Attached files
| file | filename |
|---|---|
| EX-99.4 - EXHIBIT 99.4 - PHOTRONICS INC | brhc10020762_ex99-4.htm |
| EX-99.3 - EXHIBIT 99.3 - PHOTRONICS INC | brhc10020762_ex99-3.htm |
| EX-99.2 - EXHIBIT 99.2 - PHOTRONICS INC | brhc10020762_ex99-2.htm |
| EX-99.1 - EXHIBIT 99.1 - PHOTRONICS INC | brhc10020762_ex99-1.htm |
| 8-K - 8-K - PHOTRONICS INC | brhc10020762_8k.htm |
Exhibit 99.5
Q1 2021 Financial Results Conference CallFebruary 24, 2021 Photronics, Inc.
Safe Harbor Statement This presentation and some of our comments may contain projections or other
forward-looking statements regarding future events, our future financial performance and/or the future performance of the industry. These statements are predictions, and contain risks and uncertainties. Actual events or results may differ
materially from those presented. These statements include words like “anticipate”, “believe”, “estimate”, “expect”, “forecast”, “may”, “plan”, “project”, “in our view” or the negative thereto. We cannot guarantee the accuracy of any forecasts
or estimates, and we are not obligated to update any forward-looking statements if our expectations change. If you would like more information on the risks involved in forward-looking statements, please see the documents we file from time to
time with the Securities and Exchange Commission. 2/24/2021 2
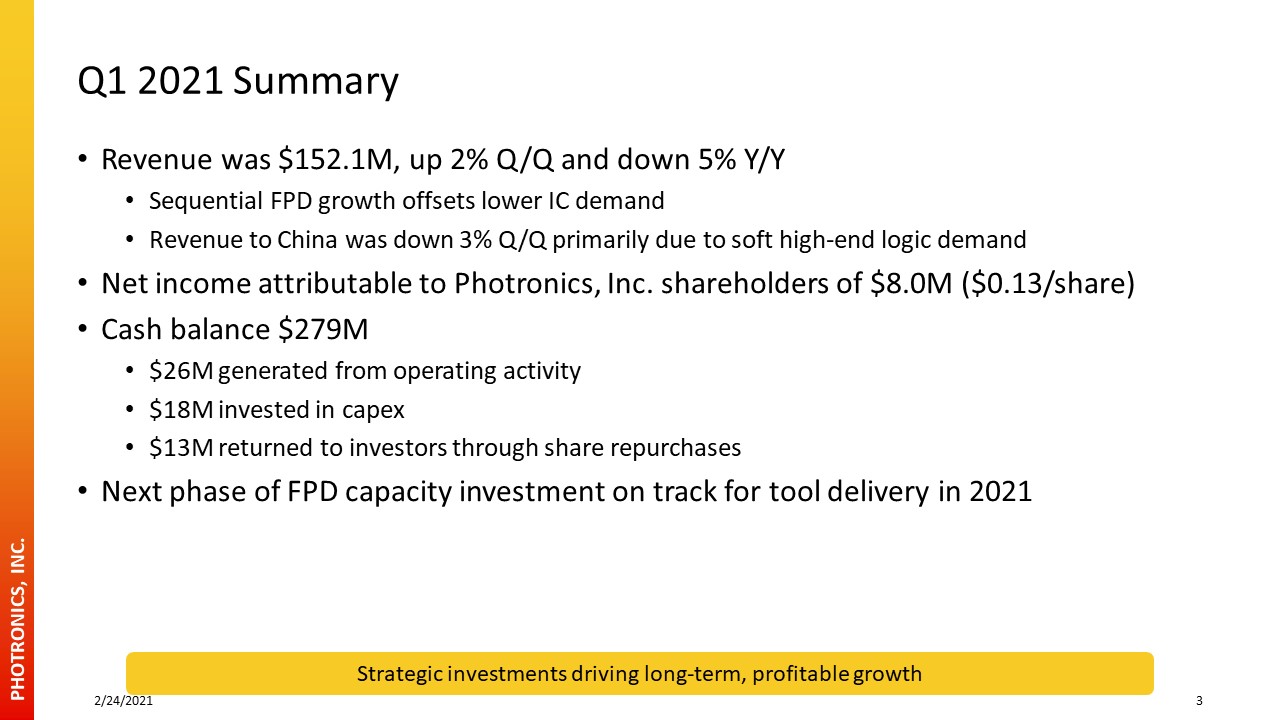
Q1 2021 Summary Revenue was $152.1M, up 2% Q/Q and down 5% Y/YSequential FPD growth offsets lower IC
demandRevenue to China was down 3% Q/Q primarily due to soft high-end logic demandNet income attributable to Photronics, Inc. shareholders of $8.0M ($0.13/share)Cash balance $279M$26M generated from operating activity$18M invested in
capex$13M returned to investors through share repurchasesNext phase of FPD capacity investment on track for tool delivery in 2021 2/24/2021 3 Strategic investments driving long-term, profitable growth
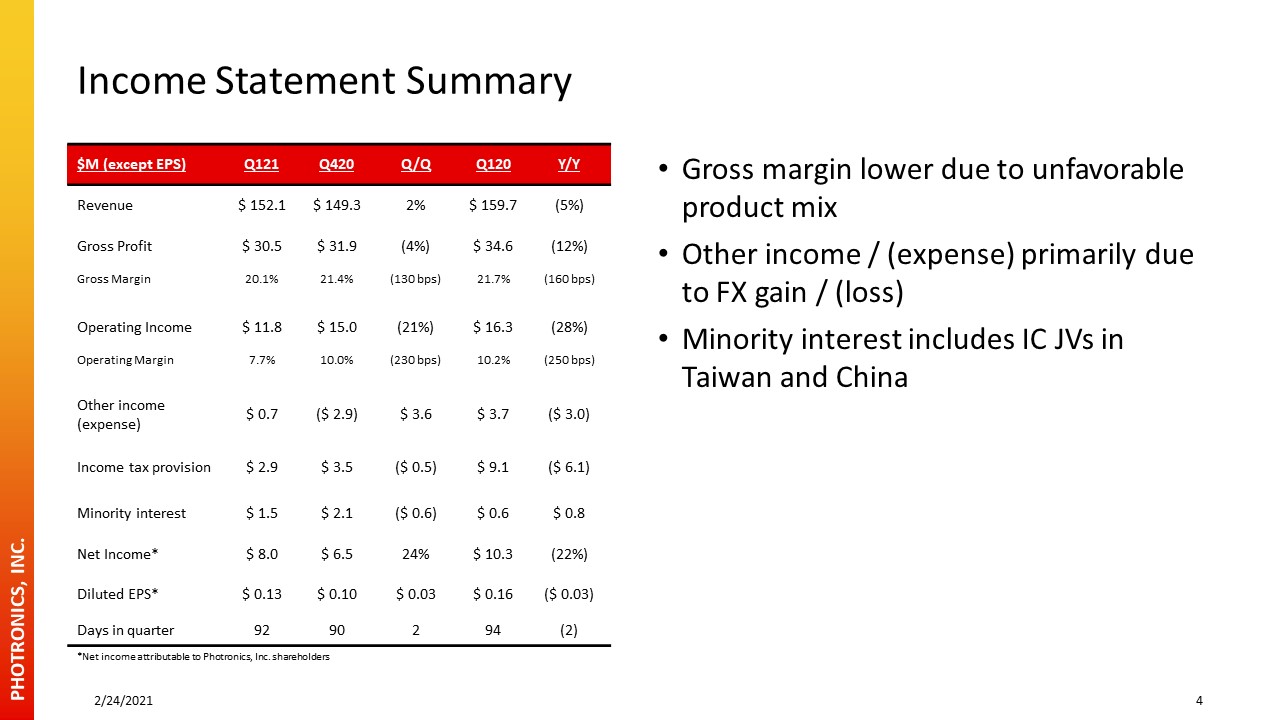
Income Statement Summary $M (except EPS) Q121 Q420 Q/Q Q120 Y/Y Revenue $ 152.1 $ 149.3 2% $
159.7 (5%) Gross Profit $ 30.5 $ 31.9 (4%) $ 34.6 (12%) Gross Margin 20.1% 21.4% (130 bps) 21.7% (160 bps) Operating Income $ 11.8 $ 15.0 (21%) $ 16.3 (28%) Operating Margin 7.7% 10.0% (230 bps) 10.2% (250 bps) Other
income (expense) $ 0.7 ($ 2.9) $ 3.6 $ 3.7 ($ 3.0) Income tax provision $ 2.9 $ 3.5 ($ 0.5) $ 9.1 ($ 6.1) Minority interest $ 1.5 $ 2.1 ($ 0.6) $ 0.6 $ 0.8 Net Income* $ 8.0 $ 6.5 24% $ 10.3 (22%) Diluted EPS* $
0.13 $ 0.10 $ 0.03 $ 0.16 ($ 0.03) Days in quarter 92 90 2 94 (2) Gross margin lower due to unfavorable product mixOther income / (expense) primarily due to FX gain / (loss)Minority interest includes IC JVs in Taiwan and
China 2/24/2021 4 *Net income attributable to Photronics, Inc. shareholders

$M Q121 Q420 Q/Q Q120 Y/Y High-End* $ 36.8 $ 38.2 (4%) $ 41.0 (10%) Mainstream $ 68.2 $
67.8 1% $ 65.9 3% Total $ 105.0 $ 105.9 (1%) $ 107.0 (2%) IC Photomask Revenue 2/24/2021 5 Memory recovery and mainstream growth offset by soft high-end logic demandChina revenue down 5% Q/Q and 2% Y/Y; represents 24% of IC
revenueOutlookSome sectors benefiting from remote work and educationMainstream demand strongIndustry responding to chip shortageMacro risk from trade policies and shelter-in-place mandates *28nm and smaller Total may differ due to rounding

FPD Photomask Revenue 2/24/2021 6 High-end improved Q/Q on strong AMOLEDStrong LCD market causes
panel makers to run current products, limiting new design activityChina revenue down 1% Q/Q and 27% Y/Y; represents 51% of FPD revenueOutlookDynamic market environmentSmartphone recovery should continue as supply chain adjusts to Huawei
banTechnology development drives demand for higher-value masks *≥G10.5, AMOLED and LTPS $M Q121 Q420 Q/Q Q120 Y/Y High-End* $ 34.6 $ 31.3 11% $ 39.8 (13%) Mainstream $ 12.5 $ 12.1 3% $ 13.0 (4%) Total $ 47.1 $
43.4 9% $ 52.8 (11%) Total may differ due to rounding

Select Financial Data $M Q121 Q420 Q120 Cash $ 279 $ 279 $ 218 Debt $ 98 $ 69 $ 54 Net
Cash* $ 180 $ 210 $ 164 Operating Cash Flow $ 26 $ 65 $ 31 Capital Expenditures $ 18 $ 34 $ 14 Government Incentives for Capital Equipment $ 0.4 - $ 2 Share repurchase $ 13 $ 18 $ 11 Debt is US equipment lease and local
China loansExpect 2021 capex to be ~$100M; completing initial China IC investment and next phase of FPD investmentTotal share repurchases of $31M under current $100M authorizationBalance sheet able to fund investments, share repurchases, and
strategic M&A opportunities 2/24/2021 7 *Net cash defined as cash and cash equivalents less long-term borrowings (including current portion), as reported in accordance with GAAP
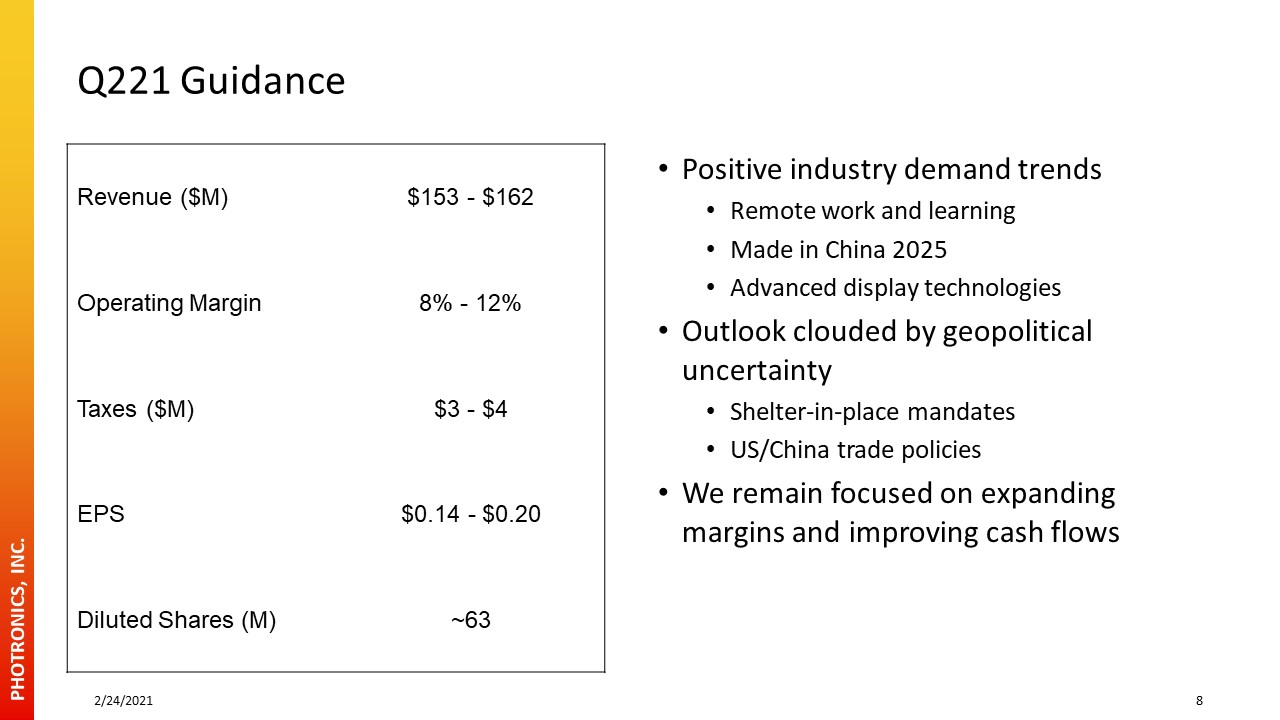
Q221 Guidance Revenue ($M) $153 - $162 Operating Margin 8% - 12% Taxes ($M) $3 - $4 EPS $0.14
- $0.20 Diluted Shares (M) ~63 Positive industry demand trendsRemote work and learningMade in China 2025Advanced display technologiesOutlook clouded by geopolitical uncertaintyShelter-in-place mandatesUS/China trade policiesWe remain
focused on expanding margins and improving cash flows 2/24/2021 8

For Additional Information:R. Troy Dewar, CFAVice President, Investor
Relations203.740.5610tdewar@photronics.com Thank you for your interest!

Appendix
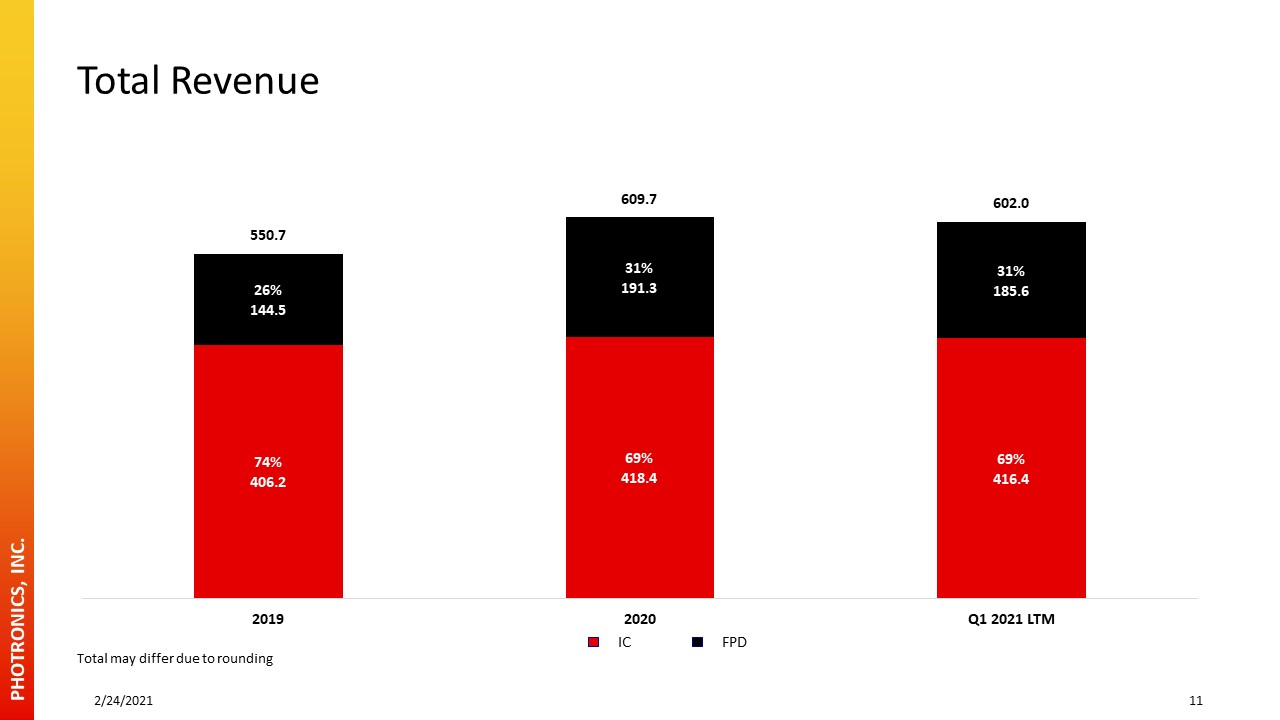
Total Revenue 2/24/2021 11 IC FPD Total may differ due to rounding

IC Photomask Revenue 2/24/2021 12 Mainstream High-End High-End: 28nm and smaller; total may
differ due to rounding

FPD Photomask Revenue 2/24/2021 13 Mainstream High-End High-End: ≥G10.5, AMOLED and LTPS;
total may differ due to rounding