Attached files
| file | filename |
|---|---|
| EX-99.1 - EX-99.1 - NEW YORK MORTGAGE TRUST INC | exhibit991q42020.htm |
| 8-K - 8-K - NEW YORK MORTGAGE TRUST INC | nymt-20210224.htm |

New York Mortgage Trust 2020 Fourth Quarter Financial Summary
2See Glossary and End Notes in the Appendix. This presentation contains forward-looking statements within the meaning of the safe harbor provisions of the Private Securities Litigation Reform Act of 1995. Forward- looking statements are based on our beliefs, assumptions and expectations of our future performance, taking into account all information currently available to us. These beliefs, assumptions and expectations are subject to risks and uncertainties and can change as a result of many possible events or factors, not all of which are known to us. If a change occurs, our business, financial condition, liquidity and results of operations may vary materially from those expressed or implied in our forward-looking statements. The following factors are examples of those that could cause actual results to vary from our forward-looking statements: changes in our business and investment strategy; changes in interest rates and the fair market value of our assets, including negative changes resulting in margin calls relating to the financing of our assets; changes in credit spreads; changes in the long-term credit ratings of the U.S., Fannie Mae, Freddie Mac, and Ginnie Mae; general volatility of the markets in which we invest; changes in prepayment rates on the loans we own or that underlie our investment securities; increased rates of default or delinquency and/or decreased recovery rates on our assets; our ability to identify and acquire our targeted assets, including assets in our investment pipeline; changes in our relationships with our financing counterparties and our ability to borrow to finance our assets and the terms thereof; our ability to predict and control costs; changes in laws, regulations or policies affecting our business, including actions that may be taken to contain or address the impact of the COVID-19 pandemic; our ability to make distributions to our stockholders in the future; our ability to maintain our qualification as a REIT for federal tax purposes; our ability to maintain our exemption from registration under the Investment Company Act of 1940, as amended; risks associated with investing in real estate assets, including changes in business conditions and the general economy, the availability of investment opportunities and the conditions in the market for Agency RMBS, non-Agency RMBS, CMBS and ABS securities, residential loans, structured multi-family investments and other mortgage-, residential housing- and credit-related assets, including changes resulting from the ongoing spread and economic effects of COVID-19; and the impact of COVID-19 on us, our operations and our personnel. These and other risks, uncertainties and factors, including the risk factors described in our most recent Annual Report on Form 10-K, as updated and supplemented from time to time, and our subsequent Quarterly Reports on Form 10-Q and other information that we file from time to time with the U.S. Securities and Exchange Commission (“SEC”) under the Securities Exchange Act of 1934, as amended (the “Exchange Act”), could cause our actual results to differ materially from those projected in any forward-looking statements we make. All forward-looking statements speak only as of the date on which they are made. New risks and uncertainties arise over time and it is not possible to predict those events or how they may affect us. Except as required by law, we are not obligated to, and do not intend to, update or revise any forward-looking statements, whether as a result of new information, future events or otherwise. This presentation may not contain all of the information that is important to you. As a result, the information in this presentation should be read together with the information included in our most recent Annual Report on Form 10-K, as updated and supplemented from time to time, and our subsequent Quarterly Reports on Form 10-Q and other information that we file under the Exchange Act. References to “the Company,” “NYMT,” “we,” “us,” or “our” refer to New York Mortgage Trust, Inc., together with its consolidated subsidiaries, unless we specifically state otherwise or the context indicates otherwise. See glossary of defined terms and detailed end notes for additional important disclosures included at the end of this presentation. Fourth quarter and full year 2020 Financial Tables and related information can be viewed in the Company’s press release dated February 24, 2021 posted on the Company’s website at http://www.nymtrust.com under the “About The Company — Press Releases” section. Forward Looking Statements
3 To Our Stockholders Management Update "The Company had a solid fourth quarter, delivering $0.19 GAAP earnings per share and $0.22 in comprehensive earnings per share. As of December 31, 2020, the Company’s book value per share was $4.71, up 3% from the prior quarter, resulting in an economic return of 5% for the quarter. During the fourth quarter, the Company was able to build on the positive momentum from the prior two quarters, executing longer term financing through a residential securitization and expanding its investment pipeline to its highest level since March. This past year was a difficult and challenging time for the Company, as well as many other mortgage REITs. Over a three-week span in March, we experienced unprecedented liquidity constraints on many of our credit asset classes as a direct result of the market disruption caused by the COVID-19 pandemic. These constraints across markets created a valuation gap that further drove down values, in many cases, disconnected from the fundamentals of the underlying assets, and generated historic levels of margin calls from our financing counterparties. Through the coordinated effort of our investment professionals, we were able to reposition the portfolio and stabilize the balance sheet, but not before incurring sizeable losses. We saw significant improvements for our assets during the balance of the year, which allowed the Company to trim the total economic return to (14.6)% for the year. While the total economic return for 2020 on an absolute-basis is disappointing, I am proud of our team and the way they performed throughout the year." – Steven Mumma, Chairman and Chief Executive Officer "With a multi-decade low of housing inventory for sale coupled with population shifts to the southern and southeast U.S., housing credit risk currently benefits from these favorable trends that we believe should provide sustainable earnings growth for housing and housing-related assets. We are excited about the flexibility afforded by our low levered balance sheet, as we believe this positions us to take advantage of these dynamics, especially in an exceptionally low cost term financing environment. Indeed, under a unique, two-tiered approach within single- and multi-family sectors, our proprietary pipelines grew significantly in the fourth quarter and have continued in the new year. NYMT has emerged from an unprecedented year with renewed positions of strength and confidence that we believe are capable of delivering solid results for stockholders in 2021." – Jason Serrano, President

Company Overview Financial Summary Market & Strategy Update Quarterly Comparative Financial Information Appendix Glossary End Notes Capital Allocation Reconciliation of Net Interest Income Table of Contents

Company Overview
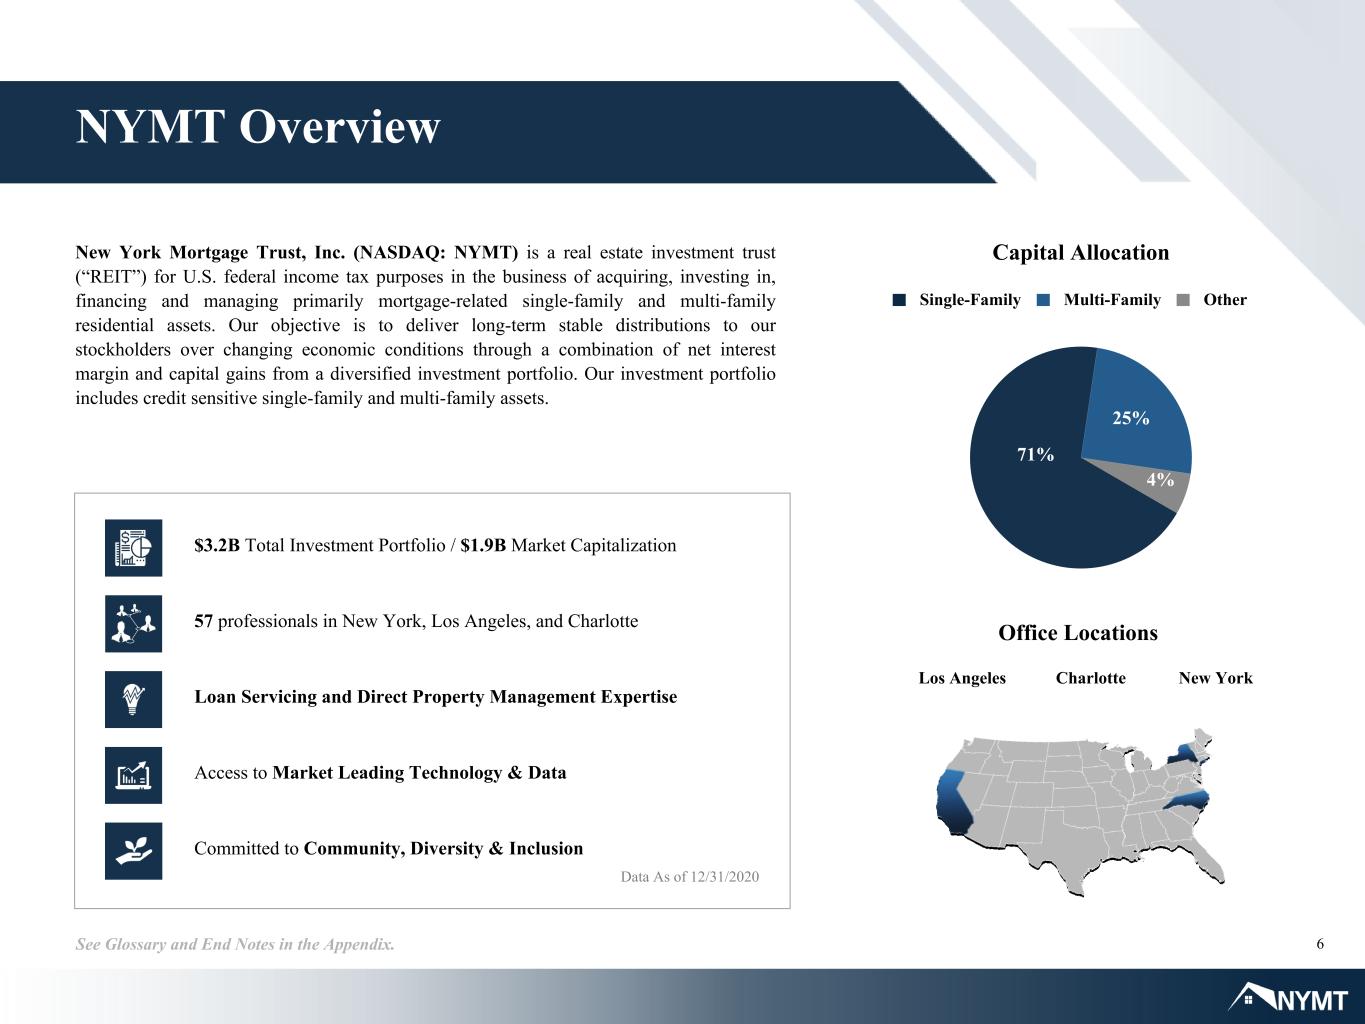
6See Glossary and End Notes in the Appendix. New York Mortgage Trust, Inc. (NASDAQ: NYMT) is a real estate investment trust (“REIT”) for U.S. federal income tax purposes in the business of acquiring, investing in, financing and managing primarily mortgage-related single-family and multi-family residential assets. Our objective is to deliver long-term stable distributions to our stockholders over changing economic conditions through a combination of net interest margin and capital gains from a diversified investment portfolio. Our investment portfolio includes credit sensitive single-family and multi-family assets. Data As of 12/31/2020 57 professionals in New York, Los Angeles, and Charlotte Access to Market Leading Technology & Data Committed to Community, Diversity & Inclusion Loan Servicing and Direct Property Management Expertise $3.2B Total Investment Portfolio / $1.9B Market Capitalization NYMT Overview Charlotte New YorkLos Angeles Office Locations Capital Allocation Single-Family Multi-Family Other 71% 25% 4%

7 Key Developments See Glossary and End Notes in the Appendix. Financial Performance ◦ Earnings per share $0.19 ◦ Comprehensive earnings per share $0.22 ◦ Book value per share of $4.71 (+3% QoQ) ◦ Achieved a 5.0% Economic Return Fourth Quarter 2020 Key Developments NYMT emerged from an unprecedented year with a stronger balance sheet and lower leverage, delivering a 5% economic return to our stockholders in the fourth quarter. Stockholder Value ◦ Declared fourth quarter common stock dividend of $0.10 per share, and preferred stock dividends ◦ Common stock dividend yield of 10.8% (share price as of 12/31/20) ◦ Total rate of return of 48.6% ◦ G&A expense ratio of 1.7% Liquidity / Financing ◦ Purchased residential loans for approximately $320 million ◦ Purchased Agency RMBS for approximately $139 million ◦ Closed two new multi-family loan investments for approximately $31 million ◦ Completed $364 million residential loan securitization ◦ $1.3 billion of unencumbered assets available to finance ◦ $293 million of unrestricted cash held on balance sheet ◦ Portfolio leverage of 0.2x – down from 1.4x at YE 2019 Investing Activity
Financial Summary Fourth Quarter 2020

9See Glossary and End Notes in the Appendix. Financial Snapshot Earnings & Book Value Net Interest MarginEarnings Per Share Price to Book Market Price $3.69 Investment Portfolio Yield on Avg. Interest Earning AssetsTotal Portfolio Size Total Investment Portfolio $3.2B Financing Dividend Per Share Economic Return on Book Value Avg. Portfolio Financing CostPortfolio Leverage Ratio $0.1B $0.5B $2.5B Investment Allocation SF Credit 59% MF Credit 25% 0.3x Book Value $4.71 Price/Book 0.78 3 Months Ended 5.0% Q4 Dividend $0.10 Comprehensive $0.22 Basic $0.19 SF 79% MF 17% Other 4% Total Leverage Ratio 1.5x 0.8x 0.5x 0.4x 0.3x SF MF Other 4Q 2019 1Q 2020 2Q 2020 3Q 2020 4Q 20204Q 2019 1Q 2020 2Q 2020 3Q 2020 4Q 2020 2.90% 2.92% 2.43% 2.18% 2.30% 4Q 2019 1Q 2020 2Q 2020 3Q 2020 4Q 2020 6.15% 5.99% 5.25% 5.51% 6.05% 4Q 2019 1Q 2020 2Q 2020 3Q 2020 4Q 2020 3.25% 3.07% 2.82% 3.33% 3.75% 4Q 2019 1Q 2020 2Q 2020 3Q 2020 4Q 2020 1.4x 0.7x 0.4x 0.3x 0.2x 1.5x 0.8x 0.5x 0.4x 0.3x

10See Glossary and End Notes in the Appendix. Fourth Quarter and Full Year Summary Dollar amounts in millions, except per share data 4Q 2020 FY 2020 Equity Capital Market Raised Total Raised Capital $ — $ 512.0 Accretive Capital from Common Equity Raises $ — $ 20.0 Investment Activity Purchases $ 489.6 $ 1,236.3 Sales $ (7.9) $ (2,472.3) Net Investment Activity $ 481.7 $ (1,236.0) Earnings Net Income (Loss) Attributable to Common Stockholders $ $70.1 $ (329.7) Comprehensive Income (Loss) Attributable to Common Stockholders $ 83.1 $ (353.8) Book Value Per Share at End of Period $ 4.71 $ 4.71
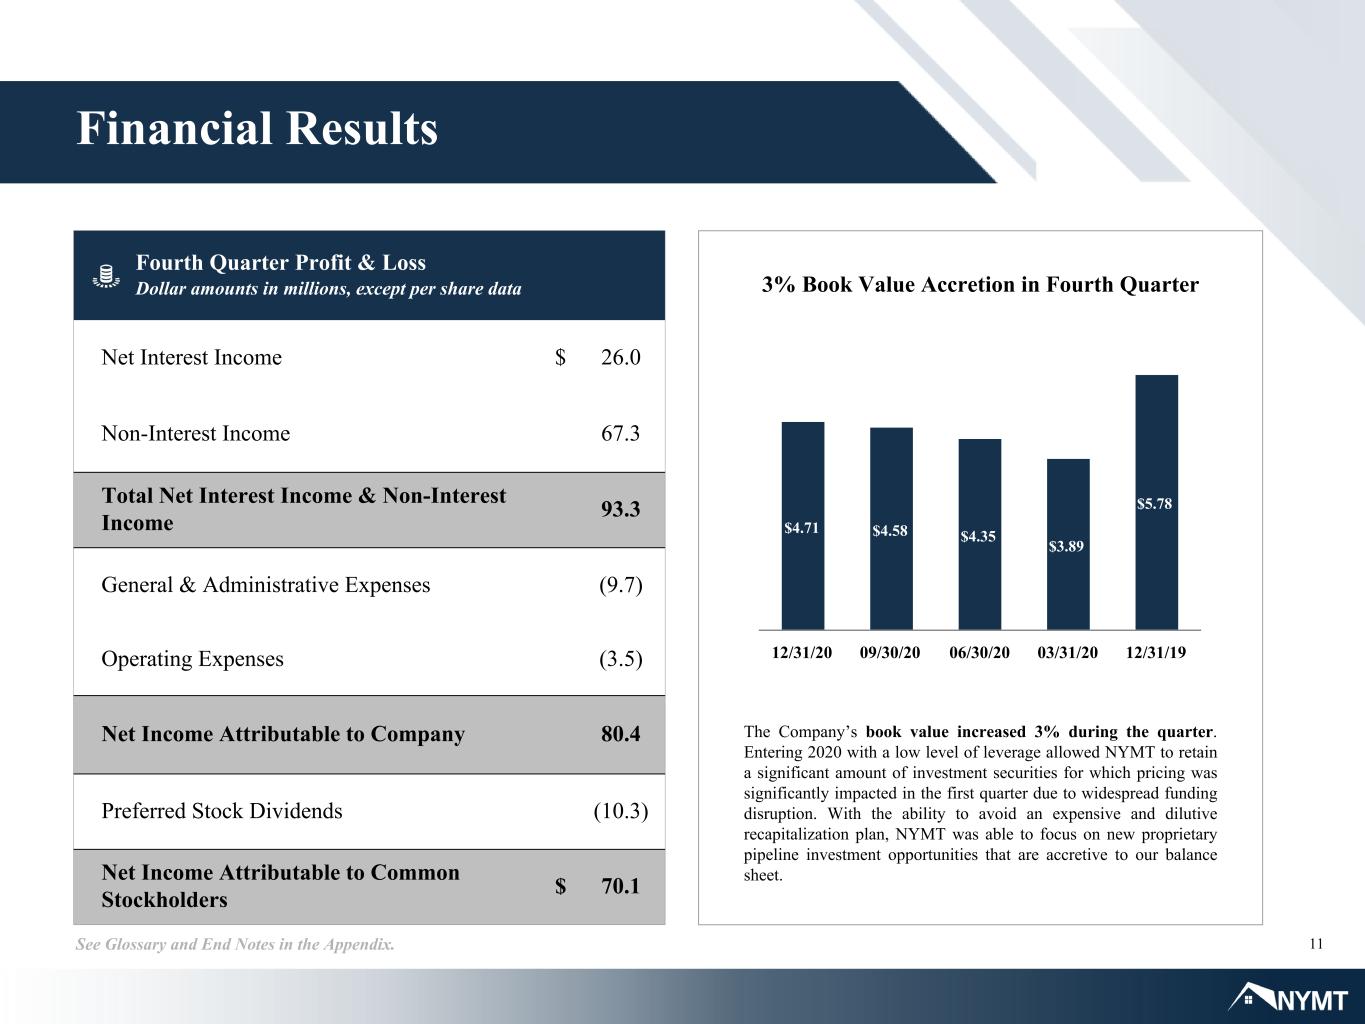
11See Glossary and End Notes in the Appendix. Financial Results Fourth Quarter Profit & Loss Dollar amounts in millions, except per share data Net Interest Income $ 26.0 Non-Interest Income 67.3 Total Net Interest Income & Non-Interest Income 93.3 General & Administrative Expenses (9.7) Operating Expenses (3.5) Net Income Attributable to Company 80.4 Preferred Stock Dividends (10.3) Net Income Attributable to Common Stockholders $ 70.1 3% Book Value Accretion in Fourth Quarter The Company’s book value increased 3% during the quarter. Entering 2020 with a low level of leverage allowed NYMT to retain a significant amount of investment securities for which pricing was significantly impacted in the first quarter due to widespread funding disruption. With the ability to avoid an expensive and dilutive recapitalization plan, NYMT was able to focus on new proprietary pipeline investment opportunities that are accretive to our balance sheet. $4.71 $4.58 $4.35 $3.89 $5.78 12/31/20 09/30/20 06/30/20 03/31/20 12/31/19

Market & Strategy Update
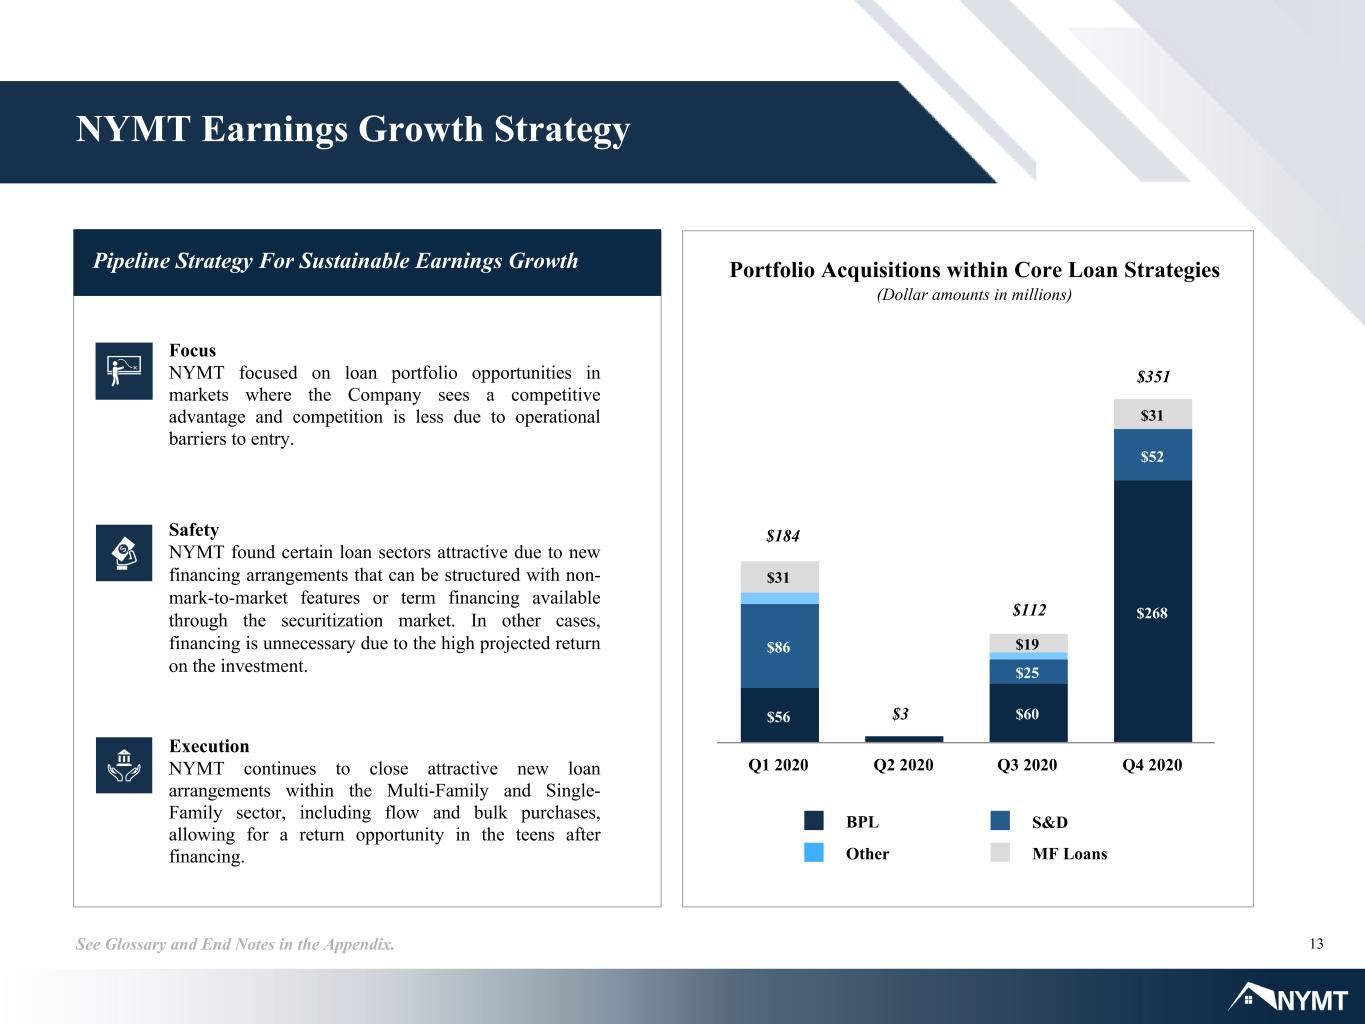
13See Glossary and End Notes in the Appendix. Pipeline Strategy For Sustainable Earnings Growth NYMT Earnings Growth Strategy Focus NYMT focused on loan portfolio opportunities in markets where the Company sees a competitive advantage and competition is less due to operational barriers to entry. Safety NYMT found certain loan sectors attractive due to new financing arrangements that can be structured with non- mark-to-market features or term financing available through the securitization market. In other cases, financing is unnecessary due to the high projected return on the investment. Execution NYMT continues to close attractive new loan arrangements within the Multi-Family and Single- Family sector, including flow and bulk purchases, allowing for a return opportunity in the teens after financing. Portfolio Acquisitions within Core Loan Strategies (Dollar amounts in millions) $184 $112 $351 $3 $3 Other BPL S&D MF Loans $56 $60 $268 $86 $25 $52 $31 $19 $31 Q1 2020 Q2 2020 Q3 2020 Q4 2020
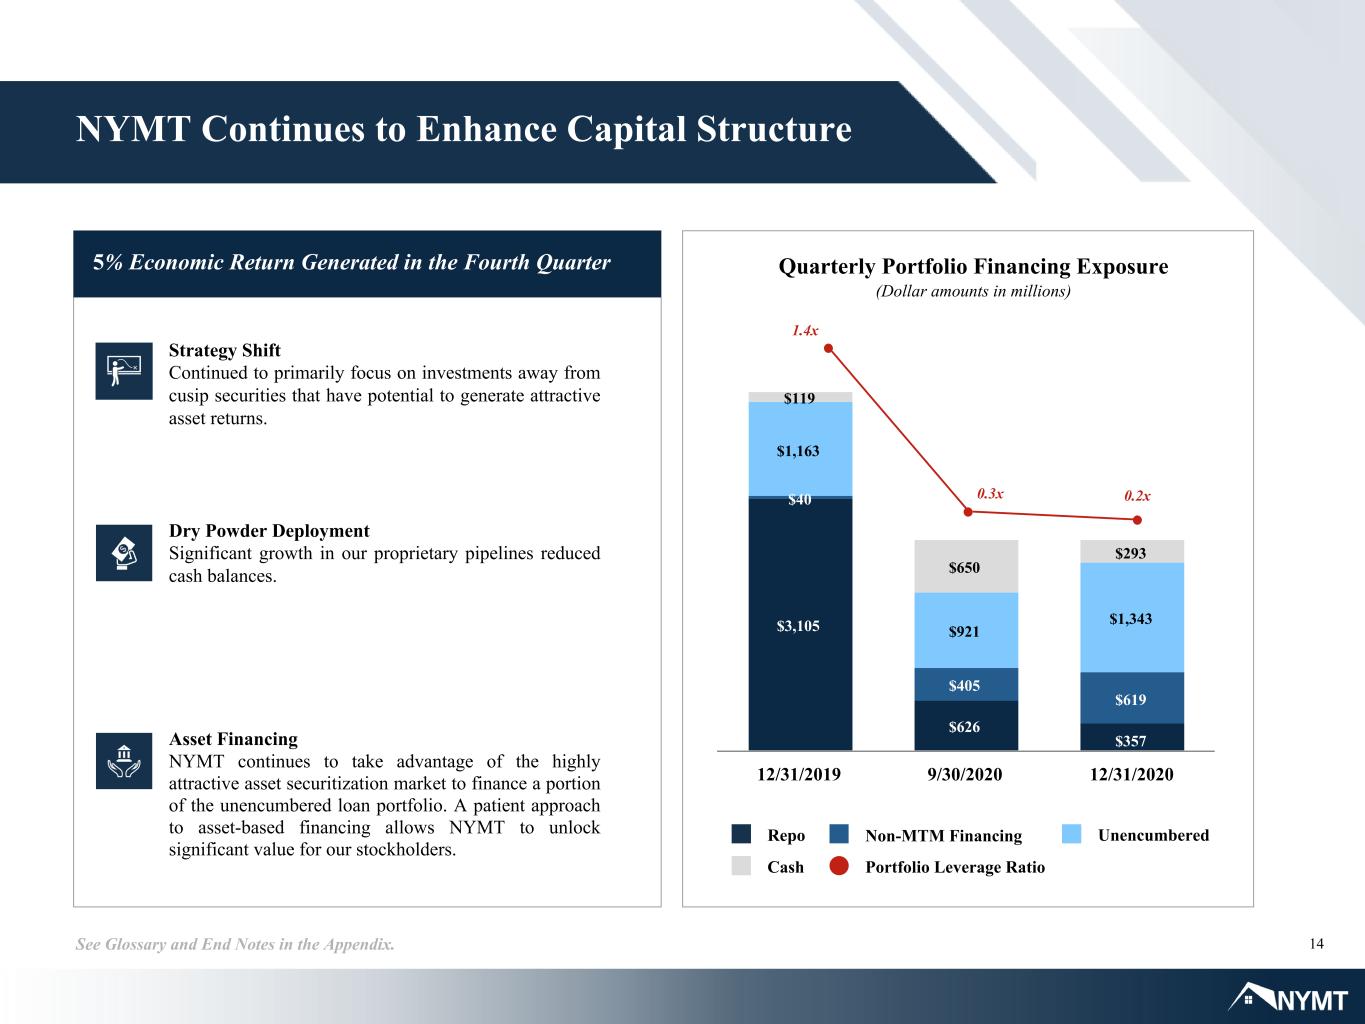
14See Glossary and End Notes in the Appendix. 5% Economic Return Generated in the Fourth Quarter NYMT Continues to Enhance Capital Structure Cash Repo Portfolio Leverage Ratio UnencumberedNon-MTM Financing $3,105 $626 $357 $40 $405 $619 $1,163 $921 $1,343 $119 $650 $293 12/31/2019 9/30/2020 12/31/2020 1.4x 0.3x 0.2x Strategy Shift Continued to primarily focus on investments away from cusip securities that have potential to generate attractive asset returns. Dry Powder Deployment Significant growth in our proprietary pipelines reduced cash balances. Asset Financing NYMT continues to take advantage of the highly attractive asset securitization market to finance a portion of the unencumbered loan portfolio. A patient approach to asset-based financing allows NYMT to unlock significant value for our stockholders. Quarterly Portfolio Financing Exposure (Dollar amounts in millions)

15See Glossary and End Notes in the Appendix. Single-Family Portfolio Overview Core Strategy Sub-Sector Asset Value Net Equity Portfolio Leverage Ratio Loan Key Characteristics Current Environment % $ % $ Avg. FICO Avg. LTV Avg. Coupon RPL Strategy • Seasoned re-performing mortgage loans • Non-performing mortgage loans 38% $945 20% $321 0.6x • Limited impact from COVID-19 forbearance on portfolio. • Housing trends raising loan valuations. • Financing costs at historical lows. Performing Loans • S & D • Business purpose loans • Other 34% $838 38% $611 0.4x • Historically low rates shortening duration of mortgage loans. • High volume of 2020 agency originations now showing larger opportunities to acquire new origination at discounts. Non-Agency Securities Securitizations not guaranteed by any agency of the U.S. Government or GSE 23% $568 34% $554 — • Bond coupons at historically low rates for various sectors. • Mezzanine bonds held at discount have meaningful chance to be called at par due to primary market strength. Agency Securities RMBS guaranteed by an agency of the U.S. government or GSE 5% $139 8% $139 — • Protection against volatility supporting global demand. • Pace of Fed's MBS purchases remains elevated – at $20B+ weekly, supporting lower coupon stack. • Current administration likely to keep high level of support. 850 59% 22% 6% 7% 6% RPL MSR NPL FnF Other 75% 4.86% 850 76% 6.91% Underlying Collateral Allocation 619 712 Dollar amounts in millions Total Investment Portfolio 79% Total Capital 71% 850 66% 2.89% 766

16See Glossary and End Notes in the Appendix. Single-Family Opportunity Highlights 2% Active COVID-19 Assistance Plan Loans (Dollar amounts in millions) Performance Update Type Count Balance 12/31/20 09/30/20 8/31/20 7/31/20 6/30/20 5/31/20 RPL 6,453 $1,002 3.0% 2.1% 2.6% 6.8% 13.4% 21.9% S&D 1,523 $398 2.2% 2.3% 4.9% 9.1% 12.3% 20.0% BPL 980 $363 0.3% 0.3% 0.8% 0.4% 0.8% 0.3% Other 949 $80 2.7% 3.2% 3.2% 3.4% 6.3% 6.8% Total 9,905 $1,843 2.3% 1.7% 2.8% 5.9% 10.4% 16.6% Fourth Quarter Update Financing Update ◦ Securitized $364 million of assets in our RPL Strategy at weighted avg. coupon of 3.17% during the quarter providing for a projected equity return of +15%. ◦ Approximately $500 million of UPB in our unencumbered book is being evaluated for two additional securitizations, the first of which we expect to close in Q1 2021. Q4 Investment Activity ◦ Purchased $320 million of residential loans – $268 million BPL – $52 million S&D ◦ Demand for BPL fell off with competing entities that were no longer supporting this sector. ◦ NYMT was able to source new BPL pipelines with lower LTVs, higher coupons, and borrowers with better credit quality as compared to 2019 vintage loan product. COVID-19 Assistance Plans ◦ 2% of the residential loan portfolio is currently under a COVID-19 assistance plan. ◦ Requests for new forbearance plans have trended lower. $87 $90 $89 $92 $94 WT. Avg. Price 62% 63% 67% 56% 46% 38% 37% 33% 44% 54% Current Delinquent (60+) 12/31/20 9/30/20 6/30/20 3/31/20 Purchase

17See Glossary and End Notes in the Appendix. Multi-Family Portfolio Overview Core Strategy Sub-Sector Asset Value Loan Key Characteristics Current Environment % $ Avg. DSCR Avg. LTV Avg. Coupon Multi-Family Loans Preferred equity and mezzanine direct originations 67% $356 • COVID-19 impacted loans not material to portfolio performance. • Properties are now generally valued higher with 50bps of cap rate compression observed across the general market, providing additional credit support. • Properties are performing well with stabilized cash flows. Multi-Family Securities CMBS backed by senior commercial mortgage loans on multi-family properties issued by, but not guaranteed by, a GSE 33% $186 66% • Underlying loan delinquencies are stable at <1% delinquencies across 9k+ senior loans. • Liquidity at full capacity with short-term repo widely available. • Monetizing remaining position as prices are nearly fully recovered from earlier price declines. Joint Venture Equity Equity ownership of an individual multi-family property alongside an operating partner — — • Property sponsors now focused on stable sources of locked up capital. • Opportunities in the southeast U.S. still on track for growth against historically low 10- yr financing costs. • Expected re-deployment beginning in Q1. 2.0x 81% 2.0x 66% 4.20% 1.87x 11.54% 1.45x Dollar amounts in millions Multi-Family Portfolio Overview Total Investment Portfolio 17% Total Capital 25%

18See Glossary and End Notes in the Appendix. Fourth Quarter Update Loan Performance Update ◦ Four loans paid off in the quarter with outstanding UPB of $18 million at an average lifetime IRR of 14% (1.45x multiple) including any applicable minimum return multiple. ◦ As of 12/31/20, only two loans equaling 3.6% of the total portfolio were delinquent or in forbearance due to COVID-19 related disruption. ◦ Both $3 million delinquent and $10 million forbearance loans expected to payoff at par after change of control/ sale of properties. NYMT Differentiation ◦ NYMT expects to rapidly expand our footprint in new loan originations and joint venture opportunities. This expansion aligns well with our existing portfolio and asset management capabilities. Multi-Family Opportunity Highlights Count Balance 12/31/20 9/30/20 6/30/20 Performing 45 $343 96% 99% 99% Delinquent 1 $3 1% 1% 1% Forbearance 1 $10 3% —% —% Total 47 $356 100% 100% 100% Property Operating Update ◦ Zero NY Exposure – Portfolio located primarily in the South and Southeast of the U.S. ◦ Despite lockdown measures, loan portfolio occupancy rate remained at 92% throughout 2020, matching 2019 levels. Loan Portfolio Characteristics as of 12/31/2020 (Dollar amounts in millions) State (Top 10) Count Balance % Total Coupon LTV DSCR TX 12 $107 30.0% 11.4% 79.0% 1.34x AL 5 $47 13.0% 12.0% 74.6% 1.88x FL 4 $34 9.0% 11.4% 80.9% 1.30x OH 3 $27 8.0% 11.6% 87.7% 1.47x TN 3 $23 7.0% 11.2% 89.1% 1.63x SC 3 $16 5.0% 11.5% 84.5% 1.59x NC 3 $18 5.0% 12.0% 73.9% 1.28x GA 2 $17 5.0% 11.0% 82.4% 1.32x VA 2 $8 2.0% 12.0% 86.1% 1.47x Other 10 $59 16.0% 11.6% 83.8% 1.35x Total 47 $356 100% 11.5% 81.0% 1.45x
19 Outlook New York Mortgage Trust 90 Park Avenue New York, New York 10016 Utilizing a Strong Balance Sheet to Capture Superior Market Opportunities ◦ Well positioned to take advantage of proprietary opportunities across the Single-Family and Multi- Family markets ◦ Continue to grow pipeline of high return asset opportunities ◦ Portfolio leverage to remain low ◦ Flexible, cash-efficient market approach NYMT Outlook for 2021 For 2021, we will continue to focus on asset growth and prudent liability management to increase our profitability. 1Q Strategy Initiatives ◦ Continue building a robust investment pipeline in less competitive markets ◦ Focus on assets that benefit from a high touch, active management approach to unlock value ◦ Take advantage of lower funding cost options to drive earnings
Quarterly Comparative Financial Information
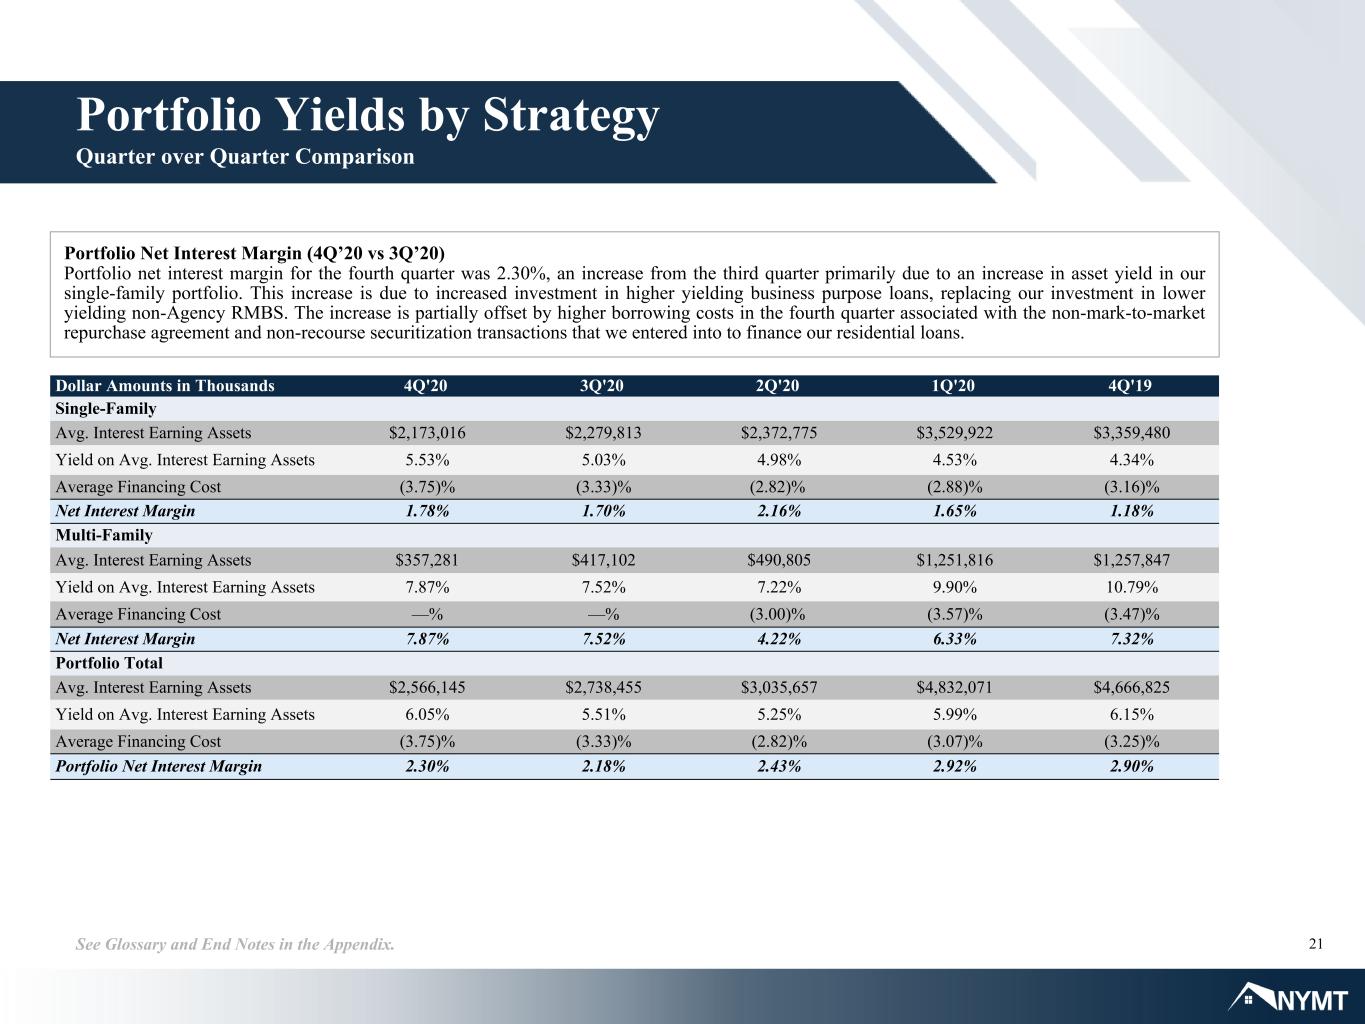
21See Glossary and End Notes in the Appendix. Portfolio Yields by Strategy Quarter over Quarter Comparison Portfolio Net Interest Margin (4Q’20 vs 3Q’20) Portfolio net interest margin for the fourth quarter was 2.30%, an increase from the third quarter primarily due to an increase in asset yield in our single-family portfolio. This increase is due to increased investment in higher yielding business purpose loans, replacing our investment in lower yielding non-Agency RMBS. The increase is partially offset by higher borrowing costs in the fourth quarter associated with the non-mark-to-market repurchase agreement and non-recourse securitization transactions that we entered into to finance our residential loans. Dollar Amounts in Thousands 4Q'20 3Q'20 2Q'20 1Q'20 4Q'19 Single-Family Avg. Interest Earning Assets $2,173,016 $2,279,813 $2,372,775 $3,529,922 $3,359,480 Yield on Avg. Interest Earning Assets 5.53% 5.03% 4.98% 4.53% 4.34% Average Financing Cost (3.75)% (3.33)% (2.82)% (2.88)% (3.16)% Net Interest Margin 1.78% 1.70% 2.16% 1.65% 1.18% Multi-Family Avg. Interest Earning Assets $357,281 $417,102 $490,805 $1,251,816 $1,257,847 Yield on Avg. Interest Earning Assets 7.87% 7.52% 7.22% 9.90% 10.79% Average Financing Cost —% —% (3.00)% (3.57)% (3.47)% Net Interest Margin 7.87% 7.52% 4.22% 6.33% 7.32% Portfolio Total Avg. Interest Earning Assets $2,566,145 $2,738,455 $3,035,657 $4,832,071 $4,666,825 Yield on Avg. Interest Earning Assets 6.05% 5.51% 5.25% 5.99% 6.15% Average Financing Cost (3.75)% (3.33)% (2.82)% (3.07)% (3.25)% Portfolio Net Interest Margin 2.30% 2.18% 2.43% 2.92% 2.90%
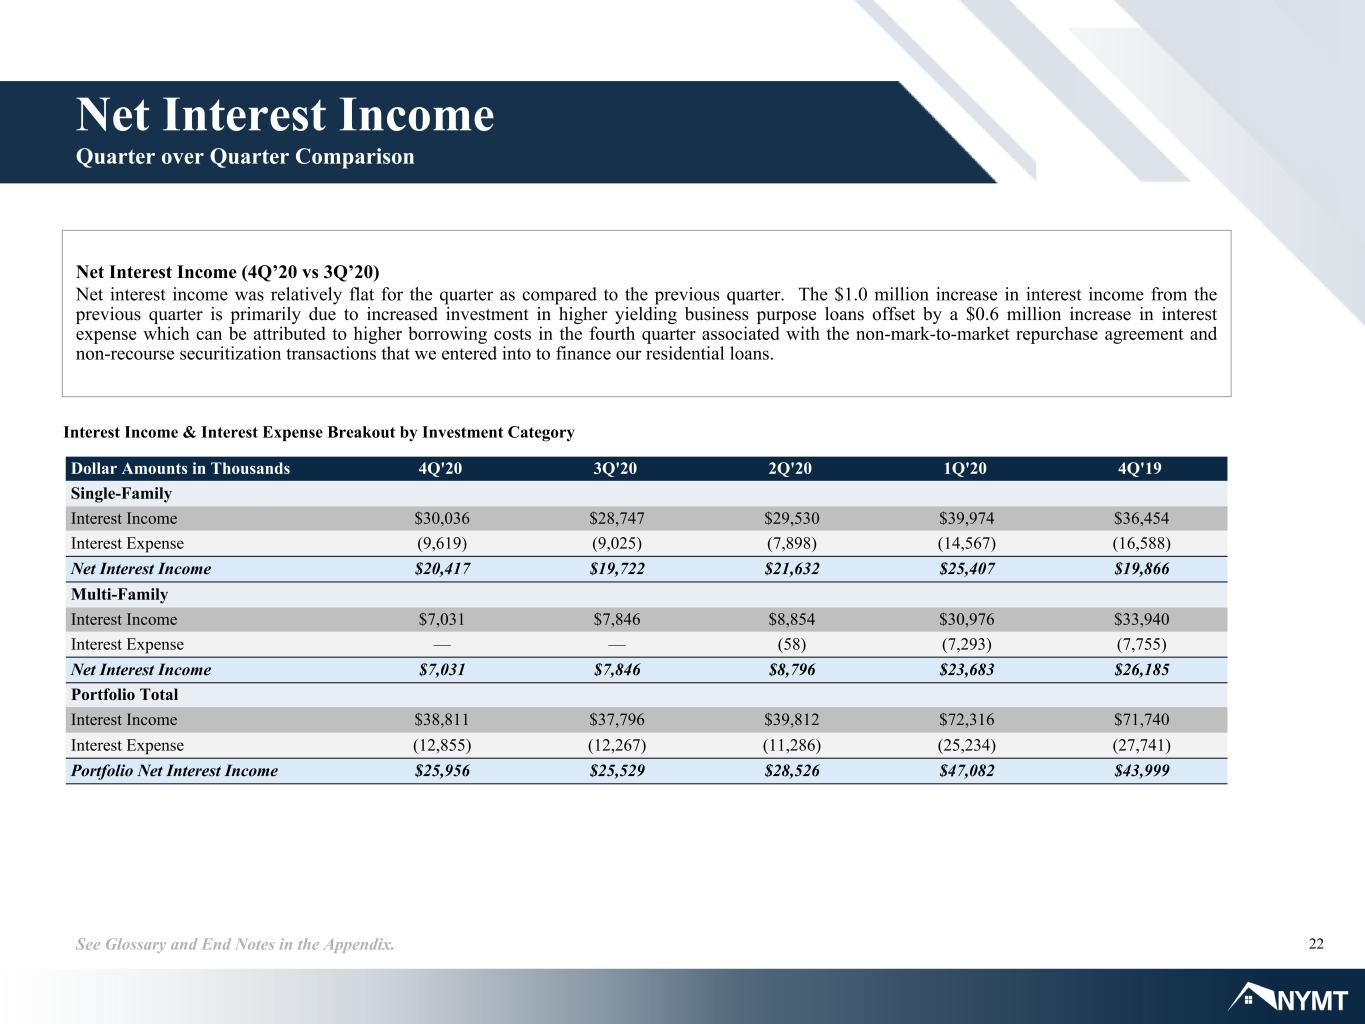
22See Glossary and End Notes in the Appendix. Net Interest Income (4Q’20 vs 3Q’20) Net interest income was relatively flat for the quarter as compared to the previous quarter. The $1.0 million increase in interest income from the previous quarter is primarily due to increased investment in higher yielding business purpose loans offset by a $0.6 million increase in interest expense which can be attributed to higher borrowing costs in the fourth quarter associated with the non-mark-to-market repurchase agreement and non-recourse securitization transactions that we entered into to finance our residential loans. Interest Income & Interest Expense Breakout by Investment Category Net Interest Income Quarter over Quarter Comparison Dollar Amounts in Thousands 4Q'20 3Q'20 2Q'20 1Q'20 4Q'19 Single-Family Interest Income $30,036 $28,747 $29,530 $39,974 $36,454 Interest Expense (9,619) (9,025) (7,898) (14,567) (16,588) Net Interest Income $20,417 $19,722 $21,632 $25,407 $19,866 Multi-Family Interest Income $7,031 $7,846 $8,854 $30,976 $33,940 Interest Expense — — (58) (7,293) (7,755) Net Interest Income $7,031 $7,846 $8,796 $23,683 $26,185 Portfolio Total Interest Income $38,811 $37,796 $39,812 $72,316 $71,740 Interest Expense (12,855) (12,267) (11,286) (25,234) (27,741) Portfolio Net Interest Income $25,956 $25,529 $28,526 $47,082 $43,999
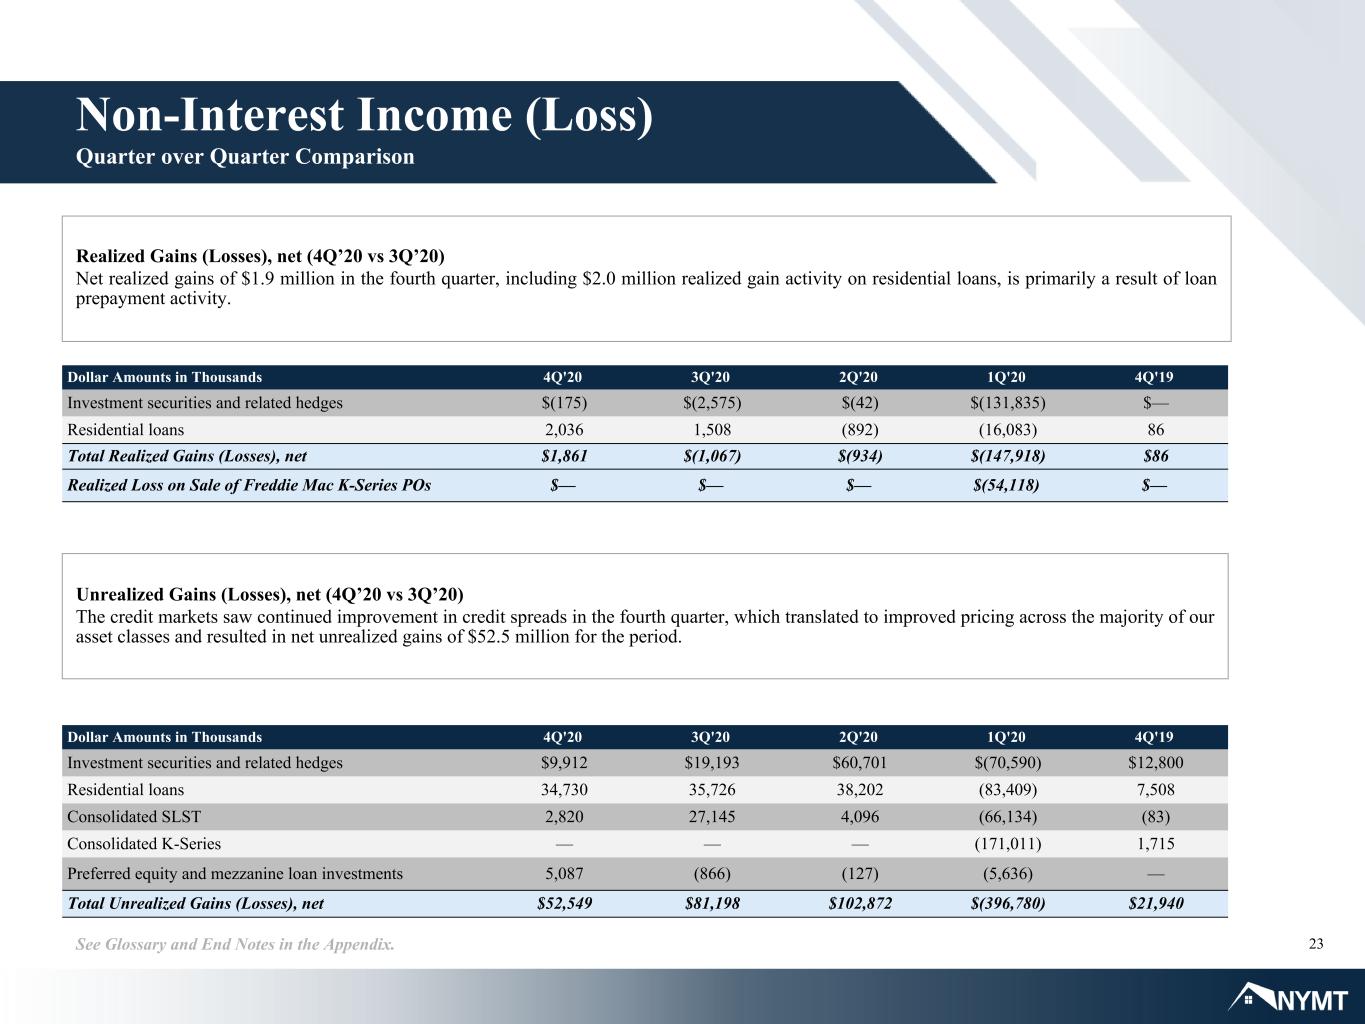
23See Glossary and End Notes in the Appendix. Non-Interest Income (Loss) Quarter over Quarter Comparison Realized Gains (Losses), net (4Q’20 vs 3Q’20) Net realized gains of $1.9 million in the fourth quarter, including $2.0 million realized gain activity on residential loans, is primarily a result of loan prepayment activity. Unrealized Gains (Losses), net (4Q’20 vs 3Q’20) The credit markets saw continued improvement in credit spreads in the fourth quarter, which translated to improved pricing across the majority of our asset classes and resulted in net unrealized gains of $52.5 million for the period. Dollar Amounts in Thousands 4Q'20 3Q'20 2Q'20 1Q'20 4Q'19 Investment securities and related hedges $(175) $(2,575) $(42) $(131,835) $— Residential loans 2,036 1,508 (892) (16,083) 86 Total Realized Gains (Losses), net $1,861 $(1,067) $(934) $(147,918) $86 Realized Loss on Sale of Freddie Mac K-Series POs $— $— $— $(54,118) $— Dollar Amounts in Thousands 4Q'20 3Q'20 2Q'20 1Q'20 4Q'19 Investment securities and related hedges $9,912 $19,193 $60,701 $(70,590) $12,800 Residential loans 34,730 35,726 38,202 (83,409) 7,508 Consolidated SLST 2,820 27,145 4,096 (66,134) (83) Consolidated K-Series — — — (171,011) 1,715 Preferred equity and mezzanine loan investments 5,087 (866) (127) (5,636) — Total Unrealized Gains (Losses), net $52,549 $81,198 $102,872 $(396,780) $21,940
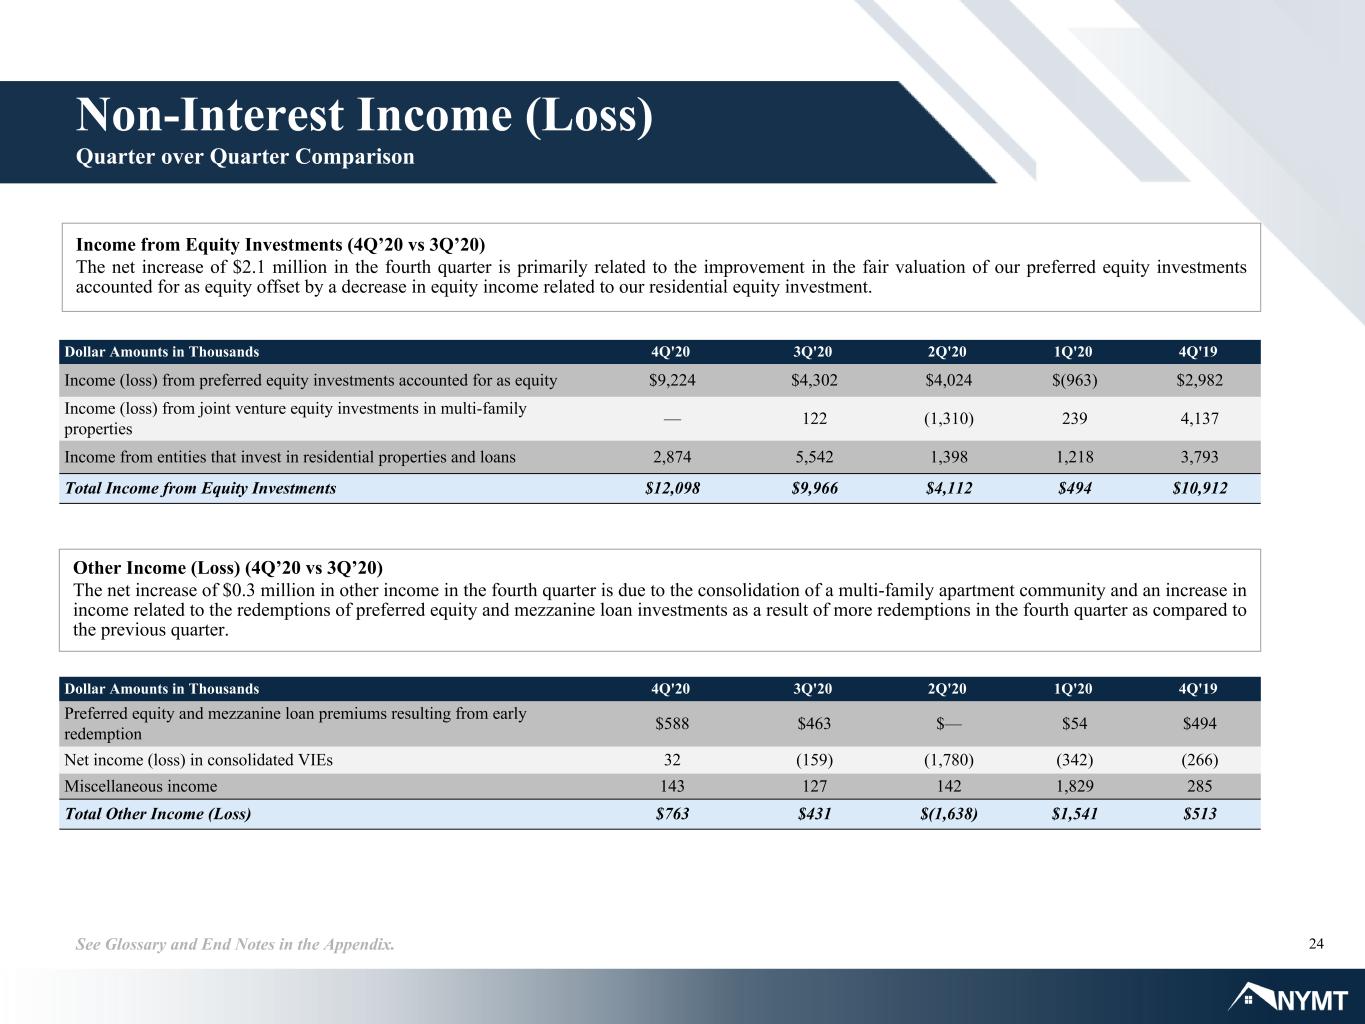
24See Glossary and End Notes in the Appendix. Non-Interest Income (Loss) Quarter over Quarter Comparison Income from Equity Investments (4Q’20 vs 3Q’20) The net increase of $2.1 million in the fourth quarter is primarily related to the improvement in the fair valuation of our preferred equity investments accounted for as equity offset by a decrease in equity income related to our residential equity investment. Dollar Amounts in Thousands 4Q'20 3Q'20 2Q'20 1Q'20 4Q'19 Preferred equity and mezzanine loan premiums resulting from early redemption $588 $463 $— $54 $494 Net income (loss) in consolidated VIEs 32 (159) (1,780) (342) (266) Miscellaneous income 143 127 142 1,829 285 Total Other Income (Loss) $763 $431 $(1,638) $1,541 $513 Other Income (Loss) (4Q’20 vs 3Q’20) The net increase of $0.3 million in other income in the fourth quarter is due to the consolidation of a multi-family apartment community and an increase in income related to the redemptions of preferred equity and mezzanine loan investments as a result of more redemptions in the fourth quarter as compared to the previous quarter. Dollar Amounts in Thousands 4Q'20 3Q'20 2Q'20 1Q'20 4Q'19 Income (loss) from preferred equity investments accounted for as equity $9,224 $4,302 $4,024 $(963) $2,982 Income (loss) from joint venture equity investments in multi-family properties — 122 (1,310) 239 4,137 Income from entities that invest in residential properties and loans 2,874 5,542 1,398 1,218 3,793 Total Income from Equity Investments $12,098 $9,966 $4,112 $494 $10,912
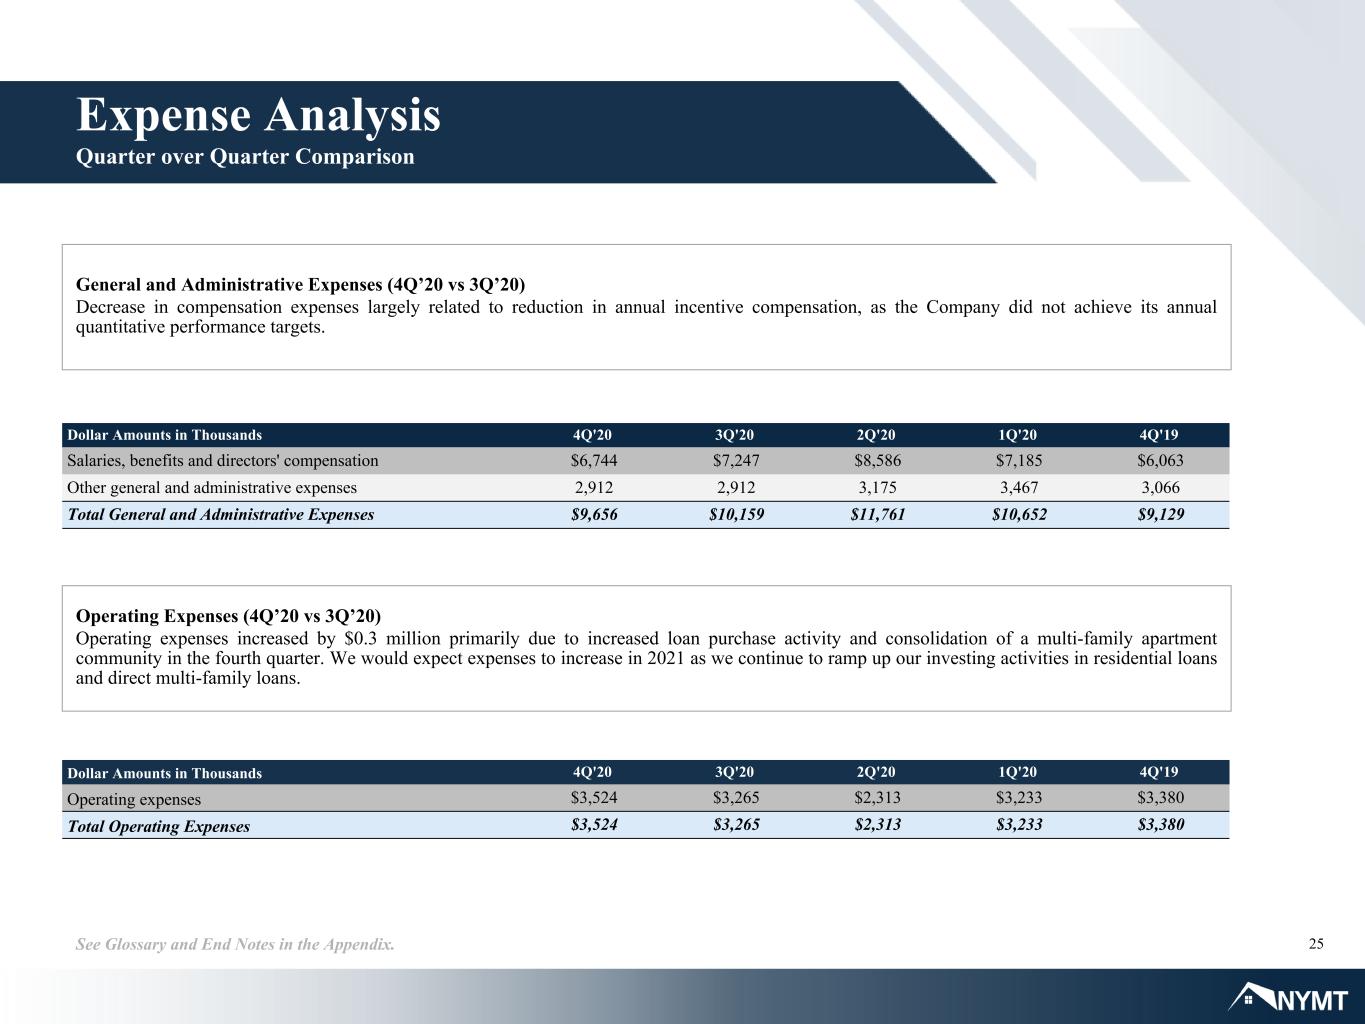
25See Glossary and End Notes in the Appendix. Expense Analysis Quarter over Quarter Comparison General and Administrative Expenses (4Q’20 vs 3Q’20) Decrease in compensation expenses largely related to reduction in annual incentive compensation, as the Company did not achieve its annual quantitative performance targets. Operating Expenses (4Q’20 vs 3Q’20) Operating expenses increased by $0.3 million primarily due to increased loan purchase activity and consolidation of a multi-family apartment community in the fourth quarter. We would expect expenses to increase in 2021 as we continue to ramp up our investing activities in residential loans and direct multi-family loans. Dollar Amounts in Thousands 4Q'20 3Q'20 2Q'20 1Q'20 4Q'19 Operating expenses $3,524 $3,265 $2,313 $3,233 $3,380 Total Operating Expenses $3,524 $3,265 $2,313 $3,233 $3,380 Dollar Amounts in Thousands 4Q'20 3Q'20 2Q'20 1Q'20 4Q'19 Salaries, benefits and directors' compensation $6,744 $7,247 $8,586 $7,185 $6,063 Other general and administrative expenses 2,912 2,912 3,175 3,467 3,066 Total General and Administrative Expenses $9,656 $10,159 $11,761 $10,652 $9,129
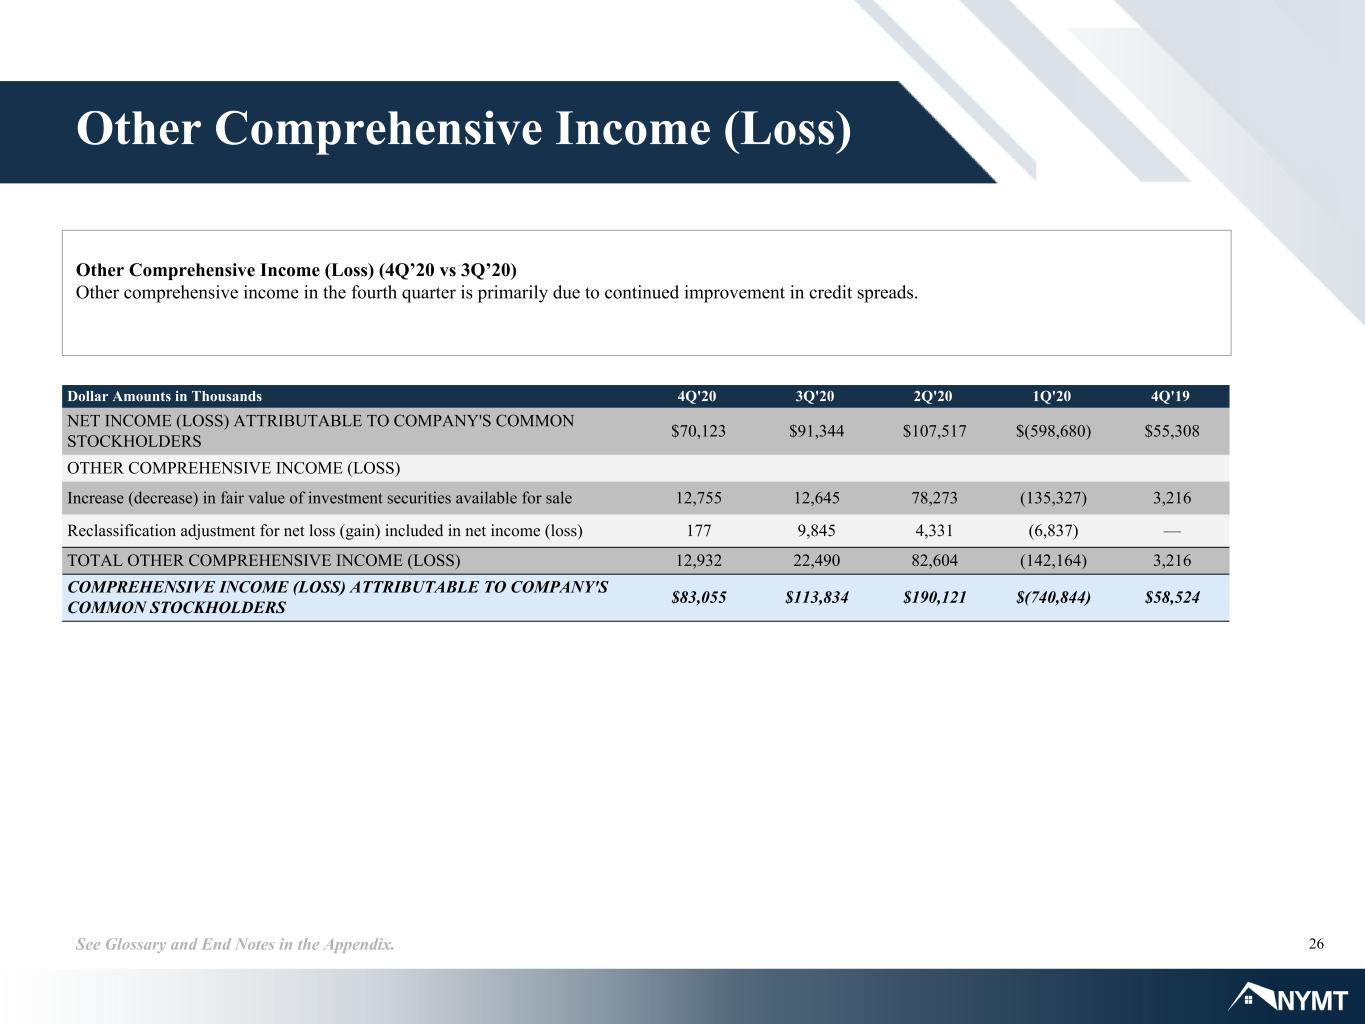
26See Glossary and End Notes in the Appendix. Other Comprehensive Income (Loss) Other Comprehensive Income (Loss) (4Q’20 vs 3Q’20) Other comprehensive income in the fourth quarter is primarily due to continued improvement in credit spreads. Dollar Amounts in Thousands 4Q'20 3Q'20 2Q'20 1Q'20 4Q'19 NET INCOME (LOSS) ATTRIBUTABLE TO COMPANY'S COMMON STOCKHOLDERS $70,123 $91,344 $107,517 $(598,680) $55,308 OTHER COMPREHENSIVE INCOME (LOSS) Increase (decrease) in fair value of investment securities available for sale 12,755 12,645 78,273 (135,327) 3,216 Reclassification adjustment for net loss (gain) included in net income (loss) 177 9,845 4,331 (6,837) — TOTAL OTHER COMPREHENSIVE INCOME (LOSS) 12,932 22,490 82,604 (142,164) 3,216 COMPREHENSIVE INCOME (LOSS) ATTRIBUTABLE TO COMPANY'S COMMON STOCKHOLDERS $83,055 $113,834 $190,121 $(740,844) $58,524
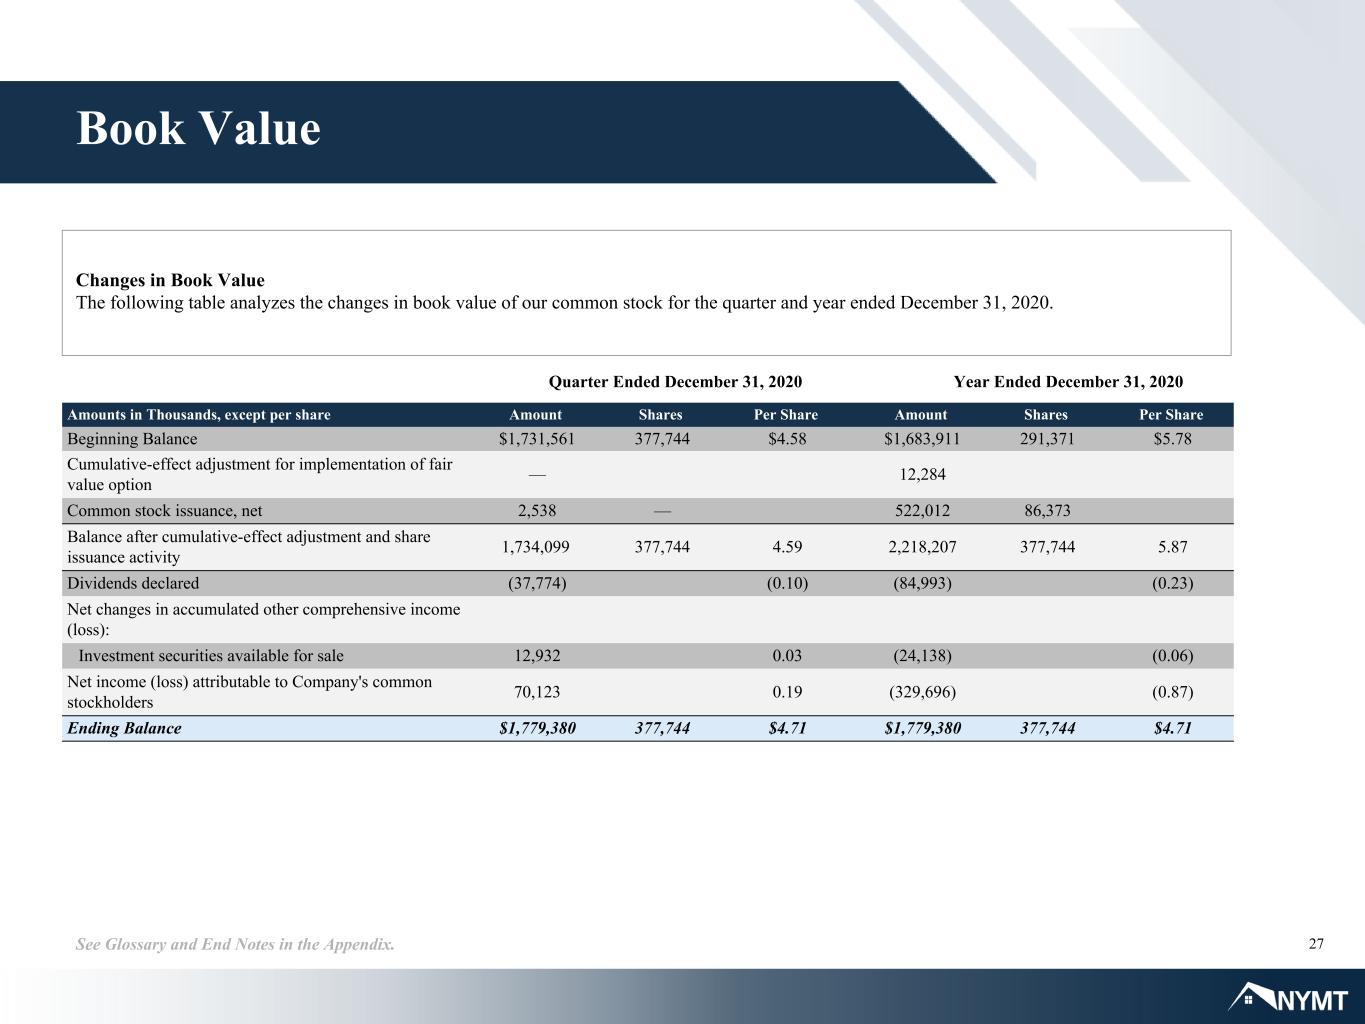
27See Glossary and End Notes in the Appendix. Book Value Changes in Book Value The following table analyzes the changes in book value of our common stock for the quarter and year ended December 31, 2020. Quarter Ended December 31, 2020 Amounts in Thousands, except per share Amount Shares Per Share Amount Shares Per Share Beginning Balance $1,731,561 377,744 $4.58 $1,683,911 291,371 $5.78 Cumulative-effect adjustment for implementation of fair value option — 12,284 Common stock issuance, net 2,538 — 522,012 86,373 Balance after cumulative-effect adjustment and share issuance activity 1,734,099 377,744 4.59 2,218,207 377,744 5.87 Dividends declared (37,774) (0.10) (84,993) (0.23) Net changes in accumulated other comprehensive income (loss): Investment securities available for sale 12,932 0.03 (24,138) (0.06) Net income (loss) attributable to Company's common stockholders 70,123 0.19 (329,696) (0.87) Ending Balance $1,779,380 377,744 $4.71 $1,779,380 377,744 $4.71 Year Ended December 31, 2020
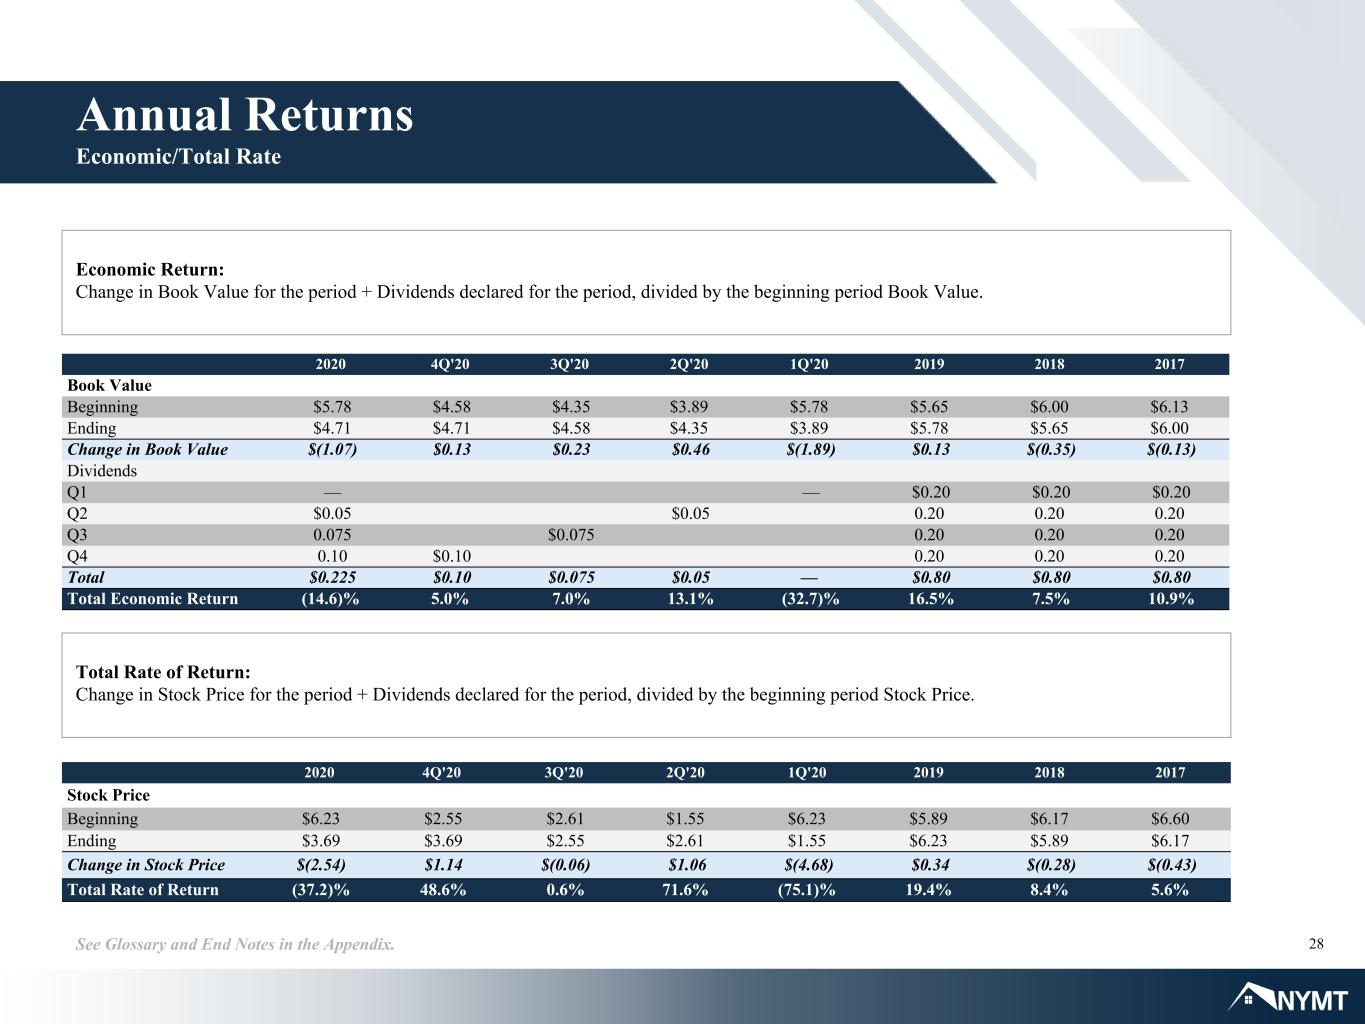
28See Glossary and End Notes in the Appendix. Economic Return: Change in Book Value for the period + Dividends declared for the period, divided by the beginning period Book Value. Total Rate of Return: Change in Stock Price for the period + Dividends declared for the period, divided by the beginning period Stock Price. Annual Returns Economic/Total Rate 2020 4Q'20 3Q'20 2Q'20 1Q'20 2019 2018 2017 Book Value Beginning $5.78 $4.58 $4.35 $3.89 $5.78 $5.65 $6.00 $6.13 Ending $4.71 $4.71 $4.58 $4.35 $3.89 $5.78 $5.65 $6.00 Change in Book Value $(1.07) $0.13 $0.23 $0.46 $(1.89) $0.13 $(0.35) $(0.13) Dividends Q1 — — $0.20 $0.20 $0.20 Q2 $0.05 $0.05 0.20 0.20 0.20 Q3 0.075 $0.075 0.20 0.20 0.20 Q4 0.10 $0.10 0.20 0.20 0.20 Total $0.225 $0.10 $0.075 $0.05 — $0.80 $0.80 $0.80 Total Economic Return (14.6)% 5.0% 7.0% 13.1% (32.7)% 16.5% 7.5% 10.9% 2020 4Q'20 3Q'20 2Q'20 1Q'20 2019 2018 2017 Stock Price Beginning $6.23 $2.55 $2.61 $1.55 $6.23 $5.89 $6.17 $6.60 Ending $3.69 $3.69 $2.55 $2.61 $1.55 $6.23 $5.89 $6.17 Change in Stock Price $(2.54) $1.14 $(0.06) $1.06 $(4.68) $0.34 $(0.28) $(0.43) Total Rate of Return (37.2)% 48.6% 0.6% 71.6% (75.1)% 19.4% 8.4% 5.6%
Appendix
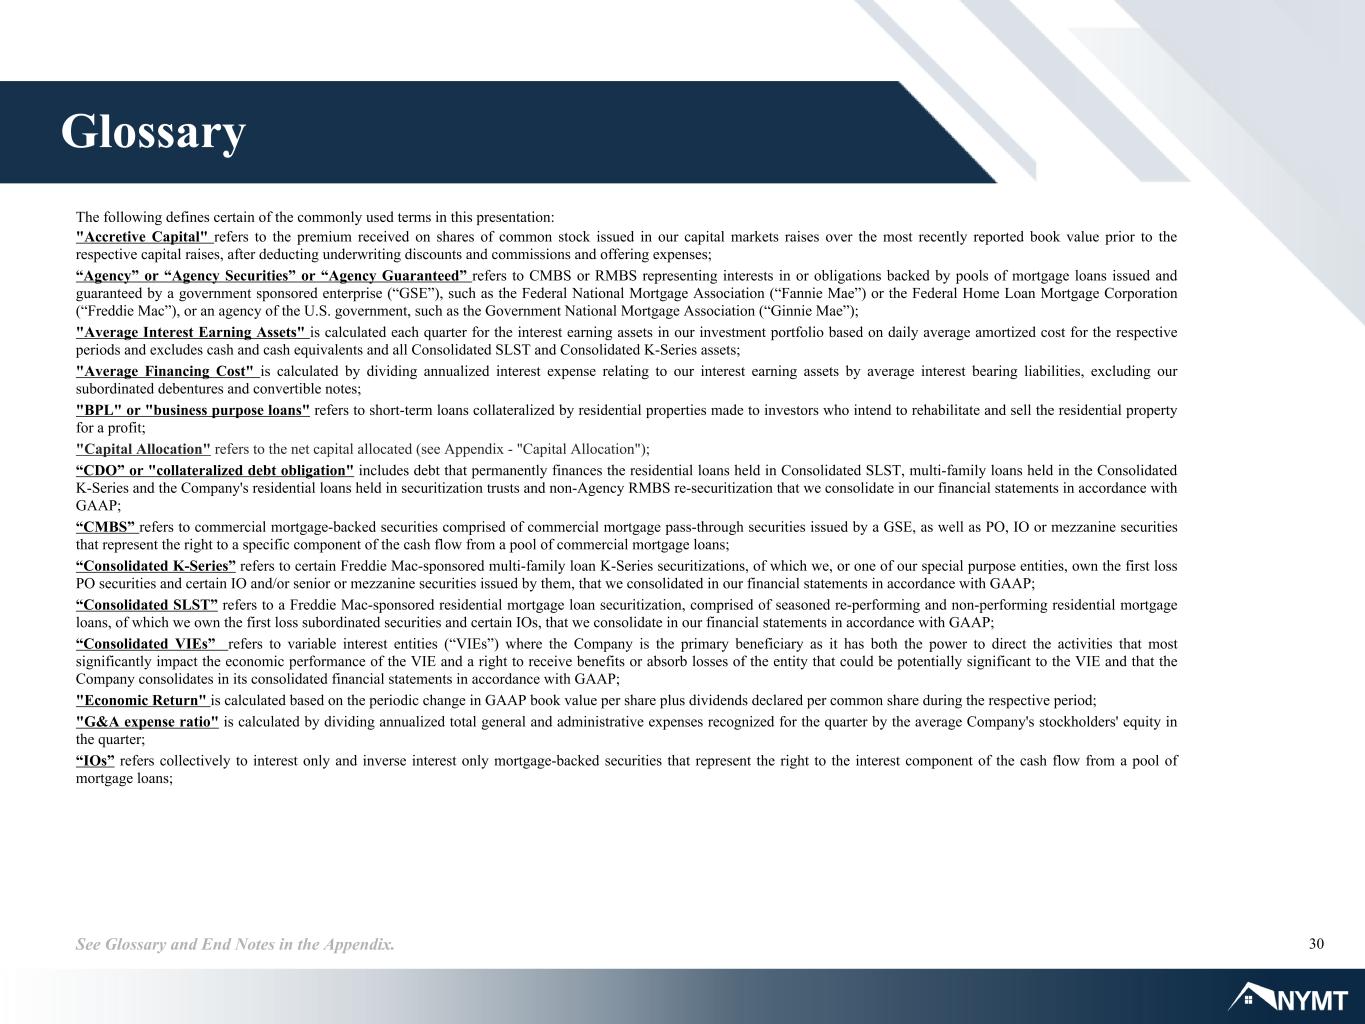
30See Glossary and End Notes in the Appendix. The following defines certain of the commonly used terms in this presentation: "Accretive Capital" refers to the premium received on shares of common stock issued in our capital markets raises over the most recently reported book value prior to the respective capital raises, after deducting underwriting discounts and commissions and offering expenses; “Agency” or “Agency Securities” or “Agency Guaranteed” refers to CMBS or RMBS representing interests in or obligations backed by pools of mortgage loans issued and guaranteed by a government sponsored enterprise (“GSE”), such as the Federal National Mortgage Association (“Fannie Mae”) or the Federal Home Loan Mortgage Corporation (“Freddie Mac”), or an agency of the U.S. government, such as the Government National Mortgage Association (“Ginnie Mae”); "Average Interest Earning Assets" is calculated each quarter for the interest earning assets in our investment portfolio based on daily average amortized cost for the respective periods and excludes cash and cash equivalents and all Consolidated SLST and Consolidated K-Series assets; "Average Financing Cost" is calculated by dividing annualized interest expense relating to our interest earning assets by average interest bearing liabilities, excluding our subordinated debentures and convertible notes; "BPL" or "business purpose loans" refers to short-term loans collateralized by residential properties made to investors who intend to rehabilitate and sell the residential property for a profit; "Capital Allocation" refers to the net capital allocated (see Appendix - "Capital Allocation"); “CDO” or "collateralized debt obligation" includes debt that permanently finances the residential loans held in Consolidated SLST, multi-family loans held in the Consolidated K-Series and the Company's residential loans held in securitization trusts and non-Agency RMBS re-securitization that we consolidate in our financial statements in accordance with GAAP; “CMBS” refers to commercial mortgage-backed securities comprised of commercial mortgage pass-through securities issued by a GSE, as well as PO, IO or mezzanine securities that represent the right to a specific component of the cash flow from a pool of commercial mortgage loans; “Consolidated K-Series” refers to certain Freddie Mac-sponsored multi-family loan K-Series securitizations, of which we, or one of our special purpose entities, own the first loss PO securities and certain IO and/or senior or mezzanine securities issued by them, that we consolidated in our financial statements in accordance with GAAP; “Consolidated SLST” refers to a Freddie Mac-sponsored residential mortgage loan securitization, comprised of seasoned re-performing and non-performing residential mortgage loans, of which we own the first loss subordinated securities and certain IOs, that we consolidate in our financial statements in accordance with GAAP; “Consolidated VIEs” refers to variable interest entities (“VIEs”) where the Company is the primary beneficiary as it has both the power to direct the activities that most significantly impact the economic performance of the VIE and a right to receive benefits or absorb losses of the entity that could be potentially significant to the VIE and that the Company consolidates in its consolidated financial statements in accordance with GAAP; "Economic Return" is calculated based on the periodic change in GAAP book value per share plus dividends declared per common share during the respective period; "G&A expense ratio" is calculated by dividing annualized total general and administrative expenses recognized for the quarter by the average Company's stockholders' equity in the quarter; “IOs” refers collectively to interest only and inverse interest only mortgage-backed securities that represent the right to the interest component of the cash flow from a pool of mortgage loans; Glossary
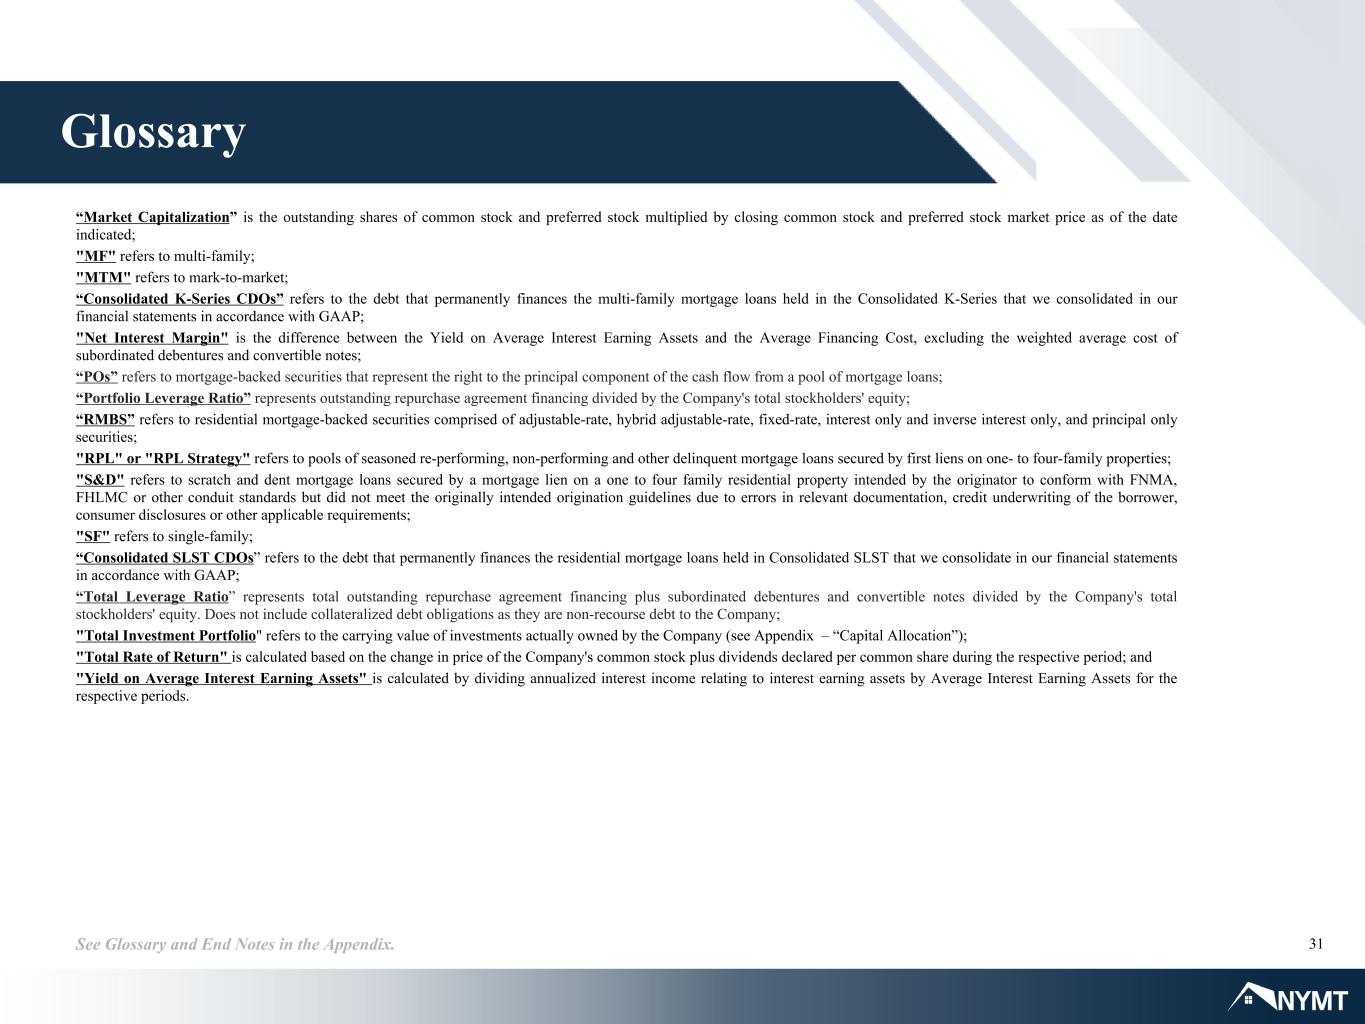
31See Glossary and End Notes in the Appendix. “Market Capitalization” is the outstanding shares of common stock and preferred stock multiplied by closing common stock and preferred stock market price as of the date indicated; "MF" refers to multi-family; "MTM" refers to mark-to-market; “Consolidated K-Series CDOs” refers to the debt that permanently finances the multi-family mortgage loans held in the Consolidated K-Series that we consolidated in our financial statements in accordance with GAAP; "Net Interest Margin" is the difference between the Yield on Average Interest Earning Assets and the Average Financing Cost, excluding the weighted average cost of subordinated debentures and convertible notes; “POs” refers to mortgage-backed securities that represent the right to the principal component of the cash flow from a pool of mortgage loans; “Portfolio Leverage Ratio” represents outstanding repurchase agreement financing divided by the Company's total stockholders' equity; “RMBS” refers to residential mortgage-backed securities comprised of adjustable-rate, hybrid adjustable-rate, fixed-rate, interest only and inverse interest only, and principal only securities; "RPL" or "RPL Strategy" refers to pools of seasoned re-performing, non-performing and other delinquent mortgage loans secured by first liens on one- to four-family properties; "S&D" refers to scratch and dent mortgage loans secured by a mortgage lien on a one to four family residential property intended by the originator to conform with FNMA, FHLMC or other conduit standards but did not meet the originally intended origination guidelines due to errors in relevant documentation, credit underwriting of the borrower, consumer disclosures or other applicable requirements; "SF" refers to single-family; “Consolidated SLST CDOs” refers to the debt that permanently finances the residential mortgage loans held in Consolidated SLST that we consolidate in our financial statements in accordance with GAAP; “Total Leverage Ratio” represents total outstanding repurchase agreement financing plus subordinated debentures and convertible notes divided by the Company's total stockholders' equity. Does not include collateralized debt obligations as they are non-recourse debt to the Company; "Total Investment Portfolio" refers to the carrying value of investments actually owned by the Company (see Appendix – “Capital Allocation”); "Total Rate of Return" is calculated based on the change in price of the Company's common stock plus dividends declared per common share during the respective period; and "Yield on Average Interest Earning Assets" is calculated by dividing annualized interest income relating to interest earning assets by Average Interest Earning Assets for the respective periods. Glossary
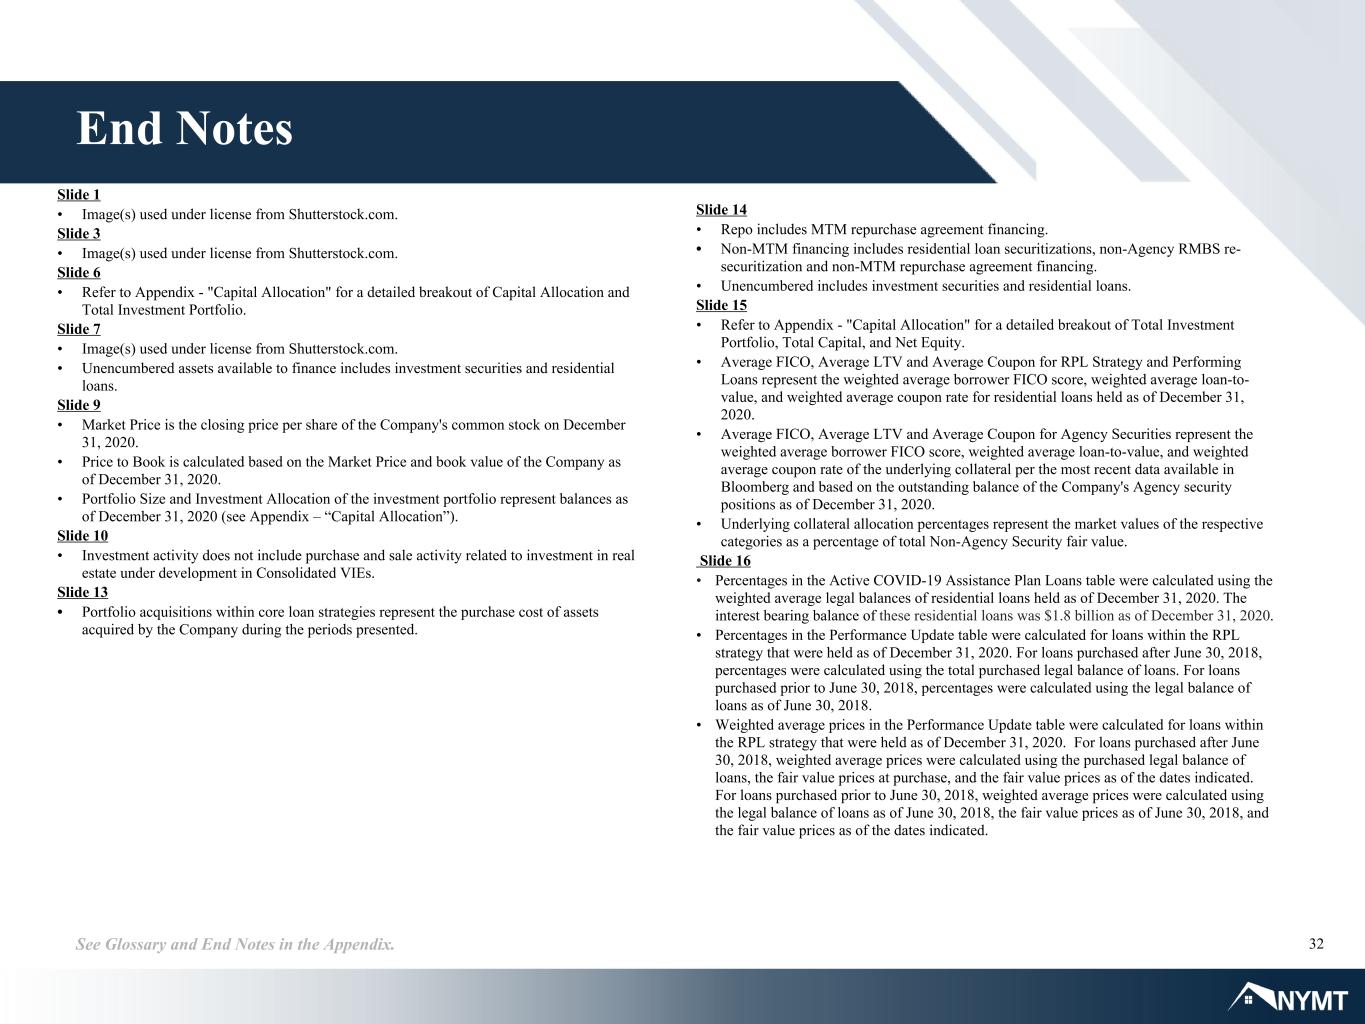
32See Glossary and End Notes in the Appendix. End Notes Slide 1 • Image(s) used under license from Shutterstock.com. Slide 3 • Image(s) used under license from Shutterstock.com. Slide 6 • Refer to Appendix - "Capital Allocation" for a detailed breakout of Capital Allocation and Total Investment Portfolio. Slide 7 • Image(s) used under license from Shutterstock.com. • Unencumbered assets available to finance includes investment securities and residential loans. Slide 9 • Market Price is the closing price per share of the Company's common stock on December 31, 2020. • Price to Book is calculated based on the Market Price and book value of the Company as of December 31, 2020. • Portfolio Size and Investment Allocation of the investment portfolio represent balances as of December 31, 2020 (see Appendix – “Capital Allocation”). Slide 10 • Investment activity does not include purchase and sale activity related to investment in real estate under development in Consolidated VIEs. Slide 13 • Portfolio acquisitions within core loan strategies represent the purchase cost of assets acquired by the Company during the periods presented. Slide 14 • Repo includes MTM repurchase agreement financing. • Non-MTM financing includes residential loan securitizations, non-Agency RMBS re- securitization and non-MTM repurchase agreement financing. • Unencumbered includes investment securities and residential loans. Slide 15 • Refer to Appendix - "Capital Allocation" for a detailed breakout of Total Investment Portfolio, Total Capital, and Net Equity. • Average FICO, Average LTV and Average Coupon for RPL Strategy and Performing Loans represent the weighted average borrower FICO score, weighted average loan-to- value, and weighted average coupon rate for residential loans held as of December 31, 2020. • Average FICO, Average LTV and Average Coupon for Agency Securities represent the weighted average borrower FICO score, weighted average loan-to-value, and weighted average coupon rate of the underlying collateral per the most recent data available in Bloomberg and based on the outstanding balance of the Company's Agency security positions as of December 31, 2020. • Underlying collateral allocation percentages represent the market values of the respective categories as a percentage of total Non-Agency Security fair value. Slide 16 • Percentages in the Active COVID-19 Assistance Plan Loans table were calculated using the weighted average legal balances of residential loans held as of December 31, 2020. The interest bearing balance of these residential loans was $1.8 billion as of December 31, 2020. • Percentages in the Performance Update table were calculated for loans within the RPL strategy that were held as of December 31, 2020. For loans purchased after June 30, 2018, percentages were calculated using the total purchased legal balance of loans. For loans purchased prior to June 30, 2018, percentages were calculated using the legal balance of loans as of June 30, 2018. • Weighted average prices in the Performance Update table were calculated for loans within the RPL strategy that were held as of December 31, 2020. For loans purchased after June 30, 2018, weighted average prices were calculated using the purchased legal balance of loans, the fair value prices at purchase, and the fair value prices as of the dates indicated. For loans purchased prior to June 30, 2018, weighted average prices were calculated using the legal balance of loans as of June 30, 2018, the fair value prices as of June 30, 2018, and the fair value prices as of the dates indicated.
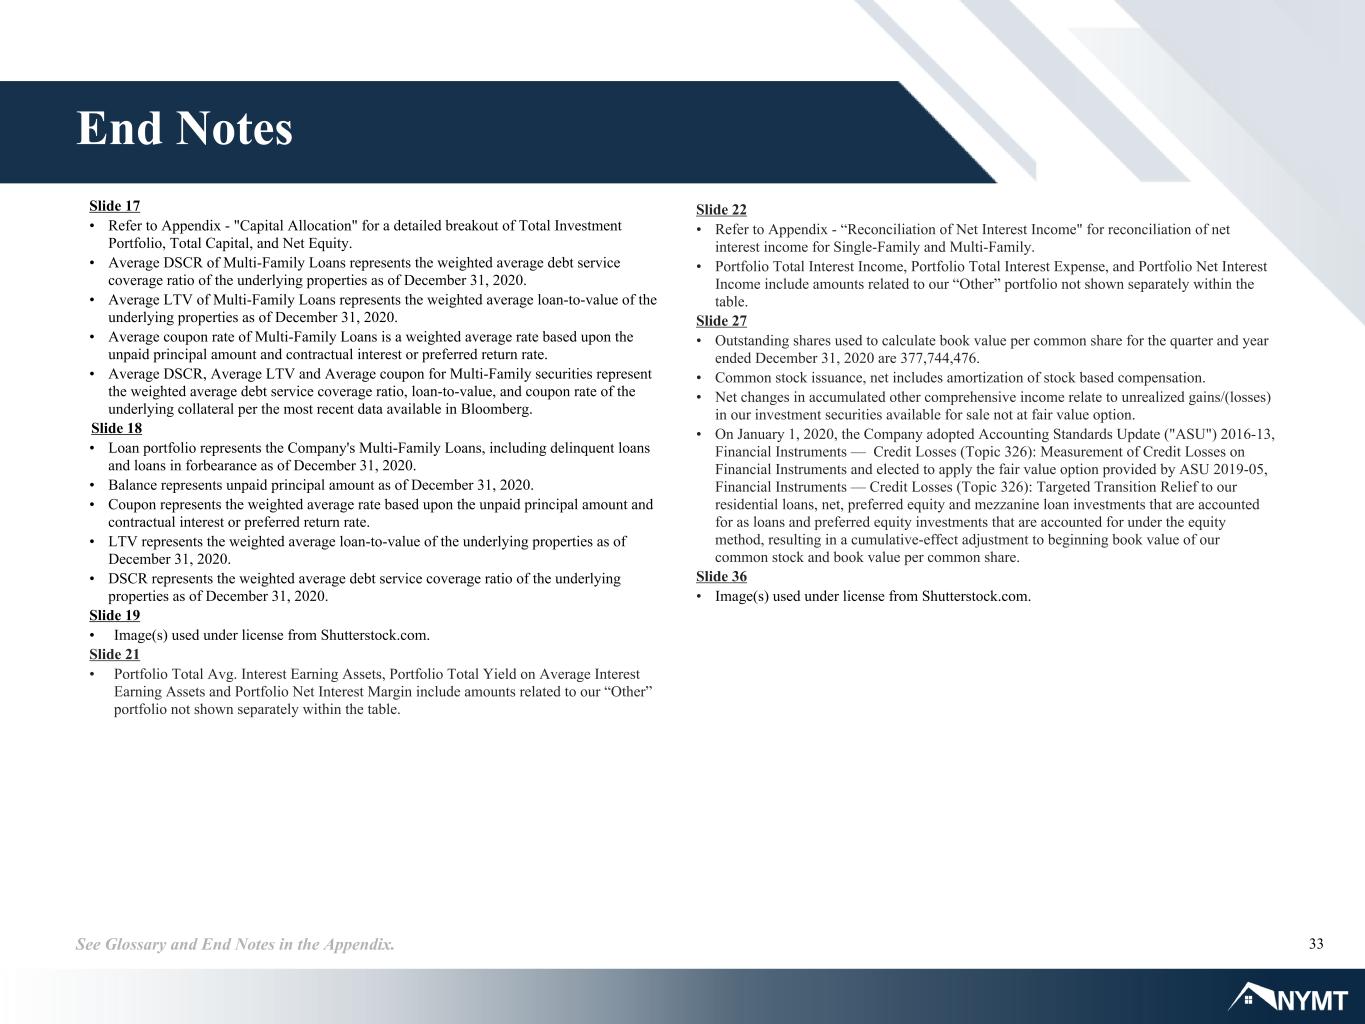
33See Glossary and End Notes in the Appendix. End Notes Slide 17 • Refer to Appendix - "Capital Allocation" for a detailed breakout of Total Investment Portfolio, Total Capital, and Net Equity. • Average DSCR of Multi-Family Loans represents the weighted average debt service coverage ratio of the underlying properties as of December 31, 2020. • Average LTV of Multi-Family Loans represents the weighted average loan-to-value of the underlying properties as of December 31, 2020. • Average coupon rate of Multi-Family Loans is a weighted average rate based upon the unpaid principal amount and contractual interest or preferred return rate. • Average DSCR, Average LTV and Average coupon for Multi-Family securities represent the weighted average debt service coverage ratio, loan-to-value, and coupon rate of the underlying collateral per the most recent data available in Bloomberg. Slide 18 • Loan portfolio represents the Company's Multi-Family Loans, including delinquent loans and loans in forbearance as of December 31, 2020. • Balance represents unpaid principal amount as of December 31, 2020. • Coupon represents the weighted average rate based upon the unpaid principal amount and contractual interest or preferred return rate. • LTV represents the weighted average loan-to-value of the underlying properties as of December 31, 2020. • DSCR represents the weighted average debt service coverage ratio of the underlying properties as of December 31, 2020. Slide 19 • Image(s) used under license from Shutterstock.com. Slide 21 • Portfolio Total Avg. Interest Earning Assets, Portfolio Total Yield on Average Interest Earning Assets and Portfolio Net Interest Margin include amounts related to our “Other” portfolio not shown separately within the table. Slide 22 • Refer to Appendix - “Reconciliation of Net Interest Income" for reconciliation of net interest income for Single-Family and Multi-Family. • Portfolio Total Interest Income, Portfolio Total Interest Expense, and Portfolio Net Interest Income include amounts related to our “Other” portfolio not shown separately within the table. Slide 27 • Outstanding shares used to calculate book value per common share for the quarter and year ended December 31, 2020 are 377,744,476. • Common stock issuance, net includes amortization of stock based compensation. • Net changes in accumulated other comprehensive income relate to unrealized gains/(losses) in our investment securities available for sale not at fair value option. • On January 1, 2020, the Company adopted Accounting Standards Update ("ASU") 2016-13, Financial Instruments — Credit Losses (Topic 326): Measurement of Credit Losses on Financial Instruments and elected to apply the fair value option provided by ASU 2019-05, Financial Instruments — Credit Losses (Topic 326): Targeted Transition Relief to our residential loans, net, preferred equity and mezzanine loan investments that are accounted for as loans and preferred equity investments that are accounted for under the equity method, resulting in a cumulative-effect adjustment to beginning book value of our common stock and book value per common share. Slide 36 • Image(s) used under license from Shutterstock.com.
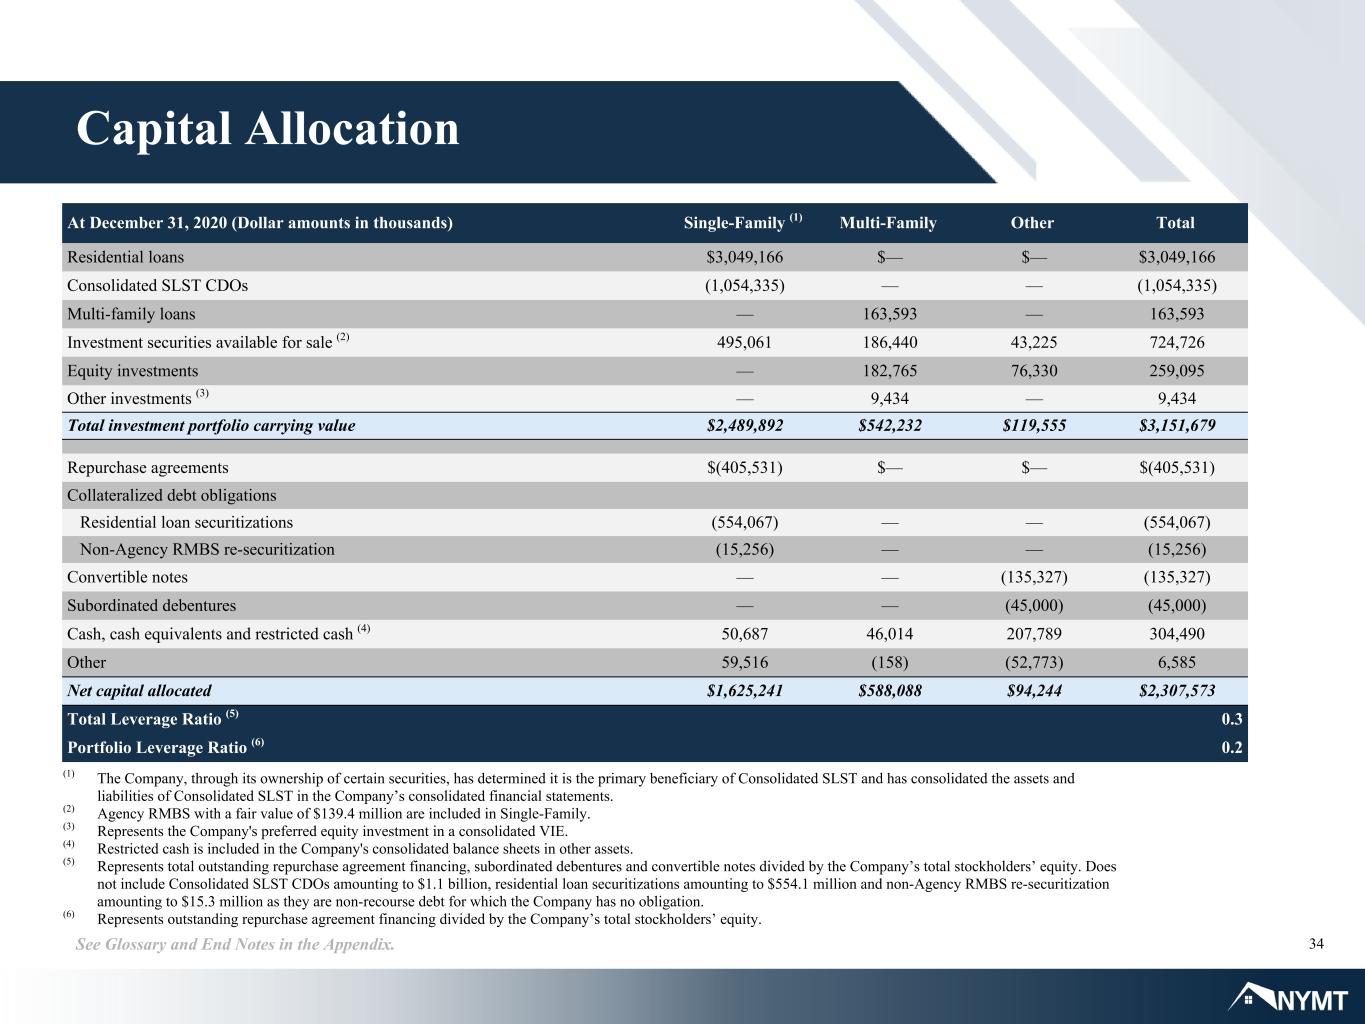
34See Glossary and End Notes in the Appendix. Capital Allocation At December 31, 2020 (Dollar amounts in thousands) Single-Family (1) Multi-Family Other Total Residential loans $3,049,166 $— $— $3,049,166 Consolidated SLST CDOs (1,054,335) — — (1,054,335) Multi-family loans — 163,593 — 163,593 Investment securities available for sale (2) 495,061 186,440 43,225 724,726 Equity investments — 182,765 76,330 259,095 Other investments (3) — 9,434 — 9,434 Total investment portfolio carrying value $2,489,892 $542,232 $119,555 $3,151,679 Repurchase agreements $(405,531) $— $— $(405,531) Collateralized debt obligations Residential loan securitizations (554,067) — — (554,067) Non-Agency RMBS re-securitization (15,256) — — (15,256) Convertible notes — — (135,327) (135,327) Subordinated debentures — — (45,000) (45,000) Cash, cash equivalents and restricted cash (4) 50,687 46,014 207,789 304,490 Other 59,516 (158) (52,773) 6,585 Net capital allocated $1,625,241 $588,088 $94,244 $2,307,573 Total Leverage Ratio (5) 0.3 Portfolio Leverage Ratio (6) 0.2 (1) The Company, through its ownership of certain securities, has determined it is the primary beneficiary of Consolidated SLST and has consolidated the assets and liabilities of Consolidated SLST in the Company’s consolidated financial statements. (2) Agency RMBS with a fair value of $139.4 million are included in Single-Family. (3) Represents the Company's preferred equity investment in a consolidated VIE. (4) Restricted cash is included in the Company's consolidated balance sheets in other assets. (5) Represents total outstanding repurchase agreement financing, subordinated debentures and convertible notes divided by the Company’s total stockholders’ equity. Does not include Consolidated SLST CDOs amounting to $1.1 billion, residential loan securitizations amounting to $554.1 million and non-Agency RMBS re-securitization amounting to $15.3 million as they are non-recourse debt for which the Company has no obligation. (6) Represents outstanding repurchase agreement financing divided by the Company’s total stockholders’ equity.

35See Glossary and End Notes in the Appendix. Reconciliation of Net Interest Income Dollar amounts in thousands 4Q'20 3Q'20 2Q'20 1Q'20 4Q'19 Single-Family Interest income, residential loans $21,899 $19,808 $17,898 $22,177 $19,988 Interest income, Consolidated SLST 10,653 10,896 11,522 12,123 4,764 Interest income, investment securities available for sale 4,892 5,605 8,268 14,209 14,647 Interest expense, Consolidated SLST CDOs (7,408) (7,562) (8,158) (8,535) (2,945) Interest income, Single-Family, net 30,036 28,747 29,530 39,974 36,454 Interest expense, repurchase agreements (3,882) (5,341) (7,299) (14,330) (16,317) Interest expense, residential loan securitizations (4,440) (2,160) (130) (237) (271) Interest expense, non-Agency RMBS re- securitization (1,297) (1,524) (469) — — Net Interest Income, Single-Family $20,417 $19,722 $21,632 $25,407 $19,866 Multi-Family Interest income, Multi-Family loans held in Consolidated K-Series $— $— $— $151,841 $150,483 Interest income, investment securities available for sale 2,007 2,546 3,652 3,524 3,307 Interest income, preferred equity and mezzanine loan investments 5,024 5,300 5,202 5,373 5,239 Interest expense, Consolidated K-Series CDOs — — — (129,762) (125,089) Interest income, Multi-Family, net 7,031 7,846 8,854 30,976 33,940 Interest expense, repurchase agreements — — (58) (7,293) (7,755) Net Interest Income, Multi-Family $7,031 $7,846 $8,796 $23,683 $26,185

Thank You From all of us at NYMT
