Attached files
| file | filename |
|---|---|
| EX-32 - EX-32 - Crescent Capital BDC, Inc. | d140499dex32.htm |
| EX-31.2 - EX-31.2 - Crescent Capital BDC, Inc. | d140499dex312.htm |
| EX-31.1 - EX-31.1 - Crescent Capital BDC, Inc. | d140499dex311.htm |
| EX-21.1 - EX-21.1 - Crescent Capital BDC, Inc. | d140499dex211.htm |
| EX-4.27 - EX-4.27 - Crescent Capital BDC, Inc. | d140499dex427.htm |
UNITED STATES
SECURITIES AND EXCHANGE COMMISSION
WASHINGTON, DC 20549
FORM 10-K
(Mark One)
| ☒ | ANNUAL REPORT PURSUANT TO SECTION 13 OR 15(d) OF THE SECURITIES EXCHANGE ACT OF 1934. |
For the fiscal year ended December 31, 2020
or
| ☐ | TRANSITION REPORT PURSUANT TO SECTION 13 OR 15(d) OF THE SECURITIES EXCHANGE ACT OF 1934. |
Commission file number 814-01132
Crescent Capital BDC, Inc.
(Exact Name of Registrant as Specified in Its Charter)
| Maryland | 47-3162282 | |
| (State or Other Jurisdiction of Incorporation or Organization) |
(I.R.S. Employer Identification No.) | |
| 11100 Santa Monica Blvd., Suite 2000, Los Angeles, CA | 90025 | |
| (Address of Principal Executive Offices) | (Zip Code) | |
Registrant’s Telephone Number, Including Area Code: (310) 235-5900
Securities registered pursuant to Section 12(b) of the Act:
| Title of each class |
Trading Symbol |
Name of each exchange on which registered | ||
| Common Stock, $0.001 par value per share | CCAP | The Nasdaq Stock Market LLC |
Securities registered pursuant to Section 12(g) of the Act: None
Indicate by check mark if the registrant is a well-known seasoned issuer, as defined in Rule 405 of the Securities Act. Yes ☐ No ☒
Indicate by check mark if the registrant is not required to file reports pursuant to Section 13 or Section 15(d) of the Act. Yes ☐ No ☒
Indicate by check mark whether the Registrant (1) has filed all reports required to be filed by Section 13 or 15(d) of the Securities Exchange Act of 1934 during the preceding 12 months (or for such shorter period that the Registrant was required to file such reports), and (2) has been subject to such filing requirements for the past 90 days. Yes ☒ No ☐
Indicate by check mark whether the registrant has submitted electronically and posted on its corporate Web site, if any, every Interactive Data File required to be submitted and posted pursuant to Rule 405 of Regulation S-T (§232.405 of this chapter) during the preceding 12 months (or for such shorter period that the registrant was required to submit files). Yes ☐ No ☐
Indicate by check mark whether the Registrant is a large accelerated filer, an accelerated filer, a non-accelerated filer, or a smaller reporting company. See the definitions of “large accelerated filer,” “accelerated filer,” “smaller reporting company” and “emerging growth company” in Rule 12b-2 of the Exchange Act.
| Large accelerated filer | ☐ | Accelerated filer | ☐ | |||
| Non-Accelerated filer | ☒ | Smaller reporting company | ☐ | |||
| Emerging growth company | ☒ | |||||
If an emerging growth company, indicate by check mark if the registrant has elected not to use the extended transition period for complying with any new or revised financial accounting standards provided pursuant to Section 13(a) of the Exchange Act. ☐
Indicate by check mark whether the registrant has filed a report on and attestation to its management’s assessment of the effectiveness of its internal control over financial reporting under Section 404(b) of the Sarbanes-Oxley Act (15 U.S.C. 7262(b)) by the registered public accounting firm that prepared or issued its audit report. ☐
Indicate by check mark whether the Registrant is a shell company (as defined in Rule 12b-2 of the Securities Exchange Act of 1934). Yes ☐ No ☒
The aggregate market value of the voting common equity held by non-affiliates of the registrant, was $200.9 million based on the number of shares held by non-affiliates of the registrant as of June 30, 2020 (the last business day of the registrant’s most recently completed second fiscal quarter). Shares of the registrant’s common stock held by each executive officer, director and holder of 5% or more of the outstanding common stock have been excluded in that such persons may be deemed to be affiliates. The calculation does not reflect a determination that certain persons are affiliates of the registrant for any other purpose.
The number of shares of the Registrant’s common stock, $.001 par value per share, outstanding at February 24, 2021 was 28,167,360
DOCUMENTS INCORPORATED BY REFERENCE
Portions of the Registrant’s proxy statement for the 2020 annual meeting of stockholders to be filed not later than 120 days after the end of the fiscal year covered by this Annual Report on Form 10-K are incorporated by reference in Part III.
CRESCENT CAPITAL BDC, INC.
INDEX TO ANNUAL REPORT ON FORM 10-K FOR
YEAR ENDED DECEMBER 31, 2020
| PAGE | ||||||
| ITEM 1. |
4 | |||||
| ITEM 1A. |
18 | |||||
| ITEM 1B. |
45 | |||||
| ITEM 2. |
45 | |||||
| ITEM 3. |
45 | |||||
| ITEM 4. |
45 | |||||
| ITEM 5. |
46 | |||||
| ITEM 6. |
48 | |||||
| ITEM 7. |
Management’s Discussion and Analysis of Financial Condition and Results of Operations |
49 | ||||
| ITEM 7A. |
63 | |||||
| ITEM 8. |
65 | |||||
| ITEM 9. |
Changes in and Disagreements with Accountants on Accounting and Financial Disclosure |
130 | ||||
| ITEM 9A. |
130 | |||||
| ITEM 9B. |
130 | |||||
| ITEM 10. |
131 | |||||
| ITEM 11. |
131 | |||||
| ITEM 12. |
Security Ownership of Certain Beneficial Owners and Management and Related Stockholder Matters |
131 | ||||
| ITEM 13. |
Certain Relationships and Related Transactions, and Director Independence |
131 | ||||
| ITEM 14. |
131 | |||||
| ITEM 15. |
132 | |||||
| ITEM 16. |
135 | |||||
| 136 | ||||||
CAUTIONARY STATEMENT REGARDING FORWARD-LOOKING STATEMENTS
This report contains forward-looking statements that involve substantial risks and uncertainties. These forward-looking statements are not historical facts, but rather are based on current expectations, estimates and projections about us, our current or prospective portfolio investments, our industry, our beliefs, and our assumptions. We believe that it is important to communicate our future expectations to our investors. Words such as “anticipates,” “expects,” “intends,” “plans,” “believes,” “seeks,” “estimates,” “would,” “will,” “should,” “targets,” “projects,” and variations of these words and similar expressions identify forward-looking statements, although not all forward-looking statements include these words. These statements are not guarantees of future performance and are subject to risks, uncertainties, and other factors, some of which are beyond our control and are difficult to predict, that could cause actual results to differ materially from those expressed or forecasted in the forward-looking statements.
The following factors and factors listed under “Risk Factors” in this report and other documents Crescent Capital BDC, Inc. has filed with the Securities and Exchange Commission, or SEC, provide examples of risks, uncertainties and events that may cause our actual results to differ materially from the expectations we describe in our forward-looking statements. The occurrence of the events described in these risk factors and elsewhere in this report could have a material adverse effect on our business, results of operation and financial position. The following factors are among those that may cause actual results to differ materially from our forward-looking statements:
| • | uncertainty surrounding the financial stability of the United States, Europe and China; |
| • | the ability of our investment adviser to locate suitable investments for us and to monitor and administer our investments; |
| • | potential fluctuation in quarterly operating results; |
| • | potential impact of economic recessions or downturns; |
| • | adverse developments in the credit markets; |
| • | regulations governing our operation as a business development company; |
| • | operation in a highly competitive market for investment opportunities; |
| • | changes in interest rates may affect our cost of capital and net investment income; |
| • | the impact of changes in London Interbank Offered Rate (“LIBOR”) on our operating results; |
| • | financing investments with borrowed money; |
| • | potential adverse effects of price declines and illiquidity in the corporate debt markets; |
| • | the impact of COVID-19 on our portfolio companies and the markets in which they operate, interest rates and the economy in general; |
| • | lack of liquidity in investments; |
| • | the outcome and impact of any litigation; |
| • | the timing, form and amount of any dividend distributions; |
| • | risks regarding distributions; |
| • | potential adverse effects of new or modified laws and regulations; |
| • | the social, geopolitical, financial, trade and legal implications of Brexit; |
| • | potential resignation of the Adviser and or the Administrator; |
| • | uncertainty as to the value of certain portfolio investments; |
| • | defaults by portfolio companies; |
| • | our ability to successfully complete and integrate any acquisitions; |
| • | risks associated with original issue discount (“OID”) and payment-in-kind (“PIK”) interest income; and |
| • | the market price of our common stock may fluctuate significantly. |
Although we believe that the assumptions on which these forward-looking statements are based upon are reasonable, some of those assumptions are based on the work of third parties and any of those assumptions could prove to be inaccurate; as a result, forward-looking statements based on those assumptions also could prove to be inaccurate. In light of these and other uncertainties, the inclusion of a projection or forward-looking statement in this report should not be regarded as a representation by us that our plans and objectives will be achieved. You should not place undue reliance on these forward-looking statements, which apply only as of the date of this report. We do not undertake any obligation to update or revise any forward-looking statements or any other information contained herein, except as required by applicable law. You are advised to consult any additional disclosures that we may make directly to you or through reports that we in the future may file with the SEC, including annual reports on Form 10-K, quarterly reports on Form 10-Q and current reports on Form 8-K. The safe harbor provisions of Section 21E of the Securities Exchange Act of 1934, as amended (the “Exchange Act”), which preclude civil liability for certain forward-looking statements, do not apply to the forward-looking statements in this report because we are an investment company.
1
SUMMARY OF RISK FACTORS
The following summarizes the principal factors that make an investment in our company speculative or risky, all of which are more fully described in “Item 1A. Risk Factors.” This summary should be read in conjunction with “Item 1A. Risk Factors” and should not be relied upon as an exhaustive summary of the material risks facing our business.
Risks Relating to the COVID-19 pandemic
| • | Global economic, political and market conditions caused by the current public health crisis have (and in the future, could further) adversely affect our business, results of operations and financial condition and those of our portfolio companies. |
Risks Relating to our Business and Structure
| • | We have a limited operating history and are dependent upon Crescent and key personnel of Crescent and the Adviser. |
| • | We may not replicate the historical results achieved by Crescent. |
| • | Global capital markets could enter a period of severe disruption and instability. These conditions have historically affected and could again materially and adversely affect debt and equity capital markets in the United States and around the world and our business. |
| • | Global economic, political and market conditions, including uncertainty about the financial stability of the United States, could have a significant adverse effect on our business, financial condition and results of operations. |
| • | Adverse developments in the credit markets may impair our ability to enter into new debt financing arrangements. |
| • | The Adviser, the investment committee of the Adviser, Crescent and their affiliates, officers, directors and employees may face certain conflicts of interest. Conflicts of interest may be created by the valuation process for certain portfolio holdings. Conflicts may arise related to other arrangements with Crescent and the Adviser and other affiliates. |
| • | Crescent’s principals and employees, the Adviser or their affiliates may, from time to time, possess material non-public information, limiting our investment discretion. |
| • | Our management and incentive fee structure may create incentives for the Adviser that are not fully aligned with our stockholders’ interests and may induce the Adviser to make speculative investments. |
| • | Our Investment Advisory Agreement was negotiated with the Adviser and the Administration Agreement was negotiated with the Administrator, which are both our related parties. The Adviser has limited liability and is entitled to indemnification under the Investment Advisory Agreement. |
| • | We operate in an increasingly competitive market for investment opportunities, which could make it difficult for us to identify and make investments that are consistent with our investment objectives. Our ability to enter into transactions with our affiliates is restricted. Our ability to sell or otherwise exit investments also invested in by other Crescent investment vehicles is restricted. |
| • | We may have difficulty paying our required distributions if it recognizes income before, or without, receiving cash representing such income. We will be subject to corporate level income tax if we are unable to qualify as a RIC. Our business may be adversely affected if it fails to maintain its qualification as a RIC. Stockholders may be required to pay tax in excess of the cash they receive. We may be subject to withholding of U. S. Federal income tax on distributions for non-U.S. stockholders. We may retain income and capital gains in excess of what is permissible for excise tax purposes and such amounts will be subject to 4% U.S. federal excise tax, reducing the amount available for distribution to stockholders. |
| • | We may need to raise additional capital. Regulations governing our operation as a BDC affect our ability to, and the way in which we may, raise additional capital. Certain investors are limited in their ability to make significant investments in us. |
| • | Our business could be adversely affected in the event we default under our existing credit facilities or any future credit or other borrowing facility. |
| • | Our strategy involves a high degree of leverage. We intend to continue to finance our investments with borrowed money, which will magnify the potential for gain or loss on amounts invested and increases the risk of investing in us. The risks of investment in a highly leveraged fund include volatility and possible distribution restrictions. |
| • | We are subject to risks associated with the current interest rate environment, and to the extent we use debt to finance our investments, changes in interest rates may affect our cost of capital and net investment income. Further, changes in LIBOR or its discontinuation may adversely affect the value of LIBOR-indexed securities, loans, and other financial obligations or extensions of credit in our portfolio. |
| • | We are and may be subject to restrictions under our credit facilities and any future credit or other borrowing facility that could adversely impact our business. |
| • | We may be the target of litigation. |
| • | There is a risk that investors in our common stock may not receive dividends or that our dividends may not grow over time and that investors in our debt securities may not receive all of the interest income to which they are entitled. |
| • | If we do not invest a sufficient portion of our assets in qualifying assets, we could fail to qualify as a BDC or be precluded from investing according to our current business strategy. |
| • | The majority of our portfolio investments are recorded at fair value as determined in good faith by our Board and, as a result, there may be uncertainty as to the value of our portfolio investments. |
| • | We may experience fluctuations in our quarterly operating results. |
2
| • | New or modified laws or regulations governing our operations may adversely affect our business. |
| • | The United Kingdom referendum decision to leave the European Union may create significant risks and uncertainty for global markets and our investments. |
| • | Our Board may change our investment objectives, operating policies and strategies without prior notice or stockholder approval. |
| • | The Adviser and the Administrator each have the ability to resign on 60 days’ notice, and we may not be able to find a suitable replacement within that time, resulting in a disruption in operations that could adversely affect our financial condition, business and results of operations. |
| • | We are highly dependent on information systems, and systems failures or cyber-attacks could significantly disrupt its business, which may, in turn, negatively affect the value of shares of our common stock and our ability to pay distributions. |
| • | Cybersecurity risks and cyber incidents may adversely affect our business by causing a disruption to our operations, a compromise or corruption of its confidential information and/or damage to its business relationships. |
| • | We and the Adviser are subject to regulations and SEC oversight. If we or the Adviser fail to comply with applicable requirements, it may adversely impact our results relative to companies that are not subject to such regulations. |
| • | We are subject to risks related to corporate social responsibility. |
Risks Relating to Our Investments
| • | We may hold the debt securities of leveraged companies. Economic recessions or downturns could impair our portfolio companies, and defaults by our portfolio companies will harm our operating results. Our portfolio companies may be unable to repay or refinance outstanding principal on their loans at or prior to maturity, and rising interests rates may make it more difficult for portfolio companies to make periodic payments on their loans. |
| • | We typically invest in middle-market companies, which involves higher risk than investments in large companies. |
| • | The due diligence process that the Adviser undertakes in connection with our investments may not reveal all the facts that may be relevant in connection with an investment. |
| • | The lack of liquidity in our investments may adversely affect our business. We may invest in high yield debt, or junk bonds, which has greater credit and liquidity risk than more highly rated debt obligations. Our subordinated investments may be subject to greater risk than investments that are not similarly subordinated. |
| • | Price declines and illiquidity in the corporate debt markets may adversely affect the fair value of our portfolio investments, reducing NAV through increased net unrealized depreciation. |
| • | Our failure to make follow-on investments in our portfolio companies could impair the value of our portfolio. |
| • | The disposition of our investments may result in contingent liabilities. |
| • | We will be subject to the risk that the debt investments we make in our portfolio companies may be repaid prior to maturity. |
| • | We may be subject to risks under hedging transactions and may become subject to risk if it invests in non-U.S. securities. |
| • | We may not realize anticipated gains on the equity interests in which it invests. |
| • | Our investments in OID and PIK interest income may expose us to risks associated with such income being required to be included in accounting income and taxable income prior to receipt of cash. You may receive shares of our Common Stock as dividends, which could result in adverse tax consequences to you. |
| • | Changes in healthcare laws and other regulations applicable to some of our portfolio companies businesses may constrain their ability to offer their products and services. |
| • | Our investments in the consumer products and services sector are subject to various risks including cyclical risks associated with the overall economy. Our investments in the financial services sector are subject to various risks including volatility and extensive government regulation. Our investments in technology companies are subject to many risks, including volatility, intense competition, shortened product life cycles, litigation risk and periodic downturn. |
| • | We may be unable to realize the benefits anticipated by the Alcentra Acquisition, including estimated cost savings and synergies, or it may take longer than anticipated to achieve such benefits. |
Risks Relating to Our Common Stock
| • | The market price of our Common Stock may fluctuate significantly. Our shares of Common Stock have traded at a discount from net asset value and may do so again, which could limit our ability to raise additional equity capital. |
| • | Our stockholders will experience dilution in their ownership percentage if they opt out of our dividend reinvestment plan. |
| • | Provisions of the Maryland General Corporation Law and of the Charter and the Bylaws could deter takeover attempts and have an adverse effect on the price of our Common Stock. |
| • | The Charter imposes certain restrictions on transfer of the our Common Stock held by our stockholders prior to the consummation of the Alcentra Acquisition in addition to those otherwise imposed by applicable law or by contract. |
| • | Our Charter designates the Circuit Court for Baltimore City, Maryland as the sole and exclusive forum for certain types of actions and proceedings that may be initiated by our stockholders, which could limit our stockholders’ ability to obtain a favorable judicial forum for disputes with us or our directors, officers or other employees. |
| • | We will incur significant costs as a result of our listing on NASDAQ. |
3
In this Annual Report, except where the context suggests otherwise, the terms “CCAP,” “we,” “us,” “our,” and “the Company” refer to Crescent Capital BDC, Inc. The term “Adviser” refers to Crescent Cap Advisors, LLC, a Delaware limited liability company. The term “Administrator” refers to CCAP Administration, LLC, a Delaware limited liability company. The term “Crescent” refers to Crescent Capital Group LP and its affiliates.
| Item 1. | Business |
General
We are a specialty finance company focused on lending to middle-market companies and were incorporated under the laws of the
State of Delaware on February 5, 2015 (“Inception”). On January 30, 2020, we changed our state of incorporation from the State of
Delaware to the State of Maryland. On January 31, 2020, the Company completed a transaction to acquire Alcentra Capital Corporation in a cash and stock transaction (the “Alcentra Acquisition”). The Company was listed and began trading on the NASDAQ stock exchange on February 3, 2020.
We have elected to be treated as a business development company (“BDC”) under the Investment Company Act of 1940, as amended (“1940 Act”). In addition, we have elected to be treated for U.S. federal income tax purposes as a regulated investment company (a “RIC”) under Subchapter M of the Internal Revenue Code of 1986, as amended (the “Code”). As such, we are required to comply with various regulatory requirements, such as the requirement to invest at least 70% of our assets in “qualifying assets,” source of income limitations, asset diversification requirements, and the requirement to distribute annually at least 90% of our taxable income and tax-exempt interest.
We are managed by our investment adviser, Crescent Cap Advisors, LLC (the “Adviser”, and formerly, CBDC Advisors, LLC), an investment adviser that is registered with the SEC under the 1940 Act. Our administrator, CCAP Administration LLC (the “Administrator”, and formerly, CBDC Administration, LLC) provides the administrative services necessary for us to operate. Company management consists of investment and administrative professionals from the Adviser and Administrator along with our Board. The Adviser directs and executes our investment operations and capital raising activities subject to oversight from the Board, which sets our broad policies. The Board has delegated investment management of our investment assets to the Adviser. The Board consists of five directors, four of whom are independent.
Our primary investment objective is to maximize the total return to our stockholders in the form of current income and capital appreciation through debt and related equity investments. We seek to achieve our investment objectives by investing primarily in secured debt (including senior secured first lien, unitranche and senior secured second-lien debt) and unsecured debt (including senior unsecured, mezzanine and subordinated debt), as well as related equity securities of private U.S. middle-market companies. We may purchase interests in loans or make debt investments, either (i) directly from our target companies as primary market or private credit investments (i.e., private credit transactions), or (ii) primary or secondary market bank loan or high yield transactions in the broadly syndicated “over-the-counter” market (i.e., broadly syndicated loans and bonds). Although our focus is to invest in less liquid private credit transactions, we may from time to time invest in more liquid broadly syndicated loans and bonds to complement our private credit transactions.
Our investment objective is accomplished through:
| • | accessing the origination channels that have been developed and established by Crescent; |
| • | originating investments in what we believe to be middle-market companies with strong business fundamentals, generally controlled by private equity investors that require capital for growth, acquisitions, recapitalizations, refinancings and leveraged buyouts; |
| • | applying Crescent’s underwriting standards; and |
| • | leveraging Crescent’s experience and resources to monitor our investments. |
Our investment philosophy emphasizes capital preservation through credit selection and risk mitigation. We expect our targeted portfolio to provide downside protection through conservative cash flow and asset coverage requirements, priority in the capital structure and information requirements.
As a BDC under the Act and a RIC under the Code, our portfolio is subject to diversification and other requirements. See “—Certain U.S. Federal Income Tax Consequences.”
We have formed or acquired wholly owned subsidiaries that are structured as tax blockers, to hold equity or equity-like investments in portfolio companies organized as limited liability companies or other forms of pass-through entities. We have also formed a special purpose vehicle that holds certain debt investments in connection with a credit facility. These corporate subsidiaries are not consolidated for income tax purposes and may incur income tax expense as a result of their ownership of portfolio companies.
4
We may borrow money from time to time within the levels permitted by the 1940 Act (up to 150% of asset coverage requirement). In determining whether to borrow money, we analyze the maturity, covenant package and rate structure of the proposed borrowings as well as the risks of such borrowings compared to our investment outlook. The use of borrowed funds or the proceeds of preferred stock offerings to make investments would have its own specific set of benefits and risks, and all of the costs of borrowing funds or issuing preferred stock would be borne by holders of our common stock. See “Item 1A. Risk Factors—Risks Relating to Our Business and Structure—We are subject to risks associated with the current interest rate environment, and to the extent we use debt to finance our investments, changes in interest rates may affect our cost of capital and net investment income. Further, changes in LIBOR or its discontinuation may adversely affect the value of LIBOR-indexed securities, loans, and other financial obligations or extensions of credit in our portfolio.”
The Investment Adviser
The Adviser, a Delaware limited liability company and an affiliate of Crescent, acts as our investment adviser. The Adviser is a registered investment adviser under the Advisers Act. Our investment activities are managed by the Adviser, which is responsible for originating prospective investments, conducting research and due diligence investigations on potential investments, analyzing investment opportunities, negotiating and structuring our investments and monitoring our investments and portfolio companies on an ongoing basis. The Adviser has entered into a Resource Sharing Agreement (the “Resource Sharing Agreement”) with Crescent, pursuant to which Crescent provides the Adviser with experienced investment professionals (including the members of the Adviser’s investment committee) and access to Crescent’s resources so as to enable the Adviser to fulfill its obligations under the Investment Advisory Agreement. Through the Resource Sharing Agreement, the Adviser capitalizes on the deal origination, credit underwriting, due diligence, investment structuring, execution, portfolio management and monitoring experience of Crescent’s investment professionals.
About Crescent
Crescent Capital Corporation, a predecessor to the business of Crescent, was formed in 1991 by Mark Attanasio and Jean-Marc Chapus as an asset management firm specializing in below-investment grade debt securities. In 1995, Crescent Capital Corporation was acquired by The TCW Group, Inc. (“TCW”) and rebranded as TCW’s Leveraged Finance Group. On January 1, 2011, Messrs. Attanasio and Chapus, along with the entire investment team, spun out of TCW and formed Crescent, an employee-owned, registered investment adviser. With its headquarters in Los Angeles, Crescent has over 180 employees based in four offices in the U.S. and Europe. Messrs. Attanasio and Chapus head Crescent’s management committee, which oversees all of Crescent’s operations. On January 5, 2021, Sun Life Financial Inc. (together with its subsidiaries and joint ventures, “Sun Life”) acquired a majority interest in Crescent (the “Sun Life Transaction”). There were no changes to our investment objective, strategies and process or to the Crescent team responsible for the investment operations as a result of the Sun Life Transaction.
The Board of Directors
Our business and affairs are managed under the direction of our Board. Our Board consists of five members, four of whom are not “interested persons” of CCAP, the Adviser, the Administrator or their respective affiliates as defined in Section 2(a)(19) of the 1940 Act. We refer to these individuals as our “Independent Directors.” The Independent Directors compose a majority of our Board. Our Board elects our officers, who serve at the discretion of our Board. The responsibilities of our Board include quarterly determinations of the fair value of our assets, corporate governance activities, oversight of our financing arrangements and oversight of our investment activities.
Investment Strategy
We follow Crescent’s approach to investing, which is based upon fundamental credit research and risk analysis. This approach reflects Crescent’s view that the cornerstone of successful investing is fundamental credit analysis.
Specifically, we pursue an investment strategy targeting companies primarily in the middle-market. We believe that the middle-market is attractive as a result of the lack of available lending sources to smaller companies. We believe many financing providers have chosen to focus on large corporate clients and managing capital markets transactions rather than lending to middle-market businesses. Further, many financial institutions and traditional lenders are faced with constrained balance sheets. We also believe hedge funds and collateralized debt obligation/collateralized loan obligation managers are less likely to pursue investment opportunities in our target market as a result of reduced liquidity for new investments. Specifically, Crescent’s sourcing platform should enable it, on our behalf and through our Adviser, to identify and invest in creditworthy borrowers. In addition, to take advantage of investment opportunities in middle-market companies that are identified for us by Crescent, we may invest alongside other pools of capital, including bank debt, high-yield and mezzanine funds managed by Crescent. See “Item 13. Certain Relationships and Related Transactions, and Director Independence” for a discussion of certain conflicts of interest of Crescent and certain limitations on our ability to co-invest with other accounts advised by Crescent.
5
We target investments in companies that exhibit one or more of the following characteristics:
| • | businesses with strong franchises and sustainable competitive advantages; |
| • | businesses operating in industries with barriers to entry; |
| • | businesses in industries with positive long-term dynamics; |
| • | businesses with cash flows that are dependable and predictable; |
| • | businesses with management teams with demonstrated track records and economic incentives; or |
| • | businesses controlled by private equity investors that require capital for growth, acquisitions, and leveraged buyouts. |
We seek to create a diversified portfolio of investments across various industries as a method to manage risk and capitalize on specific sector trends, although our investments may be concentrated in a small number of industries.
Investment Focus
Generally, we focus on investing in secured debt (including senior secured, unitranche and second lien debt) and unsecured debt (including senior unsecured, mezzanine and subordinated debt), as well as related equity securities of private U.S. middle-market companies. By “middle-market companies,” we mean companies that have annual EBITDA, which we believe is a useful proxy for cash flow, of $10 million to $250 million. We may on occasion invest in larger or smaller companies.
“First lien” investments are senior loans on a lien basis to other liabilities in the issuer’s capital structure that have the benefit of a first-priority security interest in assets of the issuer. The security interest ranks above the security interest of any second-lien lenders in those assets.
“Unitranche first lien” investments are loans that may extend deeper in a company’s capital structure than traditional first lien debt and may provide for a waterfall of cash flow priority among different lenders in the unitranche loan. In certain instances, the Company may find another lender to provide the “first out” portion of such loan and retain the “last out” portion of such loan, in which case, the “first out” portion of the loan would generally receive priority with respect to payment of principal, interest and any other amounts due thereunder over the “last out” portion that the Company would continue to hold. In exchange for the greater risk of loss, the “last out” portion earns a higher interest rate.
“Second lien” investments are loans with a second priority lien on all existing and future assets of the portfolio company. The security interest ranks below the security interests of any first lien and unitranche first lien lenders in those assets.
“Mezzanine” or “unsecured debt” investments are loans that generally rank senior to a borrower’s equity securities and junior in right of payment to such borrower’s other senior indebtedness.
We generally invest in securities that are rated below investment grade (e.g., junk bonds) by rating agencies or that would be rated below investment grade if they were rated. See “Item 1A. Risk Factors—Risks Relating to Our Investments— We may invest in high yield debt, or junk bonds, which has greater credit and liquidity risk than more highly rated debt obligations.” Our investments may include non-cash income features, including PIK interest and OID. See “Item 1A. Risk Factors—Risks Relating to Our Investments— Our investments in OID and PIK interest income may expose us to risks associated with such income being required to be included in accounting income and taxable income prior to receipt of cash.”
Our business model is focused on the direct origination of loans to middle-market companies. The companies in which we invest use our capital to support organic growth, acquisitions, market or product expansion and recapitalizations. We expect to generate revenues primarily in the form of interest income from debt investments, dividend income from direct equity investments, capital gains on the sales of debt and equity securities and various loan origination and other fees.
We may purchase interests in loans or make debt investments, either (i) directly from our target companies as primary market or private credit investments (i.e., private credit transactions), or (ii) primary or secondary market bank loan or high yield transactions in the broadly syndicated “over-the-counter” market (i.e., broadly syndicated loans and bonds). Although our focus is to invest in less liquid private credit transactions, we may from time to time invest in more liquid broadly syndicated loans and bonds to complement our private credit transactions. In addition, and because we often receive more attractive financing terms on broadly syndicated loans and bonds than we do on our less liquid assets, we are able to leverage the broadly syndicated portfolio in such a way that can maximize the levered return potential of our portfolio.
Investment Decision Process
Through Crescent’s resources, the Adviser has access to origination capabilities and research resources, experienced investment professionals, internal information systems and a credit analysis framework and investment process. Over the years, Crescent has designed its investment process to seek investments which it believes have the most attractive risk/reward characteristics. The process involves multiple levels of review and is coordinated in an effort to identify risks in potential investments. Our Adviser applies
6
Crescent’s expertise to screen our investment opportunities as described below. Depending on the type of investment and the borrower, the Adviser may apply all or some of these levels of review, in its discretion. Based upon a favorable outcome of the diligence process described below, our Adviser’s investment committee will make a final decision on such investment and such investment will only be funded after approval by the Adviser’s investment committee.
Private Credit Originations: New private credit investment opportunities are initially reviewed by a Crescent senior investment professional to determine whether additional consideration is warranted. Factors influencing this decision include fundamental business considerations, including borrower industry, borrower financial leverage and cash flows and quality of management as well as private equity sponsor involvement (if any). In the event of an initial positive review, potential investments are further reviewed with senior and junior investment professionals. If the team agrees on the fundamental attractiveness of the investment, the review phase proceeds with preliminary due diligence and financial analyses. At this point, Crescent utilizes its credit analysis methodology to outline credit and operating statistics and identify key business characteristics and risks through available diligence materials in addition to dialogue with company management and the proposed private equity sponsor (if any). Following this analysis, Crescent considers an initial structure and pricing proposal for the investment and preliminarily informs the broader investment team of such proposal.
After satisfactory preliminary analysis and review, further due diligence continues, including completion of credit analysis, on-site due diligence (if deemed necessary), visits and meetings with management, and could include consultation with third-party experts. The credit analysis is a detailed, bottom-up analysis on the proposed portfolio company that generally includes an assessment of its industry, market, competition, products, services, management and the equity sponsor or owner. Detailed financial analysis is also performed at this stage with a focus on historical financial results. Projected financial information developed by the proposed portfolio company is analyzed and sensitized based upon the portfolio company’s historical results and assessment of the portfolio company’s future prospects. The sensitivity analysis highlights the variability of revenues and earnings, “worst case” debt service coverage and available sources of liquidity. As part of the overall evaluation, comparisons are made to similar companies to help assess a portfolio company’s asset and enterprise value coverage of debt, interest servicing capacity and competitive strength within its industry and market. Additionally during this stage, Crescent typically works with the management of the proposed portfolio company and its other capital providers to develop the structure of an investment, including negotiating among these parties on how the investment is expected to perform relative to the other forms of capital in its capital structure.
Syndicated Investments: For syndicated investments, Crescent seeks to pursue an investment process based upon evaluation of the credit fundamentals of issuers. The foundation of this process is the “bottom-up” credit research process that Crescent employs across multiple strategies. In selecting investments, Crescent’s investment professionals perform comprehensive analysis of credit worthiness, including an assessment of the business, an evaluation of management, an analysis of business strategy and industry trends, an examination of financial results and projections and a review of the security’s proposed terms. Credit research is a critical component of the investment process. In selecting investments, Crescent’s respective portfolio management teams analyze opportunities with an emphasis on principal preservation (i.e., an issuer’s ability to service its debt and maintain cash flow).
Investment Funding
Upon completion of the investment decision process described above, the investment team working on an investment delivers a memorandum to the Adviser’s investment committee. Once an investment has been approved by the investment committee, the Adviser moves through a series of steps with the respective investment team towards negotiation of final documentation.
Investment Monitoring
The Adviser monitors our portfolio companies on an ongoing basis by monitoring the financial trends of each portfolio company to determine if it is meeting its business plans and to assess the appropriate course of action for each company. We consider board observation rights, where appropriate, regular dialogue with company management and equity sponsors and detailed internally generated monitoring reports to be critical to our performance. As part of the monitoring process, the Adviser regularly assesses the risk profile of each of our investments and, on a quarterly basis, grades each investment on a risk scale of 1 to 5. Risk assessment is not standardized in our industry and our risk assessment may not be comparable to ones used by our competitors. Our assessment is based on the following categories:
| 1 | Involves the least amount of risk in our portfolio. The investment/borrower is performing above expectations since investment, and the trends and risk factors are generally favorable, which may include the financial performance of the borrower or a potential exit. |
| 2 | Involves an acceptable level of risk that is similar to the risk at the time of investment. The investment/borrower is generally performing as expected, and the risk factors are neutral to favorable. |
| 3 | Involves an investment/borrower performing below expectations and indicates that the investment’s risk has increased somewhat since investment. The borrower’s loan payments are generally not past due and more likely than not the borrower will remain in compliance with debt covenants. An investment rating of 3 requires closer monitoring. |
| 4 | Involves an investment/borrower performing materially below expectations and indicates that the loan’s risk has increased materially since investment. In addition to the borrower being generally out of compliance with debt covenants, loan payments may be past due (but generally not more than 180 days past due). Placing loans on non-accrual status should be considered for investments rated 4. |
7
| 5 | Involves an investment/borrower performing substantially below expectations and indicates that the loan’s risk has substantially increased since investment. Most or all of the debt covenants are out of compliance and payments are substantially delinquent. Loans rated 5 are not anticipated to be repaid in full and the fair market value of the loan are generally reduced to the anticipated recovery amount. Loans with an investment rating of 5 are generally placed on non-accrual status. |
Investment Advisory Agreement
On June 2, 2015, we entered into an investment advisory agreement with the Adviser (the “Investment Advisory Agreement”), which was subsequently replaced by the Amended and Restated Investment Advisory Agreement (together with the Investment Advisory Agreement, the “Advisory Agreements”), which was approved by our stockholders on January 29, 2020 in connection with the Alcentra Acquisition resulting in the change of certain terms. Subsequently on December 17, 2020 in connection with the Sun Life Transaction, the Amended and Restated Investment Advisory Agreement was re-approved by our stockholders resulting in no substantive changes to the terms. Under the terms of the Amended and Restated Investment Advisory Agreement, the Adviser provides investment advisory services to us and our portfolio investments. The Adviser’s services under the Amended and Restated Investment Advisory Agreement are not exclusive, and the Adviser is free to furnish similar or other services to others so long as its services to us are not impaired. Under the terms of the Advisory Agreements, the Adviser is entitled to receive a base management fee and may also receive incentive fees, as discussed below.
Base Management Fee (prior to February 1, 2020)
Prior to February 1, 2020, pursuant to the Investment Advisory Agreement, the base management fee was calculated and payable quarterly in arrears at an annual rate of 1.50% of our gross assets, including assets acquired through the incurrence of debt but excluding any cash and cash equivalents. The base management fee was calculated based on the average value of gross assets at the end of the two most recently completed calendar quarters, and appropriately adjusted for share issuances or repurchases during the current calendar quarter.
Under the Investment Advisory Agreement, the Adviser agreed to waive its right to receive management fees in excess of the sum of (i) 0.25% of the aggregate committed but undrawn capital and (ii) 0.75% of the aggregate gross assets excluding cash and cash equivalents (including capital drawn to pay our expenses) during the period prior to February 3, 2020, the date of the our qualified initial public offering, as defined by the Investment Advisory Agreement (“Qualified IPO”). The listing of our Common Stock on NASDAQ on February 3, 2020 qualified as a Qualified IPO. The Adviser is not permitted to recoup any waived amounts at any time.
New Base Management Fee (effective February 1, 2020)
Effective February 1, 2020, pursuant to the Amended and Restated Investment Advisory Agreement, the base management fee is calculated and payable quarterly in arrears at an annual rate of 1.25% of our gross assets, including assets acquired through the incurrence of debt but excluding any cash and cash equivalents. The base management fee is calculated based on the average value of gross assets at the end of the two most recently completed calendar quarters, and appropriately adjusted for any share issuances or repurchases during the current calendar quarter.
In addition, under the terms of the Amended and Restated Advisory Agreement, the Adviser agreed to waive a portion of the management fee from February 1, 2020 through July 31, 2021 after the closing of the Alcentra Acquisition so that only 0.75% shall be charged for such time period. The Adviser is not permitted to recoup any waived amounts at any time. The Adviser has voluntarily waived its right to receive management fees on our investment in GACP II LP for any period in which GACP II LP remains in the investment portfolio.
Incentive Fee (prior to February 1, 2020)
Under the Investment Advisory Agreement, the Incentive Fee consisted of two parts. The first part, the income incentive fee, was calculated and payable quarterly in arrears and equaled (a) 100% of the excess of the pre-incentive fee net investment income for the immediately preceding calendar quarter, over a preferred return of 1.5% per quarter (6.0% annualized) (the “Hurdle”), and a catch-up feature until the Adviser received 15% of the pre-incentive fee net investment income for the current quarter up to 1.7647% (the “Catch-up”), and (b) 15% of all remaining pre-incentive fee net investment income above the “Catch-up.”
The second part, the capital gains incentive fee, was determined and payable in arrears as of the end of each fiscal year at a rate of 15.0% of our realized capital gains, if any, on a cumulative basis from Inception through the end of the fiscal year, computed net of all realized capital losses and unrealized capital depreciation on a cumulative basis, less the aggregate amount of any previously paid capital gain incentive fees.
8
At the 2018 Annual Meeting of Stockholders, in connection with the extension of the deadline to consummate a Qualified IPO, the Adviser agreed to waive its rights under the Investment Advisory Agreement to (i) the income incentive fee and (ii) the capital gain incentive fee for the period from April 1, 2018 through February 1, 2020.
Incentive Fee (effective February 1, 2020)
Under the Amended and Restated Investment Advisory Agreement, the Incentive Fee consists of two parts. The first part, the income incentive fee, is calculated and payable quarterly in arrears and (a) equals 100% of the excess of the pre-incentive fee net investment income for the immediately preceding calendar quarter, over a preferred return of 1.75% per quarter (7.0% annualized) (the “Hurdle”), and a catch-up feature until the Adviser has received 17.5%, of the pre-incentive fee net investment income for the current quarter up to 2.1212% (the “Catch-up”), and (b) 17.5% of all remaining pre-incentive fee net investment income above the “Catch-up.”
In addition, under the terms of the Amended and Restated Investment Advisory Agreement, the Adviser agreed to waive the income based portion of the incentive fee from February 1, 2020 through July 31, 2021. Once the Adviser begins to earn income incentive fees, the Adviser will voluntarily waive the income incentive fees attributable to the investment income accrued by us as a result of our investment in GACP II.
The second part, the capital gains incentive fee, is determined and payable in arrears as of the end of each fiscal year at a rate of 17.5% of our realized capital gains, if any, on a cumulative basis from Inception through the end of the fiscal year, computed net of all realized capital losses and unrealized capital depreciation on a cumulative basis, less the aggregate amount of any previously paid capital gain incentive fees.
Since the Qualified IPO occurred on a date other than the first day of a calendar quarter, the income incentive fee shall be calculated for such calendar quarter at a weighted rate calculated based on the fee rates applicable before and after a Qualified IPO based on the number of days in such calendar quarter before and after the Qualified IPO. For the avoidance of doubt, such capital gains incentive fee shall be equal to 15.0% of our realized capital gains on a cumulative basis from Inception through the day before the Qualified IPO, computed net of all realized capital losses and unrealized capital depreciation on a cumulative basis, less the aggregate amount of any previously paid capital gains incentive fees. Following the Qualified IPO, solely for the purposes of calculating the capital gains incentive fee, we will be deemed to have previously paid capital gains incentive fees prior to a Qualified IPO equal to the product obtained by multiplying (a) the actual aggregate amount of previously paid capital gains incentive fees for all periods prior to the Qualified IPO by (b) the percentage obtained by dividing (x) 17.5% by (y) 15.0%. In the event that the Amended and Restated Investment Advisory Agreement shall terminate as of a date that is not a fiscal year end, the termination date shall be treated as though it were a fiscal year end for purposes of calculating and paying a capital gains incentive fee.
Pre-incentive fee net investment income means interest income, dividend income and any other income (including any other fees (other than fees for providing managerial assistance), such as commitment, origination, structuring, diligence and consulting fees or other fees that we receive from portfolio companies) accrued during each calendar quarter, minus operating expenses for such quarter (including the base management fee, expenses payable under the Administration Agreement and any interest expense and distributions paid on any issued and outstanding debt or preferred stock, but excluding the incentive fee). Pre-incentive fee net investment income includes, in the case of investments with a deferred interest feature (such as market discount, original issue discount, debt instruments with PIK interest, preferred stock with PIK dividends and zero coupon securities), accrued income that the we have not yet received in cash. Pre-incentive fee net investment income does not include any realized capital gains, realized capital losses or unrealized capital appreciation or depreciation. Pre-incentive fee net investment income will be compared to a “Hurdle Amount” equal to the product of (i) the Hurdle rate of 1.50% or 1.75% per quarter, 6.00% or 7.00% annualized, prior to and effective February 1, 2020, respectively, and (ii) our net assets (defined as total assets less indebtedness, before taking into account any incentive fees payable during the period), at the end of the immediately preceding calendar quarter, subject to a “catch-up” provision incurred at the end of each calendar quarter.
See “Item 1A. Risk Factors—Risks Relating to Our Business and Structure—Our management and incentive fee structure may create incentives for the Adviser that are not fully aligned with the interests of our stockholders and may induce the Adviser to make speculative investments.”
GAAP Incentive Fee on Cumulative Unrealized Capital Appreciation
We accrue, but do not pay, a portion of the Incentive Fee based on capital gains with respect to net unrealized appreciation. Under GAAP, we are required to accrue an Incentive Fee based on capital gains that includes net realized capital gains and losses and net unrealized capital appreciation and depreciation on investments held at the end of each period. In calculating the accrual for the Incentive Fee based on capital gains, we consider the cumulative aggregate unrealized capital appreciation in the calculation, since an Incentive Fee based on capital gains would be payable if such unrealized capital appreciation were realized, even though such unrealized capital appreciation is not permitted to be considered in calculating the fee payable under the Amended and Restated Investment Advisory Agreement. This accrual is calculated using the aggregate cumulative realized capital gains and losses and aggregate cumulative unrealized capital appreciation or depreciation. If such amount is positive at the end of a period, then we record a capital gains incentive fee equal to 15% (pre February 3, 2020) or 17.5% (effective February 3, 2020) of such amount, minus the aggregate amount of actual Incentive Fees based on capital gains paid in all prior periods. If such amount is negative, then there is no accrual for such period. There can be no assurance that such unrealized capital appreciation will be realized in the future.
9
Our Board monitors the mix and performance of our investments over time and will seek to satisfy itself that the Adviser is acting in our interests and that our fee structure appropriately incentivizes the Adviser to do so.
Term
The Investment Advisory Agreement has been unanimously approved by the Board. Unless terminated earlier as described below, the Investment Advisory Agreement will remain in effect until January 5, 2023 and will remain in effect from year to year thereafter if approved annually by (i) the vote of the Board, or by the vote of a majority of our outstanding voting securities, and (ii) the vote of a majority of our independent directors. The Investment Advisory Agreement will automatically terminate in the event of its assignment (as defined in the 1940 Act). The Investment Advisory Agreement may be terminated by either party without penalty upon not less than 60 days’ written notice to the other. See “Item 1A. Risk Factors—Risks Relating to our Business and Structure—We are dependent upon key personnel of Crescent and the Adviser.”
Indemnification
Under the Investment Advisory Agreement, the Adviser has not assumed any responsibility to us other than to render the services called for under that agreement. The Adviser will not be responsible for any action of the Board in following or declining to follow the Adviser’s advice or recommendations. Under the Investment Advisory Agreement, the Adviser, its officers, managers, partners, agents, employees, controlling persons, members and any other person or entity affiliated with the Adviser, including, without limitation, the Administrator, and any person controlling or controlled by the Adviser will not be liable to us, any of our subsidiaries, our directors, our stockholders or any subsidiary’s stockholders or partners for acts or omissions performed in accordance with and pursuant to the Investment Advisory Agreement, except those resulting from acts constituting gross negligence, willful misfeasance, bad faith or reckless disregard of the duties that the Adviser owes to us under the Investment Advisory Agreement. In addition, as part of the Investment Advisory Agreement, we have agreed to indemnify the Adviser and each of its officers, managers, partners, agents, employees, controlling persons, members and any other person or entity affiliated with the Adviser, from and against any claims or liabilities, including reasonable legal fees and other expenses reasonably incurred, arising out of or in connection with our business and operations or any action taken or omitted on our behalf pursuant to authority granted by the Investment Advisory Agreement, except where attributable to gross negligence, willful misfeasance, bad faith or reckless disregard of such person’s duties under the Investment Advisory Agreement. These protections may lead the Adviser to act in a riskier manner when acting on our behalf than it would when acting for its own account. The Investment Advisory Agreement may be terminated by either party without penalty on 60 days’ written notice to the other party.
United States federal and state securities laws may impose liability under certain circumstances on persons who act in good faith. Nothing in the Investment Advisory Agreement constitutes a waiver or limitation of any rights that we may have under any applicable federal or state securities laws.
Administration Agreement
On June 2, 2015, we entered into the Administration Agreement with the Administrator, as amended and restated on February 1, 2020. Under the terms of the Administration Agreement, the Administrator provides administrative services. These services include providing office space, equipment and office services, maintaining financial records, preparing reports to stockholders and reports filed with the SEC, and managing the payment of expenses and the performance of administrative and professional services rendered by others. Certain of these services are reimbursable to the Administrator under the terms of the Administration Agreement. In addition, the Administrator is permitted to delegate its duties under the Administration Agreement to affiliates or third parties. To the extent the Administrator outsources any of its functions, we will pay the fees associated with such functions on a direct basis, without incremental profit to the Administrator. The Administration Agreement may be terminated by either party without penalty on 60 days’ written notice to the other party.
No person who is an officer, director or employee of the Administrator or its affiliates and who serves as a director receives any compensation for his or her services as a director. However, we reimburse the Administrator (or its affiliates) for an allocable portion of the compensation paid by the Administrator or its affiliates to our compliance professionals, legal counsel, and other professionals who spend time on such related activities (based on the percentage of time those individuals devote, on an estimated basis, to our business and affairs). The allocable portion of the compensation for these officers and other professionals are included in the administration expenses paid to the Administrator. Directors who are not affiliated with the Administrator or its affiliates receive compensation for their services and reimbursement of expenses incurred to attend meetings.
On June 5, 2015, we entered into sub-administration agreement with State Street Bank and Trust Company (“SST”) to perform certain administrative, custodian and other services. The sub-administration agreement with SST had an initial term of three years ending June 5, 2018 and shall automatically renew for 1-year terms unless a written notice of non-renewal is delivered by us or SST. We do not reimburse the Administrator for any services for which we pay a separate sub-administrator and custodian fee to SST.
10
The Administration Agreement has been approved by our Board. Unless earlier terminated as described below, the Administration Agreement will remain in effect for a period of two years from their effective date and will remain in effect from year to year thereafter if approved annually by (i) the vote of our Board, or by the vote of a majority of our outstanding voting securities, and (ii) the vote of a majority of our independent directors. The Administration Agreement will automatically terminate in the event of assignment. The Administration Agreement may be terminated by either party without penalty upon not less than 60 days’ written notice to the other. See “Item 1A. Risk Factors—Risks Relating to Our Business and Structure—Dependence Upon Key Personnel of Crescent.”
License Agreement
We have entered into a license agreement with Crescent under which Crescent granted us a non-exclusive, royalty-free license to use the name “Crescent Capital”.
Competition
Our primary competitors in providing financing to middle-market companies include public and private funds, other business development companies, commercial and investment banks, commercial financing companies and, to the extent they provide an alternative form of financing, private equity and hedge funds. Many of our competitors are substantially larger and have considerably greater financial, technical and marketing resources than we do. For example, we believe some competitors may have access to funding sources that are not available to us. In addition, some of our competitors may have higher risk tolerances or different risk assessments, which could allow them to consider a wider variety of investments and establish more relationships than us. Furthermore, many of our competitors are not subject to the regulatory restrictions that the 1940 Act imposes on us as a BDC or to the distribution and other requirements we must satisfy to maintain our qualification as a RIC.
We expect to use the expertise of Crescent’s investment professionals to which we will have access to assess investment risks and determine appropriate pricing for our investments in portfolio companies. In addition, we expect that the relationships of Crescent’s senior members will enable us to learn about, and compete effectively for, financing opportunities with attractive middle-market companies in the industries in which we seek to invest. For additional information concerning the competitive risks we face, see “Item 1A. Risk Factors—Risks Relating to our Business and Structure — We operate in an increasingly competitive market for investment opportunities, which could make it difficult for us to identify and make investments that are consistent with our investment objectives.”
Fees and Expenses
Our primary operating expenses include the payment of management fees and incentive fees to the Adviser under the Investment Advisory Agreement, as amended, our allocable portion of overhead expenses under the Administration Agreement, operating costs associated with our sub-administration agreement with State Street Bank and Trust Company and other operating costs described below. The management and incentive fees compensate the Adviser for its work in identifying, evaluating, negotiating, closing and monitoring our investments. We bear all other out-of-pocket costs and expenses of our operations and transactions, including:
| • | the cost of calculating our net asset value, including the cost of any third-party valuation services; |
| • | fidelity bond, directors’ and officers’ liability insurance and other insurance premiums; |
| • | fees and expenses associated with independent audits and outside legal costs; |
| • | independent directors’ fees and expenses; |
| • | administration fees and expenses, if any, payable under the Administration Agreement (including payments based upon our allocable portion of the Administrator’s overhead in performing its obligations under the Administration Agreement, rent and the allocable portion of the cost of certain professional services provided to us, including but not limited to, our compliance professionals, our legal counsel and other professionals); |
| • | U.S. federal, state and local taxes; |
| • | the cost of effecting sales and repurchases of shares of our common stock and other securities; |
| • | fees payable to third parties relating to making investments, including out-of-pocket fees and expenses associated with performing due diligence and reviews of prospective investments; |
| • | out-of-pocket fees and expenses associated with marketing efforts; |
| • | federal and state registration fees and any stock exchange listing fees; |
| • | brokerage commissions; |
| • | costs associated with our reporting and compliance obligations under the 1940 Act and other applicable U.S. federal and state securities laws; |
| • | debt service and other costs of borrowings or other financing arrangements; and |
| • | all other expenses reasonably incurred by us in connection with making investments and administering our business. |
11
We agreed to repay the Adviser for initial organization costs and equity offering costs incurred prior to the commencement of our operations up to a maximum of $1.5 million on a pro rata basis over the first $350.0 million of invested capital not to exceed 3 years from the initial capital commitment on June 26, 2015. The initial 3 year term was later extended to June 30, 2019, with shareholder approval. To the extent such costs related to equity offerings, these costs were charged as a reduction of capital upon the issuance of common shares. To the extent such costs related to organization costs, these costs were expensed in the Consolidated Statements of Operations upon the issuance of common shares. The Adviser was responsible for organization and private equity offerings costs in excess of $1.5 million.
Capital Resources and Borrowings
We anticipate cash to be generated from future offerings of securities, and cash flows from operations, including interest earned from the temporary investment of cash in cash equivalents, U.S. government securities and other high-quality debt investments that mature in one year or less. Additionally, we are permitted, under specified conditions, to issue multiple classes of indebtedness and one class of stock senior to our common stock if our asset coverage, as defined in the 1940 Act, is at least equal to 150% immediately after each such issuance. Furthermore, while any indebtedness and senior securities remain outstanding, we must make provisions to prohibit any distribution to our stockholders or the repurchase of such securities or shares unless we meet the applicable asset coverage ratios at the time of the distribution or repurchase. In connection with borrowings, our lenders may require us to pledge assets, investor commitments to fund capital calls and/or the proceeds of those capital calls. In addition, the lenders may ask us to comply with positive or negative covenants that could have an effect on our operations.
For more information on our debt, see “ITEM 7. MANAGEMENT’S DISCUSSION AND ANALYSIS OF FINANCIAL CONDITION AND RESULTS OF OPERATIONS—Financial Condition, Liquidity and Capital Resources.”
Dividend Reinvestment Plan (“DRIP”)
We adopted a dividend reinvestment plan that provides for reinvestment of our dividends and other distributions on behalf of our stockholders, unless a stockholder elects to receive cash. As a result, if our Board authorizes, and we declare, a cash dividend or other distribution, then stockholders who are participating in the dividend reinvestment plan will have their cash dividends and distributions automatically reinvested in additional shares of Common Stock, rather than receiving cash dividends and distributions.
Resource Sharing Agreement
We do not currently have any employees. We depend on the diligence, skill and network of business contacts of the investment professionals of the Adviser to achieve our investment objective. The Adviser is an affiliate of Crescent and depends upon access to the investment professionals and other resources of Crescent and its affiliates to fulfill its obligations to us under the Investment Advisory Agreement. The Adviser also depends upon Crescent to obtain access to deal flow generated by Crescent’s investment professionals and its affiliates. Each of our officers will also be an employee of the Adviser, Crescent or its affiliates.
Pursuant to its Resource Sharing Agreement with Crescent, the Adviser will have access to the individuals who comprise our Adviser’s investment committee, and a team of additional experienced investment professionals who, collectively, comprise the Adviser’s investment team. The Adviser may hire additional investment professionals to provide services to us, based upon its needs.
Regulation as a Business Development Company
We are regulated as a BDC under the 1940 Act. A BDC must be organized in the United States for the purpose of investing in or lending primarily to private companies and making significant managerial assistance available to them. A BDC may use capital provided by public stockholders and from other sources to make long-term, private investments in businesses. A publicly-traded BDC provides stockholders the ability to retain the liquidity of a publicly-traded stock while sharing in the possible benefits, if any, of investing in primarily privately owned companies. Prior to February 3, 2020, which is the date of our listing on NASDAQ in connection with the Alcentra Acquisition, our stock was privately held.
We may not change the nature of our business so as to cease to be, or withdraw our election as, a BDC unless authorized by vote of a majority of the outstanding voting securities, as required by the 1940 Act. A majority of the outstanding voting securities of a company is defined under the 1940 Act as the lesser of: (a) 67% or more of such company’s voting securities present at a meeting if more than 50% of the outstanding voting securities of such company are present or represented by proxy, or (b) more than 50% of the outstanding voting securities of such company. We do not anticipate any substantial change in the nature of our business.
As with other companies regulated by the 1940 Act, a BDC must adhere to certain substantive regulatory requirements. A majority of our directors must be persons who are not interested persons, as that term is defined in the 1940 Act. Additionally, we are required to provide and maintain a bond issued by a reputable fidelity insurance company to protect the BDC. Furthermore, as a BDC, we will be
12
prohibited from protecting any director or officer against any liability to us or our stockholders arising from willful misfeasance, bad faith, gross negligence or reckless disregard of the duties involved in the conduct of such person’s office. We may also be prohibited under the 1940 Act from knowingly participating in certain transactions with our affiliates without the prior approval of our directors who are not interested persons and, in some cases, prior approval by the SEC through an exemptive relief order (other than in certain limited situations pursuant to current regulatory guidance).
Also, while we may borrow funds to make investments, our ability to use debt is limited in certain significant aspects. In particular, under the provisions of the 1940 Act, BDCs are generally able to issue senior securities such that their asset coverage, as defined in the 1940 Act, equals at least 200% of gross assets less all liabilities and indebtedness not represented by senior securities, after each issuance of senior securities. In March 2018, the Small Business Credit Availability Act added Section 61(a)(2) to the 1940 Act, a successor provision to Section 61(a)(1) referenced therein, which reduces the asset coverage requirement applicable to BDCs from 200% to 150% so long as the BDC meets certain disclosure requirements and obtains certain approvals. On March 3, 2020, our Board of Directors approved, and on May 4, 2020, at an annual meeting of our stockholders, our stockholders approved, the application to us of the reduced asset coverage requirements in Section 61(a) of the 1940 Act. The application of the reduced asset coverage requirement, which became effective on May 4, 2020, permits us, provided certain requirements are satisfied, to double the maximum amount of leverage that it is permitted to incur by reducing the asset coverage requirement applicable to us from 200% to 150% (i.e., we are permitted to borrow up to two dollars for every dollar we have in assets less all liabilities and indebtedness not represented by senior securities issued by us) in order to incur debt or issue preferred stock (which we refer to collectively as “senior securities”).
We do not intend to acquire securities issued by any investment company that exceed the limits imposed by the 1940 Act. Under these limits, except for registered money market funds, we generally cannot acquire more than 3% of the voting stock of any investment company, invest more than 5% of the value of our total assets in the securities of one investment company or invest more than 10% of the value of our total assets in the securities of investment companies in the aggregate. The portion of our portfolio invested in securities issued by investment companies ordinarily will subject our stockholders to additional expenses. Our investment portfolio is also subject to diversification requirements by virtue of our intention to be a RIC for U.S. tax purposes.
We are subject to periodic examinations by the SEC for compliance with the 1940 Act.
As a BDC, we are subject to certain risks and uncertainties. See “Item 1A. Risk Factors.”
Qualifying Assets
We may invest up to 30% of our portfolio opportunistically in “non-qualifying assets”. However, under the 1940 Act, a BDC may not acquire any asset other than assets of the type listed in Section 55(a) of the 1940 Act, which are referred to as “qualifying assets,” unless, at the time the acquisition is made, qualifying assets represent at least 70% of the BDC’s total assets. The principal categories of qualifying assets relevant to our business are the following:
| 1. | Securities purchased in transactions not involving any public offering from the issuer of such securities, which issuer (subject to certain limited exceptions) is an eligible portfolio company, or from any person who is, or has been during the preceding 13 months, an affiliated person of an eligible portfolio company, or from any other person, subject to such rules as may be prescribed by the SEC. The principal categories of qualifying assets relevant to our business are the following: |
| a) | Issuer is organized under the laws of, and has its principal place of business in, the United States; |
| b) | Issuer is not an investment company (other than a small business investment company wholly owned by the BDC) or a company that would be an investment company but for certain exclusions under the 1940 Act; and |
| c) | Issuer satisfies any of the following: |
| i. | does not have any class of securities that is traded on a national securities exchange; |
| ii. | has a class of securities listed on a national securities exchange, but has an aggregate market value of outstanding voting and non-voting common equity of less than $250 million; |
| iii. | is controlled by a BDC or a group of companies including a BDC and the BDC has an affiliated person who is a director of the eligible portfolio company; or |
| iv. | is a small and solvent company having total assets of not more than $4.0 million and capital and surplus of not less than $2.0 million. |
| 2. | Securities of any eligible portfolio company which we control. |
| 3. | Securities purchased in a private transaction from a U.S. issuer that is not an investment company or from an affiliated person of the issuer, or in transactions incident thereto, if the issuer is in bankruptcy and subject to reorganization or if the issuer, immediately prior to the purchase of its securities, was unable to meet its obligations as they came due without material assistance other than conventional lending or financing arrangements. |
13
| 4. | Securities of an eligible portfolio company purchased from any person in a private transaction if there is no ready market for such securities and we already own 60% of the outstanding equity of the eligible portfolio company. |
| 5. | Securities received in exchange for or distributed on or with respect to securities described in (1) through (4) above, or pursuant to the exercise of warrants or rights relating to such securities. |
| 6. | Cash, cash equivalents, U.S. government securities or high-quality debt securities maturing in one year or less from the time of investment. |
Managerial Assistance to Portfolio Companies
A BDC must be operated for the purpose of making investments in the types of securities described under “Qualifying Assets” above. However, in order to count portfolio securities as qualifying assets for the purpose of the 70% test, the BDC must either control the issuer of the securities or must offer to make available to the issuer of the securities (other than small and solvent companies described above) significant managerial assistance; except that, where the BDC purchases such securities in conjunction with one or more other persons acting together, one of the other persons in the group may make available such managerial assistance. Making available managerial assistance means, among other things, any arrangement whereby the BDC, through its directors or officers, offers to provide, and, if accepted, does so provide, significant guidance and counsel concerning the management, operations or business objectives and policies of a portfolio company.
Monitoring Investments
In most cases, we will not have board influence over portfolio companies. In some instances, the Adviser’s investment professionals may obtain board representation or observation rights in conjunction with our investments. In conjunction with our Adviser’s investment committee and our Board, the Adviser will take an active approach in monitoring all investments, which includes reviews of financial performance on at least a quarterly basis and may include discussions with management and/or the equity sponsor. The monitoring process will begin with structuring terms and conditions which require the timely delivery and access to critical financial and business information regarding portfolio companies.
Temporary Investments
Pending investment in other types of “qualifying assets,” as described above, our investments may consist of cash, cash equivalents, U.S. government securities or high-quality debt securities maturing in one year or less from the time of investment, which we refer to, collectively, as “temporary investments,” so that 70% of our assets are qualifying assets. See “Item I. Certain U.S. Federal Income Tax Consequences—Election to be Taxed as a RIC.” Typically, we will invest in U.S. Treasury bills or in repurchase agreements, provided that such agreements are fully collateralized by cash or securities issued by the U.S. government or its agencies. A repurchase agreement involves the purchase by an investor, such as us, of a specified security and the simultaneous agreement by the seller to repurchase it at an agreed-upon future date and at a price which is greater than the purchase price by an amount that reflects an agreed-upon interest rate. There is no percentage restriction on the proportion of our assets that may be invested in such repurchase agreements. However, if more than 25% of our gross assets constitute repurchase agreements from a single counterparty, we would not meet the diversification tests in order to qualify as a RIC. Thus, we do not intend to enter into repurchase agreements with a single counterparty in excess of this limit. Our Adviser will monitor the creditworthiness of the counterparties with which we enter into repurchase agreement transactions.
Senior Securities
We are permitted, under specified conditions, to issue multiple classes of indebtedness and one class of stock senior to our common stock if our asset coverage, as defined in the 1940 Act, as amended, is at least equal to 150% immediately after each such issuance. In addition, while any senior securities remain outstanding, we must make provisions to prohibit any distribution to our stockholders or the repurchase of such securities or shares unless we meet the applicable asset coverage ratios at the time of the distribution or repurchase. We may also borrow amounts up to 5% of the value of our total assets for temporary or emergency purposes without regard to asset coverage.
The 1940 Act imposes limitations on a BDC’s issuance of preferred shares, which are considered “senior securities” and thus are subject to the 150% asset coverage requirement described above. In addition, (i) preferred shares must have the same voting rights as the common stockholders (one share, one vote); and (ii) preferred stockholders must have the right, as a class, to appoint directors to the board of directors.
14
Code of Ethics
As required by Rule 17j-1 under the 1940 Act and Rule 204A-1 under the Advisers Act, respectively, we and the Adviser have adopted codes of ethics which apply to, among others, our and our Adviser’s executive officers, including our Chief Executive Officer and Chief Financial Officer, as well as our Adviser’s officers, directors and employees. Our codes of ethics generally will not permit investments by our and the Adviser’s personnel in securities that may be purchased or sold by us.
We hereby undertake to provide a copy of the codes to any person, without charge, upon request. Requests for a copy of the codes may be made in writing addressed to our Secretary, George Hawley, Crescent Capital BDC, Inc., 11100 Santa Monica Boulevard, Suite 2000, Los Angeles, California, 90025, Attention: CCAP Investor Relations, or by emailing us at investor.relations@crescentcap.com. Our code of ethics is available without charge on our website, at http://www.crescentbdc.com.
Compliance Policies and Procedures
We and our Adviser have adopted and implemented written policies and procedures reasonably designed to detect and prevent violation of the federal securities laws and we are required to review these compliance policies and procedures annually for their adequacy and the effectiveness of their implementation and designate a Chief Compliance Officer to be responsible for administering the policies and procedures.
Sarbanes-Oxley Act of 2002 and NASDAQ Corporate Governance Regulations
The Sarbanes-Oxley Act imposes a wide variety of regulatory requirements on publicly-held companies and their insiders. Many of these requirements affect us. For example:
| • | pursuant to Rule 13a-14 of the Exchange Act, our principal executive officer and principal financial officer must certify the accuracy of the financial statements contained in our periodic reports; |
| • | pursuant to Item 307 of Regulation S-K, our periodic reports must disclose our conclusions about the effectiveness of our disclosure controls and procedures; |
| • | pursuant to Rule 13a-15 of the Exchange Act, our management must prepare an annual report regarding its assessment of our internal control over financial reporting and (once we cease to be an emerging growth company under the JOBS Act or, if later, for the year following our first annual report required to be filed with the SEC) must obtain an audit of the effectiveness of internal control over financial reporting performed by our independent registered public accounting firm; and |
| • | pursuant to Item 308 of Regulation S-K and Rule 13a-15 of the Exchange Act, our periodic reports must disclose whether there were significant changes in our internal controls over financial reporting or in other factors that could significantly affect these controls subsequent to the date of their evaluation, including any corrective actions with regard to significant deficiencies and material weaknesses. |
The Sarbanes-Oxley Act requires us to review our current policies and procedures to determine whether we comply with the Sarbanes-Oxley Act and the regulations promulgated thereunder. We will continue to monitor our compliance with all regulations that are adopted under the Sarbanes-Oxley Act and will take actions necessary to ensure that we are in compliance therewith.
In addition, NASDAQ has adopted various corporate governance requirements as part of its listing standards. We monitor our compliance with such listing standards to the extent applicable and will take actions necessary to ensure that we remain in compliance therewith.
Proxy Voting Policies and Procedures
We delegate our proxy voting responsibility to our Adviser. The Proxy Voting Policies and Procedures of the Adviser are set forth below. The guidelines are reviewed periodically by the Adviser and our non-interested directors, and, accordingly, are subject to change.
An investment adviser registered under the Advisers Act has a fiduciary duty to act solely in the best interests of its clients. As part of this duty, the Adviser recognizes that it must vote portfolio securities in a timely manner free of conflicts of interest and in the best interests of its clients.
These policies and procedures for voting proxies are intended to comply with Section 206 of, and Rule 206(4)-6 under, the Advisers Act.
15
The Adviser votes all proxies based upon the guiding principle of seeking to maximize the ultimate long-term economic value of our stockholders’ holdings, and ultimately all votes are cast on a case-by-case basis, taking into consideration the contractual obligations under the relevant advisory agreements or comparable documents, and all other relevant facts and circumstances at the time of the vote. The Adviser reviews on a case-by-case basis each proposal submitted to a stockholder vote to determine its impact on the portfolio securities held by us. Although the Adviser generally votes against proposals that may have a negative impact on our portfolio securities, the Adviser may vote for such a proposal if there exists compelling long-term reasons to do so.
The Adviser’s proxy voting decisions are made by our Adviser’s investment committee. To ensure that the vote is not the product of a conflict of interest, the Adviser will require that: (1) anyone involved in the decision making process disclose to our Adviser’s investment committee, and disinterested directors, any potential conflict that he or she is aware of and any contact that he or she has had with any interested party regarding a proxy vote; and (2) employees involved in the decision making process or vote administration are prohibited from revealing how the Adviser intends to vote on a proposal in order to reduce any attempted influence from interested parties.
Privacy Principles
We are committed to maintaining the privacy of our stockholders and to safeguarding their non-public personal information. The following information is provided to help investors understand what personal information we collect, how we protect that information and why, in certain cases, we may share information with select other parties.
Pursuant to our privacy policy, we will not disclose any non-public personal information concerning any of our stockholders who are individuals unless the disclosure meets certain permitted exceptions under Regulation S-P. We generally will not use or disclose any stockholder information for any purpose other than as required by law.
We may collect non-public information about investors, such as name, address, account number and the types and amounts of investments, and information about transactions with us or our affiliates, such as participation in other investment programs, ownership of certain types of accounts or other account data and activity. We may disclose the information that we collect from our stockholders or former stockholders, as described above, only to our affiliates and service providers and only as allowed by applicable law or regulation. Any party that receives this information will use it only for the services required by us and as allowed by applicable law or regulation, and is not permitted to share or use this information for any other purpose. To protect the non-public personal information of individuals, we permit access only by authorized personnel who need access to that information to provide services to us and our stockholders. In order to guard our stockholders’ non-public personal information, we maintain physical, electronic and procedural safeguards that are designed to comply with applicable law. Non-public personal information that we collect about our stockholders will generally be stored on secured servers. An individual stockholder’s right to privacy extends to all forms of contact with us, including telephone, written correspondence and electronic media, such as the Internet.
Pursuant to our privacy policy, we will provide a clear and conspicuous notice to each investor that details our privacy policies and procedures at the time of the investor’s subscription.
Reporting Obligations
We furnish our stockholders with annual reports containing audited financial statements, quarterly reports, and such other periodic reports as we determine to be appropriate or as may be required by law. We are required to comply with all periodic reporting, proxy solicitation and other applicable requirements under the Exchange Act.
Stockholders and the public may also read and copy any materials we file with the SEC at the SEC’s Public Reference Room at 100 F Street, NE, Washington, DC 20549. The public may also obtain information on the operation of the Public Reference Room by calling the SEC at (202) 551-8090. The SEC also maintains a website (www.sec.gov) that contains such information.
Election to be Taxed as a RIC
We qualify and intend to continue to qualify annually, as a RIC under Subchapter M of the Code, commencing with our taxable year ending on December 31, 2015. As a RIC, we generally do not pay corporate-level U.S. federal income taxes on any income or gains that we timely distribute to our stockholders as dividends. Rather, dividends we distribute generally are taxable to our stockholders, and any net operating losses, foreign tax credits and other of our tax attributes generally do not pass through to our stockholders, subject to special rules for certain items such as net capital gains and qualified dividend income we recognize. See “ —Taxation of U.S. Stockholders” and “ —Taxation of Non-U.S. Stockholders” below.
To qualify as a RIC, we must, among other things, meet certain source-of-income and asset diversification requirements (as described below). In addition, to qualify as a RIC, we must timely distribute to our stockholders at least 90% of our investment company taxable income (determined without regard to the dividends paid deduction), which is generally our net ordinary income plus the excess of realized net short-term capital gains over realized net long-term capital losses, if any, for each taxable year (the “Annual Distribution Requirement”).
16
Taxation as a RIC
As a RIC and if we satisfy the Annual Distribution Requirement, then we will not be subject to U.S. federal income tax on the portion of our investment company taxable income and net capital gain (generally, net long-term capital gain in excess of net short-term capital loss) that we timely distribute (or are deemed to timely distribute) to our stockholders. We are subject to U.S. federal income tax at the regular corporate rates on any income or capital gain not distributed (or deemed distributed) to our stockholders.
We generally are subject to a 4% nondeductible U.S. federal excise tax on certain undistributed income unless we distribute in a timely manner an amount at least equal to the sum of (1) 98% of our net ordinary income (taking into account certain deferrals and elections) for each calendar year, (2) 98.2% of our capital gains in excess of capital losses for the one-year period ending October 31 in that calendar year and (3) any net ordinary income and capital gains in excess of capital losses recognized, but not distributed, in preceding years (the “Excise Tax Avoidance Requirement”). We will not be subject to the U.S. federal excise tax on amounts on which we are required to pay U.S. federal income tax (such as retained net capital gains). Depending upon the level of taxable income earned in a year, we may choose to carry forward taxable income for distribution in the following year and pay the applicable U.S. federal excise tax.
To maintain our status as a RIC for U.S. federal income tax purposes, we must, among other things:
| • | qualify and have in effect an election to be treated as a BDC under the 1940 Act at all times during each taxable year; |
| • | derive in each taxable year at least 90% of our gross income from dividends, interest, payments with respect to loans of certain securities, gains from the sale of stock or other securities, net income derived from an interest in a “qualified publicly traded partnership” (as defined in the Code), or other income derived with respect to our business of investing in such stock or securities (the “90% Income Test”); and |
| • | diversify our holdings so that at the end of each quarter of the taxable year: |
| i. | at least 50% of the value of our assets consists of cash, cash equivalents, U.S. government securities, securities of other RICs, and other securities if such other securities of any one issuer do not represent more than 5% of the value of our assets or more than 10% of the outstanding voting securities of the issuer; and |
| ii. | no more than 25% of the value of our assets is invested in (a) the securities, other than U.S. government securities or securities of other RICs, of one issuer or of two or more issuers that are controlled, as determined under applicable Code rules, by us and that are engaged in the same or similar or related trades or businesses or (b) the securities of one or more qualified publicly traded partnerships (the “Diversification Tests”). |
For U.S. federal income tax purposes, we will include in our taxable income certain amounts that we have not yet received in cash. For example, if we hold debt obligations that are treated under applicable U.S. federal income tax rules as having OID (such as debt instruments with PIK interest or, in certain cases, that have increasing interest rates or are issued with warrants), we must include in our taxable income in each year a portion of the OID that accrues over the life of the obligation, regardless of whether we receive cash representing such income in the same taxable year. We may also have to include in our taxable income other amounts that we have not yet received in cash, such as accruals on a contingent payment debt instrument or deferred loan origination fees that are paid after origination of the loan or are paid in non-cash compensation such as warrants or stock. Because such OID or other amounts accrued are included in our investment company taxable income for the year of accrual, we may be required to make distributions to our stockholders in order to satisfy the Annual Distribution Requirement and/or the Excise Tax Avoidance Requirement, even though we will have not received any corresponding cash payments. Accordingly, to enable us to make distributions to our stockholders that will be sufficient to enable us to satisfy the Annual Distribution Requirement, we may need to sell some of our assets at times and/or at prices that we would not consider advantageous, we may need to raise additional equity or debt capital or we may need to forego new investment opportunities or otherwise take actions that are disadvantageous to our business (or be unable to take actions that are advantageous to our business). If we are unable to obtain cash from other sources to enable us to satisfy the Annual Distribution Requirement, we may fail to qualify for the U.S. federal income tax benefits allowable to RICs and, thus, become subject to a corporate-level U.S. federal income tax (and any applicable state and local taxes).
Because we expect to use debt financing, we may be prevented by financial covenants contained in our debt financing agreements from making distributions to our stockholders in certain circumstances. In addition, under the 1940 Act, we are generally not permitted to make distributions to our stockholders while our debt obligations and other senior securities are outstanding unless certain “asset coverage” tests are met. Limits on our distributions to our stockholders may prevent us from satisfying the Annual Distribution Requirement and, therefore, may jeopardize our qualification for taxation as a RIC, or subject us to the 4% U.S. federal excise tax.
17
Although we do not presently expect to do so, we may borrow funds and sell assets in order to make distributions to our stockholders that are sufficient for us to satisfy the Annual Distribution Requirement. However, our ability to dispose of assets may be limited by (1) the illiquid nature of our portfolio and/or (2) other requirements relating to our status as a RIC, including the Diversification Tests. If we dispose of assets in order to meet the Annual Distribution Requirement or the Excise Tax Avoidance Requirement, we may make such dispositions at times that, from an investment standpoint, are not advantageous. Alternatively, although we currently do not intend to do so, to satisfy the Annual Distribution Requirement, we may declare a taxable dividend payable in our stock or cash at the election of each stockholder. In such case, for U.S. federal income tax purposes, the amount of the dividend paid in our common stock will generally be equal to the amount of cash that could have been received instead of our stock. See “ —Taxation of Stockholders” below for a discussion of the tax consequences to stockholders upon receipt of such dividends.
Distributions we make to our stockholders may be made from our cash assets or by liquidation of our investments, if necessary. We may recognize gains or losses from such liquidations. In the event we recognize net capital gains from such transactions, investors may receive a larger capital gain distribution than they would have received in the absence of such transactions.
Failure to Qualify as a RIC
If we fail to satisfy the 90% Income Test for any taxable year or the Diversification Tests for any quarter of a taxable year, we might nevertheless continue to qualify as a RIC for such year if certain relief provisions of the Code applied (which might, among other things, require us to pay certain corporate-level U.S. federal taxes or to dispose of certain assets). If we failed to qualify for treatment as a RIC and such relief provisions did not apply to us, we would be subject to U.S. federal income tax on all of our taxable income at regular corporate U.S. federal income tax rates (and we also would be subject to any applicable state and local taxes), regardless of whether we make any distributions to our stockholders. We would not be able to deduct distributions to our stockholders, nor would distributions to our stockholders be required to be made for U.S. federal income tax purposes. Any distributions we make generally would be taxable to our U.S. stockholders as ordinary dividend income and, subject to certain limitations under the Code, would be eligible for the 20% maximum rate applicable to individuals and other non-corporate U.S. stockholders, to the extent of our current or accumulated earnings and profits. Subject to certain limitations under the Code, U.S. stockholders that are corporations for U.S. federal income tax purposes would be eligible for the dividends-received deduction. Distributions in excess of our current and accumulated earnings and profits would be treated first as a return of capital to the extent of the stockholder’s adjusted tax basis, and any remaining distributions would be treated as a capital gain.
Subject to a limited exception applicable to RICs that qualified as such under Subchapter M of the Code for at least one year prior to disqualification and that re-qualify as a RIC no later than the second year following the non-qualifying year, we could be subject to U.S. federal income tax on any unrealized net built-in gains in the assets held by us during the period in which we failed to qualify as a RIC that are recognized during the 10-year period after our requalification as a RIC, unless we made a special election to pay corporate-level U.S. federal income tax on such net built-in gains at the time of our requalification as a RIC. We may decide to be taxed as a regular corporation even if we would otherwise qualify as a RIC if we determine that treatment as a corporation for a particular year would be in our best interests.
AVAILABLE INFORMATION
We file with or submit to the SEC annual, quarterly and current periodic reports, proxy statements and other information meeting the informational requirements of the Exchange Act. This information is available free of charge on our website at http://www.crescentbdc.com. Information contained on our website is not incorporated into this Annual Report and you should not consider such information to be part of this Annual Report. Such information is also available from the EDGAR database on the SEC’s web site at http://www.sec.gov.
| Item 1A. | Risk Factors |
Investing in our common stock involves a number of significant risks. Before an investor invests in our common stock, the investor should be aware of various risks, including those described below. The investor should carefully consider these risk factors, together with all of the other information included in this Annual Report, before the investor decides whether to make an investment in our securities. The risks set out below are not the only risks we face. Additional risks and uncertainties not presently known to us or not presently deemed material by us may also impair business, financial condition, and/or operating results. If any of the following events occur, our business, financial condition, and results of operations could be materially and adversely affected. In such case, the net asset value of our common stock and the trading price, if any, of our securities could decline, and an investor may lose all or part of his or her investment.
Risks Relating to the COVID-19 pandemic
Global economic, political and market conditions caused by the current public health crisis have (and in the future, could further) adversely affect our business, results of operations and financial condition and those of our portfolio companies.
A novel strain of coronavirus initially appeared in China in late 2019 and rapidly spread to other countries, including the United States. In an attempt to slow the spread of the coronavirus, governments around the world, including the United States, placed restrictions on travel, issued stay at home” orders and ordered the temporary closure of certain businesses, such as factories and retail
18
stores. Such restrictions and closures impacted supply chains, consumer demand and/or the operations of many businesses. As jurisdictions around the United States and the world continue to experience surges in cases of COVID-19 and governments consider pausing the lifting of or re-imposing restrictions, there is considerable uncertainty surrounding the full economic impact of the coronavirus pandemic and the long-term effects on the U.S. and global financial markets.
Any disruptions in the capital markets, as a result of the COVID-19 pandemic or otherwise, may increase the spread between the yields realized on risk-free and higher risk securities and can result in illiquidity in parts of the capital markets, significant write-offs in the financial sector and re-pricing of credit risk in the broadly syndicated market. These and any other unfavorable economic conditions could increase our funding costs, limit our access to the capital markets or result in a decision by lenders not to extend credit to us. During the spring of 2020, the occurrence of these events negatively impacted the fair value of the investments that we held and, if they were to occur again in the future, could limit our investment originations (including as a result of the investment professionals of our Adviser diverting their time to the restructuring of certain investments), negatively impact our operating results and limit our ability to grow. In addition, our success depends in substantial part on the management, skill and acumen of our Adviser, whose operations may be adversely impacted, including through quarantine measures and travel restrictions imposed on its investment professionals or service providers, or any related health issues of such investment professionals or service providers.
In addition, the restrictions and closures and related market conditions resulted in, and if re-imposed in the future, could further result in certain of our portfolio companies halting or significantly curtailing operations and negative impacts to the supply chains of certain of our portfolio companies. The financial results of middle-market companies, like those in which we invest, experienced deterioration, which could ultimately lead to difficulty in meeting debt service requirements and an increase in defaults, and further deterioration will further depress the outlook for those companies. Further, adverse economic conditions decreased and may in the future decrease the value of collateral securing some of our loans and the value of our equity investments. Such conditions have required and may in the future require us to modify the payment terms of our investments, including changes in PIK interest provisions and/or cash interest rates. The performance of certain of our portfolio companies has been, and in the future may be, negatively impacted by these economic or other conditions, which can result in our receipt of reduced interest income from our portfolio companies and/or realized and unrealized losses related to our investments, and, in turn, may adversely affect distributable income and have a material adverse effect on our results of operations. In addition, as governments ease COVID-19 related restrictions, certain of our portfolio companies may experience increased health and safety expenses, payroll costs and other operating expenses.
In December 2020, the U.S. Food and Drug Administration authorized vaccines produced by Pfizer-BioNTech and Moderna for emergency use. However, it remains unclear how quickly the vaccines will be distributed nationwide and globally or when “herd immunity” will be achieved and the restrictions that were imposed to slow the spread of the virus will be lifted entirely. The delay in distributing the vaccines could lead people to continue to self-isolate and not participate in the economy at pre-pandemic levels for a prolonged period of time. Even after the COVID-19 pandemic subsides, the U.S. economy and most other major global economies may continue to experience a recession, and our business and operations, as well as the business and operations of our portfolio companies, could be materially adversely affected by a prolonged recession in the United States and other major markets.
As the potential impact of the coronavirus remains difficult to predict, the extent to which the coronavirus could negatively affect our and our portfolio companies’ operating results or the duration or reoccurrence of any potential business or supply-chain disruption is uncertain. Any potential impact to our results of operations will depend to a large extent on future developments regarding the duration and severity of the coronavirus and the actions taken by governments (including stimulus measures or the lack thereof) and their citizens to contain the coronavirus or treat its impact, all of which are beyond our control.
Risks Relating to our Business and Structure
We have a limited operating history.
We were formed in February 2015 and commenced operations on June 26, 2015. As a result of our limited operating history, we are subject to the business risks and uncertainties associated with recently formed businesses, including the risk that we will not achieve our investment objective and that the value of an investor’s investment could decline substantially.
We are dependent upon key personnel of Crescent and the Adviser.
We do not have any internal management capacity or employees. Our ability to achieve our investment objective will depend on our ability to manage our business and to grow our investments and earnings. This will depend, in turn, on the diligence, skill and network of business contacts of Crescent’s senior professionals. We expect that these senior professionals will evaluate, negotiate, structure, close and monitor our investments in accordance with the terms of our Investment Advisory Agreement. We can offer no assurance, however, that Crescent’s senior professionals will continue to provide investment advice to us. If these individuals do not maintain their employment or other relationships with Crescent and do not develop new relationships with other sources of investment opportunities available to us, we may not be able to grow our investment portfolio. In addition, individuals with whom Crescent’s senior professionals have relationships are not obligated to provide us with investment opportunities. Therefore, we can offer no assurance that such relationships will generate investment opportunities for us.
19
The Adviser is an affiliate of Crescent and will depend upon access to the investment professionals and Crescent’s other resources to fulfill its obligations to us under the Investment Advisory Agreement. The Adviser will also depend upon such investment professionals to obtain access to deal flow generated by Crescent. Under a Resource Sharing Agreement, Crescent has agreed to provide the Adviser with the experienced investment professionals necessary to fulfill its obligations under the Investment Advisory Agreement. The Resource Sharing Agreement provides that Crescent will make available to the Adviser experienced investment professionals and access to Crescent’s resources for purposes of evaluating, negotiating, structuring, closing and monitoring our investments. Although we are a third-party beneficiary of the Resource Sharing Agreement, it may be terminated by either party on 60 days’ notice. We cannot assure investors that Crescent will fulfill its obligations under the agreement. We cannot assure investors that the Adviser will enforce the Resource Sharing Agreement if Crescent fails to perform, that such agreement will not be terminated by either party or that we will continue to have access to Crescent’s investment professionals and its affiliates or their information and deal flow.
Crescent’s and the Adviser’s investment professionals, which are currently composed of the same personnel, have substantial responsibilities in connection with the management of other Crescent clients. Crescent’s personnel may be called upon to provide managerial assistance to our portfolio companies. These demands on their time, which may increase as the number of investments grow, may distract them or slow our rate of investment.
The Adviser’s investment committee, which provides oversight over our investment activities, is provided to us by the Adviser under the Investment Advisory Agreement. The loss of any member of the Adviser’s investment committee or of Crescent’s other senior professionals would limit our ability to achieve our investment objective and operate as we anticipate. This could have a material adverse effect on our financial condition, results of operations and cash flows.
Further, we depend upon Crescent to maintain its relationships with private equity sponsors, placement agents, investment banks, management groups and other financial institutions, and we expect to rely to a significant extent upon these relationships to provide us with potential investment opportunities. If Crescent fails to maintain such relationships, or to develop new relationships with other sources of investment opportunities, we will not be able to grow our investment portfolio. In addition, individuals with whom Crescent’s senior professionals have relationships are not obligated to provide us with investment opportunities, and we can offer no assurance that these relationships will generate investment opportunities in the future.
We may not replicate the historical results achieved by Crescent.
Our primary focus in making investments may differ from those of existing investment funds, accounts or other investment vehicles that are or have been managed by members of the Adviser’s investment committee or by Crescent. Past performance should not be relied upon as an indication of future results. There can be no guarantee that we will replicate our own historical performance, the historical success of Crescent or the historical performance of investment funds, accounts or other investment vehicles that are or have been managed by members of the Adviser’s investment committee or by Crescent or its employees, and we caution investors that our investment returns could be substantially lower than the returns achieved by them in prior periods. We cannot assure you that we will be profitable in the future or that the Adviser will be able to continue to implement our investment objectives with the same degree of success that it has had in the past. Additionally, all or a portion of the prior results may have been achieved in particular market conditions which may never be repeated. Moreover, current or future market volatility and regulatory uncertainty may have an adverse impact on our future performance.
We depend on Crescent to manage our business effectively.
Our ability to achieve our investment objective will depend on our ability to manage our business and to grow our investments and earnings. This will depend, in turn, on Crescent’s ability to identify, invest in and monitor portfolio companies that meet our investment criteria. The achievement of our investment objectives on a cost-effective basis will depend upon Crescent’s execution of our investment process, its ability to provide competent, attentive and efficient services to us and, to a lesser extent, our access to financing on acceptable terms. Crescent’s investment professionals will have substantial responsibilities in connection with the management of other investment funds, accounts and investment vehicles. Crescent’s personnel may be called upon to provide managerial assistance to our portfolio companies. These activities may distract them from servicing new investment opportunities for us or slow our rate of investment. Any failure to manage our business and our future growth effectively could have a material adverse effect on our business, financial condition, results of operations and cash flows.
Global capital markets could enter a period of severe disruption and instability. These conditions have historically affected and could again materially and adversely affect debt and equity capital markets in the United States and around the world and our business.
From time to time, the global capital markets may experience periods of disruption and instability resulting in increasing spreads between the yields realized on riskier debt securities and those realized on risk-free securities and a lack of liquidity in parts of the
20
debt capital markets, significant write-offs in the financial services sector relating to subprime mortgages and the re-pricing of credit risk in the broadly syndicated market. Deteriorating market conditions could result in increasing volatility and illiquidity in the global credit, debt and equity markets generally. The duration and ultimate effect of such market conditions cannot be forecasted. Deteriorating market conditions and uncertainty regarding economic markets generally could result in declines in the market values of potential investments or declines in the market values of investments after they are made or acquired by us and affect the potential for liquidity events involving such investments or portfolio companies.
Such declines may be exacerbated by other events, such as the failure of significant financial institutions or hedge funds, dislocations in other investment markets or other extrinsic events. Applicable accounting standards require us to determine the fair value of our investments as the amount that would be received in an orderly transaction between market participants at the measurement date. While most of our investments are not publicly traded, as part of the valuation process we consider a number of measures, including comparison to publicly traded securities. As a result, volatility in the public capital markets can adversely affect our investment valuations.
During any such periods of market disruption and instability, we and other companies in the financial services sector may have limited access, if any, to alternative markets for debt and equity capital. Equity capital may be difficult to raise because, subject to some limited exceptions that will apply to us as a BDC, we will generally not be able to issue additional shares of our common stock at a price less than net asset value (“NAV”) without first obtaining approval for such issuance from our stockholders and independent directors. In addition, our ability to incur indebtedness (including by issuing preferred stock) is limited by applicable regulations such that our asset coverage, as defined in the 1940 Act, as amended, must equal at least 150% immediately after each time we incur indebtedness. The debt capital that will be available, if any, may be at a higher cost and on less favorable terms and conditions in the future. Any inability to raise capital could have a negative effect on our business, financial condition and results of operations.
A prolonged period of market illiquidity may cause us to reduce the volume of loans and debt securities we originate and/or fund and adversely affect the value of our portfolio investments, which could have a material and adverse effect on our business, financial condition, results of operations and cash flows.
Global economic, political and market conditions, including uncertainty about the financial stability of the United States, could have a significant adverse effect on our business, financial condition and results of operations.
Downgrades by rating agencies to the U.S. government’s credit rating or concerns about its credit and deficit levels in general, could cause interest rates and borrowing costs to rise, which may negatively impact both the perception of credit risk associated with our debt portfolio and our ability to access the debt markets on favorable terms. In addition, a decreased U.S. government credit rating could create broader financial turmoil and uncertainty, which may weigh heavily on our financial performance and the value of our Common Stock.
Deterioration in the economic conditions in the Eurozone and globally, including instability in financial markets, may pose a risk to our business. In recent years, financial markets have been affected at times by a number of global macroeconomic and political events, including the following: large sovereign debts and fiscal deficits of several countries in Europe and in emerging markets jurisdictions, levels of non-performing loans on the balance sheets of European banks, the potential effect of any European country leaving the Eurozone, the potential effect of the United Kingdom leaving the European Union, and market volatility and loss of investor confidence driven by political events. Market and economic disruptions have affected, and may in the future affect, consumer confidence levels and spending, personal bankruptcy rates, levels of incurrence and default on consumer debt and home prices, among other factors. We cannot assure you that market disruptions in Europe, including the increased cost of funding for certain governments and financial institutions, will not impact the global economy, and we cannot assure you that assistance packages will be available, or if available, be sufficient to stabilize countries and markets in Europe or elsewhere affected by a financial crisis. To the extent uncertainty regarding any economic recovery in Europe negatively impacts consumer confidence and consumer credit factors, our business, financial condition and results of operations could be significantly and adversely affected.
The current global financial market situation, as well as various social and political circumstances in the U.S. and around the world, including wars and other forms of conflict, terrorist acts, security operations and catastrophic events such as fires, floods, earthquakes, tornadoes, hurricanes, adverse effects of climate change and global health epidemics (including the COVID-19), may contribute to increased market volatility and economic uncertainties or deterioration in the U.S. and worldwide. Additionally, the U.S. government’s credit and deficit concerns, the European sovereign debt crisis, and the potential trade war with China, could cause interest rates to be volatile, which may negatively impact our ability to access the debt markets on favorable terms.
Adverse developments in the credit markets may impair our ability to enter into new debt financing arrangements.
During the economic downturn in the United States that began in mid-2007, many commercial banks and other financial institutions stopped lending or significantly curtailed their lending activity. In addition, in an effort to stem losses and reduce their exposure to segments of the economy deemed to be high risk, some financial institutions limited refinancing and loan modification transactions
21
and reviewed the terms of existing facilities to identify bases for accelerating the maturity of existing lending facilities. If these conditions recur, it may be difficult for us to enter into a new credit or other borrowing facility, obtain other financing to finance the growth of its investments, or refinance any outstanding indebtedness on acceptable economic terms, or at all.
The Adviser, the investment committee of the Adviser, Crescent and their affiliates, officers, directors and employees may face certain conflicts of interest.
As a result of our arrangements with Crescent, the Adviser and the Adviser’s investment committee, there may be times when the Adviser or such persons have interests that differ from those of our stockholders, giving rise to a conflict of interest.
The members of the Adviser’s investment committee serve, or may serve, as officers, directors, members, or principals of entities that operate in the same or a related line of business as we do, or of investment funds, accounts, or investment vehicles managed by Crescent and/or its affiliates. Similarly, Crescent and its affiliates may have other clients with similar, different or competing investment objectives.
In serving in these multiple capacities, they may have obligations to other clients or investors in those entities, the fulfillment of which may not be in the best interests of, or which may be adverse to the interests of, us or our stockholders. For example, Crescent has, and will continue to have management responsibilities for other investment funds, accounts and investment vehicles. There is a potential that we will compete with these funds, and other entities managed by Crescent and its affiliates, for capital and investment opportunities. As a result, members of the Adviser’s investment committee who are affiliated with Crescent will face conflicts in the allocation of investment opportunities among us, and other investment funds, accounts and investment vehicles managed by Crescent and its affiliates and may make certain investments that are appropriate for us but for which we receive a relatively small allocation or no allocation at all. Crescent intends to allocate investment opportunities among eligible investment funds, accounts and investment vehicles in a manner that is fair and equitable over time and consistent with its allocation policy. However, we can offer no assurance that such opportunities will be allocated to us fairly or equitably in the short-term or over time and we may not be given the opportunity to participate in investments made by investment funds managed by Crescent or its affiliates. We expect that Crescent and the Adviser will agree with our Board that, subject to applicable law, allocations among us and other investment funds, accounts and investment vehicles managed by Crescent will generally be made based on capital available for investment in the asset class being allocated and the respective governing documents of such investment funds, accounts and investment vehicles. We expect that available capital for our investments will be determined based on the amount of cash on-hand, existing commitments and reserves, if any, the targeted leverage level, targeted asset mix and diversification requirements and other investment policies and restrictions set by our Board or as imposed by applicable laws, rules, regulations or interpretations. However, there can be no assurance that we will be able to participate in all investment opportunities that are suitable to us.
Further, to the extent permitted by applicable law, we and our affiliates may own investments at different levels of a portfolio company’s capital structure or otherwise own different classes of a portfolio company’s securities, which may give rise to conflicts of interest or perceived conflicts of interest. Conflicts may also arise because decisions regarding our portfolio may benefit our affiliates. Our affiliates may pursue or enforce rights with respect to one of its portfolio companies, and those activities may have an adverse effect on us.
Crescent’s principals and employees, the Adviser or their affiliates may, from time to time, possess material non-public information, limiting our investment discretion.
Crescent’s executive officers and directors, principals and other employees, including members of the Adviser’s investment committee, may serve as directors of, or in a similar capacity with, portfolio companies in which we invest, the securities of which are purchased or sold on our behalf and may come into possession of material non-public information with respect to issuers in which we may be considering making an investment. In the event that material non-public information is obtained with respect to such companies, or we become subject to trading restrictions under the internal trading policies of those companies, Crescent’s policies or as a result of applicable law or regulations, we could be prohibited for a period of time or indefinitely from purchasing or selling the securities of such companies, or we may be precluded from providing such information or other ideas to other funds affiliated with Crescent that might benefit from such information, and this prohibition may have an adverse effect on us.
Our management and incentive fee structure may create incentives for the Adviser that are not fully aligned with our stockholders’ interests and may induce the Adviser to make speculative investments.
In the course of our investing activities, we will pay management and incentive fees to the Adviser. We have entered into the Investment Advisory Agreement with the Adviser that provides that these fees are based on the value of our gross assets (which includes assets purchased with borrowed amounts or other forms of leverage but excludes cash and cash equivalents), instead of net assets (defined as total assets less indebtedness and before taking into account any incentive fees payable). As a result, investors in our common stock will invest on a “gross” basis and receive distributions on a “net” basis after expenses, including the costs of leverage, resulting in a lower rate of return than one might achieve if distributions were made on a gross basis. Because our management fees
22
are based on the value of our gross assets, incurrence of debt or the use of leverage will increase the management fees due to the Adviser. As such, the Adviser may have an incentive to use leverage to make additional investments. In addition, as additional leverage would magnify positive returns, if any, on our portfolio, the incentive fee would become payable to the Adviser (i.e., exceed the Hurdle Amount (as defined herein under the heading “Incentive Fee”)) at a lower average return on our portfolio. Thus, if we incur additional leverage, the Adviser may receive additional incentive fees without any corresponding increase (and potentially with a decrease) in the performance of our portfolio.
Additionally, under the incentive fee structure, the Adviser may benefit when capital gains are recognized and, because the Adviser will determine when to sell a holding, the Adviser will control the timing of the recognition of such capital gains. As a result of these arrangements, there may be times when the management team of the Adviser has interests that differ from those of our stockholders, giving rise to a conflict. Furthermore, there is a risk the Adviser will make more speculative investments in an effort to receive this payment. PIK interest and OID would increase our pre-incentive fee net investment income by increasing the size of the loan balance of underlying loans and increasing our assets under management and would make it easier for the Adviser to surpass the Hurdle Amount and increase the amount of incentive fees payable to the Adviser.
The part of the incentive fee payable to the Adviser relating to our net investment income is computed and paid on income that may include interest income that has been accrued but not yet received in cash. This fee structure may give rise to a conflict of interest for the Adviser to the extent that it encourages the Adviser to favor debt financings that provide for deferred interest, rather than current cash payments of interest. The Adviser may have an incentive to invest in deferred interest securities in circumstances where it would not have done so but for the opportunity to continue to earn the incentive fee even when the issuers of the deferred interest securities would not be able to make actual cash payments to us on such securities. This risk could be increased because, under the Investment Advisory Agreement, the Adviser is not obligated to reimburse us for incentive fees it receives even if we subsequently incur losses or never receives in cash the deferred income that was previously accrued.
Our Board is charged with protecting our interests by monitoring how the Adviser addresses these and other conflicts of interest associated with its services and compensation. While our Board is not expected to review or approve each investment decision or incurrence of leverage, our independent directors will periodically review the Adviser’s services and fees as well as its portfolio management decisions and portfolio performance. In connection with these reviews, our independent directors will consider whether the Adviser’s fees and expenses (including those related to leverage) remain appropriate.
We may invest, to the extent permitted by law, in the securities and instruments of other investment companies, including private funds, and, to the extent it so invests, bear its ratable share of any such investment company’s expenses, including management and performance fees. We also remain obligated to pay management and incentive fees to the Adviser with respect to the assets invested in the securities and instruments of other investment companies. With respect to each of these investments, each of our stockholders bears his or her share of the management and incentive fees of the Adviser as well as indirectly bearing the management and performance fees and other expenses of any investment companies in which we invest.
Conflicts of interest may be created by the valuation process for certain portfolio holdings.
We make many of our portfolio investments in the form of loans and securities that are not publicly traded and for which no market based price quotation is available. As a result, our Board will determine the fair value of these loans and securities in good faith as described below in “—The majority of our portfolio investments are recorded at fair value as determined in good faith by our Board and, as a result, there may be uncertainty as to the value of our portfolio investments.” Each of the interested members of our Board has an indirect pecuniary interest in the Adviser. The participation of the Adviser’s investment professionals in our valuation process, and the pecuniary interest in the Adviser by certain members of the our Board, could result in a conflict of interest as the Adviser’s management fee is based, in part, on the value of our gross assets, and our incentive fees will be based, in part, on realized gains and realized and unrealized losses.
Conflicts may arise related to other arrangements with Crescent and the Adviser and other affiliates.
We have entered into a license agreement with Crescent under which Crescent has agreed to grant us a non-exclusive, royalty-free license to use the name “Crescent Capital.” In addition, the Administration Agreement with the Administrator, an affiliate of Crescent, requires we pay to the Administrator our allocable portion of overhead and other expenses incurred by the Administrator in performing its obligations under the Administration Agreement, such as rent and our allocable portion of the cost of our chief financial officer and chief compliance officer and their respective staffs. In addition, the Adviser has entered into a Resource Sharing Agreement with Crescent pursuant to which Crescent provides the Adviser with the resources necessary to fulfill its obligations under the Investment Advisory Agreement. These agreements create conflicts of interest that the independent members of our Board will monitor. For example, under the terms of the license agreement, we will be unable to preclude Crescent from licensing or transferring the ownership of the “Crescent Capital” name to third parties, some of whom may compete against us. Consequently, it will be unable to prevent any damage to goodwill that may occur as a result of the activities of Crescent or others. Furthermore, in the event the license agreement is terminated, we will be required to change our name and cease using “Crescent Capital” as part of our name. Any of these events could disrupt our recognition in the market place, damage any goodwill it may have generated and otherwise harm its business.
23
Our Investment Advisory Agreement was negotiated with the Adviser and the Administration Agreement was negotiated with the Administrator, which are both our related parties.
The Investment Advisory Agreement, and the Administration Agreement were negotiated between related parties. Consequently, their terms, including fees payable to the Adviser, may not be as favorable to us as if they had been negotiated exclusively with an unaffiliated third party. In addition, we may desire not to enforce, or to enforce less vigorously, its rights and remedies under these agreements because of our desire to maintain our ongoing relationship with the Adviser, the Administrator and their respective affiliates. Any such decision, however, could breach our fiduciary obligations to its stockholders.
The Adviser has limited liability and is entitled to indemnification under the Investment Advisory Agreement.
Under the Investment Advisory Agreement, the Adviser has not assumed any responsibility to us other than to render the services called for under that agreement. The Adviser will not be responsible for any action of our Board in following or declining to follow the Adviser’s advice or recommendations. Under the Investment Advisory Agreement the Adviser, its officers, managers, partners, agents, employees, controlling persons, members and any other person or entity affiliated with the Adviser, including, without limitation, its general partner and the Administrator, and any person controlling or controlled by the Adviser will not be liable to us, any of our subsidiaries, our directors, our stockholders or any subsidiary’s stockholders or partners for acts or omissions performed in accordance with and pursuant to the Investment Advisory Agreement, except those resulting from acts constituting gross negligence, willful misfeasance, bad faith or reckless disregard of the duties that the Adviser owes to us under the Investment Advisory Agreement. In addition, as part of the Investment Advisory Agreement, we have agreed to indemnify the Adviser and each of its officers, managers, partners, agents, employees, controlling persons, members and any other person or entity affiliated with the Adviser, including, without limitation, its general partner and the Administrator, and hold them harmless from and against all damages, liabilities, costs and expenses (including reasonable attorneys’ fees and amounts reasonably paid in settlement) incurred by such party in or by reason of any pending, threatened or completed action, suit, investigation or other proceeding (including an action or suit by or in the right of us or our security holders) arising out of or otherwise based upon the performance of any of the Adviser’s duties or obligations under the Investment Advisory Agreement or otherwise as an investment adviser of us, except in respect of any liability to us or our security holders to which such party would otherwise be subject by reason of willful misfeasance, bad faith or gross negligence in the performance of the Adviser’s duties or by reason of the reckless disregard of the Adviser’s duties and obligations under the Investment Advisory Agreement. These protections may lead the Adviser to act in a riskier manner when acting on our behalf than the Adviser would when acting for its own account.
Our ability to enter into transactions with our affiliates is restricted.
We are prohibited under the 1940 Act from participating in certain transactions with our affiliates without the prior approval of our independent directors and, in some cases, the SEC. We consider the Adviser and its affiliates, including Crescent, to be our affiliates for such purposes. In addition, any person that owns, directly or indirectly, 5% or more of our outstanding voting securities will be our affiliate for purposes of the 1940 Act, and we are generally prohibited from buying or selling any security from or to such affiliate without the prior approval of our independent directors. We consider the Adviser and its affiliates, including Crescent, to be our affiliates for such purposes. The 1940 Act also prohibits certain “joint” transactions with certain of our affiliates, which could include investments in the same portfolio company, without prior approval of our independent directors and, in some cases, of the SEC. We are prohibited from buying or selling any security from or to any person who owns more than 25% of our voting securities or certain of that person’s affiliates, or entering into prohibited joint transactions with such persons, absent the prior approval of the SEC.
We may, however, invest alongside Crescent’s investment funds, accounts and investment vehicles in certain circumstances where doing so is consistent with our investment strategy as well as applicable law and SEC staff interpretations or exemptive orders. For example, we may invest alongside such investment funds, accounts and investment vehicles consistent with guidance promulgated by the SEC staff to purchase interests in a single class of privately placed securities so long as certain conditions are met, including that Crescent, acting on our behalf and on behalf of such investment funds, accounts and investment vehicles, negotiates no term other than price. We may also invest alongside Crescent’s investment funds, accounts and investment vehicles as otherwise permissible under regulatory guidance, applicable regulations or exemptive orders and Crescent’s allocation policy. If the Company is prohibited by applicable law from investing alongside Crescent’s investment funds, accounts and investment vehicles with respect to an investment opportunity, we may not be able to participate in such investment opportunity. This allocation policy provides that allocations among us and investment funds, accounts and investment vehicles managed by Crescent and its affiliates will generally be made pro rata based on capital available for investment, as determined, in our case, by our Board as well as the terms of our governing documents and those of such investment funds, accounts and investment vehicles. It is our policy to base our determinations on such factors as: the amount of cash on-hand, existing commitments and reserves, if any, our targeted leverage level, our targeted asset mix and diversification requirements and other investment policies and restrictions set by our Board or imposed by applicable laws, rules, regulations or interpretations. We expect that these determinations will be made similarly for investment funds, accounts and investment vehicles managed by Crescent. However, we can offer no assurance that investment opportunities will be allocated to us fairly or equitably in the short-term or over time.
24
In situations where co-investment with investment funds, accounts and investment vehicles managed by Crescent is not permitted or appropriate, such as when there is an opportunity to invest in different securities of the same issuer or where the different investments could be expected to result in a conflict between our interests and those of Crescent’s clients, subject to the limitations described in the preceding paragraph, Crescent will need to decide which client will proceed with the investment. Similar restrictions limit our ability to transact business with our officers or directors or their affiliates. These restrictions will limit the scope of investment opportunities that would otherwise be available to us.
We, the Adviser and Crescent have been granted exemptive relief from the SEC which permits greater flexibility to negotiate the terms of co-investments if our Board determines that it would be advantageous for us to co-invest with investment funds, accounts and investment vehicles managed by Crescent in a manner consistent with our investment objectives, positions, policies, strategies and restrictions as well as regulatory requirements and other pertinent factors. We believe that co-investment by us and investment funds, accounts and investment vehicles managed by Crescent may afford us additional investment opportunities and an ability to achieve a more varied portfolio. Accordingly, our exemptive order permits us to invest with investment funds, accounts and investment vehicles managed by Crescent in the same portfolio companies under circumstances in which such investments would otherwise not be permitted by the 1940 Act. The exemptive relief permitting co-investment transactions generally applies only if our independent directors and directors who have no financial interest in such transaction review and approve in advance each co-investment transaction.
Our ability to sell or otherwise exit investments also invested in by other Crescent investment vehicles is restricted.
We may be considered affiliates with respect to certain of our portfolio companies because our affiliates, which may include certain investment funds, accounts or investment vehicles managed by Crescent, also hold interests in these portfolio companies and as such these interests may be considered a joint enterprise under the 1940 Act. To the extent that our interests in these portfolio companies may need to be restructured in the future or to the extent that we choose to exit certain of these transactions, our ability to do so will be limited. We intend to seek exemptive relief in relation to certain joint transactions; however, there is no assurance that we will obtain relief that would permit us to negotiate future restructurings or other transactions that may be considered a joint enterprise.
We operate in an increasingly competitive market for investment opportunities, which could make it difficult for us to identify and make investments that are consistent with our investment objectives.
A number of entities compete with us to make the types of investments that we make and plan to make. We compete with public and private funds, commercial and investment banks, commercial financing companies and, to the extent they provide an alternative form of financing, private equity and hedge funds. Many of our competitors are substantially larger and have considerably greater financial, technical and marketing resources than we do. For example, we believe some of our competitors may have access to funding sources that are not available to us. In addition, some of our competitors may have higher risk tolerances or different risk assessments, which could allow them to consider a wider variety of investments and establish more relationships than us. Furthermore, many of our competitors are not subject to the regulatory restrictions that the 1940 Act imposes on us as a BDC or the source-of-income, asset diversification and distribution requirements we must satisfy to maintain our RIC qualification. The competitive pressures we face may have a material adverse effect on our business, financial condition, results of operations and cash flows. As a result of this competition, we may not be able to take advantage of attractive investment opportunities from time to time, and we may not be able to identify and make investments that are consistent with our investment objectives.
With respect to the investments we make, we will not seek to compete based primarily on the interest rates we will offer, and we believe that some of our competitors may make loans with interest rates that will be lower than the rates we offer. In the secondary market for acquiring existing loans, we expect to compete generally on the basis of pricing terms. With respect to all investments, we may lose some investment opportunities if we do not match our competitors’ pricing, terms and structure. However, if we match our competitors’ pricing, terms and structure, we may experience decreased net interest income, lower yields and increased risk of credit loss. We may also compete for investment opportunities with investment funds, accounts and investment vehicles managed by Crescent. Although Crescent will allocate opportunities in accordance with its policies and procedures, allocations to such investment funds, accounts and investment vehicles will reduce the amount and frequency of opportunities available to us and may not be in the best interests of us and our stockholders. Moreover, the performance of investments will not be known at the time of allocation. See —“The Adviser, the investment committee of the Adviser, Crescent and their affiliates, officers, directors and employees may face certain conflicts of interest.”
We will be subject to corporate level income tax if we are unable to qualify as a RIC.
To qualify as a RIC under the Code, we must meet certain source-of-income, asset diversification and distribution requirements. The distribution requirement for a RIC is satisfied if we distribute at least 90% of our net ordinary income and net short-term capital gains
25
in excess of net long-term capital losses, if any, to our stockholders on an annual basis. We will be subject, to the extent we use debt financing, to certain asset coverage ratio requirements under the 1940 Act and financial covenants under loan and credit agreements that could, under certain circumstances, restrict us from making distributions necessary to qualify as a RIC. If we are unable to obtain cash from other sources, we may fail to qualify as a RIC and, thus, may be subject to corporate-level income tax. To qualify as a RIC, we must also meet certain asset diversification requirements at the end of each calendar quarter. Failure to meet these tests may result in our having to dispose of certain investments quickly in order to prevent the loss of our qualifications as a RIC. Because most of our investments will be in private or thinly traded public companies, any such dispositions could be made at disadvantageous prices and may result in substantial losses. If we fail to qualify as a RIC for any reason and become subject to corporate income tax, the resulting corporate taxes could substantially reduce our net assets, the amount of income available for distributions to our stockholders and the amount of funds available for new investments. Such a failure would have a material adverse effect on us and our stockholders.
We may need to raise additional capital.
We intend to access the capital markets periodically to issue debt or equity securities or borrow from financial institutions in order to obtain additional capital to fund new investments and grow our portfolio of investments. Unfavorable economic conditions could increase our funding costs, limit our access to the capital markets or result in a decision by lenders not to extend credit to us. A reduction in the availability of new capital could limit our ability to grow. In addition, we will be required to distribute in respect of each taxable year at least 90% of our net ordinary income and net short-term capital gains in excess of net long-term capital losses, if any, for such taxable year to our stockholders to maintain our qualification as a RIC. Amounts so distributed will not be available to fund new investments or repay maturing debt. An inability on our part to access the capital markets successfully could limit our ability to grow our business and execute our business strategy fully and could decrease our earnings, if any, which would have an adverse effect on the value of our securities.
Further, we may pursue growth through acquisitions or strategic investments in new businesses. Completion and timing of any such acquisitions or strategic investments may be subject to a number of contingencies and risks. There can be no assurance that the integration of an acquired business will be successful or that an acquired business will prove to be profitable or sustainable.
Regulations governing our operation as a BDC affect our ability to, and the way in which we may, raise additional capital.
We may issue debt securities or preferred stock and/or borrow money from banks or other financial institutions, which we refer to collectively as “senior securities,” up to the maximum amount permitted by the 1940 Act. Under the provisions of the 1940 Act, we will be permitted as a BDC to issue senior securities in amounts such that our asset coverage ratio, as defined in the 1940 Act, as amended, equals at least 150% of our gross assets less all liabilities and indebtedness not represented by senior securities, after each issuance of senior securities. If the value of our assets declines, we may be unable to satisfy this test. If that happens, we may be required to sell a portion of our investments at a time when such sales may be disadvantageous to us in order to repay a portion of its indebtedness. If we issue senior securities, we will be exposed to typical risks associated with leverage, including an increased risk of loss.
Furthermore, equity capital may be difficult to raise because, subject to some limited exceptions we are not generally able to issue and sell our common stock at a price below NAV per share. We may, however, sell our common stock, or warrants, options or rights to acquire shares of our common stock, at a price below the then-current NAV per share of our common stock if our Board determines that such sale is in our best interests, and if our stockholders, including a majority of those stockholders that are not affiliated with us, approve such sale. In any such case, the price at which our securities are to be issued and sold may not be less than a price that, in the determination of our Board, closely approximates the market value of such securities (less any distributing commission or discount). We do not currently have authorization from our stockholders to issue our common stock at a price below the then-current NAV per share.
Stockholders may be required to pay tax in excess of the cash they receive.
Under our dividend reinvestment plan, if a stockholder owns shares of our common stock, the stockholder will have all cash distributions automatically reinvested in additional shares of our common stock unless such stockholder, or his, her or its nominee on such stockholder’s behalf, specifically “opts out” of the dividend reinvestment plan by delivering a written notice to the plan administrator prior to the record date of the next distribution. If a stockholder does not “opt out” of the dividend reinvestment plan, that stockholder will be deemed to have received, and for U.S. federal income tax purposes will be taxed on, the amount reinvested in our common stock to the extent the amount reinvested was not a tax-free return of capital. As a result, a stockholder may have to use funds from other sources to pay U.S. federal income tax liability on the value of the common stock received. Even if a stockholder chooses to “opt out” of the dividend reinvestment plan, we will have the ability to declare a large portion of a dividend in shares of our common stock instead of in cash in order to satisfy the Annual Distribution Requirement (as defined herein under the heading “Item 1(c). Description of Business—Regulation as a Business Development Company—Election to Be Taxed as a RIC”). As long as a portion of this dividend is paid in cash and certain requirements are met, the entire distribution will be treated as a dividend for U.S. federal income tax purposes. As a result, a stockholder generally will be subject to tax on 100% of the fair market value of the dividend on the date the dividend is received by the stockholder in the same manner as a cash dividend, even though most of the dividend was paid in shares of common stock.
26
We may have difficulty paying our required distributions if we recognize income before, or without, receiving cash representing such income.
For U.S. federal income tax purposes, we will include in income certain amounts that we have not yet received in cash, such as the accretion of OID. This may arise if we receive warrants in connection with the making of a loan and in other circumstances, or through contracted PIK interest, which represents contractual interest added to the loan balance and due at the end of the loan term. Such OID, which could be significant relative to our overall investment activities, or increases in loan balances as a result of contracted PIK arrangements, will be included in income before we receive any corresponding cash payments. We also may be required to include in income certain other amounts that we will not receive in cash.
Since in certain cases we may recognize income before or without receiving cash representing such income, we may have difficulty meeting the requirement to distribute at least 90% of our net ordinary income and net short-term capital gains in excess of net long-term capital losses, if any, to maintain our qualification as a RIC. In such a case, we may have to sell some of our investments at times we would not consider advantageous, raise additional debt or equity capital or reduce new investment originations to meet these distribution requirements. If we are not able to obtain such cash from other sources, we may fail to qualify as a RIC and thus be subject to corporate-level income tax.
We may be subject to withholding of U. S. Federal income tax on distributions for non-U.S. stockholders.
Distributions by a RIC generally are treated as dividends for U.S. tax purposes, and will be subject to U.S. income or withholding tax unless the stockholder receiving the dividend qualifies for an exemption from U.S. tax, or the distribution is subject to one of the special look-through rules described below. Distributions paid out of net capital gains can qualify for a reduced rate of taxation in the hands of an individual U.S. stockholder, and an exemption from U.S. tax in the hands of a non-U.S. stockholder.
Properly reported dividend distributions by RICs paid out of certain interest income (such distributions, “interest-related dividends”) are generally exempt from U.S. withholding tax for non-U.S. stockholders. Under such exemption, a non-U.S. stockholder generally may receive interest-related dividends free of U.S. withholding tax if the stockholder would not have been subject to U.S. withholding tax if it had received the underlying interest income directly. No assurance can be given as to whether any of our distributions will be eligible for this exemption from U.S. withholding tax or, if eligible, will be designated as such by us. In particular, the exemption does apply to distributions paid in respect of a RIC’s non-U.S. source interest income, its dividend income or its foreign currency gains. In the case shares of our common stock held through an intermediary, the intermediary may withhold U.S. federal income tax even if we designate the payment as a dividend eligible for the exemption. Also, because our common stock will be subject to significant transfer restrictions, and an investment in our common stock will generally be illiquid, non-U.S. stockholders whose distributions on our common stock are subject to U.S. withholding tax may not be able to transfer their shares of our common stock easily or quickly or at all.
We may retain income and capital gains in excess of what is permissible for excise tax purposes and such amounts will be subject to 4% U.S. federal excise tax, reducing the amount available for distribution to stockholders.
We may retain some income and capital gains in the future, including for purposes of providing additional liquidity, which amounts would be subject to the 4% U.S. federal excise tax. In that event, we will be liable for the tax on the amount by which it does not meet the foregoing distribution requirement. See Item 1(c). Description of Business—Regulation as a Business Development Company—Taxation as a RIC.”
Our business may be adversely affected if it fails to maintain its qualification as a RIC.
To maintain RIC tax treatment under the Code, we must meet the Annual Distribution Requirement, 90% Income Test and Diversification Tests described below and defined and further described in “Item 1(c). Description of Business—Regulation as a Business Development Company—Election to Be Taxed as a RIC.” The Annual Distribution Requirement will be satisfied if we distribute dividends to our stockholders in respect of each taxable year of an amount generally at least equal to 90% of its investment company taxable income, determined without regard to any deduction for distributions paid. In this regard, a RIC may, in certain cases, satisfy the Annual Distribution Requirement by distributing dividends relating to a taxable year after the close of such taxable year under the “spillback dividend” provisions of Subchapter M of the Code. We will be subject to tax, at regular corporate rates, on any retained income and/or gains, including any short-term capital gains or long-term capital gains. We must also satisfy the Excise Tax Avoidance Requirement, which is an additional distribution requirement with respect to each calendar year in order to avoid the imposition of a 4% excise tax on the amount of any under-distribution. Because we use debt financing, we are subject to (i) an asset coverage ratio requirement under the 1940 Act and are subject to (ii) certain financial covenants under loan and credit agreements that could, under certain circumstances, restrict us from making distributions necessary to satisfy the distribution requirements. If we are unable to obtain cash from other sources, or chose or be required to retain a portion of our taxable income or gains, it could (i) be required to pay excise tax and (ii) fail to qualify for RIC tax treatment, and thus become subject to corporate-level income tax on its taxable income (including gains).
27
The 90% Income Test will be satisfied if we earn at least 90% of its gross income each taxable year from distributions, interest, gains from the sale of stock or securities, or other income derived from the business of investing in stock or securities. The Diversification Tests will be satisfied if we meet certain asset diversification requirements at the end of each quarter of our taxable year. To satisfy the Diversification Tests, at least 50% of the value of our assets at the close of each quarter of each taxable year must consist of cash, cash equivalents (including receivables), U.S. government securities, securities of other RICs, and other acceptable securities, and no more than 25% of the value of its assets can be invested in the securities, other than U.S. government securities or securities of other RICs, of one issuer, of two or more issuers that are controlled, as determined under applicable Code rules, by us and that are engaged in the same or similar or related trades or businesses or of certain “qualified publicly traded partnerships.” Failure to meet these requirements may result in us having to dispose of certain investments quickly in order to prevent the loss of RIC status. Because most of our investments will be in private companies, and therefore will be relatively illiquid, any such dispositions could be made at disadvantageous prices and could result in substantial losses.
We may invest in certain debt and equity investments through taxable subsidiaries and the net taxable income of these taxable subsidiaries will be subject to federal and state corporate income taxes. We also may invest in certain foreign debt and equity investments that could be subject to foreign taxes (such as income tax, withholding, and value added taxes). If we fail to maintain RIC tax treatment for any reason and are subject to corporate income tax, the resulting corporate taxes could substantially reduce our net assets, the amount of income available for distribution, and the amount of our distributions.
Certain investors are limited in their ability to make significant investments in us.
Private funds that are excluded from the definition of “investment company” either pursuant to Section 3(c)(1) or 3(c)(7) of the 1940 Act are restricted from acquiring directly or through a controlled entity more than 3% of our total outstanding voting stock (measured at the time of the acquisition). Investment companies registered under the 1940 Act and BDCs, such as us, are also currently subject to this restriction as well as other limitations under the 1940 Act that would restrict the amount that they are able to invest in our securities. As a result, certain investors will be limited in their ability to make significant investments in us at a time that they might desire to do so. The SEC has proposed Rule 12d1-4 under the 1940 Act. Subject to certain conditions, proposed Rule 12d1-4 would provide an exemption to permit acquiring funds to invest in the securities of other registered investment companies and BDCs in excess of the limits currently prescribed by the 1940 Act.
Our business could be adversely affected in the event we default under our existing credit facilities or any future credit or other borrowing facility.
We have entered into, and additionally may enter into, one or more credit facilities. The closing of any additional credit facilities is contingent on a number of conditions including, without limitation, the negotiation and execution of definitive documents relating to such credit facility. If we obtain any additional credit facilities, we intend to use borrowings under such credit facilities to make additional investments and for other general corporate purposes. However, there can be no assurance that we will be able to close such additional credit facilities or obtain other financing.
In the event we default under one of our credit facilities or any other future borrowing facility, our business could be adversely affected as we may be forced to sell a portion of our investments quickly and prematurely at what may be disadvantageous prices to us in order to meet our outstanding payment obligations and/or support working capital requirements under the relevant credit facility or such future borrowing facility, any of which would have a material adverse effect on our business, financial condition, results of operations and cash flows. In addition, following any such default, the agent for the lenders under any future borrowing facility could assume control of the disposition of any or all of our assets, including the selection of such assets to be disposed and the timing of such disposition, which would have a material adverse effect on our business, ability to pay dividends, financial condition, results of operations and cash flows. If we were unable to obtain a waiver of a default from the lenders or holders of that indebtedness, as applicable, those lenders or holders could accelerate repayment under that indebtedness, which might result in cross-acceleration of other indebtedness. An acceleration could have a material adverse impact on our business, financial condition and results of operations.
In addition, following any such default, the agent for the lenders under the relevant credit facility or such future credit or other borrowing facility could assume control of the disposition of any or all of our assets, including the selection of such assets to be disposed and the timing of such disposition, which could have a material adverse effect on our business, financial condition, results of operations and cash flows.
Lastly, as a result of any such default, we may be unable to obtain additional leverage, which could, in turn, affect our return on capital.
Our strategy involves a high degree of leverage. We intend to continue to finance our investments with borrowed money, which will magnify the potential for gain or loss on amounts invested and increases the risk of investing in us. The risks of investment in a highly leveraged fund include volatility and possible distribution restrictions.
28
The use of leverage magnifies the potential for gain or loss on amounts invested. The use of leverage is generally considered a speculative investment technique and increases the risks associated with investing in our securities. However, we have borrowed from, and may in the future issue debt securities to, banks, insurance companies and other lenders. Lenders of these funds have fixed dollar claims on our assets that are superior to the claims
of our common stockholders, and we would expect such lenders to seek recovery against our assets in the event of a default. We may pledge up to 100% of our assets and may grant a security interest in all of our assets under the terms of any debt instruments we may enter into with lenders. In addition, under the terms of our credit facilities and any borrowing facility or other debt instrument we may enter into, we are likely to be required to use the net proceeds of any investments that we sell to repay a portion of the amount borrowed under such facility or instrument before applying such net proceeds to any other uses. If the value of our assets decreases, leveraging would cause net asset value to decline more sharply than it otherwise would have had we not leveraged, thereby magnifying losses or eliminating our stake in a leveraged investment. Similarly, any decrease in our revenue or income will cause our net income to decline more sharply than it would have had we not borrowed. Such a decline would also negatively affect our ability to make dividend payments on our common stock or preferred stock. Our ability to service any debt will depend largely on our financial performance and will be subject to prevailing economic conditions and competitive pressures. In addition, our common stockholders will bear the burden of any increase in our expenses as a result of our use of leverage, including interest expenses and any increase in the base management fee payable to the Adviser.
There can be no assurance that our business will generate sufficient cash flow from operations or that future borrowings will be available to us under our credit facilities or otherwise in an amount sufficient to enable us to repay our indebtedness or to fund our other liquidity needs. We may need to refinance all or a portion of our indebtedness on or before it matures. There can be no assurance that we will be able to refinance any of our indebtedness on commercially reasonable terms or at all. If we cannot service our indebtedness, we may have to take actions such as selling assets or seeking additional equity. There can be no assurance that any such actions, if necessary, could be effected on commercially reasonable terms or at all, or on terms that would not be disadvantageous to stockholders or on terms that would not require us to breach the terms and conditions of our existing or future debt agreements.
As a BDC, we are generally required to meet a coverage ratio of total assets to total borrowings and other senior securities, which include all of our borrowings and any preferred stock that we may issue in the future, of at least 150%. If this ratio declines below 150%, we will not be able to incur additional debt and could be required to sell a portion of our investments to repay some debt when we are otherwise disadvantageous for us to do so. This could have a material adverse effect on our operations, and we may not be able to make distributions. The amount of leverage that we employ will depend on the Adviser’s assessment of market and other factors at the time of any proposed borrowing. We cannot assure stockholders that we will be able to obtain credit at all or on terms acceptable to it.
We are subject to risks associated with the current interest rate environment, and to the extent we use debt to finance our investments, changes in interest rates may affect our cost of capital and net investment income. Further, changes in LIBOR or its discontinuation may adversely affect the value of LIBOR-indexed securities, loans, and other financial obligations or extensions of credit in our portfolio.
An increase in interest rates from their comparatively low present levels may make it more difficult for our portfolio companies to service their obligations under the debt investments that we hold. Rising interest rates could also cause portfolio companies to shift cash from other productive uses to the payment of interest, which may have a material adverse effect on their business and operations and could, over time, lead to increased defaults.
In addition, concerns have been publicized that some of the member banks surveyed by the British Bankers’ Association (the “BBA”) in connection with the calculation of LIBOR across a range of maturities and currencies may have been under-reporting or otherwise manipulating the inter-bank lending rate applicable to them in order to profit on their derivatives positions or to avoid an appearance of capital insufficiency or adverse reputational or other consequences that may have resulted from reporting inter-bank lending rates higher than those they actually submitted. A number of BBA member banks have entered into settlements with their regulators and law enforcement agencies with respect to alleged manipulation of LIBOR, and investigations by regulators and governmental authorities in various jurisdictions are ongoing. These developments may have adversely affected the interest rates on securities, loans, and other financial obligations or extensions of credit whose interest payments were determined by reference to LIBOR. Any future similar developments could, in turn, reduce the value of such instruments held by or due to us.
In July 2017, the head of the United Kingdom Financial Conduct Authority (the “FCA”), which regulates LIBOR, announced that the FCA will no longer persuade or compel banks to submit rates for the calculation of LIBOR after 2021. Such announcement indicates that the continuation of LIBOR on the current basis cannot and will not be guaranteed after 2021. It appears highly likely that LIBOR will be discontinued or modified by 2021. The U.S. Federal Reserve, in conjunction with the Alternative Reference Rates Committee of the Federal Reserve Board, a steering committee comprised of large U.S. financial institutions, is considering replacing U.S. dollar LIBOR with a new index calculated by short-term repurchase agreements, backed by U.S. Treasury securities (the “Secured Overnight Financing Rate,” or “SOFR”). Although there have been a few issuances utilizing SOFR or the Sterling Over Night Index Average, an alternative reference rate that is based on transactions, it is unknown whether this or any other alternative reference rates will attain market acceptance as replacements for LIBOR. The unavailability of LIBOR presents risks to us, including the risk that any pricing or
29
adjustments to our investments resulting from a substitute reference rate may adversely affect our performance or NAV. If LIBOR ceases to exist, we may need to renegotiate any credit agreements extending beyond 2021 with our prospective portfolio companies that utilize LIBOR as a factor in determining the interest rate. There is currently no definitive information regarding the future utilization of LIBOR or of any particular replacement rate. As such, the potential effect of any such event on our cost of capital and net investment income cannot yet be determined.
There can be no assurance that all of the LIBOR-indexed securities, loans, and other financial obligations or extensions of credit in which we are invested do or will include, or be amended to include, an alternative rate-setting methodology to be used in the event that LIBOR ceases to exist. In addition, any further changes or reforms to the determination or supervision of LIBOR may result in a sudden or prolonged increase or decrease in reported LIBOR, which could have an adverse impact on the market for or value of any LIBOR- linked securities, loans, and other financial obligations or extensions of credit held by or due to us or on our overall financial condition or results of operations.
To the extent we borrow money to make investments, our net investment income will depend, in part, upon the difference between the rate at which we borrow funds and the rate at which we invest those funds. As a result, we can offer no assurance that a significant change in market interest rates would not have a material adverse effect on our net investment income in the event we use debt to finance our investments. In periods of rising interest rates, our cost of funds would increase, which could reduce our net investment income.
In addition, a rise in the general level of interest rates typically leads to higher interest rates applicable to our debt investments. Accordingly, an increase in interest rates may result in an increase of the amount of our pre-incentive fee net investment income, which could make it easier for us to meet or exceed the Hurdle Amount and, as a result, increase the in incentive fees payable to the Adviser.
It remains unclear whether the cessation of LIBOR will be delayed due to COVID-19 or what form any delay may take, and there are no assurances that there will be a delay. It is also unclear what the duration and severity of COVID-19 will be, and whether this will impact LIBOR transition planning. COVID-19 may also slow regulators’ and others’ efforts to develop and implement alternative reference rates, which could make LIBOR transition planning more difficult, particularly if the cessation of LIBOR is not delayed but an alternative reference rate does not emerge as industry standard. In anticipation of the cessation of LIBOR, we may need to renegotiate credit facilities and any credit agreements extending beyond 2021 with our prospective portfolio companies that utilize LIBOR as a factor in determining the interest rate or rely on certain fallback provisions that could cause interest rates to shift to a base rate plus a margin. Any such renegotiations may have a material adverse effect on our business, financial condition and results of operations, including as a result of changes in interest rates payable to us by our portfolio companies or payable by us under our credit facilities.
We are and may be subject to restrictions under our credit facilities and any future credit or other borrowing facility that could adversely impact our business.
Our credit facilities, and any future borrowing facility, may be backed by all or a portion of our loans and securities on which the lenders may have a security interest. We currently pledge and may pledge up to 100% of our assets and may grant a security interest in all of our assets under the terms of any debt instrument we enter into with lenders. Like with its current credit facilities, we expect that any future security interests we grant will be set forth in a pledge and security agreement and evidenced by the filing of financing statements by the agent for the lenders, and we expect that the custodian for our securities serving as collateral for such loan would include in the custodian’s electronic systems notices indicating the existence of such security interests and, following notice of occurrence of an event of default, if any, and during its continuance, will only accept transfer instructions with respect to any such securities from the lender or its designee. Under our current credit facilities, we are subject to customary events of default. If we were to default under the terms of our current credit facilities and any future borrowing facility, the agent for the applicable lenders would be able to assume control of the timing of disposition of the assets pledged under the facility, which could include any or all of our assets securing such debt. Such remedial action would have a material adverse effect on our business, financial condition, results of operations and cash flows.
In addition, the security interests as well as negative covenants under its credit facilities, or any other future borrowing facility, may limit our ability to create liens on assets to secure additional debt and may make it difficult for us to restructure or refinance indebtedness at or prior to maturity or obtain additional debt or equity financing. In addition, if our borrowing base under our credit facilities or any other borrowing facility were to decrease, we would be required to secure additional assets in an amount equal to any borrowing base deficiency. In the event that all of our assets are secured at the time of such a borrowing base deficiency, we could be required to repay advances under the relevant credit facility or any other borrowing facility or make deposits to a collection account, either of which could have a material adverse impact on our ability to fund future investments and to pay dividends.
In addition, under our credit facilities, or any other future borrowing facility, we may be limited as to how borrowed funds may be used, which may include restrictions on geographic and industry concentrations, loan size, payment frequency and status, average life, collateral interests and investment ratings, as well as regulatory restrictions on leverage which may affect the amount of funding that may be obtained.
30
There may also be certain requirements relating to portfolio performance, including required minimum portfolio yield and limitations on delinquencies and charge-offs, a violation of which could limit further advances and, in some cases, result in an event of default. An event of default under our credit facilities or any other borrowing facility could result in an accelerated maturity date for all amounts outstanding thereunder, which could have a material adverse effect on our business and financial condition. This could reduce our revenues and, by delaying any cash payment allowed to us under the relevant credit facility or any other borrowing facility until the lenders have been paid in full, reduce our liquidity and cash flow and impair its ability to grow its business and maintain its qualification as a RIC.
We may be the target of litigation.
We may be the target of securities litigation in the future, particularly if the value of shares of our common stock fluctuates significantly. We could also generally be subject to litigation, including derivative actions by stockholders. In addition, our investment activities subject it to litigation relating to the bankruptcy process and the normal risks of becoming involved in litigation by third parties. This risk is somewhat greater where we exercise control or significant influence over a portfolio company’s direction. Any litigation could result in substantial costs and divert management’s attention and resources from our business and cause a material adverse effect on our business, financial condition and results of operations.
There is a risk that investors in our common stock may not receive dividends or that our dividends may not grow over time and that investors in our debt securities may not receive all of the interest income to which they are entitled.
We intend to make distributions on a quarterly basis to our stockholders out of assets legally available for distribution. We cannot assure you that we will achieve investment results that will allow us to make a specified level of cash distributions or year-to-year increases in cash distributions. If we declare a dividend and if more stockholders opt to receive cash distributions rather than participate in its reinvestment plan, we may be forced to sell some of its investments in order to make cash dividend payments.
In addition, due to the asset coverage test applicable to us as a BDC, we may be limited in our ability to make distributions. Certain of our credit facilities may also limit our ability to declare dividends if we default under certain provisions. Further, if we invest a greater amount of assets in equity securities that do not pay current dividends, it could reduce the amount available for distribution.
The above-referenced restrictions on distributions may also inhibit our ability to make required interest payments to holders of our debt, which may cause a default under the terms of its debt agreements. Such a default could materially increase our cost of raising capital, as well as cause us to incur penalties under the terms of its debt agreements.
If we do not invest a sufficient portion of our assets in qualifying assets, we could fail to qualify as a BDC or be precluded from investing according to our current business strategy.
To maintain its status as a BDC, we are not permitted to acquire any assets other than “qualifying assets” specified in the 1940 Act unless, at the time the acquisition is made, at least 70% of our total assets are qualifying assets (with certain limited exceptions). Subject to certain exceptions for follow-on investments and distressed companies, an investment in an issuer that has outstanding securities listed on a national securities exchange may be treated as a qualifying asset only if such issuer has a common equity market capitalization that is less than $250 million at the time of such investment. Subject to certain exceptions for follow-on investments and investments in distressed companies, an investment in an issuer that has outstanding securities listed on a national securities exchange may be treated as qualifying assets only if such issuer has a common equity market capitalization that is less than $250 million at the time of such investment.
We may be precluded from investing in what we believe are attractive investments if such investments are not qualifying assets for purposes of the 1940 Act. If we do not invest a sufficient portion of our assets in qualifying assets, we could violate the 1940 Act provisions applicable to BDCs. As a result of such violation, specific rules under the 1940 Act could prevent us, for example, from making follow-on investments in existing portfolio companies (which could result in the dilution of our position) or could require us to dispose of investments at inappropriate times in order to come into compliance with the 1940 Act. If we need to dispose of such investments quickly, it could be difficult to dispose of such investments on favorable terms. We may not be able to find a buyer for such investments and, even if we do find a buyer, we may have to sell the investments at a substantial loss. Any such outcomes would have a material adverse effect on our business, financial condition, results of operations and cash flows.
The majority of our portfolio investments are recorded at fair value as determined in good faith by our Board and, as a result, there may be uncertainty as to the value of our portfolio investments.
Many of our portfolio investments are in the form of loans and securities that are not publicly traded. The fair value of loans, securities and other investments that are not publicly traded may not be readily determinable, and we will value these investments at
fair value
31
as determined in good faith by our Board, including to reflect significant events affecting the value of our investments. Most, if not all, of our investments (other than cash and cash equivalents) will be classified as Level 3 under the FASB Accounting Standards Codification, Fair Value Measurements and Disclosures (ASC Topic 820). This means that our portfolio valuations will be based on unobservable inputs and our own assumptions about how market participants would price the asset or liability in question. We expect that inputs into the determination of fair value of our portfolio investments will require significant management judgment or estimation. Even if observable market data are available, such information may be the result of consensus pricing information or broker quotes, which include a disclaimer that the broker would not be held to such a price in an actual transaction. The non-binding nature of consensus pricing and/or quotes accompanied by disclaimers materially reduces the reliability of such information. We retain the services of one or more independent service providers to review the valuation of these loans and securities. However, the ultimate determination of fair value will be made by our Board and not by such third-party valuation firm. The types of factors that our Board may take into account in determining the fair value of our investments generally include, as appropriate, comparison to publicly-traded securities including such factors as yield, maturity and measures of credit quality, the enterprise value of a portfolio company, the nature and realizable value of any collateral, the portfolio company’s ability to make payments and its earnings and discounted cash flow, the markets in which the portfolio company does business, changes in the interest rate environment and the credit markets generally that may affect the price at which similar investments may be made in the future, comparisons to publicly traded companies, relevant credit market indices and other relevant factors.
Because such valuations, and particularly valuations of private securities and private companies, are inherently uncertain, may fluctuate over short periods of time and may be based on estimates, our determinations of fair value may differ materially from the values that would have been used if a ready market for these loans and securities existed. Also, since these valuations are, to a large extent, based on estimates, comparisons and qualitative evaluations of private information, our fair valuation process could make it more difficult for investors to accurately value our investments and could lead to undervaluation or overvaluation of our securities. In addition, the valuation of these types of securities may result in substantial write-downs and earnings volatility. Also, privately held companies frequently have less diverse product lines and smaller market presence than larger public competitors.
Our NAV could be adversely affected if our determinations regarding the fair value of our investments were materially higher than the values that we ultimately realize upon the disposal of such loans and securities. Further, our NAV as of a particular date may be materially greater than or less than the value that would be realized if our assets were to be liquidated as of such date. For example, if we were required to sell a certain asset or all or a substantial portion of our assets on a particular date, the actual price that we would realize upon the disposition of such asset or assets could be materially less than the value of such asset or assets as reflected in our NAV. Volatile market conditions could also cause reduced liquidity in the market for certain assets, which could result in liquidation values that are materially less than the values of such assets as reflected in the NAV.
We will adjust quarterly the valuation of our portfolio to reflect our Board’s determination of the fair value of each investment in our portfolio. Any changes in fair value are recorded in our statement of operations as net change in unrealized appreciation or depreciation.
We may experience fluctuations in our quarterly operating results.
We could experience fluctuations in our quarterly operating results due to a number of factors, including the interest rate payable on the loans and debt securities we acquire, the default rate on such loans and securities, the level of our expenses, variations in and the timing of the recognition of realized and unrealized gains or losses, the degree to which we encounter competition in our markets and general economic conditions. In light of these factors, results for any period should not be relied upon as being indicative of performance in future periods.
New or modified laws or regulations governing our operations may adversely affect our business.
We and our portfolio companies are subject to regulation by laws at the U.S. federal, state and local levels. These laws and regulations, as well as their interpretation, may change from time to time, including as the result of interpretive guidance or other directives from the U.S. President and others in the executive branch, and new laws, regulations and interpretations may also come into effect. Any such new or changed laws or regulations could have a material adverse effect on our business. In addition, if we do not comply with applicable laws and regulations, we could lose any licenses that we then hold for the conduct of its business and may be subject to civil fines and criminal penalties.
Additionally, changes to the laws and regulations governing our operations, including those associated with RICs, may cause us to alter our investment strategy in order to avail our self of new or different opportunities or result in the imposition of corporate-level taxes on us. Such changes could result in material differences to the strategies and plans set forth therein and may shift our investment focus from the areas of Crescent’s expertise to other types of investments in which Crescent may have little or no expertise or experience. Any such changes, if they occur, could have a material adverse effect on our results of operations and the value of an investor’s investment. If we invest in commodity interests in the future, the Adviser may determine not to use investment strategies that trigger additional regulation by the U.S. Commodity Futures Trading Commission (“CFTC”) or may determine to operate subject to CFTC regulation, if applicable. If we or the Adviser were to operate subject to CFTC regulation, we may incur additional expenses and would be subject to additional regulation.
32
On March 23, 2018, the SBCAA was signed into law. The SBCAA, among other things, modified the applicable provisions of the 1940 Act to reduce the required asset coverage ratio applicable to a BDC from 200% to 150% subject to certain approval, time and disclosure requirements.
On May 24, 2018, President Trump signed into law the Economic Growth, Regulatory Relief, and Consumer Protection Act, which increased from $50 billion to $250 billion the asset threshold for designation of “systemically important financial institutions” or “SIFIs” subject to enhanced prudential standards set by the Federal Reserve Board, staggering application of this change based on the size and risk of the covered bank holding company. On May 30, 2018, the Federal Reserve Board voted to consider changes to the Volcker Rule that would loosen compliance requirements for all banks.
On January 20, 2021, Mr. Joseph R. Biden was inaugurated as President of the United States. As a candidate, President Biden called for significant policy changes and the reversal of several of the prior presidential administration’s policies, including significant changes to U.S. fiscal, tax, trade, healthcare, immigration, foreign, and government regulatory policy. In this regard, there is significant uncertainty with respect to legislation, regulation and government policy at the federal level, as well as the state and local levels. Recent events have created a climate of heightened uncertainty and introduced new and difficult-to-quantify macroeconomic and political risks with potentially far-reaching implications. There has been a corresponding meaningful increase in the uncertainty surrounding interest rates, inflation, foreign exchange rates, trade volumes and fiscal and monetary policy. To the extent the U.S. Congress or the current presidential administration implements changes to U.S. policy, those changes may impact, among other things, the U.S. and global economy, international trade and relations, unemployment, immigration, corporate taxes, healthcare, the U.S. regulatory environment, inflation and other areas.
Further, there has been increasing commentary amongst regulators and intergovernmental institutions, including the Financial Stability Board and International Monetary Fund, on the topic of so called “shadow banking” (a term generally taken to refer to credit intermediation involving entities and activities outside the regulated banking system). We are an entity outside the regulated banking system and certain of our activities may be argued to fall within this definition and, in consequence, may be subject to regulatory developments. As a result, we and the Adviser could be subject to increased levels of oversight and regulation. This could increase costs and limit operations. In an extreme eventuality, it is possible that such regulations could render our continued operation unviable and lead to our premature termination or restructuring.
The United Kingdom referendum decision to leave the European Union may create significant risks and uncertainty for global markets and our investments.
On January 31, 2020, the United Kingdom (“UK”) officially withdrew from the European Union (“EU”) and the two sides entered into a transition phase, where the UK effectively remained in the EU from an economic perspective, but no longer had any political representation in the EU parliament. The transition period concluded on December 31, 2020, and EU law no longer applies in the UK.
On December 30, 2020, the UK and the EU signed an EU-UK Trade and Cooperation Agreement (“UK/EU Trade Agreement”), which went into effect on January 1, 2021 and sets out the foundation of the economic and legal framework for trade between the UK and the EU. As the UK/EU Trade Agreement is a new legal framework, the implementation of the UK/EU Trade Agreement may result in uncertainty in its application and periods of volatility in both the UK and wider European markets. The UK’s exit from the EU is expected to result in additional trade costs and disruptions in this trading relationship. Furthermore, there is the possibility that either party may impose tariffs on trade in the future in the event that regulatory standards between the EU and the UK diverge. The terms of the future relationship may cause continued uncertainty in the global financial markets, and adversely affect our ability, and the ability of our portfolio companies, to execute our respective strategies and to receive attractive returns.
In particular, currency volatility may mean that our returns and the returns of our portfolio companies will be adversely affected by market movements and may make it more difficult, or more expensive, for us to implement appropriate currency hedging. Potential declines in the value of the British Pound and/or the euro against other currencies, along with the potential downgrading of the UK’s sovereign credit rating, may also have an impact on the performance of any of our portfolio companies located in the UK or Europe.
In addition to the effects on our investments in European issuers, the unavoidable uncertainties and events related to Brexit could negatively affect the value and liquidity of the our other investments, increase taxes and costs of business and cause volatility in currency exchange rates and interest rates. European, UK or worldwide political, regulatory, economic or market conditions and could contribute to instability in political institutions, regulatory agencies and financial markets. Brexit could also lead to legal uncertainty and politically divergent national laws and regulations as the new relationship between the UK and EU is further defined and as the UK determines which EU laws to replace or replicate. In addition, Brexit could lead to further disintegration of the EU and related political stresses (including those related to sentiment against cross border capital movements and activities of investors like us), prejudice to financial services businesses that are conducting business in the EU and which are based in the UK, legal uncertainty regarding achievement of compliance with applicable financial and commercial laws and regulations in view of the expected steps to be taken pursuant to or in contemplation of Brexit. Any of these effects of Brexit, and others that cannot be anticipated, could adversely affect the Company’s business, results of operations and financial condition.
33
Our Board may change our investment objectives, operating policies and strategies without prior notice or stockholder approval.
Our Board has the authority, except as otherwise provided in the 1940 Act, to modify or waive certain of our investment objectives, operating policies and strategies without prior notice and without stockholder approval. However, absent stockholder approval, we may not change the nature of our business so as to cease to be, or withdraw our election as, a BDC. Under Maryland law, we also cannot be dissolved without prior stockholder approval. We cannot predict the effect any changes to our current operating policies and strategies would have on our business, operating results and the market price of its common stock. Nevertheless, any such changes could adversely affect our business and impair our ability to make distributions to our stockholders.
The Adviser and the Administrator each have the ability to resign on 60 days’ notice, and we may not be able to find a suitable replacement within that time, resulting in a disruption in operations that could adversely affect our financial condition, business and results of operations.
The Adviser has the right under the Investment Advisory Agreement to resign as our investment adviser at any time upon not less than 60 days’ written notice, whether we have found a replacement or not. Similarly, the Administrator has the right under the Administration Agreement to resign at any time upon not less than 60 days’ written notice, whether we have found a replacement or not. If the Adviser or the Administrator were to resign, we may not be able to find a new investment adviser or administrator, as applicable, or hire internal management with similar expertise and ability to provide the same or equivalent services on acceptable terms within 60 days, or at all. If we are unable to do so quickly, our operations are likely to experience a disruption, our financial condition, business and results of operations as well as our ability to pay distributions to our stockholders are likely to be adversely affected and the market price of our shares may decline. In addition, the coordination of our internal management and investment or administrative activities, as applicable, is likely to suffer if we are unable to identify and reach an agreement with a single institution or group of executives having the expertise possessed by the Adviser and the Administrator, as applicable. Even if we are able to retain a comparable service provider or individuals performing such services are retained, whether internal or external, their integration and lack of familiarity with our investment objectives may result in additional costs and time delays that may adversely affect our business, financial condition, results of operations and cash flows.
In addition, if the Adviser resigns or is terminated, we would lose the benefits of our relationship with Crescent, including the use of its communication and information systems, insights into our existing portfolio, market expertise, sector and macroeconomic views and due diligence capabilities, as well as any investment opportunities referred to us by Crescent, and we would be required to change our name, which may have a material adverse impact on its operations.
We are highly dependent on information systems, and systems failures or cyber-attacks could significantly disrupt its business, which may, in turn, negatively affect the value of shares of our common stock and our ability to pay distributions.
Our business is highly dependent on Crescent’s communications and information systems, to which we have access through the Administrator. In addition, certain of these systems are provided to Crescent by third-party service providers. Any failure or interruption of such systems, including as a result of the termination of an agreement with any such third-party service provider, could cause delays or other problems in our activities. This, in turn, could have a material adverse effect on our operating results and negatively affect the market price of our Common Stock and its ability to pay dividends to its stockholders.
Cybersecurity risks and cyber incidents may adversely affect our business by causing a disruption to our operations, a compromise or corruption of its confidential information and/or damage to its business relationships.
A cyber incident is considered to be any adverse event that threatens the confidentiality, integrity or availability of our information resources. These incidents may be an intentional attack or an unintentional event and could involve gaining unauthorized access to our information systems for purposes of misappropriating assets, stealing confidential information, corrupting data or causing operational disruption. The result of these incidents may include disrupted operations, misstated or unreliable financial data, liability for stolen information, misappropriation of assets, increased cybersecurity protection and insurance costs, litigation and damage to our business relationships. This could result in significant losses, reputational damage, litigation, regulatory fines or penalties, or otherwise adversely affect our business, financial condition or results of operations. In addition, we may be required to expend significant additional resources to modify its protective measures and to investigate and remediate vulnerabilities or other exposures arising from operational and security risks. We face risks posed to our information systems, both internal and those provided to it by third-party service providers. We, the Adviser and its affiliates have implemented processes, procedures and internal controls to help mitigate cybersecurity risks and cyber intrusions, but these measures, as well as our increased awareness of the nature and extent of a risk of a cyber-incident, may be ineffective and do not guarantee that a cyber-incident will not occur or that our financial results, operations or confidential information will not be negatively impacted by such an incident.
34
Third parties with which we do business (including those that provide services to us) may also be sources or targets of cybersecurity or other technological risks. We outsource certain functions and these relationships allow for the storage and processing of our information and assets, as well as certain investor, counterparty, employee and borrower information.
While we engage in actions to reduce our exposure resulting from outsourcing, ongoing threats may result in unauthorized access, loss, exposure or destruction of data, or other cybersecurity incidents, with increased costs and other consequences, including those described above. Privacy and information security laws and regulation changes, and compliance with those changes, may also result in cost increases due to system changes and the development of new administrative processes.
We and the Adviser are subject to regulations and SEC oversight. If we or the Adviser fail to comply with applicable requirements, it may adversely impact our results relative to companies that are not subject to such regulations.
As a BDC, we are subject to a portion of the 1940 Act. In addition, we have elected to be treated, and intend to operate in a manner so as to continuously qualify, as a RIC in accordance with the requirements of Subchapter M of the Code. The 1940 Act and the Code impose various restrictions on the management of a BDC, including related to portfolio construction, asset selection, and tax. These restrictions may reduce the chances that we will achieve the same results as other vehicles managed by Crescent and/or the Adviser.
However, if we do not maintain our status as a BDC, we would be subject to regulation as a registered closed-end investment company under the 1940 Act. As a registered closed-end investment company, we would be subject to substantially more regulatory restrictions under the 1940 Act which would significantly decrease our operating flexibility.
In addition to these and other requirements applicable to us, the Adviser is subject to regulatory oversight by the SEC. To the extent the SEC raises concerns or has negative findings concerning the manner in which we or the Adviser operates, it could adversely affect our business.
We are subject to risks related to corporate social responsibility.
Our business (including that of our portfolio companies) faces increasing public scrutiny related to environmental, social and governance (“ESG”) activities. We risk damage to our brand and reputation if we fail to act responsibly in a number of areas, such as diversity, equity and inclusion, environmental stewardship, support for local communities, corporate governance and transparency and considering ESG factors in our investment processes. Adverse incidents with respect to ESG activities could impact the value of our brand, our relationship with existing and future portfolio companies, the cost of our operations and relationships with investors, all of which could adversely affect our business and results of operations.
Additionally, new regulatory initiatives related to ESG that are applicable to us and our portfolio companies could adversely affect our business. In May 2018, the European Commission adopted an “action plan on financing sustainable growth.” The action plan is, among other things, designed to define and reorient investment toward sustainability. The action plan contemplates: establishing EU labels for green financial products; increasing disclosure requirements in the financial services sector around ESG and strengthening the transparency of companies on their ESG policies and introducing a ‘green supporting factor’ in the EU prudential rules for banks and insurance companies to incorporate climate risks into banks’ and insurance companies’ risk management policies. There is a risk that a significant reorientation in the market following the implementation of these and further measures could be adverse to our portfolio companies if they are perceived to be less valuable as a consequence of, e.g., their carbon footprint or “greenwashing” (i.e., the holding out of a product as having green or sustainable characteristics where this is not, in fact, the case). We and our portfolio companies are subject to the risk that similar measures might be introduced in other jurisdictions in the future.
Additionally, compliance with any new laws or regulations increases our regulatory burden and could make compliance more difficult and expensive, affect the manner in which we or our portfolio companies conduct our businesses and adversely affect our profitability.
Risks Relating to Our Investments
Economic recessions or downturns could impair our portfolio companies, and defaults by our portfolio companies will harm our operating results.
Many of the portfolio companies in which we expect to make investments are likely to be susceptible to economic slowdowns or recessions and may be unable to repay their loans during such periods. Therefore, the number of our non-performing assets is likely to increase and the value of our portfolio is likely to decrease during such periods. Adverse economic conditions may also decrease the value of collateral securing some of our loans and debt securities and the value of our equity investments. If the value of collateral underlying our loan declines during the term of the loan, a portfolio company may not be able to obtain the necessary funds to repay the loan at maturity through refinancing. Decreasing collateral value may hinder a portfolio company’s ability to refinance our loan because the underlying collateral cannot satisfy the debt service coverage requirements necessary to obtain new financing. Thus, economic slowdowns or recessions could lead to financial losses in our portfolio and a decrease in revenues, net income and assets. Unfavorable economic conditions also could increase our funding costs, limit its access to the capital markets or result in a decision by
35
lenders not to extend credit to us. We consider a number of factors in making our investment decisions, including, but not limited to, the financial condition and prospects of a portfolio company and its ability to repay our loan. Unfavorable economic conditions could negatively affect the valuations of our portfolio companies and, as a result, make it more difficult for such portfolio companies to repay or refinance our loan. Therefore, these events could prevent us from increasing our investments and harm our operating results. A portfolio company’s failure to satisfy financial or operating covenants imposed by us or other lenders could lead to defaults and, potentially, acceleration of the time when the loans are due, termination of the portfolio company’s loans and foreclosure on its assets, which could trigger cross-defaults under other agreements and jeopardize its ability to meet its obligations under the loans and debt securities that we hold. We may incur expenses to the extent necessary to seek recovery upon default or to negotiate new terms with a defaulting portfolio company, which may include the waiver of certain financial covenants. Furthermore, if one of our portfolio companies were to file for bankruptcy protection, depending on the facts and circumstances, including the extent to which we actually provide significant managerial assistance to that portfolio company, a bankruptcy court might re-characterize our debt holding and subordinate all or a portion of our claim to claims of other creditors, even though we may have structured our investment as senior secured debt.
Our portfolio companies may be unable to repay or refinance outstanding principal on their loans at or prior to maturity, and rising interests rates may make it more difficult for portfolio companies to make periodic payments on their loans.
Our portfolio companies may be unable to repay or refinance outstanding principal on their loans at or prior to maturity. This risk and the risk of default is increased to the extent that the loan documents do not require the portfolio companies to pay down the outstanding principal of such debt prior to maturity. In addition, if general interest rates rise, there is a risk that our portfolio companies will be unable to pay escalating interest amounts, which could result in a default under their loan documents with us. Any failure of one or more portfolio companies to repay or refinance its debt at or prior to maturity or the inability of one or more portfolio companies to make ongoing payments following an increase in contractual interest rates could have a material adverse effect on our business, financial condition, results of operations and cash flows.
We may hold the debt securities of leveraged companies.
Investment in leveraged companies involves a number of significant risks. Leveraged companies in which we invest may have limited financial resources and may be unable to meet their obligations under their loans and debt securities that we hold. Such developments may be accompanied by a deterioration in the value of any collateral and a reduction in the likelihood of our realizing any guarantees that it may have obtained in connection with its investment. Smaller leveraged companies also may have less predictable operating results and may require substantial additional capital to support their operations, finance their expansion or maintain their competitive position.
Leveraged companies may experience bankruptcy or similar financial distress. The bankruptcy process has a number of significant inherent risks. Many events in a bankruptcy proceeding are the product of contested matters and adversary proceedings and are beyond the control of the creditors. A bankruptcy filing by a portfolio company may adversely and permanently affect the portfolio company. If the proceeding is converted to a liquidation, the value of the portfolio company may not equal the liquidation value that was believed to exist at the time of the investment. The duration of a bankruptcy proceeding is also difficult to predict, and a creditor’s return on investment can be adversely affected by delays until the plan of reorganization or liquidation ultimately becomes effective.
The administrative costs in connection with a bankruptcy proceeding are frequently high and would be paid out of the debtor’s estate prior to any return to creditors. Because the standards for classification of claims under bankruptcy law are vague, our influence with respect to the class of securities or other obligations that we own may be lost by increases in the number and amount of claims in the same class or by different classification and treatment. In the early stages of the bankruptcy process, it is often difficult to estimate the extent of, or even to identify, any contingent claims that might be made. In addition, certain claims that have priority by law (for example, claims for taxes) may be substantial.
We typically invest in middle-market companies, which involves higher risk than investments in large companies.
Investment in private and middle-market companies involves a number of significant risks. Generally, little public information exists about these companies, and we will rely on the ability of Crescent’s investment professionals to obtain adequate information to evaluate the potential returns from investing in these companies. If we are unable to uncover all material information about these companies, we may not make a fully informed investment decision and may lose money on its investments. Middle-market companies may have limited financial resources and may be unable to meet their obligations under their loans and debt securities that we hold, which may be accompanied by a deterioration in the value of any collateral and a reduction in the likelihood of our realizing any guarantees that it may have obtained in connection with its investment. In addition, such companies typically have shorter operating histories, narrower product lines and smaller market shares than larger businesses, which tend to render them more vulnerable to competitors’ actions and market conditions, as well as general economic downturns. Additionally, middle-market companies are more likely to depend on the management talents and efforts of a small group of persons. Therefore, the death, disability, resignation or termination of one or more of these persons could have a material adverse impact on one or more of the portfolio companies we invest
36
in and, in turn, on us. Middle-market companies also may be parties to litigation and may be engaged in rapidly changing businesses with products subject to a substantial risk of obsolescence. In addition, our executive officers, directors and the Adviser may, in the ordinary course of business, be named as defendants in litigation arising from our investments in portfolio companies.
In addition, investment in middle-market companies involves a number of other significant risks, including:
| • | they typically have shorter operating histories, narrower product lines and smaller market shares than larger businesses, which tend to render them more vulnerable to competitors’ actions and market conditions, as well as general economic downturns; |
| • | they generally have less predictable operating results, may from time to time be parties to litigation, may be engaged in rapidly changing businesses with products subject to a substantial risk of obsolescence, and may require substantial additional capital to support their operations, finance expansion or maintain their competitive position; |
| • | changes in laws and regulations, as well as their interpretations, may adversely affect their business, financial structure or prospects; and |
| • | they may have difficulty accessing the capital markets to meet future capital needs, which may limit their ability to grow or to repay their outstanding indebtedness upon maturity. |
The due diligence process that the Adviser undertakes in connection with our investments may not reveal all the facts that may be relevant in connection with an investment.
The Adviser’s due diligence may not reveal all of a company’s liabilities and may not reveal other weaknesses in its business. There can be no assurance that our due diligence process will uncover all relevant facts that would be material to an investment decision. Before making an investment in, or a loan to, a company, the Adviser will assess the strength and skills of the company’s management team and other factors that it believes are material to the performance of the investment. In making the assessment and otherwise conducting customary due diligence, the Adviser will rely on the resources available to it and, in some cases, an investigation by third parties. This process is particularly important and highly subjective with respect to newly organized entities because there may be little or no information publicly available about the entities. We may make investments in, or loans to, companies, including middle market companies, which are not subject to public company reporting requirements, including requirements regarding preparation of financial statements, and will, therefore, depend upon the compliance by investment companies with their contractual reporting obligations and the ability of the Adviser’ investment professionals to obtain adequate information to evaluate the potential returns from investing in these companies. If we and the Adviser are unable to uncover all material information about these companies, we may not make a fully informed investment decision and may lose money on its investments. As a result, the evaluation of potential investments and the ability to perform due diligence on and effective monitoring of investments may be impeded, and we may not realize the returns that it expects on any particular investment. In the event of fraud by any company in which we invest or with respect to which we make a loan, we may suffer a partial or total loss of the amounts invested in that company.
The lack of liquidity in our investments may adversely affect our business.
All of our assets may be invested in illiquid loans and securities, and a substantial portion of our investments in leveraged companies will be subject to legal and other restrictions on resale or will otherwise be less liquid than more broadly traded public securities. The illiquidity of these investments may make it difficult for us to sell such investments if the need arises. In addition, if we are required to liquidate all or a portion of its portfolio quickly, we may realize significantly less than the value at which it has previously recorded its investments. Some of our debt investments may contain interest rate reset provisions that may make it more difficult for the borrowers to make periodic interest payments to us. In addition, some of our debt investments may not pay down principal until the end of their lifetimes, which could result in a substantial loss to us if the portfolio companies are unable to refinance or repay their debts at maturity.
We may invest in high yield debt, or junk bonds, which has greater credit and liquidity risk than more highly rated debt obligations.
We may also invest in debt securities which will not be rated by any rating agency and, if they were rated, would be rated as below investment grade quality. Below investment grade securities, which are often referred to as “junk,” have predominantly speculative characteristics with respect to the issuer’s capacity to pay interest and repay principal. They may also be illiquid and difficult to value.
Price declines and illiquidity in the corporate debt markets may adversely affect the fair value of our portfolio investments, reducing NAV through increased net unrealized depreciation.
As a BDC, we are required to carry its investments at market value or, if no market value is ascertainable, at fair value as determined in good faith by the our Board, as described above in “ —Risks Relating to our Business and Structure—The majority of our portfolio investments are recorded at fair value as determined in good faith by the our Board and, as a result, there may be uncertainty as to the value of our portfolio investments.”
37
When an external event such as a purchase transaction, public offering or subsequent equity sale occurs, we use the pricing indicated by the external event to corroborate our valuation. While most of our investments are not publicly traded, applicable accounting standards require us to assume as part of its valuation process that its investments are sold in a principal market to market participants (even if we plan on holding an investment through its maturity). As a result, volatility in the capital markets can also adversely affect our investment valuations. We record decreases in the market values or fair values of our investments as unrealized depreciation. Declines in prices and liquidity in the corporate debt markets may result in significant net unrealized depreciation in our portfolio. The effect of all of these factors on our portfolio may reduce our NAV by increasing net unrealized depreciation in our portfolio. Depending on market conditions, we could incur substantial realized losses and may suffer additional unrealized losses in future periods, which could have a material adverse effect on our business, financial condition, results of operations and cash flows.
Our failure to make follow-on investments in our portfolio companies could impair the value of our portfolio.
Following an initial investment in a portfolio company, we may make additional investments in that portfolio company as “follow-on” investments, in seeking to:
| • | increase or maintain in whole or in part our position as a creditor or equity ownership percentage in a portfolio company; |
| • | exercise warrants, options or convertible securities that were acquired in the original or subsequent financing; or |
| • | preserve or enhance the value of our investment. |
We have discretion to make follow-on investments, subject to the availability of capital resources. Failure on our part to make follow-on investments may, in some circumstances, jeopardize the continued viability of a portfolio company and our initial investment, or may result in a missed opportunity for us to increase our participation in a successful operation.
Even if we have sufficient capital to make a desired follow-on investment, we may elect not to make a follow-on investment because we may not want to increase its level of risk, because we prefer other opportunities or because we are inhibited by compliance with BDC requirements of the 1940 Act or the desire to maintain our qualification as a RIC.
Additionally, certain loans that we may make to portfolio companies may be secured on a second priority basis by the same collateral securing senior secured debt of such companies. The first priority liens on the collateral will secure the portfolio company’s obligations under any outstanding senior debt and may secure certain other future debt that may be permitted to be incurred by the portfolio company under the agreements governing the loans. The holders of obligations secured by first priority liens on the collateral will generally control the liquidation of, and be entitled to receive proceeds from, any realization of the collateral to repay their obligations in full before us. In addition, the value of the collateral in the event of liquidation will depend on market and economic conditions, the availability of buyers and other factors. There can be no assurance that the proceeds, if any, from sales of all of the collateral would be sufficient to satisfy the loan obligations secured by the second priority liens after payment in full of all obligations secured by the first priority liens on the collateral. If such proceeds were not sufficient to repay amounts outstanding under the loan obligations secured by the second priority liens, then we, to the extent not repaid from the proceeds of the sale of the collateral, will only have an unsecured claim against the portfolio company’s remaining assets, if any.
We may also make unsecured loans to portfolio companies, meaning that such loans will not benefit from any interest in collateral of such companies. Liens on such portfolio companies’ collateral, if any, will secure the portfolio company’s obligations under its outstanding secured debt and may secure certain future debt that is permitted to be incurred by the portfolio company under its secured loan agreements. The holders of obligations secured by such liens will generally control the liquidation of, and be entitled to receive proceeds from, any realization of such collateral to repay their obligations in full before us. In addition, the value of such collateral in the event of liquidation will depend on market and economic conditions, the availability of buyers and other factors. There can be no assurance that the proceeds, if any, from sales of such collateral would be sufficient to satisfy our unsecured loan obligations after payment in full of all secured loan obligations. If such proceeds were not sufficient to repay the outstanding secured loan obligations, then our unsecured claims would rank equally with the unpaid portion of such secured creditors’ claims against the portfolio company’s remaining assets, if any. Additionally, we invest in unitranche loans (loans that combine both senior and mezzanine debt, generally in a first lien position), which may provide for a waterfall of cash flow priority between different lenders in the unitranche loan. In certain instances, we may find another lender to provide the “first out” portion of such loan and retain the “last out” portion of such loan, in which case the “first out” portion of the loan would generally receive priority with respect to repayment of principal, interest and any other amounts due thereunder over the “last out” portion of the loan that we would continue to hold.
The rights we may have with respect to the collateral securing the loans we make to our portfolio companies with senior debt outstanding may also be limited pursuant to the terms of one or more intercreditor agreements that we enter into with the holders of such senior debt. Under a typical intercreditor agreement, at any time that obligations that have the benefit of the first priority liens are outstanding, any of the following actions that may be taken in respect of the collateral will be at the direction of the holders of the obligations secured by the first priority liens:
38
| • | the ability to cause the commencement of enforcement proceedings against the collateral; |
| • | the ability to control the conduct of such proceedings; |
| • | the approval of amendments to collateral documents; |
| • | releases of liens on the collateral; and |
| • | waivers of past defaults under collateral documents. |
We may not have the ability to control or direct such actions, even if its rights are adversely affected.
Our subordinated investments may be subject to greater risk than investments that are not similarly subordinated.
We may make subordinated investments that rank below other obligations of the borrower in right of payment. Subordinated investments are subject to greater risk of default than senior obligations as a result of adverse changes in the financial condition of the borrower or in general economic conditions. If we make a subordinated investment in a portfolio company, the portfolio company may be highly leveraged, and its relatively high debt-to-equity ratio may create increased risks that its operations might not generate sufficient cash flow to service all of its debt obligations.
The disposition of our investments may result in contingent liabilities.
We currently expect that substantially all of our investments will involve loans and private securities. In connection with the disposition of an investment in loans and private securities, we may be required to make representations about the business and financial affairs of the portfolio company typical of those made in connection with the sale of a business. We may also be required to indemnify the purchasers of such investment to the extent that any such representations turn out to be inaccurate or with respect to potential liabilities. These arrangements may result in contingent liabilities that ultimately result in funding obligations that we must satisfy through its return of distributions previously made to us.
We will be subject to the risk that the debt investments we make in our portfolio companies may be repaid prior to maturity.
We expect that our investments will generally allow for repayment at any time subject to certain penalties. When such prepayment occurs, we intend to generally reinvest these proceeds in temporary investments, pending their future investment in accordance with our investment strategy. These temporary investments will typically have substantially lower yields than the debt being prepaid, and we could experience significant delays in reinvesting these amounts. Any future investment may also be at lower yields than the debt that was repaid. As a result, our results of operations could be materially adversely affected if one or more of our portfolio companies elects to prepay amounts owed to us. Additionally, prepayments could negatively impact our ability to pay, or the amount of, dividends on our Common Stock, which could result in a decline in the market price of our shares.
We may be subject to risks under hedging transactions and may become subject to risk if it invests in non-U.S. securities.
The 1940 Act generally requires that 70% of our investments be in issuers each of whom is organized under the laws of, and has its principal place of business in, any state of the United States, the District of Columbia, Puerto Rico, the Virgin Islands or any other possession of the United States. However, our portfolio may include debt securities of non-U.S. companies, including emerging market issuers, to the limited extent such transactions and investments would not cause us to violate the 1940 Act. We expect that these investments would focus on the same secured debt, unsecured debt and related equity security investments that we make in U.S. middle-market companies and, accordingly, would be complementary to our overall strategy and enhance the diversity of our holdings. Investing in loans and securities of emerging market issuers involves many risks including economic, social, political, financial, tax and security conditions in the emerging market, potential inflationary economic environments, regulation by foreign governments, different accounting standards and political uncertainties. Economic, social, political, financial, tax and security conditions also could negatively affect the value of emerging market companies. These factors could include changes in exchange control regulations, political and social instability, expropriation, imposition of foreign taxes, less liquid markets and less available information than is generally the case in the United States, higher transaction costs, less government supervision of exchanges, brokers and issuers, less developed bankruptcy laws, difficulty in enforcing contractual obligations or judgments or foreclosing on collateral, lack of uniform accounting and auditing standards and greater price volatility.
Engaging in either hedging transactions or investing in foreign loans and securities would entail additional risks to our stockholders. We could, for example, use instruments such as interest rate swaps, caps, collars and floors and, if we were to invest in foreign loans and securities, we could use instruments such as forward contracts or currency options and borrow under a credit facility in currencies selected to minimize our foreign currency exposure. In each such case, we generally would seek to hedge against fluctuations of the relative values of our portfolio positions from changes in market interest rates or currency exchange rates. Hedging against a decline
39
in the values of our portfolio positions would not eliminate the possibility of fluctuations in the values of such positions or prevent losses if the values of the positions declined. However, such hedging could establish other positions designed to gain from those same developments, thereby offsetting the decline in the value of such portfolio positions. Such hedging transactions could also limit the opportunity for gain if the values of the underlying portfolio positions increased. Moreover, it might not be possible to hedge against an exchange rate or interest rate fluctuation that was so generally anticipated that we would not be able to enter into a hedging transaction at an acceptable price.
While we may enter into such transactions to seek to reduce currency exchange rate and interest rate risks, unanticipated changes in currency exchange rates or interest rates could result in poorer overall investment performance than if we had not engaged in any such hedging transactions. In addition, the degree of correlation between price movements of the instruments used in a hedging strategy and price movements in the portfolio positions being hedged could vary. Moreover, for a variety of reasons, we might not seek to establish a perfect correlation between the hedging instruments and the portfolio holdings being hedged. Any such imperfect correlation could prevent us from achieving the intended hedge and expose us to risk of loss. In addition, it might not be possible for us to hedge fully or perfectly against currency fluctuations affecting the value of securities denominated in non-U.S. currencies because the value of those loans and securities would likely fluctuate as a result of factors not related to currency fluctuations.
We may not realize anticipated gains on the equity interests in which it invests.
When we invest in loans and debt securities, it may acquire warrants or other equity securities of portfolio companies as well. We may also invest in equity securities directly. To the extent we hold equity investments, we will attempt to dispose of them and realize gains upon such disposition. However, the equity interests we receive may not appreciate in value and, may decline in value. As a result, we may not be able to realize gains from our equity interests, and any gains that we do realize on the disposition of any equity interests may not be sufficient to offset any other losses it experiences.
Our investments in OID and PIK interest income may expose us to risks associated with such income being required to be included in accounting income and taxable income prior to receipt of cash.
Our investments may include OID and PIK instruments. To the extent OID and PIK interest income constitute a portion of our income, we will be exposed to risks associated with such income being required to be included in an accounting income and taxable income prior to receipt of cash, including the following:
| • | OID instruments and PIK securities may have unreliable valuations because the accretion of OID as interest income and the continuing accruals of PIK securities require judgments about their collectability and the collectability of deferred payments and the value of any associated collateral; |
| • | OID income may also create uncertainty about the source of our cash dividends; |
| • | OID instruments may create heightened credit risks because the inducement to the borrower to accept higher interest rates in exchange for the deferral of cash payments typically represents, to some extent, speculation on the part of the borrower; |
| • | for accounting purposes, cash distributions to stockholders that include a component of accreted OID income do not come from paid-in capital, although they may be paid from the offering proceeds. Thus, although a distribution of accreted OID income may come from the cash invested by the stockholders, the 1940 Act does not require that shareholders be given notice of this fact; |
| • | generally, we must recognize income for income tax purposes no later than when it recognizes such income for accounting purposes; |
| • | the higher interest rates on PIK securities reflects the payment deferral and increased credit risk associated with such instruments and PIK securities generally represent a significantly higher credit risk than coupon loans; |
| • | the presence of accreted OID income and PIK interest income create the risk of non-refundable cash payments to the Adviser in the form of incentive fees on income based on non-cash accreted OID income and PIK interest income accruals that may never be realized; |
| • | even if accounting conditions are met, borrowers on such securities could still default when our actual collection is expected to occur at the maturity of the obligation; |
| • | OID and PIK create the risk that incentive fees will be paid to the Adviser based on |
| • | non-cash accruals that ultimately may not be realized, which the Adviser will be under no obligation to reimburse us or these fees; and |
| • | PIK interest has the effect of generating investment income and increasing the incentive fees payable at a compounding rate. In addition, the deferral of PIK interest also reduces the loan-to-value ratio at a compounding rate. |
You may receive dividends in the form of Common Stock instead of cash, which could result in adverse tax consequences to you.
In order to satisfy the Annual Distribution Requirement applicable to RICs, we have the ability to declare a large portion of a dividend
in shares of our Common Stock instead of in cash. As long as a portion of such dividend is paid in cash and certain requirements are
40
met, the entire distribution would be treated as a dividend for U.S. federal income tax purposes. As a result, a stockholder would be taxed on 100% of the dividend in the same manner as a cash dividend, even though most of the dividend was paid in shares of our Common Stock.
Changes in healthcare laws and other regulations applicable to some of our portfolio companies businesses may constrain their ability to offer their products and services.
Changes in healthcare or other laws and regulations applicable to the businesses of some of our portfolio companies may occur that could increase their compliance and other costs of doing business, require significant systems enhancements, or render their products or services less profitable or obsolete, any of which could have a material adverse effect on their results of operations. There has also been an increased political and regulatory focus on healthcare laws in recent years, and new legislation could have a material effect on the business and operations of some of our portfolio companies.
Our investments in the consumer products and services sector are subject to various risks including cyclical risks associated with the overall economy.
General risks of companies in the consumer products and services sector include cyclicality of revenues and earnings, economic recession, currency fluctuations, changing consumer tastes, extensive competition, product liability litigation and increased government regulation. Generally, spending on consumer products and services is affected by the health of consumers. Companies in the consumer products and services sectors are subject to government regulation affecting the permissibility of using various food additives and production methods, which regulations could affect company profitability. A weak economy and its effect on consumer spending would adversely affect companies in the consumer products and services sector.
Our investments in the financial services sector are subject to various risks including volatility and extensive government regulation.
These risks include the effects of changes in interest rates on the profitability of financial services companies, the rate of corporate and consumer debt defaults, price competition, governmental limitations on a company’s loans, other financial commitments, product lines and other operations and recent ongoing changes in the financial services industry (including consolidations, development of new products and changes to the industry’s regulatory framework). The deterioration of the credit markets starting in late 2007 generally has caused an adverse impact in a broad range of markets, including U.S. and international credit and interbank money markets generally, thereby affecting a wide range of financial institutions and markets. In particular, events in the financial sector in late 2008 resulted, and may continue to result, in an unusually high degree of volatility in the financial markets, both domestic and foreign. This situation has created instability in the financial markets and caused certain financial services companies to incur large losses. Insurance companies have additional risks, such as heavy price competition, claims activity and marketing competition, and can be particularly sensitive to specific events such as man-made and natural disasters (including weather catastrophes), climate change, terrorism, mortality risks and morbidity rates.
Our investments in technology companies are subject to many risks, including volatility, intense competition, shortened product life cycles, litigation risk and periodic downturn.
We have invested and will continue investing in technology companies, many of which may have narrow product lines and small market shares, which tend to render them more vulnerable to competitors’ actions and market conditions, as well as to general economic downturns. The revenues, income (or losses), and valuations of technology-related companies can and often do fluctuate suddenly and dramatically. In addition, technology related markets are generally characterized by abrupt business cycles and intense competition, where the leading companies in any particular category may hold a highly concentrated percentage of the overall market share.
Therefore, our portfolio companies may face considerably more risk of loss than do companies in other industry sectors. Because of rapid technological change, the selling prices of products and services provided by technology-related companies have historically decreased over their productive lives. As a result, the selling prices of products and services offered by technology related companies may decrease over time, which could adversely affect their operating results, their ability to meet obligations under their debt securities and the value of their equity securities. This could, in turn, materially adversely affect the value of the technology-related companies in our portfolio.
We may be unable to realize the benefits anticipated by the Alcentra Acquisition, including estimated cost savings and synergies, or it may take longer than anticipated to achieve such benefits.
The realization of certain benefits anticipated as a result of the Alcentra Acquisition will depend in part on the integration of Alcentra Capital’s investment portfolio with our investment portfolio and the integration of Alcentra Capital’s business with our business. There can be no assurance that Alcentra Capital’s and our businesses can be operated profitably or integrated successfully into our operations in a timely fashion, or at all. The dedication of management resources to such integration may detract attention from our day-to-day business, and there can be no assurance that there will not be substantial costs associated with the transition process or there will not be other material adverse effects as a result of these integration efforts. Such effects, including, but not limited to, incurring unexpected costs or delays in connection with such integration and failure of Alcentra Capital’s investment portfolio to perform as expected, could have a material adverse effect on our financial results.
41
We also expect to achieve certain cost savings and synergies from the Alcentra Acquisition when the two companies have fully integrated their portfolios. It is possible that our estimates of the potential cost savings and synergies could turn out to be incorrect. If the estimates turn out to be incorrect or we cannot integrate Alcentra Capital’s investment portfolio and business, the anticipated cost savings and synergies may not be fully realized, or realized at all, or may take longer to realize than expected.
Risks Relating to Our Common Stock
An investment in our common stock presents an above average degree of risk.
The investments we make in accordance with our investment objective may result in a higher amount of risk than associated with alternative investment options, and higher volatility or loss of principal. Our investments in portfolio companies may be speculative and, therefore, an investment in our common stock may not be suitable for someone with lower risk tolerance.
Our shares of Common Stock have traded at a discount from net asset value and may do so again, which could limit our ability to raise additional equity capital.
Shares of closed-end investment companies frequently trade at a market price that is less than the net asset value that is attributable to those shares. This characteristic of closed-end investment companies is separate and distinct from the risk that our net asset value per share may decline. It is not possible to accurately predict whether any shares of our common stock will trade at, above, or below net asset value. In the recent past, the stocks of BDCs as an industry, including at times shares of our common stock, have traded below net asset value. See “Item 1a. Risk Factors-Risks Relating to Our Business and Structure- Global capital markets could enter a period of severe disruption and instability. These conditions have historically affected and could again materially and adversely affect debt and equity capital markets in the United States and around the world and our business.” When our common stock is trading below its net asset value per share, we will generally not be able to issue additional shares of our common stock at its market price without first obtaining approval for such issuance from our stockholders and our independent directors.
The market price of our Common Stock may fluctuate significantly.
The market price and liquidity of the market for our Common Stock may be significantly affected by numerous factors, some of which may be beyond our control and may not be directly related to our operating performance. These factors include:
| • | significant volatility in the market price and trading volume of securities of publicly traded RICs, BDCs or other companies in our sector, which are not necessarily related to the operating performance of these companies; |
| • | price and volume fluctuations in the overall stock market from time to time; |
| • | the inclusion or exclusion of our Common Stock from certain indices; |
| • | changes in law, regulatory policies or tax guidelines, or interpretations thereof, particularly with respect to RICs or BDCs; |
| • | loss of RIC status; |
| • | changes in earnings or variations in operating results; |
| • | changes in the value of our portfolio of investments; |
| • | announcements with respect to significant transactions; |
| • | any shortfall in revenue or net income or any increase in losses from levels expected by investors or securities analysts; |
| • | departure of key personnel of ours or the Adviser; |
| • | operating performance of companies comparable to us; |
| • | short-selling pressure with respect to shares of our Common Stock or BDCs generally; |
| • | general economic trends and other external factors; and |
| • | loss of a major funding source. |
In the past, following periods of volatility in the market price of a company’s securities, securities class action litigation has often been brought against that company. Because of the potential volatility in the price of our Common Stock, we may become the target of securities litigation in the future. If we were to become involved in securities litigation, it could result in substantial costs, divert management’s attention and resources from the business and adversely affect the business.
42
Our stockholders will experience dilution in their ownership percentage if they opt out of our dividend reinvestment plan.
We have adopted a dividend reinvestment plan, pursuant to which we will reinvest all cash distributions authorized by the Board on behalf of stockholders who do not elect to receive their distributions in cash. As a result, if the Board authorizes and we declare a cash distribution, then stockholders who have not opted out of the dividend reinvestment plan will have their cash distributions automatically reinvested in additional shares of Common Stock, rather than receiving the cash distribution. See “Item 1—Business—Dividend Reinvestment Plan” for a description of the dividend reinvestment plan. Following the listing of our Common Stock on NASDAQ, the number of shares to be issued to a plan participant will be determined by dividing the total dollar amount of the distribution payable to such stockholder by the market price per share of our Common Stock at the close of regular trading on NASDAQ on the date of such distribution. The market price per share of our Common Stock on a particular date will be the closing price for such shares on NASDAQ on such date, or, if no sale is reported for such date, at the average of their reported bid and asked prices. However, if the market price per share exceeds the most recently computed net asset value per share, we will issue shares at the greater of (i) the most recently computed net asset value per share and (ii) 95% of the current market price per share (or such lesser discount to the current market price per share that still exceeds the most recently computed net asset value per share). Accordingly, participants in the dividend reinvestment plan may receive a greater number shares of our Common Stock than the number of shares associated with the market price of our Common Stock, resulting in dilution for other stockholders. Stockholders that opt out of the dividend reinvestment plan will experience dilution in their ownership percentage of our Common Stock over time.
Provisions of the Maryland General Corporation Law and of the Charter and the Bylaws could deter takeover attempts and have an adverse effect on the price of our Common Stock.
Certain provisions of the Maryland General Corporation Law (the “MGCL”) may discourage, delay or make more difficult a change in control of the Company, including (i) the Maryland Business Combination Act (the “Business Combination Act”), which, subject to any applicable requirements of the 1940 Act and certain other limitations, will prohibit certain business combinations between us and an “interested stockholder” (defined generally as any person who beneficially owns, directly or indirectly, 10% or more of the voting power of our outstanding shares of voting stock or an affiliate or associate of us who, at any time within the two-year period prior to the date in question, was the beneficial owner, directly or indirectly, of 10% or more of the voting power of our then outstanding shares of stock) or an affiliate thereof for five years after the most recent date on which the stockholder becomes an interested stockholder, and thereafter will impose special appraisal rights and supermajority voting requirements on these combinations and (ii) the Maryland Control Share Acquisition Act (the “Control Share Acquisition Act”), which, subject to any applicable requirements of the 1940 Act, will provide that our “control shares” (defined as shares which, when aggregated with other shares controlled by the stockholder (except solely by virtue of a revocable proxy), entitle the stockholder to exercise one of three increasing ranges of voting power in electing directors) acquired in a “control share acquisition” (defined as the direct or indirect acquisition of ownership or control of issued and outstanding “control shares”) have no voting rights except to the extent approved by our stockholders by the affirmative vote of at least two-thirds of all the votes entitled to be cast on the matter, excluding all interested shares. The Board has adopted a resolution exempting from the Business Combination Act any business combination between us and any other person, provided that the business combination is first approved by the Board, including a majority of the independent directors, and the Bylaws exempt from the Control Share Acquisition Act acquisitions of our stock by any person. However, if the resolution exempting business combinations is repealed or the Board or independent directors do not approve a business combination or we amend the Bylaws to repeal the exemption from the Control Share Acquisition Act, subject to any applicable requirements of the 1940 Act, the Business Combination Act or Control Share Acquisition Act, as the case may be, may discourage third parties from trying to acquire control of us and may increase the difficulty of consummating such an offer.
We are also subject to other measures that may make it difficult for a third party to obtain control of us, including provisions of the Charter that (i) classify the Board into three classes serving staggered three-year terms and require that any vacancies be filled by a majority of directors remaining in office, (ii) require a two-thirds vote and cause for director removal, (iii) authorize the Board to classify any unissued shares of stock and reclassify any previously classified but unissued shares of stock into other classes or series of stock, including preferred stock, and to cause the issuance of additional shares of our Common Stock and (iv) authorize the Board to amend the Charter, without stockholder approval, to increase or decrease the aggregate number of shares of stock or the number of shares of stock of any class or series that we have the authority to issue. These provisions, as well as other provisions in the Charter and the Bylaws, may delay, defer or prevent a transaction or a change in control that might otherwise be in the best interests of our stockholders.
The Charter imposes certain restrictions on transfer of the our Common Stock held by our stockholders prior to the consummation of the Alcentra Acquisition in addition to those otherwise imposed by applicable law or by contract.
The Charter provides that during the period beginning with the date we reincorporated from the State of Delaware to the State of Maryland (“the “Reincorporation”) and ending 365 days after the date our Common Stock was listed on NASDAQ (the “Listing”),
43
any transfer (whether by sale, gift, merger, operation of law or otherwise), exchange, assignment, pledge, hypothecation or other disposition or encumbrance of any shares of our Common Stock acquired by a stockholder attendant to the Reincorporation is prohibited, and therefore not effective, until 180 days after the date of the Listing for one third of the shares of our Common Stock acquired by a stockholder in the Reincorporation, 270 days after the date of the Listing for another one-third of the shares of our Common Stock acquired by a stockholder in the Reincorporation and 365 days after the date of the Listing for the final one-third of the shares of our Common Stock acquired by a stockholder in the Reincorporation, unless the Board provides prior written consent permitting an earlier effective date and the transfer, exchange, assignment, pledge, hypothecation or other disposition or encumbrance is made in accordance with applicable securities and other laws. The Board may impose certain conditions in connection with granting its consent to an earlier effective date and any such consent shall be granted in the sole discretion of the Board. Any purported transfer, exchange, assignment, pledge, hypothecation or other disposition or encumbrance of any shares of our Common Stock effected on an earlier effective date in violation of the Charter will have no force or effect, and we will not register or permit registration of (and will direct our transfer agent not to register or permit registration of) any such purported transfer, exchange, assignment, pledge, hypothecation or other disposition or encumbrance on our books and records until the applicable effective date.
Such transfer restrictions are applicable only to shares received by our stockholders in the Reincorporation, and not to any other shares of our Common Stock, including the shares issued to Alcentra Capital stockholders in connection with the Alcentra Acquisition and are in addition to any transfer restrictions applicable by law or any applicable agreements between the stockholder and us.
Our Charter designates the Circuit Court for Baltimore City, Maryland as the sole and exclusive forum for certain types of actions and proceedings that may be initiated by our stockholders, which could limit our stockholders’ ability to obtain a favorable judicial forum for disputes with us or our directors, officers or other employees.
Our Charter provides that, unless we consent in writing to the selection of an alternative forum, the Circuit Court for Baltimore City, Maryland, or, if that Court does not have jurisdiction, the United States District Court for the District of Maryland, Baltimore Division, will be the sole and exclusive forum for: (i) any derivative action or proceeding brought on our behalf; (ii) any Internal Corporate Claim, as such term is defined in Section 1-101(p) of the MGCL, including, without limitation, (a) any action asserting a claim of breach of any duty owed by any of our directors or officers or other employees to us or to our stockholders or (b) any action asserting a claim against us or any of our directors or officers or other employees arising pursuant to any provision of the MGCL or the Charter or the Bylaws; or (iii) any action asserting a claim against us or any of our directors or officers or other employees that is governed by the internal affairs doctrine. Any person or entity purchasing or otherwise acquiring or holding any interest in shares of our Common Stock will be deemed to have notice of and to have consented and waived any objection to this exclusive forum provision of the Charter, as the same may be amended from time to time. The Charter includes this provision so that we can respond to litigation more efficiently, reduce the costs associated with our responses to such litigation, particularly litigation that might otherwise be brought in multiple forums, and make it less likely that plaintiffs’ attorneys will be able to employ such litigation to coerce us into otherwise unjustified settlements. However, this exclusive forum provision may limit a stockholder’s ability to bring a claim in a judicial forum that such stockholder believes is favorable for disputes with us or our directors, officers or other employees, if any, and may discourage lawsuits against us and our directors, officers or other employees, if any. We believe the risk of a court declining to enforce this exclusive forum provision is remote, as the General Assembly of Maryland has specifically amended the MGCL to authorize the adoption of such provision. However, if a court were to find such provision inapplicable to, or unenforceable in respect of, one or more of the specified types of actions or proceedings notwithstanding that the MGCL expressly provides that the charter or bylaws of a Maryland corporation may require that any Internal Corporate Claim be brought only in courts sitting in one or more specified jurisdictions, we may incur additional costs that it does not currently anticipate associated with resolving such matters in other jurisdictions, which could adversely affect our business, financial condition and results of operations.
We will incur significant costs as a result of our listing on NASDAQ.
Companies with outstanding, registered securities listed on a national securities exchange incur legal, accounting and other expenses, including costs associated with the periodic reporting requirements applicable to a company whose securities are registered under the Exchange Act, as well as additional corporate governance requirements, including NASDAQ requirements and requirements under the Sarbanes-Oxley Act. Accordingly, while we previously filed annual, quarterly and current reports with respect to our business and financial condition under the Exchange Act, we will incur significant additional costs as a result of the listing of our Common Stock on NASDAQ. These requirements may place a strain on our systems and resources. The Sarbanes-Oxley Act requires that we maintain effective disclosure controls and procedures and internal controls over financial reporting. In order to maintain and improve the effectiveness of our disclosure controls and procedures and internal controls, significant resources and management oversight will be required. We will be implementing additional procedures, processes, policies and practices for the purpose of addressing the standards and requirements applicable to listed public companies. These activities may divert management’s attention from other business concerns, which could have a material adverse effect on our business, financial condition, results of operations and cash flows. We expect to incur significant additional annual expenses related to these steps and, among other things, directors’ and officers’ liability insurance, director fees, reporting requirements of the SEC, transfer agent fees, additional administrative expenses payable to the Administrator to compensate it for hiring additional accounting, legal and administrative personnel, increased auditing and legal fees and similar expenses.
44
| ITEM 1B. | UNRESOLVED STAFF COMMENTS |
None.
| ITEM 2. | PROPERTIES |
We maintain our principal executive office at 11100 Santa Monica Boulevard, Suite 2000, Los Angeles, California 90025. We do not own any real estate.
| ITEM 3. | LEGAL PROCEEDINGS |
We are party to certain lawsuits in the normal course of business, including proceedings relating to the enforcement of our rights under loans to or other contracts with our portfolio companies. In addition, Alcentra Capital was involved in various legal proceedings that we assumed in connection with the Alcentra Acquisition. Furthermore, third parties may try to seek to impose liability on us in connection with our activities or the activities of our portfolio companies. While the outcome of any such legal proceedings cannot at this time be predicted with certainty, we do not expect that these legal proceedings will materially affect our business, financial condition or results of operations.
On or about December 23, 2019, stockholders of Alcentra Capital filed two virtually identical stockholder class action complaints purportedly on behalf of holders of the common stock of Alcentra Capital against the members of Alcentra Capital’s board of directors and certain former Alcentra Capital officers, in the Circuit Court for Baltimore City, Maryland alleging that the defendants breached their fiduciary duties to the public stockholders of Alcentra Capital by commencing a sales process allegedly in response to certain actions by Stilwell Value Partners VII, Stilwell Activist Fund, Stilwell Activist Investments, and Stilwell Associates, and by omitting allegedly material information concerning the transaction, the resignation of certain directors of Alcentra, and the financial analysis and fairness opinion of Houlihan Lokey from the joint proxy statement filed with the SEC on December 11, 2019 as part of the registration statement relating to the Alcentra Acquisition. The complaints sought to recover compensatory damages for alleged losses resulting from the alleged breaches of fiduciary duty. We assumed indemnification responsibilities owed by Alcentra to its former directors and officers with respect to this proceeding in connection with the Alcentra Acquisition and, in April 2020, the Circuit Court for Baltimore City dismissed both stockholder class action complaints. The plaintiffs in both cases did not timely file an appeal to the decision of the Circuit Court of Baltimore City and as a consequence the dismissal of each class action complaint is final.
| ITEM 4. | MINE SAFETY DISCLOSURES |
Not applicable.
45
ITEM 5. MARKET FOR REGISTRANT’S COMMON EQUITY, RELATED STOCKHOLDER MATTERS AND ISSUER PURCHASES OF EQUITY SECURITIES
Market Information
Our common stock is traded on NASDAQ under the symbol “CCAP.” Prior to the listing of the Common Stock on NASDAQ on February 3, 2020, our Common Stock was offered and sold in transactions exempt from registration under the Securities Act under Section 4(a)(2) and Regulation D, as well as under Regulation S under the Securities Act.
The following table sets forth, for each fiscal quarter since the listing of the Common Stock on NASDAQ, the range of high and low sales prices of the Common Stock as reported on NASDAQ, the premium (discount) of sales price to our net asset value, or NAV, and the distributions declared by us for each fiscal quarter.
| Price Range | ||||||||||||||||||||||||
| Period |
Net Asset Value (1) |
High | Low | High Sales Price Premium (Discount) to Net Asset Value (2) |
Low Sales Price Premium (Discount) to Net Asset Value (2) |
Cash Dividend Per Share (3) |
||||||||||||||||||
| Year ended December 31, 2020 |
||||||||||||||||||||||||
| First Quarter |
$ | 16.52 | $ | 17.10 | $ | 6.21 | 3.5 | % | (62.4 | )% | $ | 0.41 | ||||||||||||
| Second Quarter |
$ | 18.12 | $ | 13.25 | $ | 8.68 | (26.9 | )% | (52.1 | )% | $ | 0.41 | ||||||||||||
| Third Quarter |
$ | 19.07 | $ | 13.81 | $ | 11.65 | (27.6 | )% | (38.9 | )% | $ | 0.41 | ||||||||||||
| Fourth Quarter |
$ | 19.88 | $ | 15.25 | $ | 12.40 | (23.3 | )% | (37.6 | )% | $ | 0.41 | ||||||||||||
| (1) | Net asset value per share is determined as of the last day in the relevant quarter and therefore does not reflect the net asset value per share disclosed to the market on the date of the high and low closing sales prices. The net asset values shown are based on outstanding shares at the end of the relevant quarter. |
| (2) | Calculated as the respective high or low closing sales price less net asset value, divided by net asset value (in each case, as of the applicable quarter). |
| (3) | Represents the dividend or distribution declared in the relevant quarter. |
The last reported price for our common stock on February 23, 2021 was $16.10 per share, which represented a 19.0% discount to our NAV as of December 31, 2020.
Stock Performance Graph
This graph compares the stockholder return on our common stock from February 3, 2020 (the date our common stock commenced trading on NASDAQ) to December 31, 2020 with that of the Standard & Poor’s 500 Stock Index, Standard & Poor’s BDC Index and Russell 2000 Financial Services Index. This graph assumes that on February 3, 2020, $100 was invested in our common stock, Standard & Poor’s 500 Stock Index, Standard & Poor’s BDC Index and Russell 2000 Financial Services Index. The graph also assumes the reinvestment of all cash dividends prior to any tax effect.
46
The graph and other information furnished under this Part II Item 5 of this Annual Report on Form 10-K shall not be deemed to be “soliciting material” or to be “filed” with the SEC or subject to Regulation 14A or 14C under, or to the liabilitie s of Section 18 of, the Exchange Act. The stock price performance included in the below graph is not necessarily indicative of future stock performance.
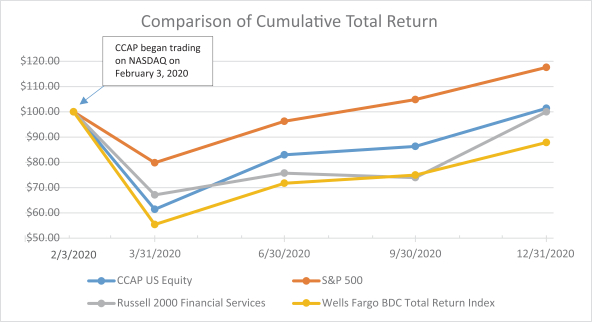
Holders
As of December 31, 2020, there were 195 holders of record of our common stock (excluding Cede & Co).
Distribution Policy
To the extent that we have taxable income available, we distribute quarterly dividends to our stockholders. The amount of our dividends, if any, are determined by our Board of Directors. Dividends and distributions are recorded on the record date. The amount to be paid out as a dividend is determined by the Board each quarter and is generally based upon the earnings estimated by management. Distributions will generally be paid from net investment income. Net realized capital gains, if any, are distributed at least annually, although we may decide to retain such capital gains for investment. If we do not generate sufficient net investment income during a year, all or part of a distribution may constitute a return of capital. The specific tax characteristics of our dividends and other distributions will be reported to stockholders after the end of each calendar year. Any dividends to our stockholders will be declared out of assets legally available for distribution.
We have elected to be treated as a BDC under the 1940 Act. We have also elected to be treated as a RIC under the Internal Revenue Code. So long as we maintain our status as a RIC, we will generally not pay corporate-level U.S. federal income or excise taxes on any ordinary income or capital gains that we distribute at least annually to our stockholders as dividends. As a result, any tax liability related to income earned and distributed by us represents obligations of our stockholders and will not be reflected in our consolidated financial statements.
In order for us not to be subject to federal excise taxes, we must distribute annually an amount at least equal to the sum of (i) 98% of our ordinary income (taking into account certain deferrals and elections), (ii) 98.2% of our net capital gains from the current year and (iii) any undistributed ordinary income and net capital gains from preceding years. At our discretion, we may carry forward taxable income in excess of calendar year dividends and pay a 4% excise tax on this income. If we choose to do so, this generally would increase expenses and reduce the amount available to be distributed to stockholders. We will accrue excise tax on estimated undistributed taxable income as required.
We intend to make distributions in cash unless a stockholder elects to receive dividends and/or long-term capital gains distributions in additional shares of common stock. We can offer no assurance that we will achieve results that will permit the payment of any cash distributions and, if we issue senior securities, we will be prohibited from making distributions if doing so causes us to fail to maintain the asset coverage ratios stipulated by the 1940 Act or if distributions are limited by the terms of any of our borrowings.
47
The following tables summarize our dividends declared and payable for the years ended December 31, 2020, 2019, and 2018:
($ in millions except per share amounts)
| Date Declared |
Record Date |
Payment Date |
Per Share Amount |
Total Amount |
||||||||
| November 4, 2020 |
December 31, 2020 | January 15, 2021 | $ | 0.41 | $ | 11.5 | ||||||
| August 7, 2020 |
September 30, 2020 | October 15, 2020 | $ | 0.41 | $ | 11.5 | ||||||
| May 11, 2020 |
June 30, 2020 | July 15, 2020 | $ | 0.41 | $ | 11.5 | ||||||
| March 3, 2020 |
March 31, 2020 | April 15, 2020 | $ | 0.41 | $ | 10.6 | ||||||
| November 8, 2019 |
December 30, 2019 | January 17, 2020 | $ | 0.41 | $ | 8.6 | ||||||
| September 27, 2019 |
September 27, 2019 | October 18, 2019 | $ | 0.41 | $ | 8.0 | ||||||
| June 28, 2019 |
June 28, 2019 | July 18, 2019 | $ | 0.41 | $ | 6.7 | ||||||
| March 29, 2019 |
March 29, 2019 | April 12, 2019 | $ | 0.41 | $ | 6.0 | ||||||
| December 31, 2018 |
December 31, 2018 | January 15, 2019 | $ | 0.40 | $ | 5.3 | ||||||
| September 27, 2018 |
September 28, 2018 | October 12, 2018 | $ | 0.38 | $ | 4.5 | ||||||
| June 19, 2018 |
June 20, 2018 | July 13, 2018 | $ | 0.37 | $ | 3.9 | ||||||
| March 29, 2018 |
March 30, 2018 | April 13, 2018 | $ | 0.32 | $ | 3.0 | ||||||
Dividend Reinvestment Plan
We have adopted a dividend reinvestment plan that will provide for reinvestment of our dividends and other distributions on behalf of our stockholders, unless a stockholder elects to receive cash. As a result, if our Board authorizes, and we declare, a cash dividend or other distribution, then stockholders who are participating in the dividend reinvestment plan, will have their cash dividends and distributions automatically reinvested in additional shares of Common Stock, rather than receiving cash dividends and distributions.
Recent Sales of Unregistered Securities and Use of Proceeds
Except as previously reported us on our Current Reports on Form 8-K, we did not sell any securities during the period covered by this Form 10-K that were not registered under the Securities Act.
| ITEM 6. | SELECTED FINANCIAL DATA |
None.
48
ITEM 7. MANAGEMENT’S DISCUSSION AND ANALYSIS OF FINANCIAL CONDITION AND RESULTS OF OPERATIONS
Management’s Discussion and Analysis should be read in conjunction with ITEM 8. CONSOLIDATED FINANCIAL STATEMENTS AND SUPPLEMENTARY DATA. This discussion contains forward-looking statements and involves numerous risks and uncertainties, including, but not limited to, those described in “ITEM 1A. RISK FACTORS.” Actual results may differ materially from those contained in any forward-looking statements.
OVERVIEW
We are a specialty finance company focused on lending to middle-market companies and were incorporated under the laws of the State of Delaware on February 5, 2015 (“Inception”). On January 30, 2020, we changed our state of incorporation from the State of Delaware to the State of Maryland. We have elected to be treated as a BDC under the 1940 Act. In addition, we have elected to be treated for U.S. federal income tax purposes as a RIC under Subchapter M of the Code. As such, we are required to comply with various regulatory requirements, such as the requirement to invest at least 70% of our assets in “qualifying assets,” source of income limitations, asset diversification requirements, and the requirement to distribute annually at least 90% of our taxable income and tax-exempt interest.
We are managed by the Adviser, an investment adviser that is registered with the SEC under the 1940 Act. The Administrator provides the administrative services necessary for us to operate. Company management consists of investment and administrative professionals from the Adviser and Administrator along with our Board. The Adviser directs and executes our investment operations and capital raising activities subject to oversight from the Board, which sets our broad policies. The Board has delegated investment management of our investment assets to the Adviser. The Board consists of five directors, four of whom are independent.
Our primary investment objective is to maximize the total return to our stockholders in the form of current income and capital appreciation through debt and related equity investments. We seek to achieve our investment objectives by investing primarily in secured debt (including senior secured first lien, unitranche and senior secured second-lien debt) and unsecured debt (including senior unsecured, mezzanine and subordinated debt), as well as related equity securities of private U.S. middle-market companies. We may purchase interests in loans or make debt investments, either (i) directly from our target companies as primary market or private credit investments (i.e., private credit transactions), or (ii) primary or secondary market bank loan or high yield transactions in the broadly syndicated “over-the-counter” market (i.e., broadly syndicated loans and bonds). Although our focus is to invest in less liquid private credit transactions, we may from time to time invest in more liquid broadly syndicated loans and bonds to complement our private credit transactions.
“First lien” investments are senior loans on a lien basis to other liabilities in the issuer’s capital structure that have the benefit of a first-priority security interest in assets of the issuer. The security interest ranks above the security interest of any second-lien lenders in those assets.
“Unitranche first lien” investments are loans that may extend deeper in a company’s capital structure than traditional first lien debt and may provide for a waterfall of cash flow priority among different lenders in the unitranche loan. In certain instances, we may find another lender to provide the “first out” portion of such loan and retain the “last out” portion of such loan, in which case, the “first out” portion of the loan would generally receive priority with respect to payment of principal, interest and any other amounts due thereunder over the “last out” portion that we would continue to hold. In exchange for the greater risk of loss, the “last out” portion earns a higher interest rate.
“Second lien” investments are loans with a second priority lien on all existing and future assets of the portfolio company. The security interest ranks below the security interests of any first lien and unitranche first lien lenders in those assets.
“Mezzanine” or “unsecured debt” investments are loans that generally rank senior to a borrower’s equity securities and junior in right of payment to such borrower’s other senior indebtedness.
Alcentra Acquisition
On August 12, 2019, we entered into the Merger Agreement to acquire Alcentra Capital, in a cash and stock transaction. The board of directors of both companies each unanimously approved the Alcentra Acquisition and on January 29, 2020, Alcentra Capital’s stockholders approved the merger and our stockholders approved the issuance of shares of our common stock to Alcentra Capital’s stockholders.
On January 31, 2020, we completed the Alcentra Acquisition, pursuant to the terms and conditions of the Merger Agreement. To effect the acquisition, Acquisition Sub merged with and into Alcentra Capital, with Alcentra Capital surviving the merger as our wholly owned subsidiary. Immediately thereafter and as a single integrated transaction, Alcentra Capital consummated the Second Merger, whereby it merged with and into us, with Crescent Capital BDC surviving the merger. Pursuant to the Merger Agreement, Alcentra Capital stockholders received the right to the following merger consideration in exchange for each share of Alcentra Capital common stock outstanding immediately prior to January 31, 2020, (a) $3.1784 per share in cash consideration (less the $0.8000 final dividend declared by Alcentra Capital) and (b) stock consideration at the fixed exchange ratio of 0.4041 shares of Common Stock. This resulted in our then-existing stockholders owning approximately 82% of us and Alcentra Capital’s then-existing stockholders owning approximately 18% of us.
49
The aggregate cash consideration was comprised of (i) $19.3 million in cash, or $1.5023 per share, from us (less $10.3 million or $0.8000 per share in final dividends paid by Alcentra Capital on January 31, 2020) and (ii) $21.6 million in cash, or $1.6761 per share, in transaction support provided by the Adviser.
CRITICAL ACCOUNTING POLICIES
Our discussion and analysis of our financial condition and results of operations are based upon our financial statements, which have been prepared in accordance with accounting principles generally accepted in the United States of America (“GAAP”). The preparation of these financial statements requires management to make estimates and assumptions that affect the reported amounts of assets, liabilities, revenues and expenses. Changes in the economic environment, financial markets and any other parameters used in determining such estimates could cause actual results to differ materially. The critical accounting policies should be read in connection with our risk factors as disclosed herein.
In addition to the discussion below, our critical accounting policies are further described in Note 2. Summary of Significant Accounting Policies to our consolidated financial statements.
Investment Valuation
We apply Financial Accounting Standards Board ASC 820, Fair Value Measurement (“ASC 820”), as amended, which establishes a framework for measuring fair value in accordance with GAAP and required disclosures of fair value measurements. ASC 820 determines fair value to be the price that would be received for an investment in a current sale, which assumes an orderly transaction between market participants on the measurement date. Market participants are defined as buyers and sellers in the principal or most advantageous market (which may be a hypothetical market) that are independent, knowledgeable, and willing and able to transact. In accordance with ASC 820, we consider our principal market to be the market that has the greatest volume and level of activity. ASC 820 specifies a fair value hierarchy that prioritizes and ranks the level of observability of inputs used in the determination of fair value. In accordance with ASC 820, these levels are summarized below:
Level 1—Valuations based on quoted prices in active markets for identical assets or liabilities that we have the ability to access.
Level 2—Valuations based on quoted prices in markets that are not active or for which all significant inputs are observable, either directly or indirectly.
Level 3—Valuations based on inputs that are unobservable and significant to the overall fair value measurement.
Investments in investment companies are valued at fair value. Fair values are generally determined utilizing the net asset value (“NAV”) supplied by, or on behalf of, management of each investment company, which is net of management and incentive fees or allocations charged by the investment company and is in accordance with the “practical expedient”, as defined by ASC 820. NAVs received by, or on behalf of, management of each investment company are based on the fair value of the investment company’s underlying investments in accordance with policies established by management of each investment company, as described in each of their financial statements and offering memorandum. Investments which are valued using NAV as a practical expedient are excluded from the above hierarchy.
Investments for which market quotations are readily available are typically valued at those market quotations. To validate market quotations, we utilize a number of factors to determine if the quotations are representative of fair value, including the source and number of the quotations. Debt and equity securities that are not publicly traded or whose market prices are not readily available are valued at fair value as determined in good faith by the Board, based on, among other things, the input of the Adviser, our Audit Committee and independent third-party valuation firms engaged at the direction of the Board.
The Board oversees and supervises a multi-step valuation process, which includes, among other procedures, the following:
| • | The valuation process begins with each investment being initially valued by the investment professionals responsible for the portfolio investment in conjunction with the portfolio management team. |
| • | The Adviser’s management and Crescent’s alternative investment valuation committee reviews the preliminary valuations with the investment professionals. Agreed upon valuation recommendations are presented to the Audit Committee. |
| • | The Audit Committee reviews the valuations presented and recommends values for each investment to the Board. |
| • | The Board reviews the recommended valuations and determines the fair value of each investment. |
In connection with debt and equity securities that are valued at fair value in good faith by the Board, the Board will periodically engage independent third-party valuation firms to estimate a range of fair values for a sample of investments, which are used to corroborate management’s fair value estimates.
In addition to using the above inputs in investment valuations, we apply the valuation policy approved by our Board that is consistent with ASC 820. Consistent with the valuation policy, we evaluate the source of inputs, including any markets in which our investments are trading (or any markets in which securities with similar attributes are trading), in determining fair value. When a security is valued
50
based on prices provided by reputable dealers or pricing services (that is, broker quotes), we subject those prices to various criteria in making the determination as to whether a particular investment would qualify for classification as a Level 2 or Level 3 investment. For example, we review pricing methodologies provided by dealers or pricing services in order to determine if observable market information is being used, versus unobservable inputs. Some additional factors considered include the number of prices obtained as well as an assessment as to their quality. Transfers between levels, if any, are recognized at the beginning of the period in which the transfers occur.
Due to the inherent uncertainty of determining the fair value of investments that do not have a readily available market value, the fair value of our investments may fluctuate from period to period. Additionally, the fair value of such investments may differ significantly from the values that would have been used had a ready market existed for such investments and may differ materially from the values that may ultimately be realized. Further, such investments are generally less liquid than publicly traded securities and may be subject to contractual and other restrictions on resale. If we were required to liquidate a portfolio investment in a forced or liquidation sale, we could realize amounts that are different from the amounts presented and such differences could be material. In addition, changes in the market environment and other events that may occur over the life of the investments may cause the gains or losses ultimately realized on these investments to be different than the unrealized gains or losses reflected herein. See Note 4. Investments and Note 5. Fair Value of Financial Instruments for additional information on our investment portfolio.
Interest and Dividend Income Recognition
Interest income is recorded on an accrual basis and includes the amortization of purchase discounts and premiums. Discounts and premiums to par value on securities purchased are accreted or amortized into interest income over the contractual life of the respective securities using the effective yield method. The amortized cost of investments represents the original cost adjusted for the accretion and amortization of discounts and premiums, if any. Upon prepayment of a loan or debt security, any prepayment premiums, unamortized upfront loan origination fees and unamortized discounts are recorded as interest income.
Dividend income from common equity securities is recorded on the record date for private portfolio companies or on the ex-dividend date for publicly-traded portfolio companies. Dividend income from preferred equity securities is recorded on an accrual basis to the extent that such amounts are payable by the portfolio company and are expected to be collected. Each distribution received from an equity investment is evaluated to determine if the distribution should be recorded as dividend income or a return of capital. Generally, we will not record distributions from equity investments as dividend income unless there is sufficient current or accumulated earnings prior to the distribution. Distributions that are classified as a return of capital are recorded as a reduction of capital are recorded as a reduction in the cost basis of the investment.
Certain investments have contractual payment-in-kind (“PIK”) interest or dividends. PIK represents accrued interest or accumulated dividends that are added to the loan principal or cost basis of the investment on the respective interest or dividend payment dates rather than being paid in cash and generally becomes due at maturity or upon being called by the issuer. PIK is recorded as interest or dividend income, as applicable. If at any point we believe PIK is not expected to be realized, the investment generating PIK will be placed on non-accrual status. Accrued PIK interest or dividends are generally reversed through interest or dividend income, respectively, when an investment is placed on non-accrual status.
Loans are generally placed on non-accrual status when principal or interest payments are past due 30 days or more or when there is reasonable doubt that principal or interest will be collected in full. Accrued and unpaid interest is generally reversed when a loan is placed on non-accrual status. Interest payments received on non-accrual loans may be recognized as income or applied to principal depending upon management’s judgment regarding collectability. Non-accrual loans are restored to accrual status when past due principal and interest is paid current and, in management’s judgment, are likely to remain current. Management may determine to not place a loan on non-accrual status if the loan has sufficient collateral value and is in the process of collection.
Income Taxes
We have elected to be treated as a BDC under the 1940 Act. We also have elected to be treated as a RIC under the Internal Revenue Code. So long as we maintain our status as a RIC, we will generally not pay corporate-level U.S. federal income or excise taxes on any ordinary income or capital gains that we distribute at least annually to our stockholders as dividends. As a result, any tax liability related to income earned and distributed by us represents obligations of our stockholders and will not be reflected in our consolidated financial statements.
We evaluate tax positions taken or expected to be taken in the course of preparing our consolidated financial statements to determine whether the tax positions are “more-likely-than-not” to be sustained by the applicable tax authority. Tax positions not deemed to meet the “more-likely-than-not” threshold are reversed and recorded as a tax benefit or expense in the current year. All penalties and interest associated with income taxes are included in income tax expense. Conclusions regarding tax positions are subject to review and may be adjusted at a later date based on factors including, but not limited to, on-going analyses of tax laws, regulations and interpretations thereof. We account for income taxes in conformity with ASC 740 — Income Taxes (“ASC 740”). ASC 740 provides guidelines for how uncertain tax positions should be recognized, measured, presented and disclosed in financial statements.
51
In order for us not to be subject to federal excise taxes, we must distribute annually an amount at least equal to the sum of (i) 98% of our ordinary income (taking into account certain deferrals and elections), (ii) 98.2% of our net capital gains from the current year and (iii) any undistributed ordinary income and net capital gains from preceding years. We, at our discretion, may carry forward taxable income in excess of calendar year dividends and pay a 4% excise tax on this income. If we choose to do so, this generally would increase expenses and reduce the amount available to be distributed to stockholders. We accrue excise tax on estimated undistributed taxable income as required on a quarterly basis.
CBDC Universal Equity, Inc. is a taxable entity (“Taxable Subsidiary”). The Taxable Subsidiary permits us to hold equity investments in portfolio companies which are “pass through” entities for tax purposes and continue to comply with the “source income” requirements contained in RIC tax provisions of the Code. The Taxable Subsidiary is not consolidated with us for income tax purposes and may generate income tax expense, benefit, and the related tax assets and liabilities, as a result of their ownership of certain portfolio investments. The income tax expense, or benefit, if any, and related tax assets and liabilities are reflected in our consolidated financial statements.
We intend to comply with the applicable provisions of the Code, pertaining to regulated investment companies and to make distributions of taxable income sufficient to relieve it from substantially all federal income taxes. As of December 31, 2020, we are subject to examination by U.S. federal tax authorities for returns filed for the three most recent calendar years and by state tax authorities for returns filed for the four most recent calendar years.
We may generate qualified net interest income or qualified net short-term capital gains that may be exempt from U.S. withholding tax when distributed to foreign stockholders. A RIC is permitted to designate distributions of qualified net interest income and qualified short-term capital gains as exempt from U.S. withholding tax when paid to non-U.S. shareholders with proper documentation. As of December 31, 2020, the percentage of 2020 income estimated as qualified interest income for tax purposes was 98.0%.
New Accounting Pronouncements
In March 2020, the FASB issued Accounting Standard Update (“ASU”) No. 2020-04, “Reference Rate Reform (Topic 848): Facilitation of the Effects of Reference Rate Reform on Financial Reporting.” This ASU provides optional exceptions for applying GAAP to contract modifications, hedging relationships and other transactions affected reference rate reform if certain criteria are met. ASU 2020-04 is elective and can be adopted between March 12, 2020 and December 31, 2022. We do not expect that the adoption of this guidance will have a material impact on our consolidated financial statements.
The SEC issued final rules that, among other things, amended the financial disclosure requirements of Regulation S-X for acquired and disposed businesses and the significance tests for a “significant subsidiary” as applicable to BDCs and amended certain forms used by BDCs. The amendments are intended to assist BDCs in making more meaningful determinations as to whether a subsidiary or an acquired or disposed entity is significant and improve the financial disclosure requirements applicable to acquisitions and dispositions of investment companies and BDCs. The Company early adopted the updated rules for the year ended December 31, 2020 which did not result in any new significant subsidiaries being identified.
COMPONENTS OF OPERATIONS
Investments
We expect our investment activity to vary substantially from period to period depending on many factors, the general economic environment, the amount of capital we have available to us, the level of merger and acquisition activity for middle-market companies, including the amount of debt and equity capital available to such companies and the competitive environment for the type of investments we make. In addition, as part of our risk strategy on investments, we may reduce certain levels of investments through partial sales or syndication to additional investors.
We may not invest in any assets other than “qualifying assets” specified in the 1940 Act, unless, at the time the investments are made, at least 70% of our total assets are qualifying assets (with certain limited exceptions). Qualifying assets include investments in “eligible portfolio companies.” Pursuant to rules adopted by the SEC, “eligible portfolio companies” include certain companies that do not have any securities listed on a national securities exchange and public companies whose securities are listed on a national securities exchange but whose market capitalization is less than $250 million.
The Investment Adviser
Our investment activities are managed by the Adviser, which is responsible for originating prospective investments, conducting research and due diligence investigations on potential investments, analyzing investment opportunities, negotiating and structuring our investments and monitoring our investments and portfolio companies on an ongoing basis. The Adviser has entered into a resource sharing agreement with Crescent, pursuant to which Crescent provides the Adviser with experienced investment professionals (including the members of the Adviser’s investment committee) and access to Crescent’s resources so as to enable the Adviser to fulfill its obligations under the Investment Advisory Agreement. Through the resource sharing agreement, the Adviser intends to capitalize on the deal origination, credit underwriting, due diligence, investment structuring, execution, portfolio management and monitoring experience of Crescent’s investment professionals. On January 5, 2021, Sun Life Financial Inc. (together with its subsidiaries
52
and joint ventures, “Sun Life”) acquired a majority interest in Crescent (the “Sun Life Transaction”). There were no changes to our investment objective, strategies and process or to the Crescent team responsible for the investment operations as a result of the Sun Life Transaction.
Revenues
We generate revenue primarily in the form of interest income on debt investments, capital gains and distributions, if any, on equity securities that we may acquire in portfolio companies. Certain investments may have contractual PIK interest or dividends. PIK represents accrued interest or accumulated dividends that are added to the loan principal of the investment on the respective interest or dividend payment dates rather than being paid in cash and generally becomes due at maturity or upon being called by the issuer. PIK is recorded as interest or dividend income, as applicable.
Dividend income from common equity securities is recorded on the record date for private portfolio companies or on the ex-dividend date for publicly-traded portfolio companies. Dividend income from preferred equity securities is recorded on an accrual basis to the extent that such amounts are payable by the portfolio company and are expected to be collected.
We may receive other income, which may include income such as consent, waiver, amendment, underwriting, and arranger fees associated with our investment activities as well as any fees for managerial assistance services rendered to the portfolio companies. Such fees are recognized as income when earned or the services are rendered.
We also generate revenue in the form of commitment or origination fees. Loan origination fees, original issue discount and market discount or premium are capitalized, and we accrete or amortize such amounts into income over the life of the loan using the effective yield method.
Expenses
Our primary operating expenses include the payment of management fees and incentive fees to the Adviser under the Investment Advisory Agreement, as amended, our allocable portion of overhead expenses under the administration agreement with our Administrator (the “Administration Agreement”), operating costs associated with our sub-administration agreement with State Street Bank and Trust Company and other operating costs described below. The management and incentive fees compensate the Adviser for its work in identifying, evaluating, negotiating, closing and monitoring our investments. We bear all other out-of-pocket costs and expenses of our operations and transactions, including:
| • | the cost of calculating our net asset value, including the cost of any third-party valuation services; |
| • | fidelity bond, directors’ and officers’ liability insurance and other insurance premiums; |
| • | fees and expenses associated with independent audits and outside legal costs; |
| • | independent directors’ fees and expenses; |
| • | administration fees and expenses, if any, payable under the Administration Agreement (including payments based upon our allocable portion of the Administrator’s overhead in performing its obligations under the Administration Agreement, rent and the allocable portion of the cost of certain professional services provided to us, including but not limited to, our compliance professionals, our legal counsel and other professionals); |
| • | U.S. federal, state and local taxes; |
| • | the cost of effecting sales and repurchases of shares of our common stock and other securities; |
| • | fees payable to third parties relating to making investments, including out-of-pocket fees and expenses associated with performing due diligence and reviews of prospective investments; |
| • | out-of-pocket fees and expenses associated with marketing efforts; |
| • | federal and state registration fees and any stock exchange listing fees; |
| • | brokerage commissions; |
| • | costs associated with our reporting and compliance obligations under the 1940 Act and other applicable U.S. federal and state securities laws; |
| • | debt service and other costs of borrowings or other financing arrangements; and |
| • | all other expenses reasonably incurred by us in connection with making investments and administering our business. |
We expect our general and administrative expenses to be relatively stable or decline as a percentage of total assets during periods of asset growth and to increase during periods of asset declines.
53
Leverage
Our financing facilities allow us to borrow money and lever our investment portfolio, subject to the limitations of the 1940 Act, with the objective of increasing our yield. This is known as “leverage” and could increase or decrease returns to our stockholders. The use of leverage involves significant risks.
Prior to the Small Business Credit Availability Act being signed into law, a BDC generally was not permitted to incur indebtedness unless immediately after such borrowing it has an asset coverage for total borrowings of at least 200%. The Small Business Credit Availability Act, signed into law on March 23, 2018, contains a provision that grants a BDC the option, subject to certain conditions and disclosure obligations, to reduce the asset coverage requirement to 150%. On March 3, 2020, our Board of Directors approved, and on May 4, 2020, at an annual meeting of our stockholders, our stockholders approved, the application to us of the reduced asset coverage requirements in Section 61(a) of the 1940 Act. The application of the reduced asset coverage requirement, which became effective on May 4, 2020, permits us, provided certain requirements are satisfied, to double the maximum amount of leverage that it is permitted to incur by reducing the asset coverage requirement applicable to us from 200% to 150% (i.e., we are permitted to borrow up to two dollars for every dollar we have in assets less all liabilities and indebtedness not represented by senior securities issued by us) in order to issue senior securities. Short-term credits necessary for the settlement of securities transactions and arrangements with respect to securities lending will not be considered borrowings for these purposes. The amount of leverage that we employ depends on our Adviser’s and our Board’s assessment of market conditions and other factors at the time of any proposed borrowing.
PORTFOLIO INVESTMENT ACTIVITY
We seek to create a broad and diversified portfolio that generally includes senior secured first lien, unitranche, senior secured second lien and subordinated loans and minority equity securities of U.S. middle market companies. The size of our individual investments will vary proportionately with the size of our capital base. We generally invest in securities that have been rated below investment grade by independent rating agencies or that would be rated below investment grade if they were rated. These securities have speculative characteristics with respect to the issuer’s capacity to pay interest and repay principal. In addition, many of our debt investments have floating interest rates that reset on a periodic basis and typically do not fully pay down principal prior to maturity.
As of December 31, 2020 and 2019, our portfolio at fair value was comprised of the following:
| December 31, 2020 | December 31, 2019 | |||||||||||||||
| ($ in millions) Investment Type |
Fair Value | Percentage | Fair Value | Percentage | ||||||||||||
| Senior Secured First Lien |
$ | 373.6 | 36.1 | % | $ | 351.3 | 48.3 | % | ||||||||
| Unitranche First Lien |
413.6 | 40.0 | 218.3 | 30.1 | ||||||||||||
| Unitranche First Lien - Last Out |
14.9 | 1.5 | 16.2 | 2.2 | ||||||||||||
| Senior Secured Second Lien |
104.7 | 10.1 | 58.9 | 8.1 | ||||||||||||
| Unsecured Debt |
3.0 | 0.3 | 7.4 | 1.0 | ||||||||||||
| Equity & Other |
69.3 | 6.7 | 21.4 | 3.0 | ||||||||||||
| LLC/LP Equity Interests |
54.9 | 5.3 | 53.0 | 7.3 | ||||||||||||
|
|
|
|
|
|
|
|
|
|||||||||
| Total investments |
$ | 1,034.0 | 100.0 | % | $ | 726.5 | 100.0 | % | ||||||||
|
|
|
|
|
|
|
|
|
|||||||||
54
The following table shows our investment activity by investment type:
| Year Ended | ||||||||
| ($ in millions) |
December 31, 2020 (1) | December 31, 2019 | ||||||
| New investments at cost: |
||||||||
| Senior Secured First Lien |
$ | 110.8 | $ | 140.7 | ||||
| Unitranche First Lien |
204.2 | 166.9 | ||||||
| Unitranche First Lien - Last Out |
— | 16.0 | ||||||
| Senior Secured Second Lien |
17.9 | 4.4 | ||||||
| Unsecured Debt |
0.8 | — | ||||||
| Equity & Other |
9.2 | 5.4 | ||||||
| LLC/LP Equity Interests |
9.5 | 44.9 | ||||||
|
|
|
|
|
|||||
| Total |
$ | 352.4 | $ | 378.3 | ||||
|
|
|
|
|
|||||
| Proceeds from investments sold or repaid: |
||||||||
| Senior Secured First Lien |
$ | 165.3 | $ | 78.4 | ||||
| Unitranche First Lien |
57.0 | 41.3 | ||||||
| Unitranche First Lien - Last Out |
0.2 | 0.2 | ||||||
| Senior Secured Second Lien |
24.2 | 14.2 | ||||||
| Unsecured Debt |
6.5 | — | ||||||
| Equity & Other |
0.5 | 2.0 | ||||||
| LLC/LP Equity Interests |
5.3 | 9.7 | ||||||
|
|
|
|
|
|||||
| Total |
$ | 259.0 | $ | 145.8 | ||||
|
|
|
|
|
|||||
| Net increase (decrease) in portfolio |
$ | 93.4 | $ | 232.5 | ||||
|
|
|
|
|
|||||
| (1) | Excludes $195.7 million of assets at cost acquired in connection with the Alcentra Acquisition. The assets acquired, at cost, were comprised of $82.2 million of senior secured first lien, $45.0 million of unitranche first lien, $53.0 million of senior secured second lien, $1.2 million of unsecured debt and $14.3 million of equity investments. |
The following table presents certain selected information regarding our investment portfolio as of December 31, 2020 and December 31, 2019:
| December 31, 2020 | December 31, 2019 | |||||||
| Weighted average yield on income producing securities (at cost) (1) |
8.0 | % | 8.1 | % (2) | ||||
| Percentage of debt bearing a floating rate (at fair value) |
98.4 | % | 97.9 | % | ||||
| Percentage of debt bearing a fixed rate (at fair value) |
1.6 | % | 2.1 | % | ||||
| Number of portfolio companies |
132 | 98 | ||||||
| (1) | Yield excludes investments on non-accrual status. |
| (2) | Prior period updated to conform to current period methodology. |
The following table shows the amortized cost of our performing and non-accrual debt and income producing debt securities as of December 31, 2020 and 2019.
| December 31, 2020 | December 31, 2019 | |||||||||||||||
| Amortized Cost | Percentage | Amortized Cost | Percentage | |||||||||||||
| Performing |
$ | 899.2 | 98.3 | % | $ | 645.4 | 98.1 | % | ||||||||
| Non-accrual |
15.6 | 1.7 | 12.6 | 1.9 | ||||||||||||
|
|
|
|
|
|
|
|
|
|||||||||
| Total income producing debt securities |
$ | 914.8 | 100.0 | % | $ | 658.0 | 100.0 | % | ||||||||
|
|
|
|
|
|
|
|
|
|||||||||
Loans are generally placed on non-accrual status when there is reasonable doubt that principal or interest will be collected in full. Non-accrual loans are restored to accrual status when past due principal and interest is paid current and, in management’s judgment, are likely to remain current. Management may determine to not place a loan on non-accrual status if the loan has sufficient collateral value and is in the process of collection.
55
As of December 31, 2020, we had investments in two portfolio companies with three investment positions on non-accrual status, which represented 1.7% and 1.3% of the total debt investments at cost and fair value, respectively. As of December 31, 2019, we had an investment in one portfolio company with three investment positions on non-accrual status, which represented 1.9% and 1.0% of total debt investments at cost and fair value, respectively. The remaining debt investments were performing and current on their interest payments as of December 31, 2020 and 2019.
The Adviser monitors our portfolio companies on an ongoing basis. The Adviser monitors the financial trends of each portfolio company to determine if it is meeting its business plans and to assess the appropriate course of action for each company. The Adviser has a number of methods of evaluating and monitoring the performance and fair value of our investments, which may include the following:
| • | assessment of success of the portfolio company in adhering to its business plan and compliance with covenants; |
| • | review of monthly and quarterly financial statements and financial projections for portfolio companies. |
| • | contact with portfolio company management and, if appropriate, the financial or strategic sponsor, to discuss financial position, requirements and accomplishments; |
| • | comparisons to other companies in the industry; and |
| • | attendance and participation in board meetings. |
As part of the monitoring process, the Adviser regularly assesses the risk profile of each of our investments and, on a quarterly basis, grades each investment on a risk scale of 1 to 5. Risk assessment is not standardized in our industry and our risk assessment may not be comparable to ones used by our competitors. Our assessment is based on the following categories:
| 1 | Involves the least amount of risk in our portfolio. The investment/borrower is performing above expectations since investment, and the trends and risk factors are generally favorable, which may include the financial performance of the borrower or a potential exit. |
| 2 | Involves an acceptable level of risk that is similar to the risk at the time of investment. The investment/borrower is generally performing as expected, and the risk factors are neutral to favorable. |
| 3 | Involves an investment/borrower performing below expectations and indicates that the investment’s risk has increased somewhat since investment. The borrower’s loan payments are generally not past due and more likely than not the borrower will remain in compliance with debt covenants. An investment rating of 3 requires closer monitoring. |
| 4 | Involves an investment/borrower performing materially below expectations and indicates that the loan’s risk has increased materially since investment. In addition to the borrower being generally out of compliance with debt covenants, loan payments may be past due (but generally not more than 180 days past due). Placing loans on non-accrual status should be considered for investments rated 4. |
| 5 | Involves an investment/borrower performing substantially below expectations and indicates that the loan’s risk has substantially increased since investment. Most or all of the debt covenants are out of compliance and payments are substantially delinquent. Loans rated 5 are not anticipated to be repaid in full and the fair market values of the loans are generally reduced to the anticipated recovery amounts. Loans with an investment rating of 5 are generally placed on non-accrual status. |
The following table shows the distribution of our investments on the 1 to 5 investment performance rating scale at fair value as of December 31, 2020 and 2019. Investment performance ratings are accurate only as of those dates and may change due to subsequent developments relating to a portfolio company’s business or financial condition, market conditions or developments, and other factors.
| ($ in millions) | December 31, 2020 | December 31, 2019 | ||||||||||||||
| Investment Performance Rating |
Investments at Fair Value |
Percentage of Total Portfolio |
Investments at Fair Value |
Percentage of Total Portfolio |
||||||||||||
| 1 |
$ | 9.8 | 0.9 | % | $ | 19.1 | 2.6 | % | ||||||||
| 2 |
895.1 | 86.6 | 653.1 | 89.9 | ||||||||||||
| 3 |
117.0 | 11.3 | 47.8 | 6.6 | ||||||||||||
| 4 |
12.1 | 1.2 | 6.5 | 0.9 | ||||||||||||
| 5 |
— | — | — | — | ||||||||||||
|
|
|
|
|
|
|
|
|
|||||||||
| Total |
$ | 1,034.0 | 100.0 | % | $ | 726.5 | 100.0 | % | ||||||||
|
|
|
|
|
|
|
|
|
|||||||||
56
RESULTS OF OPERATIONS
Operating results for the years ended December 31, 2020 and 2019 were as follows:
| For the years ended | ||||||||
| December 31, 2020 | December 31, 2019 | |||||||
| ($ in millions) |
||||||||
| Total investment income |
$ | 77.1 | $ | 53.5 | ||||
| Total net expenses |
27.2 | 21.8 | ||||||
|
|
|
|
|
|||||
| Net investment income |
$ | 49.9 | $ | 31.7 | ||||
| Net realized gain (loss) on investments (1) |
(15.3 | ) | (7.2 | ) | ||||
| Net unrealized appreciation (depreciation) on investments (1) (2) |
24.1 | 5.0 | ||||||
|
|
|
|
|
|||||
| Net realized and unrealized gains (losses) on investments |
$ | 8.8 | $ | (2.2 | ) | |||
|
|
|
|
|
|||||
| Realized loss on asset acquisition |
(3.8 | ) | — | |||||
| Benefit/(Provision) for taxes on realized and unrealized appreciation (depreciation) on investments |
(0.2 | ) | (0.2 | ) | ||||
|
|
|
|
|
|||||
| Net increase (decrease) in net assets resulting from operations |
$ | 54.7 | $ | 29.3 | ||||
|
|
|
|
|
|||||
| (1) | Includes gains and losses related to foreign currency transactions and translation. |
| (2) | Includes gains and losses related to foreign currency forward contracts. |
Investment Income
| For the years ended | ||||||||
| December 31, 2020 | December 31, 2019 | |||||||
| ($ in millions) |
||||||||
| Interest from investments |
$ | 71.1 | $ | 47.7 | ||||
| Dividend Income |
4.9 | 5.0 | ||||||
| Other income |
1.1 | 0.8 | ||||||
|
|
|
|
|
|||||
| Total |
$ | 77.1 | $ | 53.5 | ||||
|
|
|
|
|
|||||
Interest income, which includes amortization of upfront fees, increased from $47.7 million for the year ended December 31, 2019 to $71.1 million for the year ended December 31, 2020, due to an increase in the size of our portfolio related to the Alcentra Acquisition and organic net deployment. Included in interest from investments for the years ended December 31, 2020 and 2019 are $2.3 million and $1.4 million of accelerated accretion of OID, respectively.
Dividend income remained relatively flat for the years ended December 31, 2020 and 2019. Other income which includes amendment fees, amortization of loan administration fees and other fees increased modestly as a result of a growing investment portfolio.
57
Expenses
| For the years ended | ||||||||
| December 31, 2020 | December 31, 2019 | |||||||
| ($ in millions) |
||||||||
| Interest and other debt financing costs |
$ | 15.5 | $ | 13.4 | ||||
| Management fees |
11.4 | 9.2 | ||||||
| Incentive fees |
8.6 | 4.8 | ||||||
| Professional fees |
1.5 | 0.9 | ||||||
| Directors’ fees |
0.4 | 0.3 | ||||||
| Organization expenses |
— | 0.1 | ||||||
| Other general and administrative expenses |
2.6 | 2.2 | ||||||
|
|
|
|
|
|||||
| Total expenses |
$ | 40.0 | $ | 30.9 | ||||
| Management fee waiver |
(4.7 | ) | (4.5 | ) | ||||
| Incentive fee waiver |
(8.6 | ) | (4.8 | ) | ||||
|
|
|
|
|
|||||
| Net expenses |
$ | 26.7 | $ | 21.6 | ||||
| Income and excise taxes |
0.5 | 0.2 | ||||||
|
|
|
|
|
|||||
| Total |
$ | 27.2 | $ | 21.8 | ||||
|
|
|
|
|
|||||
Interest and other debt financing costs
Interest and other debt financing costs include interest, amortization of deferred financing costs including upfront commitment fees and unused fees on our credit facilities. For the years ended December 31, 2020 and 2019 interest and debt financing costs were $15.5 million and $13.4 million, respectively. The increase between the periods is due to an increase in the debt outstanding in connection with financing needs of a growing investment portfolio. The increase in the debt outstanding was partially offset by a decrease in the average benchmark rates during the year ended December 31, 2020.
Base Management Fees
For the years ended December 31, 2020 and 2019, we incurred management fees of $6.7 million and $4.7 million, respectively, which are net of a waived amounts of $4.7 million and $4.5 million, respectively. As of December 31, 2020 and 2019, $1.9 million and $1.3 million of management fees, respectively, remained payable. The increase in net management fees is driven by growing assets under management.
The Adviser has voluntarily waived its right to receive management fees on our investment in GACP II LP for any period in which GACP II LP remains in the investment portfolio. For the years ended December 31, 2020 and 2019, $0.1 million and $0.1 million of management fees waived were attributable to our investment in GACP II LP.
Incentive Fees
For the years ended December 31, 2020 and 2019 we incurred income incentive fees of $8.6 million and $4.8 million, of which $8.6 million and $4.8 million, respectively, were waived. $0 was payable as of December 31, 2020 and 2019, respectively. For the years ended December 31, 2020 and 2019 we accrued no incentive fee on cumulative unrealized capital appreciation.
Professional Fees and Other General and Administrative Expenses
Professional fees generally include expenses from independent auditors, tax advisors, legal counsel and third party valuation agents. Other general and administrative expenses generally include expenses from the sub-administration agreement, insurance premiums, overhead and staffing costs allocated from the Administrator and other miscellaneous general and administrative costs associated with our operations and investment activity. For the years ended December 31, 2020 and 2019, professional fees were $1.5 million and $0.9 million, respectively. For the years ended December 31, 2020 and 2019, other general and administrative expenses were $2.6 million and $2.2 million, respectively. The net increase in expenses was due to an increase in costs associated with servicing a growing investment portfolio.
Organization expenses
We agreed to repay the Adviser for initial organization costs and equity offering costs incurred prior to the commencement of our operations up to a maximum of $1.5 million on a pro rata basis over the first $350.0 million of invested capital not to exceed 3 years from the initial capital commitment on June 26, 2015. The initial 3 year term was later extended to June 30, 2019, with shareholder approval. To the extent such costs related to equity offerings, these costs were charged as a reduction of capital upon the issuance of common shares. To the extent such costs related to organization costs, these costs were expensed in the Consolidated Statements of Operations upon the issuance of common shares. The Adviser was responsible for organization and private equity offerings costs in excess of $1.5 million. During the reimbursement period which began on June 26, 2015 and expired on June 30, 2019, the Adviser had allocated to us $0.8 million of equity offering costs and $0.6 million of organization costs.
58
Income and Excise Taxes
For the years ended December 31, 2020 and 2019, we expensed income and excise taxes of $0.5 million and $0.2 million, respectively. As of December 31, 2020 and 2019, $0.4 million and $0.1 million of excise taxes remained payable, respectively.
Net Realized and Unrealized Gains and Losses
We value our portfolio investments quarterly and any changes in fair value are recorded as unrealized appreciation (depreciation) on investments. For the years ended December 31, 2020 and 2019, net realized gains (losses) and net unrealized appreciation (depreciation) on our investment portfolio were comprised of the following:
| For the years ended | ||||||||
| December 31, 2020 | December 31, 2019 | |||||||
| ($ in millions) |
||||||||
| Realized losses on non-controlled and non-affiliated investments |
$ | (11.6 | ) | $ | (0.6 | ) | ||
| Realized gains on non-controlled and non-affiliated investments |
0.7 | 1.4 | ||||||
| Realized losses on non-controlled and affiliated investments |
(5.6 | ) | (7.9 | ) | ||||
| Realized gains on non-controlled and affiliated investments |
1.3 | — | ||||||
| Realized losses on controlled and affiliated investments |
— | — | ||||||
| Realized gains on controlled and affiliated investments |
— | — | ||||||
| Realized losses on foreign currency transactions |
(0.3 | ) | (0.6 | ) | ||||
| Realized gains on foreign currency transactions |
0.2 | 0.5 | ||||||
|
|
|
|
|
|||||
| Net realized gains (losses) on investments |
$ | (15.3 | ) | $ | (7.2 | ) | ||
|
|
|
|
|
|||||
| Change in unrealized depreciation on non-controlled and non-affiliated investments |
$ | (1.7 | ) | $ | (1.2 | ) | ||
| Change in unrealized appreciation on non-controlled and non-affiliated investments |
8.4 | 4.5 | ||||||
| Change in unrealized depreciation on foreign currency translation |
(0.5 | ) | (0.8 | ) | ||||
| Change in unrealized appreciation on foreign currency translation |
0.6 | 1.4 | ||||||
| Change in unrealized depreciation on non-controlled and affiliated investments |
(0.4 | ) | (0.9 | ) | ||||
| Change in unrealized appreciation on non-controlled and affiliated investments |
20.7 | 0.9 | ||||||
| Change in unrealized depreciation on controlled and affiliated investments |
(1.3 | ) | — | |||||
| Change in unrealized appreciation on controlled and affiliated investments |
(0.4 | ) | 0.4 | |||||
| Change in unrealized depreciation on foreign currency forwards |
(1.3 | ) | (0.1 | ) | ||||
| Change in unrealized appreciation on foreign currency forwards |
— | 0.8 | ||||||
|
|
|
|
|
|||||
| Net unrealized appreciation (depreciation) |
$ | 24.1 | $ | 5.0 | ||||
| Realized loss on asset acquisition |
(3.8 | ) | — | |||||
|
|
|
|
|
|||||
| Net realized and unrealized gains (losses) on investments and asset acquisition |
$ | 5.0 | $ | (2.2 | ) | |||
|
|
|
|
|
|||||
Hedging
We may, but are not required to, enter into interest rate, foreign exchange or other derivative agreements to hedge interest rate, currency, credit or other risks. Generally, we do not intend to enter into any such derivative agreements for speculative purposes. Any derivative agreements entered into for speculative purposes are not expected to be material to our business or results of operations. These hedging activities, which are in compliance with applicable legal and regulatory requirements, may include the use of various instruments, including futures, options and forward contracts. We bear the costs incurred in connection with entering into, administering and settling any such derivative contracts. There can be no assurance any hedging strategy we employ will be successful.
During the years ended December 31, 2020 and 2019, our average U.S. Dollar notional exposure to foreign currency forward contracts were $35.8 million and $23.3 million, respectively.
59
For the years ended December 31, 2019 and 2018
The comparison of the fiscal years ended December 31, 2019 and 2018 can be found in our annual report on Form 10-K for the fiscal year ended December 31, 2019 located within Part II, Item 7. Management’s Discussion and Analysis of Financial Condition and Results of Operations, which is incorporated by reference herein.
FINANCIAL CONDITION, LIQUIDITY AND CAPITAL RESOURCES
The primary uses of our cash and cash equivalents are for (1) investments in portfolio companies and other investments; (2) the cost of operations (including paying the Adviser); (3) debt service, repayment, and other financing costs; and (4) cash distributions to the holders of our common stock. We expect to generate additional liquidity from (1) borrowings from our SPV Asset Facility, Corporate Revolving Facility, Unsecured Notes, and from other banks, lenders, or future issuances of debt and equity securities; and, (2) cash flows from operations.
As of December 31, 2020, we had $14.8 million in cash and cash equivalents and restricted cash and cash equivalents and $139.9 million of undrawn capacity on our senior unsecured notes and revolving credit and special purpose vehicle asset facilities, subject to borrowing base and other limitations. As of December 31, 2020, the undrawn capacity under our facilities is in excess of our unfunded commitments.
As of December 31, 2020, we were in compliance with our asset coverage requirements under the 1940 Act. In addition, we were in compliance with all the financial covenant requirements of our credit facilities as of December 31, 2020. However, any continued increase in realized losses or unrealized depreciation of our investment portfolio or further significant reductions in our net asset value as a result of the effects of the COVID-19 pandemic, increase the risk of breaching the relevant covenants requirements. Any breach of these requirements may adversely affect the access to sufficient debt and equity capital.
We expect that the market and business disruption created by the COVID-19 pandemic will continue to impact certain aspects of our liquidity, and we are therefore continuously and critically monitoring our operating results, liquidity and anticipated capital requirements. It is impossible at this time to determine the full scope of this outbreak, or any future outbreaks, how long any such outbreak, market disruption or uncertainties may last, the effect any governmental actions will have or the full potential impact on our liquidity and overall performance.
Capital Share Activity
Between June 26, 2015, commencement of operations, and January 31, 2020, the date of Alcentra Acquisition, we entered into subscription agreements (collectively, the “Subscription Agreements”) with several investors, including Crescent, providing for the private placement of our common shares. Pursuant to the Subscription Agreements, between June 26, 2015 and January 31, 2020, we issued 23,127,335 common shares for aggregate proceeds of $456.3 million, of which $10.0 million was from Crescent. Proceeds from the issuances were used to fund our investing activities and for other general corporate purposes. Subsequently, on January 31, 2020, we issued 5,203,016 shares in connection with the Alcentra Acquisition. Upon closing of the Alcentra Acquisition, all unfunded commitments of stockholders subscribing in private offering were terminated.
During the years ended December 31, 2020 and 2019 we issued 30,128 shares and 76,969 shares of our common stock, respectively, to investors who have opted into our dividend reinvestment plan for proceeds of $0.6 million and $1.5 million, respectively.
Debt
Debt consisted of the following as of December 31, 2020 and 2019:
| December 31, 2020 | ||||||||||||||||||||||||
| Aggregate Principal Amount Committed |
Drawn Amount |
Amount Available (1) |
Carrying Value (2) |
Weighted Average Debt Outstanding |
Weighted Average Interest Rate |
|||||||||||||||||||
| SPV Asset Facility |
$ | 350.0 | $ | 260.2 | $ | 89.8 | $ | 260.2 | $ | 235.3 | 2.63 | % | ||||||||||||
| Corporate Revolving Facility |
200.0 | 149.9 | 50.1 | 149.9 | 150.4 | 2.93 | % | |||||||||||||||||
| Unsecured Notes |
50.0 | 50.0 | — | 50.0 | 15.0 | 6.49 | % | |||||||||||||||||
| InterNotes ® |
16.4 | 16.4 | — | 16.4 | 20.4 | 6.40 | % | |||||||||||||||||
|
|
|
|
|
|
|
|
|
|
|
|
|
|||||||||||||
| Total Debt |
$ | 616.4 | $ | 476.5 | $ | 139.9 | $ | 476.5 | $ | 421.1 | 3.26 | % | ||||||||||||
|
|
|
|
|
|
|
|
|
|
|
|
|
|||||||||||||
60
| December 31, 2019 | ||||||||||||||||||||||||
| Aggregate Principal Amount Committed |
Drawn Amount |
Amount Available (1) |
Carrying Value (2) |
Weighted Average Debt Outstanding |
Weighted Average Interest Rate |
|||||||||||||||||||
| SPV Asset Facility |
$ | 250.0 | $ | 220.7 | $ | 29.3 | $ | 220.7 | $ | 201.0 | 4.03 | % | ||||||||||||
| Corporate Revolving Facility |
200.0 | 104.7 | 95.3 | 104.7 | 74.9 | 4.26 | % | |||||||||||||||||
|
|
|
|
|
|
|
|
|
|
|
|
|
|||||||||||||
| Total Debt |
$ | 450.0 | $ | 325.4 | $ | 124.6 | $ | 325.4 | $ | 275.9 | 4.10 | % | ||||||||||||
|
|
|
|
|
|
|
|
|
|
|
|
|
|||||||||||||
| (1) | The amount available is subject to any limitations related to the respective debt facilities’ borrowing bases and foreign currency translation adjustments. |
| (2) | Amount presented excludes netting of deferred financing costs. |
SPV Asset Facility
On March 28, 2016, Crescent Capital BDC Funding, LLC (“CCAP SPV”), a wholly owned subsidiary of CCAP, entered into a loan and security agreement, as amended (the “SPV Asset Facility”) with us as the collateral manager, seller and equity holder, CCAP SPV as the borrower, the banks and other financial institutions from time to time party thereto as lenders, and Wells Fargo Bank, National Association (“Wells Fargo”), as administrative agent, collateral agent, and lender. We consolidate CCAP SPV in our consolidated financial statements and no gain or loss is recognized from the transfer of assets to and from CCAP SPV. Between February 8, 2017 and March 10, 2020, we have entered into multiple amendments to the SPV Asset Facility to, among other things, increase the facility limit from $75 million to $350 million.
The maximum commitment amount under the SPV Asset Facility is $350 million, and may be increased with the consent of Wells Fargo or reduced upon our request. Proceeds of the Advances under the SPV Asset Facility may be used to acquire portfolio investments, to make distributions to us in accordance with the SPV Asset Facility, and to pay related expenses. The maturity date is the earlier of (a) the date the borrower voluntarily reduces the commitments to zero, (b) March 10, 2025 (the Facility Maturity Date) and (c) the date upon which Wells Fargo declares the obligations due and payable after the occurrence of an Event of Default. Borrowings under the SPV Asset Facility bear interest at LIBOR plus a margin with no LIBOR floor. The margin is between 1.65% and 2.20% as determined by the proportion of liquid and illiquid loans pledged to the SPV Asset Facility. We pay unused facility fees of 0.50% per annum on committed but undrawn amounts under the SPV Asset Facility. The SPV Asset Facility includes customary covenants, including certain limitations on the incurrence of additional indebtedness and liens, as well as usual and customary events of default for revolving credit facilities of this nature.
The facility size is subject to availability under the borrowing base, which is based on the amount of CCAP SPV’s assets from time to time, and satisfaction of certain conditions, including an asset coverage test and certain concentration limits.
Corporate Revolving Facility
On August 20, 2019, we entered into the “Corporate Revolving Facility” with Ally Bank (“Ally”), as Administrative Agent and Arranger. Proceeds of the advances under the Revolving Credit Agreement may be used to acquire portfolio investments, to make distributions to us in accordance with the Revolving Credit Agreement and to pay related expenses. The maximum principal amount of the Corporate Revolving Facility is $200 million, subject to availability under the borrowing base.
Borrowings under the Corporate Revolving Facility bear interest at LIBOR plus a 2.35% margin, which includes a 0.05% utilization fee, with no LIBOR floor. We pay unused facility fees of 0.50% per annum on committed but undrawn amounts under the Corporate Revolving Facility. Interest is payable quarterly in arrears. Any amounts borrowed under the Corporate Revolving Facility, and all accrued and unpaid interest, will be due and payable, on August 20, 2024.
The Corporate Revolving Facility replaced the prior corporate revolving facility with Capital One, National Association. The maximum principal amount of the prior corporate revolving facility was $85 million, subject to availability under the borrowing base. Borrowings under the prior corporate revolving facility bore interest at LIBOR plus a 1.55% margin with no LIBOR floor. We paid unused facility fees of 0.20% per annum on committed but undrawn amounts. Interest was payable monthly in arrears. We paid down in full and terminated the prior corporate revolving facility on August 20, 2019.
Unsecured Notes
On July 30, 2020, we completed a private offering of $50.0 million aggregate principal amount of 5.95% senior unsecured notes due July 30, 2023 (the “Unsecured Notes”). The Unsecured Notes have a delayed draw feature. The initial issuance of $25.0 million of Unsecured Notes closed July 30, 2020. The issuance of the remaining $25.0 million of Unsecured Notes closed on October 28, 2020.
61
The Unsecured Notes will mature on July 30, 2023 and may be redeemed in whole or in part, at our option, at any time or from time to time at par plus a “make-whole” premium, if applicable. Interest on the Unsecured Notes is due and payable semiannually in arrears on January 30th and July 30th of each year, commencing on January 30, 2021. As of December 31, 2020, we were in compliance with the terms of the note purchase agreement governing the Unsecured Notes.
Costs incurred in connection with issuing the Unsecured Notes are recorded as deferred financing costs and are being amortized over the life of the Unsecured Notes on an effective yield basis.
InterNotes®
On January 31, 2020, in connection with the Alcentra Acquisition, we assumed direct unsecured fixed interest rate obligations or “InterNotes®”. The majority of InterNotes® were issued by Alcentra Corporation between January 2015 and January 2016. Each series of notes has been issued by a separate trust administered by U.S. Bank. As of December 31, 2020, the outstanding InterNotes® bear interest at fixed interest rates ranging between 6.25% and 6.75% and offer a variety of maturities ranging between February 15, 2021 and April 15, 2022.
The summary of costs incurred in connection with the SPV Asset Facility, Corporate Revolving Facility, InterNotes®, Unsecured Notes, and prior corporate revolving facility for the years ended December 31, 2020 and 2019, were as follows:
($ in millions)
| For the years ended | ||||||||
| December 31, 2020 | December 31, 2019 | |||||||
| Borrowing interest expense |
$ | 13.4 | $ | 12.1 | ||||
| Unused facility fees |
0.8 | 0.2 | ||||||
| Amortization of financing costs |
1.3 | 1.1 | ||||||
|
|
|
|
|
|||||
| Total interest and credit facility expenses |
$ | 15.5 | $ | 13.4 | ||||
|
|
|
|
|
|||||
| Weighted average outstanding balance |
$ | 421.1 | $ | 275.9 | ||||
To the extent we determine that additional capital would allow us to take advantage of additional investment opportunities, if the market for debt financing presents attractively priced opportunities, or if our Board otherwise determines that leveraging our portfolio would be in our best interest and the best interests of our stockholders, we may enter into new debt financing opportunities in addition to our existing debt. The pricing and other terms of any such opportunities would depend upon market conditions and the performance of our business, among other factors.
In accordance with applicable SEC staff guidance and interpretations, effective May 5, 2020 with shareholder approval, we, as a BDC, are permitted to borrow amounts such that our asset coverage ratio is at least 150% after such borrowing (if certain requirements are met), rather than 200%, as previously required. Short-term credits necessary for the settlement of securities transactions and arrangements with respect to securities lending will not be considered borrowings for these purposes. The amount of leverage that we employ depends on our Adviser’s and our Board’s assessment of market conditions and other factors at the time of any proposed borrowing.
As of December 31, 2020 and 2019, our asset coverage ratio was 217% and 225%, respectively. We may also refinance or repay any of our indebtedness at any time based on our financial condition and market conditions. See Note 6. Debt to our consolidated financial statements for more detail on the debt facilities.
STOCK REPURCHASE PROGRAM
On January 31, 2020, we entered into a $20.0 million repurchase plan which allowed us to purchase shares in the open market any time our common stock traded below 90% of the most recently disclosed net asset value per share. The plan was subject to compliance with our liquidity, covenant, leverage and regulatory requirements. Pursuant to the terms of the repurchase plan, repurchases began on March 2, 2020. On April 9, 2020, our Board of Directors unanimously approved the termination of the stock repurchase program.
For the year ended December 31, 2020, we repurchased 192,415 shares at an average price per share, including commissions, of $11.48. There were no stock repurchased for the years ended December 31, 2019.
OFF BALANCE SHEET ARRANGEMENTS
Our investment portfolio may contain investments that are in the form of lines of credit or unfunded commitments which require us to provide funding when requested by portfolio companies in accordance with the terms of the underlying agreements. Unfunded commitments to provide funds to portfolio companies are not reflected on our Consolidated Statements of Assets and Liabilities.
62
These commitments are subject to the same underwriting and ongoing portfolio maintenance as are the on-balance sheet financial instruments that we hold. Since these commitments may expire without being drawn upon, the total commitment amount does not necessarily represent future cash requirements. As of December 31, 2020 and 2019, we had aggregate unfunded commitments totaling $80.8 million and $82.7 million, respectively. The foreign denominated commitments were converted to USD at each balance sheet date.
RECENT DEVELOPMENTS
On January 5, 2021, Sun Life Financial Inc. acquired a majority interest in Crescent. Consummation of the Sun Life Transaction resulted in a change of control of Crescent. There were no changes to our investment objective, strategies and process or to the Crescent team responsible for the investment operations as a result of the Sun Life Transaction.
On February 15, 2021, $5.4 million of InterNotes® matured and were redeemed at par. We provided notice to redeem the remaining $11.0 million of InterNotes® which is expected to be paid off on March 19, 2021.
On February 17, 2021, we completed a private offering of $135.0 million aggregate principal amount of 4.00% senior unsecured notes due February 17, 2026 (the “2026 Unsecured Notes”). The 2026 Unsecured Notes have a delayed draw feature. The initial issuance of $50.0 million of Unsecured Notes closed February 17, 2021. The issuance of the remaining $85.0 million of 2026 Unsecured Notes is expected to close on or before May 17, 2021.
On February 22, 2021, our Board of Directors declared a regular cash dividend of $0.41 per share, which will be paid on April 15, 2021 to stockholders of record as of March 31, 2021.
On February 22, 2021, the Adviser notified the Board of Directors of its intent to voluntarily waive incentive fees to the extent net investment income falls short of the declared dividend on a full dollar basis. The waiver will become effective upon expiration of the current waivers on July 31, 2021 and will continue through December 31, 2022.
| ITEM 7A. | QUANTITATIVE AND QUALITATIVE DISCLOSURES ABOUT MARKET RISK |
We are subject to financial market risks, including valuation risk, interest rate risk and currency risk.
Valuation Risk
We have invested, and plan to continue to invest, in illiquid debt and equity securities of private companies. These investments will generally not have a readily available market price, and we will value these investments at fair value as determined in good faith by our Board in accordance with our valuation policy. There is no single standard for determining fair value in good faith. As a result, determining fair value requires that judgment be applied to the specific facts and circumstances of each portfolio investment while employing a consistently applied valuation process for the types of investments we make. If we were required to liquidate a portfolio investment in a forced or liquidation sale, we may realize amounts that are different from the amounts presented and such differences could be material. See Note 2. Summary of Significant Account Policies to our consolidated financial statements for more details on estimates and judgments made by us in connection with the valuation of our investments.
Interest Rate Risk
Interest rate sensitivity refers to the change in earnings that may result from changes in the level of interest rates. We also fund a portion of our investments with borrowings and our net investment income will be affected by the difference between the rate at which we invest and the rate at which we borrow. Accordingly, there can be no assurance that a significant change in market interest rates will not have a material adverse effect on our net investment income.
We regularly measure our exposure to interest rate risk. We assess interest rate risk and manage our interest rate exposure on an ongoing basis by comparing our interest rate-sensitive assets to our interest rate-sensitive liabilities. Based on that review, we determine whether or not any hedging transactions are necessary to mitigate exposure to changes in interest rates.
As of December 31, 2020, 98.4% of the investments at fair value in our portfolio were at variable rates, subject to interest rate floors. The SPV Asset Facility and Corporate Revolving Facility also bear interest at variable rates.
63
Assuming that our Consolidated Statements of Assets and Liabilities as of December 31, 2020 were to remain constant and that we took no actions to alter our existing interest rate sensitivity, the following table shows the annualized impact of hypothetical base rate changes in interest rates (considering interest rate floors for floating rate instruments):
($ in millions)
| Basis Point Change |
Interest Income | Interest Expense | Increase (decrease) in net assets resulting from operations |
|||||||||
| Up 300 basis points |
$ | 27.3 | $ | 12.3 | $ | 15.0 | ||||||
| Up 200 basis points |
18.2 | 8.2 | 10.0 | |||||||||
| Up 100 basis points |
9.1 | 4.1 | 5.0 | |||||||||
| Down 25 basis points |
(0.4 | ) | (1.0 | ) | 0.6 | |||||||
| Down 100 basis points |
(0.4 | ) | (1.0 | ) | 0.6 | |||||||
Although we believe that this analysis is indicative of our existing sensitivity to interest rate changes, it does not adjust for changes in the credit market, credit quality, the size and composition of the assets in our portfolio and other business developments that could affect our net income. Accordingly, we cannot assure you that actual results would not differ materially from the analysis above.
We may in the future hedge against interest rate fluctuations by using hedging instruments such as interest rate swaps, futures, options and forward contracts. While hedging activities may mitigate our exposure to adverse fluctuations in interest rates, certain hedging transactions that we may enter into in the future, such as interest rate swap agreements, may also limit our ability to participate in the benefits of lower interest rates with respect to our portfolio investments.
Currency Risk
From time to time, we may make investments that are denominated in a foreign currency. These investments are converted into U.S. dollars at the balance sheet date, exposing us to movements in foreign exchange rates. We may employ hedging techniques to minimize these risks, but we cannot assure you that such strategies will be effective or without risk to us. We may seek to utilize instruments such as, but not limited to, forward contracts to seek to hedge against fluctuations in the relative values of our portfolio positions from changes in currency exchange rates. To the extent the loan or investment is based on a floating rate, we may seek to utilize interest rate derivatives to hedge our exposure to changes in the associated rate. As of December 31, 2020, we had £9.4 million, €16.1 million and CAD $12.6 million notional exposure to foreign currency forward contracts related to investments totaling £9.7 million, €16.7 million and CAD $13.1 million of par value.
64
ITEM 8. CONSOLIDATED FINANCIAL STATEMENTS AND SUPPLEMENTARY DATA
CRESCENT CAPITAL BDC, INC.
INDEX TO CONSOLIDATED FINANCIAL STATEMENTS
65
Report of Independent Registered Public Accounting Firm
To the Shareholders and the Board of Directors of Crescent Capital BDC, Inc.
Opinion on the Financial Statements
We have audited the accompanying consolidated statements of assets and liabilities of Crescent Capital BDC, Inc. (the Company), including the consolidated schedules of investments, as of December 31, 2020 and 2019, the related consolidated statements of operations, changes in net assets and cash flows for each of the three years in the period ended December 31, 2020, and the related notes (collectively referred to as the “consolidated financial statements”). In our opinion, the consolidated financial statements present fairly, in all material respects, the financial position of the Company at December 31, 2020 and 2019, and the results of its operations, changes in its net assets, and its cash flows for each of the three years in the period ended December 31, 2020, in conformity with U.S. generally accepted accounting principles.
Basis for Opinion
These financial statements are the responsibility of the Company’s management. Our responsibility is to express an opinion on the Company’s financial statements based on our audits. We are a public accounting firm registered with the Public Company Accounting Oversight Board (United States) (PCAOB) and are required to be independent with respect to the Company in accordance with the U.S. federal securities laws and the applicable rules and regulations of the Securities and Exchange Commission and the PCAOB.
We conducted our audits in accordance with the standards of the PCAOB. Those standards require that we plan and perform the audit to obtain reasonable assurance about whether the financial statements are free of material misstatement, whether due to error or fraud. The Company is not required to have, nor were we engaged to perform, an audit of the Company’s internal control over financial reporting. As part of our audits we are required to obtain an understanding of internal control over financial reporting but not for the purpose of expressing an opinion on the effectiveness of the Company’s internal control over financial reporting. Accordingly, we express no such opinion.
Our audits included performing procedures to assess the risks of material misstatement of the financial statements, whether due to error or fraud, and performing procedures that respond to those risks. Such procedures included examining, on a test basis, evidence regarding the amounts and disclosures in the financial statements. Our procedures included confirmation of investments owned as of December 31, 2020 and 2019, by correspondence with the custodian, syndication agents and underlying investee companies, or by other appropriate auditing procedures where confirmation was not received. Our audits also included evaluating the accounting principles used and significant estimates made by management, as well as evaluating the overall presentation of the financial statements. We believe that our audits provide a reasonable basis for our opinion.
/s/ Ernst & Young LLP
We have served as the Company’s auditor since 2015.
Los Angeles, California
February 24, 2021
66
Consolidated Statements of Assets and Liabilities
(in thousands, except share and per share data)
| As of December 31, 2020 |
As of December 31, 2019 |
|||||||
| Assets |
||||||||
| Investments, at fair value |
||||||||
| Non-controlled non-affiliated (cost of $936,921 and $675,329, respectively) |
$ | 940,066 | $ | 671,582 | ||||
| Non-controlled affiliated (cost of $34,203 and $19,766, respectively) |
55,200 | 20,507 | ||||||
| Controlled (cost of $40,000 and $34,000, respectively) |
38,735 | 34,442 | ||||||
| Cash and cash equivalents |
1,896 | 4,576 | ||||||
| Restricted cash and cash equivalents |
12,953 | 8,851 | ||||||
| Interest receivable |
3,859 | 2,832 | ||||||
| Deferred tax assets |
630 | 421 | ||||||
| Other assets |
543 | 3,046 | ||||||
| Unrealized appreciation on foreign currency forward contracts |
264 | 758 | ||||||
| Receivable for investments sold |
6 | 160 | ||||||
|
|
|
|
|
|||||
| Total assets |
$ | 1,054,152 | $ | 747,175 | ||||
|
|
|
|
|
|||||
| Liabilities |
| |||||||
| Debt (net of deferred financing costs of $4,600 and $3,431, respectively) |
$ | 471,932 | $ | 322,010 | ||||
| Distributions payable |
11,549 | 8,554 | ||||||
| Interest and other debt financing costs payable |
3,923 | 3,545 | ||||||
| Accrued expenses and other liabilities |
2,563 | 3,788 | ||||||
| Management fees payable |
1,867 | 1,343 | ||||||
| Deferred tax liabilities |
1,324 | 879 | ||||||
| Unrealized depreciation on foreign currency forward contracts |
896 | 65 | ||||||
| Directors’ fees payable |
98 | 74 | ||||||
|
|
|
|
|
|||||
| Total liabilities |
$ | 494,152 | $ | 340,258 | ||||
|
|
|
|
|
|||||
| Commitments and Contingencies (Note 8) |
| |||||||
| Net Assets |
| |||||||
| Preferred stock, par value $0.001 per share (10,000 shares authorized, zero outstanding, respectively) |
$ | — | $ | — | ||||
| Common stock, par value $0.001 per share (200,000,000 shares authorized, 28,167,360 and 20,862,314 shares issued and outstanding, respectively) |
28 | 21 | ||||||
| Paid-in capital in excess of par value |
594,658 | 414,293 | ||||||
| Accumulated earnings (loss) |
(34,686 | ) | (7,397 | ) | ||||
|
|
|
|
|
|||||
| Total Net Assets |
$ | 560,000 | $ | 406,917 | ||||
|
|
|
|
|
|||||
| Total Liabilities and Net Assets |
$ | 1,054,152 | $ | 747,175 | ||||
|
|
|
|
|
|||||
| Net asset value per share |
$ | 19.88 | $ | 19.50 | ||||
See accompanying notes
67
Consolidated Statements of Operations
(in thousands, except share and per share data)
| For the year ended December 31, 2020 |
For the year ended December 31, 2019 |
For the year ended December 31, 2018 |
||||||||||
| Investment Income: |
| |||||||||||
| From non-controlled non-affiliated investments: |
| |||||||||||
| Interest income |
$ | 66,078 | $ | 45,237 | $ | 29,705 | ||||||
| Paid-in-kind interest |
2,169 | 560 | 454 | |||||||||
| Dividend income |
2,730 | 2,361 | 591 | |||||||||
| Other income |
1,060 | 807 | 641 | |||||||||
| From non-controlled affiliated investments: |
| |||||||||||
| Interest income |
1,420 | 1,902 | 1,904 | |||||||||
| Paid-in-kind interest |
1,456 | — | — | |||||||||
| Dividend income |
— | 310 | — | |||||||||
| From controlled investments: |
| |||||||||||
| Dividend income |
2,200 | 2,300 | — | |||||||||
|
|
|
|
|
|
|
|||||||
| Total investment income |
77,113 | 53,477 | 33,295 | |||||||||
|
|
|
|
|
|
|
|||||||
| Expenses: |
| |||||||||||
| Interest and other debt financing costs |
15,485 | 13,362 | 8,450 | |||||||||
| Management fees |
11,438 | 9,198 | 5,987 | |||||||||
| Incentive fees |
8,639 | 4,752 | 2,742 | |||||||||
| Professional fees |
1,460 | 957 | 760 | |||||||||
| Directors’ fees |
437 | 303 | 290 | |||||||||
| Organization expenses |
— | 136 | 154 | |||||||||
| Other general and administrative expenses |
2,544 | 2,201 | 1,851 | |||||||||
|
|
|
|
|
|
|
|||||||
| Total expenses |
40,003 | 30,909 | 20,234 | |||||||||
| Management fee waiver |
(4,672 | ) | (4,502 | ) | (2,602 | ) | ||||||
| Incentive fee waiver |
(8,639 | ) | (4,752 | ) | (2,187 | ) | ||||||
|
|
|
|
|
|
|
|||||||
| Net expenses |
26,692 | 21,655 | 15,445 | |||||||||
|
|
|
|
|
|
|
|||||||
| Net investment income before taxes |
50,421 | 31,822 | 17,850 | |||||||||
| Income and excise taxes |
541 | 139 | 121 | |||||||||
|
|
|
|
|
|
|
|||||||
| Net investment income |
49,880 | 31,683 | 17,729 | |||||||||
|
|
|
|
|
|
|
|||||||
| Net realized and unrealized gains (losses) on investments: |
| |||||||||||
| Net realized gain (loss) on: |
| |||||||||||
| Non-controlled non-affiliated investments |
(10,889 | ) | 824 | (467 | ) | |||||||
| Non-controlled affiliated investments |
(4,314 | ) | (7,900 | ) | — | |||||||
| Foreign currency transactions |
(83 | ) | (70 | ) | (79 | ) | ||||||
| Net change in unrealized appreciation (depreciation) on: |
| |||||||||||
| Non-controlled non-affiliated investments and foreign currency translation |
6,867 | 3,926 | (9,702 | ) | ||||||||
| Non-controlled affiliated investments |
20,256 | (80 | ) | 705 | ||||||||
| Controlled investments |
(1,707 | ) | 442 | — | ||||||||
| Foreign currency forward contracts |
(1,324 | ) | 675 | 17 | ||||||||
|
|
|
|
|
|
|
|||||||
| Net realized and unrealized gains (losses) on investments |
8,806 | (2,183 | ) | (9,526 | ) | |||||||
|
|
|
|
|
|
|
|||||||
| Realized loss on asset acquisition |
(3,825 | ) | — | — | ||||||||
|
|
|
|
|
|
|
|||||||
| Net realized and unrealized gains (losses) on investments and asset acquisition |
4,981 | (2,183 | ) | (9,526 | ) | |||||||
| Benefit (provision) for taxes on realized gain on investments |
46 | (67 | ) | — | ||||||||
| Benefit (provision) for taxes on unrealized appreciation (depreciation) on investments |
(235 | ) | (154 | ) | (88 | ) | ||||||
|
|
|
|
|
|
|
|||||||
| Net increase (decrease) in net assets resulting from operations |
$ | 54,672 | $ | 29,279 | $ | 8,115 | ||||||
|
|
|
|
|
|
|
|||||||
| Per Common Share Data: |
| |||||||||||
| Net increase in net assets resulting from operations per share (basic and diluted): |
$ | 1.98 | $ | 1.69 | $ | 0.76 | ||||||
| Net investment income per share (basic and diluted): |
$ | 1.80 | $ | 1.83 | $ | 1.65 | ||||||
| Weighted average shares outstanding (basic and diluted): |
27,681,757 | 17,344,640 | 10,719,485 | |||||||||
See accompanying notes
68
Consolidated Statements of Changes in Net Assets
(in thousands, except share and per share data)
| Common Stock | ||||||||||||||||||||
| Shares | Par Amount | Paid in Capital in Excess of Par Value |
Accumulated Earnings (Loss) |
Total Net Assets |
||||||||||||||||
| Balance at December 31, 2019 |
20,862,314 | $ | 21 | $ | 414,293 | $ | (7,397 | ) | $ | 406,917 | ||||||||||
| Net increase (decrease) in net assets resulting from operations: |
||||||||||||||||||||
| Net investment income |
— | — | — | 49,880 | 49,880 | |||||||||||||||
| Net realized gain (loss) on investments and foreign currency transactions |
— | — | — | (15,286 | ) | (15,286 | ) | |||||||||||||
| Net change in unrealized appreciation (depreciation) on investments, foreign currency forward contracts and foreign currency translation |
— | — | — | 24,092 | 24,092 | |||||||||||||||
| Realized loss on asset acquisition |
— | — | — | (3,825 | ) | (3,825 | ) | |||||||||||||
| Provision for taxes on realized gain on investment |
— | — | — | 46 | 46 | |||||||||||||||
| Benefit/(Provision) for taxes on unrealized appreciation/(depreciation) on investments |
— | — | — | (235 | ) | (235 | ) | |||||||||||||
| Stockholder distributions: |
| |||||||||||||||||||
| Issuance of common stock |
2,265,021 | 2 | 44,295 | — | 44,297 | |||||||||||||||
| Issuance in connection with asset acquisition (Note 14) |
5,202,312 | 5 | 101,944 | — | 101,949 | |||||||||||||||
| Issuance of common shares pursuant to dividend reinvestment plan |
30,128 | — | 589 | — | 589 | |||||||||||||||
| Repurchase of common stock |
(192,415 | ) | — | (2,208 | ) | — | (2,208 | ) | ||||||||||||
| Distributions to stockholders |
— | — | — | (46,216 | ) | (46,216 | ) | |||||||||||||
|
|
|
|
|
|
|
|
|
|
|
|||||||||||
| Total increase (decrease) for the year ended December 31, 2020 |
7,305,046 | 7 | 144,620 | 8,456 | 153,083 | |||||||||||||||
|
|
|
|
|
|
|
|
|
|
|
|||||||||||
| Tax reclassification of stockholders’ equity in accordance with GAAP |
— | — | 35,745 | (35,745 | ) | — | ||||||||||||||
| Balance at December 31, 2020 |
28,167,360 | $ | 28 | $ | 594,658 | $ | (34,686 | ) | $ | 560,000 | ||||||||||
|
|
|
|
|
|
|
|
|
|
|
|||||||||||
| Distributions declared per share |
$ | 1.64 | ||||||||||||||||||
|
|
|
|||||||||||||||||||
See accompanying notes
69
Crescent Capital BDC, Inc.
Consolidated Statements of Changes in Net Assets
(in thousands, except share and per share data)
| Common Stock | ||||||||||||||||||||
| Shares | Par Amount | Paid in Capital in Excess of Par Value |
Accumulated Earnings (Loss) |
Total Net Assets |
||||||||||||||||
| Balance at December 31, 2018 |
13,358,289 | $ | 13 | $ | 266,024 | $ | (6,458 | ) | $ | 259,579 | ||||||||||
| Net increase (decrease) in net assets resulting from operations: |
||||||||||||||||||||
| Net investment income |
— | — | — | 31,683 | 31,683 | |||||||||||||||
| Net realized gain (loss) on investments and foreign currency transactions |
— | — | — | (7,146 | ) | (7,146 | ) | |||||||||||||
| Net change in unrealized appreciation (depreciation) on investments, foreign currency forward contracts and foreign currency translation |
— | — | — | 4,963 | 4,963 | |||||||||||||||
| Provision for taxes on realized gain on investment |
— | — | — | (67 | ) | (67 | ) | |||||||||||||
| Benefit/(Provision) for taxes on unrealized appreciation/(depreciation) on investments |
— | — | — | (154 | ) | (154 | ) | |||||||||||||
| Stockholder distributions: |
||||||||||||||||||||
| Issuance of common stock |
7,427,056 | 7 | 145,993 | — | 146,000 | |||||||||||||||
| Issuance of common shares pursuant to dividend reinvestment plan |
76,969 | 1 | 1,508 | — | 1,509 | |||||||||||||||
| Equity offering costs |
— | — | (191 | ) | — | (191 | ) | |||||||||||||
| Distributions to stockholders |
— | — | — | (29,259 | ) | (29,259 | ) | |||||||||||||
|
|
|
|
|
|
|
|
|
|
|
|||||||||||
| Total increase (decrease) for the year ended December 31, 2019 |
7,504,025 | 8 | 147,310 | 20 | 147,338 | |||||||||||||||
|
|
|
|
|
|
|
|
|
|
|
|||||||||||
| Tax reclassification of stockholders’ equity in accordance with GAAP |
— | — | 959 | (959 | ) | — | ||||||||||||||
| Balance at December 31, 2019 |
20,862,314 | $ | 21 | $ | 414,293 | $ | (7,397 | ) | $ | 406,917 | ||||||||||
|
|
|
|
|
|
|
|
|
|
|
|||||||||||
| Distributions declared per share |
$ | 1.64 | ||||||||||||||||||
See accompanying notes
70
Crescent Capital BDC, Inc.
Consolidated Statements of Changes in Net Assets
(in thousands, except share and per share data)
| Common Stock | ||||||||||||||||||||
| Shares | Par Amount | Paid in Capital in Excess of Par Value |
Accumulated Earnings (Loss) |
Total Net Assets |
||||||||||||||||
| Balance at December 31, 2017 |
8,597,116 | $ | 9 | $ | 170,756 | $ | 2,035 | $ | 172,800 | |||||||||||
| Net increase (decrease) in net assets resulting from operations: |
||||||||||||||||||||
| Net investment income |
— | — | — | 17,729 | 17,729 | |||||||||||||||
| Net realized gain (loss) on investments and foreign currency transactions |
— | — | — | (546 | ) | (546 | ) | |||||||||||||
| Net change in unrealized appreciation (depreciation) on investments, foreign currency forward contracts and foreign currency translation |
— | — | — | (8,980 | ) | (8,980 | ) | |||||||||||||
| Benefit/(Provision) for taxes on unrealized appreciation/(depreciation) on investments |
— | — | — | (88 | ) | (88 | ) | |||||||||||||
| Stockholder distributions: |
||||||||||||||||||||
| Issuance of common stock |
4,731,259 | 4 | 94,996 | — | 95,000 | |||||||||||||||
| Issuance of common shares pursuant to dividend reinvestment plan |
29,914 | — | 600 | — | 600 | |||||||||||||||
| Equity offering costs |
— | — | (216 | ) | — | (216 | ) | |||||||||||||
| Distributions to stockholders |
— | — | — | (16,720 | ) | (16,720 | ) | |||||||||||||
|
|
|
|
|
|
|
|
|
|
|
|||||||||||
| Total increase (decrease) for the year ended December 31, 2018 |
4,761,173 | 4 | 95,380 | (8,605 | ) | 86,779 | ||||||||||||||
|
|
|
|
|
|
|
|
|
|
|
|||||||||||
| Tax reclassification of stockholders’ equity in accordance with GAAP |
— | — | (112 | ) | 112 | — | ||||||||||||||
| Balance at December 31, 2018 |
13,358,289 | $ | 13 | $ | 266,024 | $ | (6,458 | ) | $ | 259,579 | ||||||||||
|
|
|
|
|
|
|
|
|
|
|
|||||||||||
| Distributions declared per share |
$ | 1.47 | ||||||||||||||||||
|
|
|
|||||||||||||||||||
See accompanying notes
71
Consolidated Statements of Cash Flows
(in thousands, except share and per share data)
| For the year ended December 31, 2020 |
For the year ended December 31, 2019 |
For the year ended December 31, 2018 |
||||||||||
| Cash flows from operating activities: |
| |||||||||||
| Net increase (decrease) in net assets resulting from operations |
$ | 54,672 | $ | 29,279 | $ | 8,115 | ||||||
| Adjustments to reconcile net increase (decrease) in net assets resulting from
|
| |||||||||||
| Purchases of investments |
(352,392 | ) | (378,342 | ) | (291,155 | ) | ||||||
| Paid-in-kind interest income |
(3,625 | ) | (560 | ) | (454 | ) | ||||||
| Proceeds from sales of investments and principal repayments |
258,979 | 145,828 | 109,697 | |||||||||
| Net realized (gain) loss on investments and foreign currency transactions |
15,786 | 7,676 | 467 | |||||||||
| Realized loss on asset acquisition(2) |
3,825 | — | — | |||||||||
| Acquisition of Alcentra Capital Corporation, net of cash acquired(2) |
(12,884 | ) | — | — | ||||||||
| Net change in unrealized (appreciation) depreciation on investments and foreign currency translation |
(25,416 | ) | (4,288 | ) | 8,997 | |||||||
| Net change in unrealized (appreciation) depreciation on foreign currency forward contracts |
1,324 | (675 | ) | (17 | ) | |||||||
| Amortization of premium and accretion of discount, net |
(5,109 | ) | (3,016 | ) | (2,020 | ) | ||||||
| Amortization of deferred financing costs |
1,329 | 1,040 | 761 | |||||||||
| Change in operating assets and liabilities: |
| |||||||||||
| (Increase) decrease in receivable for investments sold |
549 | (123 | ) | (26 | ) | |||||||
| (Increase) decrease in interest receivable |
(25 | ) | (1,498 | ) | (1 | ) | ||||||
| (Increase) decrease in deferred tax asset |
(209 | ) | (121 | ) | — | |||||||
| (Increase) decrease in other assets |
2,480 | (3,026 | ) | 54 | ||||||||
| Increase (decrease) in payable for investments purchased |
— | (300 | ) | 300 | ||||||||
| Increase (decrease) in management fees payable |
524 | 380 | 228 | |||||||||
| Increase (decrease) in incentive fees payable |
— | — | (504 | ) | ||||||||
| Increase (decrease) in directors’ fees payable |
24 | 12 | 5 | |||||||||
| Increase (decrease) in interest and other debt financing costs payable |
(456 | ) | 1,695 | 832 | ||||||||
| Increase (decrease) in deferred tax liability |
445 | 275 | 88 | |||||||||
| Increase (decrease) in accrued expenses and other liabilities |
(1,620 | ) | 2,778 | 79 | ||||||||
|
|
|
|
|
|
|
|||||||
| Net cash provided by (used for) operating activities |
(61,799 | ) | (202,986 | ) | (164,554 | ) | ||||||
|
|
|
|
|
|
|
|||||||
| Cash flows from financing activities: |
| |||||||||||
| Issuance of common stock |
44,297 | 146,000 | 95,000 | |||||||||
| Repurchase of common stock |
(2,208 | ) | — | — | ||||||||
| Deferred financing and debt issuance costs paid |
(2,498 | ) | (2,776 | ) | (1,600 | ) | ||||||
| Distributions paid |
(42,632 | ) | (24,540 | ) | (13,484 | ) | ||||||
| Equity offering costs |
— | (191 | ) | (216 | ) | |||||||
| Borrowings on debt |
352,342 | 308,250 | 223,300 | |||||||||
| Repayments on debt |
(302,227 | ) | (220,746 | ) | (137,300 | ) | ||||||
| Issuance of unsecured debt |
50,000 | — | — | |||||||||
| Repayments on InterNotes ® |
(33,853 | ) | — | — | ||||||||
|
|
|
|
|
|
|
|||||||
| Net cash provided by (used for) financing activities |
63,221 | 205,997 | 165,700 | |||||||||
|
|
|
|
|
|
|
|||||||
| Effect of exchange rate changes on cash denominated in foreign currency |
— | 47 | (48 | ) | ||||||||
|
|
|
|
|
|
|
|||||||
| Net increase (decrease) in cash, cash equivalents, restricted cash and foreign currency |
1,422 | 3,058 | 1,098 | |||||||||
| Cash, cash equivalents, restricted cash and foreign currency, beginning of period |
13,427 | 10,369 | 9,271 | |||||||||
|
|
|
|
|
|
|
|||||||
| Cash, cash equivalents, restricted cash and foreign currency, end of period(1) |
$ | 14,849 | $ | 13,427 | $ | 10,369 | ||||||
|
|
|
|
|
|
|
|||||||
| Supplemental and non-cash financing activities: |
| |||||||||||
| Cash paid during the period for interest |
$ | 14,489 | $ | 10,626 | $ | 6,858 | ||||||
| Issuance of common stock pursuant to dividend reinvestment plan |
$ | 589 | $ | 1,509 | $ | 600 | ||||||
| Accrued but unpaid equity offering costs |
$ | — | $ | — | $ | 79 | ||||||
| Accrued but unpaid distributions |
$ | 11,549 | $ | 8,554 | $ | 5,343 | ||||||
| Issuance of shares in connection with asset acquisition (Note 14)(2) |
$ | 101,949 | $ | — | $ | — | ||||||
See accompanying notes
72
| (1) | As of December 31, 2020, the balance included cash and cash equivalents of $1,764, cash denominated in foreign currency of $132 and restricted cash of $12,953, respectively. As of December 31, 2019, the balance includes cash and cash equivalents of $3,867, cash denominated in foreign currency of $709, and restricted cash of $8,851, respectively. As of December 31, 2018, the balance includes cash and cash equivalents of $3,667, cash denominated in foreign currency of $559 and restricted cash of $6,143, respectively. |
| (2) | After the close of business on January 31, 2020, in connection with the Alcentra Acquisition (as defined in Note 1 and further discussed in Note 14), the Company acquired net assets of $114,431 which included $195,682 of investments, $3,409 cash and cash equivalents and $1,398 of other assets, net of $86,058 of assumed liabilities, for the total cash and stock consideration of $118,256, inclusive of $7,250 of asset acquisition costs. |
See accompanying notes
73
Consolidated Schedule of Investments
December 31, 2020
(in thousands, except share and per share data)
| Company/Security/Country |
Investment Type |
Interest |
Interest Rate |
Maturity/ Dissolution Date |
Principal Amount, Par Value or Shares |
Cost | Percentage of Net Assets ** |
Fair Value |
||||||||||||||||||||
| Investments(1) (2) |
||||||||||||||||||||||||||||
| United States |
||||||||||||||||||||||||||||
| Debt Investments |
||||||||||||||||||||||||||||
| Automobiles & Components |
||||||||||||||||||||||||||||
| Auto-Vehicle Parts, LLC(3) (4) (5) (6) |
Senior Secured First Lien Revolver |
01/2023 | $ | — | $ | (4 | ) | — | % | $ | (10 | ) | ||||||||||||||||
| Auto-Vehicle Parts, LLC(3) |
Senior Secured First Lien Term Loan |
L + 450 (100 Floor) (7) |
5.50 | % | 01/2023 | 4,566 | 4,535 | 0.8 | 4,488 | |||||||||||||||||||
| Continental Battery Company(3) |
Senior Secured First Lien Delayed Draw Term Loan |
L + 675 (100 Floor) (7) |
7.75 | % | 12/2022 | 6,578 | 6,522 | 1.2 | 6,578 | |||||||||||||||||||
| Continental Battery Company(3) (5) |
Senior Secured First Lien Delayed Draw Term Loan |
L + 675 (100 Floor) (7) |
7.75 | % | 12/2022 | 3,465 | 3,444 | 0.6 | 3,465 | |||||||||||||||||||
| Continental Battery Company(3) (5) (6) |
Senior Secured First Lien Revolver |
L + 675 (100 Floor) (7) |
7.75 | % | 12/2022 | 283 | 278 | 0.1 | 283 | |||||||||||||||||||
| Continental Battery Company(3) |
Senior Secured First Lien Term Loan |
L + 675 (100 Floor) (7) |
7.75 | % | 12/2022 | 3,933 | 3,902 | 0.7 | 3,933 | |||||||||||||||||||
| Empire Auto Parts, LLC(3) (4) (5) (6) |
Unitranche First Lien Revolver |
09/2024 | — | (5 | ) | — | (8 | ) | ||||||||||||||||||||
| Empire Auto Parts, LLC(3) |
Unitranche First Lien Term Loan |
L + 550 (100 Floor) (8) |
6.50 | % | 09/2024 | 2,370 | 2,334 | 0.4 | 2,324 | |||||||||||||||||||
| Empire Auto Parts, LLC(3) |
Unitranche First Lien Term Loan |
L + 550 (100 Floor) (8) |
6.50 | % | 09/2024 | 2,444 | 2,411 | 0.4 | 2,396 | |||||||||||||||||||
|
|
|
|
|
|
|
|
|
|||||||||||||||||||||
| 23,639 | 23,417 | 4.2 | 23,449 | |||||||||||||||||||||||||
|
|
|
|
|
|
|
|
|
|||||||||||||||||||||
| Capital Goods |
||||||||||||||||||||||||||||
| Envocore Holding, LLC(3) |
Senior Secured First Lien Term Loan |
L + 900 (200 Floor) (including 425 PIK) (8) |
11.00 | % | 06/2022 | 18,541 | 15,834 | 2.6 | 14,335 | |||||||||||||||||||
| Potter Electric Signal Company(3) (4) (6) (9) |
Senior Secured First Lien Delayed Draw Term Loan |
12/2024 | — | (16 | ) | — | (8 | ) | ||||||||||||||||||||
| Potter Electric Signal Company(3) (4) (5) (6) |
Senior Secured First Lien Revolver |
12/2022 | — | (4 | ) | — | (4 | ) | ||||||||||||||||||||
| Potter Electric Signal Company(3) |
Senior Secured First Lien Term Loan |
L + 425 (100 Floor) (8) |
5.25 | % | 12/2025 | 2,480 | 2,461 | 0.4 | 2,461 | |||||||||||||||||||
| Potter Electric Signal Company(3) |
Senior Secured First Lien Term Loan |
L + 425 (100 Floor) (8) |
5.25 | % | 12/2024 | 471 | 468 | 0.1 | 467 | |||||||||||||||||||
|
|
|
|
|
|
|
|
|
|||||||||||||||||||||
| 21,492 | 18,743 | 3.1 | 17,251 | |||||||||||||||||||||||||
|
|
|
|
|
|
|
|
|
|||||||||||||||||||||
| Commercial & Professional Services |
||||||||||||||||||||||||||||
| ASP MCS Acquisition Corp.(3) (10) |
Senior Secured Second Lien Term Loan |
L + 600 (100 Floor) (8) |
7.00 | % | 10/2025 | 295 | 273 | 0.1 | 293 | |||||||||||||||||||
| Battery Solutions, Inc.(3) (10) |
Unsecured Debt |
1200 + 200 PIK (11) |
14.00 | % | 11/2021 | 1,263 | 1,248 | 0.2 | 1,192 | |||||||||||||||||||
| BFC Solmetex LLC & Bonded Filter Co. LLC(3) (5) |
Unitranche First Lien Revolver |
L + 850 (100 Floor) (8) |
9.50 | % | 09/2023 | 750 | 742 | 0.1 | 750 | |||||||||||||||||||
| BFC Solmetex LLC & Bonded Filter Co. LLC(3) (5) |
Unitranche First Lien Revolver |
L + 850 (100 Floor) (8) |
9.50 | % | 09/2023 | 300 | 296 | 0.1 | 300 | |||||||||||||||||||
| BFC Solmetex LLC & Bonded Filter Co. LLC(3) |
Unitranche First Lien Term Loan |
L + 850 (100 Floor) (8) |
9.50 | % | 09/2023 | 5,920 | 5,848 | 1.0 | 5,920 | |||||||||||||||||||
| BFC Solmetex LLC & Bonded Filter Co. LLC(3) |
Unitranche First Lien Term Loan |
L + 850 (100 Floor) (8) |
9.50 | % | 09/2023 | 618 | 610 | 0.1 | 618 | |||||||||||||||||||
See accompanying notes
74
CRESCENT CAPITAL BDC, INC.
Consolidated Schedule of Investments
December 31, 2020
(in thousands, except share and per share data)
| Company/Security/Country |
Investment Type |
Interest |
Interest Rate |
Maturity/ Dissolution Date |
Principal Amount, Par Value or Shares |
Cost | Percentage of Net Assets ** |
Fair Value |
||||||||||||||||||
| CHA Holdings, Inc.(3) |
Senior Secured First Lien Delayed Draw Term Loan |
L + 450 (100 Floor) (8) | 5.50 | % | 04/2025 | $ | 1,013 | $ | 1,010 | 0.2 | % | $ | 987 | |||||||||||||
| CHA Holdings, Inc.(3) |
Senior Secured First Lien Term Loan |
L + 450 (100 Floor) (8) | 5.50 | % | 04/2025 | 4,805 | 4,789 | 0.8 | 4,683 | |||||||||||||||||
| Consolidated Label Co., LLC(3) (4) (5) (6) |
Senior Secured First Lien Revolver |
07/2026 | — | (12 | ) | — | — | |||||||||||||||||||
| Consolidated Label Co., LLC(3) |
Senior Secured First Lien Term Loan |
L + 575 (100 Floor) (8) | 6.75 | % | 07/2026 | 4,339 | 4,258 | 0.8 | 4,339 | |||||||||||||||||
| Digital Room Holdings, Inc.(3) |
Senior Secured First Lien Term Loan |
L + 500 (12) | 5.27 | % | 05/2026 | 6,895 | 6,602 | 1.2 | 6,533 | |||||||||||||||||
| GH Holding Company(3) |
Senior Secured First Lien Term Loan |
L + 450 (7) | 4.65 | % | 02/2023 | 1,459 | 1,455 | 0.2 | 1,412 | |||||||||||||||||
| GI Revelation Acquisition, LLC(3) |
Senior Secured First Lien Term Loan |
L + 500 (7) | 5.15 | % | 04/2025 | 7,321 | 7,296 | 1.3 | 7,049 | |||||||||||||||||
| Hepaco, LLC(3) (6) (9) |
Senior Secured First Lien Delayed Draw Term Loan |
L + 500 (100 Floor) (7) | 6.00 | % | 08/2024 | 4,156 | 4,130 | 0.7 | 3,999 | |||||||||||||||||
| Hepaco, LLC(3) (5) (6) |
Senior Secured First Lien Revolver |
L + 500 (100 Floor) (7) | 6.00 | % | 08/2024 | 825 | 824 | 0.1 | 791 | |||||||||||||||||
| Hepaco, LLC(3) |
Senior Secured First Lien Term Loan |
L + 500 (100 Floor) (7) | 6.00 | % | 08/2024 | 5,098 | 5,067 | 0.9 | 4,911 | |||||||||||||||||
| Hercules Borrower LLC(3) (4) (5) (6) |
Unitranche First Lien Revolver |
12/2026 | — | (55 | ) | — | (55 | ) | ||||||||||||||||||
| Hercules Borrower LLC(3) |
Unitranche First Lien Term Loan |
L + 650 (100 Floor) (8) | 7.50 | % | 12/2026 | 19,125 | 18,650 | 3.3 | 18,647 | |||||||||||||||||
| Hsid Acquisition, LLC(3) (9) |
Senior Secured First Lien Delayed Draw Term Loan |
L + 500 (100 Floor) (8) | 6.00 | % | 01/2026 | 2,893 | 2,844 | 0.5 | 2,893 | |||||||||||||||||
| Hsid Acquisition, LLC(3) (4) (5) (6) |
Senior Secured First Lien Revolver |
01/2026 | — | (13 | ) | — | — | |||||||||||||||||||
| Hsid Acquisition, LLC(3) |
Senior Secured First Lien Term Loan |
L + 500 (100 Floor) (7) | 6.00 | % | 01/2026 | 3,866 | 3,799 | 0.7 | 3,866 | |||||||||||||||||
| Impact Group, LLC(3) |
Senior Secured First Lien Term Loan |
L + 737 (100 Floor) (7) | 8.37 | % | 06/2023 | 7,040 | 5,455 | 1.2 | 6,585 | |||||||||||||||||
| Impact Sales, LLC(3) |
Senior Secured First Lien Delayed Draw Term Loan |
L + 737 (100 Floor) (7) | 8.37 | % | 06/2023 | 6,645 | 5,149 | 1.1 | 6,216 | |||||||||||||||||
| Institutional Shareholder Services, Inc.(3) |
Senior Secured First Lien Term Loan |
L + 450 (8) | 4.75 | % | 03/2026 | 2,948 | 2,909 | 0.5 | 2,936 | |||||||||||||||||
| Institutional Shareholder Services, Inc.(3) |
Senior Secured Second Lien Term Loan |
L + 850 (8) | 8.75 | % | 03/2027 | 2,000 | 1,928 | 0.3 | 2,000 | |||||||||||||||||
| ISS Compressors Industries, Inc.(3) (4) (5) (6) |
Senior Secured First Lien Revolver |
02/2026 | — | (7 | ) | — | (27 | ) | ||||||||||||||||||
| ISS Compressors Industries, Inc.(3) |
Senior Secured First Lien Term Loan |
L + 550 (100 Floor) (8) | 6.50 | % | 02/2026 | 9,098 | 9,019 | 1.6 | 8,807 | |||||||||||||||||
| Jordan Healthcare, Inc.(3) |
Senior Secured First Lien Delayed Draw Term Loan |
L + 600 (100 Floor) (8) | 7.00 | % | 07/2022 | 691 | 688 | 0.1 | 691 | |||||||||||||||||
| Jordan Healthcare, Inc.(3) |
Senior Secured First Lien Revolver |
L + 600 (100 Floor) (8) | 7.00 | % | 07/2022 | 450 | 449 | 0.1 | 450 | |||||||||||||||||
| Jordan Healthcare, Inc.(3) |
Senior Secured First Lien Term Loan |
L + 600 (100 Floor) (8) | 7.00 | % | 07/2022 | 3,980 | 3,966 | 0.7 | 3,980 | |||||||||||||||||
| MHS Acquisition Holdings, LLC(3) |
Senior Secured Second Lien Delayed Draw Term Loan |
L + 875 (100 Floor) (8) | 9.75 | % | 03/2025 | 467 | 461 | 0.1 | 455 | |||||||||||||||||
| MHS Acquisition Holdings, LLC(3) |
Senior Secured Second Lien Term Loan |
L + 875 (100 Floor) (8) | 9.75 | % | 03/2025 | 8,102 | 7,956 | 1.4 | 7,900 | |||||||||||||||||
See accompanying notes
75
CRESCENT CAPITAL BDC, INC.
Consolidated Schedule of Investments
December 31, 2020
(in thousands, except share and per share data)
| Company/Security/Country |
Investment Type |
Interest |
Interest Rate |
Maturity/ Dissolution Date |
Principal Amount, Par Value or Shares |
Cost | Percentage of Net Assets ** |
Fair Value |
||||||||||||||||||||
| MHS Acquisition Holdings, LLC(3) |
Unsecured Debt |
1350 PIK(11) |
13.50 | % | 03/2026 | $ | 272 | $ | 270 | — | % | $ | 264 | |||||||||||||||
| MHS Acquisition Holdings, LLC(3) |
Unsecured Debt |
1350 PIK(11) |
13.50 | % | 03/2026 | 817 | 810 | 0.1 | 792 | |||||||||||||||||||
| Pinstripe Holdings, LLC(3) |
Unitranche First Lien Term Loan |
L + 600 (100 Floor)(8) |
7.00 | % | 01/2025 | 9,825 | 9,618 | 1.7 | 9,807 | |||||||||||||||||||
| Pye-Barker Fire & Safety, LLC(3) |
Unitranche First Lien Delayed Draw Term Loan |
L + 600 (100 Floor)(8) |
7.00 | % | 11/2025 | 3,715 | 3,623 | 0.7 | 3,715 | |||||||||||||||||||
| Pye-Barker Fire & Safety, LLC(3) |
Unitranche First Lien Term Loan |
L + 600 (100 Floor)(8) |
7.00 | % | 11/2025 | 10,024 | 9,790 | 1.8 | 10,024 | |||||||||||||||||||
| Receivable Solutions, Inc.(3) (4) (5) (6) |
Senior Secured First Lien Revolver |
10/2024 | — | (4 | ) | — | (3 | ) | ||||||||||||||||||||
| Receivable Solutions, Inc.(3) |
Senior Secured First Lien Term Loan |
L + 500 (100 Floor)(7) |
6.00 | % | 10/2024 | 2,070 | 2,042 | 0.4 | 2,047 | |||||||||||||||||||
| SavATree, LLC(3) (6) (9) |
Senior Secured First Lien Delayed Draw Term Loan |
L + 500 (100 Floor)(8) |
6.00 | % | 06/2022 | 772 | 766 | 0.1 | 772 | |||||||||||||||||||
| SavATree, LLC(3) (4) (5) (6) |
Senior Secured First Lien Revolver |
06/2022 | — | (3 | ) | — | — | |||||||||||||||||||||
| SavATree, LLC(3) |
Senior Secured First Lien Term Loan |
L + 500 (100 Floor)(8) |
6.00 | % | 06/2022 | 3,910 | 3,887 | 0.7 | 3,910 | |||||||||||||||||||
| Service Logic Acquisition, Inc(3) (4) (6) (9) |
Senior Secured Second Lien Delayed Draw Term Loan |
10/2028 | — | (71 | ) | — | — | |||||||||||||||||||||
| Service Logic Acquisition, Inc(3) |
Senior Secured Second Lien Term Loan |
L + 850 (100 Floor)(8) |
9.50 | % | 10/2028 | 8,755 | 8,496 | 1.6 | 8,755 | |||||||||||||||||||
| Spear Education(3) (4) (6) (9) |
Senior Secured First Lien Delayed Draw Term Loan |
02/2025 | — | (26 | ) | — | (81 | ) | ||||||||||||||||||||
| Spear Education(3) |
Senior Secured First Lien Term Loan |
L + 550 (100 Floor)(8) |
6.50 | % | 02/2025 | 6,823 | 6,765 | 1.2 | 6,646 | |||||||||||||||||||
| TecoStar Holdings, Inc.(3) |
Senior Secured Second Lien Term Loan |
L + 850 (100 Floor)(8) |
9.50 | % | 11/2024 | 5,000 | 4,925 | 0.9 | 5,000 | |||||||||||||||||||
| UP Acquisition Corp.(3) |
Unitranche First Lien Delayed Draw Term Loan |
L + 625 (100 Floor)(7) |
7.25 | % | 05/2024 | 1,189 | 1,170 | 0.2 | 1,163 | |||||||||||||||||||
| UP Acquisition Corp.(3) (5) (6) |
Unitranche First Lien Revolver |
L + 625 (100 Floor)(7) |
7.25 | % | 05/2024 | 391 | 374 | 0.1 | 364 | |||||||||||||||||||
| UP Acquisition Corp.(3) |
Unitranche First Lien Term Loan |
L + 625 (100 Floor)(7) |
7.25 | % | 05/2024 | 4,334 | 4,272 | 0.8 | 4,242 | |||||||||||||||||||
| Xcentric Mold and Engineering Acquisition Company, LLC(3) |
Senior Secured First Lien Revolver |
L + 700 (100 Floor) |
8.00 | % | 01/2022 | 710 | 707 | 0.1 | 614 | |||||||||||||||||||
| Xcentric Mold and Engineering Acquisition Company, LLC(3) |
Senior Secured First Lien Term Loan |
L + 700 (100 Floor) |
8.00 | % | 01/2022 | 4,416 | 4,395 | 0.7 | 3,819 | |||||||||||||||||||
|
|
|
|
|
|
|
|
|
|||||||||||||||||||||
| 175,385 | 169,440 | 30.5 | 170,971 | |||||||||||||||||||||||||
|
|
|
|
|
|
|
|
|
|||||||||||||||||||||
| Consumer Durables & Apparel |
||||||||||||||||||||||||||||
| EiKo Global, LLC(3) (4) (5) (6) |
Senior Secured First Lien Revolver |
06/2023 | — | (8 | ) | — | — | |||||||||||||||||||||
| EiKo Global, LLC(3) |
Senior Secured First Lien Term Loan |
L + 600 (100 Floor)(8) |
7.00 | % | 06/2023 | 3,223 | 3,188 | 0.6 | 3,223 | |||||||||||||||||||
|
|
|
|
|
|
|
|
|
|||||||||||||||||||||
| 3,223 | 3,180 | 0.6 | 3,223 | |||||||||||||||||||||||||
|
|
|
|
|
|
|
|
|
|||||||||||||||||||||
See accompanying notes
76
CRESCENT CAPITAL BDC, INC.
Consolidated Schedule of Investments
December 31, 2020
(in thousands, except share and per share data)
| Company/Security/Country |
Investment Type |
Interest |
Interest Rate |
Maturity/ Dissolution Date |
Principal Amount, Par Value or Shares |
Cost | Percentage of Net Assets ** |
Fair Value |
||||||||||||||||||||
| Consumer Services |
||||||||||||||||||||||||||||
| BJH Holdings III Corp.(3) |
Unitranche First Lien Term Loan |
L + 525 (100 Floor)(8) |
6.25 | % | 08/2025 | $ | 13,355 | $ | 13,194 | 2.3 | % | $ | 12,921 | |||||||||||||||
| Cambium Learning Group, Inc.(3) |
Senior Secured Second Lien Term Loan |
L + 850 (100 Floor)(8) |
9.50 | % | 12/2026 | 5,000 | 4,865 | 0.9 | 4,800 | |||||||||||||||||||
| Colibri Group LLC(3) |
Unitranche First Lien Delayed Draw Term Loan |
L + 575 (100 Floor)(8) |
6.75 | % | 05/2025 | 1,337 | 1,312 | 0.2 | 1,350 | |||||||||||||||||||
| Colibri Group LLC(3) (4) (5) (6) |
Unitranche First Lien Revolver |
05/2025 | — | (18 | ) | — | 10 | |||||||||||||||||||||
| Colibri Group LLC(3) |
Unitranche First Lien Term Loan |
L + 575 (100 Floor)(8) |
6.75 | % | 05/2025 | 8,126 | 7,970 | 1.5 | 8,208 | |||||||||||||||||||
| Everlast Parent Inc.(3) (4) (6) (9) |
Unitranche First Lien Delayed Draw Term Loan |
10/2026 | — | (41 | ) | — | — | |||||||||||||||||||||
| Everlast Parent Inc.(3) (4) (5) (6) |
Unitranche First Lien Revolver |
10/2026 | — | (39 | ) | — | — | |||||||||||||||||||||
| Everlast Parent Inc.(3) |
Unitranche First Lien Term Loan |
L + 650 (100 Floor)(8) |
7.50 | % | 10/2026 | 14,028 | 13,686 | 2.5 | 14,028 | |||||||||||||||||||
| HGH Purchaser, Inc.(3) (6) (9) |
Unitranche First Lien Delayed Draw Term Loan |
L + 675 (100 Floor)(8) |
7.75 | % | 11/2025 | 2,815 | 2,725 | 0.5 | 2,815 | |||||||||||||||||||
| HGH Purchaser, Inc.(3) (5) (6) |
Unitranche First Lien Revolver |
L + 675 (100 Floor)(8) |
7.75 | % | 11/2025 | 101 | 81 | — | 101 | |||||||||||||||||||
| HGH Purchaser, Inc.(3) |
Unitranche First Lien Term Loan |
L + 675 (100 Floor)(8) |
7.75 | % | 11/2025 | 8,027 | 7,859 | 1.4 | 8,027 | |||||||||||||||||||
| JLL XDD, Inc.(3) |
Senior Secured First Lien Term Loan |
L + 600 (100 Floor)(13) |
7.00 | % | 12/2023 | 5,970 | 5,824 | 1.1 | 6,030 | |||||||||||||||||||
| JLL XDD, Inc.(3) |
Senior Secured First Lien Term Loan |
L + 550 (100 Floor)(12) |
6.50 | % | 12/2023 | 2,113 | 2,076 | 0.4 | 2,105 | |||||||||||||||||||
| Learn-It Systems, LLC(3) (6) (14) |
Senior Secured First Lien Delayed Draw Term Loan |
L + 450 (100 Floor)(8) |
5.50 | % | 03/2025 | 1,140 | 1,079 | 0.2 | 1,111 | |||||||||||||||||||
| Learn-It Systems, LLC(3) (4) (5) (6) |
Senior Secured First Lien Revolver |
03/2025 | — | (14 | ) | — | (7 | ) | ||||||||||||||||||||
| Learn-It Systems, LLC(3) |
Senior Secured First Lien Term Loan |
L + 450 (100 Floor)(8) |
5.50 | % | 03/2025 | 4,337 | 4,236 | 0.8 | 4,288 | |||||||||||||||||||
| Southern HVAC Corporation(3) (4) (6) (14) |
Unitranche First Lien Delayed Draw Term Loan |
10/2025 | — | (24 | ) | — | — | |||||||||||||||||||||
| Southern HVAC Corporation(3) (4) (5) (6) |
Unitranche First Lien Revolver |
10/2025 | — | (19 | ) | — | — | |||||||||||||||||||||
| Southern HVAC Corporation(3) |
Unitranche First Lien Term Loan |
L + 625 (100 Floor)(8) |
7.25 | % | 10/2025 | 5,550 | 5,442 | 1.0 | 5,550 | |||||||||||||||||||
| Teaching Strategies LLC(3) (4) (5) (6) |
Unitranche First Lien Revolver |
05/2024 | — | (9 | ) | — | — | |||||||||||||||||||||
| Teaching Strategies LLC(3) |
Unitranche First Lien Term Loan |
L + 600 (100 Floor)(8) |
7.00 | % | 05/2024 | 9,141 | 8,999 | 1.6 | 9,141 | |||||||||||||||||||
| United Language Group, Inc.(3) (5) |
Senior Secured First Lien Revolver |
L + 675 (100 Floor)(7) |
7.75 | % | 12/2021 | 400 | 398 | 0.1 | 381 | |||||||||||||||||||
| United Language Group, Inc.(3) |
Senior Secured First Lien Term Loan |
L + 675 (100 Floor)(7) |
7.75 | % | 12/2021 | 4,641 | 4,616 | 0.8 | 4,419 | |||||||||||||||||||
| Vistage Worldwide, Inc. |
Senior Secured First Lien Term Loan |
L + 400 (100 Floor)(8) |
5.00 | % | 02/2025 | 6,134 | 6,143 | 1.1 | 6,092 | |||||||||||||||||||
| WeddingWire, Inc.(3) |
Senior Secured Second Lien Term Loan |
L + 825(8) |
8.46 | % | 12/2026 | 5,000 | 4,955 | 0.8 | 4,604 | |||||||||||||||||||
See accompanying notes
77
CRESCENT CAPITAL BDC, INC.
Consolidated Schedule of Investments
December 31, 2020
(in thousands, except share and per share data)
| Company/Security/Country |
Investment Type |
Interest |
Interest Rate |
Maturity/ Dissolution Date |
Principal Amount, Par Value or Shares |
Cost | Percentage of Net Assets ** |
Fair Value |
||||||||||||||||||||
| Wrench Group LLC(3) |
Senior Secured Second Lien Term Loan |
L + 788(8) |
8.13 | % | 04/2027 | $ | 2,500 | $ | 2,436 | 0.4 | % | $ | 2,492 | |||||||||||||||
|
|
|
|
|
|
|
|
|
|||||||||||||||||||||
| 99,715 | 97,732 | 17.6 | 98,466 | |||||||||||||||||||||||||
|
|
|
|
|
|
|
|
|
|||||||||||||||||||||
| Diversified Financials |
||||||||||||||||||||||||||||
| GGC Aperio Holdings, L.P.(3) |
Unitranche First Lien Term Loan |
L + 500(8) |
5.15 | % | 10/2024 | 8,405 | 8,393 | 1.5 | 8,410 | |||||||||||||||||||
| Goldentree Loan Management US CLO 2, Ltd.(3) (15) |
CLO, Series 2017-2A, Class E |
L + 470 |
4.92 | % | 11/2030 | 2,000 | 1,902 | 0.3 | 1,829 | |||||||||||||||||||
|
|
|
|
|
|
|
|
|
|||||||||||||||||||||
| 10,405 | 10,295 | 1.8 | 10,239 | |||||||||||||||||||||||||
|
|
|
|
|
|
|
|
|
|||||||||||||||||||||
| Energy |
||||||||||||||||||||||||||||
| BJ Services, LLC(3) (16) (17) |
Unitranche First Lien - Last Out Term Loan |
01/2023 | 8,075 | 8,014 | 1.1 | 6,463 | ||||||||||||||||||||||
| BJ Services, LLC(3) |
Unitranche First Lien Term Loan |
L + 700 (150 Floor)(8) |
8.50 | % | 01/2023 | 2,668 | 2,653 | 0.5 | 2,668 | |||||||||||||||||||
| Black Diamond Oilfield Rentals, LLC(3) |
Senior Secured First Lien Term Loan |
L + 650 (100 Floor)(8) |
7.50 | % | 09/2021 | 10,386 | 10,332 | 1.7 | 9,645 | |||||||||||||||||||
|
|
|
|
|
|
|
|
|
|||||||||||||||||||||
| 21,129 | 20,999 | 3.3 | 18,776 | |||||||||||||||||||||||||
|
|
|
|
|
|
|
|
|
|||||||||||||||||||||
| Food & Staples Retailing |
||||||||||||||||||||||||||||
| Isagenix International, LLC |
Senior Secured First Lien Term Loan |
L + 575 (100 Floor)(8) |
6.75 | % | 06/2025 | 6,068 | 6,046 | 0.6 | 3,408 | |||||||||||||||||||
| PetIQ, LLC(3) (15) |
Senior Secured First Lien Term Loan |
L + 500 (100 Floor)(7) |
6.00 | % | 07/2025 | 14,812 | 14,703 | 2.6 | 14,812 | |||||||||||||||||||
|
|
|
|
|
|
|
|
|
|||||||||||||||||||||
| 20,880 | 20,749 | 3.2 | 18,220 | |||||||||||||||||||||||||
|
|
|
|
|
|
|
|
|
|||||||||||||||||||||
| Food, Beverage & Tobacco |
||||||||||||||||||||||||||||
| Mann Lake Ltd.(3) (5) (6) |
Senior Secured First Lien Revolver |
L + 750 (100 Floor)(8) |
8.50 | % | 10/2024 | 840 | 829 | 0.1 | 840 | |||||||||||||||||||
| Mann Lake Ltd.(3) |
Senior Secured First Lien Term Loan |
L + 750 (100 Floor)(8) |
8.50 | % | 10/2024 | 3,826 | 3,773 | 0.7 | 3,826 | |||||||||||||||||||
|
|
|
|
|
|
|
|
|
|||||||||||||||||||||
| 4,666 | 4,602 | 0.8 | 4,666 | |||||||||||||||||||||||||
|
|
|
|
|
|
|
|
|
|||||||||||||||||||||
| Health Care Equipment & Services |
||||||||||||||||||||||||||||
| Abode Healthcare, Inc.(3) (4) (5) (6) |
Senior Secured First Lien Revolver |
08/2025 | — | (18 | ) | — | (11 | ) | ||||||||||||||||||||
| Abode Healthcare, Inc.(3) |
Senior Secured First Lien Term Loan |
L + 525 (100 Floor)(8) |
6.25 | % | 08/2025 | 4,740 | 4,663 | 0.8 | 4,693 | |||||||||||||||||||
| Aegis Sciences Corporation |
Senior Secured First Lien Term Loan |
L + 550 (100 Floor)(8) |
6.50 | % | 05/2025 | 7,328 | 6,936 | 1.2 | 6,442 | |||||||||||||||||||
| Ameda, Inc.(3) (5) (6) |
Senior Secured First Lien Revolver |
L + 700 (100 Floor)(7) |
8.00 | % | 09/2022 | 188 | 186 | — | 163 | |||||||||||||||||||
| Ameda, Inc.(3) |
Senior Secured First Lien Term Loan |
L + 700 (100 Floor)(7) |
8.00 | % | 09/2022 | 2,201 | 2,185 | 0.4 | 2,022 | |||||||||||||||||||
| Anne Arundel Dermatology Management, LLC(3) (6) (9) |
Senior Secured First Lien Delayed Draw Term Loan |
L + 600 (100 Floor)(8) |
7.00 | % | 10/2025 | 491 | 460 | 0.1 | 491 | |||||||||||||||||||
| Anne Arundel Dermatology Management, LLC(3) (4) (5) (6) |
Senior Secured First Lien Revolver |
10/2025 | — | (11 | ) | — | — | |||||||||||||||||||||
| Anne Arundel Dermatology Management, LLC(3) |
Senior Secured First Lien Term Loan |
L + 600 (100 Floor)(8) |
7.00 | % | 10/2025 | 2,450 | 2,403 | 0.4 | 2,450 | |||||||||||||||||||
| Avalign Technologies, Inc.(3) |
Senior Secured First Lien Term Loan |
L + 450(8) |
4.73 | % | 12/2025 | 16,837 | 16,709 | 3.0 | 16,753 | |||||||||||||||||||
| BAART Programs, Inc.(3) |
Senior Secured Second Lien Delayed Draw Term Loan |
L + 800 (100 Floor)(8) |
9.00 | % | 03/2025 | 1,000 | 957 | 0.2 | 997 | |||||||||||||||||||
| BAART Programs, Inc.(3) |
Senior Secured Second Lien Term Loan |
L + 825 (100 Floor)(18) |
9.25 | % | 03/2025 | 7,000 | 6,700 | 1.3 | 6,977 | |||||||||||||||||||
See accompanying notes
78
CRESCENT CAPITAL BDC, INC.
Consolidated Schedule of Investments
December 31, 2020
(in thousands, except share and per share data)
| Company/Security/Country |
Investment Type |
Interest |
Interest Rate |
Maturity/ Dissolution Date |
Principal Amount, Par Value or Shares |
Cost | Percentage of Net Assets ** |
Fair Value |
||||||||||||||||||||
| Centria Subsidiary Holdings, LLC(3) (5) (6) |
Unitranche First Lien Revolver |
P + 500(19) |
8.25 | % | 12/2025 | $ | 158 | $ | 109 | — | % | $ | 158 | |||||||||||||||
| Centria Subsidiary Holdings, LLC(3) |
Unitranche First Lien Term Loan |
L + 600 (100 Floor)(8) |
7.00 | % | 12/2025 | 11,753 | 11,452 | 2.1 | 11,753 | |||||||||||||||||||
| CRA MSO, LLC(3) (5) (6) |
Senior Secured First Lien Revolver |
L + 700 (100 Floor)(7) |
8.00 | % | 12/2023 | 80 | 78 | — | 72 | |||||||||||||||||||
| CRA MSO, LLC(3) |
Senior Secured First Lien Term Loan |
L + 700 (100 Floor)(7) |
8.00 | % | 12/2023 | 1,225 | 1,210 | 0.2 | 1,173 | |||||||||||||||||||
| ExamWorks Group, Inc.(3) |
Senior Secured Second Lien Term Loan |
L + 725 (100 Floor)(8) |
8.25 | % | 07/2024 | 5,735 | 5,642 | 1.0 | 5,735 | |||||||||||||||||||
| FH MD Buyer, Inc(3) |
Senior Secured First Lien Term Loan |
L + 575 (100 Floor)(7) |
6.75 | % | 10/2026 | 17,264 | 16,845 | 3.0 | 16,832 | |||||||||||||||||||
| GrapeTree Medical Staffing, LLC(3) (4) (5) (6) |
Senior Secured First Lien Revolver |
10/2022 | — | (3 | ) | — | (3 | ) | ||||||||||||||||||||
| GrapeTree Medical Staffing, LLC(3) |
Senior Secured First Lien Term Loan |
L + 525 (100 Floor)(7) |
6.25 | % | 10/2022 | 1,645 | 1,633 | 0.3 | 1,634 | |||||||||||||||||||
| GrapeTree Medical Staffing, LLC(3) |
Senior Secured First Lien Term Loan |
L + 525 (100 Floor)(7) |
6.25 | % | 10/2022 | 1,383 | 1,367 | 0.2 | 1,374 | |||||||||||||||||||
| HCAT Acquisition, Inc.(3) |
Unitranche First Lien Delayed Draw Term Loan |
L + 925 (100 Floor)(8) |
10.25 | % | 11/2022 | 2,307 | 2,195 | 0.4 | 2,104 | |||||||||||||||||||
| HCAT Acquisition, Inc.(3) (20) |
Unitranche First Lien Revolver |
L + 925 (100 Floor)(8) |
10.25 | % | 11/2022 | 3,837 | 3,649 | 0.6 | 3,499 | |||||||||||||||||||
| HCAT Acquisition, Inc.(3) |
Unitranche First Lien Term Loan |
L + 925 (100 Floor)(8) |
10.25 | % | 11/2022 | 14,666 | 13,948 | 2.4 | 13,375 | |||||||||||||||||||
| HCOS Group Intermediate III LLC(3) (4) (5) (6) |
Senior Secured First Lien Revolver |
09/2026 | — | (17 | ) | — | (13 | ) | ||||||||||||||||||||
| HCOS Group Intermediate III LLC(3) |
Senior Secured First Lien Term Loan |
L + 600 (100 Floor)(8) |
7.00 | % | 09/2026 | 11,571 | 11,348 | 2.0 | 11,397 | |||||||||||||||||||
| Hospice Care Buyer, Inc.(3) (4) (6) (9) |
Unitranche First Lien Delayed Draw Term Loan |
12/2026 | — | (40 | ) | — | — | |||||||||||||||||||||
| Hospice Care Buyer, Inc.(3) (5) (6) |
Unitranche First Lien Revolver |
L + 650 (100 Floor)(8) |
7.50 | % | 12/2026 | 231 | 183 | — | 231 | |||||||||||||||||||
| Hospice Care Buyer, Inc.(3) (6) |
Unitranche First Lien Term Loan |
L + 650 (100 Floor)(7) |
7.50 | % | 12/2026 | 12,743 | 12,339 | 2.3 | 12,743 | |||||||||||||||||||
| IvyRehab Intermediate II, LLC(3) (4) (6) (9) |
Unitranche First Lien Delayed Draw Term Loan |
12/2024 | — | (28 | ) | — | (14 | ) | ||||||||||||||||||||
| IvyRehab Intermediate II, LLC(3) (4) (5) (6) |
Unitranche First Lien Revolver |
12/2024 | — | (10 | ) | — | (5 | ) | ||||||||||||||||||||
| IvyRehab Intermediate II, LLC(3) |
Unitranche First Lien Term Loan |
L + 675 (100 Floor)(8) |
7.75 | % | 12/2024 | 8,030 | 7,872 | 1.4 | 7,951 | |||||||||||||||||||
| Lightspeed Buyer, Inc.(3) (6) (9) |
Unitranche First Lien Delayed Draw Term Loan |
L + 550 (100 Floor)(7) |
6.50 | % | 02/2026 | 1,146 | 1,120 | 0.2 | 1,114 | |||||||||||||||||||
| Lightspeed Buyer, Inc.(3) (5) (6) |
Unitranche First Lien Revolver |
L + 550 (100 Floor)(8) |
6.50 | % | 02/2026 | 350 | 332 | 0.1 | 331 | |||||||||||||||||||
| Lightspeed Buyer, Inc.(3) |
Unitranche First Lien Term Loan |
L + 550 (100 Floor)(7) |
6.50 | % | 02/2026 | 9,925 | 9,752 | 1.7 | 9,745 | |||||||||||||||||||
| MDVIP, Inc. |
Senior Secured First Lien Term Loan |
L + 425 (100 Floor)(7) |
5.25 | % | 11/2024 | 9,561 | 9,561 | 1.7 | 9,534 | |||||||||||||||||||
| Medsurant Holdings, LLC(3) |
Senior Secured Second Lien Term Loan |
1400(11) |
14.00 | % | 03/2022 | 7,945 | 7,907 | 1.4 | 7,859 | |||||||||||||||||||
See accompanying notes
79
CRESCENT CAPITAL BDC, INC.
Consolidated Schedule of Investments
December 31, 2020
(in thousands, except share and per share data)
| Company/Security/Country |
Investment Type |
Interest |
Interest Rate |
Maturity/ Dissolution Date |
Principal Amount, Par Value or Shares |
Cost | Percentage of Net Assets ** |
Fair Value |
||||||||||||||||||||
| NMN Holdings III Corp.(3) |
Senior Secured Second Lien Delayed Draw Term Loan |
L + 775(7) |
7.93 | % | 11/2026 | $ | 1,667 | $ | 1,626 | 0.3 | % | $ | 1,641 | |||||||||||||||
| NMN Holdings III Corp.(3) |
Senior Secured Second Lien Term Loan |
L + 775(7) |
7.93 | % | 11/2026 | 7,222 | 7,049 | 1.3 | 7,110 | |||||||||||||||||||
| NMSC Holdings, Inc.(3) |
Senior Secured Second Lien Term Loan |
L + 1000 (100 Floor)(8) |
11.00 | % | 10/2023 | 4,307 | 4,230 | 0.8 | 4,194 | |||||||||||||||||||
| Omni Ophthalmic Management Consultants, LLC(3) (4) (6) (9) |
Senior Secured First Lien Delayed Draw Term Loan |
03/2021 | — | (2 | ) | — | (39 | ) | ||||||||||||||||||||
| Omni Ophthalmic Management Consultants, LLC(3) (5) |
Senior Secured First Lien Revolver |
L + 750 (100 Floor)(7) |
8.50 | % | 05/2023 | 850 | 843 | 0.1 | 797 | |||||||||||||||||||
| Omni Ophthalmic Management Consultants, LLC(3) |
Senior Secured First Lien Term Loan |
L + 750 (100 Floor)(7) |
8.50 | % | 05/2023 | 6,878 | 6,820 | 1.2 | 6,452 | |||||||||||||||||||
| Pinnacle Treatment Centers, Inc.(3) (6) (9) |
Unitranche First Lien Delayed Draw Term Loan |
L + 625 (100 Floor)(8) |
7.25 | % | 12/2022 | 684 | 677 | 0.1 | 684 | |||||||||||||||||||
| Pinnacle Treatment Centers, Inc.(3) (4) (5) (6) |
Unitranche First Lien Revolver |
12/2022 | — | (5 | ) | — | — | |||||||||||||||||||||
| Pinnacle Treatment Centers, Inc.(3) |
Unitranche First Lien Term Loan |
L + 625 (100 Floor)(8) |
7.25 | % | 12/2022 | 8,052 | 7,996 | 1.4 | 8,052 | |||||||||||||||||||
| Professional Physical Therapy(3) |
Senior Secured First Lien Term Loan |
L + 850 (100 Floor) |
9.50 | % | 12/2022 | 8,975 | 8,755 | 1.2 | 6,855 | |||||||||||||||||||
| PT Network, LLC(3) (4) (5) (6) |
Senior Secured First Lien Revolver |
11/2023 | — | (1 | ) | — | (10 | ) | ||||||||||||||||||||
| PT Network, LLC(3) |
Senior Secured First Lien Term Loan |
L + 750 (100 Floor) |
8.50 | % | 11/2023 | 4,789 | 4,782 | 0.8 | 4,672 | |||||||||||||||||||
| Safco Dental Supply, LLC(3) (4) (5) (6) |
Unitranche First Lien Revolver |
06/2025 | — | (8 | ) | — | (1 | ) | ||||||||||||||||||||
| Safco Dental Supply, LLC(3) |
Unitranche First Lien Term Loan |
L + 450 (100 Floor)(8) |
5.50 | % | 06/2025 | 4,043 | 3,988 | 0.7 | 4,034 | |||||||||||||||||||
| Seniorlink Incorporated(3) (4) (5) (6) |
Unitranche First Lien Revolver |
07/2026 | — | (29 | ) | — | — | |||||||||||||||||||||
| Seniorlink Incorporated(3) |
Unitranche First Lien Term Loan |
L + 700 (100 Floor)(8) |
8.00 | % | 07/2026 | 6,818 | 6,626 | 1.2 | 6,818 | |||||||||||||||||||
| Smile Brands, Inc.(3) |
Senior Secured First Lien Delayed Draw Term Loan |
L + 517 (21 Floor)(8) |
5.49 | % | 10/2024 | 619 | 615 | 0.1 | 604 | |||||||||||||||||||
| Smile Brands, Inc.(3) (4) (5) (6) |
Senior Secured First Lien Revolver |
09/2024 | — | (2 | ) | — | (7 | ) | ||||||||||||||||||||
| Smile Brands, Inc.(3) |
Senior Secured First Lien Term Loan |
L + 517 (21 Floor)(8) |
5.49 | % | 10/2024 | 2,058 | 2,044 | 0.4 | 2,007 | |||||||||||||||||||
| Smile Doctors LLC(3) (4) (5) (6) |
Senior Secured First Lien Revolver |
10/2022 | — | — | — | (6 | ) | |||||||||||||||||||||
| Smile Doctors LLC(3) |
Senior Secured First Lien Term Loan |
L + 600 (100 Floor)(8) |
7.00 | % | 10/2022 | 16,280 | 16,261 | 2.9 | 16,196 | |||||||||||||||||||
| Unifeye Vision Partners(3) (6) (14) |
Senior Secured First Lien Delayed Draw Term Loan |
P + 400(19) |
7.25 | % | 09/2025 | 813 | 782 | 0.1 | 707 | |||||||||||||||||||
| Unifeye Vision Partners(3) (5) (6) |
Senior Secured First Lien Revolver |
P + 400(19) |
7.25 | % | 09/2025 | 453 | 427 | 0.1 | 394 | |||||||||||||||||||
| Unifeye Vision Partners(3) |
Senior Secured First Lien Term Loan |
L + 500 (100 Floor)(8) |
6.00 | % | 09/2025 | 5,346 | 5,259 | 0.9 | 5,159 | |||||||||||||||||||
| Vital Care Buyer, LLC(3) (4) (5) (6) |
Unitranche First Lien Revolver |
10/2025 | — | (37 | ) | — | (39 | ) | ||||||||||||||||||||
See accompanying notes
80
CRESCENT CAPITAL BDC, INC.
Consolidated Schedule of Investments
December 31, 2020
(in thousands, except share and per share data)
| Company/Security/Country |
Investment Type |
Interest |
Interest Rate |
Maturity/ Dissolution Date |
Principal Amount, Par Value or Shares |
Cost | Percentage of Net Assets ** |
Fair Value |
||||||||||||||||||||
| Vital Care Buyer, LLC(3) |
Unitranche First Lien Term Loan |
L + 600 (100 Floor)(8) |
7.00 | % | 10/2025 | $ | 7,778 | $ | 7,646 | 1.4 | % | $ | 7,642 | |||||||||||||||
| Zest Acquisition Corp. |
Senior Secured First Lien Term Loan |
L + 350(7) |
3.66 | % | 03/2025 | 8,603 | 8,604 | 1.5 | 8,259 | |||||||||||||||||||
|
|
|
|
|
|
|
|
|
|||||||||||||||||||||
| 260,025 | 254,560 | 44.9 | 251,731 | |||||||||||||||||||||||||
|
|
|
|
|
|
|
|
|
|||||||||||||||||||||
| Household & Personal Products |
||||||||||||||||||||||||||||
| Tranzonic(3) (5) (6) |
Senior Secured First Lien Revolver |
P + 375 (100 Floor)(19) |
7.00 | % | 03/2023 | 440 | 438 | 0.1 | 440 | |||||||||||||||||||
| Tranzonic(3) |
Senior Secured First Lien Term Loan |
L + 450 (100 Floor)(7) |
5.50 | % | 03/2023 | 3,813 | 3,793 | 0.7 | 3,813 | |||||||||||||||||||
|
|
|
|
|
|
|
|
|
|||||||||||||||||||||
| 4,253 | 4,231 | 0.8 | 4,253 | |||||||||||||||||||||||||
|
|
|
|
|
|
|
|
|
|||||||||||||||||||||
| Insurance |
||||||||||||||||||||||||||||
| Comet Acquisition, Inc.(3) |
Senior Secured Second Lien Term Loan |
L + 750(8) |
7.75 | % | 10/2026 | 3,563 | 3,556 | 0.6 | 3,231 | |||||||||||||||||||
| Integrity Marketing Acquisition, LLC(3) |
Unitranche First Lien Delayed Draw Term Loan |
L + 550 (100 Floor)(8) |
6.50 | % | 08/2025 | 5,068 | 4,959 | 0.9 | 5,068 | |||||||||||||||||||
| Integrity Marketing Acquisition, LLC(3) |
Unitranche First Lien Delayed Draw Term Loan |
L + 550 (100 Floor)(8) |
6.50 | % | 08/2025 | 3,064 | 2,997 | 0.5 | 3,064 | |||||||||||||||||||
| Integrity Marketing Acquisition, LLC(3) (4) (5) (6) |
Unitranche First Lien Revolver |
08/2025 | — | (39 | ) | — | — | |||||||||||||||||||||
| Integrity Marketing Acquisition, LLC(3) |
Unitranche First Lien Term Loan |
L + 550 (100 Floor)(8) |
6.50 | % | 08/2025 | 12,879 | 12,618 | 2.3 | 12,879 | |||||||||||||||||||
| Integro Parent, Inc.(3) (15) |
Senior Secured First Lien Term Loan |
L + 575 (100 Floor)(7) |
6.75 | % | 10/2022 | 473 | 470 | 0.1 | 473 | |||||||||||||||||||
| Integro Parent, Inc.(3) (15) |
Senior Secured Second Lien Delayed Draw Term Loan |
L + 925 (100 Floor)(7) |
10.25 | % | 10/2023 | 380 | 378 | 0.1 | 369 | |||||||||||||||||||
| Integro Parent, Inc.(3) (15) |
Senior Secured Second Lien Term Loan |
L + 925 (100 Floor)(7) |
10.25 | % | 10/2023 | 2,916 | 2,889 | 0.5 | 2,825 | |||||||||||||||||||
| The Hilb Group, LLC(3) |
Unitranche First Lien Delayed Draw Term Loan |
L + 575 (100 Floor)(7) |
6.75 | % | 12/2026 | 1,019 | 996 | 0.2 | 1,016 | |||||||||||||||||||
| The Hilb Group, LLC(3) (4) (5) (6) |
Unitranche First Lien Revolver |
12/2025 | — | (7 | ) | — | (1 | ) | ||||||||||||||||||||
| The Hilb Group, LLC(3) |
Unitranche First Lien Term Loan |
L + 575 (100 Floor)(8) |
6.75 | % | 12/2026 | 3,603 | 3,524 | 0.6 | 3,594 | |||||||||||||||||||
| THG Acquisition, LLC(3) (6) (9) |
Unitranche First Lien Delayed Draw Term Loan |
L + 600 (100 Floor)(8) |
7.00 | % | 12/2026 | 53 | 31 | — | 49 | |||||||||||||||||||
| THG Acquisition, LLC(3) (4) (5) (6) |
Unitranche First Lien Revolver |
12/2025 | — | (4 | ) | — | — | |||||||||||||||||||||
| THG Acquisition, LLC(3) |
Unitranche First Lien Term Loan |
L + 600 (100 Floor)(8) |
7.00 | % | 12/2026 | 1,069 | 1,042 | 0.2 | 1,066 | |||||||||||||||||||
|
|
|
|
|
|
|
|
|
|||||||||||||||||||||
| 34,087 | 33,410 | 6.0 | 33,633 | |||||||||||||||||||||||||
|
|
|
|
|
|
|
|
|
|||||||||||||||||||||
| Materials |
||||||||||||||||||||||||||||
| Kestrel Parent, LLC(3) (4) (6) (20) |
Unitranche First Lien Revolver |
11/2023 | — | (12 | ) | — | — | |||||||||||||||||||||
| Kestrel Parent, LLC(3) |
Unitranche First Lien Term Loan |
L + 575 (100 Floor)(8) |
6.75 | % | 11/2025 | 6,672 | 6,547 | 1.2 | 6,672 | |||||||||||||||||||
|
|
|
|
|
|
|
|
|
|||||||||||||||||||||
| 6,672 | 6,535 | 1.2 | 6,672 | |||||||||||||||||||||||||
|
|
|
|
|
|
|
|
|
|||||||||||||||||||||
| Pharmaceuticals, Biotechnology & Life Sciences |
||||||||||||||||||||||||||||
| Pharmalogic Holdings Corp.(3) |
Senior Secured Second Lien Delayed Draw Term Loan |
L + 800(7) |
8.15 | % | 12/2023 | 4,760 | 4,733 | 0.8 | 4,663 | |||||||||||||||||||
| Pharmalogic Holdings Corp.(3) |
Senior Secured Second Lien Term Loan |
L + 800(7) |
8.15 | % | 12/2023 | 5,460 | 5,428 | 1.0 | 5,349 | |||||||||||||||||||
See accompanying notes
81
CRESCENT CAPITAL BDC, INC.
Consolidated Schedule of Investments
December 31, 2020
(in thousands, except share and per share data)
| Company/Security/Country |
Investment Type |
Interest |
Interest Rate |
Maturity/ Dissolution Date |
Principal Amount, Par Value or Shares |
Cost | Percentage of Net Assets ** |
Fair Value |
||||||||||||||||||||
| Pharmalogic Holdings Corp.(3) |
Senior Secured Second Lien Term Loan |
L + 800(7) |
8.15 | % | 12/2023 | $ | 5,880 | $ | 5,845 | 1.0 | % | $ | 5,760 | |||||||||||||||
| Teal Acquisition Co., Inc(3) (4) (6) (9) |
Unitranche First Lien Delayed Draw Term Loan |
09/2026 | — | (24 | ) | — | — | |||||||||||||||||||||
| Teal Acquisition Co., Inc(3) (5) (6) |
Unitranche First Lien Revolver |
L + 625 (100 Floor)(8) |
7.25 | % | 09/2026 | 274 | 237 | 0.1 | 274 | |||||||||||||||||||
| Teal Acquisition Co., Inc(3) |
Unitranche First Lien Term Loan |
L + 625 (100 Floor)(8) |
7.25 | % | 09/2026 | 9,124 | 8,861 | 1.6 | 9,124 | |||||||||||||||||||
| Trinity Partners, LLC(3) (4) (5) (6) |
Senior Secured First Lien Revolver |
02/2025 | — | (4 | ) | — | — | |||||||||||||||||||||
| Trinity Partners, LLC(3) |
Senior Secured First Lien Term Loan |
L + 525 (100 Floor)(7) |
6.25 | % | 02/2025 | 3,709 | 3,682 | 0.7 | 3,709 | |||||||||||||||||||
|
|
|
|
|
|
|
|
|
|||||||||||||||||||||
| 29,207 | 28,758 | 5.2 | 28,879 | |||||||||||||||||||||||||
|
|
|
|
|
|
|
|
|
|||||||||||||||||||||
| Retailing |
||||||||||||||||||||||||||||
| Palmetto Moon LLC,(3) |
Senior Secured First Lien Term Loan |
1150 + 250 PIK(11) |
14.00 | % | 10/2021 | 4,155 | 3,397 | 0.7 | 3,813 | |||||||||||||||||||
| Slickdeals Holdings, LLC(3) (4) (6) (10) (20) |
Unitranche First Lien Revolver |
06/2023 | — | (10 | ) | — | — | |||||||||||||||||||||
| Slickdeals Holdings, LLC(3) (10) |
Unitranche First Lien Term Loan |
L + 625 (100 Floor)(12) |
7.25 | % | 06/2024 | 14,528 | 14,223 | 2.6 | 14,528 | |||||||||||||||||||
|
|
|
|
|
|
|
|
|
|||||||||||||||||||||
| 18,683 | 17,610 | 3.3 | 18,341 | |||||||||||||||||||||||||
|
|
|
|
|
|
|
|
|
|||||||||||||||||||||
| Software & Services |
||||||||||||||||||||||||||||
| Affinitiv, Inc.(3) (4) (5) (6) |
Unitranche First Lien Revolver |
08/2024 | — | (7 | ) | — | — | |||||||||||||||||||||
| Affinitiv, Inc.(3) |
Unitranche First Lien Term Loan |
L + 700 (100 Floor)(8) |
8.00 | % | 08/2024 | 6,435 | 6,349 | 1.2 | 6,435 | |||||||||||||||||||
| Ansira Partners, Inc.(3) (16) |
Unitranche First Lien Delayed Draw Term Loan |
12/2024 | 964 | 931 | 0.1 | 676 | ||||||||||||||||||||||
| Ansira Partners, Inc.(3) (16) |
Unitranche First Lien Term Loan |
12/2024 | 7,122 | 6,687 | 0.9 | 4,997 | ||||||||||||||||||||||
| Avaap USA LLC(3) |
Senior Secured First Lien Delayed Draw Term Loan |
L + 725 (100 Floor)(7) |
8.25 | % | 03/2023 | 344 | 340 | 0.1 | 336 | |||||||||||||||||||
| Avaap USA LLC(3) (4) (5) (6) |
Senior Secured First Lien Revolver |
03/2023 | — | (7 | ) | — | (15 | ) | ||||||||||||||||||||
| Avaap USA LLC(3) |
Senior Secured First Lien Term Loan |
L + 725 (100 Floor)(7) |
8.25 | % | 03/2023 | 3,769 | 3,727 | 0.7 | 3,684 | |||||||||||||||||||
| Benesys Inc.(3) |
Senior Secured First Lien Term Loan |
L + 475 (100 Floor)(7) |
5.75 | % | 10/2024 | 300 | 294 | 0.1 | 295 | |||||||||||||||||||
| Benesys, Inc.(3) (4) (5) (6) |
Senior Secured First Lien Revolver |
10/2024 | — | (1 | ) | — | (3 | ) | ||||||||||||||||||||
| Benesys, Inc.(3) |
Senior Secured First Lien Term Loan |
L + 475 (100 Floor)(7) |
5.75 | % | 10/2024 | 1,414 | 1,400 | 0.3 | 1,388 | |||||||||||||||||||
| C-4 Analytics, LLC(3) (4) (5) (6) |
Senior Secured First Lien Revolver |
08/2023 | — | (5 | ) | — | — | |||||||||||||||||||||
| C-4 Analytics, LLC(3) |
Senior Secured First Lien Term Loan |
L + 525 (100 Floor)(7) |
6.25 | % | 08/2023 | 9,916 | 9,832 | 1.8 | 9,916 | |||||||||||||||||||
| CAT Buyer, LLC(3) (4) (5) (6) |
Unitranche First Lien Revolver |
04/2024 | — | (8 | ) | — | (17 | ) | ||||||||||||||||||||
| CAT Buyer, LLC(3) |
Unitranche First Lien Term Loan |
L + 550 (100 Floor)(7) |
6.50 | % | 04/2024 | 6,239 | 6,154 | 1.1 | 6,041 | |||||||||||||||||||
| Claritas, LLC(3) (5) (6) |
Senior Secured First Lien Revolver |
L + 600 (100 Floor)(8) |
7.00 | % | 12/2023 | 113 | 111 | — | 113 | |||||||||||||||||||
| Claritas, LLC(3) |
Senior Secured First Lien Term Loan |
L + 600 (100 Floor)(8) |
7.00 | % | 12/2023 | 1,093 | 1,085 | 0.2 | 1,093 | |||||||||||||||||||
See accompanying notes
82
CRESCENT CAPITAL BDC, INC.
Consolidated Schedule of Investments
December 31, 2020
(in thousands, except share and per share data)
| Company/Security/Country |
Investment Type |
Interest |
Interest Rate |
Maturity/ Dissolution Date |
Principal Amount, Par Value or Shares |
Cost | Percentage of Net Assets ** |
Fair Value |
||||||||||||||||||||
| List Partners, Inc.(3) (4) (5) (6) |
Senior Secured First Lien Revolver |
01/2023 | $ | — | $ | (4 | ) | — | % | $ | (6 | ) | ||||||||||||||||
| List Partners, Inc.(3) |
Senior Secured First Lien Term Loan |
L + 500 (100 Floor)(7) |
6.00 | % | 01/2023 | 4,495 | 4,455 | 0.8 | 4,440 | |||||||||||||||||||
| MRI Software LLC(3) (4) (6) (9) |
Unitranche First Lien Delayed Draw Term Loan |
02/2026 | — | (22 | ) | — | (3 | ) | ||||||||||||||||||||
| MRI Software LLC(3) (4) (5) (6) |
Unitranche First Lien Delayed Draw Term Loan |
02/2026 | — | (4 | ) | — | (1 | ) | ||||||||||||||||||||
| MRI Software LLC(3) (4) (5) (6) |
Unitranche First Lien Revolver |
02/2026 | — | (16 | ) | — | (32 | ) | ||||||||||||||||||||
| MRI Software LLC(3) |
Unitranche First Lien Term Loan |
L + 550 (100 Floor)(8) |
6.50 | % | 02/2026 | 149 | 145 | — | 149 | |||||||||||||||||||
| MRI Software LLC(3) |
Unitranche First Lien Term Loan |
L + 550 (100 Floor)(8) |
6.50 | % | 02/2026 | 18,079 | 17,841 | 3.2 | 18,034 | |||||||||||||||||||
| Ontario Systems, LLC(3) (4) (6) (9) |
Unitranche First Lien Delayed Draw Term Loan |
08/2025 | — | (4 | ) | — | (38 | ) | ||||||||||||||||||||
| Ontario Systems, LLC(3) (5) (6) |
Unitranche First Lien Revolver |
L + 550 (100 Floor)(8) |
6.50 | % | 08/2025 | 200 | 196 | — | 183 | |||||||||||||||||||
| Ontario Systems, LLC(3) |
Unitranche First Lien Term Loan |
L + 550 (100 Floor)(7) |
6.50 | % | 08/2025 | 3,209 | 3,183 | 0.6 | 3,098 | |||||||||||||||||||
| Park Place Technologies, LLC(3) |
Unsecured Debt |
1250 PIK(11) |
12.50 | % | 05/2029 | 784 | 784 | 0.1 | 784 | |||||||||||||||||||
| Perforce Software, Inc.(3) |
Senior Secured Second Lien Term Loan |
L + 800(7) |
8.15 | % | 07/2027 | 5,000 | 4,977 | 0.9 | 5,000 | |||||||||||||||||||
| Prism Bidco, Inc.(3) (4) (5) (6) |
Unitranche First Lien Revolver |
06/2026 | — | (23 | ) | — | (13 | ) | ||||||||||||||||||||
| Prism Bidco, Inc.(3) |
Unitranche First Lien Term Loan |
L + 700 (100 Floor)(8) |
8.00 | % | 06/2026 | 7,463 | 7,254 | 1.3 | 7,351 | |||||||||||||||||||
| Right Networks, LLC(3) (4) (5) (6) |
Unitranche First Lien Revolver |
11/2024 | — | (4 | ) | — | — | |||||||||||||||||||||
| Right Networks, LLC(3) |
Unitranche First Lien Term Loan |
L + 600 (100 Floor)(7) |
7.00 | % | 11/2024 | 9,645 | 9,472 | 1.7 | 9,645 | |||||||||||||||||||
| Ruffalo Noel Levitz, LLC(3) (5) (6) |
Unitranche First Lien Revolver |
L + 600 (100 Floor)(8) |
7.00 | % | 05/2022 | 240 | 238 | — | 237 | |||||||||||||||||||
| Ruffalo Noel Levitz, LLC(3) |
Unitranche First Lien Term Loan |
L + 600 (100 Floor)(8) |
7.00 | % | 05/2022 | 2,505 | 2,489 | 0.4 | 2,480 | |||||||||||||||||||
| Saturn Borrower Inc(3) (4) (5) (6) |
Unitranche First Lien Revolver |
09/2026 | — | (43 | ) | — | — | |||||||||||||||||||||
| Saturn Borrower Inc(3) |
Unitranche First Lien Term Loan |
L + 650 (100 Floor)(8) |
7.50 | % | 09/2026 | 20,524 | 19,929 | 3.7 | 20,524 | |||||||||||||||||||
| Transportation Insight, LLC(3) (9) |
Senior Secured First Lien Delayed Draw Term Loan |
L + 450(7) |
4.65 | % | 12/2024 | 1,277 | 1,269 | 0.2 | 1,226 | |||||||||||||||||||
| Transportation Insight, LLC(3) (4) (5) (6) |
Senior Secured First Lien Revolver |
12/2024 | — | (5 | ) | — | (30 | ) | ||||||||||||||||||||
| Transportation Insight, LLC(3) |
Senior Secured First Lien Term Loan |
L + 450(7) |
4.65 | % | 12/2024 | 5,142 | 5,107 | 0.9 | 4,936 | |||||||||||||||||||
| Trident Technologies, LLC(3) |
Senior Secured First Lien Term Loan |
L + 600 (150 Floor)(8) |
7.50 | % | 12/2025 | 14,850 | 14,658 | 2.6 | 14,726 | |||||||||||||||||||
| Winxnet Holdings LLC(3) |
Unitranche First Lien Delayed Draw Term Loan |
L + 600 (100 Floor)(7) |
7.00 | % | 06/2023 | 641 | 632 | 0.1 | 636 | |||||||||||||||||||
| Winxnet Holdings LLC(3) |
Unitranche First Lien Delayed Draw Term Loan |
L + 600 (100 Floor)(8) |
7.00 | % | 06/2023 | 1,050 | 1,029 | 0.2 | 1,043 | |||||||||||||||||||
| Winxnet Holdings LLC(3) (5) (6) |
Unitranche First Lien Revolver |
L + 600 (100 Floor)(7) |
7.00 | % | 06/2023 | 240 | 236 | — | 237 | |||||||||||||||||||
See accompanying notes
83
CRESCENT CAPITAL BDC, INC.
Consolidated Schedule of Investments
December 31, 2020
(in thousands, except share and per share data)
| Company/Security/Country |
Investment Type |
Interest |
Interest Rate |
Maturity/ Dissolution Date |
Principal Amount, Par Value or Shares |
Cost | Percentage of Net Assets ** |
Fair Value |
||||||||||||||||||||
| Winxnet Holdings LLC(3) |
Unitranche First Lien Term Loan |
L + 600 (100 Floor)(7) |
7.00 | % | 06/2023 | $ | 1,950 | $ | 1,929 | 0.3 | % | $ | 1,936 | |||||||||||||||
|
|
|
|
|
|
|
|
|
|||||||||||||||||||||
| 135,152 | 132,580 | 23.5 | 131,481 | |||||||||||||||||||||||||
|
|
|
|
|
|
|
|
|
|||||||||||||||||||||
| Technology Hardware & Equipment |
||||||||||||||||||||||||||||
| Onvoy, LLC(3) |
Senior Secured Second Lien Term Loan |
L + 1050 (100 Floor)(7) |
11.50 | % | 02/2025 | 2,635 | 2,556 | 0.5 | 2,585 | |||||||||||||||||||
|
|
|
|
|
|
|
|
|
|||||||||||||||||||||
| Transportation |
||||||||||||||||||||||||||||
| Pilot Air Freight, LLC(3) |
Senior Secured First Lien Delayed Draw Term Loan |
L + 475 (100 Floor)(8) |
5.75 | % | 07/2024 | 1,196 | 1,196 | 0.2 | 1,184 | |||||||||||||||||||
| Pilot Air Freight, LLC(3) |
Senior Secured First Lien Delayed Draw Term Loan |
L + 475 (100 Floor)(8) |
5.75 | % | 07/2024 | 771 | 769 | 0.1 | 764 | |||||||||||||||||||
| Pilot Air Freight, LLC(3) (4) (6) (9) |
Senior Secured First Lien Revolver |
07/2024 | — | — | — | (1 | ) | |||||||||||||||||||||
| Pilot Air Freight, LLC(3) |
Senior Secured First Lien Term Loan |
L + 475 (100 Floor)(8) |
5.75 | % | 07/2024 | 5,363 | 5,343 | 1.0 | 5,310 | |||||||||||||||||||
|
|
|
|
|
|
|
|
|
|||||||||||||||||||||
| 7,330 | 7,308 | 1.3 | 7,257 | |||||||||||||||||||||||||
|
|
|
|
|
|
|
|
|
|||||||||||||||||||||
| Total Debt Investments |
$ | 878,578 | $ | 856,705 | 151.8 | % | $ | 850,093 | ||||||||||||||||||||
|
|
|
|
|
|
|
|
|
|||||||||||||||||||||
| Equity Investments |
||||||||||||||||||||||||||||
| Capital Goods |
||||||||||||||||||||||||||||
| Alion Science and Technology Corporation(3) |
Common Stock |
745,504 | 766 | 0.2 | 1,392 | |||||||||||||||||||||||
| Envocore Holding, LLC(3) |
Preferred Stock |
1,139,725 | — | — | — | |||||||||||||||||||||||
|
|
|
|
|
|
|
|
|
|||||||||||||||||||||
| 1,885,229 | 766 | 0.2 | 1,392 | |||||||||||||||||||||||||
|
|
|
|
|
|
|
|
|
|||||||||||||||||||||
| Commercial & Professional Services |
||||||||||||||||||||||||||||
| Allied Universal holdings, LLC(3) |
Common Stock, Class A |
2,240,375 | 1,011 | 0.5 | 2,716 | |||||||||||||||||||||||
| ASP MCS Acquisition Corp.(10) |
Common Stock |
11,792 | 1,150 | 0.3 | 1,500 | |||||||||||||||||||||||
| Battery Solutions, Inc.(3) (10) |
Preferred Stock, Class E |
5,275,561 | 3,669 | 0.4 | 2,373 | |||||||||||||||||||||||
| Battery Solutions, Inc.(3) (10) |
Preferred Stock, Class A |
50,000 | — | — | — | |||||||||||||||||||||||
| Battery Solutions, Inc.(3) (10) |
Preferred Stock, Class F |
3,333,333 | — | — | — | |||||||||||||||||||||||
| Hercules Borrower LLC(3) |
Common Stock |
1,153,075 | 1,153 | 0.2 | 1,153 | |||||||||||||||||||||||
| IGT Holding LLC(3) |
Preferred Stock |
645,730 | — | — | — | |||||||||||||||||||||||
| IGT Holding LLC(3) |
Common Stock |
1,000,000 | — | — | — | |||||||||||||||||||||||
| MHS Acquisition Holdings, LLC(3) |
Common Stock |
10 | 10 | — | — | |||||||||||||||||||||||
| MHS Acquisition Holdings, LLC(3) |
Preferred Stock |
1,018 | 923 | 0.2 | 799 | |||||||||||||||||||||||
| My Alarm Center, LLC(3) |
Common Stock |
129,582 | — | — | — | |||||||||||||||||||||||
| My Alarm Center, LLC(3) |
Junior Preferred Stock |
2,420 | — | — | — | |||||||||||||||||||||||
| My Alarm Center, LLC(3) |
Senior Preferred Stock |
2,998 | — | — | — | |||||||||||||||||||||||
| PB Parent, LP(3) |
Common Stock |
1,125,000 | 1,125 | 0.2 | 1,189 | |||||||||||||||||||||||
| RSI Acquisition, LLC(3) |
Preferred Stock, Class A |
137,000 | 137 | — | 196 | |||||||||||||||||||||||
| Saber Parent Holdings(3) |
Common Stock |
13,132 | 1,313 | 0.2 | 1,313 | |||||||||||||||||||||||
| TecoStar Holdings, Inc.(3) |
Common Stock |
500,000 | 500 | 0.2 | 1,024 | |||||||||||||||||||||||
|
|
|
|
|
|
|
|
|
|||||||||||||||||||||
| 15,621,026 | 10,991 | 2.2 | 12,263 | |||||||||||||||||||||||||
|
|
|
|
|
|
|
|
|
|||||||||||||||||||||
| Consumer Services |
||||||||||||||||||||||||||||
| Everlast Holding, Inc.(3) |
Common Stock |
948 | 948 | 0.2 | 948 | |||||||||||||||||||||||
| Green Wrench Acquisition, LLC(3) |
Common Stock |
4,082 | 410 | 0.1 | 569 | |||||||||||||||||||||||
| HGH Investment, LP(3) |
Common Stock, Class A |
4,171 | 417 | 0.1 | 562 | |||||||||||||||||||||||
| Legalshield(3) |
Common Stock |
372 | 372 | 0.1 | 495 | |||||||||||||||||||||||
| Southern Technical Institute, Inc.(3) (10) |
Common Stock, Class A1 |
6,000,000 | — | 1.3 | 6,987 | |||||||||||||||||||||||
| Southern Technical Institute, Inc.(3) (10) |
Common Stock, Class A |
3,164,063 | — | — | 266 | |||||||||||||||||||||||
| Wrench Group Holdings, LLC(3) |
Common Stock, Class A |
1,143 | 115 | — | 160 | |||||||||||||||||||||||
|
|
|
|
|
|
|
|
|
|||||||||||||||||||||
| 9,174,779 | 2,262 | 1.8 | 9,987 | |||||||||||||||||||||||||
|
|
|
|
|
|
|
|
|
|||||||||||||||||||||
| Diversified Financials |
||||||||||||||||||||||||||||
| CBDC Senior Loan Fund LLC(15) (21) (22) |
Partnership Interest |
40,000,000 | 40,000 | 6.9 | 38,735 | |||||||||||||||||||||||
| GACP II LP(15) (22) (23) |
Partnership Interest |
16,227,613 | 16,228 | 2.9 | 16,154 | |||||||||||||||||||||||
|
|
|
|
|
|
|
|
|
|||||||||||||||||||||
| 56,227,613 | 56,228 | 9.8 | 54,889 | |||||||||||||||||||||||||
|
|
|
|
|
|
|
|
|
|||||||||||||||||||||
| Health Care Equipment & Services |
||||||||||||||||||||||||||||
| ExamWorks Group, Inc.(3) |
Common Stock |
7,500 | 750 | 0.3 | 1,586 | |||||||||||||||||||||||
| Hospice Care Buyer, Inc.(3) |
Common Stock |
11,265 | 1,127 | 0.2 | 1,127 | |||||||||||||||||||||||
See accompanying notes
84
CRESCENT CAPITAL BDC, INC.
Consolidated Schedule of Investments
December 31, 2020
(in thousands, except share and per share data)
| Company/Security/Country |
Investment Type |
Interest |
Interest Rate |
Maturity/ Dissolution Date |
Principal Amount, Par Value or Shares |
Cost | Percentage of Net Assets ** |
Fair Value |
||||||||||||||||||||
| MDVIP, Inc.(3) |
Common Stock |
46,807 | $ | 648 | 0.2 | % | $ | 1,169 | ||||||||||||||||||||
| NMN Holdings LP(3) |
Common Stock |
11,111 | 1,111 | 0.3 | 1,454 | |||||||||||||||||||||||
| PT Network, LLC(3) |
Common Stock, Class C |
0.93 | — | — | — | |||||||||||||||||||||||
| SL Topco Holdings, Inc.(3) |
Common Stock |
68,182 | 682 | 0.2 | 944 | |||||||||||||||||||||||
| Spartan Healthcare Holdings, LLC(3) |
Common Stock |
11,911 | 1,191 | 0.2 | 1,353 | |||||||||||||||||||||||
|
|
|
|
|
|
|
|
|
|||||||||||||||||||||
| 156,777 | 5,509 | 1.4 | 7,633 | |||||||||||||||||||||||||
|
|
|
|
|
|
|
|
|
|||||||||||||||||||||
| Insurance |
||||||||||||||||||||||||||||
| Integrity Marketing Acquisition, LLC(3) |
Common Stock |
619,562 | 648 | 0.2 | 1,252 | |||||||||||||||||||||||
| Integrity Marketing Acquisition, LLC(3) |
Preferred Stock |
1,247 | 1,216 | 0.3 | 1,485 | |||||||||||||||||||||||
| Integro Parent, Inc.(3) (15) |
Common Stock |
4,468 | 454 | 0.1 | 784 | |||||||||||||||||||||||
|
|
|
|
|
|
|
|
|
|||||||||||||||||||||
| 625,277 | 2,318 | 0.6 | 3,521 | |||||||||||||||||||||||||
|
|
|
|
|
|
|
|
|
|||||||||||||||||||||
| Materials |
||||||||||||||||||||||||||||
| Kestrel Upperco, LLC(3) |
Common Stock, Class A |
41,791 | 209 | — | 240 | |||||||||||||||||||||||
|
|
|
|
|
|
|
|
|
|||||||||||||||||||||
| Media & Entertainment |
||||||||||||||||||||||||||||
| Conisus, LLC(3) (10) |
Common Stock |
4,914,556 | — | 0.8 | 4,320 | |||||||||||||||||||||||
| Conisus, LLC(3) (10) (24) |
Preferred Stock, Series B |
1500 PIK |
15.00 | % | 18,544,370 | 10,160 | 3.3 | 18,545 | ||||||||||||||||||||
|
|
|
|
|
|
|
|
|
|||||||||||||||||||||
| 23,458,926 | 10,160 | 4.1 | 22,865 | |||||||||||||||||||||||||
| Pharmaceuticals, Biotechnology & Life Sciences |
||||||||||||||||||||||||||||
| Teal Parent Holdings, LP(3) |
Common Stock |
4,562 | 456 | 0.1 | 456 | |||||||||||||||||||||||
|
|
|
|
|
|
|
|
|
|||||||||||||||||||||
| Retailing |
||||||||||||||||||||||||||||
| Palmetto Moon, LLC(3) |
Common Stock |
99 | — | — | — | |||||||||||||||||||||||
| Slickdeals Holdings, LLC(3) (10) |
Common Stock |
61 | 990 | 0.3 | 1,482 | |||||||||||||||||||||||
| Vivid Seats Ltd.(3) (10) |
Common Stock |
608,108 | 608 | 0.1 | 801 | |||||||||||||||||||||||
| Vivid Seats Ltd.(3) (10) |
Preferred Stock |
1,891,892 | 1,892 | 0.5 | 2,913 | |||||||||||||||||||||||
|
|
|
|
|
|
|
|
|
|||||||||||||||||||||
| 2,500,160 | 3,490 | 0.9 | 5,196 | |||||||||||||||||||||||||
|
|
|
|
|
|
|
|
|
|||||||||||||||||||||
| Software & Services |
||||||||||||||||||||||||||||
| Curvature(3) (25) |
Residual Interest |
— | 2,482 | 0.4 | 2,481 | |||||||||||||||||||||||
| Saturn Topco LP(3) |
Common Stock |
411,511 | 412 | 0.1 | 412 | |||||||||||||||||||||||
|
|
|
|
|
|
|
|
|
|||||||||||||||||||||
| 411,511 | 2,894 | 0.5 | 2,893 | |||||||||||||||||||||||||
|
|
|
|
|
|
|
|
|
|||||||||||||||||||||
| Technology Hardware & Equipment |
||||||||||||||||||||||||||||
| Onvoy, LLC(3) |
Common Stock, Class A |
3,649 | 365 | 0.1 | 410 | |||||||||||||||||||||||
| Onvoy, LLC(3) |
Common Stock, Class B |
2,536 | — | — | — | |||||||||||||||||||||||
|
|
|
|
|
|
|
|
|
|||||||||||||||||||||
| 6,185 | 365 | 0.1 | 410 | |||||||||||||||||||||||||
| Transportation |
||||||||||||||||||||||||||||
| Xpress Global Systems, LLC(3) |
Common Stock |
12,544 | — | — | — | |||||||||||||||||||||||
|
|
|
|
|
|
|
|
|
|||||||||||||||||||||
| Total Equity Investments |
110,126,380 | $ | 95,648 | 21.7 | % | $ | 121,745 | |||||||||||||||||||||
|
|
|
|
|
|
|
|
|
|||||||||||||||||||||
| Total United States |
$ | 952,353 | 173.5 | % | $ | 971,838 | ||||||||||||||||||||||
|
|
|
|
|
|
|
|||||||||||||||||||||||
| Canada |
||||||||||||||||||||||||||||
| Debt Investments |
||||||||||||||||||||||||||||
| Health Care Equipment & Services |
||||||||||||||||||||||||||||
| VetStrategy(3) (4) (6) (9) (11) |
Unitranche First Lien Delayed Draw Term Loan |
07/2027 | C$ | 657 | (35 | ) | — | — | ||||||||||||||||||||
| VetStrategy(3) (15) |
Unitranche First Lien Term Loan |
C + 700 (100 Floor)(26) |
8.00 | % | 07/2027 | 9,292 | 6,738 | 1.3 | 7,294 | |||||||||||||||||||
| VetStrategy(3) (6) (9) (15) |
Unitranche First Lien Delayed Draw Term Loan |
C + 700 (100 Floor)(26) |
8.00 | % | 07/2027 | 1,399 | 973 | 0.2 | 1,010 | |||||||||||||||||||
| VetStrategy(3) (15) |
Unitranche First Lien Delayed Draw Term Loan |
C + 700 (100 Floor)(26) |
8.00 | % | 07/2027 | 1,729 | 1,259 | 0.2 | 1,357 | |||||||||||||||||||
|
|
|
|
|
|
|
|
|
|||||||||||||||||||||
| 13,077 | 8,935 | 1.7 | 9,661 | |||||||||||||||||||||||||
|
|
|
|
|
|
|
|
|
|||||||||||||||||||||
| Telecommunication Services |
||||||||||||||||||||||||||||
| Sandvine Corporation(3) (15) |
Senior Secured Second Lien Term Loan |
L + 800(7) |
8.15 | % | 11/2026 | 4,500 | 4,359 | 0.7 | 4,062 | |||||||||||||||||||
|
|
|
|
|
|
|
|
|
|||||||||||||||||||||
| Total Debt Investments |
C$ | 17,577 | $ | 13,294 | 2.4 | % | $ | 13,723 | ||||||||||||||||||||
|
|
|
|
|
|
|
|
|
|||||||||||||||||||||
See accompanying notes
85
CRESCENT CAPITAL BDC, INC.
Consolidated Schedule of Investments
December 31, 2020
(in thousands, except share and per share data)
| Company/Security/Country |
Investment Type |
Interest |
Interest Rate |
Maturity/ Dissolution Date |
Principal Amount, Par Value or Shares |
Cost | Percentage of Net Assets ** |
Fair Value |
||||||||||||||||||||
| Equity Investments |
||||||||||||||||||||||||||||
| Health Care Equipment & Services |
||||||||||||||||||||||||||||
| VetStrategy(3) (15) |
Common Stock | 750,000 | $ | 560 | 0.1 | % | $ | 589 | ||||||||||||||||||||
|
|
|
|
|
|
|
|
|
|||||||||||||||||||||
| 750,000 | 560 | 0.1 | 589 | |||||||||||||||||||||||||
|
|
|
|
|
|
|
|
|
|||||||||||||||||||||
| Total Equity Investments |
750,000 | $ | 560 | 0.1 | % | $ | 589 | |||||||||||||||||||||
|
|
|
|
|
|
|
|
|
|||||||||||||||||||||
| Total Canada |
$ | 13,854 | 2.5 | % | $ | 14,312 | ||||||||||||||||||||||
|
|
|
|
|
|
|
|||||||||||||||||||||||
| United Kingdom |
||||||||||||||||||||||||||||
| Debt Investments |
||||||||||||||||||||||||||||
| Commercial & Professional Services |
||||||||||||||||||||||||||||
| Crusoe Bidco Limited(3) (6) (15) (27) |
Unitranche First Lien Delayed Draw Term Loan |
L + 625(28) |
6.27 | % | 12/2025 | £ | 303 | 398 | 0.1 | 415 | ||||||||||||||||||
| Crusoe Bidco Limited(3) (15) |
Unitranche First Lien Term Loan |
L + 625(28) |
6.28 | % | 12/2025 | 6,068 | 7,431 | 1.5 | 8,294 | |||||||||||||||||||
| Crusoe Bidco Limited(3) (6) (15) (27) |
Unitranche First Lien Delayed Draw Term Loan |
12/2025 | — | — | — | — | ||||||||||||||||||||||
|
|
|
|
|
|
|
|
|
|||||||||||||||||||||
| 6,371 | 7,829 | 1.6 | 8,709 | |||||||||||||||||||||||||
|
|
|
|
|
|
|
|
|
|||||||||||||||||||||
| Consumer Services |
||||||||||||||||||||||||||||
| Auction Technology Group(3) (15) |
Unitranche First Lien Term Loan |
L + 650(29) |
6.62 | % | 02/2027 | £ | 3,339 | 4,241 | 0.8 | 4,564 | ||||||||||||||||||
| Auction Technology Group(3) (15) |
Unitranche First Lien Term Loan |
L + 650(29) |
6.84 | % | 02/2027 | $ | 10,687 | 10,398 | 1.9 | 10,687 | ||||||||||||||||||
|
|
|
|
|
|
|
|
|
|||||||||||||||||||||
| 14,026 | 14,639 | 2.7 | 15,251 | |||||||||||||||||||||||||
|
|
|
|
|
|
|
|
|
|||||||||||||||||||||
| Total Debt Investments |
20,397 | $ | 22,468 | 4.3 | % | $ | 23,960 | |||||||||||||||||||||
|
|
|
|
|
|
|
|
|
|||||||||||||||||||||
| Total United Kingdom |
$ | 22,468 | 4.3 | % | $ | 23,960 | ||||||||||||||||||||||
|
|
|
|
|
|
|
|||||||||||||||||||||||
| Netherlands |
||||||||||||||||||||||||||||
| Debt Investments |
||||||||||||||||||||||||||||
| Pharmaceuticals, Biotechnology & Life Sciences |
||||||||||||||||||||||||||||
| PharComp Parent B.V.(3) (15) (17) |
Unitranche First Lien - Last Out Term Loan |
E + 625(30) (31) |
6.25 | % | 02/2026 | € | 6,910 | 7,654 | 1.5 | 8,454 | ||||||||||||||||||
| PharComp Parent B.V.(3) (6) (15) (27) |
Unitranche First Lien Term Loan |
E + 625(30) (31) |
6.25 | % | 02/2026 | 187 | 151 | 0.1 | 229 | |||||||||||||||||||
|
|
|
|
|
|
|
|
|
|||||||||||||||||||||
| 7,097 | 7,805 | 1.6 | 8,683 | |||||||||||||||||||||||||
|
|
|
|
|
|
|
|
|
|||||||||||||||||||||
| Total Debt Investments |
€ | 7,097 | $ | 7,805 | 1.6 | % | $ | 8,683 | ||||||||||||||||||||
|
|
|
|
|
|
|
|
|
|||||||||||||||||||||
| Total Netherlands |
$ | 7,805 | 1.6 | % | $ | 8,683 | ||||||||||||||||||||||
|
|
|
|
|
|
|
|||||||||||||||||||||||
| Belgium |
||||||||||||||||||||||||||||
| Debt Investments |
||||||||||||||||||||||||||||
| Commercial & Professional Services |
||||||||||||||||||||||||||||
| MIR Bidco SA(3) (15) |
Unitranche First Lien Term Loan |
E + 625(31) (32) |
6.25 | % | 04/2026 | € | 9,507 | 10,491 | 2.0 | 11,168 | ||||||||||||||||||
| Miraclon Corporation(3) (15) |
Unitranche First Lien Term Loan |
L + 625(12) |
7.47 | % | 04/2026 | $ | 4,162 | 4,061 | 0.7 | 3,983 | ||||||||||||||||||
|
|
|
|
|
|
|
|
|
|||||||||||||||||||||
| 13,669 | 14,552 | 2.7 | 15,151 | |||||||||||||||||||||||||
|
|
|
|
|
|
|
|
|
|||||||||||||||||||||
| Total Debt Investments |
13,669 | $ | 14,552 | 2.7 | % | $ | 15,151 | |||||||||||||||||||||
|
|
|
|
|
|
|
|
|
|||||||||||||||||||||
| Equity Investments |
||||||||||||||||||||||||||||
| Commercial & Professional Services |
||||||||||||||||||||||||||||
| MIR Bidco SA(3) (15) |
Common Stock |
921 | 1 | — | — | |||||||||||||||||||||||
| MIR Bidco SA(3) (15) |
Preferred Stock |
81,384 | 91 | — | 57 | |||||||||||||||||||||||
|
|
|
|
|
|
|
|
|
|||||||||||||||||||||
| 82,305 | 92 | — | 57 | |||||||||||||||||||||||||
|
|
|
|
|
|
|
|
|
|||||||||||||||||||||
| Total Equity Investments |
82,305 | $ | 92 | — | % | $ | 57 | |||||||||||||||||||||
|
|
|
|
|
|
|
|
|
|||||||||||||||||||||
| Total Belgium |
$ | 14,644 | 2.7 | % | $ | 15,208 | ||||||||||||||||||||||
|
|
|
|
|
|
|
|||||||||||||||||||||||
| Total Investments |
$ | 1,011,124 | 184.6 | % | $ | 1,034,001 | ||||||||||||||||||||||
|
|
|
|
|
|
|
|||||||||||||||||||||||
See accompanying notes
86
CRESCENT CAPITAL BDC, INC.
Consolidated Schedule of Investments
December 31, 2020
(in thousands, except share and per share data)
| * | The majority of the investments bear interest at a rate that may be determined by reference to London Interbank Offered Rate (“LIBOR” or “L”), Prime (“P”), CDOR (“C”) or EURIBOR (“E”) and which reset monthly, bi-monthly, quarterly, semiannually or annually. For each, the Company has provided the spread over LIBOR or Prime and the current interest rate in effect at December 31, 2020. Certain investments are subject to a LIBOR or Prime interest rate floor. For fixed rate loans, a spread above a reference rate is not applicable. |
| ** | Percentage is based on net assets of $560,000 as of December 31, 2020. |
| (1) | All positions held are non-controlled/non-affiliated investments, unless otherwise noted, as defined by the Investment Company Act of 1940, as amended (“1940 Act”). Non-controlled/non-affiliated investments are investments that are neither controlled nor affiliated. |
| (2) | All debt investments are income-producing, unless otherwise noted. Equity and member interests are non-income-producing unless otherwise noted. The Company generally acquires its investments in private transactions exempt from registration under the Securities Act of 1933, as amended, or the Securities Act. Its investments are therefore generally subject to certain limitations on resale, and may be deemed to be “restricted securities” under the Securities Act. |
| (3) | The fair value of the investment was determined using significant unobservable inputs. See Note 2 “Summary of Significant Accounting Policies”. |
| (4) | The negative cost, if applicable, is the result of the capitalized discount or unfunded commitment being greater than the principal amount outstanding on the loan. The negative fair value, if applicable, is the result of the capitalized discount or unfunded commitment on the loan. |
| (5) | Investment pays 0.50% unfunded commitment fee on delayed draw term loan and/or revolving credit facilities. |
| (6) | Position or portion thereof is an unfunded loan commitment, and no interest is being earned on the unfunded portion. See Note 7 “Commitments and Contingencies”. |
| (7) | The interest rate on these loans is subject to the greater of a LIBOR floor or 1 month LIBOR plus a base rate. The 1 month LIBOR as of December 31, 2020 was 0.14%. For some of these loans, the interest rate is based on the last reset date. |
| (8) | The interest rate on these loans is subject to the greater of a LIBOR floor or 3 month LIBOR plus a base rate. The 3 month LIBOR as of December 31, 2020 was 0.24%. For some of these loans, the interest rate is based on the last reset date. |
| (9) | Investment pays 1.00% unfunded commitment fee on delayed draw term loan and/or revolving credit facilities. |
| (10) | As defined in the 1940 Act, the portfolio company is deemed to be a “non-controlled affiliated person” of the Company because the Company owns, either directly or indirectly, 5% or more of the portfolio company’s outstanding voting securities. See Note 3 “Agreements and Related Party Transactions”. |
| (11) | Fixed rate investment. |
| (12) | The interest rate on these loans is subject to the greater of a LIBOR floor or 6 month LIBOR plus a base rate. The 6 month LIBOR as of December 31, 2020 was 0.26%. For some of these loans, the interest rate is based on the last reset date. |
| (13) | The interest rate on these loans is subject to the greater of a LIBOR floor or 2 month LIBOR plus a base rate. The 2 month LIBOR as of December 31, 2020 was 0.19%. For some of these loans, the interest rate is based on the last reset date. |
| (14) | Investment pays 0.75% unfunded commitment fee on delayed draw term loan and/or revolving credit facilities. |
| (15) | Investment is not a qualifying investment as defined under section 55 (a) of the Investment Company Act of 1940. Qualifying assets must represent at least 70% of total assets at the time of acquisition. The Company’s percentage of non-qualifying assets based on fair value was 13.30% as of December 31, 2020. |
| (16) | The investment is on non-accrual status as of December 31, 2020. |
| (17) | These loans are unitranche first lien/last-out term loans. In addition to the interest earned based on the effective interest rate of this loan, which is the amount reflected in this schedule, the Company is entitled to receive additional interest as a result of an agreement among lenders whereby the loan has been allocated to “first-out” and “last-out” tranches, whereby the “first-out” tranche will have priority as to the “last-out” tranche with respect to payments of principal, interest and any amounts due thereunder. The Company holds the “last-out” tranche. |
| (18) | The interest rate on these loans is subject to the greater of a LIBOR floor or 12 month LIBOR plus a base rate. The 12 month LIBOR as of December 31, 2020 was 0.34%. For some of these loans, the interest rate is based on the last reset date. |
| (19) | The interest rate on these loans is subject to the U.S. Prime rate, which as of December 31, 2020 was 3.25%. |
| (20) | Investment pays 0.38% unfunded commitment fee on delayed draw term loan and/or revolving credit facilities. |
| (21) | As defined in the 1940 Act, the portfolio company is deemed to be a “controlled affiliated person” of the Company because the Company owns, either directly or indirectly, 25% or more of the portfolio company’s outstanding voting securities or has the power to exercise control over management or policies of such portfolio company. See Note 3 “Agreements and Related Party Transactions”. |
| (22) | This investment was valued using net asset value as a practical expedient for fair value. Consistent with FASB guidance under ASC 820, these investments are excluded from the hierarchical levels. |
| (23) | Investment is not redeemable. |
| (24) | Income producing equity security. |
| (25) | Residual interest in Curvature (Beijing) Technology Limited. |
See accompanying notes
87
CRESCENT CAPITAL BDC, INC.
Consolidated Schedule of Investments
December 31, 2020
(in thousands, except share and per share data)
| (26) | The interest rate on these loans is subject to the greater of a CDOR floor or 3 month CDOR plus a base rate. The 3 month CDOR as of December 31, 2020 was 0.50%. For some of these loans, the interest rate is based on the last reset date. |
| (27) | Investment pays 2.19% unfunded commitment fee on delayed draw term loan and/or revolving credit facilities. |
| (28) | The interest rate on these loans is subject to the greater of a GBP LIBOR floor or 3 month GBP LIBOR plus a base rate. The 3 month GBP LIBOR as of December 31, 2020 was 0.03%. For some of these loans, the interest rate is based on the last reset date. |
| (29) | The interest rate on these loans is subject to the greater of a GBP LIBOR floor or 6 month GBP LIBOR plus a base rate. The 6 month GBP LIBOR as of December 31, 2020 was 0.03%. For some of these loans, the interest rate is based on the last reset date. |
| (30) | The interest rate on these loans is subject to the greater of a EURIBOR floor or 3 month EURIBOR plus a base rate. The 3 month EURIBOR as of December 31, 2020 was (0.55)%. For some of these loans, the interest rate is based on the last reset date. |
| (31) | For EURIBOR rate investments where negative rates can be prevalent, a 0% floor is presumed. |
| (32) | The interest rate on these loans is subject to the greater of a EURIBOR floor or 6 month EURIBOR plus a base rate. The 6 month EURIBOR as of December 31, 2020 was (0.53)%. For some of these loans, the interest rate is based on the last reset date. |
| Foreign Currency Exchange Contracts |
||||||||||||||||
| Counterparty |
Currency Purchased | Currency Sold | Settlement | Unrealized Appreciation (Depreciation) |
||||||||||||
| Wells Fargo Bank, N.A. |
USD | 7,089 | CAD | 9,712 | 07/31/2025 | (12 | ) | |||||||||
| Wells Fargo Bank, N.A. |
USD | 612 | CAD | 801 | 07/31/2025 | (485 | ) | |||||||||
| Wells Fargo Bank, N.A. |
USD | 325 | CAD | 422 | 07/31/2025 | (4 | ) | |||||||||
| Wells Fargo Bank, N.A. |
USD | 622 | CAD | 839 | 07/31/2025 | (32 | ) | |||||||||
| Wells Fargo Bank, N.A. |
USD | 635 | CAD | 864 | 07/31/2025 | (39 | ) | |||||||||
| Wells Fargo Bank, N.A. |
USD | 209 | EUR | 187 | 02/20/2024 | (26 | ) | |||||||||
| Wells Fargo Bank, N.A. |
USD | 8,063 | EUR | 6,703 | 02/20/2024 | 183 | ||||||||||
| Wells Fargo Bank, N.A. |
USD | 11,682 | EUR | 9,222 | 04/10/2024 | 81 | ||||||||||
| Wells Fargo Bank, N.A. |
USD | 7,975 | GBP | 5,885 | 12/01/2023 | (125 | ) | |||||||||
| Wells Fargo Bank, N.A. |
USD | 395 | GBP | 294 | 12/01/2023 | (10 | ) | |||||||||
| Wells Fargo Bank, N.A. |
USD | 4,317 | GBP | 3,239 | 02/13/2025 | (163 | ) | |||||||||
|
|
|
|||||||||||||||
| Total Foreign Currency Exchange Contracts |
(632 | ) | ||||||||||||||
|
|
|
|||||||||||||||
| CAD | Canadian Dollar |
| EUR | Euro |
| GBP | Great British Pound |
| PIK | Payment In-Kind |
| USD | United States Dollar |
See accompanying notes
88
CRESCENT CAPITAL BDC, INC.
Consolidated Schedule of Investments
December 31, 2019
(in thousands, except share and per share data)
| Company/Security/Country†‡ |
Investment Type |
Interest |
Interest Rate |
Maturity / Dissolution Date |
Principal Amount, Par Value or Shares |
Cost | Percentage of Net Assets ** |
Fair Value |
||||||||||||||||||||
| United States |
||||||||||||||||||||||||||||
| Debt Investments |
||||||||||||||||||||||||||||
| Automobiles & Components |
||||||||||||||||||||||||||||
| Auto-Vehicle Parts, LLC(1) |
Senior Secured First Lien Term Loan |
L + 450 (100 Floor) (2) |
6.30 | % | 01/2023 | $ | 4,720 | $ | 4,674 | 1.2 | % | $ | 4,702 | |||||||||||||||
| Auto-Vehicle Parts, LLC(1) (3) (4) (20) |
Senior Secured First Lien Revolver |
01/2023 | — | (5 | ) | — | (2 | ) | ||||||||||||||||||||
| Continental Battery Company(1) (3) (20) |
Senior Secured First Lien Delayed Draw Term Loan | L + 525 (100 Floor) (2) |
7.05 | % | 01/2020 | 1,689 | 1,683 | 0.4 | 1,689 | |||||||||||||||||||
| Continental Battery Company(1) |
Senior Secured First Lien Term Loan |
L + 525 (100 Floor) (2) |
7.05 | % | 12/2022 | 3,973 | 3,928 | 1.0 | 3,973 | |||||||||||||||||||
| Continental Battery Company(1) (3) (20) |
Senior Secured First Lien Revolver |
L + 525 (100 Floor) (2) |
7.05 | % | 12/2022 | 680 | 671 | 0.2 | 680 | |||||||||||||||||||
| Continental Battery Company(1) |
Senior Secured First Lien Delayed Draw Term Loan | L + 525 (100 Floor) (2) |
7.05 | % | 12/2022 | 6,645 | 6,559 | 1.6 | 6,645 | |||||||||||||||||||
| Empire Auto Parts, LLC(1) |
Unitranche First Lien Term Loan |
L + 550 (100 Floor) (5) |
7.39 | % | 09/2024 | 2,469 | 2,429 | 0.6 | 2,493 | |||||||||||||||||||
| Empire Auto Parts, LLC(1) (3) (4) (20) |
Unitranche First Lien Revolver |
09/2024 | — | (6 | ) | — | 4 | |||||||||||||||||||||
| Empire Auto Parts, LLC(1) |
Unitranche First Lien Term Loan |
L + 550 (100 Floor) (5) |
7.39 | % | 09/2024 | 2,394 | 2,349 | 0.6 | 2,418 | |||||||||||||||||||
| POC Investors, LLC(1) |
Senior Secured First Lien Term Loan |
L + 550 (100 Floor) (5) |
7.44 | % | 11/2021 | 9,448 | 9,371 | 2.3 | 9,448 | |||||||||||||||||||
| POC Investors, LLC(1) (3) (4) (20) |
Senior Secured First Lien Revolver |
11/2021 | — | (7 | ) | — | — | |||||||||||||||||||||
|
|
|
|
|
|
|
|
|
|||||||||||||||||||||
| 32,018 | 31,646 | 7.9 | 32,050 | |||||||||||||||||||||||||
|
|
|
|
|
|
|
|
|
|||||||||||||||||||||
| Capital Goods |
| |||||||||||||||||||||||||||
| Alion Science and Technology Corporation |
Senior Secured First Lien Term Loan |
L + 450 (100 Floor) (2) |
6.30 | % | 08/2021 | 2,968 | 2,968 | 0.7 | 2,977 | |||||||||||||||||||
| Alion Science and Technology Corporation(1) (6) |
Unsecured Debt | 11.00 | % | 08/2022 | 6,543 | 6,440 | 1.6 | 6,543 | ||||||||||||||||||||
| Midwest Industrial Rubber(1) |
Senior Secured First Lien Term Loan |
L + 550 (100 Floor) (2) |
7.05 | % | 12/2021 | 7,180 | 7,123 | 1.8 | 7,180 | |||||||||||||||||||
| Midwest Industrial Rubber(1) (3) (4) (20) |
Senior Secured First Lien Revolver |
12/2021 | — | (4 | ) | — | — | |||||||||||||||||||||
| Potter Electric Signal Company(1) (3) (21) |
Senior Secured First Lien Delayed Draw Term Loan | L + 425 (100 Floor) (5) |
6.13 | % | 12/2021 | 476 | 453 | 0.1 | 468 | |||||||||||||||||||
| Potter Electric Signal Company(1) (3) (20) |
Senior Secured First Lien Revolver |
P + 325(7) | 8.00 | % | 12/2024 | 31 | 26 | — | 28 | |||||||||||||||||||
| Potter Electric Signal Company(1) |
Senior Secured First Lien Term Loan |
L + 425 (100 Floor) (8) |
6.54 | % | 12/2025 | 2,506 | 2,483 | 0.6 | 2,493 | |||||||||||||||||||
|
|
|
|
|
|
|
|
|
|||||||||||||||||||||
| 19,704 | 19,489 | 4.8 | 19,689 | |||||||||||||||||||||||||
|
|
|
|
|
|
|
|
|
|||||||||||||||||||||
| Commercial & Professional Services |
||||||||||||||||||||||||||||
| ASP MCS Acquisition Corp. |
Senior Secured First Lien Term Loan |
L + 475 (100 Floor) (5) |
6.64 | % | 05/2024 | 5,241 | 5,223 | 0.6 | 2,495 | |||||||||||||||||||
| BFC Solmetex LLC & Bonded Filter Co. LLC(1) (3) (2) |
Unitranche First Lien Revolver |
L + 650 (100 Floor) (5) |
8.45 | % | 09/2023 | 60 | 54 | — | 60 | |||||||||||||||||||
| BFC Solmetex LLC & Bonded Filter Co. LLC(1) (20) |
Unitranche First Lien Revolver |
L + 650 (100 Floor) (5) |
8.45 | % | 09/2023 | 750 | 739 | 0.2 | 750 | |||||||||||||||||||
| BFC Solmetex LLC & Bonded Filter Co. LLC(1) |
Unitranche First Lien Term Loan |
L + 650 (100 Floor) (5) |
8.45 | % | 09/2023 | 5,981 | 5,885 | 1.5 | 5,981 | |||||||||||||||||||
| BFC Solmetex LLC & Bonded Filter Co. LLC(1) |
Unitranche First Lien Term Loan |
L + 650 (100 Floor) (5) |
8.45 | % | 09/2023 | 624 | 614 | 0.1 | 624 | |||||||||||||||||||
| BFC Solmetex LLC & Bonded Filter Co. LLC(1) (3) (4) |
Unitranche First Lien Term Loan |
09/2023 | — | (6 | ) | — | — | |||||||||||||||||||||
| CHA Holdings, Inc.(1) |
Senior Secured First Lien Term Loan |
L + 450 (100 Floor) (5) |
6.44 | % | 04/2025 | 4,855 | 4,835 | 1.2 | 4,849 | |||||||||||||||||||
| CHA Holdings, Inc.(1) |
Senior Secured First Lien Delayed Draw Term Loan | L + 450 (100 Floor) (5) |
6.44 | % | 04/2025 | 1,023 | 1,020 | 0.2 | 1,022 | |||||||||||||||||||
See accompanying notes
89
CRESCENT CAPITAL BDC, INC.
Consolidated Schedule of Investments
December 31, 2019
(in thousands, except share and per share data)
| Company/Security/Country†‡ |
Investment Type |
Interest |
Interest Rate |
Maturity / Dissolution Date |
Principal Amount, Par Value or Shares |
Cost | Percentage of Net Assets ** |
Fair Value |
||||||||||||||||||||
| DFS Intermediate Holdings, LLC(1) |
Senior Secured First Lien Term Loan |
L + 525 (100 Floor) (2) | 7.02 | % | 03/2022 | $ | 8,793 | $ | 8,707 | 2.2 | % | $ | 8,793 | |||||||||||||||
| DFS Intermediate Holdings, LLC(1) (3) (20) |
Senior Secured First Lien Revolver |
L + 525 (100 Floor) (2) | 7.02 | % | 03/2022 | 1,644 | 1,620 | 0.4 | 1,644 | |||||||||||||||||||
| DFS Intermediate Holdings, LLC(1) (3) (20) |
Senior Secured First Lien Delayed Draw Term Loan | L + 525 (100 Floor) (2) | 6.95 | % | 03/2022 | 3,473 | 3,431 | 0.8 | 3,473 | |||||||||||||||||||
| GH Holding Company(1) |
Senior Secured First Lien Term Loan |
L + 450(2) | 6.30 | % | 02/2023 | 1,474 | 1,469 | 0.3 | 1,463 | |||||||||||||||||||
| GI Revelation Acquisition LLC |
Senior Secured First Lien Term Loan |
L + 500(2) | 6.80 | % | 04/2025 | 7,396 | 7,366 | 1.7 | 6,999 | |||||||||||||||||||
| Hepaco, LLC(1) (3) (20) |
Senior Secured First Lien Revolver |
L + 475 (100 Floor) (2) | 6.54 | % | 08/2023 | 660 | 658 | 0.2 | 660 | |||||||||||||||||||
| Hepaco, LLC(1) |
Senior Secured First Lien Term Loan |
L + 475 (100 Floor) (2) | 6.55 | % | 08/2024 | 5,151 | 5,112 | 1.3 | 5,151 | |||||||||||||||||||
| Hepaco, LLC(1) (3) (21) |
Senior Secured First Lien Delayed Draw Term Loan | L + 475 (100 Floor) (2) | 6.55 | % | 08/2024 | 3,978 | 3,945 | 1.0 | 3,978 | |||||||||||||||||||
| Jordan Healthcare, Inc.(1) |
Senior Secured First Lien Term Loan |
L + 600 (100 Floor) (5) | 7.94 | % | 07/2022 | 4,021 | 3,998 | 1.0 | 4,036 | |||||||||||||||||||
| Jordan Healthcare, Inc.(1) |
Senior Secured First Lien Delayed Draw Term Loan | L + 600 (100 Floor) (5) | 7.94 | % | 07/2022 | 698 | 694 | 0.2 | 701 | |||||||||||||||||||
| Jordan Healthcare, Inc.(1) (3) (20) |
Senior Secured First Lien Revolver |
L + 600 (100 Floor) (5) | 7.94 | % | 07/2022 | 294 | 292 | 0.1 | 296 | |||||||||||||||||||
| MHS Acquisition Holdings, LLC(1) |
Senior Secured Second Lien Term Loan |
L + 875 (100 Floor) (5) | 10.69 | % | 03/2025 | 8,102 | 7,929 | 1.9 | 7,818 | |||||||||||||||||||
| MHS Acquisition Holdings, LLC(1) |
Senior Secured Second Lien Delayed Draw Term Loan |
L + 875 (100 Floor) (5) | 10.69 | % | 03/2025 | 467 | 460 | 0.1 | 450 | |||||||||||||||||||
| MHS Acquisition Holdings, LLC(1) |
Unsecured Debt | 1350 PIK | 13.50 | % | 03/2026 | 714 | 706 | 0.2 | 653 | |||||||||||||||||||
| MHS Acquisition Holdings, LLC(1) |
Unsecured Debt | 1350 PIK | 13.50 | % | 03/2026 | 238 | 236 | 0.1 | 218 | |||||||||||||||||||
| Pye-Barker Fire & Safety, LLC(1) |
Unitranche First Lien Term Loan |
L + 575 (100 Floor) (5) | 7.67 | % | 11/2025 | 10,125 | 9,850 | 2.5 | 10,125 | |||||||||||||||||||
| Pye-Barker Fire & Safety, LLC(1) (3) (4) |
Unitranche First Lien Delayed Draw Term Loan |
11/2025 | — | (51 | ) | — | — | |||||||||||||||||||||
| Receivable Solutions, Inc.(1) |
Senior Secured First Lien Term Loan |
L + 500 (100 Floor) (5) | 6.94 | % | 10/2024 | 2,194 | 2,158 | 0.5 | 2,194 | |||||||||||||||||||
| Receivable Solutions, Inc.(1) (3) (20) |
Senior Secured First Lien Revolver |
L + 500 (100 Floor) (2) | 6.80 | % | 10/2024 | 30 | 25 | — | 30 | |||||||||||||||||||
| SavATree, LLC(1) |
Senior Secured First Lien Term Loan |
L + 500 (100 Floor) (5) | 6.94 | % | 06/2022 | 3,956 | 3,916 | 1.0 | 3,956 | |||||||||||||||||||
| SavATree, LLC(1) (3) (4) (20) |
Senior Secured First Lien Revolver |
06/2022 | — | (5 | ) | — | — | |||||||||||||||||||||
| SavATree, LLC(1) (3) (21) |
Senior Secured First Lien Delayed Draw Term Loan | L + 500 (100 Floor) (5) | 6.89 | % | 06/2022 | 154 | 147 | — | 154 | |||||||||||||||||||
| TecoStar Holdings, Inc.(1) |
Senior Secured Second Lien Term Loan |
L + 850 (100 Floor)(5) | 10.24 | % | 11/2024 | 5,000 | 4,909 | 1.2 | 5,000 | |||||||||||||||||||
| UP Acquisition Corp(1) |
Unitranche First Lien Term Loan |
L + 575 (100 Floor) (2) | 7.55 | % | 05/2024 | 4,378 | 4,299 | 1.1 | 4,378 | |||||||||||||||||||
| UP Acquisition Corp(1) (3) (20) |
Unitranche First Lien Revolver |
L + 575 (100 Floor) (5) | 7.55 | % | 05/2024 | 73 | 51 | — | 73 | |||||||||||||||||||
| UP Acquisition Corp(1) (3) (20) |
Unitranche First Lien Delayed Draw Term Loan |
L + 575 (100 Floor) (2) | 7.55 | % | 05/2024 | 276 | 271 | 0.1 | 276 | |||||||||||||||||||
| Valet Waste Holdings, Inc. |
Senior Secured First Lien Term Loan |
L + 375(2) | 5.54 | % | 09/2025 | 14,812 | 14,781 | 3.6 | 14,683 | |||||||||||||||||||
See accompanying notes
90
CRESCENT CAPITAL BDC, INC.
Consolidated Schedule of Investments
December 31, 2019
(in thousands, except share and per share data)
| Company/Security/Country†‡ |
Investment Type |
Interest |
Interest Rate |
Maturity / Dissolution Date |
Principal Amount, Par Value or Shares |
Cost | Percentage of Net Assets ** |
Fair Value |
||||||||||||||||||||
| Xcentric Mold and Engineering Acquisition Company, LLC(1) |
Senior Secured First Lien Term Loan |
L + 700 (100 Floor) (including 100 PIK)(2) |
8.69 | % | 01/2022 | $ | 4,933 | $ | 4,889 | 1.1 | % | $ | 4,587 | |||||||||||||||
| Xcentric Mold and Engineering Acquisition Company, LLC(1) |
Senior Secured First Lien Revolver |
L + 700 (100 Floor) (including 100 PIK)(2) |
8.69 | % | 01/2022 | 703 | 697 | 0.2 | 654 | |||||||||||||||||||
|
|
|
|
|
|
|
|
|
|||||||||||||||||||||
| 112,271 | 110,924 | 26.6 | 108,224 | |||||||||||||||||||||||||
|
|
|
|
|
|
|
|
|
|||||||||||||||||||||
| Consumer Durables & Apparel |
||||||||||||||||||||||||||||
| EiKo Global, LLC(1) |
Senior Secured First Lien Term Loan |
L + 600 (100 Floor) (5) |
7.94 | % | 06/2023 | 3,256 | 3,207 | 0.8 | 3,256 | |||||||||||||||||||
| EiKo Global, LLC(1) (3) (4) (20) |
Senior Secured First Lien Revolver |
06/2023 | — | (11 | ) | — | — | |||||||||||||||||||||
|
|
|
|
|
|
|
|
|
|||||||||||||||||||||
| 3,256 | 3,196 | 0.8 | 3,256 | |||||||||||||||||||||||||
|
|
|
|
|
|
|
|
|
|||||||||||||||||||||
| Consumer Services |
||||||||||||||||||||||||||||
| Colibri Group LLC(1) |
Unitranche First Lien Term Loan |
L + 575 (100 Floor) (5) |
7.70 | % | 05/2025 | 8,209 | 8,021 | 2.0 | 8,200 | |||||||||||||||||||
| Colibri Group LLC(1) (21) |
Unitranche First Lien Delayed Draw Term Loan |
L + 575 (100 Floor) (5) |
7.68 | % | 05/2025 | 1,350 | 1,320 | 0.3 | 1,348 | |||||||||||||||||||
| Colibri Group LLC(1) (3) (20) |
Unitranche First Lien Revolver |
L + 575 (100 Floor) (2) |
7.55 | % | 05/2025 | 267 | 244 | 0.1 | 266 | |||||||||||||||||||
| COP Home Services Holdings, Inc.(1) (3) (4) (20) |
Senior Secured First Lien Term Loan |
05/2025 | — | (8 | ) | — | (2 | ) | ||||||||||||||||||||
| COP Home Services Holdings, Inc.(1) (21) |
Senior Secured First Lien Term Loan |
L + 450 (100 Floor) (5) |
6.40 | % | 05/2025 | 3,474 | 3,411 | 0.8 | 3,457 | |||||||||||||||||||
| COP Home Services Holdings, Inc.(1) (3) (4) |
Senior Secured First Lien Delayed Draw Term Loan |
05/2025 | — | (9 | ) | — | (4 | ) | ||||||||||||||||||||
| HGH Purchaser, Inc.(1) |
Unitranche First Lien Term Loan |
L + 600 (100 Floor) (2) |
7.69 | % | 11/2025 | 8,108 | 7,910 | 2.0 | 8,108 | |||||||||||||||||||
| HGH Purchaser, Inc.(1) (3) (4) (21) |
Unitranche First Lien Delayed Draw Term Loan |
11/2025 | — | (41 | ) | — | — | |||||||||||||||||||||
| HGH Purchaser, Inc.(1) (3) (20) |
Unitranche First Lien Revolver |
P + 500(7) |
9.75 | % | 11/2025 | 186 | 161 | — | 186 | |||||||||||||||||||
| JLL XDD, Inc.(1) |
Senior Secured First Lien Term Loan |
L + 475 (100 Floor) (5) |
6.69 | % | 12/2023 | 2,134 | 2,086 | 0.5 | 2,134 | |||||||||||||||||||
| Learn-It Systems, LLC(1) |
Senior Secured First Lien Term Loan |
L + 450 (50 Floor)(5) |
6.40 | % | 03/2025 | 4,367 | 4,265 | 1.1 | 4,367 | |||||||||||||||||||
| Learn-It Systems, LLC(1) (3) (20) |
Senior Secured First Lien Revolver |
P + 350(7) |
8.25 | % | 03/2025 | 492 | 478 | 0.1 | 492 | |||||||||||||||||||
| Learn-It Systems, LLC(1) (3) (22) |
Senior Secured First Lien Delayed Draw Term Loan |
L + 450 (50 Floor)(5) |
6.50 | % | 03/2025 | 311 | 251 | 0.1 | 311 | |||||||||||||||||||
| New Mountain Learning(1) |
Senior Secured First Lien Term Loan |
L + 600 (100 Floor) (5) |
7.94 | % | 03/2024 | 1,825 | 1,798 | 0.4 | 1,579 | |||||||||||||||||||
| New Mountain Learning(1) (3) (20) |
Senior Secured First Lien Revolver |
L + 600 (100 Floor) (5) |
7.94 | % | 03/2024 | 475 | 467 | 0.1 | 394 | |||||||||||||||||||
| New Mountain Learning(1) |
Senior Secured First Lien Delayed Draw Term Loan |
L + 600 (100 Floor) (5) |
7.94 | % | 03/2024 | 370 | 365 | 0.1 | 320 | |||||||||||||||||||
| Pre-Paid Legal Services, Inc. |
Senior Secured Second Lien Term Loan |
L + 750(2) |
9.30 | % | 05/2026 | 9,333 | 9,249 | 2.3 | 9,318 | |||||||||||||||||||
| Teaching Strategies LLC(1) |
Unitranche First Lien Term Loan |
L + 600 (100 Floor) (5) |
7.94 | % | 05/2024 | 9,234 | 9,055 | 2.3 | 9,327 | |||||||||||||||||||
| Teaching Strategies LLC(1) (3) (20) |
Unitranche First Lien Revolver |
L + 600 (100 Floor) (5) |
7.94 | % | 05/2024 | 183 | 171 | — | 189 | |||||||||||||||||||
| United Language Group, Inc.(1) |
Senior Secured First Lien Term Loan |
L + 600 (100 Floor) (2) |
7.88 | % | 12/2021 | 4,689 | 4,638 | 1.1 | 4,344 | |||||||||||||||||||
| United Language Group, Inc.(1) (20) |
Senior Secured First Lien Revolver |
L + 600 (100 Floor) (2) |
7.88 | % | 12/2021 | 400 | 395 | 0.1 | 370 | |||||||||||||||||||
| Vistage Worldwide, Inc. |
Senior Secured First Lien Term Loan |
L + 400 (100 Floor) (2) |
5.80 | % | 02/2025 | 6,473 | 6,483 | 1.6 | 6,441 | |||||||||||||||||||
See accompanying notes
91
CRESCENT CAPITAL BDC, INC.
Consolidated Schedule of Investments
December 31, 2019
(in thousands, except share and per share data)
| Company/Security/Country†‡ |
Investment Type |
Interest |
Interest Rate |
Maturity / Dissolution Date |
Principal Amount, Par Value or Shares |
Cost | Percentage of Net Assets ** |
Fair Value |
||||||||||||||||||||
| Wrench Group LLC(1) |
Senior Secured First Lien Term Loan |
L + 425(5) |
6.19 | % | 04/2026 | $ | 3,089 | $ | 3,060 | 0.8 | % | $ | 3,097 | |||||||||||||||
| Wrench Group LLC(1) (3) (23) |
Senior Secured First Lien Delayed Draw Term Loan |
04/2026 | — | — | — | 2 | ||||||||||||||||||||||
| Wrench Group LLC(1) |
Senior Secured Second Lien Term Loan |
L + 788(10) |
9.82 | % | 04/2027 | 2,500 | 2,429 | 0.6 | 2,500 | |||||||||||||||||||
|
|
|
|
|
|
|
|
|
|||||||||||||||||||||
| 67,469 | 66,199 | 16.4 | 66,744 | |||||||||||||||||||||||||
|
|
|
|
|
|
|
|
|
|||||||||||||||||||||
| Diversified Financials |
||||||||||||||||||||||||||||
| CC SAG Acquisition Corp.(1) |
Unitranche First Lien Term Loan |
L + 500 (100 Floor) (5) |
6.89 | % | 09/2025 | 7,182 | 7,021 | 1.8 | 7,132 | |||||||||||||||||||
| CC SAG Acquisition Corp.(1) (3) (21) |
Unitranche First Lien Delayed Draw Term Loan |
L + 500 (100 Floor) (2) |
6.76 | % | 09/2025 | 172 | 142 | — | 157 | |||||||||||||||||||
| CC SAG Acquisition Corp.(1) (3) (4) (20) |
Unitranche First Lien Revolver |
09/2025 | — | (23 | ) | — | (7 | ) | ||||||||||||||||||||
|
|
|
|
|
|
|
|
|
|||||||||||||||||||||
| 7,354 | 7,140 | 1.8 | 7,282 | |||||||||||||||||||||||||
|
|
|
|
|
|
|
|
|
|||||||||||||||||||||
| Energy |
||||||||||||||||||||||||||||
| BJ Services, LLC(1) (11) |
Unitranche First Lien—Last Out Term Loan |
L + 1033 (150 Floor) (5) |
12.43 | % | 01/2023 | 8,287 | 8,220 | 2.0 | 8,287 | |||||||||||||||||||
| BJ Services, LLC(1) |
Unitranche First Lien Term Loan |
L + 700 (150 Floor) (5) |
9.10 | % | 01/2023 | 4,875 | 4,836 | 1.2 | 4,875 | |||||||||||||||||||
|
|
|
|
|
|
|
|
|
|||||||||||||||||||||
| 13,162 | 13,056 | 3.2 | 13,162 | |||||||||||||||||||||||||
|
|
|
|
|
|
|
|
|
|||||||||||||||||||||
| Food & Staples Retailing |
||||||||||||||||||||||||||||
| BJH Holdings III Corp.(1) |
Unitranche First Lien Term Loan |
L + 575 (100 Floor) (2) |
7.55 | % | 08/2025 | 13,715 | 13,520 | 3.4 | 13,647 | |||||||||||||||||||
| Isagenix International, LLC |
Senior Secured First Lien Term Loan |
L + 575 (100 Floor) (5) |
7.70 | % | 06/2025 | 6,471 | 6,442 | 1.1 | 4,652 | |||||||||||||||||||
| PetIQ, LLC(1) (9) |
Senior Secured First Lien Term Loan |
L + 450 (100 Floor) (2) |
6.30 | % | 07/2025 | 15,000 | 14,868 | 3.7 | 15,000 | |||||||||||||||||||
|
|
|
|
|
|
|
|
|
|||||||||||||||||||||
| 35,186 | 34,830 | 8.2 | 33,299 | |||||||||||||||||||||||||
|
|
|
|
|
|
|
|
|
|||||||||||||||||||||
| Food, Beverage & Tobacco |
||||||||||||||||||||||||||||
| Mann Lake Ltd.(1) |
Senior Secured First Lien Term Loan |
L + 500 (100 Floor) (5) |
6.91 | % | 10/2024 | 3,865 | 3,800 | 1.0 | 3,826 | |||||||||||||||||||
| Mann Lake Ltd.(1) (3) (20) |
Senior Secured First Lien Revolver |
L + 500 (100 Floor) (5) |
6.91 | % | 10/2024 | 444 | 430 | 0.1 | 435 | |||||||||||||||||||
|
|
|
|
|
|
|
|
|
|||||||||||||||||||||
| 4,309 | 4,230 | 1.1 | 4,261 | |||||||||||||||||||||||||
|
|
|
|
|
|
|
|
|
|||||||||||||||||||||
| Health Care Equipment & Services |
||||||||||||||||||||||||||||
| Abode Healthcare, Inc.(1) |
Senior Secured First Lien Term Loan |
L + 425 (100 Floor) (5) |
6.16 | % | 08/2025 | 4,788 | 4,697 | 1.2 | 4,716 | |||||||||||||||||||
| Abode Healthcare, Inc.(1) (3) (20) |
Senior Secured First Lien Revolver |
L + 425 (100 Floor) (5) |
6.16 | % | 08/2025 | 288 | 266 | 0.1 | 270 | |||||||||||||||||||
| Ameda, Inc.(1) |
Senior Secured First Lien Term Loan |
L + 700 (100 Floor) (2) |
8.77 | % | 09/2022 | 2,279 | 2,254 | 0.6 | 2,244 | |||||||||||||||||||
| Ameda, Inc.(1) (3) (20) |
Senior Secured First Lien Revolver |
L + 700 (100 Floor) (2) |
8.77 | % | 09/2022 | 188 | 184 | — | 183 | |||||||||||||||||||
| Avalign Technologies, Inc.(1) |
Senior Secured First Lien Term Loan |
L + 450(2) |
6.30 | % | 12/2025 | 17,009 | 16,858 | 4.2 | 16,881 | |||||||||||||||||||
| Centauri Health Solutions, Inc.(1) |
Senior Secured First Lien Delayed Draw Term Loan |
L + 475 (100 Floor) (2) |
6.55 | % | 01/2023 | 891 | 881 | 0.2 | 900 | |||||||||||||||||||
| Centauri Health Solutions, Inc.(1) |
Senior Secured First Lien Term Loan |
L + 475 (100 Floor) (2) |
6.55 | % | 01/2023 | 14,546 | 14,387 | 3.6 | 14,692 | |||||||||||||||||||
| Centauri Health Solutions, Inc.(1) (3) (4) (20) |
Senior Secured First Lien Revolver |
01/2023 | — | (9 | ) | — | 16 | |||||||||||||||||||||
| Centria Subsidiary Holdings, LLC(1) (3) (4) (20) |
Unitranche First Lien Revolver |
12/2025 | — | (59 | ) | — | — | |||||||||||||||||||||
| Centria Subsidiary Holdings, LLC(1) |
Unitranche First Lien Term Loan |
L + 600 (100 Floor)(5) |
7.89 | % | 12/2025 | 11,842 | 11,490 | 2.9 | 11,842 | |||||||||||||||||||
| Clarkson Eyecare, LLC(1) |
Unitranche First Lien Term Loan |
L + 625 (100 Floor) (2) |
8.05 | % | 04/2021 | 9,013 | 8,869 | 2.2 | 8,877 | |||||||||||||||||||
| Clarkson Eyecare, LLC(1) |
Unitranche First Lien Term Loan |
L + 625 (100 Floor) (2) |
8.05 | % | 04/2021 | 5,950 | 5,853 | 1.4 | 5,861 | |||||||||||||||||||
See accompanying notes
92
CRESCENT CAPITAL BDC, INC.
Consolidated Schedule of Investments
December 31, 2019
(in thousands, except share and per share data)
| Company/Security/Country†‡ |
Investment Type |
Interest |
Interest Rate |
Maturity / Dissolution Date |
Principal Amount, Par Value or Shares |
Cost | Percentage of Net Assets ** |
Fair Value |
||||||||||||||||||||
| CRA MSO, LLC(1) |
Senior Secured First Lien Term Loan |
L + 475 (100 Floor) (2) |
6.55 | % | 12/2023 | $ | 1,237 | $ | 1,218 | 0.3 | % | $ | 1,237 | |||||||||||||||
| CRA MSO, LLC(1) (3) (4) (20) |
Senior Secured First Lien Delayed Draw Term Loan |
12/2023 | — | (6 | ) | — | — | |||||||||||||||||||||
| CRA MSO, LLC(1) (3) (4) (20) |
Senior Secured First Lien Revolver |
12/2023 | — | (3 | ) | — | — | |||||||||||||||||||||
| ExamWorks Group, Inc.(1) |
Senior Secured Second Lien Term Loan |
L + 725 (100 Floor) (2) |
9.05 | % | 07/2024 | 5,735 | 5,621 | 1.4 | 5,745 | |||||||||||||||||||
| GrapeTree Medical Staffing, LLC(1) |
Senior Secured First Lien Term Loan |
L + 525 (100 Floor) (2) |
7.05 | % | 10/2022 | 1,662 | 1,644 | 0.4 | 1,662 | |||||||||||||||||||
| GrapeTree Medical Staffing, LLC(1) (3) (4) (20) |
Senior Secured First Lien Revolver |
10/2022 | — | (4 | ) | — | — | |||||||||||||||||||||
| GrapeTree Medical Staffing, LLC(1) |
Senior Secured First Lien Term Loan |
L + 525 (100 Floor) (2) |
7.05 | % | 10/2022 | 1,396 | 1,373 | 0.3 | 1,396 | |||||||||||||||||||
| MDVIP, Inc. |
Senior Secured First Lien Term Loan |
L + 425 (100 Floor) (2) |
6.05 | % | 11/2024 | 9,659 | 9,659 | 2.4 | 9,611 | |||||||||||||||||||
| NMN Holdings III Corp.(1) |
Senior Secured Second Lien Term Loan Term Loan |
L + 775(2) |
9.49 | % | 11/2026 | 7,222 | 7,027 | 1.8 | 7,182 | |||||||||||||||||||
| NMN Holdings III Corp.(1) (3) (4) (24) |
Senior Secured Second Lien Delayed Draw Term Loan |
11/2026 | — | (21 | ) | — | (9 | ) | ||||||||||||||||||||
| NMSC Holdings, Inc.(1) |
Senior Secured Second Lien Term Loan |
L + 1000(2) |
11.80 | % | 10/2023 | 4,307 | 4,202 | 1.1 | 4,286 | |||||||||||||||||||
| Omni Ophthalmic Management Consultants, LLC(1) (3) (4) (20) |
Senior Secured First Lien Revolver |
05/2023 | — | (10 | ) | — | (3 | ) | ||||||||||||||||||||
| Omni Ophthalmic Management Consultants, LLC(1) (3) (4) (21) |
Senior Secured First Lien Delayed Draw Term Loan |
05/2023 | — | (9 | ) | — | (4 | ) | ||||||||||||||||||||
| Omni Ophthalmic Management Consultants, LLC(1) |
Senior Secured First Lien Term Loan |
L + 525 (100 Floor) (2) |
7.05 | % | 05/2023 | 6,947 | 6,868 | 1.7 | 6,924 | |||||||||||||||||||
| Professional Physical Therapy(1) |
Senior Secured First Lien Term Loan |
L + 675 (100 Floor) (including 75 PIK)(5) |
8.44 | % | 12/2022 | 8,906 | 8,574 | 1.8 | 7,488 | |||||||||||||||||||
| PT Network, LLC(1) (3) (4) (20) |
Senior Secured First Lien Revolver |
11/2023 | — | (1 | ) | — | (8 | ) | ||||||||||||||||||||
| PT Network, LLC(1) |
Senior Secured First Lien Term Loan |
L + 750 (100 Floor) (including 200 PIK)(10) |
9.44 | % | 11/2023 | 4,727 | 4,718 | 1.1 | 4,627 | |||||||||||||||||||
| Safco Dental Supply, LLC(1) |
Unitranche First Lien Term Loan |
L + 550 (100 Floor) (5) |
7.25 | % | 06/2025 | 4,549 | 4,475 | 1.1 | 4,549 | |||||||||||||||||||
| Safco Dental Supply, LLC(1) (3) (4) (20) |
Unitranche First Lien Revolver |
06/2025 | — | (10 | ) | — | — | |||||||||||||||||||||
| Smile Brands, Inc.(1) (3) (20) |
Senior Secured First Lien Revolver |
P + 350(7) |
8.25 | % | 10/2023 | 40 | 38 | — | 38 | |||||||||||||||||||
| Smile Brands, Inc.(1) (3) (21) |
Senior Secured First Lien Delayed Draw Term Loan |
L + 450(5) |
6.43 | % | 10/2024 | 378 | 372 | 0.1 | 374 | |||||||||||||||||||
| Smile Brands, Inc.(1) |
Senior Secured First Lien Term Loan |
L + 450(10) |
6.70 | % | 10/2024 | 2,079 | 2,062 | 0.5 | 2,069 | |||||||||||||||||||
| Smile Doctors LLC(1) (3) (20) |
Senior Secured First Lien Revolver |
L + 600 (100 Floor) (5) |
7.94 | % | 10/2022 | 139 | 138 | — | 139 | |||||||||||||||||||
| Smile Doctors LLC(1) |
Senior Secured First Lien Term Loan |
L + 600 (100 Floor) (5) |
7.94 | % | 10/2022 | 3,173 | 3,146 | 0.8 | 3,173 | |||||||||||||||||||
| Smile Doctors LLC(1) (3) (21) |
Senior Secured First Lien Delayed Draw Term Loan |
L + 600 (100 Floor) (5) |
7.94 | % | 10/2022 | 1,685 | 1,683 | 0.4 | 1,685 | |||||||||||||||||||
| Unifeye Vision Partners(1) |
Senior Secured First Lien Term Loan |
L + 500 (100 Floor) (5) |
6.89 | % | 09/2025 | 5,400 | 5,296 | 1.3 | 5,400 | |||||||||||||||||||
See accompanying notes
93
CRESCENT CAPITAL BDC, INC.
Consolidated Schedule of Investments
December 31, 2019
(in thousands, except share and per share data)
| Company/Security/Country†‡ |
Investment Type |
Interest |
Interest Rate |
Maturity / Dissolution Date |
Principal Amount, Par Value or Shares |
Cost | Percentage of Net Assets ** |
Fair Value |
||||||||||||||||||||
| Unifeye Vision Partners(1) (3) (20) |
Senior Secured First Lien Revolver |
L + 500 (100 Floor) (5) |
6.89 | % | 09/2025 | $ | 227 | $ | 194 | 0.1 | % | $ | 227 | |||||||||||||||
| Unifeye Vision Partners(1) (3) (4) |
Senior Secured First Lien Delayed Draw Term Loan |
09/2025 | — | (29 | ) | — | — | |||||||||||||||||||||
| Zest Acquisition Corp. |
Senior Secured First Lien Term Loan |
L + 350(2) |
5.25 | % | 03/2025 | 8,830 | 8,831 | 2.1 | 8,432 | |||||||||||||||||||
|
|
|
|
|
|
|
|
|
|||||||||||||||||||||
| 145,092 | 142,717 | 35.1 | 142,702 | |||||||||||||||||||||||||
|
|
|
|
|
|
|
|
|
|||||||||||||||||||||
| Household & Personal Products |
||||||||||||||||||||||||||||
| Tranzonic(1) |
Senior Secured First Lien Term Loan |
L + 475 (100 Floor) (2) |
6.55 | % | 03/2023 | 3,854 | 3,826 | 0.9 | 3,854 | |||||||||||||||||||
| Tranzonic(1) (3) (4) (20) |
Senior Secured First Lien Revolver |
03/2023 | — | (3 | ) | — | — | |||||||||||||||||||||
|
|
|
|
|
|
|
|
|
|||||||||||||||||||||
| 3,854 | 3,823 | 0.9 | 3,854 | |||||||||||||||||||||||||
|
|
|
|
|
|
|
|
|
|||||||||||||||||||||
| Insurance |
||||||||||||||||||||||||||||
| Comet Acquisition, Inc.(1) |
Senior Secured Second Lien Term Loan |
L + 750(5) |
9.41 | % | 10/2026 | 4,632 | 4,622 | 1.1 | 4,411 | |||||||||||||||||||
| Integrity Marketing Acquisition, LLC(1) (3) (21) |
Unitranche First Lien Delayed Draw Term Loan |
L + 575 (100 Floor) (5) |
7.81 | % | 02/2020 | 3,543 | 3,433 | 0.8 | 3,517 | |||||||||||||||||||
| Integrity Marketing Acquisition, LLC(1) (3) (4) (21) |
Unitranche First Lien Delayed Draw Term Loan |
07/2021 | — | (37 | ) | — | (15 | ) | ||||||||||||||||||||
| Integrity Marketing Acquisition, LLC(1) |
Unitranche First Lien Term Loan |
L + 575 (100 Floor) (5) |
7.67 | % | 08/2025 | 13,009 | 12,699 | 3.2 | 12,944 | |||||||||||||||||||
| Integrity Marketing Acquisition, LLC(1) (3) (4) (20) |
Unitranche First Lien Revolver |
08/2025 | — | (48 | ) | — | (7 | ) | ||||||||||||||||||||
| Integro Parent, Inc.(1) (9) |
Senior Secured First Lien Term Loan |
L + 575 (100 Floor) (2) |
7.55 | % | 10/2022 | 477 | 473 | 0.1 | 470 | |||||||||||||||||||
| Integro Parent, Inc.(1) (9) |
Senior Secured Second Lien Term Loan |
L + 925 (100 Floor) (2) |
11.05 | % | 10/2023 | 2,916 | 2,882 | 0.7 | 2,916 | |||||||||||||||||||
| Integro Parent, Inc.(1) (9) |
Senior Secured Second Lien Delayed Draw Term Loan |
L + 925 (100 Floor) (2) |
10.99 | % | 10/2023 | 380 | 377 | 0.1 | 380 | |||||||||||||||||||
| The Hilb Group, LLC(1) (3) (4) |
Unitranche First Lien Revolver |
12/2025 | — | (8 | ) | — | (2 | ) | ||||||||||||||||||||
| The Hilb Group, LLC(1) (20) |
Unitranche First Lien Term Loan |
L + 575 (100 Floor) (2) |
7.69 | % | 12/2026 | 3,640 | 3,549 | 0.9 | 3,612 | |||||||||||||||||||
| The Hilb Group, LLC(1) (3) (4) (21) |
Unitranche First Lien Term Loan |
12/2026 | — | (13 | ) | — | (8 | ) | ||||||||||||||||||||
| 28,597 | 27,929 | 6.9 | 28,218 | |||||||||||||||||||||||||
| Materials |
||||||||||||||||||||||||||||
| Kestrel Parent, LLC(1) (3) (4) (20) |
Unitranche First Lien Revolver |
11/2023 | — | (17 | ) | — | 13 | |||||||||||||||||||||
| Kestrel Parent, LLC(1) |
Unitranche First Lien Term Loan |
L + 600 (100 Floor) (2) |
7.78 | % | 11/2025 | 6,740 | 6,593 | 1.7 | 6,841 | |||||||||||||||||||
| Maroon Group, LLC (1) |
Unitranche First Lien Term Loan |
L + 675 (100 Floor) (5) |
8.72 | % | 08/2022 | 2,712 | 2,693 | 0.7 | 2,712 | |||||||||||||||||||
| Maroon Group, LLC (1) (3) (20) |
Unitranche First Lien Revolver |
L + 675 (100 Floor) (2) |
8.56 | % | 08/2022 | 98 | 96 | — | 98 | |||||||||||||||||||
| Maroon Group, LLC (1) (21) |
Unitranche First Lien Delayed Draw Term Loan |
L + 675 (100 Floor) (5) |
8.72 | % | 08/2022 | 1,250 | 1,242 | 0.3 | 1,250 | |||||||||||||||||||
|
|
|
|
|
|
|
|
|
|||||||||||||||||||||
| 10,800 | 10,607 | 2.7 | 10,914 | |||||||||||||||||||||||||
|
|
|
|
|
|
|
|
|
|||||||||||||||||||||
| Pharmaceuticals, Biotechnology & Life Sciences |
||||||||||||||||||||||||||||
| Trinity Partners, LLC(1) |
Senior Secured First Lien Term Loan |
L + 500 (100 Floor) (2) |
6.80 | % | 02/2023 | 3,744 | 3,706 | 0.9 | 3,744 | |||||||||||||||||||
| Trinity Partners, LLC(1) (3) (4) (20) |
Senior Secured First Lien Revolver |
02/2023 | — | (6 | ) | — | — | |||||||||||||||||||||
|
|
|
|
|
|
|
|
|
|||||||||||||||||||||
| 3,744 | 3,700 | 0.9 | 3,744 | |||||||||||||||||||||||||
|
|
|
|
|
|
|
|
|
|||||||||||||||||||||
| Retailing |
||||||||||||||||||||||||||||
| Slickdeals Holdings, LLC(1) (3) (4) (19) (25) |
Unitranche First Lien Revolver |
06/2023 | — | (14 | ) | — | — | |||||||||||||||||||||
See accompanying notes
94
CRESCENT CAPITAL BDC, INC.
Consolidated Schedule of Investments
December 31, 2019
(in thousands, except share and per share data)
| Company/Security/Country†‡ |
Investment Type |
Interest |
Interest Rate |
Maturity / Dissolution Date |
Principal Amount, Par Value or Shares |
Cost | Percentage of Net Assets ** |
Fair Value |
||||||||||||||||||||
| Slickdeals Holdings, LLC(1) (19) |
Unitranche First Lien Term Loan |
L + 625 (100 Floor) (2) |
7.99 | % | 06/2024 | $ | 14,726 | $ | 14,342 | 3.6 | % | $ | 14,726 | |||||||||||||||
| Strategic Partners, Inc.(1) |
Senior Secured First Lien Term Loan |
L + 375 (100 Floor) (2) |
5.55 | % | 06/2023 | 6,322 | 6,313 | 1.6 | 6,338 | |||||||||||||||||||
|
|
|
|
|
|
|
|
|
|||||||||||||||||||||
| 21,048 | 20,641 | 5.2 | 21,064 | |||||||||||||||||||||||||
|
|
|
|
|
|
|
|
|
|||||||||||||||||||||
| Software & Services |
||||||||||||||||||||||||||||
| Affinitiv, Inc.(1) |
Unitranche First Lien Term Loan |
L + 525 (100 Floor) (5) |
7.17 | % | 08/2024 | 6,500 | 6,393 | 1.6 | 6,500 | |||||||||||||||||||
| Affinitiv, Inc.(1) (3) (4) (20) |
Unitranche First Lien Revolver |
08/2024 | — | (14 | ) | — | — | |||||||||||||||||||||
| Ansira Partners, Inc.(1) |
Unitranche First Lien Term Loan |
L + 575 (100 Floor) (2) |
7.55 | % | 12/2022 | 6,867 | 6,829 | 1.6 | 6,477 | |||||||||||||||||||
| Ansira Partners, Inc.(1) (3) (21) |
Unitranche First Lien Delayed Draw Term Loan |
L + 575 (100 Floor) (2) |
7.49 | % | 12/2022 | 626 | 622 | 0.1 | 572 | |||||||||||||||||||
| Avaap USA LLC(1) |
Senior Secured First Lien Term Loan |
L + 525 (100 Floor) (2) |
7.05 | % | 03/2023 | 3,808 | 3,748 | 1.0 | 3,846 | |||||||||||||||||||
| Avaap USA LLC(1) (20) |
Senior Secured First Lien Delayed Draw Term Loan |
L + 525 (100 Floor) (2) |
7.02 | % | 03/2023 | 347 | 342 | 0.1 | 351 | |||||||||||||||||||
| Avaap USA LLC(1) (3) (4) (20) |
Senior Secured First Lien Revolver |
03/2023 | — | (10 | ) | — | 7 | |||||||||||||||||||||
| Benesys, Inc.(1) |
Senior Secured First Lien Term Loan |
L + 425 (100 Floor) (2) |
6.05 | % | 10/2024 | 1,432 | 1,414 | 0.4 | 1,411 | |||||||||||||||||||
| Benesys, Inc.(1) (3) (20) |
Senior Secured First Lien Revolver |
L + 425 (100 Floor) (2) |
6.05 | % | 10/2024 | 48 | 46 | — | 46 | |||||||||||||||||||
| C-4 Analytics, LLC(1) |
Senior Secured First Lien Term Loan |
L + 475 (100 Floor) (2) |
6.55 | % | 08/2023 | 10,313 | 10,195 | 2.5 | 10,313 | |||||||||||||||||||
| C-4 Analytics, LLC(1) (3) (4) (20) |
Senior Secured First Lien Revolver |
08/2023 | — | (6 | ) | — | — | |||||||||||||||||||||
| CAT Buyer, LLC(1) |
Unitranche First Lien Term Loan |
L + 550 (100 Floor) (2) |
7.30 | % | 04/2024 | 6,302 | 6,194 | 1.5 | 6,272 | |||||||||||||||||||
| CAT Buyer, LLC(1) (3) (20) |
Unitranche First Lien Revolver |
L + 550(2) |
7.30 | % | 04/2024 | 151 | 140 | — | 149 | |||||||||||||||||||
| Claritas, LLC(1) |
Senior Secured First Lien Term Loan |
L + 600 (100 Floor) (5) |
7.94 | % | 12/2023 | 1,121 | 1,112 | 0.3 | 1,121 | |||||||||||||||||||
| Claritas, LLC(1) (3) (2) |
Senior Secured First Lien Revolver |
L + 600 (100 Floor) (2) |
7.80 | % | 12/2023 | 120 | 118 | — | 120 | |||||||||||||||||||
| List Partners, Inc.(1) |
Senior Secured First Lien Term Loan |
L + 500 (100 Floor)(2) |
6.77 | % | 01/2023 | 4,623 | 4,563 | 1.1 | 4,649 | |||||||||||||||||||
| List Partners, Inc.(1) (3) (4) (20) |
Senior Secured First Lien Revolver |
01/2023 | — | (5 | ) | — | 3 | |||||||||||||||||||||
| Ontario Systems, LLC(1) |
Unitranche First Lien Term Loan |
L + 550 (100 Floor) (2) |
7.30 | % | 08/2025 | 3,242 | 3,211 | 0.8 | 3,242 | |||||||||||||||||||
| Ontario Systems, LLC(1) (3) (4) (20) |
Unitranche First Lien Revolver |
08/2025 | — | (5 | ) | — | — | |||||||||||||||||||||
| Ontario Systems, LLC(1) (3) (4) (21) |
Unitranche First Lien Delayed Draw Term Loan |
08/2025 | — | (5 | ) | — | — | |||||||||||||||||||||
| Perforce Software, Inc. |
Senior Secured First Lien Term Loan |
L + 450(2) |
6.30 | % | 07/2026 | 12,469 | 12,410 | 3.1 | 12,492 | |||||||||||||||||||
| Right Networks, LLC(1) |
Unitranche First Lien Term Loan |
L + 600 (100 Floor) (2) |
7.70 | % | 11/2024 | 9,743 | 9,530 | 2.4 | 9,743 | |||||||||||||||||||
| Right Networks, LLC(1) (3) (4) (2) |
Unitranche First Lien Revolver |
11/2024 | — | (5 | ) | — | — | |||||||||||||||||||||
| Ruffalo Noel Levitz, LLC(1) |
Unitranche First Lien Term Loan |
L + 600 (100 Floor) (5) |
7.94 | % | 05/2022 | 2,531 | 2,503 | 0.6 | 2,518 | |||||||||||||||||||
| Ruffalo Noel Levitz, LLC(1) (3) (4) (20) |
Unitranche First Lien Revolver |
05/2022 | — | (3 | ) | — | (2 | ) | ||||||||||||||||||||
| SMS Systems Maintenance Services, Inc.(1) (12) |
Senior Secured Second Lien Term Loan |
10/2024 | 6,156 | 5,619 | 0.6 | 2,471 | ||||||||||||||||||||||
| SMS Systems Maintenance Services, Inc.(1) (12) |
Senior Secured Second Lien Term Loan |
10/2024 | 4,704 | 4,287 | 0.5 | 1,888 | ||||||||||||||||||||||
| SMS Systems Maintenance Services, Inc.(1) (12) |
Senior Secured Second Lien Term Loan |
10/2024 | 2,859 | 2,670 | 0.5 | 2,193 | ||||||||||||||||||||||
See accompanying notes
95
CRESCENT CAPITAL BDC, INC.
Consolidated Schedule of Investments
December 31, 2019
(in thousands, except share and per share data)
| Company/Security/Country†‡ |
Investment Type |
Interest |
Interest Rate |
Maturity / Dissolution Date |
Principal Amount, Par Value or Shares |
Cost | Percentage of Net Assets ** |
Fair Value |
||||||||||||||||||||
| Transportation Insight, LLC(1) (3) (4) (20) |
Senior Secured First Lien Revolver |
12/2024 | $ | — | $ | (6 | ) | — | % | $ | (4 | ) | ||||||||||||||||
| Transportation Insight, LLC(1) |
Senior Secured First Lien Term Loan |
L + 450(2) |
6.30 | % | 12/2024 | 5,194 | 5,151 | 1.3 | 5,168 | |||||||||||||||||||
| Transportation Insight, LLC(1) (3) (21) |
Senior Secured First Lien Delayed Draw Term Loan |
L + 450(5) |
6.20 | % | 12/2024 | 713 | 702 | 0.2 | 706 | |||||||||||||||||||
| Trident Technologies, LLC(1) |
Senior Secured First Lien Term Loan |
L + 600 (150 Floor) (2) |
7.62 | % | 12/2025 | 15,000 | 14,775 | 3.6 | 14,775 | |||||||||||||||||||
|
Winxnet Holdings LLC(1) (3) |
Unitranche First Lien Delayed Draw Term Loan |
L + 600 (100 Floor) (2) |
7.76 | % | 06/2023 | 647 | 632 | 0.2 | 634 | |||||||||||||||||||
| Winxnet Holdings LLC(1) |
Unitranche First Lien Term Loan |
L + 600 (100 Floor) (2) |
7.76 | % | 06/2023 | 1,970 | 1,941 | 0.5 | 1,945 | |||||||||||||||||||
| Winxnet Holdings LLC(1) (3) (20) |
Unitranche First Lien Revolver |
L + 600 (100 Floor) (2) |
7.76 | % | 06/2023 | 80 | 74 | — | 75 | |||||||||||||||||||
|
|
|
|
|
|
|
|
|
|||||||||||||||||||||
| 107,566 | 105,162 | 24.5 | 99,681 | |||||||||||||||||||||||||
|
|
|
|
|
|
|
|
|
|||||||||||||||||||||
| Technology Hardware & Equipment |
||||||||||||||||||||||||||||
| Onvoy, LLC(1) |
Senior Secured Second Lien Term Loan |
L + 1050 (100 Floor) (2) |
12.30 | % | 02/2025 | 2,635 | 2,541 | 0.6 | 2,339 | |||||||||||||||||||
|
|
|
|
|
|
|
|
|
|||||||||||||||||||||
| Transportation |
||||||||||||||||||||||||||||
| Pilot Air Freight, LLC(1) |
Senior Secured First Lien Term Loan |
L + 525 (100 Floor) (2) |
7.05 | % | 07/2024 | 5,417 | 5,393 | 1.3 | 5,417 | |||||||||||||||||||
| Pilot Air Freight, LLC(1) |
Senior Secured First Lien Delayed Draw Term Loan |
L + 525 (100 Floor) (2) |
7.05 | % | 07/2024 | 1,209 | 1,209 | 0.3 | 1,209 | |||||||||||||||||||
| Pilot Air Freight, LLC(1) (3) (4) (26) |
Senior Secured First Lien Delayed Draw Term Loan |
07/2024 | — | (5 | ) | — | — | |||||||||||||||||||||
| Pilot Air Freight, LLC(1) (3) (4) (21) |
Senior Secured First Lien Revolver |
07/2024 | — | (1 | ) | — | — | |||||||||||||||||||||
|
|
|
|
|
|
|
|
|
|||||||||||||||||||||
| 6,626 | 6,596 | 1.6 | 6,626 | |||||||||||||||||||||||||
|
|
|
|
|
|
|
|
|
|||||||||||||||||||||
| Total Debt Investments United States |
$ | 624,691 | $ | 614,426 | 149.2 | % | $ | 607,109 | ||||||||||||||||||||
|
|
|
|
|
|
|
|
|
|||||||||||||||||||||
| Equity Investments |
||||||||||||||||||||||||||||
| Automobiles & Components |
||||||||||||||||||||||||||||
| APC Auto Tech Holdings, LLC(1) (13) (19) |
Common Stock |
2,427 | 1,090 | — | 162 | |||||||||||||||||||||||
| APC Auto Technology Intermediate, LLC(1) (13) (19) |
Preferred Stock |
757 | 757 | 0.2 | 767 | |||||||||||||||||||||||
|
|
|
|
|
|
|
|
|
|||||||||||||||||||||
| 3,184 | 1,847 | 0.2 | 929 | |||||||||||||||||||||||||
|
|
|
|
|
|
|
|
|
|||||||||||||||||||||
| Capital Goods |
||||||||||||||||||||||||||||
| Alion Science and Technology Corporation(1) (13) |
Common Stock |
745,504 | 766 | 0.3 | 1,207 | |||||||||||||||||||||||
|
|
|
|
|
|
|
|
|
|||||||||||||||||||||
| Commercial & Professional Services |
||||||||||||||||||||||||||||
| Allied Universal holdings, LLC(1) (13) |
Common Stock, Class A |
2,240,375 | 1,011 | 0.5 | 2,199 | |||||||||||||||||||||||
| MHS Acquisition Holdings, LLC(1) (13) |
Common Stock |
912 | 913 | 0.2 | 586 | |||||||||||||||||||||||
| MHS Acquisition Holdings, LLC(1) (13) |
Preferred Stock |
20 | 20 | — | — | |||||||||||||||||||||||
| PB Parent, LP(1) (13) |
Common Stock |
1,125,000 | 1,125 | 0.3 | 1,125 | |||||||||||||||||||||||
| RSI Acquisition, LLC(1) (13) |
Preferred Stock, Class A |
137,000 | 137 | — | 137 | |||||||||||||||||||||||
| TecoStar Holdings, Inc.(1) (13) |
Common Stock |
500,000 | $ | 500 | 0.2 | % | $ | 973 | ||||||||||||||||||||
|
|
|
|
|
|
|
|
|
|||||||||||||||||||||
| 4,003,307 | 3,706 | 1.2 | 5,020 | |||||||||||||||||||||||||
| Consumer Services |
||||||||||||||||||||||||||||
| Green Wrench Acquisition, LLC(1) (13) |
Common Stock |
3,906 | 391 | 0.1 | 391 | |||||||||||||||||||||||
| HGH Investment, LP(1) (13) |
Common Stock, Class A |
4,171 | 417 | 0.1 | 416 | |||||||||||||||||||||||
| Legalshield(1) (13) |
Common Stock |
372 | 372 | 0.2 | 719 | |||||||||||||||||||||||
See accompanying notes
96
CRESCENT CAPITAL BDC, INC.
Consolidated Schedule of Investments
December 31, 2019
(in thousands, except share and per share data)
| Company/Security/Country†‡ |
Investment Type |
Interest |
Interest Rate |
Maturity / Dissolution Date |
Principal Amount, Par Value or Shares |
Cost | Percentage of Net Assets ** |
Fair Value |
||||||||||||||||||||
| Wrench Group Holdings, LLC(1) (13) |
Common Stock, Class A |
1,094 | $ | 109 | — | % | $ | 109 | ||||||||||||||||||||
|
|
|
|
|
|
|
|
|
|||||||||||||||||||||
| 9,543 | 1,289 | 0.4 | 1,635 | |||||||||||||||||||||||||
|
|
|
|
|
|
|
|
|
|||||||||||||||||||||
| Diversified Financials |
||||||||||||||||||||||||||||
| CBDC Senior Loan Fund LLC(9) (14) (15) |
Partnership Interest |
34,000,000 | 34,000 | 8.5 | 34,442 | |||||||||||||||||||||||
| GACP II LP(9) (15) |
Partnership Interest |
18,067,282 | 18,067 | 4.5 | 18,564 | |||||||||||||||||||||||
|
|
|
|
|
|
|
|
|
|||||||||||||||||||||
| 52,067,282 | 52,067 | 13.0 | 53,006 | |||||||||||||||||||||||||
|
|
|
|
|
|
|
|
|
|||||||||||||||||||||
| Health Care Equipment & Services |
||||||||||||||||||||||||||||
| ExamWorks Group, Inc.(1) (13) |
Common Stock |
7,500 | 750 | 0.3 | 1,344 | |||||||||||||||||||||||
| MDVIP, Inc.(1) (13) |
Common Stock |
46,807 | 667 | 0.2 | 922 | |||||||||||||||||||||||
| NMN Holdings LP(1) (13) |
Common Stock |
11,111 | 1,111 | 0.3 | 1,009 | |||||||||||||||||||||||
| PT Network, LLC(1) (13) |
Common Stock, Class C |
1 | — | — | — | |||||||||||||||||||||||
| Spartan Healthcare Holdings, LLC(1) (13) |
Common Stock |
11,843 | 1,184 | 0.3 | 1,185 | |||||||||||||||||||||||
|
|
|
|
|
|
|
|
|
|||||||||||||||||||||
| 77,262 | 3,712 | 1.1 | 4,460 | |||||||||||||||||||||||||
|
|
|
|
|
|
|
|
|
|||||||||||||||||||||
| Insurance |
||||||||||||||||||||||||||||
| Integrity Marketing Acquisition, LLC(1) (13) |
Common Stock |
619,562 | 648 | 0.2 | 648 | |||||||||||||||||||||||
| Integrity Marketing Acquisition, LLC(1) (13) |
Preferred Stock |
1,247 | 1,213 | 0.3 | 1,247 | |||||||||||||||||||||||
| Integro Parent, Inc.(1) (9) (13) |
Common Stock |
4,468 | 454 | 0.2 | 878 | |||||||||||||||||||||||
|
|
|
|
|
|
|
|
|
|||||||||||||||||||||
| 625,277 | 2,315 | 0.7 | 2,773 | |||||||||||||||||||||||||
|
|
|
|
|
|
|
|
|
|||||||||||||||||||||
| Materials |
||||||||||||||||||||||||||||
| Kestrel Upperco, LLC(1) (13) |
Common Stock, Class A |
41,791 | 209 | 0.1 | 223 | |||||||||||||||||||||||
|
|
|
|
|
|
|
|
|
|||||||||||||||||||||
| Retailing |
||||||||||||||||||||||||||||
| Slickdeals Holdings, LLC(1) (13) (19) |
Common Stock |
109 | 1,091 | 0.3 | 1,207 | |||||||||||||||||||||||
| Vivid Seats Ltd.(1) (13) (19) |
Common Stock |
608,108 | 608 | 0.3 | 1,083 | |||||||||||||||||||||||
| Vivid Seats Ltd.(1) (13) (19) |
Preferred Stock |
1,891,892 | 1,892 | 0.6 | 2,563 | |||||||||||||||||||||||
|
|
|
|
|
|
|
|
|
|||||||||||||||||||||
| 2,500,109 | 3,591 | 1.2 | 4,853 | |||||||||||||||||||||||||
|
|
|
|
|
|
|
|
|
|||||||||||||||||||||
| Software & Services |
||||||||||||||||||||||||||||
| SMS Systems Maintenance Services, Inc.(1) (13) |
Common Stock |
1,142,789 | 1,144 | — | — | |||||||||||||||||||||||
|
|
|
|
|
|
|
|
|
|||||||||||||||||||||
| Technology Hardware & Equipment |
||||||||||||||||||||||||||||
| Onvoy, LLC(1) (13) |
Common Stock, Class A |
3,649 | 365 | 0.1 | 228 | |||||||||||||||||||||||
| Onvoy, LLC(1) (13) |
Common Stock, Class B |
2,536 | — | — | — | |||||||||||||||||||||||
|
|
|
|
|
|
|
|
|
|||||||||||||||||||||
| 6,185 | 365 | 0.1 | 228 | |||||||||||||||||||||||||
|
|
|
|
|
|
|
|
|
|||||||||||||||||||||
| Total Equity Investments United States |
61,222,233 | $ | 71,011 | 18.3 | % | $ | 74,334 | |||||||||||||||||||||
|
|
|
|
|
|
|
|
|
|||||||||||||||||||||
| Total United States |
$ | 685,437 | 167.5 | % | $ | 681,443 | ||||||||||||||||||||||
|
|
|
|
|
|
|
|||||||||||||||||||||||
| Canada |
||||||||||||||||||||||||||||
| Debt Investments |
||||||||||||||||||||||||||||
| Software & Services |
||||||||||||||||||||||||||||
| Corel Corporation(9) |
Senior Secured First Lien Term Loan |
L + 500(12) |
6.91 | % | 07/2026 | $ | 12,500 | 11,905 | 3.0 | 12,109 | ||||||||||||||||||
|
|
|
|
|
|
|
|
|
|||||||||||||||||||||
| Total Debt Investments Canada |
$ | 12,500 | $ | 11,905 | 3.0 | % | $ | 12,109 | ||||||||||||||||||||
|
|
|
|
|
|
|
|
|
|||||||||||||||||||||
| Total Canada |
$ | 11,905 | 3.0 | % | $ | 12,109 | ||||||||||||||||||||||
|
|
|
|
|
|
|
|||||||||||||||||||||||
See accompanying notes
97
CRESCENT CAPITAL BDC, INC.
Consolidated Schedule of Investments
December 31, 2019
(in thousands, except share and per share data)
| Company/Security/Country†‡ |
Investment Type |
Interest |
Interest Rate |
Maturity / Dissolution Date |
Principal Amount, Par Value or Shares |
Cost | Percentage of Net Assets ** |
Fair Value |
||||||||||||||||||||
| France |
||||||||||||||||||||||||||||
| Debt Investments |
||||||||||||||||||||||||||||
| Technology Hardware & Equipment |
||||||||||||||||||||||||||||
| Parkeon, Inc.(9) |
Senior Secured First Lien Term Loan | E + 525(17) | 5.25 | % | 04/2023 | € | 1,995 | $ | 2,136 | 0.5 | % | $ | 2,248 | |||||||||||||||
|
|
|
|
|
|
|
|
|
|||||||||||||||||||||
| 1,995 | 2,136 | 0.5 | 2,248 | |||||||||||||||||||||||||
|
|
|
|
|
|
|
|
|
|||||||||||||||||||||
| Total Debt Investments France |
€ | 1,995 | $ | 2,136 | 0.5 | % | $ | 2,248 | ||||||||||||||||||||
|
|
|
|
|
|
|
|
|
|||||||||||||||||||||
| Total France |
$ | 2,136 | 0.5 | % | $ | 2,248 | ||||||||||||||||||||||
|
|
|
|
|
|
|
|||||||||||||||||||||||
| United Kingdom |
||||||||||||||||||||||||||||
| Debt Investments |
||||||||||||||||||||||||||||
| Commercial & Professional Services |
||||||||||||||||||||||||||||
| Crusoe Bidco Limited(1) (3) (9) |
Unitranche First Lien Delayed Draw Term Loan | 12/2025 | £ | — | — | — | — | |||||||||||||||||||||
| Crusoe Bidco Limited(1) (3) (9) |
Unitranche First Lien Delayed Draw Term Loan | 12/2025 | — | — | — | — | ||||||||||||||||||||||
| Crusoe Bidco Limited(1) (9) |
Unitranche First Lien Term Loan | L + 625(18) | 7.04 | % | 12/2025 | 6,067 | 7,402 | 2.0 | 8,038 | |||||||||||||||||||
|
|
|
|
|
|
|
|
|
|||||||||||||||||||||
| 6,067 | 7,402 | 2.0 | 8,038 | |||||||||||||||||||||||||
|
|
|
|
|
|
|
|
|
|||||||||||||||||||||
| Total Debt Investments United Kingdom |
£ | 6,067 | $ | 7,402 | 2.0 | % | $ | 8,038 | ||||||||||||||||||||
|
|
|
|
|
|
|
|
|
|||||||||||||||||||||
| Total United Kingdom |
$ | 7,402 | 2.0 | % | $ | 8,038 | ||||||||||||||||||||||
|
|
|
|
|
|
|
|||||||||||||||||||||||
| Netherlands |
||||||||||||||||||||||||||||
| Debt Investments |
||||||||||||||||||||||||||||
| Pharmaceuticals, Biotechnology & Life Sciences |
||||||||||||||||||||||||||||
| PharComp Parent B.V.(1) (9) (11) |
Unitranche First Lien - Last Out Term Loan | E + 650(17) | 6.50 | % | 02/2026 | € | 6,910 | 7,625 | 1.9 | 7,756 | ||||||||||||||||||
| PharComp Parent B.V.(1) (3) (9) |
Unitranche First Lien Term Loan | 02/2026 | — | — | — | — | ||||||||||||||||||||||
|
|
|
|
|
|
|
|
|
|||||||||||||||||||||
| 6,910 | 7,625 | 1.9 | 7,756 | |||||||||||||||||||||||||
|
|
|
|
|
|
|
|
|
|||||||||||||||||||||
| Total Debt Investments Netherlands |
€ | 6,910 | $ | 7,625 | 1.9 | % | $ | 7,756 | ||||||||||||||||||||
|
|
|
|
|
|
|
|
|
|||||||||||||||||||||
| Total Netherlands |
$ | 7,625 | 1.9 | % | $ | 7,756 | ||||||||||||||||||||||
|
|
|
|
|
|
|
|||||||||||||||||||||||
| Belgium |
||||||||||||||||||||||||||||
| Debt Investments |
||||||||||||||||||||||||||||
| Commercial & Professional Services |
||||||||||||||||||||||||||||
| MIR Bidco SA(1) (9) |
Unitranche First Lien Term Loan | E + 600(17) | 6.00 | % | 04/2026 | € | $9,507 | $ | 10,451 | 2.6 | % | $ | 10,672 | |||||||||||||||
| Miraclon Corporation(1) (9) |
Unitranche First Lien Term Loan | L + 600(10) | 7.96 | % | 04/2026 | $ | 4,161 | 4,046 | 1.0 | 4,161 | ||||||||||||||||||
|
|
|
|
|
|
|
|
|
|||||||||||||||||||||
| Total Debt Investments Belgium |
13,668 | $ | 14,497 | 3.6 | % | $ | 14,833 | |||||||||||||||||||||
|
|
|
|
|
|
|
|
|
|||||||||||||||||||||
| Equity Investments |
||||||||||||||||||||||||||||
| Commercial & Professional Services |
||||||||||||||||||||||||||||
| MIR Bidco SA(1) (9) (13) |
Common Stock | 921 | 1 | — | 1 | |||||||||||||||||||||||
| MIR Bidco SA(1) (9) (13) |
Preferred Stock | 81,384 | 92 | — | 103 | |||||||||||||||||||||||
|
|
|
|
|
|
|
|
|
|||||||||||||||||||||
| 82,305 | 93 | — | 104 | |||||||||||||||||||||||||
|
|
|
|
|
|
|
|
|
|||||||||||||||||||||
| Total Equity Investments Belgium |
82,305 | $ | 93 | — | % | $ | 104 | |||||||||||||||||||||
|
|
|
|
|
|
|
|
|
|||||||||||||||||||||
| Total Belgium |
$ | 14,590 | 3.6 | % | $ | 14,937 | ||||||||||||||||||||||
|
|
|
|
|
|
|
|||||||||||||||||||||||
| Total Investments |
$ | 729,095 | 178.5 | % | $ | 726,531 | ||||||||||||||||||||||
|
|
|
|
|
|
|
|||||||||||||||||||||||
| * | The majority of the investments bear interest at a rate that may be determined by reference to London Interbank Offered Rate (“LIBOR” or “L”), Prime (“P”) or EURIBOR (“E”) and which reset monthly, bi-monthly, quarterly, semiannually or annually. For each, the Company has provided the spread over LIBOR or Prime and the current interest rate in effect at December 31, 2019. Certain investments are subject to a LIBOR or Prime interest rate floor. For fixed rate loans, a spread above a reference rate is not applicable. |
See accompanying notes
98
CRESCENT CAPITAL BDC, INC.
Consolidated Schedule of Investments
December 31, 2019
(in thousands, except share and per share data)
| ** | Percentage is based on net assets of $406,917 as of December 31, 2019. |
| † | All positions held are non-controlled/non-affiliated investments, unless otherwise noted, as defined by the Investment Company Act of 1940, as amended (“1940 Act”). Non-controlled/non-affiliated investments are investments that are neither controlled nor affiliated. |
| ‡ | All debt investments are income-producing, unless otherwise noted. Equity and member interests are non-income-producing unless otherwise noted. The Company generally acquires its investments in private transactions exempt from registration under the Securities Act of 1933, as amended, or the Securities Act. Its investments are therefore generally subject to certain limitations on resale, and may be deemed to be “restricted securities” under the Securities Act. |
| (1) | The fair value of the investment was determined using significant unobservable inputs. See Note 2 “Summary of Significant Accounting Policies”. |
| (2) | The interest rate on these loans is subject to the greater of a LIBOR floor or 1 month LIBOR plus a base rate. The 1 month LIBOR as of December 31, 2019 was 1.76%. |
| (3) | Position or portion thereof is an unfunded loan commitment, and no interest is being earned on the unfunded portion. See Note 8 “Commitments and Contingencies”. |
| (4) | The negative cost, if applicable, is the result of the capitalized discount or unfunded commitment being greater than the principal amount outstanding on the loan. The negative fair value, if applicable, is the result of the capitalized discount or unfunded commitment on the loan. |
| (5) | The interest rate on these loans is subject to the greater of a LIBOR floor or 3 month LIBOR plus a base rate. The 3 month LIBOR as of December 31, 2019 was 1.91%. |
| (6) | Fixed rate investment. |
| (7) | The interest rate on these loans is subject to the U.S. Prime rate, which as of December 31, 2019 was 4.75%. |
| (8) | The interest rate on these loans is subject to the greater of a LIBOR floor or 12 month LIBOR plus a base rate. The 12 month LIBOR as of December 31, 2019 was 2.00%. |
| (9) | Investment is not a qualifying investment as defined under section 55 (a) of the Investment Company Act of 1940. Qualifying assets must represent at least 70% of total assets at the time of acquisition. The Company’s percentage of non-qualifying assets based on fair value was 16.21% as of December 31, 2019. |
| (10) | The interest rate on these loans is subject to the greater of a LIBOR floor or 6 month LIBOR plus a base rate. The 6 month LIBOR as of December 31, 2019 was 1.91%. |
| (11) | These loans are unitranche first lien/last-out term loans. In addition to the interest earned based on the effective interest rate of this loan, which is the amount reflected in this schedule, the Company is entitled to receive additional interest as a result of an agreement among lenders whereby the loan has been allocated to “first-out” and “last-out” tranches, whereby the “first-out” tranche will have priority as to the “last-out” tranche with respect to payments of principal, interest and any amounts due thereunder. The Company holds the “last-out” tranche. |
| (12) | The investment is on non-accrual status as of December 31, 2019. |
| (13) | Non-income producing security. |
| (14) | As defined in the Investment Company Act of 1940, the portfolio company is deemed to be a “controlled affiliated person” of the Company because the Company owns, either directly or indirectly, 25% or more of the portfolio company’s outstanding voting securities or has the power to exercise control over management or policies of such portfolio company. See Note 3 “Agreements and Related Party Transactions”. |
| (15) | This investment was valued using net asset value as a practical expedient for fair value. Consistent with FASB guidance under ASC 820, these investments are excluded from the hierarchical levels. |
| (16) | The interest rate on these loans is subject to the greater of a LIBOR floor or 2 month LIBOR plus a base rate. The 2 month LIBOR as of December 31, 2019 was 1.83%. |
| (17) | The interest rate on these loans is subject to the greater of a EURIBOR floor or 3 month EURIBOR plus a base rate. The 3 month EURIBOR as of December 31, 2019 was (0.38)%. |
| (18) | The interest rate on these loans is subject to the greater of a GBP LIBOR floor or 3 month GBP LIBOR plus a base rate. The 3 month GBP LIBOR as of December 31, 2019 was 0.79%. |
| (19) | As defined in the 1940 Act, the portfolio company is deemed to be a “non-controlled affiliated person” of the Company because the Company owns, either directly or indirectly, 5% or more of the portfolio company’s outstanding voting securities. See Note 3 “Agreements and Related Party Transactions”. |
| (20) | Investment pays 0.50% unfunded commitment fee on delayed draw term loan and/or revolving credit facilities. |
| (21) | Investment pays 1.00% unfunded commitment fee on delayed draw term loan and/or revolving credit facilities. |
| (22) | Investment pays 0.75% unfunded commitment fee on delayed draw term loan and/or revolving credit facilities. |
| (23) | Investment pays 4.25% unfunded commitment fee on delayed draw term loan and/or revolving credit facilities. |
| (24) | Investment pays 3.88 % unfunded commitment fee on delayed draw term loan and/or revolving credit facilities. |
| (25) | Investment pays 0.38% unfunded commitment fee on delayed draw term loan and/or revolving credit facilities. |
See accompanying notes
99
CRESCENT CAPITAL BDC, INC.
Consolidated Schedule of Investments
December 31, 2019
(in thousands, except share and per share data)
| (26) | Investment pays 1.25% unfunded commitment fee on delayed draw term loan and/or revolving credit facilities. |
| Foreign Currency Exchange Contracts |
||||||||||||||||
| Counterparty |
Currency Purchased |
Currency Sold | Settlement | Unrealized Appreciation (Depreciation) |
||||||||||||
| Wells Fargo Bank, N.A. |
USD 7,974,709 | GBP 5,885,394 | 12/01/2023 | $ | (65 | ) | ||||||||||
| Wells Fargo Bank, N.A. |
USD 11,682,415 | EUR 9,221,988 | 04/10/2024 | 366 | ||||||||||||
| Wells Fargo Bank, N.A. |
USD 8,602,672 | EUR 6,702,510 | 02/20/2024 | 392 | ||||||||||||
|
|
|
|||||||||||||||
| $ | 693 | |||||||||||||||
|
|
|
|||||||||||||||
| EUR | Euro |
| GBP | Great British Pound |
| PIK | Payment In-Kind |
| USD | United States Dollar |
See accompanying notes
100
NOTES TO CONSOLIDATED FINANCIAL STATEMENTS
(in thousands, except share and per share amounts)
December 31, 2020
Note 1. Organization and Basis of Presentation
Crescent Capital BDC, Inc. (the “Company”) was formed on February 5, 2015 (“Inception”) as a Delaware corporation structured as an externally managed, closed-end management investment company. The Company commenced investment operations on June 26, 2015. On January 30, 2020, the Company changed its state of incorporation from the State of Delaware to the State of Maryland. The Company has elected to be treated as a business development company (“BDC”) under the Investment Company Act of 1940, as amended (the “1940 Act”) and currently operates as a diversified investment company. In addition, the Company has elected to be treated for U.S. federal income tax purposes as a regulated investment company (a “RIC”) under Subchapter M of the Internal Revenue Code of 1986, as amended (the “Code”). As a RIC, the Company will not be taxed on its income to the extent that it distributes such income each year and satisfies other applicable income tax requirements.
The Company’s primary investment objective is to maximize the total return to its stockholders in the form of current income and capital appreciation through debt and related equity investments. The Company will seek to achieve its investment objectives by investing primarily in secured debt (including senior secured, unitranche and second lien debt) and unsecured debt (including senior unsecured, mezzanine and subordinated debt), as well as related equity securities of private U.S. middle-market companies. The Company may make multiple investments in the same portfolio company. Although the Company’s focus is to invest in private credit transactions, in certain circumstances it may also invest in broadly syndicated loans and bonds.
The Company is managed by Crescent Cap Advisors, LLC (the “Adviser” and formerly, CBDC Advisors, LLC), an investment adviser that is registered with the Securities and Exchange Commission (the “SEC”) under the Investment Advisers Act of 1940, as amended. CCAP Administration LLC (the “Administrator” and formerly, CBDC Administration, LLC) provides the administrative services necessary for the Company to operate. Company management consists of investment and administrative professionals from the Adviser and Administrator along with the Company’s Board of Directors (the “Board”). The Adviser directs and executes the investment operations and capital raising activities of the Company subject to oversight from the Board, which sets the broad policies of the Company. The Board has delegated investment management of the Company’s investment assets to the Adviser. The Board consists of five directors, four of whom are independent.
The Company has formed a wholly owned subsidiary that is structured as a tax blocker, to hold equity or equity-like investments in portfolio companies organized as limited liability companies or other forms of pass-through entities. This corporate subsidiary is not consolidated for income tax purposes and may incur income tax expense as a result of its ownership of portfolio companies.
On January 31, 2020, the Company completed a transaction to acquire Alcentra Capital Corporation in a cash and stock transaction (the “Alcentra Acquisition”). The Company was listed and began trading on the NASDAQ stock exchange on February 3, 2020. See “Note 14. Alcentra Acquisition” for more information.
On January 5, 2021, Sun Life Financial Inc. (together with its subsidiaries and joint ventures, “Sun Life”) acquired a majority interest in Crescent (the “Sun Life Transaction”). Consummation of the Sun Life Transaction resulted in a change of control of Crescent.
Basis of Presentation
The Company is an investment company as defined in the accounting and reporting guidance under Accounting Standards Codification (“ASC”) Topic 946 — Financial Services — Investment Companies (“ASC Topic 946”). The accompanying consolidated financial statements of the Company and related financial information have been prepared in accordance with generally accepted accounting principles in the United States of America (“GAAP”) for financial information and pursuant to the requirements for reporting on Form 10-K and Regulation S-X. In the opinion of management, the consolidated financial statements reflect all adjustments and reclassifications consisting solely of normal accruals that are necessary for the fair presentation of financial results as of and for the periods presented. All intercompany balances and transactions have been eliminated. Certain prior period amounts have been reclassified to conform to the current period presentation.
The Company does not consolidate its equity interest in CBDC Senior Loan Fund, LLC (the “Senior Loan Fund”).
101
Note 2. Summary of Significant Accounting Policies
Use of Estimates
The preparation of the consolidated financial statements in conformity with GAAP requires management to make certain estimates and assumptions that may affect the amounts reported in the consolidated financial statements and accompanying notes. These consolidated financial statements reflect adjustments that in the opinion of management are necessary for the fair statement of the results for the periods presented. Although management believes that the estimates and assumptions are reasonable, changes in the economic environment, financial markets and any other parameters used in determining these estimates could cause actual results to differ materially.
Cash and Cash Equivalents
Cash and cash equivalents consist of demand deposits and may include highly liquid investments (e.g., money market funds, U.S. Treasury notes, and similar type instruments) with original maturities of three months or less. Cash and cash equivalents other than money market mutual funds, are carried at cost plus accrued interest, which approximates fair value. Money market mutual funds are carried at their net asset value, which approximates fair value. Restricted cash and cash equivalents consists of deposits held at Wells Fargo Bank N.A. related to the Company’s credit facility. The Company holds cash and cash equivalents denominated in foreign currencies. The Company deposits its cash, cash equivalents and restricted cash with highly-rated banking corporations and, at times, cash deposits may exceed the insured limits under applicable law.
Investment Transactions
Loan originations are recorded on the date of the binding commitment. Investments purchased on a secondary market are recorded on the trade date. Realized gains or losses are recorded using the specific identification method as the difference between the net proceeds received (excluding prepayment fees, if any) and the amortized cost basis of the investment without regard to unrealized gains or losses previously recognized, and include investments written off during the period, net of recoveries. The net change in unrealized gains or losses primarily reflects the change in investment fair values as of the last business day of the reporting period and also includes the reversal of previously recorded unrealized gains or losses with respect to investments realized during the period.
Investment Valuation
The Company applies Financial Accounting Standards Board ASC 820, Fair Value Measurement (ASC 820), as amended, which establishes a framework for measuring fair value in accordance with GAAP and required disclosures of fair value measurements. ASC 820 determines fair value to be the price that would be received for an investment in a current sale, which assumes an orderly transaction between market participants on the measurement date. Market participants are defined as buyers and sellers in the principal or most advantageous market (which may be a hypothetical market) that are independent, knowledgeable, and willing and able to transact. In accordance with ASC 820, the Company considers its principal market to be the market that has the greatest volume and level of activity. ASC 820 specifies a fair value hierarchy that prioritizes and ranks the level of observability of inputs used in the determination of fair value. In accordance with ASC 820, these levels are summarized below:
Level 1—Valuations based on quoted prices in active markets for identical assets or liabilities that the Company has the ability to access.
Level 2—Valuations based on quoted prices in markets that are not active or for which all significant inputs are observable, either directly or indirectly.
Level 3—Valuations based on inputs that are unobservable and significant to the overall fair value measurement.
Investments for which market quotations are readily available are typically valued at those market quotations. To validate market quotations, the Company utilizes a number of factors to determine if the quotations are representative of fair value, including the source and number of the quotations. Debt and equity securities that are not publicly traded or whose market prices are not readily available are valued at fair value as determined in good faith by the Board, based on, among other things, the input of the Adviser, the Company’s Audit Committee and, with certain de minimis exceptions, independent third-party valuation firms engaged at the direction of the Board.
The Board oversees and supervises a multi-step valuation process, which includes, among other procedures, the following:
| • | The valuation process begins with each investment being initially valued by the investment professionals responsible for the portfolio investment in conjunction with the portfolio management team. |
102
| • | The Adviser’s management and Crescent’s alternative investment valuation committee reviews the preliminary valuations with the investment professionals. Agreed upon valuation recommendations are presented to the Audit Committee. |
| • | The Audit Committee reviews the valuations presented and recommends values for each investment to the Board. |
| • | The Board reviews the recommended valuations and determines the fair value of each investment. |
Investments in investment companies are valued at fair value. Fair values are generally determined utilizing the net asset value (“NAV”) supplied by, or on behalf of, management of each investment company, which is net of management and incentive fees or allocations charged by the investment company and is in accordance with the “practical expedient”, as defined by ASC 820. NAVs received by, or on behalf of, management of each investment company are based on the fair value of the investment company’s underlying investments in accordance with policies established by management of each investment company, as described in each of their financial statements and offering memorandum. Investments which are valued using NAV as a practical expedient are excluded from the above hierarchy.
The Company applies the valuation policy approved by its Board that is consistent with ASC 820. Consistent with the valuation policy, the Company evaluates the source of inputs, including any markets in which its investments are trading (or any markets in which securities with similar attributes are trading), in determining fair value. When a security is valued based on prices provided by reputable dealers or pricing services (that is, broker quotes), the Company subjects those prices to various criteria in making the determination as to whether a particular investment would qualify for classification as a Level 2 or Level 3 investment. For example, the Company reviews pricing methodologies provided by dealers or pricing services in order to determine if observable market information is being used, versus unobservable inputs. Some additional factors considered include the number of prices obtained as well as an assessment as to their quality. Transfers between levels, if any, are recognized at the beginning of the period in which the transfers occur.
Due to the inherent uncertainty of determining the fair value of investments that do not have a readily available market value, the fair value of the Company’s investments may fluctuate from period to period. Additionally, the fair value of such investments may differ significantly from the values that would have been used had a ready market existed for such investments and may differ materially from the values that may ultimately be realized. Further, such investments are generally less liquid than publicly traded securities and may be subject to contractual and other restrictions on resale. If the Company were required to liquidate a portfolio investment in a forced or liquidation sale, it could realize amounts that are different from the amounts presented and such differences could be material. In addition, changes in the market environment and other events that may occur over the life of the investments may cause the gains or losses ultimately realized on these investments to be different than the unrealized gains or losses reflected herein.
Foreign Currency
Foreign currency amounts are translated into U.S. dollars on the following basis:
| • | cash and cash equivalents, fair value of investments, outstanding debt on revolving credit facilities, other assets and liabilities: at the spot exchange rate on the last business day of the period; and |
| • | purchases and sales of investments, borrowings and repayments of such borrowings, income and expenses: at the rates of exchange prevailing on the respective dates of such transactions. |
Although net assets and fair values are presented based on the applicable foreign exchange rates described above, the Company does not isolate that portion of the results of operations resulting from changes in foreign exchange rates on investments from the fluctuations arising from changes in fair values of investments held. Gains or losses on foreign currency transactions are included with net realized gain (loss) on foreign currency transactions on the Consolidated Statements of Operations. Fluctuations arising from the translation of foreign currency on cash, investments and borrowings are included with net change in unrealized appreciation (depreciation) on investments and foreign currency translation on the Consolidated Statements of Operations.
The Company’s approach to hedging the foreign currency exposure in its non-U.S. dollar denominated investments is to borrow local currency under the Company’s credit facilities or by entering into foreign currency forward contracts.
Foreign currency forward contracts
The Company may enter into foreign currency forward contracts to reduce the Company’s exposure to foreign currency exchange rate fluctuations in the value of foreign currencies. In a foreign currency forward contract, the Company agrees to receive or deliver a fixed quantity of one currency for another, at a pre-determined price at a future date. Forward foreign currency contracts are marked-to-market at the applicable forward rate. Unrealized appreciation (depreciation) on foreign currency forward contracts are recorded on the Consolidated Statements of Assets and Liabilities by counterparty on a gross basis, not taking into account collateral posted which is recorded separately, if applicable. Notional amounts and the gross fair value of foreign currency forward contract assets and liabilities
103
are presented separately on the Consolidated Schedules of Investments. Purchases and sales of foreign currency forward contracts having the same notional value, settlement date and counterparty are generally settled net (which results in a net foreign currency position of zero with the counterparty) and any realized gains or losses are recognized on the settlement date.
The Company does not utilize hedge accounting and as such, the Company recognizes its derivatives at fair value with changes in the net unrealized appreciation (depreciation) on foreign currency forward contracts recorded on the Consolidated Statements of Operations.
Equity Offering and Organization Expenses
The Company agreed to repay the Adviser for initial organization costs and equity offering costs incurred prior to the commencement of its operations up to a maximum of $1,500 on a pro rata basis over the first $350,000 of invested capital not to exceed 3 years from the initial capital commitment on June 26, 2015. The initial 3 year term was later extended to June 30, 2019 with shareholder approval. To the extent such costs related to equity offerings, these costs were charged as a reduction of capital upon the issuance of common shares. To the extent such costs related to organization costs, these costs were expensed in the Consolidated Statements of Operations upon the issuance of common shares. The Adviser was responsible for organization and private equity offerings costs in excess of $1,500. During the reimbursement period which began on June 26, 2015 and expired on June 30, 2019, the Adviser had allocated to the Company $794 of equity offering costs and $568 of organization costs.
Debt Issuance Costs
The Company records costs related to issuance of debt obligations as deferred financing costs. These costs are deferred and amortized using the effective yield method for revolving credit facilities, over the stated maturity life of the obligation. As of December 31, 2020 and December 31, 2019, there were $4,600 and $3,431, respectively, of deferred financing costs netted against debt balances on the Company’s Consolidated Statements of Assets and Liabilities.
Interest and Dividend Income Recognition
Interest income is recorded on an accrual basis and includes the amortization of purchase discounts and premiums. Discounts and premiums to par value on securities purchased are accreted or amortized into interest income over the contractual life of the respective security using the effective yield method. The amortized cost of investments represents the original cost adjusted for the accretion and amortization of discounts and premiums, if any. Upon prepayment of a loan or debt security, any prepayment premiums, unamortized upfront loan origination fees and unamortized discounts are recorded as interest income.
Dividend income from common equity securities is recorded on the record date for private portfolio companies or on the ex-dividend date for publicly-traded portfolio companies. Dividend income from preferred equity securities is recorded on an accrual basis to the extent that such amounts are payable by the portfolio company and are expected to be collected. Each distribution received from an equity investment is evaluated to determine if the distribution should be recorded as dividend income or a return of capital. Generally, the Company will not record distributions from equity investments as dividend income unless there is sufficient current or accumulated earnings prior to the distribution. Distributions that are classified as a return of capital are recorded as a reduction in the cost basis of the investment.
Certain investments have contractual payment-in-kind (“PIK”) interest or dividends. PIK represents accrued interest or accumulated dividends that are added to the loan principal or cost basis of the investment on the respective interest or dividend payment dates rather than being paid in cash and generally becomes due at maturity or upon being called by the issuer. PIK is recorded as interest income, as applicable. If at any point the Company believes PIK is not expected to be realized, the investment generating PIK will be placed on non-accrual status. Accrued PIK interest or dividends are generally reversed through interest or dividend income, respectively, when an investment is placed on non-accrual status.
Loans are generally placed on non-accrual status when principal or interest payments are past due 30 days or more or when there is reasonable doubt that principal or interest will be collected in full. Accrued and unpaid interest is generally reversed when a loan is placed on non-accrual status. Interest payments received on non-accrual loans may be recognized as income or applied to principal depending upon management’s judgment regarding collectability. Non-accrual loans are restored to accrual status when past due principal and interest is paid current and, in management’s judgment, are likely to remain current. Management may determine to not place a loan on non-accrual status if the loan has sufficient collateral value and is in the process of collection. As of December 31, 2020, the Company had two portfolio companies with three investment positions on non-accrual status, which represented 1.7% and 1.3% of the total debt investments at cost and fair value, respectively. As of December 31, 2019, the Company had one portfolio company with three investment positions on non-accrual status, which represented 1.9% and 1.0% of the total debt investments at cost and fair value, respectively.
104
Other Income
Other income may include income such as consent, waiver, amendment, underwriting and arranger fees associated with the Company’s investment activities as well as any fees for managerial assistance services rendered by the Company to the portfolio companies. Such fees are recognized as income when earned or the services are rendered.
Income Taxes
The Company has elected to be treated as a BDC under the 1940 Act. The Company also has elected to be treated as a RIC under the Internal Revenue Code. So long as the Company maintains its status as a RIC, it will generally not pay corporate-level U.S. federal income or excise taxes on any ordinary income or capital gains that it distributes at least annually to its stockholders as dividends. As a result, any tax liability related to income earned and distributed by the Company represents obligations of the Company’s stockholders and will not be reflected in the consolidated financial statements of the Company.
The Company evaluates tax positions taken or expected to be taken in the course of preparing its consolidated financial statements to determine whether the tax positions are “more-likely-than-not” to be sustained by the applicable tax authority. Tax positions not deemed to meet the “more-likely-than-not” threshold are reversed and recorded as a tax benefit or expense in the current year. All penalties and interest associated with income taxes are included in income tax expense. Conclusions regarding tax positions are subject to review and may be adjusted at a later date based on factors including, but not limited to, on-going analyses of tax laws, regulations and interpretations thereof. The Company accounts for income taxes in conformity with ASC 740 — Income Taxes (“ASC 740”). ASC 740 provides guidelines for how uncertain tax positions should be recognized, measured, presented and disclosed in financial statements.
The Company intends to comply with the applicable provisions of the Code, pertaining to regulated investment companies and to make distributions of taxable income sufficient to relieve it from substantially all federal income taxes. As of December 31, 2020, the Company is subject to examination by U.S. federal tax authorities for returns filed for the three most recent calendar years and by state tax authorities for returns filed for the four most recent calendar years.
In order for the Company not to be subject to federal excise taxes, it must distribute annually an amount at least equal to the sum of (i) 98% of its ordinary income (taking into account certain deferrals and elections), (ii) 98.2% of its net capital gains from the current year and (iii) any undistributed ordinary income and net capital gains from preceding years. The Company, at its discretion, may carry forward taxable income in excess of calendar year dividends and pay a 4% excise tax on this income. If the Company chooses to do so, this generally would increase expenses and reduce the amount available to be distributed to stockholders. The Company accrues excise tax on estimated undistributed taxable income as required on a quarterly basis. For the year ended December 31, 2020, the Company expensed an excise tax of $592, of which $421 remained payable. For the year ended December 31, 2019, the Company expensed an excise tax of $119, of which $110 remained payable. For the year ended December 31, 2018, the Company expensed an excise tax of $112, of which $112 remained payable.
CBDC Universal Equity, Inc. is a taxable entity (“Taxable Subsidiary”). The Taxable Subsidiary permits the Company to hold equity investments in portfolio companies which are “pass through” entities for tax purposes and continues to comply with the “source income” requirements contained in RIC tax provisions of the Code. The Taxable Subsidiary is not consolidated with the Company for income tax purposes and may generate income tax expense, benefit, and the related tax assets and liabilities, as a result of its ownership of certain portfolio investments. The income tax expense, or benefit, if any, and related tax assets and liabilities are reflected in the Company’s consolidated financial statements.
For the year ended December 31, 2020, the Company recognized a benefit/(provision) for taxes of $(235) on unrealized appreciation/(depreciation) on investments and net operating losses and federal tax credits related to the Taxable Subsidiary. As of December 31, 2020, $630 was included in deferred tax assets on the Consolidated Statements of Assets and Liabilities relating to net operating loss carryforwards and unrealized losses on investments and other temporary book to tax differences that are expected to be used in future periods. As of December 31, 2020, $1,324, was included in deferred tax liabilities on the Consolidated Statements of Assets and Liabilities primarily relating to deferred taxes on unrealized gains on investments held in the Company’s corporate subsidiary and other temporary book to tax differences of the corporate subsidiary.
For the year ended December 31, 2019, the Company recognized a benefit/(provision) for taxes of $(154), on unrealized appreciation/(depreciation) on investments and net operating losses and federal tax credits related to the Taxable Subsidiary. As of December 31, 2019, $421, was included in deferred tax assets on the Consolidated Statements of Assets and Liabilities relating to net operating loss carryforwards and unrealized losses on investments and other temporary book to tax differences that are expected to be used in future periods. As of December 31, 2019, $879 was included in deferred tax liabilities on the Consolidated Statements of Assets and Liabilities primarily relating to deferred taxes on unrealized gains on investments held in the Company’s corporate subsidiary and other temporary book to tax differences of the corporate subsidiary.
For the year ended December 31, 2018, the Company recognized a benefit/(provision) for taxes of $(88), on unrealized appreciation/(depreciation) on investments and net operating losses and federal tax credits related to the Taxable Subsidiary. As of
105
December 31, 2018, $299, was included in deferred tax assets on the Consolidated Statements of Assets and Liabilities relating to net operating loss carryforwards and unrealized losses on investments and other temporary book to tax differences that are expected to be used in future periods. As of December 31, 2018, $604 was included in deferred tax liabilities on the Consolidated Statements of Assets and Liabilities primarily relating to deferred taxes on unrealized gains on investments held in the Company’s corporate subsidiary and other temporary book to tax differences of the corporate subsidiary.
For the years ended December 31, 2020 and 2019, the Company recognized a tax benefit (provision) of $46 and $(67) on realized gains on investments, respectively. For the year ended December 31, 2018 there was no realized gain on investments requiring a recognition of a tax provision.
Dividends and Distributions to Stockholders
Dividends and distributions to common stockholders are recorded on the record date. The amount to be paid out as a dividend is determined by the Board each quarter. Net realized capital gains, if any, are distributed at least annually, although the Company may decide to retain such capital gains for investment.
The Company adopted a dividend reinvestment plan that provides for reinvestment of the Company’s dividends and other distributions on behalf of the stockholders unless a stockholder elects to receive cash. As a result, if the Company’s Board authorizes, and the Company declares, a cash dividend, or other distribution then stockholders who are participating in the dividend reinvestment plan will have their cash dividends and distributions automatically reinvested in additional shares of common stock, rather than receiving cash dividends and distributions.
Prior to February 3, 2020, which is the date of the Company’s listing on NASDAQ, only stockholders who “opted in” to the dividend reinvestment plan had their cash dividends and distributions automatically reinvested in additional shares of common stock. After February 3, 2020, stockholders who do not “opt out” of the dividend reinvestment plan will have their cash dividends and distributions automatically reinvested in additional shares of the Company’s common stock. The elections of stockholders that made an election prior to February 3, 2020 remain effective.
New Accounting Standards
In March 2020, the FASB issued Accounting Standard Update (“ASU”) No. 2020-04, “Reference Rate Reform (Topic 848): Facilitation of the Effects of Reference Rate Reform on Financial Reporting.” This ASU provides optional exceptions for applying GAAP to contract modifications, hedging relationships and other transactions affected reference rate reform if certain criteria are met. ASU 2020-04 is elective and can be adopted between March 12, 2020 and December 31, 2022. The Company doesn’t expect that the adoption of this guidance will have a material impact on its consolidated financial statements.
The SEC issued final rules that, among other things, amended the financial disclosure requirements of Regulation S-X for acquired and disposed businesses and the significance tests for a “significant subsidiary” as applicable to BDCs and amended certain forms used by BDCs. The amendments are intended to assist BDCs in making more meaningful determinations as to whether a subsidiary or an acquired or disposed entity is significant and improve the financial disclosure requirements applicable to acquisitions and dispositions of investment companies and BDCs. The Company early adopted the updated rules for the year ended December 31, 2020 which did not result in any new significant subsidiaries being identified.
Note 3. Agreements and Related Party Transactions
Administration Agreement
On June 2, 2015, the Company entered into the Administration Agreement with the Administrator, as amended and restated on February 1, 2020. Under the terms of the Administration Agreement, the Administrator provides administrative services to the Company. These services include providing office space, equipment and office services, maintaining financial records, preparing reports to stockholders and reports filed with the SEC, and managing the payment of expenses and the performance of administrative and professional services rendered by others. Certain of these services are reimbursable to the Administrator under the terms of the Administration Agreement. In addition, the Administrator is permitted to delegate its duties under the Administration Agreement to affiliates or third parties. To the extent the Administrator outsources any of its functions, the Company will pay the fees associated with such functions on a direct basis, without incremental profit to the Administrator. The Administration Agreement may be terminated by either party without penalty on 60 days’ written notice to the other party.
For the years ended December 31, 2020, 2019 and 2018, the Company incurred administrative services expenses of $819, $657 and $652, respectively, which are included in other general and administrative expenses on the Consolidated Statements of Operations, of which $321 and $175, respectively, were payable at December 31, 2020 and 2019.
106
No person who is an officer, director or employee of the Administrator or its affiliates and who serves as a director of the Company receives any compensation from the Company for his or her services as a director. However, the Company reimburses the Administrator (or its affiliates) for an allocable portion of the compensation paid by the Administrator or its affiliates to the Company’s compliance professionals, legal counsel, and other professionals who spend time on such related activities (based on the percentage of time those individuals devote, on an estimated basis, to the business and affairs of the Company). The allocable portion of the compensation for these officers and other professionals are included in the administration expenses paid to the Administrator. Directors who are not affiliated with the Administrator or its affiliates receive compensation for their services and reimbursement of expenses incurred to attend meetings, which are included as directors’ fees on the Consolidated Statements of Operations.
On June 5, 2015, the Company entered into a sub-administration agreement with State Street Bank and Trust Company (“SSB”) to perform certain administrative, custodian and other services on behalf of the Company. The sub-administration agreement with SSB had an initial term of three years ending June 5, 2018 and shall automatically renew for 1-year terms unless a written notice of non-renewal is delivered by the Company or SSB. The Company does not reimburse the Administrator for any services for which it pays a separate sub-administrator and custodian fee to SSB. For the years ended December 31, 2020, 2019 and 2018, the Company incurred expenses of $1,199, $973 and $778, respectively, which are included in other general and administrative expenses on the Consolidated Statements of Operations, under the terms of the sub-administration agreements, of which $300 and $263, respectively, were payable at December 31, 2020 and 2019.
Investment Advisory Agreement
On June 2, 2015, the Company entered into a investment advisory agreement with the Adviser (the “Investment Advisory Agreement”), which was subsequently replaced by the Amended and Restated Investment Advisory Agreement (together with the Investment Advisory Agreement, the “Advisory Agreements”), which was approved by the Company’s stockholders on January 29, 2020 in connection with the Alcentra Acquisition resulting in the change of certain terms. Subsequently on December 17, 2020 in connection with the Sun Life Transaction, the Amended and Restated Investment Advisory Agreement was re-approved by the Company’s stockholders resulting in no substantive changes to the terms. Under the terms of the Amended and Restated Investment Advisory Agreement, the Adviser provides investment advisory services to the Company and its portfolio investments. The Adviser’s services under the Amended and Restated Investment Advisory Agreement are not exclusive, and the Adviser is free to furnish similar or other services to others so long as its services to the Company are not impaired. Under the terms of the Advisory Agreements, the Adviser is entitled to receive a base management fee and may also receive incentive fees, as discussed below.
Base Management Fee (prior to February 1, 2020)
Prior to February 1, 2020, pursuant to the Investment Advisory Agreement, the base management fee was calculated and payable quarterly in arrears at an annual rate of 1.50% of the Company’s gross assets, including assets acquired through the incurrence of debt but excluding any cash and cash equivalents. The base management fee was calculated based on the average value of gross assets at the end of the two most recently completed calendar quarters, and appropriately adjusted for share issuances or repurchases during the current calendar quarter.
Under the Investment Advisory Agreement, the Adviser agreed to waive its right to receive management fees in excess of the sum of (i) 0.25% of the aggregate committed but undrawn capital and (ii) 0.75% of the aggregate gross assets excluding cash and cash equivalents (including capital drawn to pay the Company’s expenses) during the period prior to February 3, 2020, the date of the Company’s qualified initial public offering, as defined by the Investment Advisory Agreement (“Qualified IPO”). The listing of the Company’s Common Stock on NASDAQ on February 3, 2020 qualified as a Qualified IPO. The Adviser is not permitted to recoup any waived amounts at any time.
New Base Management Fee (effective February 1, 2020)
Effective February 1, 2020, pursuant to the Amended and Restated Investment Advisory Agreement, the base management fee is calculated and payable quarterly in arrears at an annual rate of 1.25% of the Company’s gross assets, including assets acquired through the incurrence of debt but excluding any cash and cash equivalents. The base management fee is calculated based on the average value of gross assets at the end of the two most recently completed calendar quarters, and appropriately adjusted for any share issuances or repurchases during the current calendar quarter.
In addition, under the terms of the Amended and Restated Advisory Agreement, the Adviser agreed to waive a portion of the management fee from February 1, 2020 through July 31, 2021 after the closing of the Alcentra Acquisition so that only 0.75% shall be charged for such time period. The Adviser is not permitted to recoup any waived amounts at any time.
For the years ended December 31, 2020, 2019 and 2018, the Company incurred management fees of $6,766, $4,696 and $3,385, respectively, which are net of waived amounts, of $4,672, $4,502 and $2,602, respectively, of which $1,867 and $1,343 was payable at December 31, 2020 and December 31, 2019.
107
The Adviser has voluntarily waived its right to receive management fees on the Company’s investment in GACP II LP for any period in which GACP II LP remains in the investment portfolio. For the years ended December 31, 2020, 2019 and 2018, $148, $149 and $60, respectively, of management fees waived were attributable to the Company’s investment in GACP II LP.
Incentive Fee (prior to February 1, 2020)
Under the Investment Advisory Agreement, the Incentive Fee consisted of two parts. The first part, the income incentive fee, was calculated and payable quarterly in arrears and equaled (a) 100% of the excess of the pre-incentive fee net investment income for the immediately preceding calendar quarter, over a preferred return of 1.5% per quarter (6.0% annualized) (the “Hurdle”), and a catch-up feature until the Adviser received 15% of the pre-incentive fee net investment income for the current quarter up to 1.7647% (the “Catch-up”), and (b) 15% of all remaining pre-incentive fee net investment income above the “Catch-up.”
The second part, the capital gains incentive fee, was determined and payable in arrears as of the end of each fiscal year at a rate of 15.0% of the Company’s realized capital gains, if any, on a cumulative basis from Inception through the end of the fiscal year, computed net of all realized capital losses and unrealized capital depreciation on a cumulative basis, less the aggregate amount of any previously paid capital gain incentive fees.
At the 2018 Annual Meeting of Stockholders, in connection with the extension of the deadline to consummate a Qualified IPO, the Adviser agreed to waive its rights under the Investment Advisory Agreement to (i) the income incentive fee and (ii) the capital gain incentive fee for the period from April 1, 2018 through February 1, 2020.
Incentive Fee (effective February 1, 2020)
Under the Amended and Restated Investment Advisory Agreement, the Incentive Fee consists of two parts. The first part, the income incentive fee, is calculated and payable quarterly in arrears and (a) equals 100% of the excess of the pre-incentive fee net investment income for the immediately preceding calendar quarter, over a preferred return of 1.75% per quarter (7.0% annualized) (the “Hurdle”), and a catch-up feature until the Adviser has received 17.5%, of the pre-incentive fee net investment income for the current quarter up to 2.1212% (the “Catch-up”), and (b) 17.5% of all remaining pre-incentive fee net investment income above the “Catch-up.”
In addition, under the terms of the Amended and Restated Investment Advisory Agreement, the Adviser agreed to waive the income based portion of the incentive fee from February 1, 2020 through July 31, 2021. Once the Adviser begins to earn income incentive fees, the Adviser will voluntarily waive the income incentive fees attributable to the investment income accrued by the Company as a result of its investment in GACP II. The second part, the capital gains incentive fee, is determined and payable in arrears as of the end of each fiscal year at a rate of 17.5% of the Company’s realized capital gains, if any, on a cumulative basis from Inception through the end of the fiscal year, computed net of all realized capital losses and unrealized capital depreciation on a cumulative basis, less the aggregate amount of any previously paid capital gain incentive fees.
Since the Qualified IPO occurred on a date other than the first day of a calendar quarter, the income incentive fee shall be calculated for such calendar quarter at a weighted rate calculated based on the fee rates applicable before and after a Qualified IPO based on the number of days in such calendar quarter before and after the Qualified IPO. For the avoidance of doubt, such capital gains incentive fee shall be equal to 15.0% of the Company’s realized capital gains on a cumulative basis from Inception through the day before the Qualified IPO, computed net of all realized capital losses and unrealized capital depreciation on a cumulative basis, less the aggregate amount of any previously paid capital gains incentive fees. Following the Qualified IPO, solely for the purposes of calculating the capital gains incentive fee, the Company will be deemed to have previously paid capital gains incentive fees prior to a Qualified IPO equal to the product obtained by multiplying (a) the actual aggregate amount of previously paid capital gains incentive fees for all periods prior to the Qualified IPO by (b) the percentage obtained by dividing (x) 17.5% by (y) 15.0%. In the event that the Amended and Restated Investment Advisory Agreement shall terminate as of a date that is not a fiscal year end, the termination date shall be treated as though it were a fiscal year end for purposes of calculating and paying a capital gains incentive fee.
Pre-incentive fee net investment income means interest income, dividend income and any other income (including any other fees (other than fees for providing managerial assistance), such as commitment, origination, structuring, diligence and consulting fees or other fees that the Company receives from portfolio companies) accrued during each calendar quarter, minus operating expenses for such quarter (including the base management fee, expenses payable under the Administration Agreement and any interest expense and distributions paid on any issued and outstanding debt or preferred stock, but excluding the incentive fee). Pre-incentive fee net investment income includes, in the case of investments with a deferred interest feature (such as market discount, original issue discount, debt instruments with PIK interest, preferred stock with PIK dividends and zero coupon securities), accrued income that the Company has not yet received in cash. Pre-incentive fee net investment income does not include any realized capital gains, realized capital losses or unrealized capital appreciation or depreciation. Pre-incentive fee net investment income will be compared to a “Hurdle Amount” equal to the product of (i) the Hurdle rate of 1.50% or 1.75% per quarter, 6.00% or 7.00% annualized, prior to and effective February 1, 2020, respectively, and (ii) the Company’s net assets (defined as total assets less indebtedness, before taking into account any incentive fees payable during the period), at the end of the immediately preceding calendar quarter, subject to a “catch-up” provision incurred at the end of each calendar quarter.
108
For the years ended December 31, 2020, 2019 and 2018, the Company incurred income incentive fees of $0, $0 and $555, respectively, which are net of waived amounts, of $8,639, $4,752 and $2,187, respectively, of which $0 and $0 were payable at December 31, 2020 and 2019.
GAAP Incentive Fee on Cumulative Unrealized Capital Appreciation
The Company accrues, but does not pay, a portion of the Incentive Fee based on capital gains with respect to net unrealized appreciation. Under GAAP, the Company is required to accrue an Incentive Fee based on capital gains that includes net realized capital gains and losses and net unrealized capital appreciation and depreciation on investments held at the end of each period. In calculating the accrual for the Incentive Fee based on capital gains, the Company considers the cumulative aggregate unrealized capital appreciation in the calculation, since an Incentive Fee based on capital gains would be payable if such unrealized capital appreciation were realized, even though such unrealized capital appreciation is not permitted to be considered in calculating the fee payable under the Amended and Restated Investment Advisory Agreement. This accrual is calculated using the aggregate cumulative realized capital gains and losses and aggregate cumulative unrealized capital appreciation or depreciation. If such amount is positive at the end of a period, then the Company records a capital gains incentive fee equal to 15% (prior to February 3, 2020) or 17.5% (effective February 3, 2020) of such amount, minus the aggregate amount of actual Incentive Fees based on capital gains paid in all prior periods. If such amount is negative, then there is no accrual for such period. There can be no assurance that such unrealized capital appreciation will be realized in the future.
For the years ended December 31, 2020, 2019 and 2018, the Company recorded no incentive fee on cumulative unrealized capital appreciation.
Other Related Party Transactions
From time to time, the Administrator may pay amounts owed by the Company to third-party providers of goods or services, including the Board, and the Company will subsequently reimburse the Administrator for such amounts paid on its behalf. Amounts payable to the Administrator are settled in the normal course of business without formal payment terms.
In conjunction with the closing of Alcentra Capital merger, the Company and the Adviser executed a Transaction Support Agreement, as described in Note 14.
A portion of the outstanding shares of the Company’s common stock are owned by Crescent Capital Group LP (“Crescent”). Crescent is also the majority member of the Adviser and sole member of the Administrator. The Company has entered into a license agreement with Crescent under which Crescent granted the Company a non-exclusive, royalty-free license to use the name “Crescent Capital”. The Adviser has entered into a resource sharing agreement with Crescent. Crescent will provide the Adviser with the resources necessary for the Adviser to fulfill its obligations under the Investment Advisory Agreement. On January 5, 2021, Sun Life acquired a majority interest in Crescent. Consummation of the Sun Life Transaction resulted in a change of control of Crescent. There were no changes to the Company’s investment objective, strategies and process or to the Crescent team responsible for the investment operations of the Company as a result of the Sun Life Transaction.
As described in Note 6, the Company completed a private offering of senior unsecured notes due July 30, 2023 with Sun Life serving as sole lender.
Investments in and Advances to Affiliates
The Company’s investments in non-controlled affiliates for the year ended December 31, 2020 were as follows (in thousands):
| Fair Value as of December 31, 2019 |
Gross Additions(2) |
Gross Reductions(3) |
Net Realized Gains/ (Losses) |
Change in Unrealized Gains/ (Losses) |
Fair Value as of December 31, 2020 |
Dividend, Interest, PIK and Other Income |
||||||||||||||||||||||
| Non-Controlled Affiliates |
||||||||||||||||||||||||||||
| APC Auto Technology Intermediate, LLC |
$ | 928 | $ | — | $ | — | $ | (1,847 | ) | $ | 919 | $ | — | $ | — | |||||||||||||
| ASP MCS Acquisition |
— | 5,224 | (13 | ) | (3,788 | ) | 370 | 1,793 | 76 | |||||||||||||||||||
| Battery Solutions, Inc. |
— | 4,917 | — | — | (1,352 | ) | 3,565 | 178 | ||||||||||||||||||||
| Conisus, LLC |
— | 10,160 | — | — | 12,705 | 22,865 | 1,433 | |||||||||||||||||||||
| Slickdeals Holdings, LLC |
15,933 | 82 | (348 | ) | 50 | 293 | 16,010 | 1,189 | ||||||||||||||||||||
| Southern Technical Institute, Inc. |
— | — | (1,271 | ) | 1,271 | 7,253 | 7,253 | — | ||||||||||||||||||||
| Vivid Seats Ltd. |
3,646 | — | — | — | 68 | 3,714 | — | |||||||||||||||||||||
|
|
|
|
|
|
|
|
|
|
|
|
|
|
|
|||||||||||||||
| Total Non-Controlled Affiliates |
$ | 20,507 | $ | 20,383 | $ | (1,632 | ) | $ | (4,314 | ) | $ | 20,256 | $ | 55,200 | $ | 2,876 | ||||||||||||
|
|
|
|
|
|
|
|
|
|
|
|
|
|
|
|||||||||||||||
109
The Company’s investments in non-controlled affiliates for the year ended December 31, 2019 were as follows (in thousands):
| Fair Value as of December 31, 2018 |
Gross Additions(2) |
Gross Reductions(3) |
Net Realized Gains/ (Losses) |
Change in Unrealized Gains/ (Losses) |
Fair Value as of December 31, 2019 |
Dividend, Interest, PIK and Other Income |
||||||||||||||||||||||
| Non-Controlled Affiliates |
||||||||||||||||||||||||||||
| APC Auto Tech |
$ | — | $ | 9,747 | $ | — | $ | (7,900 | ) | $ | (919 | ) | $ | 928 | $ | 665 | ||||||||||||
| Slickdeals Holdings, LLC |
12,096 | 3,897 | (129 | ) | — | 69 | 15,933 | 1,464 | ||||||||||||||||||||
| Vivid Seats Ltd. |
3,389 | 28 | (541 | ) | — | 770 | 3,646 | 83 | ||||||||||||||||||||
|
|
|
|
|
|
|
|
|
|
|
|
|
|
|
|||||||||||||||
| Total Non-Controlled Affiliates |
$ | 15,485 | $ | 13,672 | $ | (670 | ) | $ | (7,900 | ) | $ | (80 | ) | $ | 20,507 | $ | 2,212 | |||||||||||
|
|
|
|
|
|
|
|
|
|
|
|
|
|
|
|||||||||||||||
The Company’s investments in controlled affiliates for the year ended December 31, 2020 were as follows (in thousands):
| Fair Value as of December 31, 2019 |
Gross Additions(2) |
Gross Reductions(3) |
Net Realized Gains/ (Losses) |
Change in Unrealized Gains/ (Losses) |
Fair Value as of December 31, 2020 |
Dividend, Interest, PIK and Other Income |
||||||||||||||||||||||
| Controlled Affiliates |
||||||||||||||||||||||||||||
| CBDC Senior Loan Fund LLC(1) |
$ | 34,442 | $ | 7,000 | $ | (1,000 | ) | $ | — | $ | (1,707 | ) | $ | 38,735 | $ | 2,200 | ||||||||||||
|
|
|
|
|
|
|
|
|
|
|
|
|
|
|
|||||||||||||||
The Company’s investments in controlled affiliates for the year ended December 31, 2019 were as follows (in thousands):
| Fair Value as of December 31, 2018 |
Gross Additions(2) |
Gross Reductions(3) |
Net Realized Gains/ (Losses) |
Change in Unrealized Gains/ (Losses) |
Fair Value as of December 31, 2019 |
Dividend, Interest, PIK and Other Income |
||||||||||||||||||||||
| Controlled Affiliates |
||||||||||||||||||||||||||||
| CBDC Senior Loan Fund LLC(1) |
$ | — | $ | 34,000 | $ | — | $ | — | $ | 442 | $ | 34,442 | $ | 2,300 | ||||||||||||||
|
|
|
|
|
|
|
|
|
|
|
|
|
|
|
|||||||||||||||
| (1) | Together with Masterland Enterprise Holdings, Ltd. (“Masterland”, and collectively with the Company, the “Members”), the Company invests through the Senior Loan Fund. Although the Company owns more than 25% of the voting securities of the Senior Loan Fund, the Company does not have control over the Senior Loan Fund (other than for purposes of the Investment Company Act). See Note 4 “Investments”. |
| (2) | Gross additions may include increases in the cost basis of investments resulting from new portfolio investments, PIK interest or dividends, the accretion of discounts, the exchange of one or more existing securities for one or more new securities and the movement of an existing portfolio company into this category from a different category. |
| (3) | Gross reductions may include decreases in the cost basis of investments resulting from principal collections related to investment repayments or sales, the exchange of one or more existing securities for one or more new securities and the movement of an existing portfolio company out of this category into a different category. |
110
Note 4. Investments
The Company’s investments at any time may include securities and other financial instruments or other assets of any sort, including, without limitation, corporate and government bonds, convertible securities, collateralized loan obligations, term loans, trade claims, equity securities, privately negotiated securities, direct placements, working interests, warrants and investment derivatives (including, but not limited to credit default swaps, recovery swaps, total return swaps, options, forward contracts, and futures) (all of the foregoing collectively referred to in these consolidated financial statements as “investments”).
“First lien” investments are senior loans on a lien basis to other liabilities in the issuer’s capital structure that have the benefit of a first-priority security interest in assets of the issuer. The security interest ranks above the security interest of any second-lien lenders in those assets.
“Unitranche first lien” investments are loans that may extend deeper in a company’s capital structure than traditional first lien debt and may provide for a waterfall of cash flow priority among different lenders in the unitranche loan. In certain instances, the Company may find another lender to provide the “first out” portion of such loan and retain the “last out” portion of such loan, in which case, the “first out” portion of the loan would generally receive priority with respect to payment of principal, interest and any other amounts due thereunder over the “last out” portion that the Company would continue to hold. In exchange for the greater risk of loss, the “last out” portion earns a higher interest rate.
“Second lien” investments are loans with a second priority lien on all existing and future assets of the portfolio company. The security interest ranks below the security interests of any first lien and unitranche first lien lenders in those assets.
“Mezzanine” or “unsecured debt” investments are loans that generally rank senior to a borrower’s equity securities and junior in right of payment to such borrower’s other senior indebtedness.
Under the 1940 Act, the Company is required to separately identify non-controlled investments where it owns 5% or more of a portfolio company’s outstanding voting securities and/or has the power to exercise control over the management or policies of such portfolio company as investments in “affiliated” companies. In addition, under the 1940 Act, the Company is required to separately identify investments where it owns more than 25% of a portfolio company’s outstanding voting securities and/or has the power to exercise control over the management or policies of such portfolio company as investments in “controlled” companies. Detailed information with respect to the Company’s non-controlled, non-affiliated; non-controlled, affiliated; and controlled affiliated investments is contained in the accompanying consolidated financial statements, including the Consolidated Schedule of Investments. The information in the following tables is presented on an aggregate portfolio basis, without regard to whether they are non-controlled, non-affiliated, non-controlled, affiliated or controlled affiliated, investments.
Certain Risk Factors
In the ordinary course of business, the Company manages a variety of risks including market risk and liquidity risk. The Company identifies, measures and monitors risk through various control mechanisms, including trading limits and diversifying exposures and activities across a variety of instruments, markets and counterparties.
Market risk is the risk of potential adverse changes to the value of financial instruments because of changes in market conditions, including as a result of changes in the credit quality of a particular issuer, credit spreads, interest rates, and other movements and volatility in security prices or commodities. In particular, the Company may invest in issuers that are experiencing or have experienced financial or business difficulties (including difficulties resulting from the initiation or prospect of significant litigation or bankruptcy proceedings), which involves significant risks. The Company manages its exposure to market risk through the use of risk management strategies and various analytical monitoring techniques.
The Company’s investments may, at any time, include securities and other financial instruments or obligations that are illiquid or thinly traded, making purchase or sale of such securities and financial instruments at desired prices or in desired quantities difficult. Furthermore, the sale of any such investments may be possible only at substantial discounts, and it may be extremely difficult to value any such investments accurately.
Investments denominated in foreign currencies and foreign currency transactions may involve certain considerations and risks not typically associated with those of domestic origin, including unanticipated movements in the value of the foreign currency relative to the U.S. dollar.
111
Investments at fair value consisted of the following at December 31, 2020 and December 31, 2019 (in thousands):
| December 31, 2020 | December 31, 2019 | |||||||||||||||||||||||
| Investment Type |
Cost | Fair Value | Unrealized Appreciation/ (Depreciation) |
Cost | Fair Value | Unrealized Appreciation/ (Depreciation) |
||||||||||||||||||
| Senior Secured First Lien |
$ | 380,909 | $ | 373,633 | $ | (7,276 | ) | $ | 356,080 | $ | 351,332 | $ | (4,748 | ) | ||||||||||
| Unitranche First Lien |
408,177 | 413,543 | 5,366 | 213,884 | 218,416 | 4,532 | ||||||||||||||||||
| Unitranche First Lien - Last Out |
15,668 | 14,917 | (751 | ) | 15,845 | 16,044 | 199 | |||||||||||||||||
| Senior Secured Second Lien |
105,056 | 104,656 | (400 | ) | 64,801 | 58,887 | (5,914 | ) | ||||||||||||||||
| Unsecured Debt |
3,112 | 3,032 | (80 | ) | 7,381 | 7,414 | 33 | |||||||||||||||||
| Equity & Other |
41,974 | 69,331 | 27,357 | 19,037 | 21,432 | 2,395 | ||||||||||||||||||
| LLC/LP Equity Interests |
56,228 | 54,889 | (1,339 | ) | 52,067 | 53,006 | 939 | |||||||||||||||||
|
|
|
|
|
|
|
|
|
|
|
|
|
|||||||||||||
| Total Investments |
$ | 1,011,124 | $ | 1,034,001 | $ | 22,877 | $ | 729,095 | $ | 726,531 | $ | (2,564 | ) | |||||||||||
|
|
|
|
|
|
|
|
|
|
|
|
|
|||||||||||||
The industry composition of investments at fair value at December 31, 2020 and December 31, 2019 is as follows (in thousands):
| Industry |
Fair Value December 31, 2020 |
Percentage of Fair Value |
Fair Value December 31, 2019 |
Percentage of Fair Value |
||||||||||||
| Health Care Equipment & Services |
$ | 269,614 | 26.08 | % | 147,162 | 20.26 | % | |||||||||
| Commercial & Professional Services |
207,151 | 20.03 | 136,218 | 18.75 | ||||||||||||
| Software & Services |
134,374 | 13.00 | 111,790 | 15.39 | ||||||||||||
| Consumer Services |
123,704 | 11.96 | 68,380 | 9.41 | ||||||||||||
| Diversified Financials |
65,128 | 6.30 | 60,288 | 8.30 | ||||||||||||
| Pharmaceuticals, Biotechnology & Life Sciences |
38,018 | 3.68 | 11,500 | 1.58 | ||||||||||||
| Insurance |
37,154 | 3.59 | 30,991 | 4.27 | ||||||||||||
| Retailing |
23,537 | 2.28 | 25,917 | 3.56 | ||||||||||||
| Automobiles & Components |
23,449 | 2.27 | 32,978 | 4.54 | ||||||||||||
| Media & Entertainment |
22,865 | 2.21 | — | — | ||||||||||||
| Energy |
18,776 | 1.82 | 13,162 | 1.81 | ||||||||||||
| Capital Goods |
18,643 | 1.80 | 20,896 | 2.88 | ||||||||||||
| Food & Staples Retailing |
18,220 | 1.76 | 33,300 | 4.58 | ||||||||||||
| Transportation |
7,257 | 0.70 | 6,626 | 0.91 | ||||||||||||
| Materials |
6,912 | 0.67 | 11,137 | 1.53 | ||||||||||||
| Food, Beverage & Tobacco |
4,666 | 0.45 | 4,261 | 0.59 | ||||||||||||
| Household & Personal Products |
4,253 | 0.41 | 3,854 | 0.53 | ||||||||||||
| Telecommunication Services |
4,062 | 0.39 | — | — | ||||||||||||
| Consumer Durables & Apparel |
3,223 | 0.31 | 3,256 | 0.45 | ||||||||||||
| Technology Hardware & Equipment |
2,995 | 0.29 | 4,815 | 0.66 | ||||||||||||
|
|
|
|
|
|
|
|
|
|||||||||
| Total Investments |
$ | 1,034,001 | 100.00 | % | $ | 726,531 | 100.00 | % | ||||||||
|
|
|
|
|
|
|
|
|
|||||||||
112
The geographic composition of investments at fair value at December 31, 2020 and December 31, 2019 is as follows (in thousands):
| Geographic Region |
Fair Value December 31, 2020 |
Percentage of Fair Value |
Fair Value December 31, 2019 |
Percentage of Fair Value |
||||||||||||
| United States |
$ | 971,838 | 93.99 | % | $ | 681,443 | 93.79 | % | ||||||||
| United Kingdom |
23,960 | 2.32 | 8,038 | 1.11 | ||||||||||||
| Belgium |
15,208 | 1.47 | 14,937 | 2.05 | ||||||||||||
| Canada |
14,312 | 1.38 | 12,109 | 1.67 | ||||||||||||
| Netherlands |
8,683 | 0.84 | 7,756 | 1.07 | ||||||||||||
| France |
— | — | 2,248 | 0.31 | ||||||||||||
|
|
|
|
|
|
|
|
|
|||||||||
| Total Investments |
$ | 1,034,001 | 100.00 | % | $ | 726,531 | 100.00 | % | ||||||||
|
|
|
|
|
|
|
|
|
|||||||||
Note 5. Fair Value of Financial Instruments
Investments
The following table presents fair value measurements of investments as of December 31, 2020 (in thousands):
| Fair Value Hierarchy |
||||||||||||||||
| Level 1 | Level 2 | Level 3 | Total | |||||||||||||
| Senior Secured First Lien |
$ | — | $ | 33,735 | $ | 339,898 | $ | 373,633 | ||||||||
| Unitranche First Lien |
— | — | 413,543 | 413,543 | ||||||||||||
| Unitranche First Lien – Last Out |
— | — | 14,917 | 14,917 | ||||||||||||
| Senior Secured Second Lien |
— | — | 104,656 | 104,656 | ||||||||||||
| Unsecured Debt |
— | — | 3,032 | 3,032 | ||||||||||||
| Equity & Other |
— | 1,500 | 67,831 | 69,331 | ||||||||||||
|
|
|
|
|
|
|
|
|
|||||||||
| Subtotal |
$ | — | $ | 35,235 | $ | 943,877 | $ | 979,112 | ||||||||
|
|
|
|
|
|
|
|
|
|||||||||
| Investments Measured at NAV (1) |
54,889 | |||||||||||||||
|
|
|
|
|
|
|
|
|
|||||||||
| Total Investments |
$ | 1,034,001 | ||||||||||||||
|
|
|
|
|
|
|
|
|
|||||||||
| Foreign Currency Forward Contracts |
$ | — | $ | (632 | ) | $ | — | $ | (632 | ) | ||||||
|
|
|
|
|
|
|
|
|
|||||||||
The following table presents fair value measurements of investments as of December 31, 2019 (in thousands):
| Fair Value Hierarchy |
||||||||||||||||
| Level 1 | Level 2 | Level 3 | Total | |||||||||||||
| Senior Secured First Lien |
$ | — | $ | 83,139 | $ | 268,193 | $ | 351,332 | ||||||||
| Unitranche First Lien |
— | — | 218,416 | 218,416 | ||||||||||||
| Unitranche First Lien – Last Out |
— | — | 16,044 | 16,044 | ||||||||||||
| Senior Secured Second Lien |
— | 9,318 | 49,569 | 58,887 | ||||||||||||
| Unsecured Debt |
— | — | 7,414 | 7,414 | ||||||||||||
| Equity & Other |
— | — | 21,432 | 21,432 | ||||||||||||
|
|
|
|
|
|
|
|
|
|||||||||
| Subtotal |
$ | — | $ | 92,457 | $ | 581,068 | $ | 673,525 | ||||||||
|
|
|
|
|
|
|
|
|
|||||||||
| Investments Measured at NAV (1) |
53,006 | |||||||||||||||
|
|
|
|
|
|
|
|
|
|||||||||
| Total Investments |
$ | 726,531 | ||||||||||||||
|
|
|
|
|
|
|
|
|
|||||||||
| Foreign Currency Forward Contracts |
$ | — | $ | 693 | $ | — | $ | 693 | ||||||||
|
|
|
|
|
|
|
|
|
|||||||||
| (1) | In accordance with ASC 820-10, certain investments that are measured using the net asset value per shares (or its equivalent) as a practical expedient for fair value have not been classified in the fair value hierarchy. These investments are generally not redeemable. The fair value amounts presented in this table are intended to permit reconciliation of the fair value hierarchy to the amounts presented in the Consolidated Statements of Assets and Liabilities. |
113
The following table provides a reconciliation of the beginning and ending balances for total investments that use Level 3 inputs for the year ended December 31, 2020, based off of the fair value hierarchy at December 31, 2020 (in thousands):
| Senior Secured First Lien |
Unitranche First Lien |
Unitranche First - Last Out |
Senior Secured Second Lien |
Unsecured Debt |
Equity & Other |
Total | ||||||||||||||||||||||
| Balance as of January 1, 2020 |
$ | 268,193 | $ | 218,416 | $ | 16,044 | $ | 49,569 | $ | 7,414 | $ | 21,432 | $ | 581,068 | ||||||||||||||
| Amortized discounts/premiums |
1,776 | 1,669 | 35 | 218 | 119 | 10 | 3,827 | |||||||||||||||||||||
| Paid in-kind interest |
1,399 | 352 | — | 267 | 175 | 1,432 | 3,625 | |||||||||||||||||||||
| Net realized gain (loss) |
(334 | ) | — | — | (9,002 | ) | — | (667 | ) | (10,003 | ) | |||||||||||||||||
| Net change in unrealized appreciation (depreciation) |
(3,670 | ) | 833 | (949 | ) | 5,855 | (114 | ) | 23,467 | 25,422 | ||||||||||||||||||
| Purchases |
155,047 | 239,785 | — | 62,622 | 1,981 | 22,376 | 481,811 | |||||||||||||||||||||
| Sales/return of capital/principal repayments/paydowns |
(89,512 | ) | (47,512 | ) | (213 | ) | (4,873 | ) | (6,543 | ) | (219 | ) | (148,872 | ) | ||||||||||||||
| Transfers in |
6,999 | — | — | — | — | — | 6,999 | |||||||||||||||||||||
| Transfers out |
— | — | — | — | — | — | — | |||||||||||||||||||||
|
|
|
|
|
|
|
|
|
|
|
|
|
|
|
|||||||||||||||
| Balance as of December 31, 2020 |
$ | 339,898 | $ | 413,543 | $ | 14,917 | $ | 104,656 | $ | 3,032 | $ | 67,831 | $ | 943,877 | ||||||||||||||
|
|
|
|
|
|
|
|
|
|
|
|
|
|
|
|||||||||||||||
| Net change in unrealized appreciation (depreciation) from investments still held as of December 31, 2020 |
$ | (3,286 | ) | $ | (2,116 | ) | $ | (949 | ) | $ | (253 | ) | $ | 46 | $ | 2,518 | $ | (4,040 | ) | |||||||||
|
|
|
|
|
|
|
|
|
|
|
|
|
|
|
|||||||||||||||
During the year ended December 31, 2020, the Company recorded $0 in transfers from Level 3 to Level 2 and $6,999 in transfers from Level 2 to Level 3 due to a decrease in observable inputs in market data.
The following table provides a reconciliation of the beginning and ending balances for total investments that use Level 3 inputs for the year ended December 31, 2019, based off of the fair value hierarchy at December 31, 2019 (in thousands):
| Senior Secured First Lien |
Unitranche First Lien |
Unitranche First - Last Out |
Senior Secured Second Lien |
Unsecured Debt |
Equity & Other |
Total | ||||||||||||||||||||||
| Balance as of January 1, 2019 |
$ | 232,214 | $ | 84,891 | $ | — | $ | 53,857 | $ | 7,263 | $ | 13,806 | $ | 392,031 | ||||||||||||||
| Amortized discounts/premiums |
1,090 | 1,097 | 47 | 290 | 33 | — | 2,557 | |||||||||||||||||||||
| Paid in-kind interest |
440 | — | — | — | 120 | — | 560 | |||||||||||||||||||||
| Net realized gain (loss) |
(597 | ) | 10 | — | (7,900 | ) | — | 1,299 | (7,188 | ) | ||||||||||||||||||
| Net change in unrealized appreciation (depreciation) |
819 | 2,597 | 198 | 911 | (2 | ) | 2,072 | 6,595 | ||||||||||||||||||||
| Purchases |
102,410 | 164,399 | 16,012 | 2,425 | — | 7,183 | 292,429 | |||||||||||||||||||||
| Sales/return of capital/principal repayments/paydowns |
(50,060 | ) | (34,578 | ) | (213 | ) | (4,669 | ) | — | (2,928 | ) | (92,448 | ) | |||||||||||||||
| Transfers in |
— | — | — | 4,655 | — | — | 4,655 | |||||||||||||||||||||
| Transfers out |
(18,123 | ) | — | — | — | — | — | (18,123 | ) | |||||||||||||||||||
|
|
|
|
|
|
|
|
|
|
|
|
|
|
|
|||||||||||||||
| Balance as of December 31, 2019 |
$ | 268,193 | $ | 218,416 | $ | 16,044 | $ | 49,569 | $ | 7,414 | $ | 21,432 | $ | 581,068 | ||||||||||||||
|
|
|
|
|
|
|
|
|
|
|
|
|
|
|
|||||||||||||||
| Net change in unrealized appreciation (depreciation) from investments still held as of December 31, 2019 |
$ | 395 | $ | 3,375 | $ | 199 | $ | (1,528 | ) | $ | (2 | ) | $ | 2,780 | $ | 5,219 | ||||||||||||
|
|
|
|
|
|
|
|
|
|
|
|
|
|
|
|||||||||||||||
114
During the year ended December 31, 2019, the Company recorded $18,123 in transfers from Level 3 to Level 2 and $4,655 in transfers from Level 2 to Level 3 due to an increase and a decrease, respectively, in observable inputs in market data.
The following tables present the fair value of Level 3 investments and the ranges of significant unobservable inputs used to value the Company’s Level 3 investments as of December 31, 2020 and December 31, 2019. These ranges represent the significant unobservable inputs that were used in the valuation of each type of investment. These inputs are not representative of the inputs that could have been used in the valuation of any one investment. For example, the highest market yield presented in the table for senior secured first lien investments is appropriate for valuing a specific investment but may not be appropriate for valuing any other investment. Accordingly, the ranges of inputs presented below do not represent uncertainty in, or possible ranges of, fair value measurements of the Company’s Level 3 investments.
Quantitative information about Level 3 Fair Value Measurements
| Fair value as of December 31, 2020 (in thousands) |
Valuation Techniques |
Unobservable Input |
Range (Weighted Average) |
|||||||||
| Senior Secured First Lien |
$ | 301,956 | Discounted Cash Flows | Discount Rate | 4.7%-25.2% (7.3%) | |||||||
| 21,189 | Enterprise Value | Comparable EBITDA Multiple | 3.7x-16.6x (7.9x) | |||||||||
| 16,753 | Broker Quoted | Broker Quote | N/A | |||||||||
|
|
|
|||||||||||
| Subtotal: |
$ | 339,898 | ||||||||||
|
|
|
|||||||||||
| Unitranche First Lien |
$ | 392,281 | Discounted Cash Flows | Discount Rate | 4.8%-15.0% (7.0%) | |||||||
| 5,673 | Enterprise Value | Comparable EBITDA Multiple | 5.9x-5.9x (5.9x) | |||||||||
| 2,668 | Collateral Analysis | Recovery Rate | 100.0% | |||||||||
| 12,921 | Broker Quoted | Broker Quote | N/A | |||||||||
|
|
|
|||||||||||
| Subtotal |
$ | 413,543 | ||||||||||
|
|
|
|||||||||||
| Unitranche First Lien - Last Out |
$8,454 | Discounted Cash Flows | Discount Rate | 6.2%-6.2% (6.2%) | ||||||||
| 6,463 | Collateral Analysis | Recovery Rate | 80.0% | |||||||||
|
|
|
|||||||||||
| Subtotal |
$ | 14,917 | ||||||||||
|
|
|
|||||||||||
| Senior Secured Second Lien |
$ | 104,362 | Discounted Cash Flows | Discount Rate | 7.5%-14.0% (9.5%) | |||||||
| 294 | Broker Quoted | Broker Quote | N/A | |||||||||
|
|
|
|||||||||||
| Subtotal: |
$ | 104,656 | ||||||||||
|
|
|
|||||||||||
| Unsecured Debt |
$3,032 | Discounted Cash Flows | Discount Rate | 12.5%-21.4% (16.6%) | ||||||||
|
|
|
|||||||||||
| Equity & Other |
$66,002 | Enterprise Value | Comparable EBITDA Multiple | 1.5x-25.9x (10.2x) | ||||||||
| 1,829 | Broker Quoted | Broker Quote | N/A | |||||||||
|
|
|
|||||||||||
| Subtotal: |
$ | 67,831 | ||||||||||
|
|
|
|||||||||||
115
Quantitative information about Level 3 Fair Value Measurements
| Fair value as of December 31, 2019 (in thousands) |
Valuation Techniques |
Unobservable Input |
Range (Weighted Average) |
|||||||||
| Senior Secured First Lien |
$ | 213,314 | Discounted Cash Flows | Discount Rate | 6.3%-12.9% (7.4%) | |||||||
| 7,488 | Enterprise Value | Comparable EBITDA Multiple | 11.7x | |||||||||
| 47,391 | Broker Quoted | Broker Quote | N/A | |||||||||
|
|
|
|||||||||||
| Subtotal: |
$ | 268,193 | ||||||||||
|
|
|
|||||||||||
| Unitranche First Lien |
$ | 183,908 | Discounted Cash Flows | Discount Rate | 7.1%-10.8% (8.0%) | |||||||
| 34,508 | Broker Quoted | Broker Quote | N/A | |||||||||
|
|
|
|||||||||||
| Subtotal |
$ | 218,416 | ||||||||||
|
|
|
|||||||||||
| Unitranche First Lien - Last Out |
$ | 16,044 | Discounted Cash Flows | Discount Rate | 6.5%-12.2% (9.5%) | |||||||
|
|
|
|||||||||||
| Senior Secured Second Lien |
$ | 43,018 | Discounted Cash Flows | Discount Rate | 9.1%-15.6% (10.8%) | |||||||
| 6,551 | Enterprise Value | Comparable EBITDA Multiple | 11.4x | |||||||||
|
|
|
|||||||||||
| Subtotal: |
$ | 49,569 | ||||||||||
|
|
|
|||||||||||
| Unsecured Debt |
$ | 7,414 | Discounted Cash Flows | Discount Rate | 11.0%-15.7% (11.5%) | |||||||
|
|
|
|||||||||||
| Equity & Other |
$ | 21,432 | Enterprise Value | Comparable EBITDA Multiple | 7.3x-17.9x (14.4x) | |||||||
|
|
|
|||||||||||
As noted above, the discounted cash flows and market multiple approaches were used in the determination of fair value of certain Level 3 assets as of December 31, 2020 and December 31, 2019. The significant unobservable inputs used in the discounted cash flow approach is the discount rate used to discount the estimated future cash flows expected to be received from the underlying investment, which include both future principal and interest payments. Increases and decreases in the discount rate would result in a decrease and increase in the fair value, respectively. Included in the consideration and selection of discount rates is risk of default, rating of the investment, call provisions and comparable company investments. The significant unobservable inputs used in the market multiple approach are the multiples of similar companies’ earnings before income taxes, depreciation and amortization (“EBITDA”) and comparable market transactions. Increases and decreases in market EBITDA multiples would result in an increase or decrease in the fair value, respectively. The recovery rate represents the extent to which proceeds can be recovered. An increase/decrease in the recovery rate would result in an increase/decrease, respectively, in the fair value.
116
Note 6. Debt
Debt consisted of the following as of December 31, 2020 and December 31, 2019 (in thousands):
| December 31, 2020 | ||||||||||||||||||||||||
| Aggregate Principal Amount Committed |
Drawn Amount |
Amount Available (1) |
Carrying Value(2) |
Weighted Average Debt Outstanding |
Weighted Average Interest Rate |
|||||||||||||||||||
| SPV Asset Facility |
$ | 350,000 | $ | 260,210 | $ | 89,790 | $ | 260,210 | $ | 235,263 | 2.63 | % | ||||||||||||
| Corporate Revolving Facility |
200,000 | 149,904 | 50,096 | 149,904 | 150,378 | 2.93 | % | |||||||||||||||||
| Unsecured Notes |
50,000 | 50,000 | — | 50,000 | 15,027 | 6.49 | % | |||||||||||||||||
| InterNotes ® |
16,418 | 16,418 | — | 16,418 | 20,398 | 6.40 | % | |||||||||||||||||
|
|
|
|
|
|
|
|
|
|
|
|
|
|||||||||||||
| Total Debt |
$ | 616,418 | $ | 476,532 | $ | 139,886 | $ | 476,532 | $ | 421,066 | 3.26 | % | ||||||||||||
|
|
|
|
|
|
|
|
|
|
|
|
|
|||||||||||||
| December 31, 2019 | ||||||||||||||||||||||||
| Aggregate Principal Amount Committed |
Drawn Amount |
Amount Available (1) |
Carrying Value(2) |
Weighted Average Debt Outstanding |
Weighted Average Interest Rate |
|||||||||||||||||||
| SPV Asset Facility |
$ | 250,000 | $ | 220,687 | $ | 29,313 | $ | 220,687 | $ | 200,975 | 4.03 | % | ||||||||||||
| Corporate Revolving Facility |
200,000 | 104,754 | 95,246 | 104,754 | 74,930 | 4.26 | % | |||||||||||||||||
|
|
|
|
|
|
|
|
|
|
|
|
|
|||||||||||||
| Total Debt |
$ | 450,000 | $ | 325,441 | $ | 124,559 | $ | 325,441 | $ | 275,905 | 4.10 | % | ||||||||||||
|
|
|
|
|
|
|
|
|
|
|
|
|
|||||||||||||
| (1) | The amount available is subject to any limitations related to the respective debt facilities’ borrowing bases and foreign currency translation adjustments. |
| (2) | The amount presented excludes netting of deferred financing costs. |
As of December 31, 2020 and December 31, 2019, the carrying amount of the Company’s outstanding debt approximated fair value. The fair values of the Company’s debt are determined in accordance with ASC 820, which defines fair value in terms of the price that would be paid to transfer a liability in an orderly transaction between market participants at the measurement date under current market conditions. The fair value of the Company’s debt is estimated based upon market interest rates and entities with similar credit risk. As of December 31, 2020 and December 31, 2019, the debt would be deemed to be Level 3 of the fair value hierarchy.
As of December 31, 2020 and December 31, 2019, the Company was in compliance with the terms and covenants of its debt arrangements.
SPV Asset Facility
On March 28, 2016, Crescent Capital BDC Funding, LLC (“CCAP SPV”), a wholly owned subsidiary of CCAP, entered into a loan and security agreement, as amended (the “SPV Asset Facility”), with the Company as the collateral manager, seller and equityholder, CCAP SPV as the borrower, the banks and other financial institutions from time to time party thereto as lenders, and Wells Fargo Bank, National Association (“Wells Fargo”), as administrative agent, collateral agent, and lender. CCAP SPV is consolidated into the Company’s financial statements and no gain or loss is recognized from transfer of assets to and from CCAP SPV. Between February 8, 2017 and March 10, 2020, the Company has entered into multiple amendments to the SPV Asset Facility to, among other things, increase the facility limit from $75,000 to $350,000.
The maximum commitment amount under the SPV Asset Facility is $350,000 and may be increased with the consent of Wells Fargo or reduced upon request of the Company. Proceeds of the advances under the SPV Asset Facility may be used to acquire portfolio investments, to make distributions to the Company in accordance with the SPV Asset Facility, and to pay related expenses. The maturity date is the earlier of (a) the date the Borrower voluntarily reduces the commitments to zero, (b) March 10, 2025 (the Facility Maturity Date) and (c) the date upon which Wells Fargo declares the obligations due and payable after the occurrence of an Event of Default. Borrowings under the SPV Asset Facility bear interest at LIBOR plus a margin with no LIBOR floor. The margin is between 1.65% and 2.20% as determined by the proportion of liquid and illiquid loans pledged to the SPV Asset Facility. The Company pays unused facility fees of 0.50% per annum on committed but undrawn amounts under the SPV Asset Facility. The SPV Asset Facility includes customary covenants, including certain limitations on the incurrence of additional indebtedness and liens, as well as usual and customary events of default for revolving credit facilities of this nature. The facility size is subject to availability under the borrowing base, which is based on the amount of CCAP SPV’s assets from time to time, and satisfaction of certain conditions, including certain concentration limits.
117
Costs incurred in connection with obtaining the SPV Asset Facility and subsequent amendments were recorded as deferred financing costs and are being amortized over the life of the SPV Asset Facility on an effective yield basis. As of December 31, 2020 and December 31, 2019, deferred financing costs related to the SPV Asset Facility were $2,540 and $1,508, respectively, and were included in debt on the Consolidated Statements of Assets and Liabilities.
Corporate Revolving Facility
On August 20, 2019, the Company entered into the “Corporate Revolving Facility” with Ally Bank (“Ally”), as Administrative Agent and Arranger. Proceeds of the advances under the Revolving Credit Agreement may be used to acquire portfolio investments, to make distributions to the Company in accordance with the Revolving Credit Agreement and to pay related expenses. The maximum principal amount of the Corporate Revolving Facility is $200,000, subject to availability under the borrowing base.
Borrowings under the Corporate Revolving Facility bear interest at LIBOR plus a 2.35%, which includes 0.05% utilization fee, with no LIBOR floor. The Company pays unused facility fees of 0.50% per annum on committed but undrawn amounts under the Corporate Revolving Facility. Interest is payable quarterly in arrears. Any amounts borrowed under the Corporate Revolving Facility, and all accrued and unpaid interest, will be due and payable, on August 20, 2024.
Costs incurred in connection with obtaining the Corporate Revolving Facility have been recorded as deferred financing costs and are being amortized over the life of the Corporate Revolving Facility on an effective yield basis. As of December 31, 2020 and December 31, 2019, deferred financing costs related to the Corporate Revolving Facility were $1,360 and $1,923, respectively, and were included in debt on the Consolidated Statements of Assets and Liabilities.
The Corporate Revolving Facility replaced the prior corporate revolving facility with Capital One, National Association, as Administrative Agent, Lead Arranger, Managing Agent and Committed Lender. The maximum principal amount of the prior corporate revolving facility was $85,000, subject to availability under the borrowing base.
Borrowings under the prior corporate revolving facility bore interest at LIBOR plus a 1.55% margin with no LIBOR floor. The Company paid unused facility fees of 0.20% per annum on committed but undrawn amounts under the prior corporate revolving facility. Interest was payable monthly in arrears. The Company paid down in full and terminated the prior corporate revolving facility on August 20, 2019.
Unsecured Notes
On July 30, 2020, the Company completed a private offering of $50,000 aggregate principal amount of 5.95% senior unsecured notes due July 30, 2023 (the “Unsecured Notes”). The Unsecured Notes have a delayed draw feature. The initial issuance of $25,000 of Unsecured Notes closed July 30, 2020. The issuance of the remaining $25,000 of Unsecured Notes is closed on October 28, 2020.
The Unsecured Notes will mature on July 30, 2023 and may be redeemed in whole or in part, at the Company’s option, at any time or from time to time at par plus a “make-whole” premium, if applicable. Interest on the Unsecured Notes is due and payable semiannually in arrears on January 30th and July 30th of each year, commencing on January 30, 2021. As of December 31, 2020, the Company was in compliance with the terms of the note purchase agreement governing the Unsecured Notes.
Costs incurred in connection with issuing the Unsecured Notes were recorded as deferred financing costs and are being amortized over the life of the Unsecured Notes on an effective yield basis. As of December 31, 2020 and December 31, 2019, deferred financing costs related to the Unsecured Notes were $700 and $0, respectively, and were included in debt on the Consolidated Statements of Assets and Liabilities.
InterNotes®
On January 31, 2020, in connection with the Alcentra Acquisition, the Company assumed direct unsecured fixed interest rate obligations or “InterNotes®”. The majority of InterNotes® were issued by Alcentra Corporation between January 2015 and January 2016. Each series of notes has been issued by a separate trust administered by U.S. Bank.
As of December 31, 2020, the outstanding InterNotes® bear interest at fixed interest rates ranging between 6.25% and 6.75% and offer a variety of maturities ranging between February 15, 2021 and April 15, 2022.
118
Summary of Interest and Credit Facility Expenses
The summary information regarding the SPV Asset Facility, Corporate Revolving Facility, Unsecured Notes, InterNotes ®, and prior corporate revolving facility for the years ended December 31, 2020, 2019 and 2018, were as follows (in thousands):
| For the year ended December 31, 2020 |
For the year ended December 31, 2019 |
For the year ended December 31, 2018 |
||||||||||
| Borrowing interest expense |
$ | 13,417 | $ | 12,068 | $ | 7,502 | ||||||
| Unused facility fees |
740 | 254 | 187 | |||||||||
| Amortization of financing costs |
1,328 | 1,040 | 761 | |||||||||
|
|
|
|
|
|
|
|||||||
| Total interest and credit facility expenses |
$ | 15,485 | $ | 13,362 | $ | 8,450 | ||||||
|
|
|
|
|
|
|
|||||||
| Weighted average outstanding balance |
$ | 421,066 | $ | 275,905 | $ | 182,328 | ||||||
Note 7. Derivatives
The Company enters into foreign currency forward contracts from time to time to help mitigate the impact that an adverse change in foreign exchange rates would have on the value of the Company’s investments denominated in foreign currencies.
In order to better define its contractual rights and to secure rights that will help mitigate its counterparty risk, the Company may enter into an International Swaps and Derivatives Association, Inc. Master Agreement (“ISDA Master Agreement”) or a similar agreement with its derivative counterparties. An ISDA Master Agreement is a bilateral agreement between the Company and a counterparty that governs OTC derivatives, including foreign currency forward contracts, and typically contains, among other things, collateral posting terms and netting provisions in the event of a default and/or termination event. The provisions of the ISDA Master Agreement typically permit a single net payment in the event of a default (close-out netting) or similar event, including the bankruptcy or insolvency of the counterparty.
For financial reporting purposes, cash collateral that has been pledged to cover obligations of the Company and cash collateral received from the counterparty, if any, is included in the Consolidated Statement of Assets and Liabilities as due to/due from broker. There has been no cash collateral received or paid from the counterparty. The Company minimizes counterparty credit risk by only entering into agreements with counterparties that they believe to be of good standing and by monitoring the financial stability of those counterparties. All of the forward contracts qualify as Level 2 financial instruments.
For the years ended December 31, 2020, 2019 and 2018, the Company’s average USD notional exposure to foreign currency forward contracts was $35,788, $23,342 and $7,975, respectively.
The following table sets forth the Company’s net exposure to foreign currency forward contracts that are subject to ISDA Master Agreements or similar agreements as of December 31, 2020 and December 31, 2019.
As of December 31, 2020 (in thousands):
| Counterparty |
Gross Amount of Assets on the Consolidated Statements of Assets and Liabilities |
Gross Amount of (Liabilities) on the Consolidated Statements of Assets and Liabilities |
Net Amount of Assets or (Liabilities) Presented on the Consolidated Statements of Assets and Liabilities |
Collateral (Received) Pledged (1) |
Net Amounts(2) |
|||||||||||||||
| Wells Fargo Bank, N.A. |
$ | 264 | $ | (896 | ) | $ | (632 | ) | $ | — | $ | (632 | ) | |||||||
|
|
|
|
|
|
|
|
|
|
|
|||||||||||
| Total |
$ | 264 | $ | (896 | ) | $ | (632 | ) | $ | — | $ | (632 | ) | |||||||
|
|
|
|
|
|
|
|
|
|
|
|||||||||||
119
As of December 31, 2019 (in thousands):
| Counterparty |
Gross Amount of Assets on the Consolidated Statements of Assets and Liabilities |
Gross Amount of (Liabilities) on the Consolidated Statements of Assets and Liabilities |
Net Amount of Assets or (Liabilities) Presented on the Consolidated Statements of Assets and Liabilities |
Collateral (Received) Pledged (1) |
Net Amounts(2) |
|||||||||||||||
| Wells Fargo Bank, N.A. |
$ | 758 | $ | (65 | ) | $ | 693 | $ | — | $ | 693 | |||||||||
|
|
|
|
|
|
|
|
|
|
|
|||||||||||
| Total |
$ | 758 | $ | (65 | ) | $ | 693 | $ | — | $ | 693 | |||||||||
|
|
|
|
|
|
|
|
|
|
|
|||||||||||
| (1) | Amount excludes excess cash collateral paid. |
| (2) | Net amount represents the net amount due (to) from counterparty in the event of a default based on the contractual setoff rights under the agreement. Net amount excludes any over-collateralized amounts. |
The effect of transactions in derivative instruments to the Consolidated Statements of Operations for the years ended December 31, 2020, 2019 and 2018, was as follows (in thousands):
| For the year ended December 31, 2020 |
For the year ended December 31, 2019 |
For the year ended December 31, 2018 |
||||||||||
| Net realized gain (loss) on foreign currency forward contracts |
$ | — | $ | — | $ | — | ||||||
| Net change in unrealized appreciation (depreciation) on foreign currency forward contracts |
(1,324 | ) | 675 | 17 | ||||||||
|
|
|
|
|
|
|
|||||||
| Total net realized and unrealized gains (losses) on foreign currency forward contracts |
$ | (1,324 | ) | $ | 675 | $ | 17 | |||||
|
|
|
|
|
|
|
|||||||
Note 8. Commitments, Contingencies and Indemnifications
The Company’s investment portfolio may contain investments that are in the form of lines of credit or unfunded commitments, which require the Company to provide funding when requested by portfolio companies in accordance with the terms of the underlying agreements. Unfunded commitments to provide funds to portfolio companies are not reflected on the Company’s Consolidated Statements of Assets and Liabilities. These commitments are subject to the same underwriting and ongoing portfolio maintenance as are the on-balance sheet financial instruments that the Company holds. Since these commitments may expire without being drawn upon, the total commitment amount does not necessarily represent future cash requirements. As of December 31, 2020 and December 31, 2019, the Company had aggregated unfunded commitments totaling $80,837 and $82,745 including foreign denominated commitments converted to USD at the balance sheet date, respectively, under loan and financing agreements.
As of December 31, 2020 and December 31, 2019, the Company has the following unfunded commitments to portfolio companies (in thousands):
| December 31, 2020 | December 31, 2019 | |||||||||||||||
| Commitment Expiration Date (1) |
Unfunded Commitment(2) |
Commitment Expiration Date (1) |
Unfunded Commitment(2) |
|||||||||||||
| Senior Secured and Unitranche First Lien |
||||||||||||||||
| Abode Healthcare, Inc. |
8/28/2025 | $ | 1,150 | 8/25/2025 | $ | 862 | ||||||||||
| Affinitiv, Inc. |
8/26/2024 | 567 | 8/26/2024 | 850 | ||||||||||||
| Ameda, Inc. |
9/29/2022 | 113 | 9/29/2022 | 113 | ||||||||||||
| Anne Arundel Dermatology Management, LLC |
10/16/2022 | 1,159 | — | — | ||||||||||||
| Anne Arundel Dermatology Management, LLC |
10/16/2025 | 550 | — | — | ||||||||||||
| Ansira Partners, Inc. |
— | — | 4/16/2020 | 322 | ||||||||||||
| Auto-Vehicle Parts, LLC |
1/3/2023 | 600 | 1/3/2023 | 600 | ||||||||||||
| Avaap USA LLC |
3/22/2023 | 650 | 3/22/2023 | 650 | ||||||||||||
120
| December 31, 2020 | December 31, 2019 | |||||||||||||||
| Commitment Expiration Date (1) |
Unfunded Commitment(2) |
Commitment Expiration Date (1) |
Unfunded Commitment(2) |
|||||||||||||
| Benesys, Inc. |
10/5/2024 | 150 | 10/5/2024 | 102 | ||||||||||||
| BFC Solmetex LLC & Bonded Filter Co. LLC |
— | — | 11/16/2020 | 850 | ||||||||||||
| BFC Solmetex LLC & Bonded Filter Co. LLC |
— | — | 9/26/2023 | 240 | ||||||||||||
| C-4 Analytics, LLC |
8/22/2023 | 600 | 8/22/2023 | 600 | ||||||||||||
| CAT Buyer, LLC |
4/11/2024 | 550 | 4/11/2024 | 399 | ||||||||||||
| CC SAG Acquisition Corp. |
— | — | 9/9/2021 | 2,128 | ||||||||||||
| CC SAG Acquisition Corp. |
— | — | 9/9/2025 | 1,050 | ||||||||||||
| Centauri Health Solutions, Inc. |
— | — | 1/31/2022 | 1,575 | ||||||||||||
| Centria Subsidiary Holdings, LLC |
12/09/2025 | 1,816 | 12/9/2025 | 1,974 | ||||||||||||
| Claritas, LLC |
12/21/2023 | 188 | 12/21/2023 | 180 | ||||||||||||
| Colibri Group LLC |
5/1/2025 | 1,000 | 5/1/2025 | 733 | ||||||||||||
| Consolidated Label Co., LLC |
7/15/2026 | 650 | — | — | ||||||||||||
| Continental Battery Company |
— | — | 1/15/2020 | 1,811 | ||||||||||||
| Continental Battery Company |
12/14/2022 | 567 | 12/14/2022 | 170 | ||||||||||||
| COP Home Services Holdings, Inc. |
— | — | 5/13/2025 | 464 | ||||||||||||
| CRA MSO, LLC |
— | — | 8/31/2020 | 1,000 | ||||||||||||
| CRA MSO, LLC |
12/17/2023 | 120 | 12/17/2023 | 200 | ||||||||||||
| CRA MSO, LLC |
— | — | 5/13/2021 | 697 | ||||||||||||
| Crusoe Bidco Limited |
— | — | 12/2/2025 | 340 | ||||||||||||
| DFS Intermediate Holdings, LLC |
— | — | 9/18/2020 | 328 | ||||||||||||
| DFS Intermediate Holdings, LLC |
— | — | 3/31/2022 | 336 | ||||||||||||
| EiKo Global, LLC |
6/1/2023 | 750 | 6/1/2023 | 750 | ||||||||||||
| Empire Auto Parts, LLC |
9/5/2024 | 400 | 9/5/2023 | 400 | ||||||||||||
| Everlast Parent Inc. |
10/30/2022 | 3,412 | — | — | ||||||||||||
| Everlast Parent Inc. |
10/30/2026 | 1,611 | — | — | ||||||||||||
| GrapeTree Medical Staffing, LLC |
10/19/2022 | 450 | 10/19/2022 | 450 | ||||||||||||
| HCOS Group Intermediate III LLC |
9/30/2026 | 900 | — | — | ||||||||||||
| Hepaco, LLC |
8/18/2023 | 92 | 8/18/2023 | 257 | ||||||||||||
| Hepaco, LLC |
8/18/2024 | 112 | — | — | ||||||||||||
| Hercules Borrower LLC |
12/15/2026 | 2,222 | — | — | ||||||||||||
| HGH Purchaser, Inc. |
11/1/2021 | 557 | 11/1/2021 | 3,378 | ||||||||||||
| HGH Purchaser, Inc. |
11/3/2025 | 912 | 11/3/2025 | 828 | ||||||||||||
| Hospice Care Buyer, Inc. |
6/09/2021 | 2,679 | — | — | ||||||||||||
| Hospice Care Buyer, Inc. |
12/09/2026 | 1,386 | — | — | ||||||||||||
| Hospice Care Buyer, Inc. |
12/09/2026 | 1,668 | — | — | ||||||||||||
| Hsid Acquisition, LLC |
1/31/2026 | 750 | — | — | ||||||||||||
| Integrity Marketing Acquisition, LLC |
— | — | 10/15/2020 | 333 | ||||||||||||
| Integrity Marketing Acquisition, LLC |
— | — | 2/29/2020 | 1,576 | ||||||||||||
| Integrity Marketing Acquisition, LLC |
— | — | 2/27/2021 | 3,095 | ||||||||||||
| Integrity Marketing Acquisition, LLC |
8/27/2025 | 1,409 | 8/27/2025 | 1,409 | ||||||||||||
| ISS Compressors Industries, Inc. |
2/05/2026 | 833 | — | — | ||||||||||||
| IvyRehab Intermediate II, LLC |
12/04/2022 | 1,450 | — | — | ||||||||||||
| IvyRehab Intermediate II, LLC |
12/04/2024 | 500 | — | — | ||||||||||||
| Kestrel Parent, LLC |
11/13/2023 | 871 | 11/13/2023 | 871 | ||||||||||||
| Learn-It Systems, LLC |
3/18/2022 | 1,456 | 3/18/2022 | 2,288 | ||||||||||||
| Learn-It Systems, LLC |
3/18/2025 | 600 | 3/18/2025 | 108 | ||||||||||||
| Lightspeed Buyer, Inc. |
8/3/2021 | 648 | ||||||||||||||
| Lightspeed Buyer, Inc. |
2/03/2026 | 700 | ||||||||||||||
| List Partners, Inc. |
— | — | 7/6/2022 | 156 | ||||||||||||
| List Partners, Inc. |
1/5/2023 | 450 | 1/5/2023 | 450 | ||||||||||||
| Mann Lake Ltd. |
10/04/2024 | 60 | 10/4/2024 | 456 | ||||||||||||
| Maroon Group, LLC |
— | — | 8/31/2022 | 252 | ||||||||||||
| Midwest Industrial Rubber |
— | — | 12/2/2021 | 525 | ||||||||||||
| MRI Software LLC |
2/10/2022 | 519 | — | — | ||||||||||||
| MRI Software LLC |
2/10/2026 | 1,184 | — | — | ||||||||||||
| MRI Software LLC |
2/10/2026 | 1,266 | — | — | ||||||||||||
| New Mountain Learning |
— | — | 3/16/2024 | 125 | ||||||||||||
| Omni Ophthalmic Management Consultants, LLC |
— | — | 7/10/2019 | 1,150 | ||||||||||||
| Omni Ophthalmic Management Consultants, LLC |
— | — | 9/22/2021 | 850 | ||||||||||||
| Omni Ophthalmic Management Consultants, LLC |
2/28/2021 | 623 | — | — | ||||||||||||
| Ontario Systems, LLC |
9/5/2021 | 1,100 | 9/5/2021 | 1,100 | ||||||||||||
| Ontario Systems, LLC |
8/30/2025 | 300 | 8/30/2025 | 500 | ||||||||||||
| Pilot Air Freight, LLC |
— | — | 7/25/2020 | 1,200 | ||||||||||||
121
| December 31, 2020 | December 31, 2019 | |||||||||||||||
| Commitment Expiration Date (1) |
Unfunded Commitment(2) |
Commitment Expiration Date (1) |
Unfunded Commitment(2) |
|||||||||||||
| Pilot Air Freight, LLC |
7/25/2024 | 100 | 7/25/2024 | 100 | ||||||||||||
| Pinnacle Treatment Centers, Inc. |
1/17/2022 | 457 | — | — | ||||||||||||
| Pinnacle Treatment Centers, Inc. |
12/31/2022 | 571 | — | — | ||||||||||||
| POC Investors, LLC |
— | — | 11/10/2021 | 1,000 | ||||||||||||
| Potter Electric Signal Company |
12/19/2021 | 1,123 | 12/19/2021 | 1,113 | ||||||||||||
| Potter Electric Signal Company |
— | — | 12/19/2022 | 519 | ||||||||||||
| Potter Electric Signal Company |
12/19/2024 | 550 | — | — | ||||||||||||
| Prism Bidco, Inc. |
6/25/2026 | 833 | — | — | ||||||||||||
| PT Network, LLC |
11/30/2023 | 400 | 11/30/2023 | 400 | ||||||||||||
| Pye-Barker Fire & Safety, LLC |
— | — | 11/26/2021 | 3,750 | ||||||||||||
| Receivable Solutions, Inc. |
10/1/2024 | 300 | 10/1/2024 | 270 | ||||||||||||
| Right Networks, LLC |
11/4/2024 | 232 | 11/4/2024 | 233 | ||||||||||||
| Ruffalo Noel Levitz, LLC |
5/29/2022 | 60 | 5/29/2022 | 300 | ||||||||||||
| Safco Dental Supply, LLC |
6/14/2025 | 600 | 6/14/2025 | 600 | ||||||||||||
| Saturn Borrower Inc |
9/30/2026 | 1,513 | — | — | ||||||||||||
| SavATree, LLC |
6/2/2022 | 122 | 6/2/2020 | 745 | ||||||||||||
| SavATree, LLC |
6/2/2022 | 550 | 6/2/2022 | 550 | ||||||||||||
| Seniorlink Incorporated |
7/17/2026 | 1,037 | — | — | ||||||||||||
| Slickdeals Holdings, LLC |
6/12/2023 | 727 | 6/12/2023 | 727 | ||||||||||||
| Smile Brands, Inc. |
— | — | 10/12/2020 | 419 | ||||||||||||
| Smile Brands, Inc. |
10/12/2023 | 300 | 10/12/2023 | 260 | ||||||||||||
| Smile Doctors LLC |
— | — | 04/06/20 | 198 | ||||||||||||
| Smile Doctors LLC |
10/6/2022 | 1,070 | 10/6/2022 | 170 | ||||||||||||
| Southern HVAC Corporation |
10/30/2022 | 2,450 | — | — | ||||||||||||
| Southern HVAC Corporation |
10/30/2022 | 1,000 | — | — | ||||||||||||
| Spear Education |
2/3/2026 | 3,125 | — | — | ||||||||||||
| Teal Acquisition Co., Inc |
9/22/2026 | 1,642 | — | — | ||||||||||||
| Teal Acquisition Co., Inc |
9/22/2026 | 1,004 | — | — | ||||||||||||
| The Hilb Group, LLC |
— | — | 12/2/2021 | 1,020 | ||||||||||||
| The Hilb Group, LLC |
12/2/2025 | 340 | — | — | ||||||||||||
| Teaching Strategies LLC |
5/14/2024 | 629 | 5/14/2024 | 447 | ||||||||||||
| THG Acquisition, LLC |
12/15/2022 | 1,728 | — | — | ||||||||||||
| THG Acquisition, LLC |
12/02/2025 | 142 | — | — | ||||||||||||
| Transportation Insight, LLC |
— | — | 12/18/2020 | 576 | ||||||||||||
| Transportation Insight, LLC |
12/3/2024 | 750 | 12/3/2024 | 750 | ||||||||||||
| Tranzonic |
3/27/2023 | 110 | 3/27/2023 | 550 | ||||||||||||
| Trinity Partners, LLC |
2/21/2023 | 450 | 2/21/2023 | 450 | ||||||||||||
| Unifeye Vision Partners |
9/13/2021 | 2,237 | 9/13/2021 | 3,050 | ||||||||||||
| Unifeye Vision Partners |
9/13/2025 | 1,247 | 9/13/2025 | 1,473 | ||||||||||||
| UP Acquisition Corp |
— | — | 1/31/2020 | 1,624 | ||||||||||||
| UP Acquisition Corp |
5/23/2024 | 859 | 5/23/2024 | 1,177 | ||||||||||||
| Winxnet Holdings LLC |
— | — | 6/29/2020 | 400 | ||||||||||||
| Winxnet Holdings LLC |
6/29/2023 | 160 | 6/29/2023 | 320 | ||||||||||||
| Wrench Group LLC |
— | — | 4/30/2021 | 1,035 | ||||||||||||
| Crusoe Bidco Limited |
12/10/2025 | 538 | 12/5/2020 | 2,977 | ||||||||||||
| Crusoe Bidco Limited |
12/10/2025 | 169 | 12/10/2025 | 2,233 | ||||||||||||
| VetStrategy |
7/31/2027 | 347 | — | — | ||||||||||||
| VetStrategy |
7/31/2027 | 2,355 | — | — | ||||||||||||
| Vital Care Buyer, LLC |
10/19/2025 | 2,222 | — | — | ||||||||||||
| PharComp Parent B.V. |
2/20/2026 | 2,056 | 2/20/2026 | 2,096 | ||||||||||||
|
|
|
|
|
|||||||||||||
| Total Senior Secured and Unitranche First Lien |
78,405 | 72,613 | ||||||||||||||
|
|
|
|
|
|
|
|
|
|||||||||
| Senior Secured Second Lien |
||||||||||||||||
| Service Logic Acquisition, Inc |
10/30/2022 | 2,432 | — | — | ||||||||||||
| NMN Holdings III Corp. |
— | — | 11/13/2020 | 1,667 | ||||||||||||
|
|
|
|
|
|||||||||||||
| Total Senior Secured Second Lien |
2,432 | 1,667 | ||||||||||||||
|
|
|
|
|
|
|
|
|
|||||||||
| LLC/LP Equity Interests |
||||||||||||||||
| CBDC Senior Loan Fund LLC |
— | $ | — | — | $ | 6,000 | ||||||||||
| GACP II LP |
— | — | — | 2,465 | ||||||||||||
|
|
|
|
|
|||||||||||||
| Total LLC/LP Equity Interests |
— | — | — | 8,465 | ||||||||||||
|
|
|
|
|
|
|
|
|
|||||||||
| Total |
$ | 80,837 | $ | 82,745 | ||||||||||||
|
|
|
|
|
|
|
|
|
|||||||||
122
| (1) | Commitments are generally subject to borrowers meeting certain criteria such as compliance with covenants and certain operational metrics. These amounts may remain outstanding until the commitment period of an applicable loan expires, which may be shorter than its maturity. |
| (2) | Unfunded commitments denominated in currencies other than USD have been converted to USD using the applicable foreign currency exchange rate as of December 31, 2020 and December 31, 2019. |
As of December 31, 2020, the Company believes that there is sufficient assets and liquidity to adequately cover future obligations under unfunded commitments. The cash and restricted cash balances, availability under the credit facilities and ongoing investment realizations are expected to provide sufficient liquidity. In addition, broadly syndicated loans in the portfolio could be sold over a relatively short period to generate liquidity.
Other Commitments and Contingencies
In the normal course of business, the Company enters into contracts which provide a variety of representations and warranties, and that provide general indemnifications. Such contracts include those with certain service providers, brokers and trading counterparties. Any exposure to the Company under these arrangements is unknown as it would involve future claims that may be made against the Company; however, based on the Company’s experience, the risk of loss is remote and no such claims are expected to occur. As such, the Company has not accrued any liability in connection with such indemnifications.
Note 9. Stockholders’ Equity
The Company authorized 200,000,000 shares of its common stock with a par value of $0.001 per share. The Company has authorized 10,000 shares of its preferred stock with a par value of $0.001 per share. To date, no shares of preferred stock have been issued.
Between June 26, 2015, commencement of operations, and January 31, 2020, the date of Alcentra Acquisition, the Company entered into subscription agreements (collectively, the “Subscription Agreements”) with several investors, including Crescent, providing for the private placement of its common shares. Pursuant to the Subscription Agreements, between June 26, 2015 and January 31, 2020, the Company issued 23,127,335 common shares for aggregate proceeds of $456,297, of which $10,000 was from Crescent. Proceeds from the issuances were used to fund investing activities and for other general corporate purposes. Additionally, on January 31, 2020, the Company issued 5,203,016 shares in connection with the Alcentra Acquisition. Upon closing of the Alcentra Acquisition, all unfunded commitments of stockholders subscribing in a private offering were terminated.
For the years ended December 31, 2020, 2019 and 2018, the Company issued 30,128, 76,969 and 29,914 new common shares, respectively, in connection with its dividend reinvestment plan.
The following table summarizes the Company’s recent distributions declared:
| Date Declared |
Record Date |
Payment Date |
Amount Per Share | |||||
| November 4, 2020 |
December 31, 2020 | January 15, 2021 | $ | 0.41 | ||||
| August 7, 2020 |
September 30, 2020 | October 15, 2020 | $ | 0.41 | ||||
| May 11, 2020 |
June 30, 2020 | July 15, 2020 | $ | 0.41 | ||||
| March 3, 2020 |
March 31, 2020 | April 15, 2020 | $ | 0.41 | ||||
| November 8, 2019 |
December 30, 2019 | January 17, 2020 | $ | 0.41 | ||||
| September 27, 2019 |
September 27, 2019 | October 18, 2019 | $ | 0.41 | ||||
| June 28, 2019 |
June 28, 2019 | July 18, 2019 | $ | 0.41 | ||||
| March 29, 2019 |
March 29, 2019 | April 12, 2019 | $ | 0.41 | ||||
| December 31, 2018 |
December 31, 2018 | January 15, 2019 | $ | 0.40 | ||||
| September 27, 2018 |
September 28, 2018 | October 12, 2018 | $ | 0.38 | ||||
| June 19, 2018 |
June 20, 2018 | July 13, 2018 | $ | 0.37 | ||||
| March 29, 2018 |
March 30, 2018 | April 13, 2018 | $ | 0.32 | ||||
At December 31, 2020 and December 31, 2019, Crescent owned 2.11% and 2.23%, respectively, of the outstanding common shares of the Company.
Note 10. Earnings Per Share
In accordance with the provisions of ASC 260 – Earnings per Share (“ASC 260”), basic earnings per share is computed by dividing earnings available to common stockholders by the weighted average number of shares outstanding during the period. Other potentially dilutive common shares, and the related impact to earnings, are considered when calculating earnings per share on a diluted basis. As of December 31, 2020 and December 31, 2019, there are no dilutive shares.
123
The following table sets forth the computation of the weighted average basic and diluted net increase in net assets per share from operations for the following periods (in thousands):
| For the year ended December 31, 2020 |
For the year ended December 31, 2019 |
For the year ended December 31, 2018 |
||||||||||
| Net increase (decrease) in net assets resulting from operations |
$ | 54,672 | $ | 29,279 | $ | 8,115 | ||||||
| Weighted average common shares outstanding |
27,681,757 | 17,344,640 | 10,719,485 | |||||||||
| Net increase (decrease) in net assets resulting from operations per common share-basic and diluted |
$ | 1.98 | $ | 1.69 | $ | 0.76 | ||||||
Note 11. Income Taxes
The tax character of shareholder distributions attributable to the years ended December 31, 2020, 2019 and 2018, were as follows (in thousands):
| 2020 | 2019 | 2018 | ||||||||||
| Ordinary Income (1) |
$ | 46,216 | $ | 29,258 | $ | 16,720 | ||||||
| Capital Gains |
— | — | — | |||||||||
|
|
|
|
|
|
|
|||||||
| Total |
$ | 46,216 | $ | 29,258 | $ | 16,720 | ||||||
|
|
|
|
|
|
|
|||||||
| (1) | For years ended December 31, 2020, 2019 and 2018, 98.0%, 100% and 100%, respectively, of ordinary income qualified as interest related dividend which is exempt from U.S. withholding tax applicable to non U.S. shareholders. |
For the years ended December 31, 2020, 2019 and 2018, the components of distributable earnings on a tax basis detailed below differ from the amounts reflected in the Company’s Consolidated Statements of Assets and Liabilities by temporary and other book/tax differences, primarily relating to the tax treatment of wash sales, organizational expenses, partnership basis adjustments, forward contracts mark to market and defaulted bond income accruals is as follows (in thousands):
| 2020 | 2019 | 2018 | ||||||||||
| Undistributed net investment income |
$ | 8,439 | $ | 6,685 | $ | 2,454 | ||||||
| Other temporary differences |
(456 | ) | (465 | ) | (366 | ) | ||||||
| Post October loss deferrals |
— | — | — | |||||||||
| Capital loss carryover (1) |
(63,271 | ) | (8,716 | ) | (916 | ) | ||||||
| Unrealized appreciation (depreciation) |
20,630 | (4,901 | ) | (7,630 | ) | |||||||
|
|
|
|
|
|
|
|||||||
| Components of tax distributable earnings at year end |
$ | (34,658 | ) | $ | (7,397 | ) | $ | (6,458 | ) | |||
|
|
|
|
|
|
|
|||||||
| (1) | Capital loss carryforward is subject to limitations under IRC Sections 382 & 383. |
Note: Taxable income is an estimate and is not fully determined until the Company’s tax return is filed.
Taxable income generally differs from net increase (decrease) in net assets resulting from operations due to temporary and permanent differences in the recognition of income and expenses, and generally excludes net unrealized gains or losses, as unrealized gains or losses are generally not included in taxable income until they are realized.
The Company makes certain adjustments to the classification of stockholders’ equity as a result of permanent book-to-tax differences, which include differences in the book and tax basis of certain assets and liabilities, and nondeductible federal taxes or losses among other items. To the extent these differences are permanent, they are charged or credited to additional paid in capital, undistributed net investment income or undistributed net realized gains on investments, as appropriate.
The Company neither has any uncertain tax positions that met the recognition or measurement criteria of ASC 740-10-25, Income Taxes, nor did the Company have any unrecognized tax benefits as of the periods presented herein. Although the Company files federal and state tax returns, the Company’s major tax jurisdiction is federal. The Company’s inception-to-date federal tax returns remain subject to examination by the Internal Revenue Service. A portion of losses acquired from Alcentra Capital may be subject to limitations under the Internal Revenue Code.
124
Permanent differences between Investment Company Taxable Income (“ICTI”) and net investment income for financial reporting purposes are reclassified among capital accounts in the financial statements to reflect their tax character. Differences in classification may also result from the treatment of short-term gains as ordinary income for tax purposes. For the years ended December 31, 2020, 2019 and 2018, the Company reclassified for book purposes amounts arising from permanent book/tax differences related to the different tax treatment of foreign currency gain/(loss), defaulted bonds and non-deductible-excise tax as follows (in thousands):
| 2020 | 2019 | 2018 | ||||||||||
| Accumulated net realized gain (loss) |
$ | (35,651 | ) | $ | (1,379 | ) | $ | 670 | ||||
| Distributions in excess of Investment Company Taxable Income |
(94 | ) | 419 | (558 | ) | |||||||
|
|
|
|
|
|
|
|||||||
| Total |
$ | 35,745 | $ | 960 | $ | (112 | ) | |||||
|
|
|
|
|
|
|
|||||||
The tax cost of the Company’s investments as of December 31, 2020, approximates their amortized cost.
As of December 31, 2020 and December 31, 2019, the Company’s aggregate investment unrealized appreciation and depreciation for federal income tax purposes was (in thousands):
| As of December 31, 2020 |
As of December 31, 2019 |
|||||||
| Tax cost |
$ | 1,038,153 | $ | 730,999 | ||||
|
|
|
|
|
|||||
| Gross unrealized appreciation |
$ | 26,684 | $ | 14,809 | ||||
| Gross unrealized depreciation |
(30,836 | ) | (19,277 | ) | ||||
|
|
|
|
|
|||||
| Net unrealized investment appreciation (depreciation) |
$ | (4,152 | ) | $ | (4,468 | ) | ||
|
|
|
|
|
|||||
Note 12. Financial Highlights
Below is the schedule of financial highlights of the Company for the years ended December 31, 2020, 2019, 2018, 2017 and 2016 relating to the common shares issued through December 31, 2020 pursuant to the Subscription Agreements (in thousands, except share and per share data):
| For the year ended December 31, 2020 |
For the year ended December 31, 2019 |
For the year ended December 31, 2018 |
For the year ended December 31, 2017 |
For the year ended December 31, 2016 |
||||||||||||||||
| Per Share Data:(1) |
||||||||||||||||||||
| Net asset value, beginning of period |
$ | 19.50 | $ | 19.43 | $ | 20.10 | $ | 20.08 | $ | 19.13 | ||||||||||
| Net investment income after tax |
1.80 | 1.83 | 1.65 | 1.31 | 1.23 | |||||||||||||||
| Net realized and unrealized gains (losses) on investments, asset acquisition and forward contracts, net of taxes |
0.18 | (0.14 | ) | (0.89 | ) | (0.11 | ) | 1.04 | ||||||||||||
|
|
|
|
|
|
|
|
|
|
|
|||||||||||
| Net increase (decrease) in net assets resulting from operations |
1.98 | 1.69 | 0.76 | 1.20 | 2.27 | |||||||||||||||
|
|
|
|
|
|
|
|
|
|
|
|||||||||||
| Effect of equity issuances, net of share repurchases |
0.04 | 0.03 | 0.06 | 0.02 | (0.20 | ) | ||||||||||||||
| Distributions declared from net investment income(2) |
(1.64 | ) | (1.64 | ) | (1.47 | ) | (1.18 | ) | (1.10 | ) | ||||||||||
| Offering costs |
— | (0.01 | ) | (0.02 | ) | (0.02 | ) | (0.02 | ) | |||||||||||
|
|
|
|
|
|
|
|
|
|
|
|||||||||||
| Total increase (decrease) in net assets |
0.38 | 0.07 | (0.67 | ) | 0.02 | 0.95 | ||||||||||||||
|
|
|
|
|
|
|
|
|
|
|
|||||||||||
| Net asset value, end of period |
$ | 19.88 | $ | 19.50 | $ | 19.43 | $ | 20.10 | $ | 20.08 | ||||||||||
125
| For the year ended December 31, 2020 |
For the year ended December 31, 2019 |
For the year ended December 31, 2018 |
For the year ended December 31, 2017 |
For the year ended December 31, 2016 |
||||||||||||||||
| Shares outstanding, end of period |
28,167,360 | 20,862,314 | 13,358,289 | 8,597,116 | 6,376,850 | |||||||||||||||
| Market value, end of period |
$ | 14.57 | $ | — | $ | — | $ | — | $ | — | ||||||||||
| Weighted average shares outstanding |
27,681,757 | 17,344,640 | 10,719,485 | 7,562,447 | 5,191,589 | |||||||||||||||
| Total return based on market value(3) |
1.47 | % | — | % | — | % | — | % | — | % | ||||||||||
| Total return based on net asset value(4) |
10.36 | % | 8.81 | % | 4.06 | % | 5.99 | % | 10.70 | % | ||||||||||
| Ratio/Supplemental Data: |
||||||||||||||||||||
| Net assets, end of period |
$ | 560,000 | $ | 406,917 | $ | 259,579 | $ | 172,800 | $ | 128,056 | ||||||||||
| Ratio of total net expenses to average net assets(5)(6) |
5.34 | % | 6.54 | % | 7.33 | % | 8.02 | % | 7.17 | % | ||||||||||
| Ratio of net expenses (without incentive fees and interest and other debt expenses) to average net assets(6) |
2.24 | % | 2.50 | % | 3.06 | % | 3.53 | % | 4.08 | % | ||||||||||
| Ratio of net investment income before taxes to average net assets(6) |
10.10 | % | 9.61 | % | 8.48 | % | 6.45 | % | 6.14 | % | ||||||||||
| Ratio of interest and credit facility expenses to average net assets(7) |
3.10 | % | 4.03 | % | 4.01 | % | 3.44 | % | 2.59 | % | ||||||||||
| Ratio of net incentive fees to average net assets |
— | % | — | % | 0.26 | % | 1.05 | % | 0.50 | % | ||||||||||
| Ratio of portfolio turnover to average investments at fair value |
28.01 | % | 23.97 | % | 27.89 | % | 19.27 | % | 34.36 | % | ||||||||||
| Weighted average debt outstanding |
$ | 421,066 | $ | 275,905 | $ | 182,328 | $ | 133,486 | $ | 78,294 | ||||||||||
| Asset coverage ratio |
217 | % | 225 | % | 209 | % | 214 | % | 236 | % | ||||||||||
| (1) | Based on actual number of shares outstanding at the end of the corresponding period or the weighted average shares outstanding for the period, unless otherwise noted, as appropriate. |
| (2) | The per share data for distributions per share reflects the actual amount of distributions declared per share for the applicable periods. |
| (3) | Total return based on market value is calculated as the change in market value per share during the period, taking into account dividends, if any, reinvested in accordance with the Company’s dividend reinvestment plan. The beginning market value per share is based on the market price of $16.40 per share on February 3, 2020, the date of the Company’s listing on NASDAQ, and not annualized. |
| (4) | Total return based on net asset value is calculated as the change in net asset value per share during the period plus declared dividends per share during the period, divided by the beginning net asset value per share. |
| (5) | The ratio of total expenses to average net assets in the table above reflects the Adviser’s voluntary waivers of its right to receive a portion of the management fees and income incentive fees with respect to the Company’s ownership in GACP II. Excluding the effects of waivers, the ratio of total expenses to average net assets would have been 5.37%, 6.58% and 7.36% for the years ended December 31, 2020, 2019 and 2018, respectively. The GACP II investment was made in 2018, and as such, the 2017 and 2016 ratios were not affected. |
| (6) | Annualized except for organization expenses. |
| (7) | Annualized. |
126
Note 13. Selected Quarterly Financial Data (Unaudited)
| Quarter Ended December 31, 2020 |
Quarter Ended September 30, 2020 |
Quarter Ended June 30, 2020 |
Quarter Ended March 31, 2020 |
|||||||||||||
| Investment income |
$ | 20,281 | $ | 18,674 | $ | 19,327 | $ | 18,831 | ||||||||
| Net expenses |
7,057 | 6,335 | 6,260 | 7,040 | ||||||||||||
|
|
|
|
|
|
|
|
|
|||||||||
| Net investment income before taxes |
13,224 | 12,339 | 13,067 | 11,791 | ||||||||||||
| Income and excise taxes |
61 | 131 | 111 | 238 | ||||||||||||
|
|
|
|
|
|
|
|
|
|||||||||
| Net investment income after taxes |
13,163 | 12,208 | 12,956 | 11,553 | ||||||||||||
|
|
|
|
|
|
|
|
|
|||||||||
| Net realized and unrealized gains (losses) |
21,586 | 26,294 | 43,654 | (82,728 | ) | |||||||||||
| Realized loss on asset acquisition |
— | — | — | (3,825 | ) | |||||||||||
| Benefit/(Provision) for taxes on realized gain on investments |
46 | — | — | — | ||||||||||||
| Benefit/(Provision) for taxes on unrealized appreciation (depreciation) on investments |
(336 | ) | (161 | ) | (193 | ) | 455 | |||||||||
| Net increase (decrease) in net assets resulting from operations after tax |
$ | 34,459 | $ | 38,341 | $ | 56,417 | $ | (74,545 | ) | |||||||
|
|
|
|
|
|
|
|
|
|||||||||
| Net investment income per share (basic and diluted) |
$ | 0.47 | $ | 0.43 | $ | 0.46 | $ | 0.44 | ||||||||
|
|
|
|
|
|
|
|
|
|||||||||
| Net increase (decrease) in net assets resulting from operations per share (basic and diluted) |
$ | 1.22 | $ | 1.36 | $ | 2.00 | $ | (2.84 | ) | |||||||
|
|
|
|
|
|
|
|
|
|||||||||
| Weighted average shares outstanding |
28,167,360 | 28,167,360 | 28,168,643 | 26,212,991 | ||||||||||||
|
|
|
|
|
|
|
|
|
|||||||||
| Net asset value per share |
$ | 19.88 | $ | 19.07 | $ | 18.12 | $ | 16.52 | ||||||||
|
|
|
|
|
|
|
|
|
|||||||||
| Quarter Ended December 31, 2019 |
Quarter Ended September 30, 2019 |
Quarter Ended June 30, 2019 |
Quarter Ended March 31, 2019 |
|||||||||||||
| Investment income |
$ | 14,667 | $ | 14,836 | $ | 12,519 | $ | 11,455 | ||||||||
| Total expenses |
6,232 | 5,659 | 5,140 | 4,624 | ||||||||||||
|
|
|
|
|
|
|
|
|
|||||||||
| Net investment income before taxes |
8,435 | 9,177 | 7,379 | 6,831 | ||||||||||||
| Income and excise taxes |
125 | 9 | 3 | 2 | ||||||||||||
|
|
|
|
|
|
|
|
|
|||||||||
| Net investment income after taxes |
8,310 | 9,168 | 7,376 | 6,829 | ||||||||||||
|
|
|
|
|
|
|
|
|
|||||||||
| Net realized and unrealized gains |
584 | (6,415 | ) | 1,167 | 2,481 | |||||||||||
| Provision for taxes on realized gain on investments |
(67 | ) | ||||||||||||||
|
|
|
|
|
|
|
|
|
|||||||||
| Benefit/(Provision) for taxes on unrealized appreciation (depreciation) on investments |
352 | (26 | ) | (31 | ) | (449 | ) | |||||||||
|
|
|
|
|
|
|
|
|
|||||||||
| Net increase in net assets resulting from operations after tax |
$ | 9,179 | $ | 2,727 | $ | 8,512 | $ | 8,861 | ||||||||
|
|
|
|
|
|
|
|
|
|||||||||
| Net investment income per share (basic and diluted) |
$ | 0.41 | $ | 0.49 | $ | 0.47 | $ | 0.47 | ||||||||
|
|
|
|
|
|
|
|
|
|||||||||
| Net increase in net assets resulting from operations per share (basic and diluted) |
$ | 0.45 | $ | 0.15 | $ | 0.54 | $ | 0.61 | ||||||||
|
|
|
|
|
|
|
|
|
|||||||||
| Weighted average shares outstanding |
20,320,131 | 18,810,099 | 15,703,473 | 14,464 ,405 | ||||||||||||
|
|
|
|
|
|
|
|
|
|||||||||
| Net asset value per share |
$ | 19.50 | $ | 19.48 | $ | 19.75 | $ | 19.63 | ||||||||
|
|
|
|
|
|
|
|
|
|||||||||
| Quarter Ended December 31, 2018 |
Quarter Ended September 30, 2018 |
Quarter Ended June 30, 2018 |
Quarter Ended March 31, 2018 |
|||||||||||||
| Investment income |
$ | 10,509 | $ | 8,724 | $ | 7,251 | $ | 6,811 | ||||||||
| Total expenses |
4,426 | 3,848 | 3,504 | 3,667 | ||||||||||||
|
|
|
|
|
|
|
|
|
|||||||||
| Net investment income before taxes |
6,083 | 4,876 | 3,747 | 3,144 | ||||||||||||
| Income and excise taxes |
114 | 1 | 7 | (1 | ) | |||||||||||
|
|
|
|
|
|
|
|
|
|||||||||
| Net investment income after taxes |
5,969 | 4,875 | 3,740 | 3,145 | ||||||||||||
|
|
|
|
|
|
|
|
|
|||||||||
| Net realized and unrealized gains (losses) |
(7,671 | ) | (82 | ) | (1,439 | ) | (334 | ) | ||||||||
| Benefit/(Provision) for taxes on unrealized appreciation (depreciation) on investments |
(105 | ) | 12 | (26 | ) | 31 | ||||||||||
|
|
|
|
|
|
|
|
|
|||||||||
| Net increase (decrease) in net assets resulting from operations after tax |
$ | (1,807 | ) | $ | 4,805 | $ | 2,275 | $ | 2,842 | |||||||
|
|
|
|
|
|
|
|
|
|||||||||
| Net investment income per share (basic and diluted) |
$ | 0.47 | $ | 0.43 | $ | 0.38 | $ | 0.36 | ||||||||
|
|
|
|
|
|
|
|
|
|||||||||
| Net increase (decrease) in net assets resulting from operations per share (basic and diluted) |
$ | (0.14 | ) | $ | 0.42 | $ | 0.23 | $ | 0.32 | |||||||
|
|
|
|
|
|
|
|
|
|||||||||
| Weighted average shares outstanding |
12,725,993 | 11,394,307 | 9,902,467 | 8,805,686 | ||||||||||||
|
|
|
|
|
|
|
|
|
|||||||||
| Net asset value per share |
$ | 19.43 | $ | 19.97 | $ | 19.93 | $ | 20.08 | ||||||||
|
|
|
|
|
|
|
|
|
|||||||||
Note 14. Alcentra Acquisition
On August 12, 2019, the Company entered into an Agreement and Plan of Merger (as amended on September 27, 2019, the “Merger Agreement”) to acquire Alcentra Capital Corporation (“Alcentra Capital”) in a cash and stock transaction (the “Alcentra Acquisition”).
127
In connection with the Alcentra Acquisition, which was completed on January 31, 2020, each share of Alcentra Capital common stock issued and outstanding immediately prior to the effective time of the Alcentra Acquisition was converted into the right to receive from the Company, in accordance with the Merger Agreement, (a) approximately $1.50 per share in cash consideration less $0.80 per share spillover dividend declared by Alcentra Capital, and (b) stock consideration at the fixed exchange ratio of 0.4041 shares, par value $0.001 per share, of the Company’s common stock (the “Exchange Ratio”) (and, if applicable, cash in lieu of fractional shares of the Company’s common stock). The Exchange Ratio was fixed on the date of the Merger Agreement, and was not subject to adjustment based on changes in the trading price of Alcentra Capital’s common stock before the closing of the Alcentra Acquisition. Based on the number of shares of Alcentra Capital common stock outstanding on the date of the merger, approximately 5,203,016 of the Company’s shares of common stock were exchanged for approximately 12,875,566 outstanding shares of Alcentra Capital common stock, subject to adjustment in certain limited circumstances. Upon closing of the Alcentra Acquisition, all unfunded commitments of stockholders subscribing in a private offering were terminated.
Additionally, on August 12, 2019, the Company entered into an agreement with the Adviser in connection with the Alcentra Acquisition. Under the terms of the Transaction Support Agreement, in connection with the consummation of the Alcentra Acquisition the Adviser (a) provided cash consideration of approximately $1.68 per share of Alcentra Capital common stock, payable to Alcentra Capital stockholders in accordance with the terms and conditions set forth in the Merger Agreement at closing, (b) entered into an amendment to the Investment Advisory Agreement to (i) permanently reduce the management fee from 1.5% to 1.25%, (ii) increase the incentive fee hurdle from 6% to 7% annualized, (iii) waive a portion of the management fee from February 1, 2020 through July 31, 2021 after the transaction so that only 0.75% shall be charged for such time period, and (iv) waive the income based portion of the incentive fee from February 1, 2020 through July 31, 2021 after the transaction and (c) fund up to $1,419 of expenses that the Company incurs in connection with completing the Alcentra Acquisition.
The merger of Alcentra Capital with and into Crescent Capital BDC was accounted for as an asset acquisition in accordance with ASC 805-50, Business Combinations-Related Issues. Accordingly, transaction expenses of $7,250, net of Adviser transaction support of $1,419, were included in total consideration paid, and no goodwill was recognized.
In evaluating whether the merger was an asset acquisition or business combination, the Company considered (i) whether substantially all of the fair value of the gross assets acquired was concentrated in a single identifiable asset or group of similar identifiable assets; and (ii) whether the set of acquired assets included at least one substantive process. Since the acquired assets consisted of similar classes of financial assets, and since the Company did not acquire an organized workforce or other substantive processes in the transaction, it was deemed to be an asset acquisition.
Total consideration paid by the Company, including transaction costs related to the merger, of $118,256 was allocated to the acquired assets and assumed liabilities based upon their relative fair values as of the closing date, subject to the limitation that certain “non-qualifying” assets, including financial instruments, could not be assigned an amount greater than their fair values. As a result of this limitation, total consideration paid by the Company exceeded the fair value of the net assets acquired by $3,825, which has been presented as a realized loss in the Company’s Consolidated Statement of Operations for the year ended December 31, 2020. The Company estimated the fair value of the assets acquired and liabilities assumed in accordance with ASC 820; the methodologies utilized to make these estimates were consistent with those used by the Company in estimating the fair value of its own assets and liabilities.
The following table summarizes the allocation of the purchase price to the assets acquired and liabilities assumed as a result of the Alcentra Acquisition (in thousands):
| Consideration Paid by the Company |
||||
| Common stock issued by the Company(1) |
$ | 101,963 | ||
| Cash Consideration paid by the Company |
9,043 | |||
| Transaction costs |
7,250 | |||
|
|
|
|||
| Total Purchase Price |
$ | 118,256 | ||
|
|
|
|||
| Assets (Liabilities) Acquired |
||||
| Investment portfolio (2) |
$ | 195,682 | ||
| Cash |
3,409 | |||
| Portfolio receivables |
1,003 | |||
| Other receivable |
395 | |||
| InterNotes® |
(50,271 | ) | ||
| Secured credit facility |
(34,558 | ) | ||
| Borrowing expense payable |
(834 | ) | ||
128
| Other payables |
(395 | ) | ||
|
|
|
|||
| Net Assets Acquired |
$ | 114,431 | ||
|
|
|
|||
| Realized loss on asset acquisition |
$ | 3,825 | ||
|
|
|
| (1) | Common stock consideration was issued at the Company’s Net Asset Value of $19.60 at the date of the Alcentra Acquisition. |
| (2) | Investments acquired were recorded at fair value at the date of the acquisition, which is also the Company’s initial cost basis. |
Note 15. Stock Repurchase Program
On January 31, 2020, the Company entered into a $20,000 repurchase plan which allowed it to purchase shares in the open market any time the Company’s common stock trades below ninety percent (90%) of its most recently disclosed net asset value per share. The plan was subject to compliance with the Company’s liquidity, covenant, leverage and regulatory requirements. Pursuant to the terms of the repurchase plan, repurchases began on March 2, 2020. On April 9, 2020, the Company’s Board of Directors unanimously approved the termination of the Company’s stock repurchase program.
The following table summarizes share repurchases under the Company’s stock repurchase program for the year ended December 31, 2020. There were no share repurchases for the years ended December 31, 2019 and December 31, 2018 (in thousands, except share and per share data).
| Year Ended December 31, 2020 |
||||
| Dollar amount repurchased |
$ | 2,208 | ||
| Shares repurchased |
192,415 | |||
| Average price per share including commission |
$ | 11.48 | ||
| Weighted average discount to net asset value |
40.89% (1) | |||
| (1) | Weighted average discount is calculated using the December 31, 2019 proforma combined NAV of $19.42 per share assuming the effect of the Alcentra Acquisition. |
Note 16. Subsequent Events
The Company’s management evaluated subsequent events through the date of issuance of the consolidated financial statements included herein. Other than the items below, there have been no subsequent events that occurred during such period that would require disclosure in this Form 10-K or would be required to be recognized in the consolidated financial statements as of December 31, 2020 and for the year ended December 31, 2020.
On January 5, 2021, Sun Life Financial Inc. acquired a majority interest in Crescent. Consummation of the Sun Life Transaction resulted in a change of control of Crescent. There were no changes to the Company’s investment objective, strategies and process or to the Crescent team responsible for the investment operations of the Company as a result of the Sun Life Transaction.
On February 15, 2021, $5,401 of InterNotes® matured and were redeemed at par. The Company provided notice to redeem the remaining $11,017 of InterNotes® which is expected to be paid off on March 19, 2021.
On February 17, 2021, the Company completed a private offering of $135,000 aggregate principal amount of 4.00% senior unsecured notes due February 17, 2026 (the “2026 Unsecured Notes”). The 2026 Unsecured Notes have a delayed draw feature. The initial issuance of $50,000 of Unsecured Notes closed February 17, 2021. The issuance of the remaining $85,000 of 2026 Unsecured Notes is expected to close on or before May 17, 2021.
On February 22, 2021, the Company’s Board of Directors declared a regular cash dividend of $0.41 per share, which will be paid on April 15, 2021 to stockholders of record as of March 31, 2021
On February 22, 2021, the Adviser notified the Board of Directors of its intent to voluntarily waive incentive fees to the extent net investment income falls short of the declared dividend on a full dollar basis. The waiver will become effective upon expiration of the current waivers on July 31, 2021 and will continue through December 31, 2022.
129
| ITEM 9. | CHANGES IN DISAGREEMENTS WITH ACCOUNTANTS ON ACCOUNTING AND FINANCIAL DISCLOSURE |
None.
| ITEM 9A. | CONTROLS AND PROCEDURES |
(a) Evaluation of Disclosure Controls and Procedures
We maintain disclosure controls and procedures (as that term is defined in Rules 13a-15(e) and 15d-15(e) under the Exchange Act) that are designed to ensure that information required to be disclosed in our reports under the Exchange Act is recorded, processed, summarized and reported within the time periods specified in the SEC’s rules and forms, and that such information is accumulated and communicated to our management, including our principal executive officer and principal financial officer, as appropriate, to allow timely decisions regarding required disclosures. Any controls and procedures, no matter how well designed and operated, can provide only reasonable assurance of achieving the desired control objectives. Our management, with the participation of our principal executive officer and principal financial officer, has evaluated the effectiveness of the design and operation of our disclosure controls and procedures as of December 31, 2020. Based upon that evaluation and subject to the foregoing, our principal executive officer and principal financial officer concluded that, as of December 31, 2020, the design and operation of our disclosure controls and procedures were effective to accomplish their objectives at the reasonable assurance level.
(b) Management’s Report on Internal Control Over Financial Reporting
Our management is responsible for establishing and maintaining adequate internal control over financial reporting for the Company. Internal control over financial reporting is a process to provide reasonable assurance regarding the reliability of our financial reporting for external purposes in accordance with accounting principles generally accepted in the United States of America. Internal control over financial reporting includes maintaining records that in reasonable detail accurately and fairly reflect our transactions; providing reasonable assurance that transactions are recorded as necessary for preparation of our consolidated financial statements; providing reasonable assurance that receipts and expenditures of company assets are made in accordance with management authorization; and providing reasonable assurance that unauthorized acquisition, use or disposition of company assets that could have a material effect on our consolidated financial statements would be prevented or detected on a timely basis. Because of its inherent limitations, internal control over financial reporting is not intended to provide absolute assurance that a material misstatement of our consolidated financial statements would be prevented or detected.
Management conducted an evaluation of the effectiveness of our internal control over financial reporting based on the framework in Internal Control — Integrated Framework (2013) issued by the Committee of Sponsoring Organizations of the Treadway Commission. Based on this evaluation, management concluded that the Company’s internal control over financial reporting was effective as of December 31, 2020.
(c) Attestation Report of the Registered Public Accounting Firm. This Annual Report on Form 10-K does not include an attestation report of the company’s registered public accounting firm pursuant to the rules of the SEC.
(d) Changes in Internal Control over Financial Reporting. There have been no changes in our internal control over financial reporting (as defined in Rules 13a-15(f) and 15d-15(f) under the Exchange Act) during the quarter ended December 31, 2020, that have materially affected, or that are reasonably likely to materially affect, our internal control over financial reporting.
| ITEM 9B. | OTHER INFORMATION |
None.
130
We will file a definitive Proxy Statement for our 2021 Annual Meeting of Stockholders with the Securities and Exchange Commission pursuant to Regulation 14A, no later than 120 days after the end of our fiscal year. Accordingly, certain information required by Part III has been omitted under General Instruction G(3) to Form 10-K. Only those sections of our definitive Proxy Statement that specifically address the items set forth herein are incorporated by reference.
| ITEM 10. | DIRECTORS, EXECUTIVE OFFICERS AND CORPORATE GOVERNANCE |
The information required by this item will be contained in the Company’s definitive Proxy Statement for its 2021 Annual Stockholder Meeting, to be filed with the SEC within 120 days after December 31, 2020, and is incorporated herein by reference.
| ITEM 11. | EXECUTIVE COMPENSATION |
The information required by this item will be contained in the Company’s definitive Proxy Statement for its 2021 Annual Stockholder Meeting, to be filed with the SEC within 120 days after December 31, 2020, and is incorporated herein by reference.
ITEM 12. SECURITY OWNERSHIP OF CERTAIN BENEFICIAL OWNERS AND MANAGEMENT AND RELATED STOCKHOLDER MATTERS
The information required by this item will be contained in the Company’s definitive Proxy Statement for its 2021 Annual Stockholder Meeting, to be filed with the SEC within 120 days after December 31, 2020, and is incorporated herein by reference.
| ITEM 13. | CERTAIN RELATIONSHIPS AND RELATED TRANSACTIONS, AND DIRECTOR INDEPENDENCE |
The information required by this item will be contained in the Company’s definitive Proxy Statement for its 2021 Annual Stockholder Meeting, to be filed with the SEC within 120 days after December 31, 2020, and is incorporated herein by reference.
| ITEM 14. | PRINCIPAL ACCOUNTANT FEES AND SERVICES |
The information required by this item will be contained in the Company’s definitive Proxy Statement for its 2021 Annual Stockholder Meeting, to be filed with the SEC within 120 days after December 31, 2020, and is incorporated herein by reference.
131
| ITEM 15. | EXHIBITS AND FINANCIAL STATEMENT SCHEDULES |
The following documents are filed as part of this Annual Report:
132
133
134
| ITEM 16. | FORM 10-K SUMMARY |
None.
135
Pursuant to the requirements of the Securities Exchange Act of 1934, as amended, the registrant has duly caused this report to be signed on its behalf by the undersigned thereunto duly authorized.
| Crescent Capital BDC, INC. | ||||||
| Date: February 24, 2021 | By: | /s/ Jason A. Breaux | ||||
| Jason A. Breaux | ||||||
| Chief Executive Officer | ||||||
| Date: February 24, 2021 | By: | /s/ Gerhard Lombard | ||||
| Gerhard Lombard | ||||||
| Chief Financial Officer | ||||||
Each person whose signature appears below constitutes and appoints Jason A Breaux, Gerhard Lombard, George P. Hawley, Joseph A. Hanlon and Jonathan R. Insull, and each of them, such person’s true and lawful attorney-in-fact and agent, with full power of substitution and revocation, for such person and in such person’s name, place and stead, in any and all capacities, to sign one or more Annual Reports on Form 10-K for the fiscal year ended December 31, 2020, and any and all amendments thereto, and to file same with all exhibits thereto, and other documents in connection therewith, with the Securities and Exchange Commission, granting unto said attorneys-in-fact and agents, and each of them, full power and authority to do and perform each and every act and thing requisite and necessary to be done in connection therewith, as fully to all intents and purposes as such person might or could do in person, hereby ratifying and confirming all that said attorneys-in-fact and agents and each of them, or their or his substitute or substitutes, may lawfully do or cause to be done by virtue hereof.
Pursuant to the requirements of the Securities Exchange Act of 1934, this report has been signed below by the following persons on behalf of the registrant and in the capacities indicated on February 24, 2021.
| Signature |
Title | |
| /s/ Jason A. Breaux Jason A. Breaux |
Chief Executive Officer | |
| /s/ Gerhard Lombard Gerhard Lombard |
Chief Financial Officer | |
| /s/ George G. Strong, Jr. George G. Strong, Jr. |
Director and Chairman of the Audit Committee | |
| /s/ Steven F. Strandberg Steven F. Strandberg |
Director | |
| /s/ Michael S. Segal Michael S. Segal |
Director | |
| /s/ Kathleen Briscoe Kathleen Briscoe |
Director | |
136