Attached files
| file | filename |
|---|---|
| EX-99.1 - EXHIBIT 99-1 - NABORS INDUSTRIES LTD | tm215471d3_ex99-1.htm |
| 8-K - FORM 8-K - NABORS INDUSTRIES LTD | tm215471d3_8k.htm |
Exhibit 99.2

1 2/24/2021 NABORS INDUSTRIES LTD. 4Q Earnings Presentation

2 Forward Looking Statements We often discuss expectations regarding our future markets, demand for our products and services, and our performance in our annual, quarterly, and current reports, press releases, and other written and oral statements . Such statements, including statements in this document that relate to matters that are not historical facts, are “forward - looking statements” within the meaning of the safe harbor provisions of Section 27 A of the U . S . Securities Act of 1933 and Section 21 E of the U . S . Securities Exchange Act of 1934 . These “forward - looking statements” are based on our analysis of currently available competitive, financial and economic data and our operating plans . They are inherently uncertain, and investors should recognize that events and actual results could turn out to be significantly different from our expectations . Factors to consider when evaluating these forward - looking statements include, but are not limited to: • the Covid - 19 pandemic and its impact on oil and gas markets and prices; • fluctuations and volatility in worldwide prices of and demand for oil and natural gas; • fluctuations in levels of oil and natural gas exploration and development activities; • fluctuations in the demand for our services; • competitive and technological changes and other developments in the oil and gas and oilfield services industries; • our ability to renew customer contracts in order to maintain competitiveness; • the existence of operating risks inherent in the oil and gas and oilfield services industries; • the possibility of the loss of one or a number of our large customers; • the impact of long - term indebtedness and other financial commitments on our financial and operating flexibility; • our access to and the cost of capital, including the impact of a further downgrade in our credit rating, covenant restrictions, availability under our unsecured revolving credit facility, and future issuances of debt or equity securities; • our dependence on our operating subsidiaries and investments to meet our financial obligations; our ability to retain skilled employees; • our ability to complete, and realize the expected benefits, of strategic transactions; • changes in tax laws and the possibility of changes in other laws and regulation; • the possibility of political or economic instability, civil disturbance, war or acts of terrorism in any of the countries in which we do business; • the possibility of changes to U.S. trade policies and regulations including the imposition of trade embargoes or sanctions; and • general economic conditions, including the capital and credit markets. Our businesses depend, to a large degree, on the level of spending by oil and gas companies for exploration, development and production activities . Therefore, sustained lower oil or natural gas prices that have a material impact on exploration, development or production activities could also materially affect our financial position, results of operations and cash flows . The outbreak of the novel coronavirus (“COVID - 19 ”), together with actions by large oil and natural gas producing countries, has led to decreases in commodity prices, specifically oil and natural gas prices, resulting from oversupply and demand weakness . These price decreases caused significant disruptions and volatility in the global marketplace during 2020 . Lower prices and the resulting weakness in demand for our services, which have negatively affected our results of operations and cash flows, have persisted into the fourth quarter, and uncertainty remains regarding the length and impact of COVID - 19 on the energy industry and the outlook for our business . The above description of risks and uncertainties is by no means all - inclusive, but is designed to highlight what we believe are important factors to consider . For a discussion of these factors and other risks and uncertainties, please refer to our filings with the Securities and Exchange Commission ("SEC"), including those contained in our Annual Reports on Form 10 - K and Quarterly Reports on Form 10 - Q, which are available at the SEC's website at www . sec . gov .

Recent Company Highlights Cut debt obligations by $307M in 4Q20 & 1Q21 Executed debt exchanges and open market repurchases Delivered L48 gross margin per day of $9,541 Highest 4Q 2020 gross margin versus our peers Delivered EBITDA of $108M in 4Q 2020 Highest by a wide margin among land drillers Generated FCF of $66M in 4Q 2020 From cost reductions and capital discipline SmartDRILL TM approaching 30% penetration across Nabors’ Lower 48 rigs Steadily increasing since update in 2Q 2020 ESG score improvement in 4Q 2 points Environmental 1 point Social 3

4 4Q Rig Utilization and Availability RIG FLEET (1) 383 4Q20 AVERAGE RIGS ON REV 132 AVERAGE UTILIZATION 34% (1) As of December 31, 2020 Note: Subtotals may not foot due to rounding TOTAL U.S. OFFSHORE 12 2 17% CANADA 16 3 19% ALASKA 35 10 29% INTERNATIONAL 133 63 47% 187 54 29% U.S. LOWER 48 HIGH SPEC 110 HIGH SPEC 53 HIGH SPEC 48%

33% 40% 4% 8% 15% 4Q 2020 NBR HP PTEN ESI Other 22% 39% 22% 7% 9% 2014 5 Building L48 Market Share with the Supermajors A leader in the supermajors market segment, Nabors increased market share by 50%compared to the 2014 peak. “Nabors has invested heavily in their fleet and support services. They’ve also made tough decisions to ensure the right talent is in their front - line leadership positions.” “ Best in - basin rig performance. Attentive corporate and field personnel.” “New technology, consistently evolving. Quality performance and excellent service.” Major Independent Major Independent Supermajor “I gave Nabors a 9 for their quality, forward - thinking mentality, low NPT and performance - minded personnel.” Supermajor

6 Nabors’ Commitment to Environmental Stewardship 40 dual - fuel - capable rigs in Lower 48 Signed onto the Science Based Targets initiative, committed to setting science - based GHG emissions targets Image: Rig 27E in Deadhorse Alaska 3 High - Line rigs, 4 Bi - Fuel rigs, including 1 rig using our advanced energy management system in L48 Evaluating carbon capture, emissions minimization and power management technologies
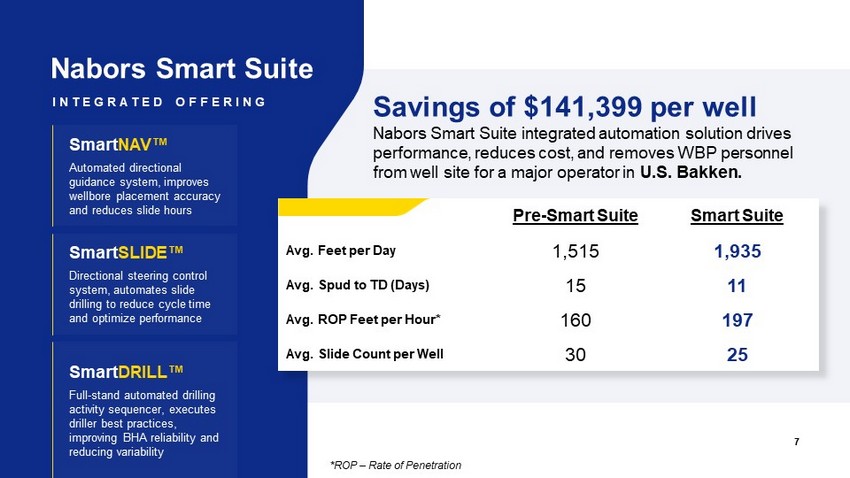
Smart NAV ΠAutomated directional guidance system, improves wellbore placement accuracy and reduces slide hours 7 Savings of $141,399 per well Nabors Smart Suite integrated automation solution drives performance, reduces cost, and removes WBP personnel from well site for a major operator in U.S. Bakken. Pre - Smart Suite Smart Suite Avg. Feet per Day 1,515 1,935 Avg. Spud to TD (Days) 15 11 Avg. ROP Feet per Hour* 160 197 Avg. Slide Count per Well 30 25 Nabors Smart Suite Smart SLIDE ΠDirectional steering control system, automates slide drilling to reduce cycle time and optimize performance Smart DRILL ΠFull - stand automated drilling activity sequencer, executes driller best practices, improving BHA reliability and reducing variability INTEGRATED OFFERING *ROP РRate of Penetration

Increasing Automation Across NDS Services Increased Smart app penetration on Nabors rigs in 2020 despite difficult market conditions • Grew SmartDRILL Œ customer base to 5 operators in Lower 48 plus 1 international operator • 2021 SmartDRILL Œ initiatives to drive operator value: • Streamline deployment model targeted to operators with short - term drilling programs • Automate KPIs to easily provide value - add of the software SmartDRILL Œ Growth 29% Q1’20 Q2’20 Q3’20 Q4’20 6% 19% SmartDRILL TM Penetration (% of Nabors Rigs) Automated Well Stats Life to Date Q4 Wells – SmartSLIDE Œ / SmartNAV Œ 655 68 Wells – SmartDRILL Œ 152 64 Footage – SmartSLIDE Œ / SmartNAV Œ 12.20M ft 1.2M ft Footage – SmartDRILL Œ 3.05M ft 1.2M ft 51 88 152 3.5 3.0 0.0 0.5 1.0 2.0 1.5 2.5 0 50 100 150 200 24 Q1’20 Q2’20 Q3’20 Q4’20 0.52 1.08 1.83 3.05 Cumulative Wells Drilled Cumulative Footage Footage Drilled (Million Ft) Cumulative Wells Commercial Release Field Testing New Functionality 8

SmartDRILL TM : Industry leading value proposition Feature SmartDRILL Œ Benefit Automated Processes Slips to Weight Connections, BHA Reliability Rotary to Slide Slide to Rotary BHA Reliability Rotary Drilling Weight to Slip Connections, BHA Reliability Reaming BHA Reliability Granular Machine Control Top Drive Mud Pumps Configurable, Connections, BHA Reliability Drawworks Detailed Cloud - Based KPI’s Prove Value and Performance Fleet Wide Scalability Scalable Low Impact Rig Upgrade Cost - Efficient Improved BHA Reliability Minimize Max RPM and Severe Vibration 1.40 0.56 2.39 0.91 SmartDRILL Œ Wells Manual Wells 3.79 1.47 - 61% Slips to Weight (mins) Weight to Slips (mins) 61% Improvement in Connection Times Automation Aggregate (mins) 12 4 4 2 Manual Wells SmartDRILL Œ Wells Instances of Maximum RPMs >300RPM Instances of Severe Lateral Vibrations Customer Success 9

10 “The recent work with SmartDRILL Œ has been very encouraging …” The Nabors team’s work on this has been tireless…this is a long - term winner for our team and the results are improving.” — Major Global Operator “ SmartDRILL Œ is the gateway to future technology.” — Major U.S. Operator Smart Suite Resonating with Customers 10 “Thank you for all the updates that you are making to your automation software… the progress made can be seen every meeting. This is all thanks to a group who has been very responsive and is always a joy to work with….” — Major Global Operator

86 150 324 854 560 390 673 $0 $250 $500 $750 $1,000 $1,250 $1,500 2021 2022 2023 2024 2025 2026 2027 2028 Revolving Credit Facility Notes Outstanding (1) 11 (1) Annual figures shown in millions at maturity face value as of December 31, 2020 (2) Annual figures shown reflect carrying values as of December 31, 2020 During 2020, reduced or extended maturities on an aggregate $1.5 billion of notes with maturities through 2023 (1) Debt Maturity Profile as of December 31, 2020 Debt at 12/31/2020 Total Debt: $2.97Bn (2) Cash, Cash Equivalents & STI $0.48Bn Total Debt Less Cash, Cash Equiv. & STI $2.49Bn (2)

nabors.com Contact Us: William C. Conroy VP - Corporate Development and Investor Relations William.Conroy@nabors.com Kara K. Peak Director - Corporate Development and Investor Relations Kara.Peak@nabors.com NABORS CORPORATE SERVICES 515 W. Greens Road Suite 1200 Houston, TX 77067 - 4525