Attached files
| file | filename |
|---|---|
| EX-99.1 - EX-99.1 - Matson, Inc. | matx-20210223xex99d1.htm |
| 8-K - 8-K - Matson, Inc. | matx-20210223x8k.htm |
Exhibit 99.2
| 1 Fourth Quarter 2020 Earnings Conference Call Fourth Quarter 2020 Earnings Conference Call February 23, 2021 |
| 2 Fourth Quarter 2020 Earnings Conference Call Forward-Looking Statements Statements made during this presentation that set forth expectations, predictions, projections or are about future events are based on facts and situations that are known to us as of February 23, 2021. We believe that our expectations and assumptions are reasonable. Actual results may differ materially, due to risks and uncertainties, such as those described on pages 24-34 of our Form 10-Q filed on November 2, 2020 and other subsequent filings by Matson with the SEC. Statements made during this presentation are not guarantees of future performance. We do not undertake any obligation to update our forward-looking statements. |
| 3 Fourth Quarter 2020 Earnings Conference Call Opening Remarks • Recap of Matson’s 4Q20 results: – Capped off a strong year with continued solid performance in Ocean Transportation and Logistics – Ocean Transportation: • China strength – CLX+ voyages and increased capacity in the CLX service • In other core tradelanes, continued to see elevated demand for sustenance and home improvement goods lead to higher quarterly YoY volume growth – Logistics: • Improved performance as a result of elevated goods consumption and inventory restocking and tight supply and demand fundamentals in our core markets • Recap of Matson’s FY 2020 results: – Ocean Transportation: • China service was primary driver of increase in consolidated operating income year-over-year • Hawaii and Guam container volume approached the 2019 levels despite the economic challenges from the pandemic; Alaska container volume was modestly higher than the 2019 level – Logistics: • Operating income was modestly lower YoY largely due to pandemic’s impacts on the business lines in 1H20 |
| 4 Fourth Quarter 2020 Earnings Conference Call 2021 Priorities • Continue to safeguard the health and safety of our employees • Maximize the opportunity in our China service – Maintain CLX and CLX+ as the fastest services in the Transpacific – Continue to invest in new equipment to support growth • Position domestic trades for continued economic recovery as pandemic subsides • Position Logistics for opportunities in chaotic environment • Continue to evaluate growth opportunities • Maintain financial flexibility with investment grade balance sheet |
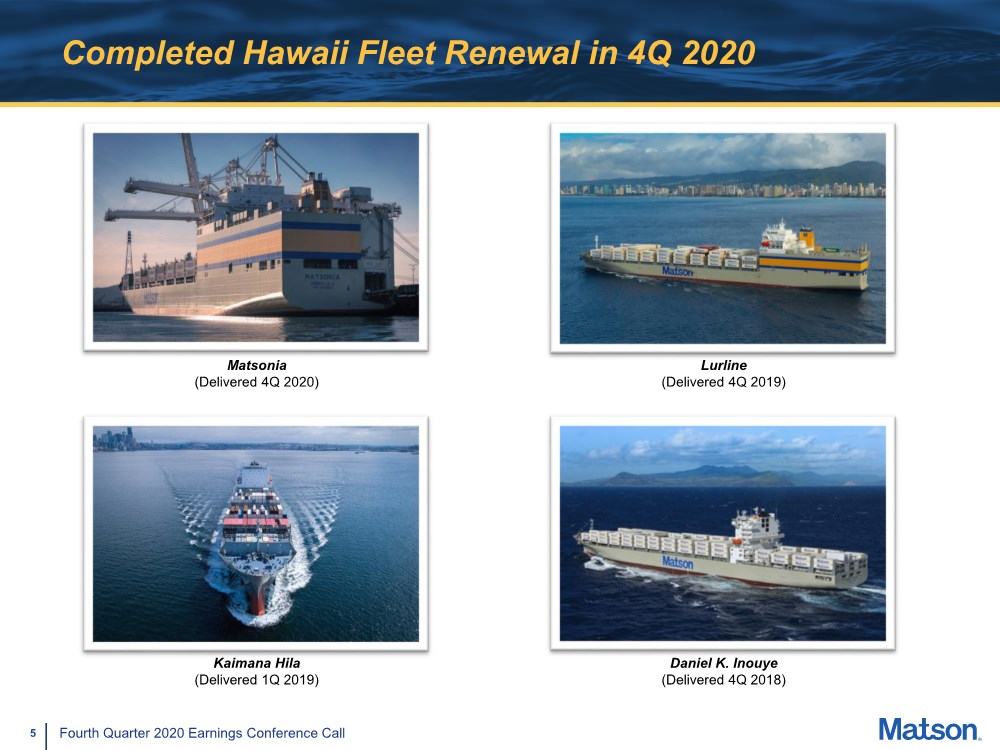
| 5 Fourth Quarter 2020 Earnings Conference Call Completed Hawaii Fleet Renewal in 4Q 2020 Lurline (Delivered 4Q 2019) Matsonia (Delivered 4Q 2020) Kaimana Hila (Delivered 1Q 2019) Daniel K. Inouye (Delivered 4Q 2018) |
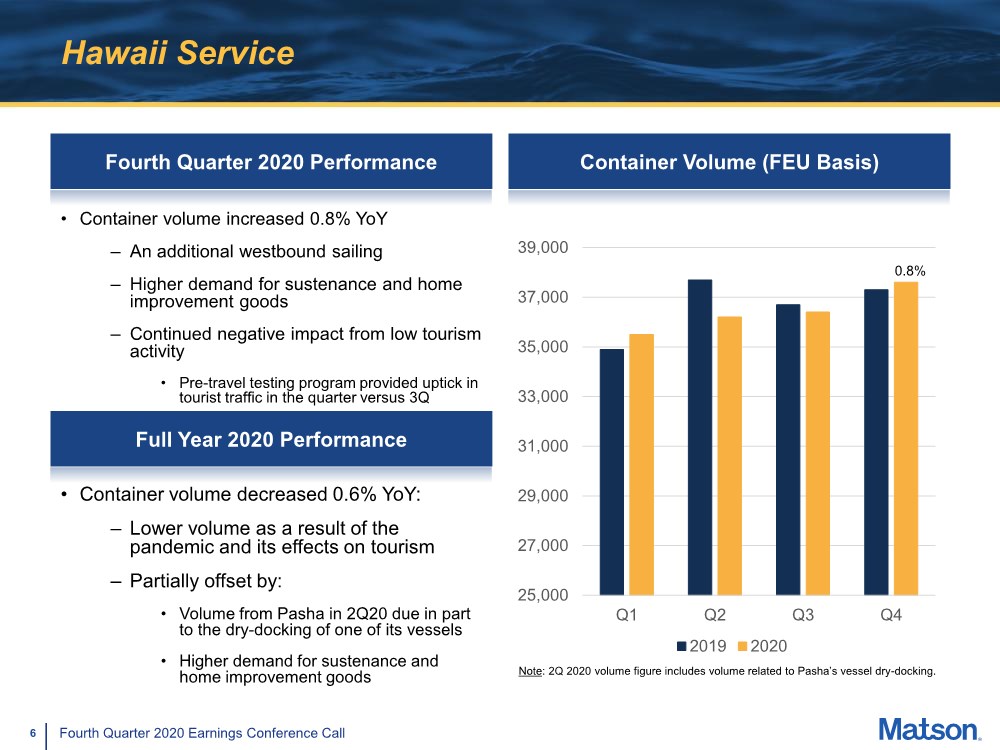
| 6 Fourth Quarter 2020 Earnings Conference Call Hawaii Service Fourth Quarter 2020 Performance • Container volume increased 0.8% YoY – An additional westbound sailing – Higher demand for sustenance and home improvement goods – Continued negative impact from low tourism activity • Pre-travel testing program provided uptick in tourist traffic in the quarter versus 3Q Container Volume (FEU Basis) 25,000 27,000 29,000 31,000 33,000 35,000 37,000 39,000 Q1 Q2 Q3 Q4 2019 2020 Note: 2Q 2020 volume figure includes volume related to Pasha’s vessel dry-docking. 0.8% Full Year 2020 Performance • Container volume decreased 0.6% YoY: – Lower volume as a result of the pandemic and its effects on tourism – Partially offset by: • Volume from Pasha in 2Q20 due in part to the dry-docking of one of its vessels • Higher demand for sustenance and home improvement goods |
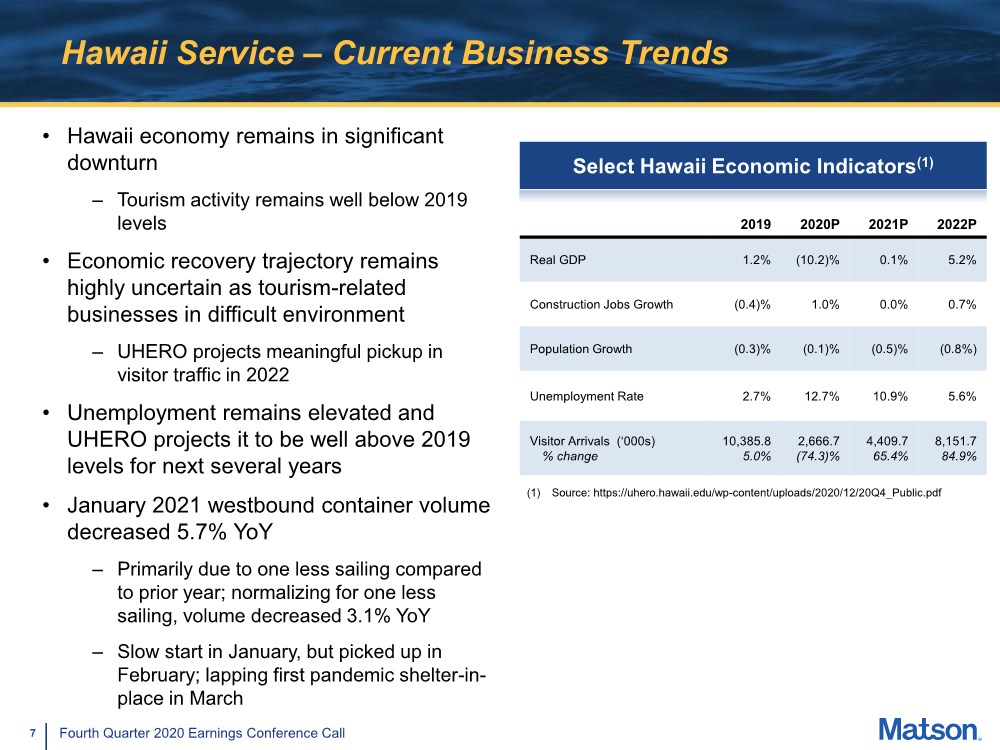
| 7 Fourth Quarter 2020 Earnings Conference Call Hawaii Service – Current Business Trends • Hawaii economy remains in significant downturn – Tourism activity remains well below 2019 levels • Economic recovery trajectory remains highly uncertain as tourism-related businesses in difficult environment – UHERO projects meaningful pickup in visitor traffic in 2022 • Unemployment remains elevated and UHERO projects it to be well above 2019 levels for next several years • January 2021 westbound container volume decreased 5.7% YoY – Primarily due to one less sailing compared to prior year; normalizing for one less sailing, volume decreased 3.1% YoY – Slow start in January, but picked up in February; lapping first pandemic shelter-in- place in March (1) Source: https://uhero.hawaii.edu/wp-content/uploads/2020/12/20Q4_Public.pdf Select Hawaii Economic Indicators(1) 2019 2020P 2021P 2022P Real GDP 1.2% (10.2)% 0.1% 5.2% Construction Jobs Growth (0.4)% 1.0% 0.0% 0.7% Population Growth (0.3)% (0.1)% (0.5)% (0.8%) Unemployment Rate 2.7% 12.7% 10.9% 5.6% Visitor Arrivals (‘000s) % change 10,385.8 5.0% 2,666.7 (74.3)% 4,409.7 65.4% 8,151.7 84.9% |
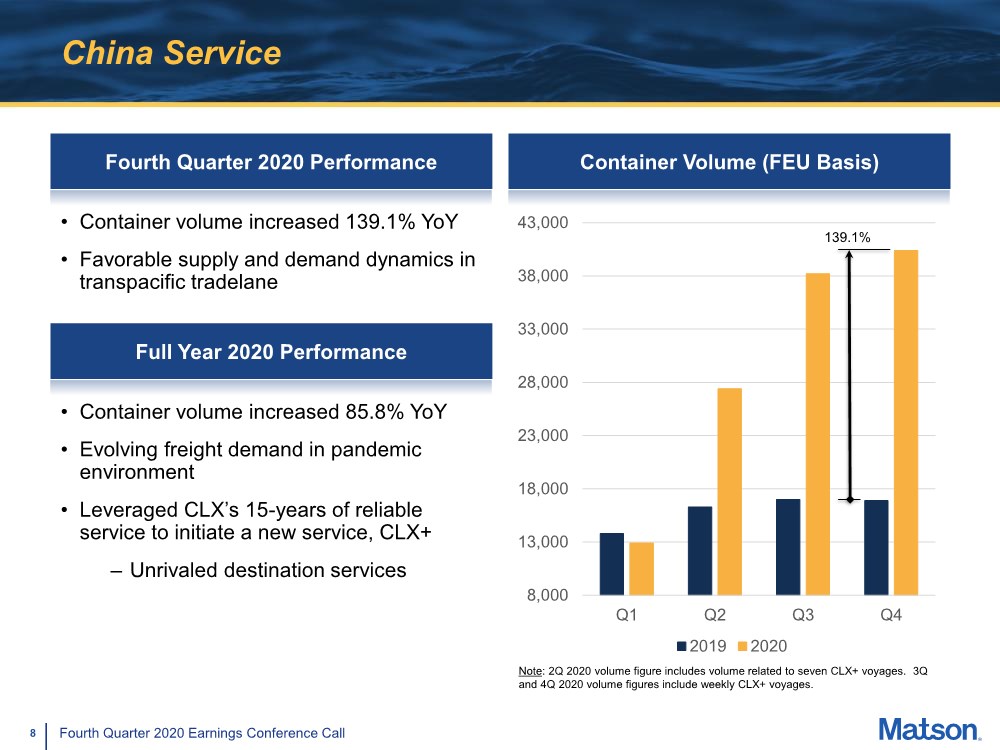
| 8 Fourth Quarter 2020 Earnings Conference Call China Service Fourth Quarter 2020 Performance Container Volume (FEU Basis) 8,000 13,000 18,000 23,000 28,000 33,000 38,000 43,000 Q1 Q2 Q3 Q4 2019 2020 Note: 2Q 2020 volume figure includes volume related to seven CLX+ voyages. 3Q and 4Q 2020 volume figures include weekly CLX+ voyages. 139.1% Full Year 2020 Performance • Container volume increased 85.8% YoY • Evolving freight demand in pandemic environment • Leveraged CLX’s 15-years of reliable service to initiate a new service, CLX+ – Unrivaled destination services • Container volume increased 139.1% YoY • Favorable supply and demand dynamics in transpacific tradelane |
| 9 Fourth Quarter 2020 Earnings Conference Call China Service – Current Business Trends • January 2021 eastbound container volume increased 130.4% YoY – Supply and demand factors continued to remain favorable – Continued trend of inventory restocking and elevated consumption of goods • Very strong pre-Lunar New Year period and abbreviated post-Lunar New Year period slowdown as vessels were near full • Investing approximately $55 million in new equipment to support CLX+/AAX growth and increase availability of equipment in our network • Expect supply and demand dynamics in transpacific tradelane to remain largely favorable in the first half of 2021 as pandemic persists • As pandemic subsides with widespread vaccination, expect some supply and demand factors that we are currently benefitting from to remain and continue to drive demand for CLX and CLX+ |
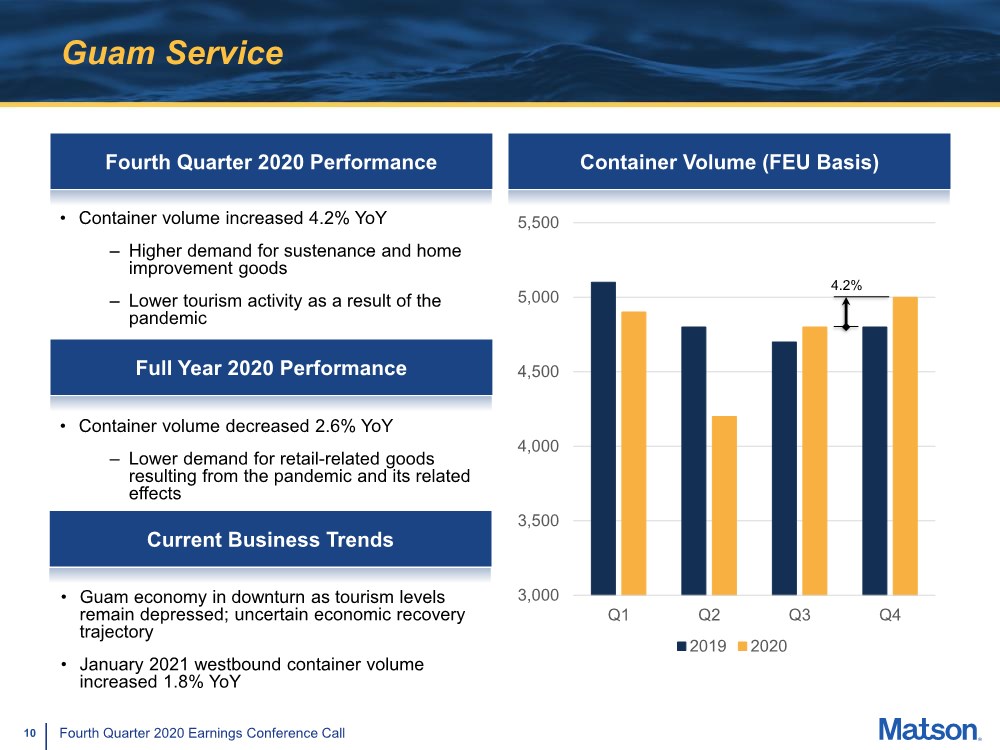
| 10 Fourth Quarter 2020 Earnings Conference Call Guam Service Fourth Quarter 2020 Performance Container Volume (FEU Basis) 3,000 3,500 4,000 4,500 5,000 5,500 Q1 Q2 Q3 Q4 2019 2020 4.2% • Container volume increased 4.2% YoY – Higher demand for sustenance and home improvement goods – Lower tourism activity as a result of the pandemic Current Business Trends • Guam economy in downturn as tourism levels remain depressed; uncertain economic recovery trajectory • January 2021 westbound container volume increased 1.8% YoY Full Year 2020 Performance • Container volume decreased 2.6% YoY – Lower demand for retail-related goods resulting from the pandemic and its related effects |
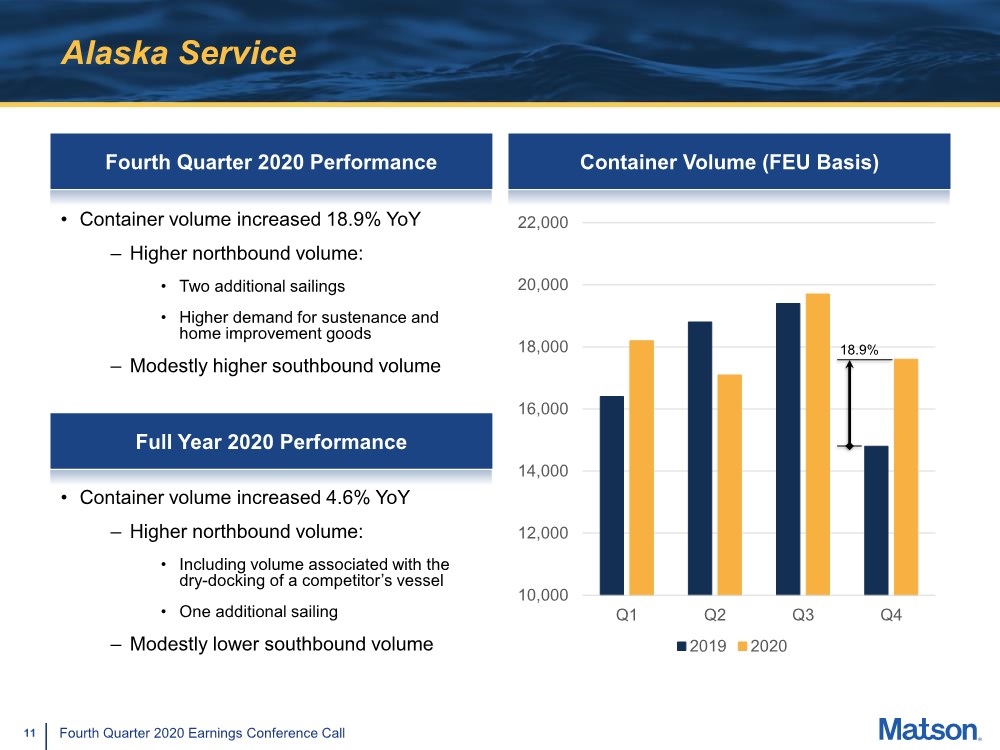
| 11 Fourth Quarter 2020 Earnings Conference Call Alaska Service Fourth Quarter 2020 Performance • Container volume increased 18.9% YoY – Higher northbound volume: • Two additional sailings • Higher demand for sustenance and home improvement goods – Modestly higher southbound volume Container Volume (FEU Basis) 10,000 12,000 14,000 16,000 18,000 20,000 22,000 Q1 Q2 Q3 Q4 2019 2020 18.9% • Container volume increased 4.6% YoY – Higher northbound volume: • Including volume associated with the dry-docking of a competitor’s vessel • One additional sailing – Modestly lower southbound volume Full Year 2020 Performance |
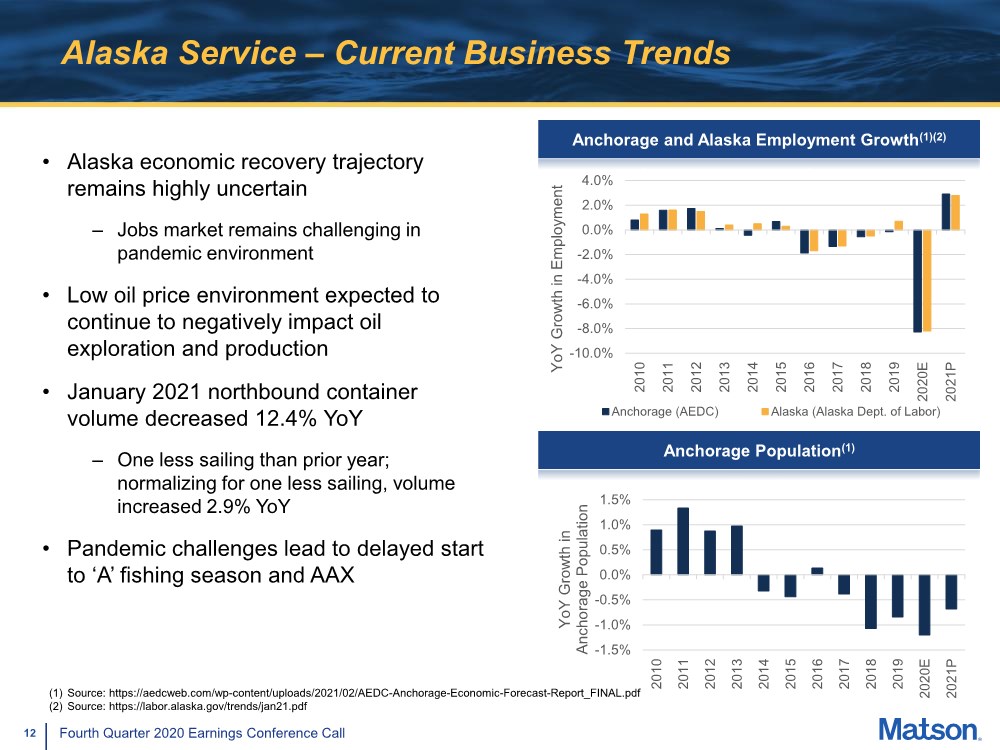
| 12 Fourth Quarter 2020 Earnings Conference Call Alaska Service – Current Business Trends • Alaska economic recovery trajectory remains highly uncertain – Jobs market remains challenging in pandemic environment • Low oil price environment expected to continue to negatively impact oil exploration and production • January 2021 northbound container volume decreased 12.4% YoY – One less sailing than prior year; normalizing for one less sailing, volume increased 2.9% YoY •Pandemic challenges lead to delayed start to ‘A’ fishing season and AAX -10.0% -8.0% -6.0% -4.0% -2.0% 0.0% 2.0% 4.0% 2010 2011 2012 2013 2014 2015 2016 2017 2018 2019 2020E 2021P YoY Growth in Employment Anchorage (AEDC) Alaska (Alaska Dept. of Labor) Anchorage and Alaska Employment Growth(1)(2) (1) Source: https://aedcweb.com/wp-content/uploads/2021/02/AEDC-Anchorage-Economic-Forecast-Report_FINAL.pdf (2) Source: https://labor.alaska.gov/trends/jan21.pdf -1.5% -1.0% -0.5% 0.0% 0.5% 1.0% 1.5% 2010 2011 2012 2013 2014 2015 2016 2017 2018 2019 2020E 2021P YoY Growth in Anchorage Population Anchorage Population(1) |
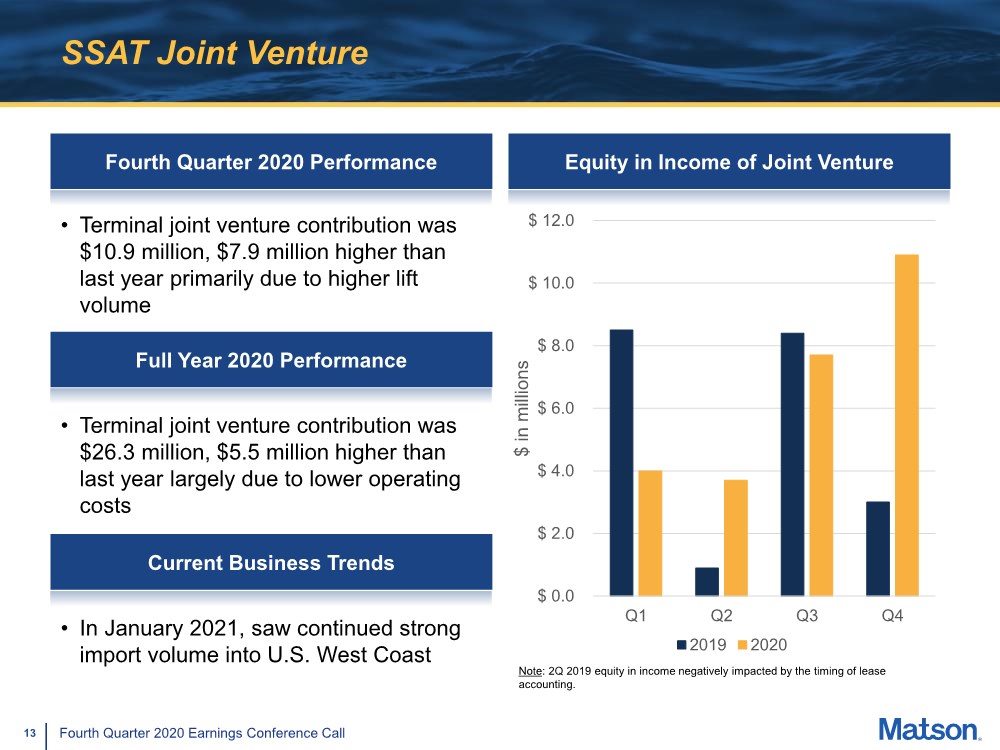
| 13 Fourth Quarter 2020 Earnings Conference Call SSAT Joint Venture Fourth Quarter 2020 Performance Equity in Income of Joint Venture Note: 2Q 2019 equity in income negatively impacted by the timing of lease accounting. $ 0.0 $ 2.0 $ 4.0 $ 6.0 $ 8.0 $ 10.0 $ 12.0 Q1 Q2 Q3 Q4 $ in millions 2019 2020 Current Business Trends • In January 2021, saw continued strong import volume into U.S. West Coast • Terminal joint venture contribution was $10.9 million, $7.9 million higher than last year primarily due to higher lift volume Full Year 2020 Performance • Terminal joint venture contribution was $26.3 million, $5.5 million higher than last year largely due to lower operating costs |
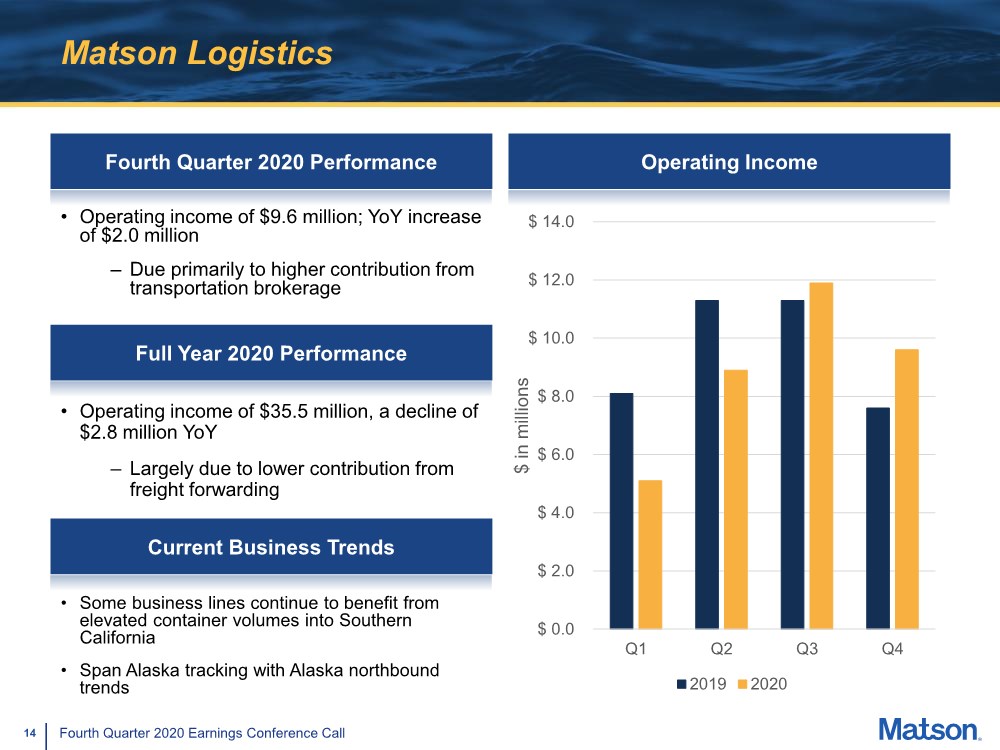
| 14 Fourth Quarter 2020 Earnings Conference Call Matson Logistics Fourth Quarter 2020 Performance Operating Income $ 0.0 $ 2.0 $ 4.0 $ 6.0 $ 8.0 $ 10.0 $ 12.0 $ 14.0 Q1 Q2 Q3 Q4 $ in millions 2019 2020 • Operating income of $9.6 million; YoY increase of $2.0 million – Due primarily to higher contribution from transportation brokerage Current Business Trends Full Year 2020 Performance • Some business lines continue to benefit from elevated container volumes into Southern California • Span Alaska tracking with Alaska northbound trends • Operating income of $35.5 million, a decline of $2.8 million YoY – Largely due to lower contribution from freight forwarding |
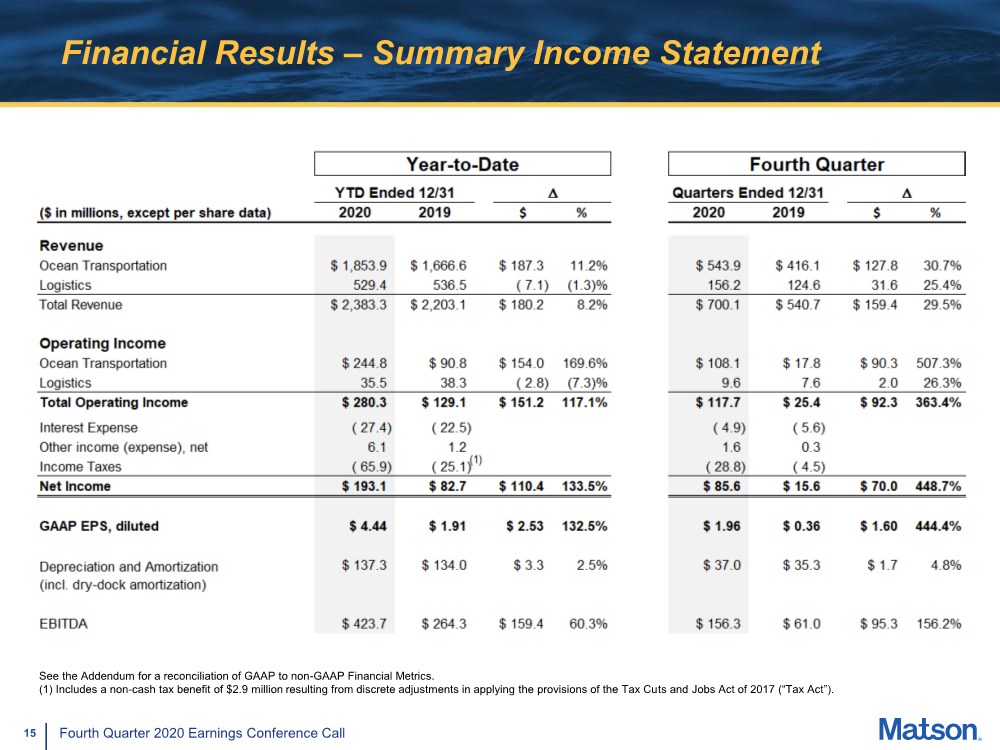
| 15 Fourth Quarter 2020 Earnings Conference Call Financial Results – Summary Income Statement See the Addendum for a reconciliation of GAAP to non-GAAP Financial Metrics. (1) Includes a non-cash tax benefit of $2.9 million resulting from discrete adjustments in applying the provisions of the Tax Cuts and Jobs Act of 2017 (“Tax Act”). |
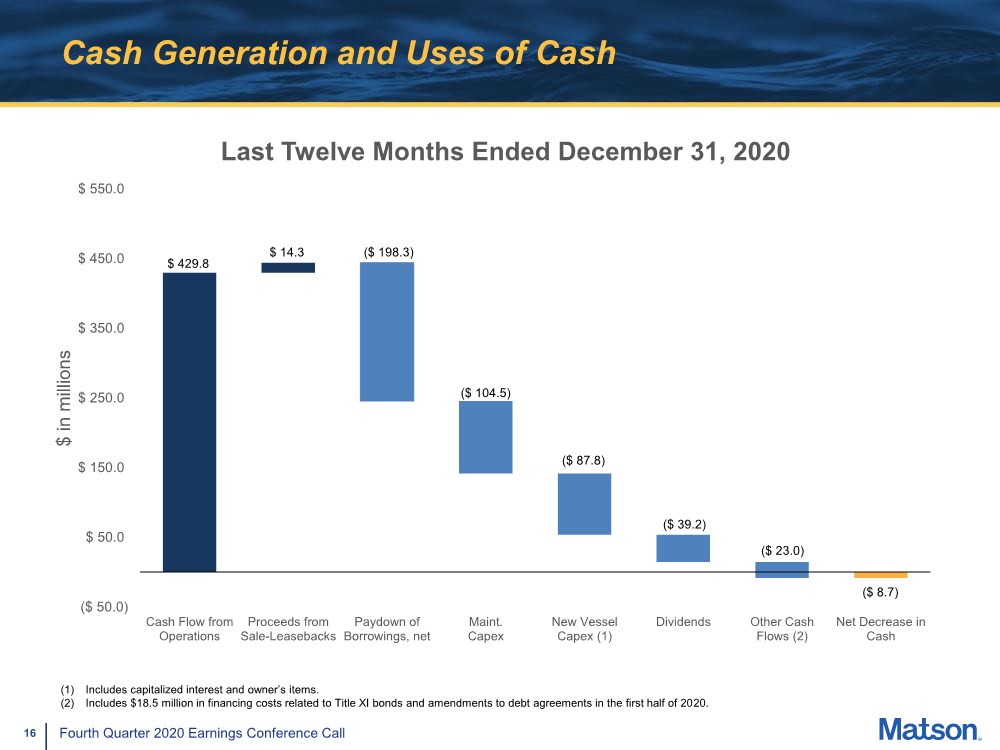
| 16 Fourth Quarter 2020 Earnings Conference Call Cash Generation and Uses of Cash ($ 50.0) $ 50.0 $ 150.0 $ 250.0 $ 350.0 $ 450.0 $ 550.0 Cash Flow from Operations Proceeds from Sale-Leasebacks Paydown of Borrowings, net Maint. Capex New Vessel Capex (1) Dividends Other Cash Flows (2) Net Decrease in Cash $ in millions Last Twelve Months Ended December 31, 2020 $ 429.8 $ 14.3 ($ 198.3) ($ 104.5) ($ 87.8) ($ 39.2) ($ 8.7) ($ 23.0) (1) Includes capitalized interest and owner’s items. (2) Includes $18.5 million in financing costs related to Title XI bonds and amendments to debt agreements in the first half of 2020. |
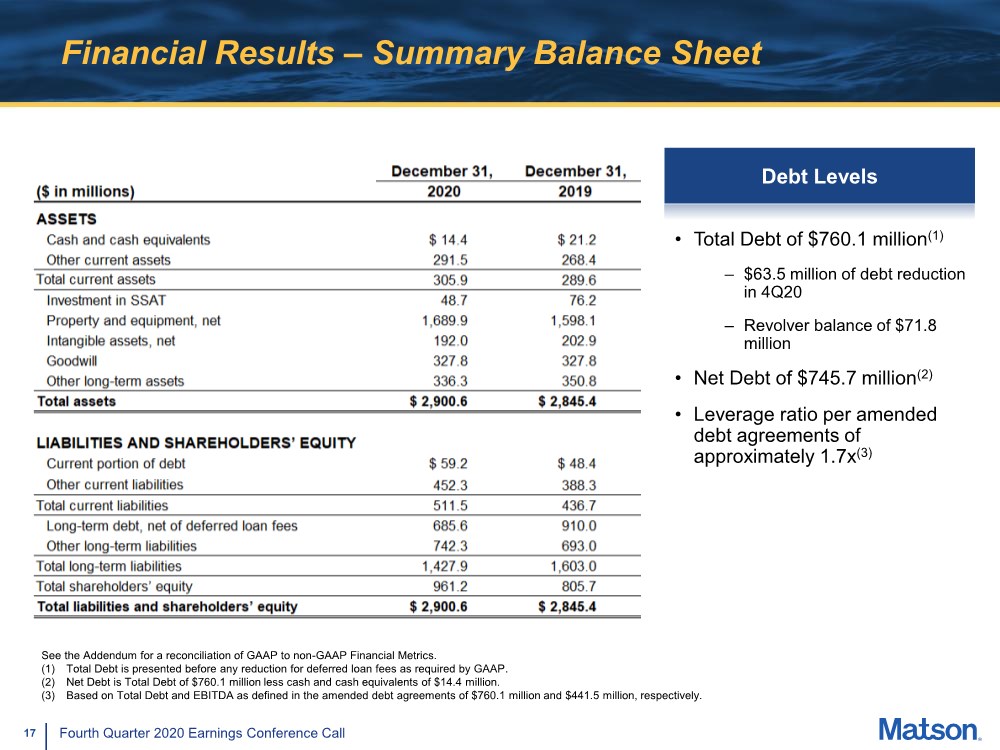
| 17 Fourth Quarter 2020 Earnings Conference Call Financial Results – Summary Balance Sheet • Total Debt of $760.1 million(1) – $63.5 million of debt reduction in 4Q20 – Revolver balance of $71.8 million • Net Debt of $745.7 million(2) • Leverage ratio per amended debt agreements of approximately 1.7x(3) See the Addendum for a reconciliation of GAAP to non-GAAP Financial Metrics. (1) Total Debt is presented before any reduction for deferred loan fees as required by GAAP. (2) Net Debt is Total Debt of $760.1 million less cash and cash equivalents of $14.4 million. (3) Based on Total Debt and EBITDA as defined in the amended debt agreements of $760.1 million and $441.5 million, respectively. Debt Levels |
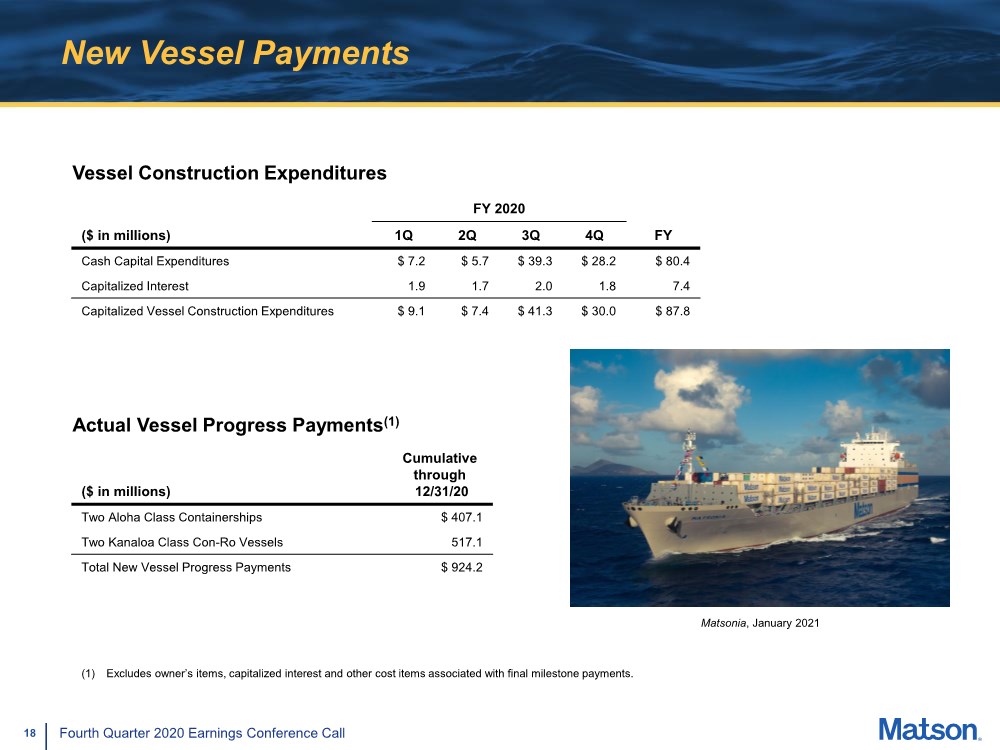
| 18 Fourth Quarter 2020 Earnings Conference Call New Vessel Payments Actual Vessel Progress Payments(1) FY 2020 ($ in millions) 1Q 2Q 3Q 4Q FY Cash Capital Expenditures $ 7.2 $ 5.7 $ 39.3 $ 28.2 $ 80.4 Capitalized Interest 1.9 1.7 2.0 1.8 7.4 Capitalized Vessel Construction Expenditures $ 9.1 $ 7.4 $ 41.3 $ 30.0 $ 87.8 ($ in millions) Cumulative through 12/31/20 Two Aloha Class Containerships $ 407.1 Two Kanaloa Class Con-Ro Vessels 517.1 Total New Vessel Progress Payments $ 924.2 Vessel Construction Expenditures (1) Excludes owner’s items, capitalized interest and other cost items associated with final milestone payments. Matsonia, January 2021 |
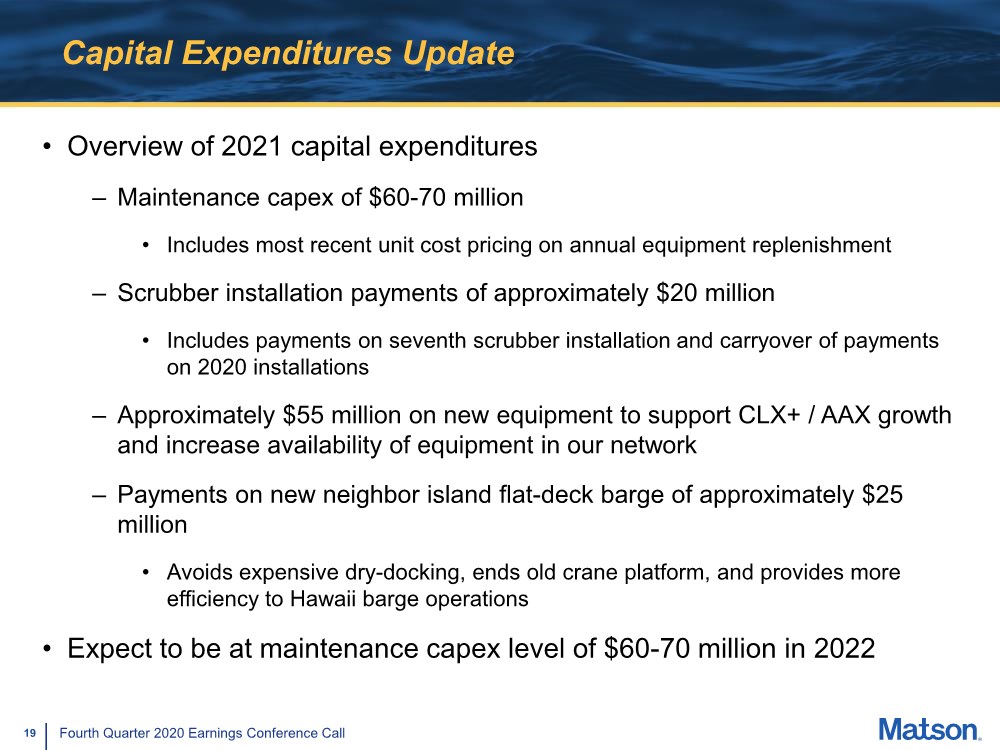
| 19 Fourth Quarter 2020 Earnings Conference Call Capital Expenditures Update • Overview of 2021 capital expenditures – Maintenance capex of $60-70 million • Includes most recent unit cost pricing on annual equipment replenishment – Scrubber installation payments of approximately $20 million • Includes payments on seventh scrubber installation and carryover of payments on 2020 installations – Approximately $55 million on new equipment to support CLX+ / AAX growth and increase availability of equipment in our network – Payments on new neighbor island flat-deck barge of approximately $25 million • Avoids expensive dry-docking, ends old crane platform, and provides more efficiency to Hawaii barge operations • Expect to be at maintenance capex level of $60-70 million in 2022 |
| 20 Fourth Quarter 2020 Earnings Conference Call Capital Allocation • No change in capital allocation strategy • Uses of cash after funding our ordinary dividend and maintenance capex (in no particular order): – Organic growth – Reduce debt – Acquire businesses – Return capital to shareholders • In 2021, expect to continue to reduce outstanding debt • Acquisition criteria: – Target must have an enduring competitive advantage – Target must be strategic or complementary – Target must generate a cash-on-cash return in excess of 10% initially, and have ability to grow organically – Target must be a good cultural fit |
| 21 Fourth Quarter 2020 Earnings Conference Call Appendix |
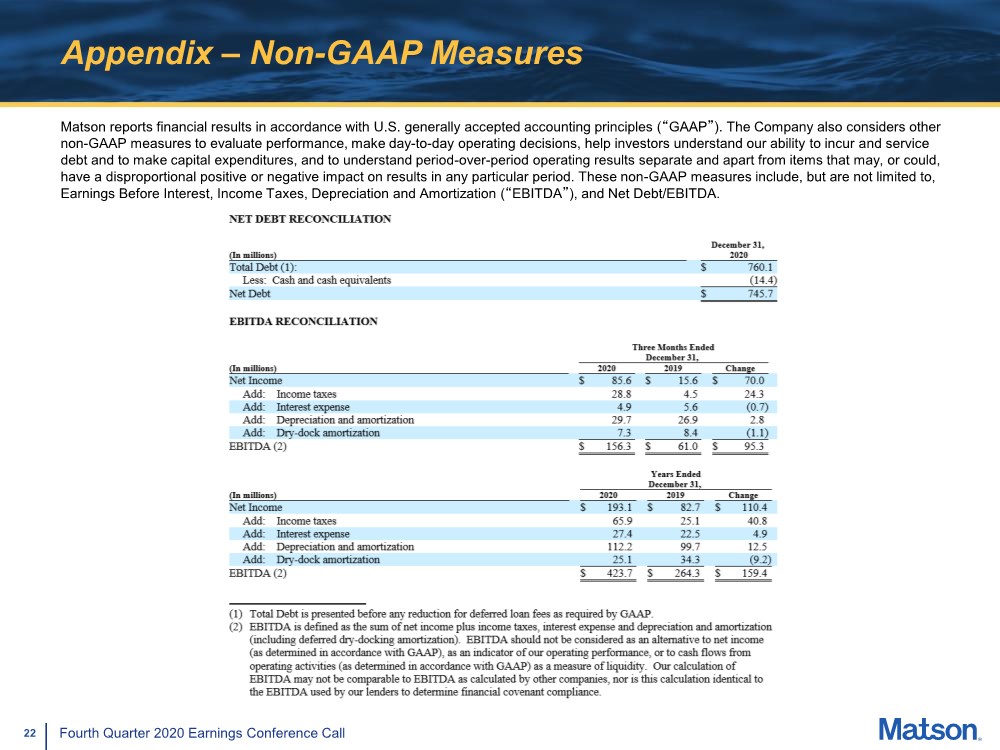
| 22 Fourth Quarter 2020 Earnings Conference Call Appendix – Non-GAAP Measures Matson reports financial results in accordance with U.S. generally accepted accounting principles (“GAAP”). The Company also considers other non-GAAP measures to evaluate performance, make day-to-day operating decisions, help investors understand our ability to incur and service debt and to make capital expenditures, and to understand period-over-period operating results separate and apart from items that may, or could, have a disproportional positive or negative impact on results in any particular period. These non-GAAP measures include, but are not limited to, Earnings Before Interest, Income Taxes, Depreciation and Amortization (“EBITDA”), and Net Debt/EBITDA. |