Attached files
| file | filename |
|---|---|
| 8-K - 8-K - Bloom Energy Corp | d24355d8k.htm |

Exhibit 99.1 SERVICE BUSINESS TEACH-IN Greg Cameron Executive Vice President, Chief Financial Officer Glen Griffiths Executive Vice President, Services, Quality, Reliability and EH&S Proprietary and Confidential 1Exhibit 99.1 SERVICE BUSINESS TEACH-IN Greg Cameron Executive Vice President, Chief Financial Officer Glen Griffiths Executive Vice President, Services, Quality, Reliability and EH&S Proprietary and Confidential 1

FORWARD-LOOKING STATEMENTS AND NON-GAAP FINANCIAL MEASURES This presentation contains forward-looking statements that are based on our beliefs and assumptions and on information currently available to us. Forward-looking statements include all statements other than statements of historical fact, including information or predictions concerning our expectations regarding our services business; potential growth of our service business; projected service gross margin; and our business plans and objectives. Forward-looking statements are subject to known and unknown risks, uncertainties, assumptions, and other factors including, but not limited to, our limited operating history, the emerging nature of the distributed generation market and rapidly evolving market trends, the significant losses we have incurred in the past, our ability to service our existing debt obligations, our ability to succeed in new markets, the significant upfront costs of our Energy Servers and R&D costs of new products to address emerging markets, delays in the development and introduction of new products or updates to existing products, market acceptance and adoption of our products, our ability to continue to drive cost reductions, the risk of manufacturing defects, the accuracy of our estimates regarding the useful life of our Energy Servers, the availability of rebates, tax credits and other tax benefits, our reliance on tax equity financing arrangements, our ability to successfully enter new international markets, our reliance upon a limited number of customers, our lengthy sales and installation cycle, construction, utility interconnection and other delays and cost overruns related to the installation of our Energy Servers, potential supply chain constraints, business and economic conditions and growth trends in commercial and industrial energy markets, global economic conditions and uncertainties in the geopolitical environment, overall electricity generation market, the COVID-19 pandemic and other risks and uncertainties. Moreover, we operate in very competitive and rapidly changing environments, and new risks may emerge from time to time. It is not possible for us to predict all risks, nor can we assess the impact of all factors on our business or the extent to which any factor, or combination of factors, may cause actual results to differ materially from those contained in any forward-looking statements we may make. You should not rely upon forward-looking statements as predictions of future events. Although we believe that the expectations reflected in our forward-looking statements are reasonable, we cannot guarantee that the future results, performance, or events and circumstances described in the forward-looking statements will be achieved or occur. Moreover, neither we, nor any other person, assume responsibility for the accuracy and completeness of the forward-looking statements. We undertake no obligation to update any forward-looking statements for any reason after the date of this presentation to conform these statements to actual results or to changes in our expectations, except as required by law. These forward-looking statements should also be read in conjunction with the other cautionary statements that are included elsewhere in our public filings, including under the heading “Risk Factors” in our Annual Report on Form 10-K for the year ended December 31, 2019, our Quarterly Report on Form 10-Q for the quarter ended September 30, 2020 and subsequent filings with the SEC filed from time-to-time. With respect to our expectations regarding our service gross margin target, we are not able to provide a quantitative reconciliation of non-GAAP gross margin measure to the corresponding GAAP measures without unreasonable efforts. The only difference between GAAP and non-GAAP is the exclusion of stock-based compensation. 2 Proprietary and ConfidentialFORWARD-LOOKING STATEMENTS AND NON-GAAP FINANCIAL MEASURES This presentation contains forward-looking statements that are based on our beliefs and assumptions and on information currently available to us. Forward-looking statements include all statements other than statements of historical fact, including information or predictions concerning our expectations regarding our services business; potential growth of our service business; projected service gross margin; and our business plans and objectives. Forward-looking statements are subject to known and unknown risks, uncertainties, assumptions, and other factors including, but not limited to, our limited operating history, the emerging nature of the distributed generation market and rapidly evolving market trends, the significant losses we have incurred in the past, our ability to service our existing debt obligations, our ability to succeed in new markets, the significant upfront costs of our Energy Servers and R&D costs of new products to address emerging markets, delays in the development and introduction of new products or updates to existing products, market acceptance and adoption of our products, our ability to continue to drive cost reductions, the risk of manufacturing defects, the accuracy of our estimates regarding the useful life of our Energy Servers, the availability of rebates, tax credits and other tax benefits, our reliance on tax equity financing arrangements, our ability to successfully enter new international markets, our reliance upon a limited number of customers, our lengthy sales and installation cycle, construction, utility interconnection and other delays and cost overruns related to the installation of our Energy Servers, potential supply chain constraints, business and economic conditions and growth trends in commercial and industrial energy markets, global economic conditions and uncertainties in the geopolitical environment, overall electricity generation market, the COVID-19 pandemic and other risks and uncertainties. Moreover, we operate in very competitive and rapidly changing environments, and new risks may emerge from time to time. It is not possible for us to predict all risks, nor can we assess the impact of all factors on our business or the extent to which any factor, or combination of factors, may cause actual results to differ materially from those contained in any forward-looking statements we may make. You should not rely upon forward-looking statements as predictions of future events. Although we believe that the expectations reflected in our forward-looking statements are reasonable, we cannot guarantee that the future results, performance, or events and circumstances described in the forward-looking statements will be achieved or occur. Moreover, neither we, nor any other person, assume responsibility for the accuracy and completeness of the forward-looking statements. We undertake no obligation to update any forward-looking statements for any reason after the date of this presentation to conform these statements to actual results or to changes in our expectations, except as required by law. These forward-looking statements should also be read in conjunction with the other cautionary statements that are included elsewhere in our public filings, including under the heading “Risk Factors” in our Annual Report on Form 10-K for the year ended December 31, 2019, our Quarterly Report on Form 10-Q for the quarter ended September 30, 2020 and subsequent filings with the SEC filed from time-to-time. With respect to our expectations regarding our service gross margin target, we are not able to provide a quantitative reconciliation of non-GAAP gross margin measure to the corresponding GAAP measures without unreasonable efforts. The only difference between GAAP and non-GAAP is the exclusion of stock-based compensation. 2 Proprietary and Confidential

BLOOM ENERGY’S SERVICE BUSINESS AT A GLANCE $3.4B ~$150M ~40% 20% 1 Service Backlog 2021 Service 2021 YoY Revenue New Service Contract Revenue Estimate Growth Estimate Gross Margin Target 100% >650 15 Years >5 Years Service Contract Unique Sites Globally with Average Remaining Useful Life of Latest Bloom Attach Rate Bloom Power Modules Contract Term Power Modules 3 Proprietary and Confidential 1. Includes value of contracts from backlog and installed base; assuming annual renewals per contract terms and no cancellations.BLOOM ENERGY’S SERVICE BUSINESS AT A GLANCE $3.4B ~$150M ~40% 20% 1 Service Backlog 2021 Service 2021 YoY Revenue New Service Contract Revenue Estimate Growth Estimate Gross Margin Target 100% >650 15 Years >5 Years Service Contract Unique Sites Globally with Average Remaining Useful Life of Latest Bloom Attach Rate Bloom Power Modules Contract Term Power Modules 3 Proprietary and Confidential 1. Includes value of contracts from backlog and installed base; assuming annual renewals per contract terms and no cancellations.

SERVICE OFFERING OVERVIEW • 24/7 remote monitoring Remote • Fleet performance optimization ~10% Monitoring and (power, efficiency, reliability) Diagnostics of Service Cost • Analytics and field service dispatch Installed Base Unit Fixed • Preventive maintenance (filters Cost and adsorbents) Parts and Labor ~25% (Level 1) • Minor repair and replacements of Service Cost (fans, blowers and electronics) Life, Reliability, • Removal and replacement Reuse Power Modules • Repair and overhaul ~65% (Level 2) of Service Cost Cost • Refurbishment 4 Proprietary and ConfidentialSERVICE OFFERING OVERVIEW • 24/7 remote monitoring Remote • Fleet performance optimization ~10% Monitoring and (power, efficiency, reliability) Diagnostics of Service Cost • Analytics and field service dispatch Installed Base Unit Fixed • Preventive maintenance (filters Cost and adsorbents) Parts and Labor ~25% (Level 1) • Minor repair and replacements of Service Cost (fans, blowers and electronics) Life, Reliability, • Removal and replacement Reuse Power Modules • Repair and overhaul ~65% (Level 2) of Service Cost Cost • Refurbishment 4 Proprietary and Confidential

VALUE PROPOSITION Value to Bloom Customers Value to Bloom Always-on Power / Availability Annuity-Based Income Performance Certainty Ability to Expand Margins through (Availability, Power and Efficiency) Cost-Out, Upgrade and Refurbishment Pipeline Incentives Aligned Contractual Availability Commitments Based on Reliable, Long-Term Partner Intersection of Customer Needs and Bloom’s Ability to Deliver Closeness to Customer, Understanding of Access to Latest Fuel Cell Technology Updates Evolving Customer Needs Value to Customers Delivered via Reliable, Always-On, Resilient Power 5 Proprietary and ConfidentialVALUE PROPOSITION Value to Bloom Customers Value to Bloom Always-on Power / Availability Annuity-Based Income Performance Certainty Ability to Expand Margins through (Availability, Power and Efficiency) Cost-Out, Upgrade and Refurbishment Pipeline Incentives Aligned Contractual Availability Commitments Based on Reliable, Long-Term Partner Intersection of Customer Needs and Bloom’s Ability to Deliver Closeness to Customer, Understanding of Access to Latest Fuel Cell Technology Updates Evolving Customer Needs Value to Customers Delivered via Reliable, Always-On, Resilient Power 5 Proprietary and Confidential

KEY DRIVERS OF OUR SERVICE PERFORMANCE • Power module installed life • Beginning of life efficiency and rate of degradation Power Module Life 1 • More power per unit = fewer units Service Cost • Power module replacement cost Unit Cost 2 • Replacement with a new or refurbished system Expected to be Profitable in 2021 and 20% Target Gross Margin by 2025 6 Proprietary and ConfidentialKEY DRIVERS OF OUR SERVICE PERFORMANCE • Power module installed life • Beginning of life efficiency and rate of degradation Power Module Life 1 • More power per unit = fewer units Service Cost • Power module replacement cost Unit Cost 2 • Replacement with a new or refurbished system Expected to be Profitable in 2021 and 20% Target Gross Margin by 2025 6 Proprietary and Confidential

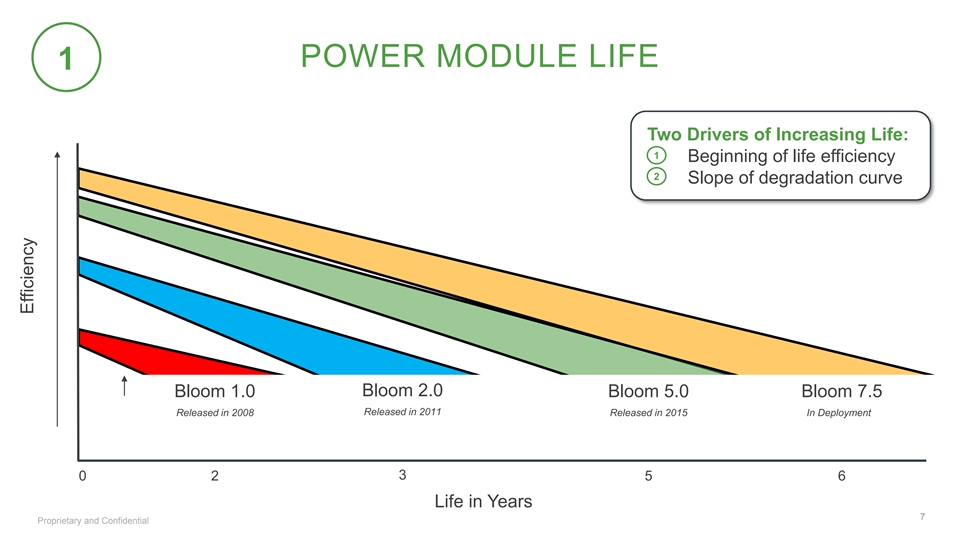
POWER MODULE LIFE 1 Two Drivers of Increasing Life: 1 • Beginning of life efficiency 2 • Slope of degradation curve Bloom 2.0 Bloom 1.0 Bloom 5.0 Bloom 7.5 Released in 2011 Released in 2008 Released in 2015 In Deployment 3 0 2 5 6 Life in Years 7 Proprietary and Confidential EfficiencyPOWER MODULE LIFE 1 Two Drivers of Increasing Life: 1 • Beginning of life efficiency 2 • Slope of degradation curve Bloom 2.0 Bloom 1.0 Bloom 5.0 Bloom 7.5 Released in 2011 Released in 2008 Released in 2015 In Deployment 3 0 2 5 6 Life in Years 7 Proprietary and Confidential Efficiency

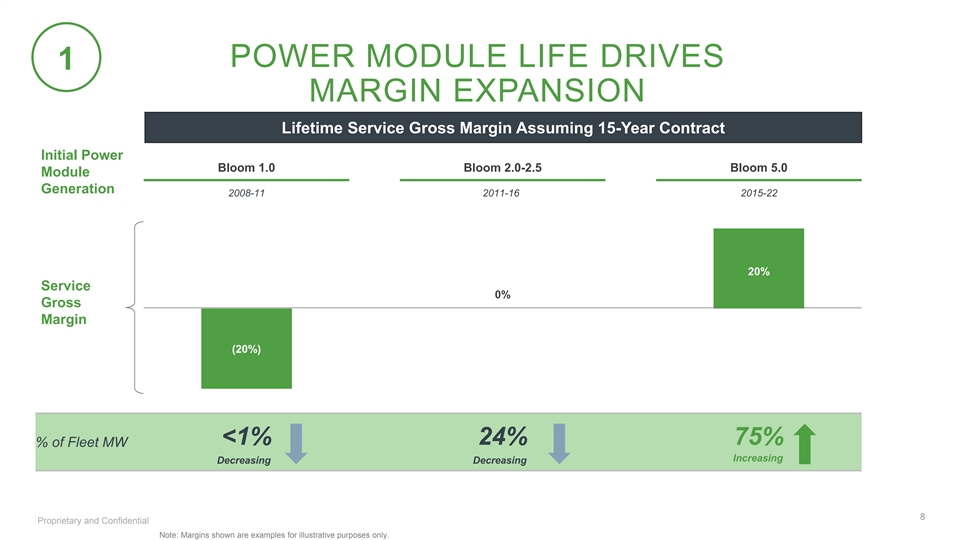
POWER MODULE LIFE DRIVES 1 MARGIN EXPANSION Lifetime Service Gross Margin Assuming 15-Year Contract Initial Power Bloom 1.0 Bloom 2.0-2.5 Bloom 5.0 Module Generation 2008-11 2011-16 2015-22 20% Service 0% Gross Margin (20%) <1% 24% 75% % of Fleet MW Increasing Decreasing Decreasing 8 Proprietary and Confidential Note: Margins shown are examples for illustrative purposes only. POWER MODULE LIFE DRIVES 1 MARGIN EXPANSION Lifetime Service Gross Margin Assuming 15-Year Contract Initial Power Bloom 1.0 Bloom 2.0-2.5 Bloom 5.0 Module Generation 2008-11 2011-16 2015-22 20% Service 0% Gross Margin (20%) <1% 24% 75% % of Fleet MW Increasing Decreasing Decreasing 8 Proprietary and Confidential Note: Margins shown are examples for illustrative purposes only.

REPLACEMENT COST 2 Power Module Cost ($ / kW) Parts & Labor Cost ($ / kW) Lower Cost per Lower Parts and Power Module Labor Cost (40%) (71%) ~(30%) ~(25%) 2015 2020 2025 2015 2020 2025 9 Proprietary and ConfidentialREPLACEMENT COST 2 Power Module Cost ($ / kW) Parts & Labor Cost ($ / kW) Lower Cost per Lower Parts and Power Module Labor Cost (40%) (71%) ~(30%) ~(25%) 2015 2020 2025 2015 2020 2025 9 Proprietary and Confidential

BLOOM POWER MODULE IMPROVEMENTS BY GENERATION Generation Bloom 1.0 Bloom 2.0 Bloom 2.5 Bloom 5.0 Bloom 7.5 Deployment 2008-11 2011-13 2013-16 2015-22 2021+ Module Power 25 kW 33 kW 42 kW 50 kW 75 kW Increased Power Module Output Footprint % of Fleet MW <1% 4% 20% 75% 0% Portfolio Generation Mix Improving Measured Avg. Life 1.8 Years 2.8 Years 4.9 Years >5 Year (Proj.) 6 Year (Target) Increased Power Module Life Decreasing Costs per Power Generated Unit Cost / Output (Indexed) 100 66 57 - 35 39 - 14 <14 10 Proprietary and ConfidentialBLOOM POWER MODULE IMPROVEMENTS BY GENERATION Generation Bloom 1.0 Bloom 2.0 Bloom 2.5 Bloom 5.0 Bloom 7.5 Deployment 2008-11 2011-13 2013-16 2015-22 2021+ Module Power 25 kW 33 kW 42 kW 50 kW 75 kW Increased Power Module Output Footprint % of Fleet MW <1% 4% 20% 75% 0% Portfolio Generation Mix Improving Measured Avg. Life 1.8 Years 2.8 Years 4.9 Years >5 Year (Proj.) 6 Year (Target) Increased Power Module Life Decreasing Costs per Power Generated Unit Cost / Output (Indexed) 100 66 57 - 35 39 - 14 <14 10 Proprietary and Confidential

HOW IT WORKS IN PRACTICE: ILLUSTRATIVE PRODUCT LIFECYCLE Bloom 1.0 Bloom 2.0 Bloom 2.5 Bloom 5.0 Power Module Life 2 3 5 >5 (Years) 1 Unit Cost 100 66 57 - 35 39 - 14 Refurbished Power Module Replacement + Upgrade to Power Module Bloom 5.0 Replacement Performance Power + Upgrade to Module Bloom 2.5 Replacement + Upgrade to Bloom 2.0 0 2 5 10 15 (2009) (2011) (2014) (2019) (2024) 11 Proprietary and Confidential 1. Actual dollar costs indexed to 100 with Bloom 1.0. Year EfficiencyHOW IT WORKS IN PRACTICE: ILLUSTRATIVE PRODUCT LIFECYCLE Bloom 1.0 Bloom 2.0 Bloom 2.5 Bloom 5.0 Power Module Life 2 3 5 >5 (Years) 1 Unit Cost 100 66 57 - 35 39 - 14 Refurbished Power Module Replacement + Upgrade to Power Module Bloom 5.0 Replacement Performance Power + Upgrade to Module Bloom 2.5 Replacement + Upgrade to Bloom 2.0 0 2 5 10 15 (2009) (2011) (2014) (2019) (2024) 11 Proprietary and Confidential 1. Actual dollar costs indexed to 100 with Bloom 1.0. Year Efficiency

HOW IT WORKS IN PRACTICE: ILLUSTRATIVE HISTORICAL VIEW Power Module Replacement + Upgrade to Bloom 2.0 Power Module Replacement + Upgrade to Bloom 2.5 Refurbished Power Module Replacement + Upgrade to Annual Bloom 5.0 Performance Revenue Annual Cost 2009 2010 2011 2012 2013 2014 2015 2016 2017 2018 2019 2020 2021 2022 Cumulative Revenue 2.0x 5.0x 10.0x 16.0x All revenue, cost and profit Cumulative Cost 5.4x 9.0x 12.0x 14.3x benchmarked in units of 1 year of service revenue Cumulative Gross Profit (3.4x) (4.0x) (2.0x) 1.7x 12 Proprietary and Confidential Approx. Dollars YearHOW IT WORKS IN PRACTICE: ILLUSTRATIVE HISTORICAL VIEW Power Module Replacement + Upgrade to Bloom 2.0 Power Module Replacement + Upgrade to Bloom 2.5 Refurbished Power Module Replacement + Upgrade to Annual Bloom 5.0 Performance Revenue Annual Cost 2009 2010 2011 2012 2013 2014 2015 2016 2017 2018 2019 2020 2021 2022 Cumulative Revenue 2.0x 5.0x 10.0x 16.0x All revenue, cost and profit Cumulative Cost 5.4x 9.0x 12.0x 14.3x benchmarked in units of 1 year of service revenue Cumulative Gross Profit (3.4x) (4.0x) (2.0x) 1.7x 12 Proprietary and Confidential Approx. Dollars Year

HOW IT WORKS IN PRACTICE: 1 ILLUSTRATIVE CURRENT CONTRACT Service Contract Cumulative Economics ($M) Consistently profitable services contract Cumulative Revenue Cumulative Cost 1 2 3 4 5 6 7 8 9 10 11 12 13 14 15 First Power Module Second Power Module Replacements Replacements 13 Proprietary and Confidential 1. Assumes 1 MW 15-year PPA contract.HOW IT WORKS IN PRACTICE: 1 ILLUSTRATIVE CURRENT CONTRACT Service Contract Cumulative Economics ($M) Consistently profitable services contract Cumulative Revenue Cumulative Cost 1 2 3 4 5 6 7 8 9 10 11 12 13 14 15 First Power Module Second Power Module Replacements Replacements 13 Proprietary and Confidential 1. Assumes 1 MW 15-year PPA contract.

COMBINED P&L IMPACT OF CONTRACTS Combined Economics of Services Contracts ($M) Revenue 20% Target Gross Margin by 2025 Cost Breakeven in Q1’21 2015-2017 2018-2020 2021 2023 2025 (Average) (Average) 14 Proprietary and ConfidentialCOMBINED P&L IMPACT OF CONTRACTS Combined Economics of Services Contracts ($M) Revenue 20% Target Gross Margin by 2025 Cost Breakeven in Q1’21 2015-2017 2018-2020 2021 2023 2025 (Average) (Average) 14 Proprietary and Confidential

KEY TAKEAWAYS Service Represents Attractive Recurring Revenue Stream with 100% Product Attach Rate Yearly Profitability Expected in 2021 Scalability and Cost-out to Drive to 20% Target Service Gross Margin by 2025 15 Proprietary and ConfidentialKEY TAKEAWAYS Service Represents Attractive Recurring Revenue Stream with 100% Product Attach Rate Yearly Profitability Expected in 2021 Scalability and Cost-out to Drive to 20% Target Service Gross Margin by 2025 15 Proprietary and Confidential

T H A N K Y O U – Q&A F E B R U A RY 2 0 2 1 16 Proprietary and ConfidentialT H A N K Y O U – Q&A F E B R U A RY 2 0 2 1 16 Proprietary and Confidential
