Attached files
| file | filename |
|---|---|
| 8-K - TRUEBLUE FORM 8-K - TrueBlue, Inc. | tbi-20210222.htm |


Forward-Looking Statements

Investment highlights Return of Capital Attractive growth potential from secular, cyclical and post-Covid recovery factors Strong balance sheet and cash flow to support stock buybacks Sound growth strategies applying industry leading digital technology to increase market share

Our Mission: Connecting People and Work 99,000 Clients served annually with strong diversity1 490,000 People connected to work during 2020 One of the largest U.S. industrial staffing providers One of the largest global RPO providers2 Returning Value to Shareholders (Share Repurchases last 5 years) 2015-2020 Free Cash Flow3 CAGR $1.8B 2020 Revenue 19% Growth $169M HRO Today magazine repeatedly recognizes PeopleScout as a global market leader Thousands of veterans hired each year via internal programs as well as Hiring Our Heroes and Wounded Warriors Recognized for breakthrough board practices that promote greater diversity and inclusion 1 No single client accounted for more than 4% of total revenue for FY 2020. 2 Source: Evolution of RPO: Meeting Hiring Needs for the Workplace of the 2020s. NelsonHall, September 2020. 3 Calculated as net cash provided by operating activities minus purchases for property and equipment. All segments earned the Top Workplaces USA Award issued by Energage

PeopleReady PeopleManagement PeopleScout Revenue mix1 60% 32% 9% Segment profit mix1 73% 20% 8% Segment profit margin 4% 2% 3% Three specialized segments meet diverse client needs Contingent, on-site industrial staffing and commercial driver services Talent solutions for outsourcing the recruiting process for permanent employees 1 Revenue and segment profit calculations based on FY 2020. Figures may not sum due to rounding.
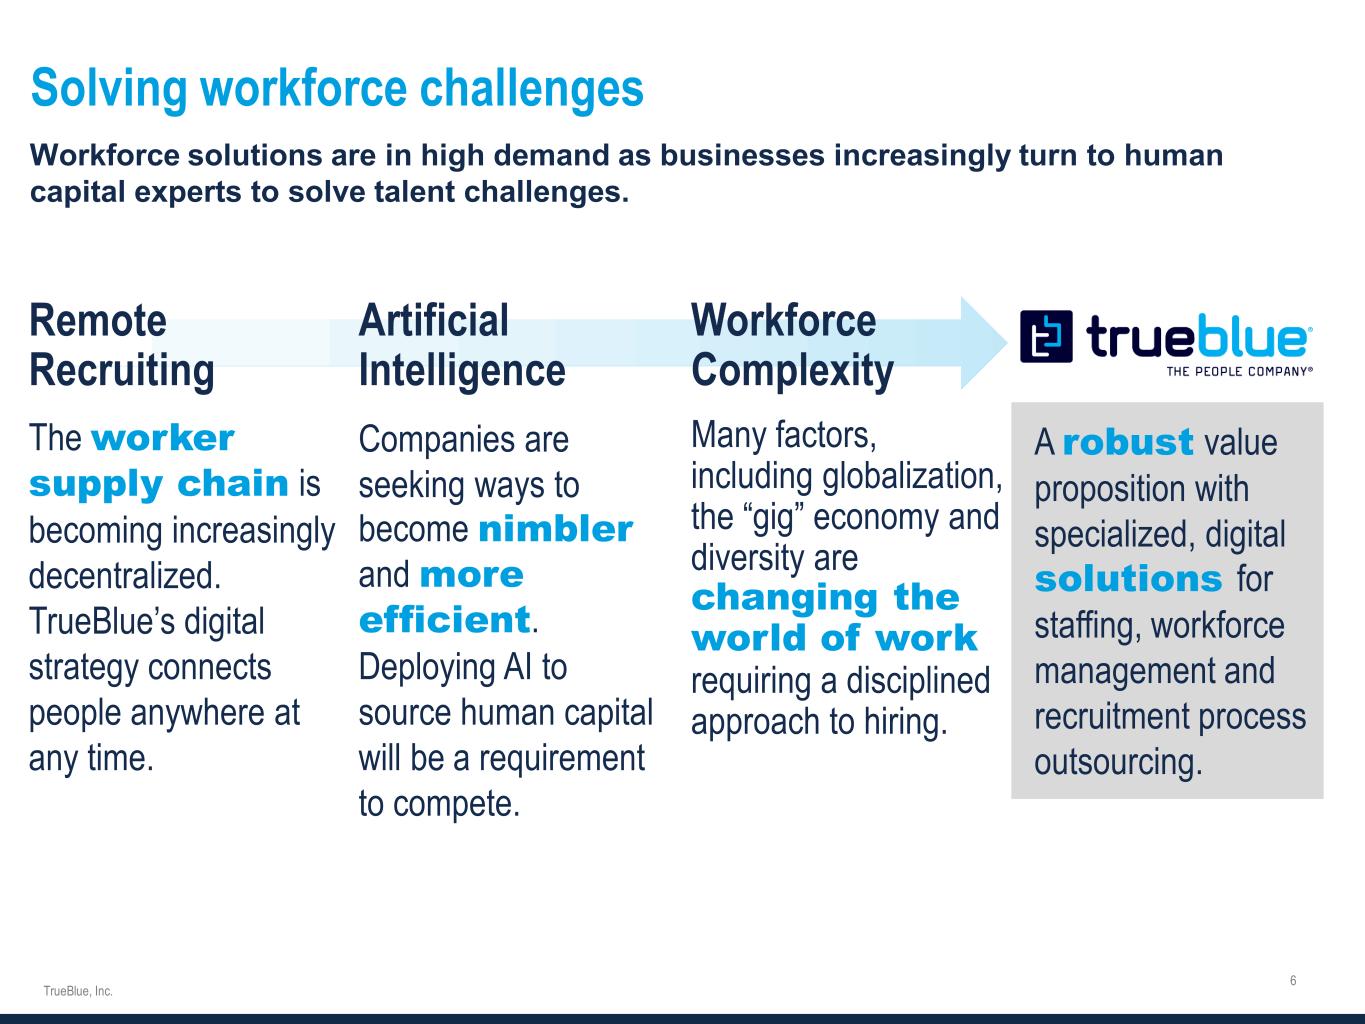
Solving workforce challenges changing the world of work nimbler more efficient worker supply chain robust solutions

-7% -25% 27% 0% -20% 15% 2008 2009 2010 2019 2020P 2021P U.S. Industrial Staffing poised for post-Covid rebound 1Staffing Industry Analyst reports: Industrial Staffing Growth Assessment: 2020 Update (December 2020). Industrial temp staffing includes various occupations such as: laborers, packers, construction workers, skilled trades, machinists, janitors, etc. U.S. Industrial Temp Staffing Revenue Growth1 2008-10 Recession Recovery Current Recession The industry rebounds quickly in the early stages of a recovery
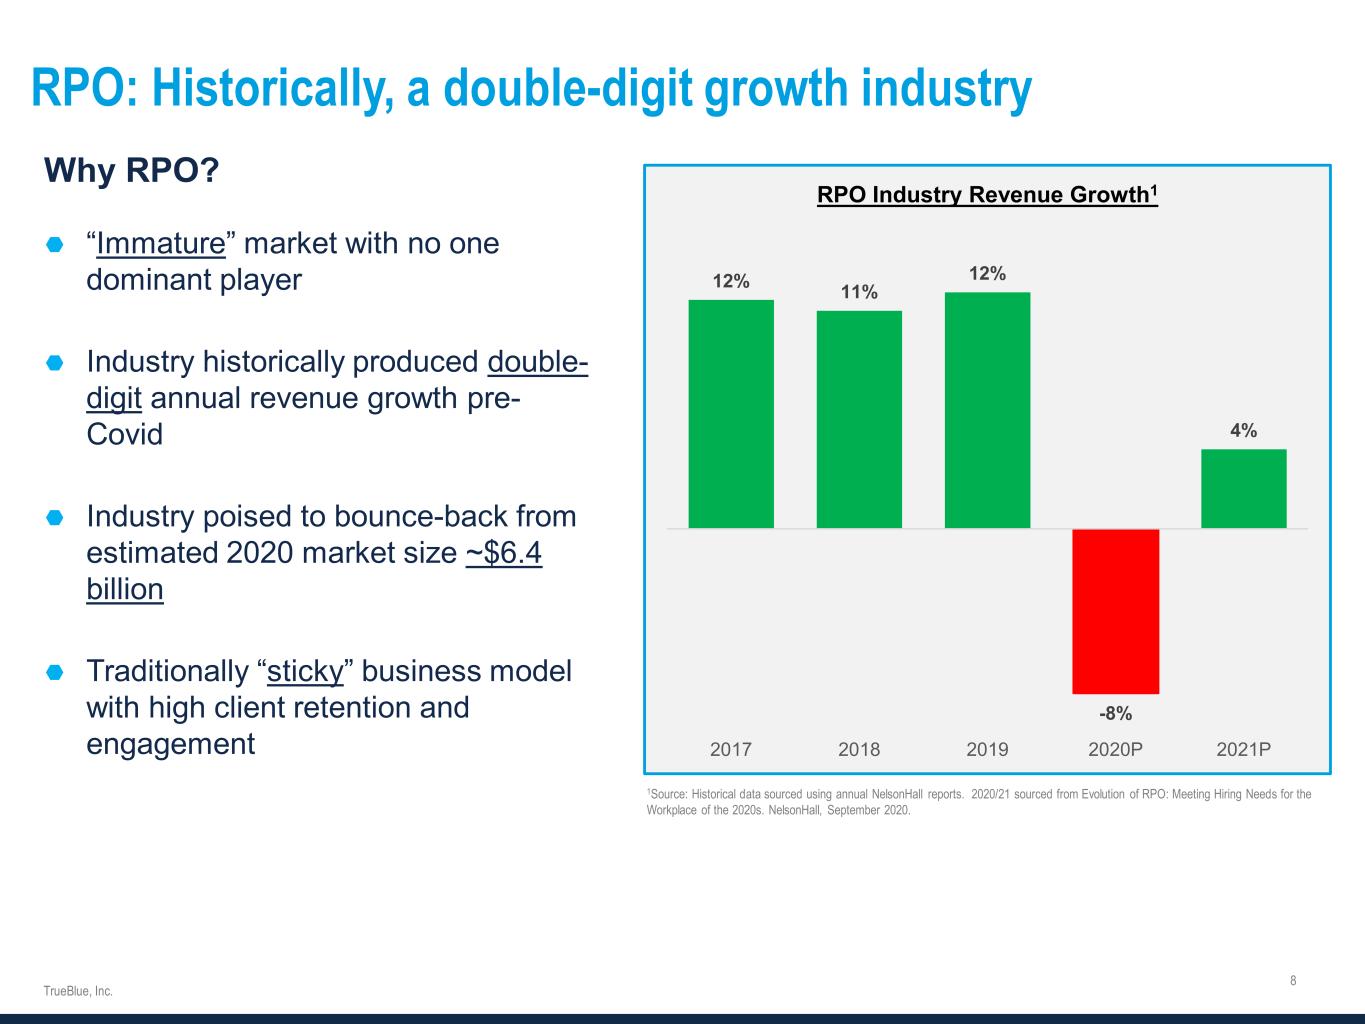
RPO: Historically, a double-digit growth industry Why RPO? “Immature” market with no one dominant player Industry historically produced double- digit annual revenue growth pre- Covid Industry poised to bounce-back from estimated 2020 market size ~$6.4 billion Traditionally “sticky” business model with high client retention and engagement 1Source: Historical data sourced using annual NelsonHall reports. 2020/21 sourced from Evolution of RPO: Meeting Hiring Needs for the Workplace of the 2020s. NelsonHall, September 2020. 12% 11% 12% -8% 4% 2017 2018 2019 2020P 2021P RPO Industry Revenue Growth1

Strategically positioned for secular growth Strong position in attractive vertical markets Powerful secular forces in industrial staffing Positive Demographic Trends Compelling Technology Capitalizing on Industry Evolution 18% 18% 20% 24% FY 2020 Mix by Vertical Co ns tru ct io n M an uf ac tu rin g Tr an sp or ta tio n Re ta il
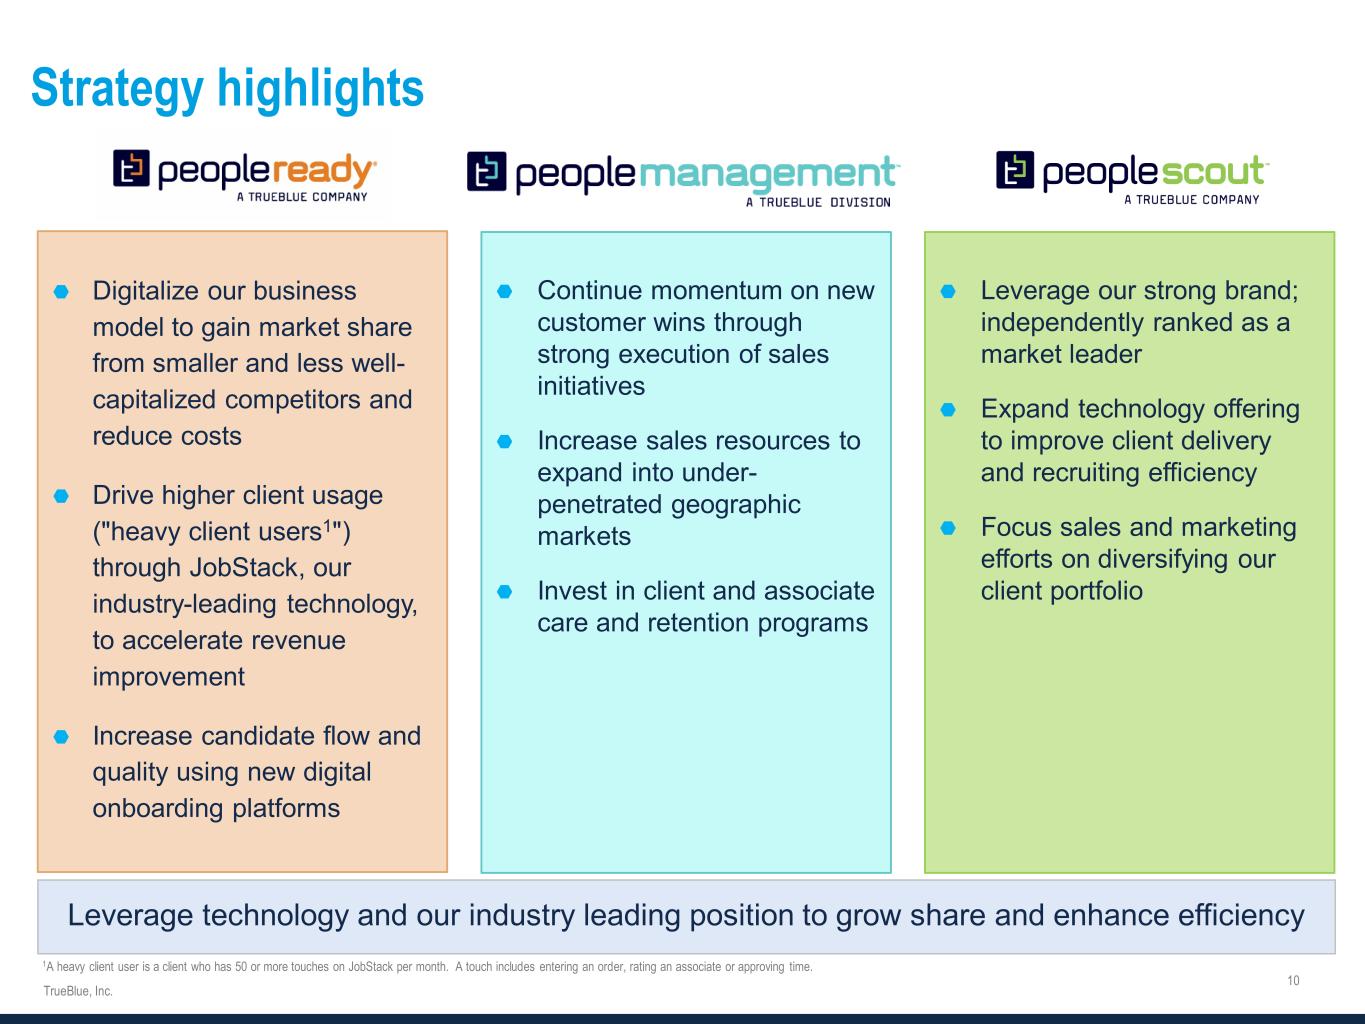
Strategy highlights Leverage technology and our industry leading position to grow share and enhance efficiency Digitalize our business model to gain market share from smaller and less well- capitalized competitors and reduce costs Drive higher client usage ("heavy client users1") through JobStack, our industry-leading technology, to accelerate revenue improvement Increase candidate flow and quality using new digital onboarding platforms Continue momentum on new customer wins through strong execution of sales initiatives Increase sales resources to expand into under- penetrated geographic markets Invest in client and associate care and retention programs Leverage our strong brand; independently ranked as a market leader Expand technology offering to improve client delivery and recruiting efficiency Focus sales and marketing efforts on diversifying our client portfolio 1A heavy client user is a client who has 50 or more touches on JobStack per month. A touch includes entering an order, rating an associate or approving time.
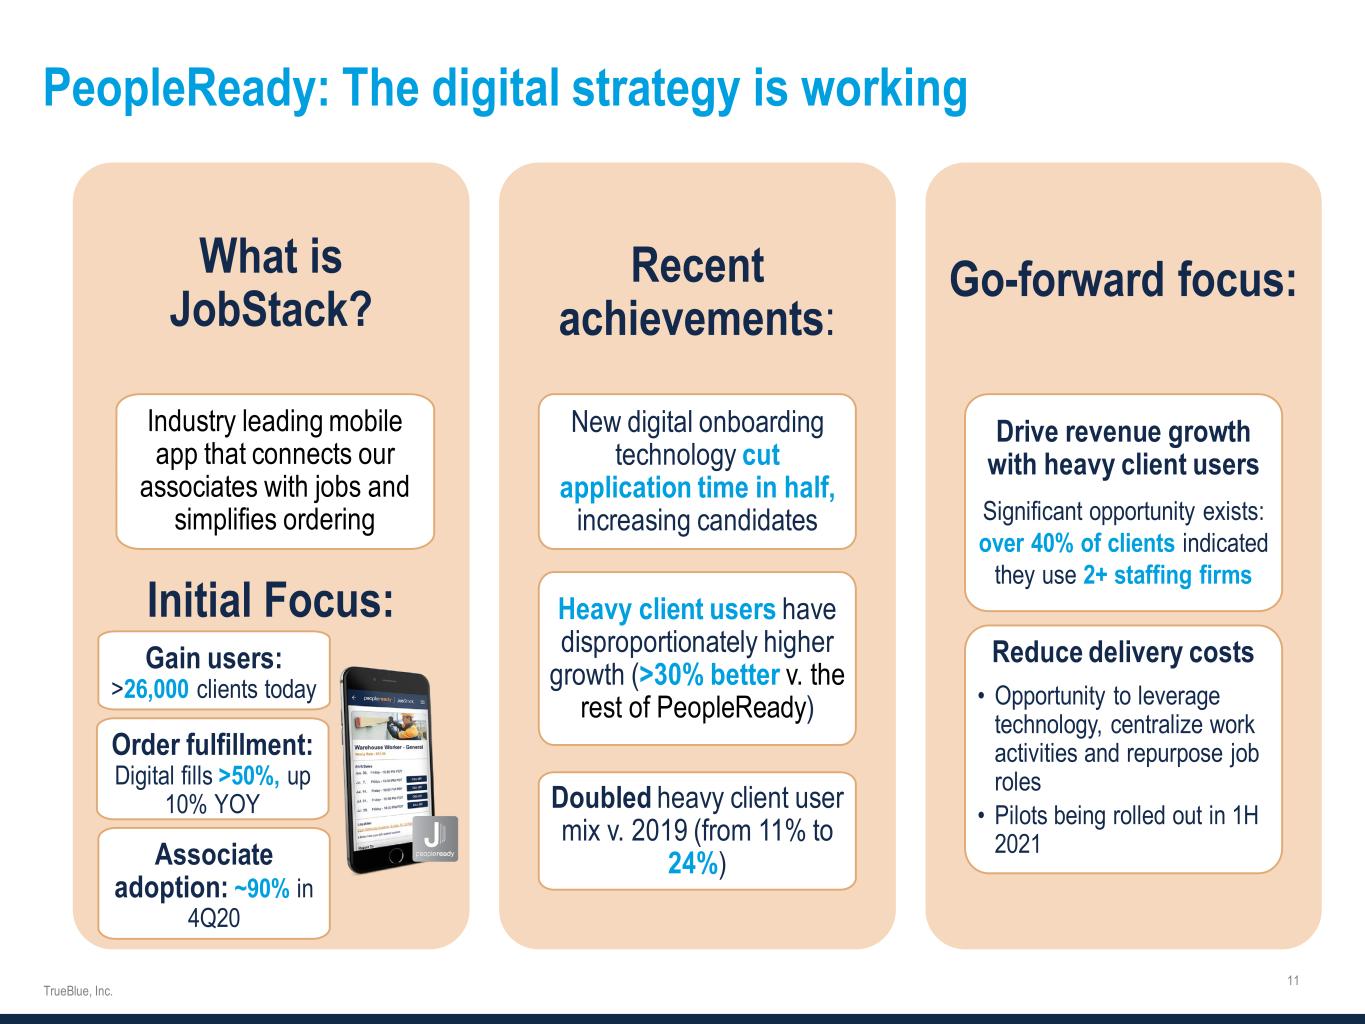
PeopleReady: The digital strategy is working What is JobStack? Initial Focus: Industry leading mobile app that connects our associates with jobs and simplifies ordering Order fulfillment: Digital fills >50%, up 10% YOY Recent achievements: New digital onboarding technology cut application time in half, increasing candidates Heavy client users have disproportionately higher growth (>30% better v. the rest of PeopleReady) Doubled heavy client user mix v. 2019 (from 11% to 24%) Go-forward focus: Drive revenue growth with heavy client users Significant opportunity exists: over 40% of clients indicated they use 2+ staffing firms Reduce delivery costs • Opportunity to leverage technology, centralize work activities and repurpose job roles • Pilots being rolled out in 1H 2021 Gain users: >26,000 clients today Associate adoption: ~90% in 4Q20

Q119 Q219 Q319 Q419 Q120 Q220 Q320 Q420 JobStack Heavy Client User success story Customer Profile: Midwest Food Producer and Distributor Long-time PeopleReady Client PeopleReady Service Overview: Supplied associates for one shift Filled a narrow set of positions Shared relationship with another staffing agency, which placed temp to perm workers Branches fill orders, provide customer service and troubleshoot issues The JobStack Value Ability to fill more positions across all shifts Access to a variety of positions Elimination of multiple staffing agencies Branch focus shifted to customer service and troubleshooting vs. sourcing associates JobStack Adoption 4x Annual Revenue Growth Revenue Trend

PeopleManagement: Expanding market share PeopleManagement proved more resilient during the pandemic due to the outsourced nature of our client relationships and is well-positioned for growth The team is deploying a variety of tactics and strategies to expand market share o Launching effort focused on smaller, local markets o Hiring additional salespeople and condensing their geographic footprint o Expanding into new sites at National Account clients o Cross-selling with other TrueBlue brands Onsite Growth Opportunities Approximately 90% of Onsite revenue is in the East and Midwest

$181 $252 $160 2016 2019 2020 Revenue PeopleScout: Industry leader with historically high margins Strong Brand Recognition o #1 by HRO Today’s Total Workforce Solution Baker’s Dozen o 3rd largest North American and 4th largest global RPO provider Affinix Technology: A Differentiated Experience o Connects clients and candidates using AI, machine learnings and predictive analytics ideal in today’s remote recruiting landscape o Flexible platform with plans to monetize services our clients can use directly Strong Growth & Profitability Prospects o Demonstrated track record servicing large employers with dynamic needs in industries (hospitality, travel) positioned for a rebound o Segment margins expected to increase as scale returns o Expanding sales and client delivery teams to accelerate new business o Global focus as growing number of deals are multi-region and multi-country 19% 15% 3% 2016 2019 2020 Segment Profit Margin

ESG principles help us make sound decisions External ESG Ratings: AA Rating Risk Ranking: Low Risk Exposure: Low Risk Management: Avg Key Statistics: MSCI ESG industry leader (top 20% of all rated companies) 67% of Board Members are women or racially diverse 51% of Senior Management are women 97% of shareholders approved Executive Compensation How ESG guides our decision making: Risk Management framework development and governance Board of Directors oversight & governance Executive Compensation structure Compliance, Ethics and Code of Conduct policymaking
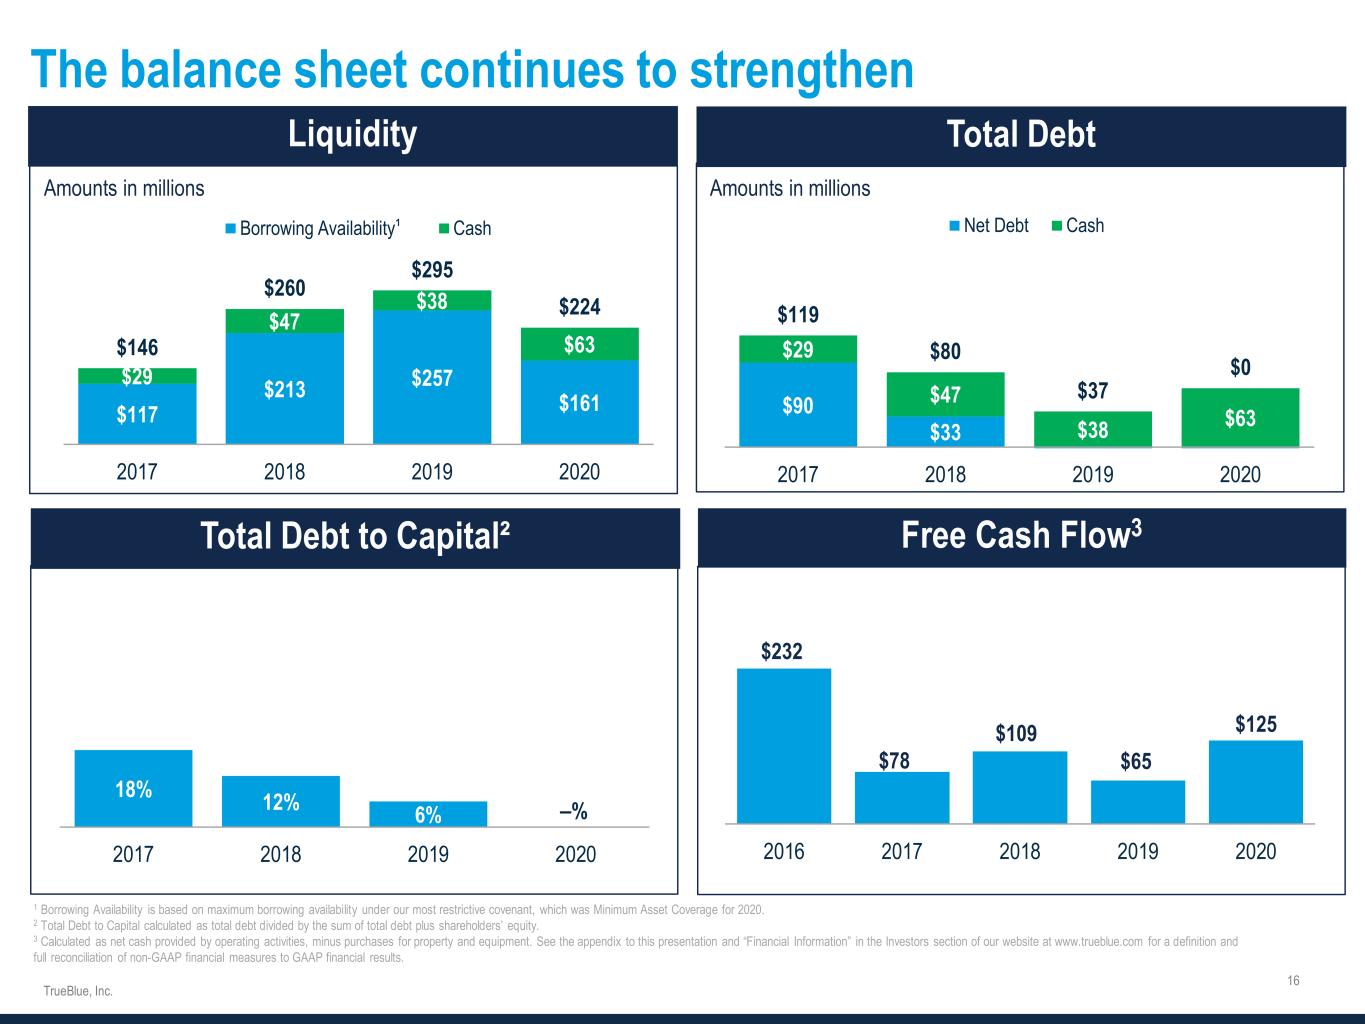
The balance sheet continues to strengthen 1 Borrowing Availability is based on maximum borrowing availability under our most restrictive covenant, which was Minimum Asset Coverage for 2020. 2 Total Debt to Capital calculated as total debt divided by the sum of total debt plus shareholders’ equity. 3 Calculated as net cash provided by operating activities, minus purchases for property and equipment. See the appendix to this presentation and “Financial Information” in the Investors section of our website at www.trueblue.com for a definition and full reconciliation of non-GAAP financial measures to GAAP financial results. 3 Amounts in millions Amounts in millions $232 $78 $109 $65 $125 2016 2017 2018 2019 2020 18% 12% 6% –% 2017 2018 2019 2020 $90 $33 $29 $47 $38 $63 $119 $80 $37 $0 2017 2018 2019 2020 Net Debt Cash $117 $213 $257 $161 $29 $47 $38 $63$146 $260 $295 $224 2017 2018 2019 2020 Borrowing Availability Cash¹

Strong track record of returning capital to shareholders $169 million of capital returned to shareholders via share repurchases over the last five years (2016-2020) 3.6M shares repurchased 9% reduction in shares outstanding Year 1 6.8M shares repurchased 17% reduction in shares outstanding 8.6M shares repurchased 21% reduction in shares outstanding 3 Years 5 Years


NON-GAAP FINANCIAL MEASURES AND NON-GAAP RECONCILIATIONS In addition to financial measures presented in accordance with U.S. GAAP, we monitor certain non-GAAP key financial measures. The presentation of these non-GAAP financial measures is used to enhance the understanding of certain aspects of our financial performance. It is not meant to be considered in isolation, superior to, or as a substitute for the directly comparable financial measures prepared in accordance with U.S. GAAP, and may not be comparable to similarly titled measures of other companies. Non-GAAP Measure Definition Purpose of Adjusted Measures Free cash flow Net cash provided by operating activities, minus cash purchases for property and equipment. - Used by management to assess cash flows. RECONCILIATION OF NET CASH PROVIDED BY OPERATING ACTIVITIES TO FREE CASH FLOWS (Unaudited) 2020 2019 2018 2017 2016 2015 52 Weeks Ended 52 Weeks Ended 52 Weeks Ended 52 Weeks Ended 53 Weeks Ended 52 Weeks Ended (in thousands) Dec 27, 2020 Dec 29, 2019 Dec 30, 2018 Dec 31, 2017 Jan 1, 2017 Dec 25, 2015 Net cash provided by operating activities $ 152,531 $ 93,531 $ 125,692 $ 100,134 $ 260,703 $ 72,072 Capital expenditures (27,066) (28,119) (17,054) (21,958) (29,042) (18,394) Free cash flows $ 125,465 $ 65,412 $ 108,638 $ 78,176 $ 231,661 $ 53,678
