Attached files
| file | filename |
|---|---|
| EX-99.1 - EX-99.1 - Tremont Mortgage Trust | trmt_123120xearningsrelease.htm |
| 8-K - 8-K - Tremont Mortgage Trust | trmt-20210219.htm |
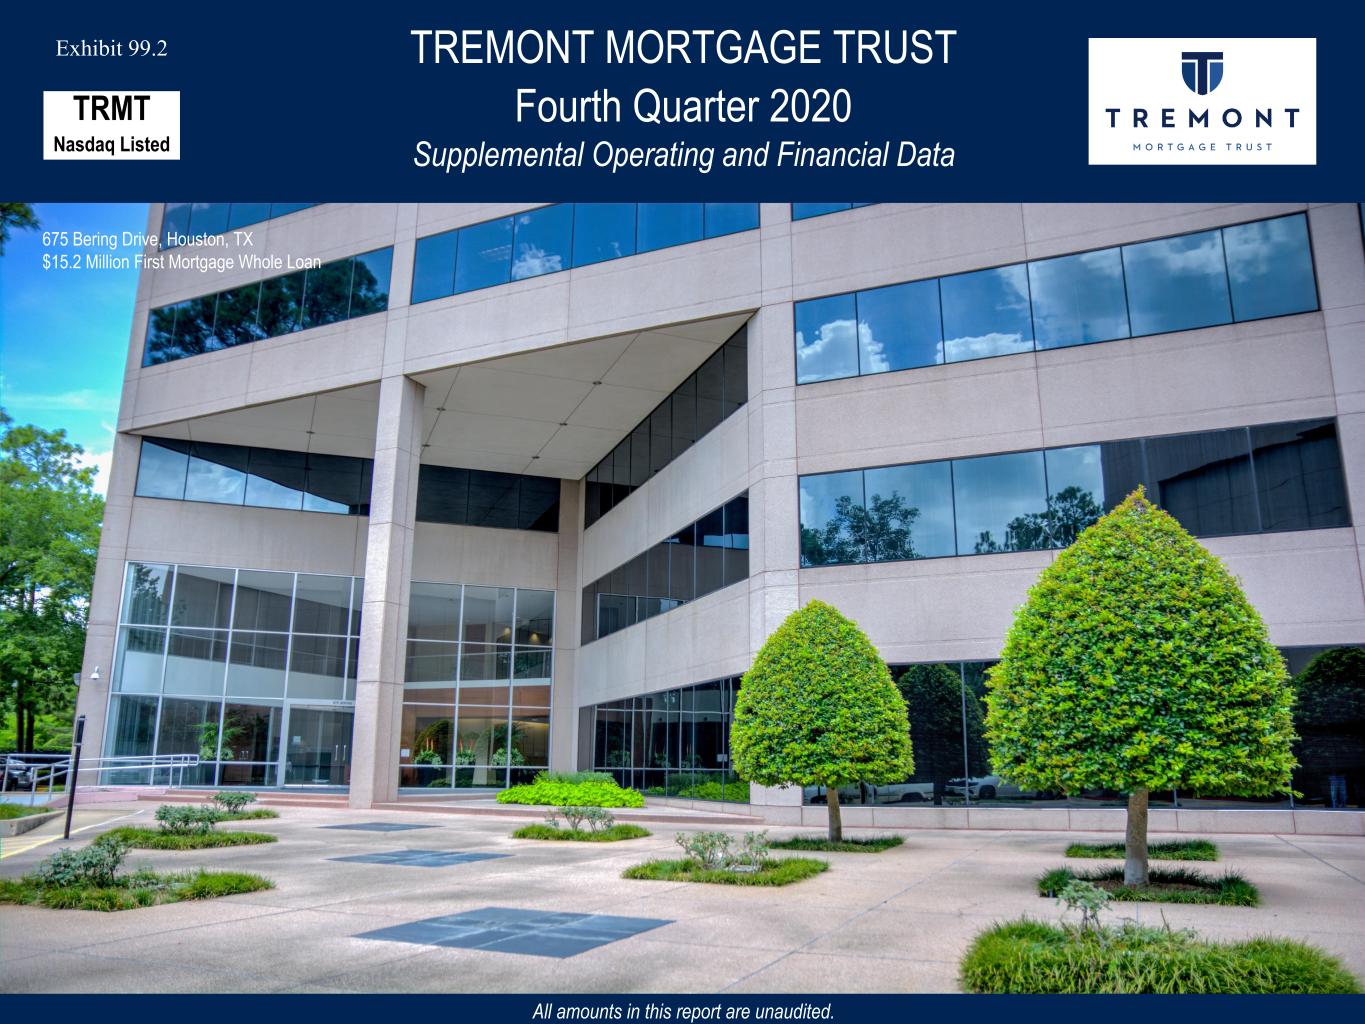
TREMONT MORTGAGE TRUST Fourth Quarter 2020 Supplemental Operating and Financial Data All amounts in this report are unaudited. Exhibit 99.2 TRMT Nasdaq Listed The Blazer Plaza, Dublin, OH $22.8 Million First Mortgage Whole Loan675 Bering Drive, Houston, TX $15.2 Million First Mortgage Whole Loan 675 Bering Drive, Houston, TX $15.2 Million First Mortgage Whole Loan
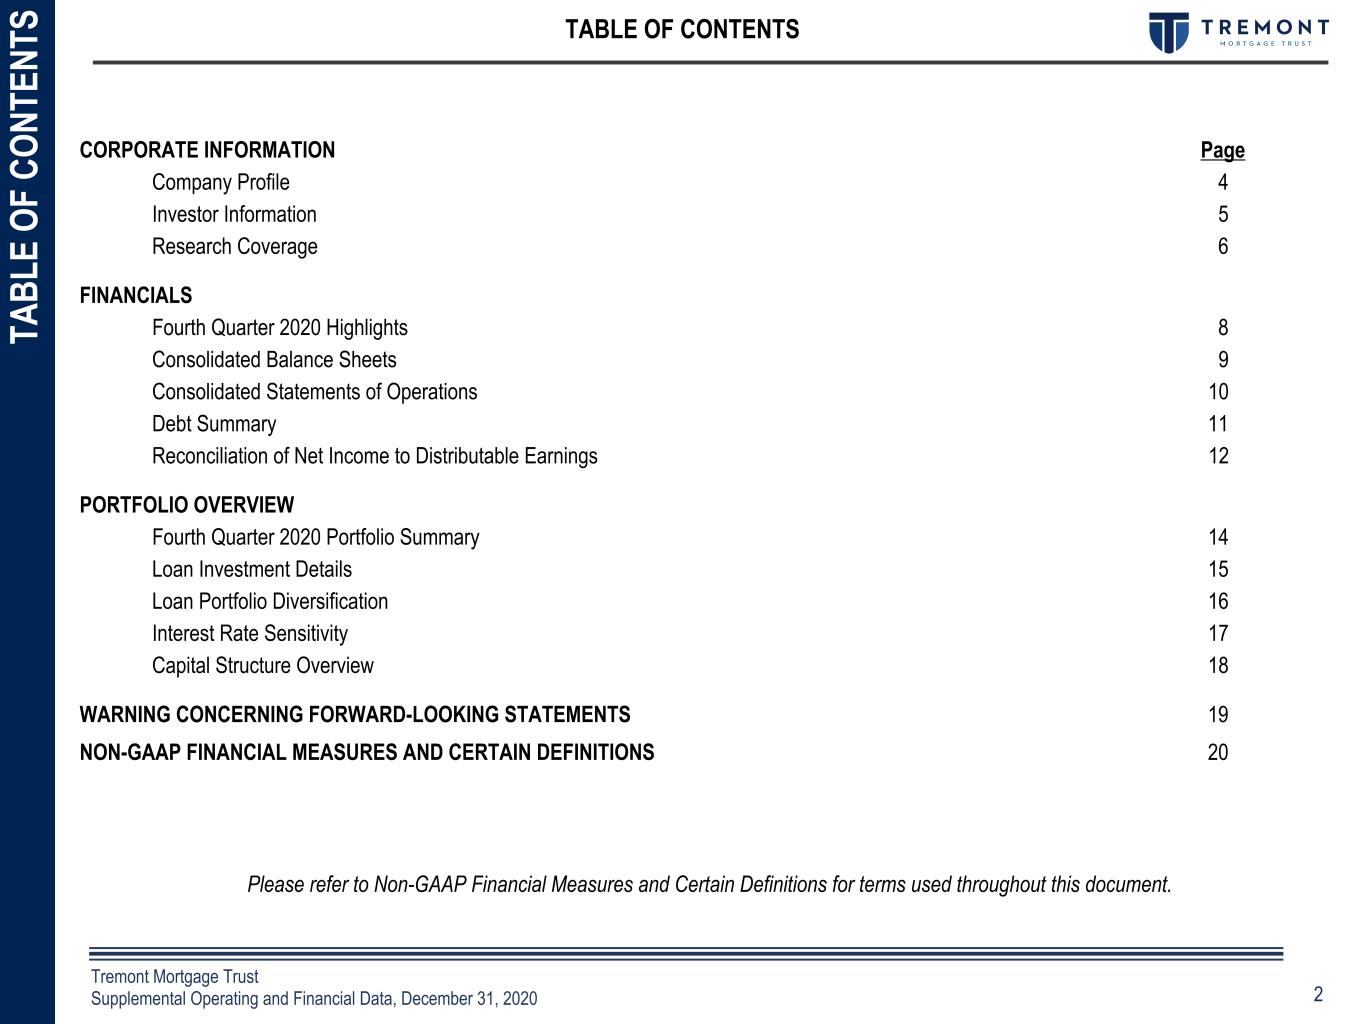
2Confidential Tremont Mortgage Trust Supplemental Operating and Financial Data, December 31, 2020 TABLE OF CONTENTS CORPORATE INFORMATION Page Company Profile 4 Investor Information 5 Research Coverage 6 FINANCIALS Fourth Quarter 2020 Highlights 8 Consolidated Balance Sheets 9 Consolidated Statements of Operations 10 Debt Summary 11 Reconciliation of Net Income to Distributable Earnings 12 PORTFOLIO OVERVIEW Fourth Quarter 2020 Portfolio Summary 14 Loan Investment Details 15 Loan Portfolio Diversification 16 Interest Rate Sensitivity 17 Capital Structure Overview 18 WARNING CONCERNING FORWARD-LOOKING STATEMENTS 19 NON-GAAP FINANCIAL MEASURES AND CERTAIN DEFINITIONS 20 Please refer to Non-GAAP Financial Measures and Certain Definitions for terms used throughout this document. TA BL E O F CO NT EN TS
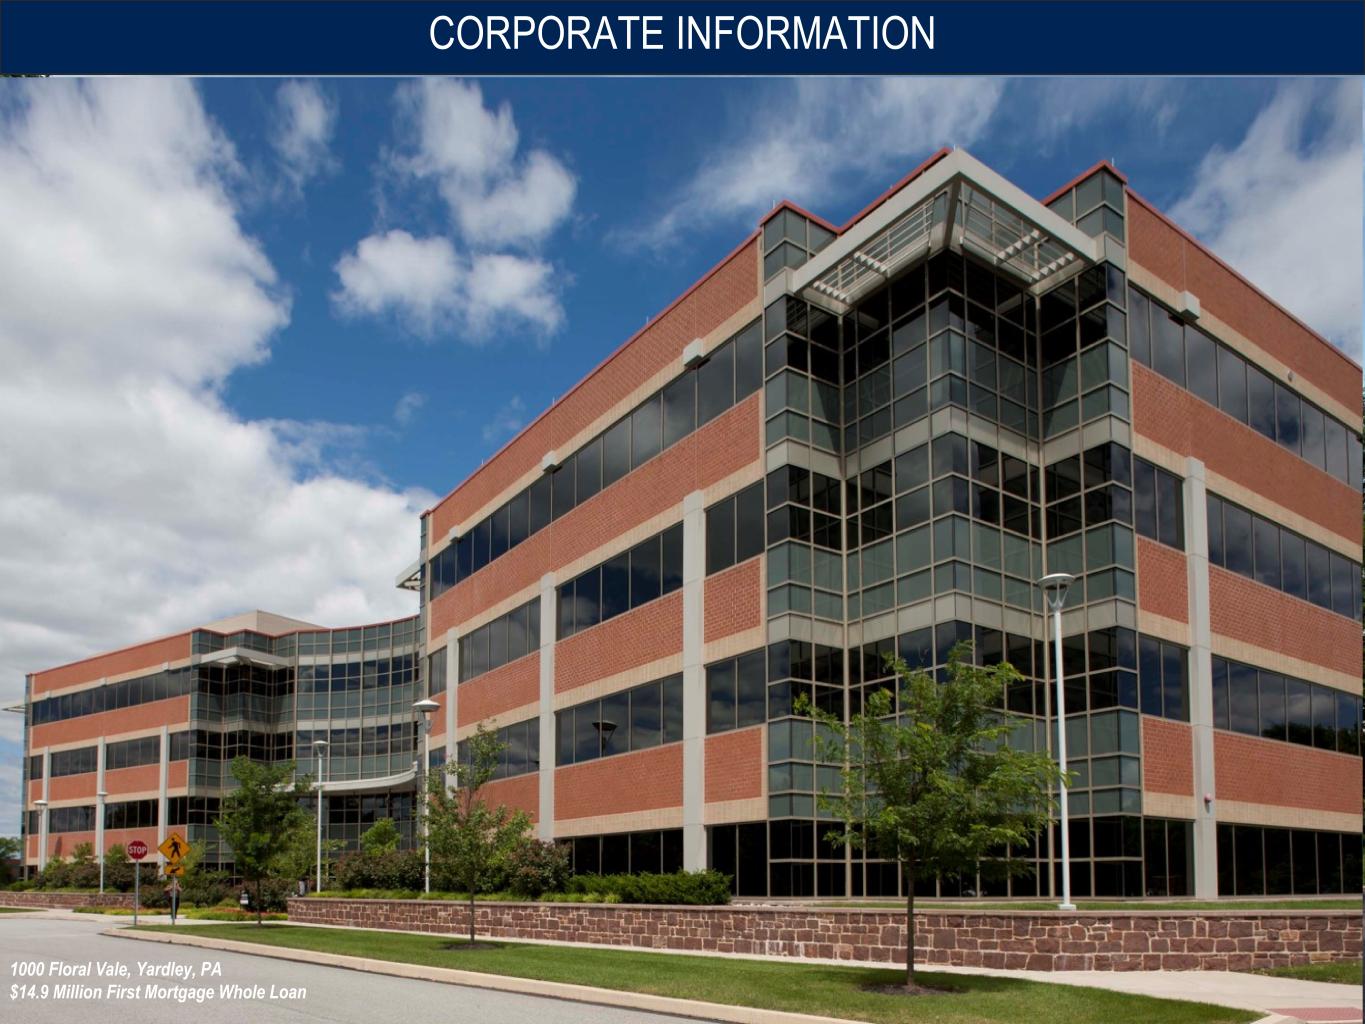
CORPORATE INFORMATION West Park II, St. Louis, MO Part of West Park I, West Park II and Pine View Point Office Portfolio $29.5 Million First Mortgage Whole Loan 1000 Floral Vale, Yardley, PA $14.9 Million First Mortgage Whole Loan
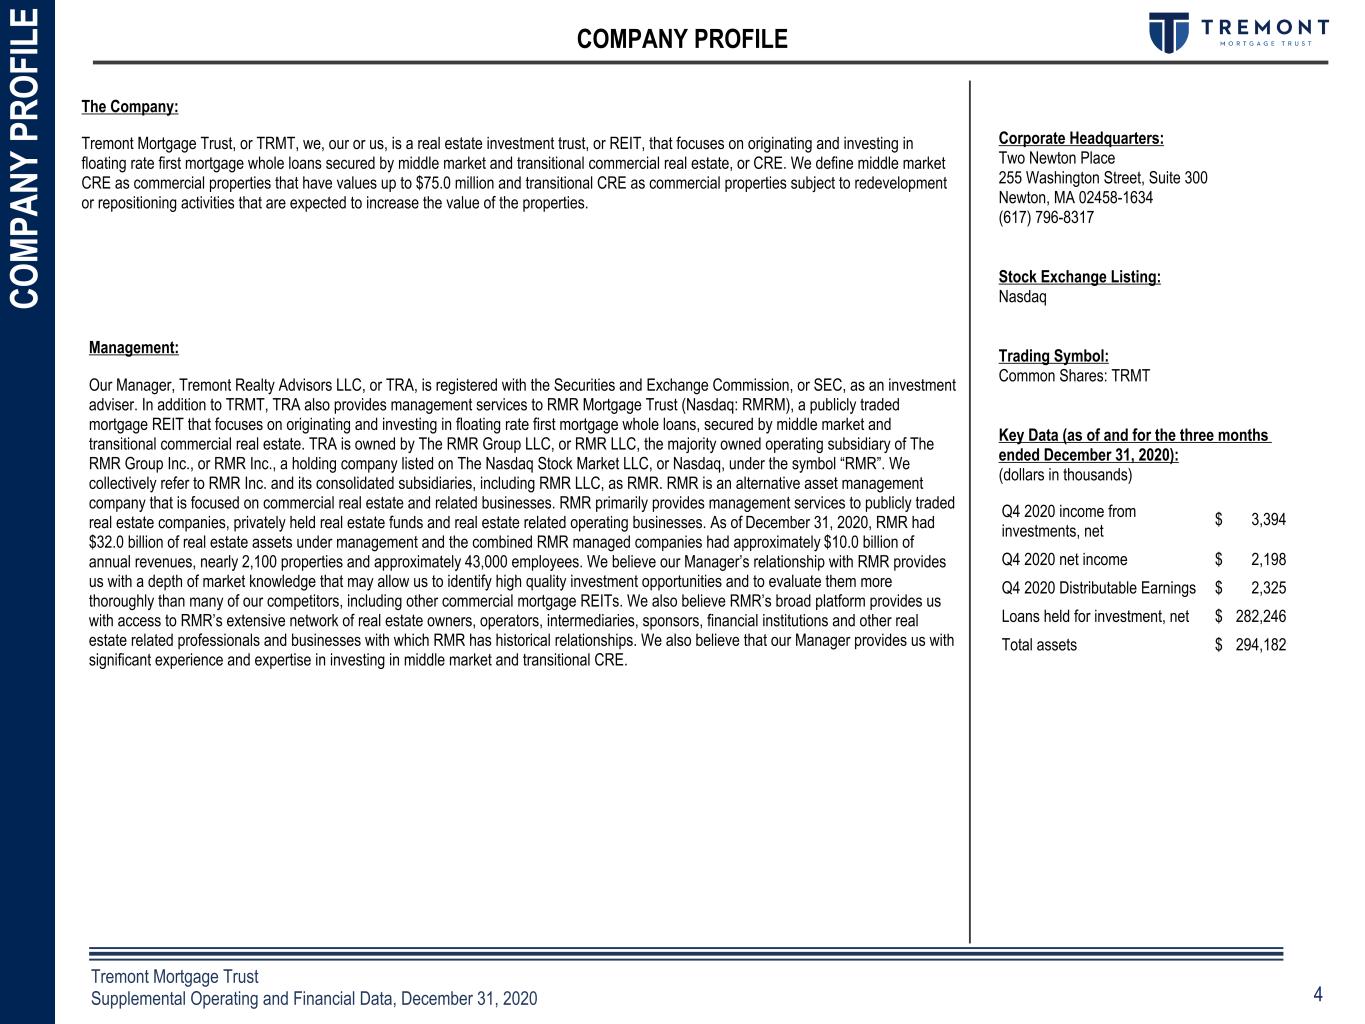
4Confidential Tremont Mortgage Trust Supplemental Operating and Financial Data, December 31, 2020 Management: Our Manager, Tremont Realty Advisors LLC, or TRA, is registered with the Securities and Exchange Commission, or SEC, as an investment adviser. In addition to TRMT, TRA also provides management services to RMR Mortgage Trust (Nasdaq: RMRM), a publicly traded mortgage REIT that focuses on originating and investing in floating rate first mortgage whole loans, secured by middle market and transitional commercial real estate. TRA is owned by The RMR Group LLC, or RMR LLC, the majority owned operating subsidiary of The RMR Group Inc., or RMR Inc., a holding company listed on The Nasdaq Stock Market LLC, or Nasdaq, under the symbol “RMR”. We collectively refer to RMR Inc. and its consolidated subsidiaries, including RMR LLC, as RMR. RMR is an alternative asset management company that is focused on commercial real estate and related businesses. RMR primarily provides management services to publicly traded real estate companies, privately held real estate funds and real estate related operating businesses. As of December 31, 2020, RMR had $32.0 billion of real estate assets under management and the combined RMR managed companies had approximately $10.0 billion of annual revenues, nearly 2,100 properties and approximately 43,000 employees. We believe our Manager’s relationship with RMR provides us with a depth of market knowledge that may allow us to identify high quality investment opportunities and to evaluate them more thoroughly than many of our competitors, including other commercial mortgage REITs. We also believe RMR’s broad platform provides us with access to RMR’s extensive network of real estate owners, operators, intermediaries, sponsors, financial institutions and other real estate related professionals and businesses with which RMR has historical relationships. We also believe that our Manager provides us with significant experience and expertise in investing in middle market and transitional CRE. The Company: Tremont Mortgage Trust, or TRMT, we, our or us, is a real estate investment trust, or REIT, that focuses on originating and investing in floating rate first mortgage whole loans secured by middle market and transitional commercial real estate, or CRE. We define middle market CRE as commercial properties that have values up to $75.0 million and transitional CRE as commercial properties subject to redevelopment or repositioning activities that are expected to increase the value of the properties. COMPANY PROFILE Corporate Headquarters: Two Newton Place 255 Washington Street, Suite 300 Newton, MA 02458-1634 (617) 796-8317 Stock Exchange Listing: Nasdaq Trading Symbol: Common Shares: TRMT Key Data (as of and for the three months ended December 31, 2020): (dollars in thousands) CO M PA NY P RO FI LE Q4 2020 income from investments, net $ 3,394 Q4 2020 net income $ 2,198 Q4 2020 Distributable Earnings $ 2,325 Loans held for investment, net $ 282,246 Total assets $ 294,182
5Confidential Tremont Mortgage Trust Supplemental Operating and Financial Data, December 31, 2020 INVESTOR INFORMATION Board of Trustees John L. Harrington Independent Trustee Adam D. Portnoy Managing Trustee William A. Lamkin Independent Trustee Joseph L. Morea Independent Trustee Matthew P. Jordan Managing Trustee Executive Officers Thomas J. Lorenzini President G. Douglas Lanois Chief Financial Officer and Treasurer Contact Information Investor Relations Tremont Mortgage Trust Two Newton Place 255 Washington Street, Suite 300 Newton, MA 02458-1634 (617) 796-7651 kbarry@trmtreit.com www.trmtreit.com Inquiries Financial, investor and media inquiries should be directed to Kevin Barry, Manager, Investor Relations, at (617) 796-7651 or kbarry@trmtreit.com IN VE ST O R IN FO RM AT IO N
6Confidential Tremont Mortgage Trust Supplemental Operating and Financial Data, December 31, 2020 RE SE AR CH C O VE RA G E Equity Research Coverage UBS Securities, LLC Brock Vandervliet (212) 713-2382 brock.vandervliet@ubs.com Citibank Global Markets, Inc Arren Cyganovich, CFA (212) 816-3733 arren.cyganovich@citi.com TRMT is followed by the analysts listed above. Please note that any opinions, estimates or forecasts regarding TRMT’s performance made by these analysts do not represent opinions, forecasts or predictions of TRMT or its management. TRMT does not by its reference above imply its endorsement of or concurrence with any information, conclusions or recommendations provided by any of these analysts. RESEARCH COVERAGE Jones Trading Institutional Services, LLC Jason M. Stewart (646) 465-9932 jstewart@jonestrading.com JMP Securities Steven C. DeLaney (212) 906-3517 sdelaney@jmpsecurities.com
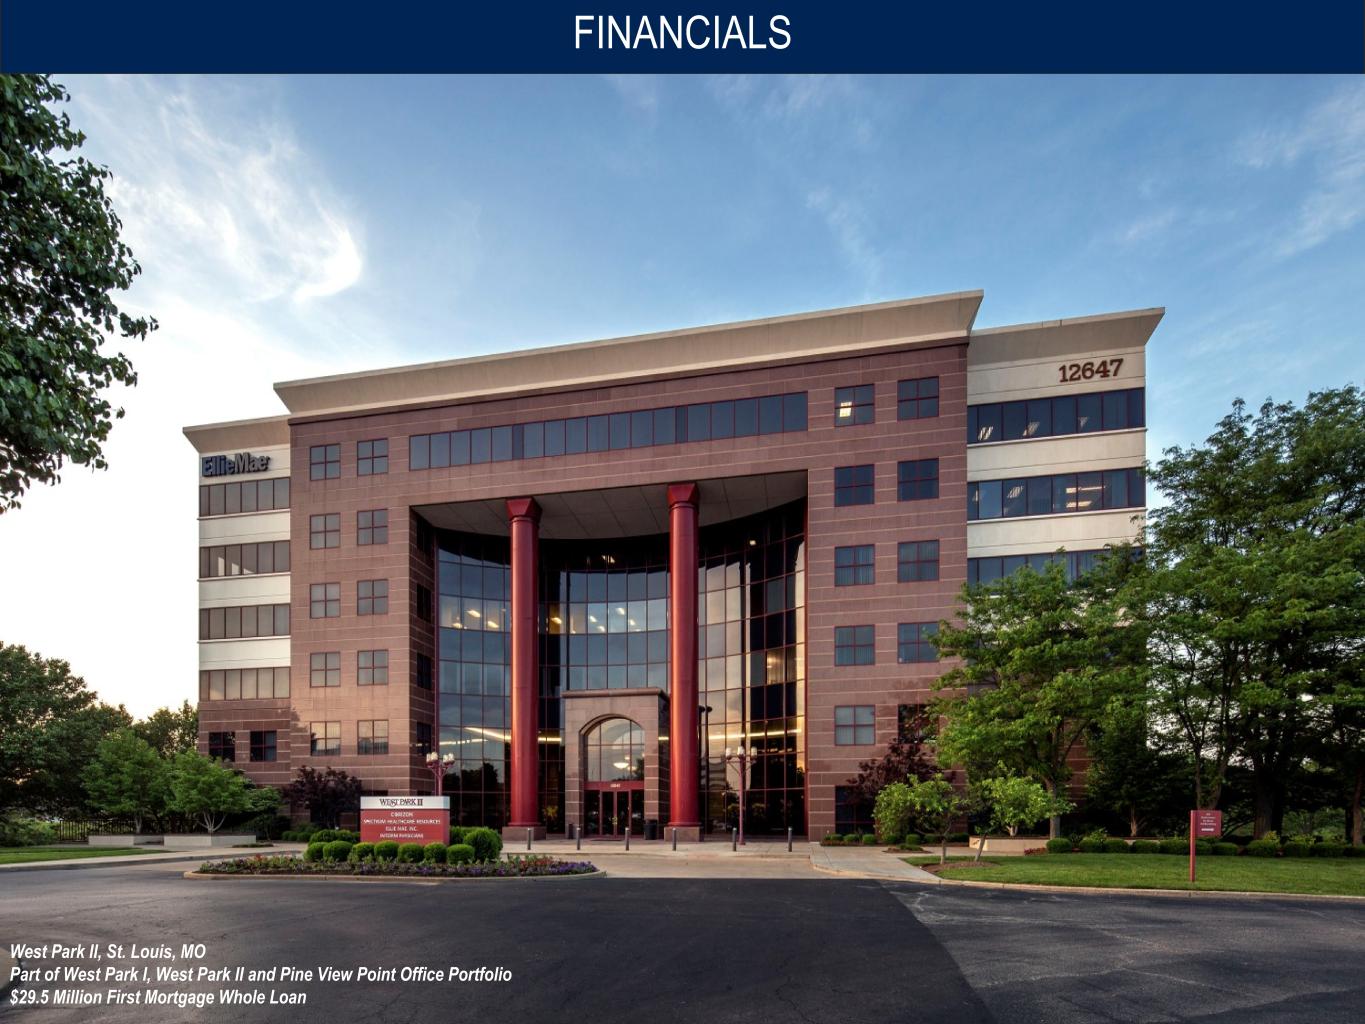
FINANCIALS West Park II, St. Louis, MO Part of West Park I, West Park II and Pine View Point Office Portfolio $29.5 Million First Mortgage Whole Loan
8Confidential Tremont Mortgage Trust Supplemental Operating and Financial Data, December 31, 2020 Financial Results Loan Portfolio Capitalization Interest Rates FO UR TH Q UA RT ER 2 02 0 HI G HL IG HT S FOURTH QUARTER 2020 HIGHLIGHTS (1) (1) As of December 31, 2020 • Net income of $2.2 million and Distributable Earnings of $2.3 million, or $0.26 and $0.28 per diluted common share, respectively. • Book value per common share of $10.71. • One-time cash distribution of $0.53 per common share declared in December 2020 and paid in January 2021. • 14 first mortgage whole loans diversified among office, retail, multifamily, industrial and hotel collateral, with an aggregate total loan commitment of $293.9 million. ◦ Weighted average maturity of 2.6 years based on Maximum Maturities. ◦ Weighted average coupon of 5.70% and weighted average All In Yield of 6.39%. ◦ All loans are current on debt service. • All loans held for investment have floating interest rates and we require borrowers to obtain hedging instruments to mitigate the risk of increasing interest rates. The weighted average LIBOR floor for the portfolio is 2.10%. • Borrowings under our Master Repurchase Facility are subject to floating interest rates with no LIBOR floor. • Floating rate investments and floating rate liabilities support earnings stability. • Our master repurchase facility with Citibank, N.A., or our Master Repurchase Facility, has $12.4 million available, comprised of $9.5 million immediately available to be drawn on loans for which the principal amount outstanding is now below the allocated maximum leverage amount and $2.9 million available to be drawn to fund future advances on unfunded loan commitments. • Outstanding principal balance of $201.1 million under our Master Repurchase Facility; 2.1x Net Debt to Book Equity ratio.
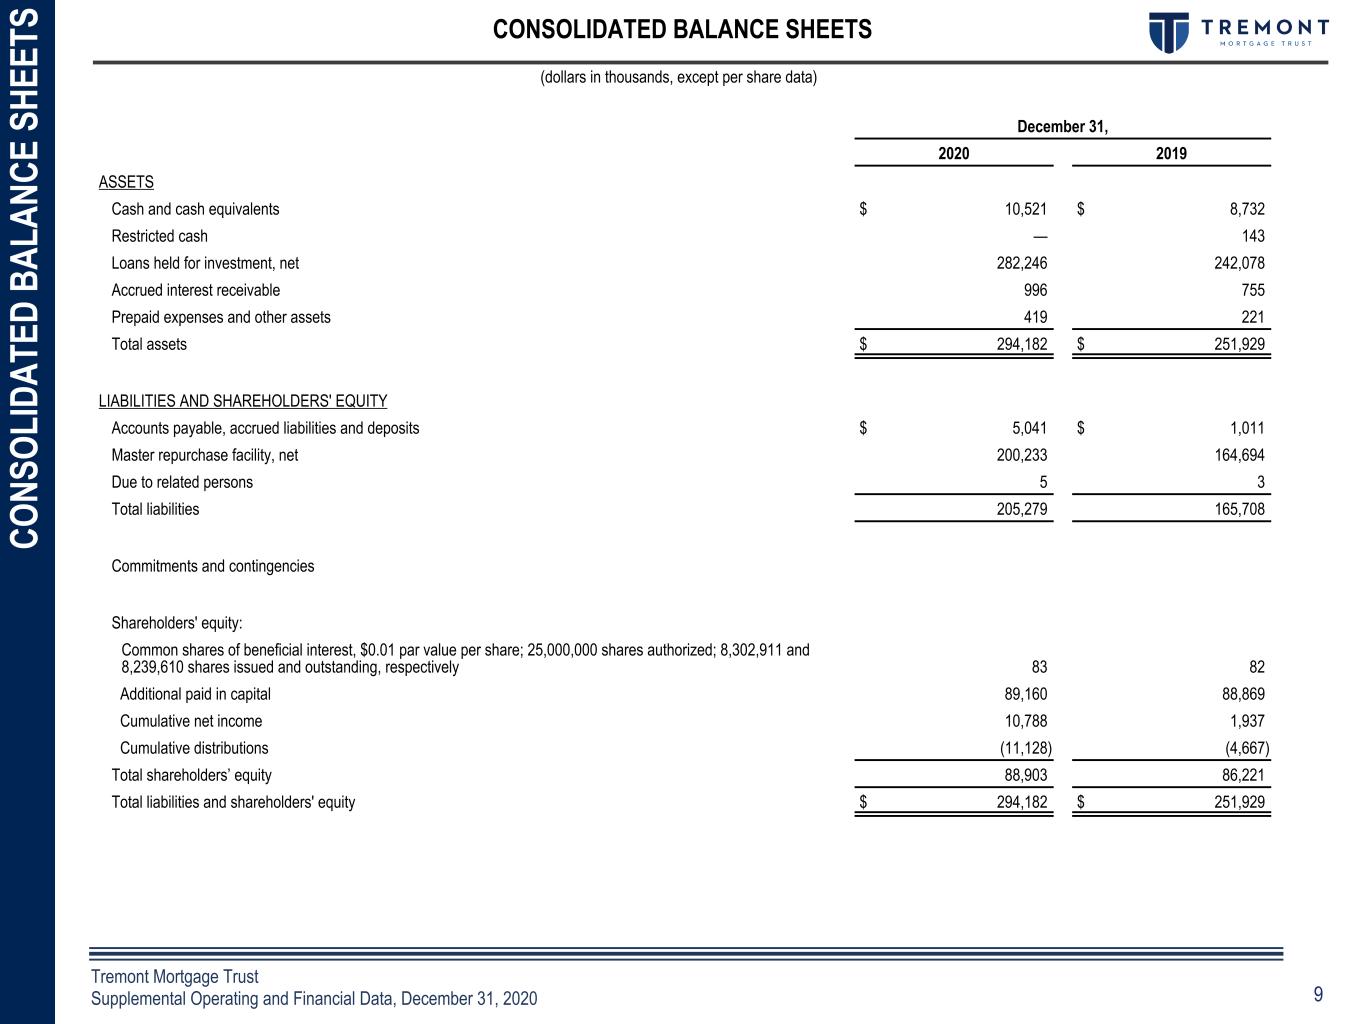
9Confidential Tremont Mortgage Trust Supplemental Operating and Financial Data, December 31, 2020 Financial Summary CONSOLIDATED BALANCE SHEETS CO NS O LI DA TE D BA LA NC E SH EE TS (dollars in thousands, except per share data) December 31, 2020 2019 ASSETS Cash and cash equivalents $ 10,521 $ 8,732 Restricted cash — 143 Loans held for investment, net 282,246 242,078 Accrued interest receivable 996 755 Prepaid expenses and other assets 419 221 Total assets $ 294,182 $ 251,929 LIABILITIES AND SHAREHOLDERS' EQUITY Accounts payable, accrued liabilities and deposits $ 5,041 $ 1,011 Master repurchase facility, net 200,233 164,694 Due to related persons 5 3 Total liabilities 205,279 165,708 Commitments and contingencies Shareholders' equity: Common shares of beneficial interest, $0.01 par value per share; 25,000,000 shares authorized; 8,302,911 and 8,239,610 shares issued and outstanding, respectively 83 82 Additional paid in capital 89,160 88,869 Cumulative net income 10,788 1,937 Cumulative distributions (11,128) (4,667) Total shareholders’ equity 88,903 86,221 Total liabilities and shareholders' equity $ 294,182 $ 251,929
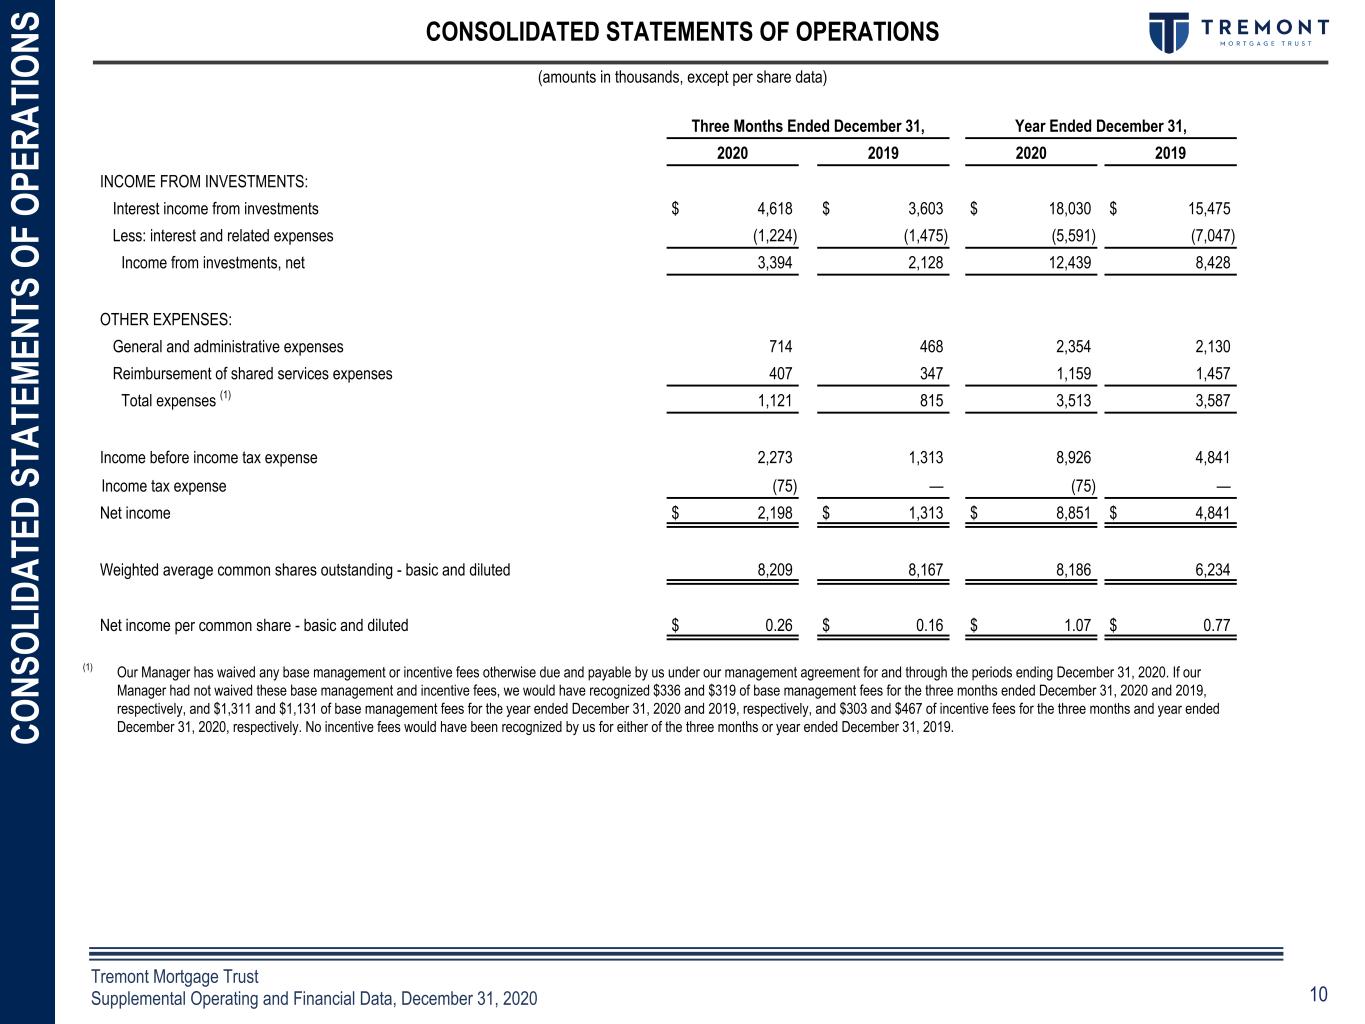
10Confidential Tremont Mortgage Trust Supplemental Operating and Financial Data, December 31, 2020 CONSOLIDATED STATEMENTS OF OPERATIONS (amounts in thousands, except per share data) C O NS O LI DA TE D ST AT EM EN TS O F O PE RA TI O NS (1) Our Manager has waived any base management or incentive fees otherwise due and payable by us under our management agreement for and through the periods ending December 31, 2020. If our Manager had not waived these base management and incentive fees, we would have recognized $336 and $319 of base management fees for the three months ended December 31, 2020 and 2019, respectively, and $1,311 and $1,131 of base management fees for the year ended December 31, 2020 and 2019, respectively, and $303 and $467 of incentive fees for the three months and year ended December 31, 2020, respectively. No incentive fees would have been recognized by us for either of the three months or year ended December 31, 2019. Three Months Ended December 31, Year Ended December 31, 2020 2019 2020 2019 INCOME FROM INVESTMENTS: Interest income from investments $ 4,618 $ 3,603 $ 18,030 $ 15,475 Less: interest and related expenses (1,224) (1,475) (5,591) (7,047) Income from investments, net 3,394 2,128 12,439 8,428 OTHER EXPENSES: General and administrative expenses 714 468 2,354 2,130 Reimbursement of shared services expenses 407 347 1,159 1,457 Total expenses (1) 1,121 815 3,513 3,587 Income before income tax expense 2,273 1,313 8,926 4,841 Income tax expense (75) — (75) — Net income $ 2,198 $ 1,313 $ 8,851 $ 4,841 Weighted average common shares outstanding - basic and diluted 8,209 8,167 8,186 6,234 Net income per common share - basic and diluted $ 0.26 $ 0.16 $ 1.07 $ 0.77
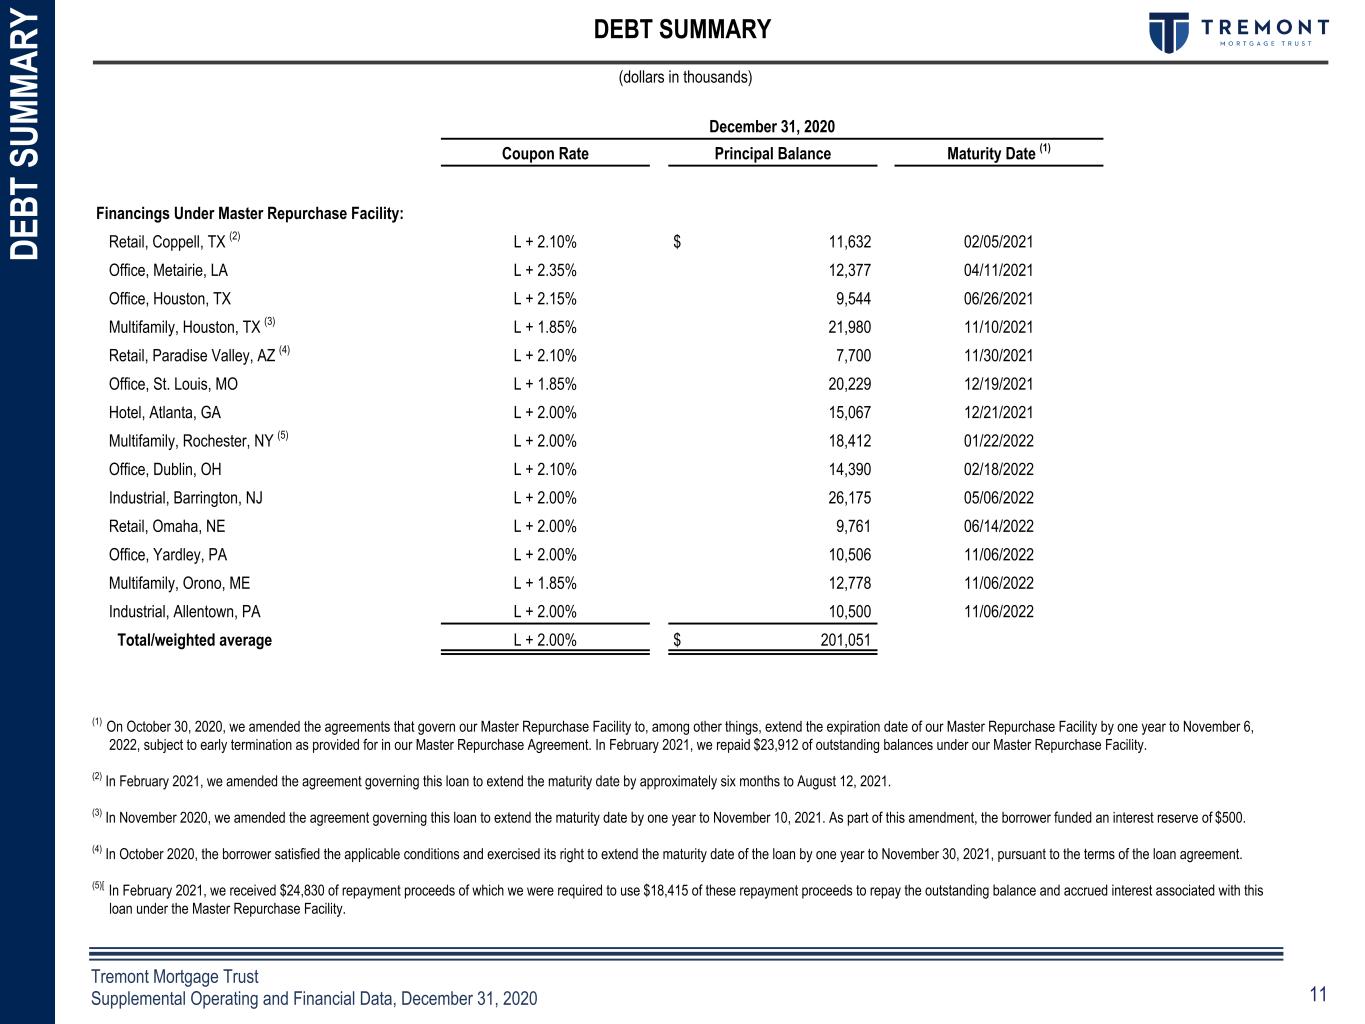
11Confidential Tremont Mortgage Trust Supplemental Operating and Financial Data, December 31, 2020 DEBT SUMMARY DE BT S UM M AR Y (dollars in thousands) December 31, 2020 Coupon Rate Principal Balance Maturity Date (1) Financings Under Master Repurchase Facility: Retail, Coppell, TX (2) L + 2.10% $ 11,632 02/05/2021 Office, Metairie, LA L + 2.35% 12,377 04/11/2021 Office, Houston, TX L + 2.15% 9,544 06/26/2021 Multifamily, Houston, TX (3) L + 1.85% 21,980 11/10/2021 Retail, Paradise Valley, AZ (4) L + 2.10% 7,700 11/30/2021 Office, St. Louis, MO L + 1.85% 20,229 12/19/2021 Hotel, Atlanta, GA L + 2.00% 15,067 12/21/2021 Multifamily, Rochester, NY (5) L + 2.00% 18,412 01/22/2022 Office, Dublin, OH L + 2.10% 14,390 02/18/2022 Industrial, Barrington, NJ L + 2.00% 26,175 05/06/2022 Retail, Omaha, NE L + 2.00% 9,761 06/14/2022 Office, Yardley, PA L + 2.00% 10,506 11/06/2022 Multifamily, Orono, ME L + 1.85% 12,778 11/06/2022 Industrial, Allentown, PA L + 2.00% 10,500 11/06/2022 Total/weighted average L + 2.00% $ 201,051 (1) On October 30, 2020, we amended the agreements that govern our Master Repurchase Facility to, among other things, extend the expiration date of our Master Repurchase Facility by one year to November 6, 2022, subject to early termination as provided for in our Master Repurchase Agreement. In February 2021, we repaid $23,912 of outstanding balances under our Master Repurchase Facility. (2) In February 2021, we amended the agreement governing this loan to extend the maturity date by approximately six months to August 12, 2021. (3) In November 2020, we amended the agreement governing this loan to extend the maturity date by one year to November 10, 2021. As part of this amendment, the borrower funded an interest reserve of $500. (4) In October 2020, the borrower satisfied the applicable conditions and exercised its right to extend the maturity date of the loan by one year to November 30, 2021, pursuant to the terms of the loan agreement. (5)[ In February 2021, we received $24,830 of repayment proceeds of which we were required to use $18,415 of these repayment proceeds to repay the outstanding balance and accrued interest associated with this loan under the Master Repurchase Facility.
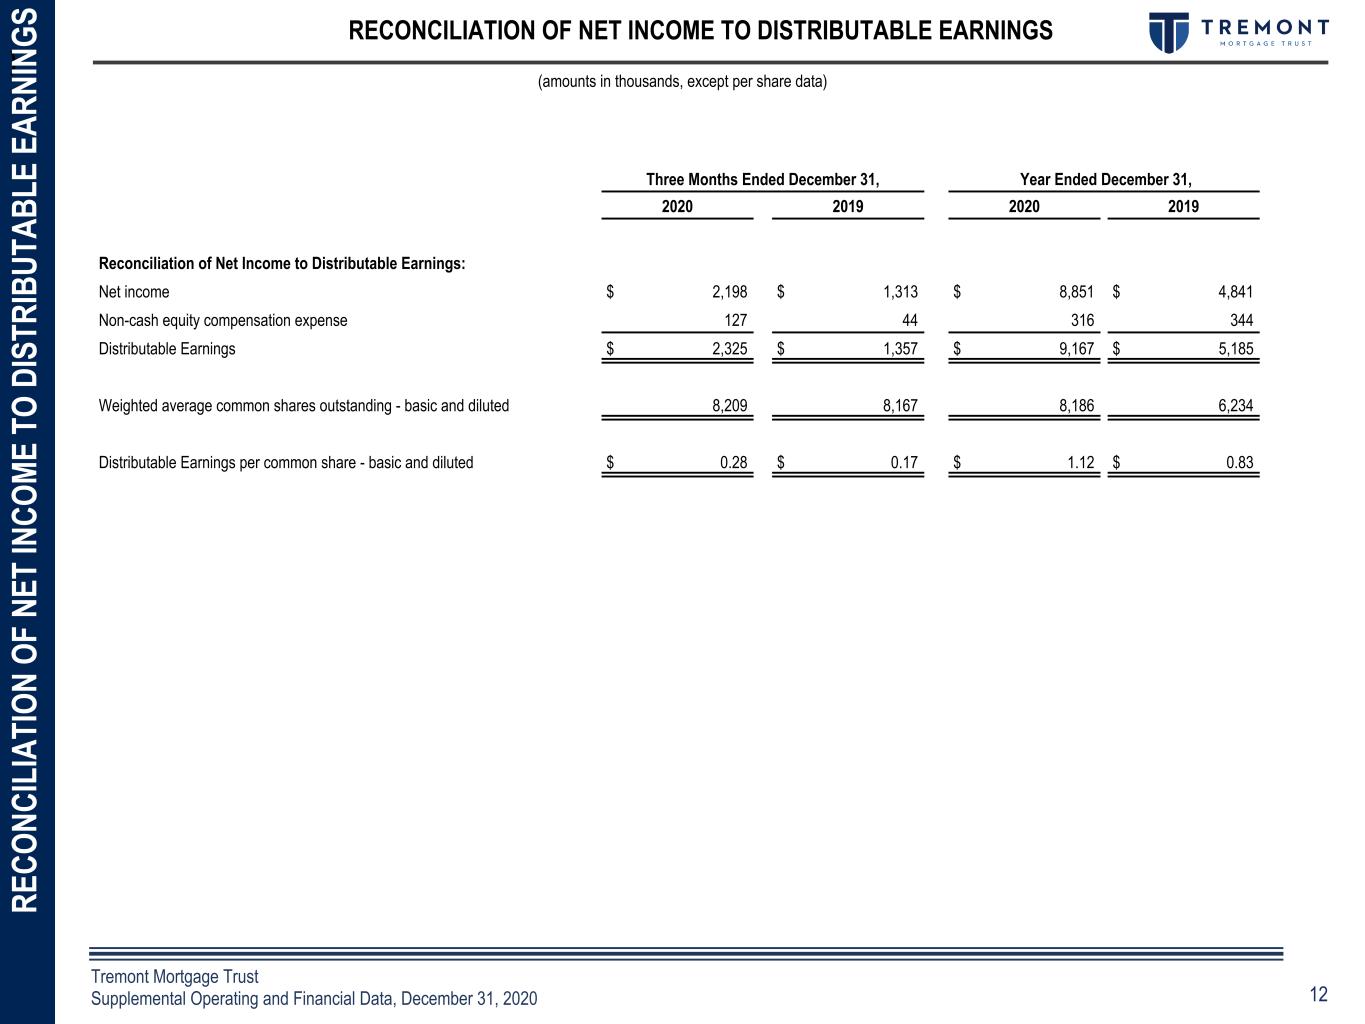
12Confidential Tremont Mortgage Trust Supplemental Operating and Financial Data, December 31, 2020 RECONCILIATION OF NET INCOME TO DISTRIBUTABLE EARNINGS ) RE CO NC IL IA TI O N O F NE T IN CO M E TO D IS TR IB UT AB LE E AR NI NG S (amounts in thousands, except per share data) Three Months Ended December 31, Year Ended December 31, 2020 2019 2020 2019 Reconciliation of Net Income to Distributable Earnings: Net income $ 2,198 $ 1,313 $ 8,851 $ 4,841 Non-cash equity compensation expense 127 44 316 344 Distributable Earnings $ 2,325 $ 1,357 $ 9,167 $ 5,185 Weighted average common shares outstanding - basic and diluted 8,209 8,167 8,186 6,234 Distributable Earnings per common share - basic and diluted $ 0.28 $ 0.17 $ 1.12 $ 0.83
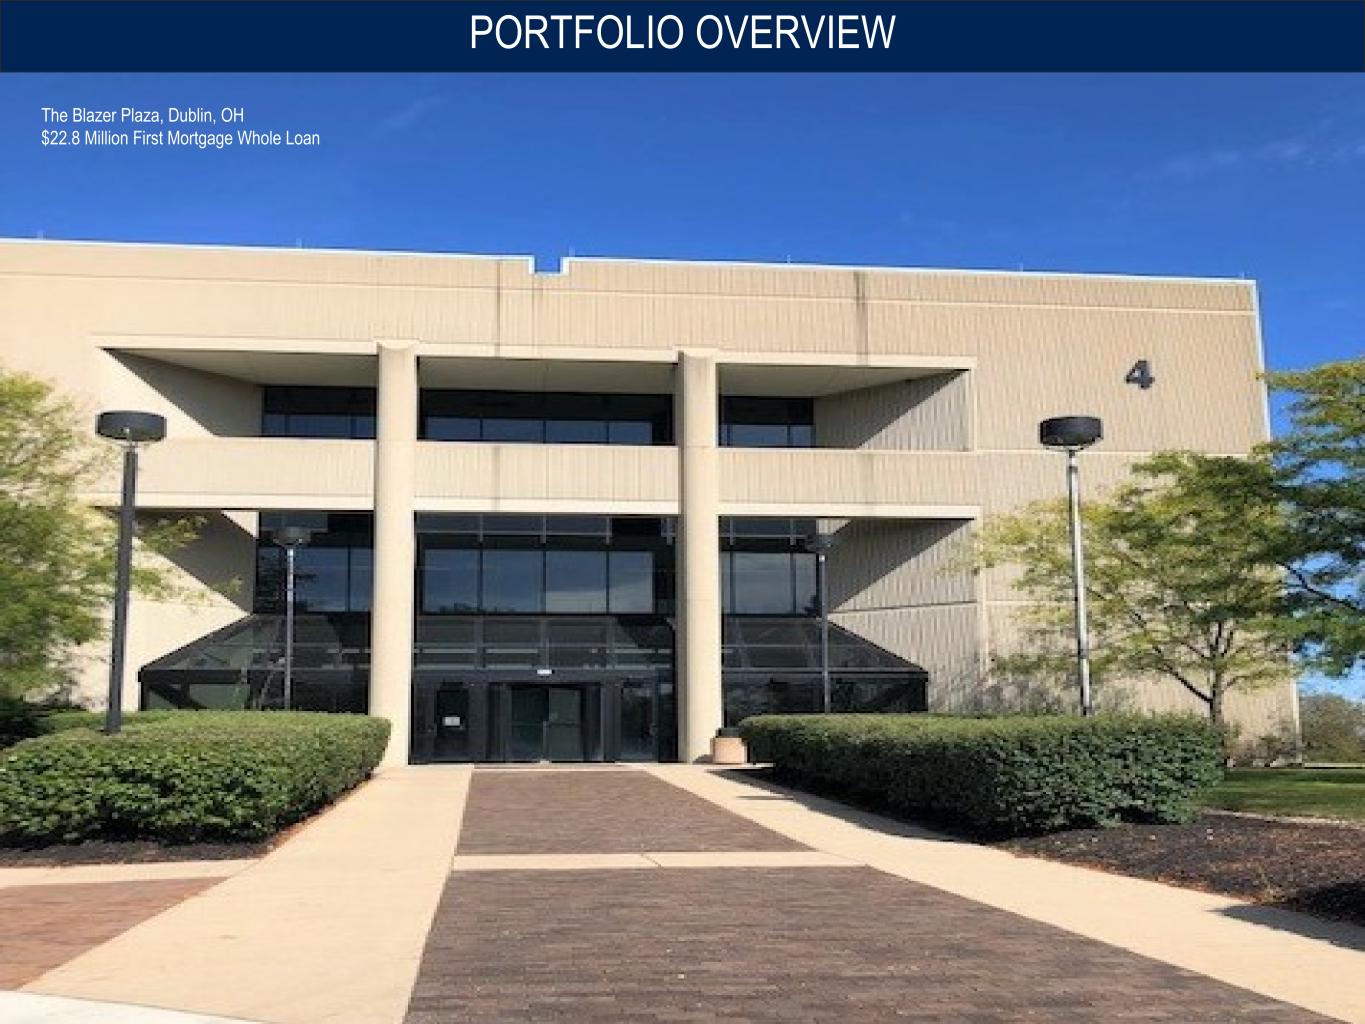
1711 Caroline Street, Houston, TX $28.0 Million First Mortgage Whole Loan PORTFOLIO OVERVIEW 675 Bering Drive, Houston, TX $15.2 Million First Mortgage Whole Loan The Blazer Plaza, Dublin, OH $22.8 Million First Mortgage Whole Loan
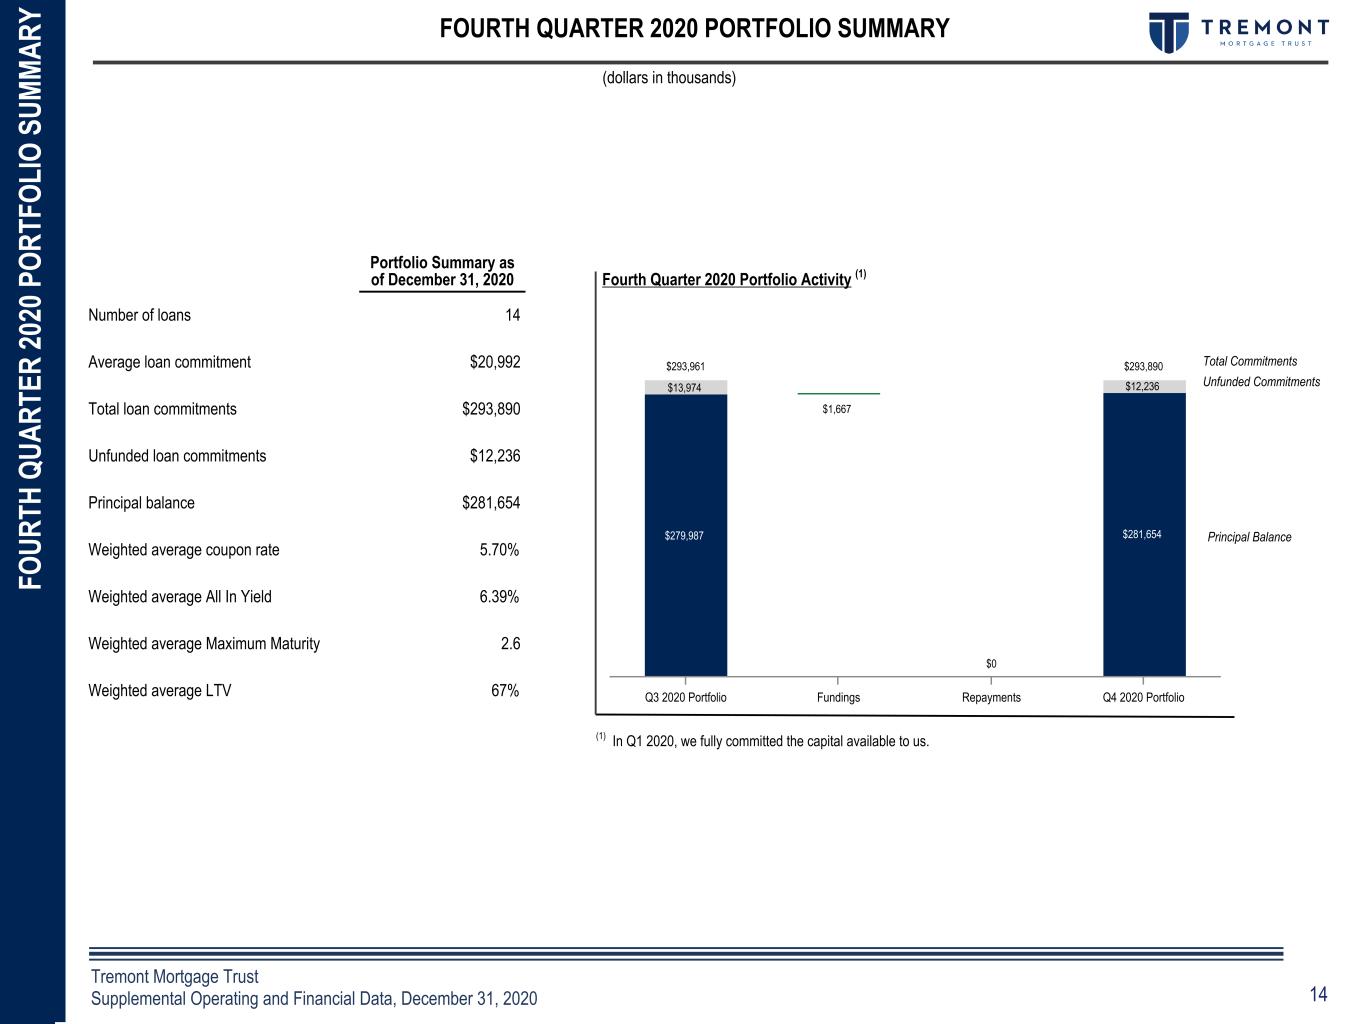
14Confidential Tremont Mortgage Trust Supplemental Operating and Financial Data, December 31, 2020 FOURTH QUARTER 2020 PORTFOLIO SUMMARY (dollars in thousands) Fourth Quarter 2020 Portfolio Activity (1) Unfunded Commitments $293,961 $0 $293,890 $279,987 $281,654 $1,667 $13,974 $12,236 Q3 2020 Portfolio Fundings Repayments Q4 2020 Portfolio Total Commitments Unfunded Commitments F O UR TH Q UA RT ER 2 02 0 PO RT FO LI O S UM M AR Y Portfolio Summary as of December 31, 2020 Number of loans 14 Average loan commitment $20,992 Total loan commitments $293,890 Unfunded loan commitments $12,236 Principal balance $281,654 Weighted average coupon rate 5.70% Weighted average All In Yield 6.39% Weighted average Maximum Maturity 2.6 Weighted average LTV 67% Principal Balance (1) In Q1 2020, we fully committed the capital available to us.
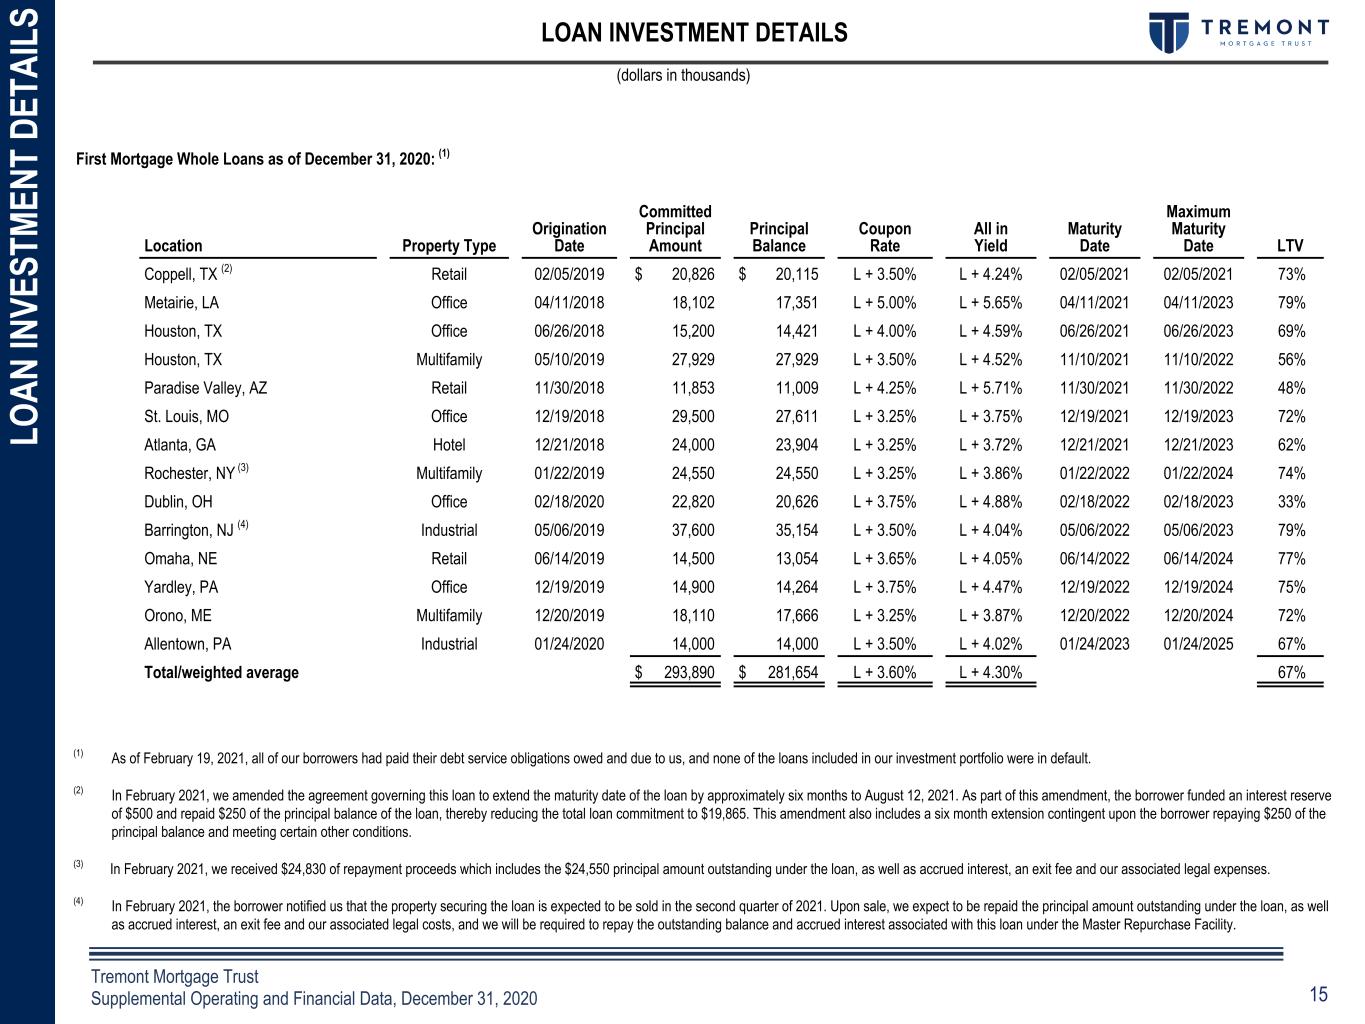
15Confidential Tremont Mortgage Trust Supplemental Operating and Financial Data, December 31, 2020 LO AN IN VE ST M EN T DE TA IL S LOAN INVESTMENT DETAILS (dollars in thousands) First Mortgage Whole Loans as of December 31, 2020: (1) Location Property Type Origination Date Committed Principal Amount Principal Balance Coupon Rate All in Yield Maturity Date Maximum Maturity Date LTV Coppell, TX (2) Retail 02/05/2019 $ 20,826 $ 20,115 L + 3.50% L + 4.24% 02/05/2021 02/05/2021 73% Metairie, LA Office 04/11/2018 18,102 17,351 L + 5.00% L + 5.65% 04/11/2021 04/11/2023 79% Houston, TX Office 06/26/2018 15,200 14,421 L + 4.00% L + 4.59% 06/26/2021 06/26/2023 69% Houston, TX Multifamily 05/10/2019 27,929 27,929 L + 3.50% L + 4.52% 11/10/2021 11/10/2022 56% Paradise Valley, AZ Retail 11/30/2018 11,853 11,009 L + 4.25% L + 5.71% 11/30/2021 11/30/2022 48% St. Louis, MO Office 12/19/2018 29,500 27,611 L + 3.25% L + 3.75% 12/19/2021 12/19/2023 72% Atlanta, GA Hotel 12/21/2018 24,000 23,904 L + 3.25% L + 3.72% 12/21/2021 12/21/2023 62% Rochester, NY (3) Multifamily 01/22/2019 24,550 24,550 L + 3.25% L + 3.86% 01/22/2022 01/22/2024 74% Dublin, OH Office 02/18/2020 22,820 20,626 L + 3.75% L + 4.88% 02/18/2022 02/18/2023 33% Barrington, NJ (4) Industrial 05/06/2019 37,600 35,154 L + 3.50% L + 4.04% 05/06/2022 05/06/2023 79% Omaha, NE Retail 06/14/2019 14,500 13,054 L + 3.65% L + 4.05% 06/14/2022 06/14/2024 77% Yardley, PA Office 12/19/2019 14,900 14,264 L + 3.75% L + 4.47% 12/19/2022 12/19/2024 75% Orono, ME Multifamily 12/20/2019 18,110 17,666 L + 3.25% L + 3.87% 12/20/2022 12/20/2024 72% Allentown, PA Industrial 01/24/2020 14,000 14,000 L + 3.50% L + 4.02% 01/24/2023 01/24/2025 67% Total/weighted average $ 293,890 $ 281,654 L + 3.60% L + 4.30% 67% (1) As of February 19, 2021, all of our borrowers had paid their debt service obligations owed and due to us, and none of the loans included in our investment portfolio were in default. (2) In February 2021, we amended the agreement governing this loan to extend the maturity date of the loan by approximately six months to August 12, 2021. As part of this amendment, the borrower funded an interest reserve of $500 and repaid $250 of the principal balance of the loan, thereby reducing the total loan commitment to $19,865. This amendment also includes a six month extension contingent upon the borrower repaying $250 of the principal balance and meeting certain other conditions. (3) In February 2021, we received $24,830 of repayment proceeds which includes the $24,550 principal amount outstanding under the loan, as well as accrued interest, an exit fee and our associated legal expenses. (4) In February 2021, the borrower notified us that the property securing the loan is expected to be sold in the second quarter of 2021. Upon sale, we expect to be repaid the principal amount outstanding under the loan, as well as accrued interest, an exit fee and our associated legal costs, and we will be required to repay the outstanding balance and accrued interest associated with this loan under the Master Repurchase Facility.
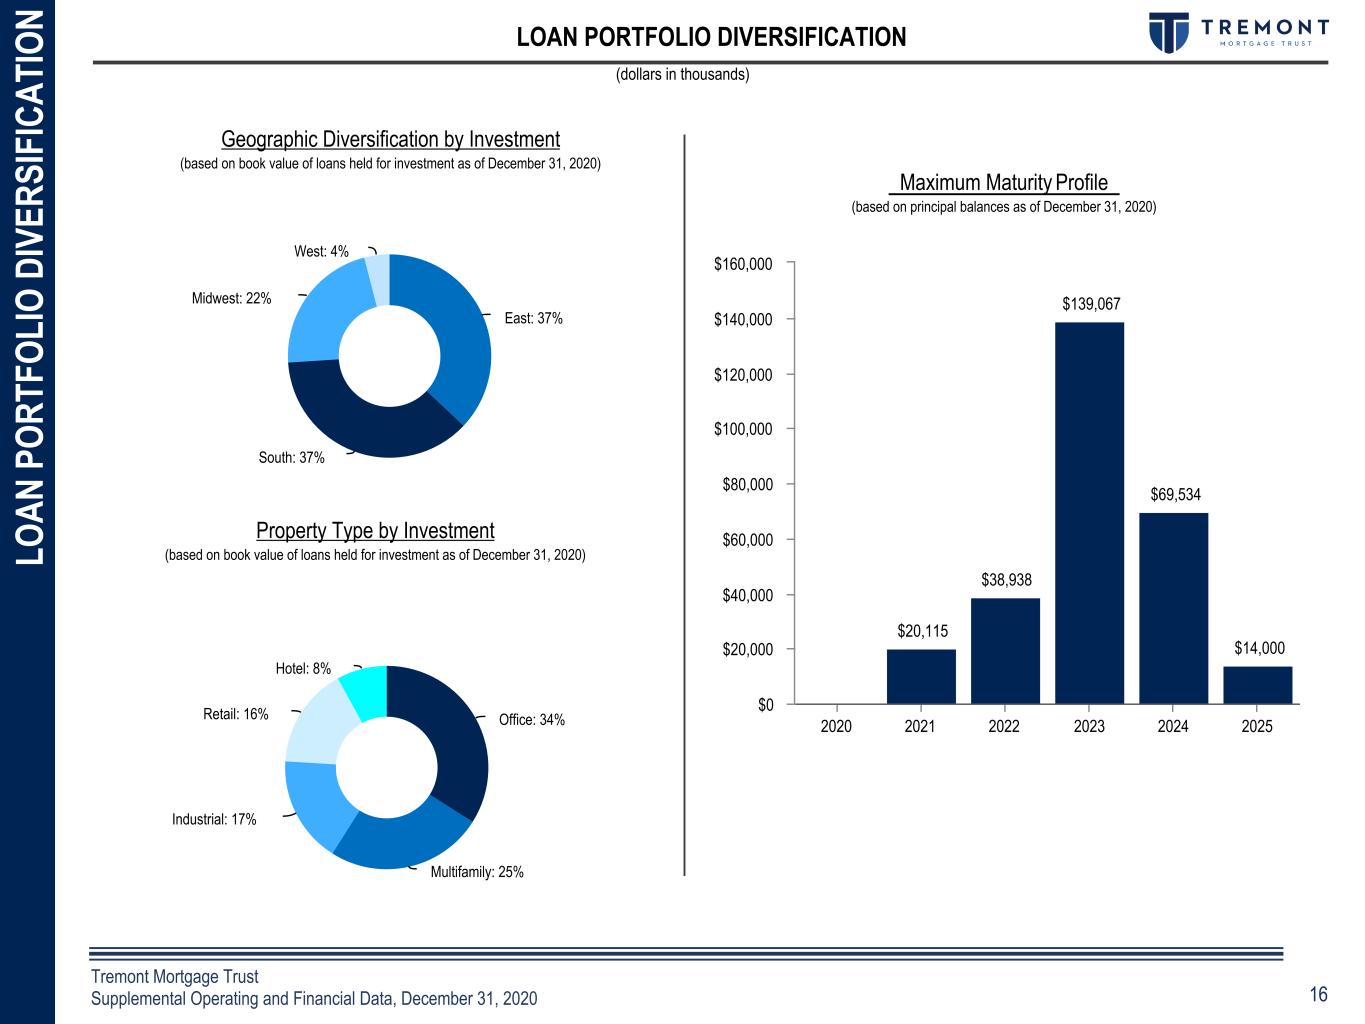
16Confidential Tremont Mortgage Trust Supplemental Operating and Financial Data, December 31, 2020 LOAN PORTFOLIO DIVERSIFICATION (dollars in thousands) LO AN P O RT FO LI O D IV ER SI FI CA TI O N Retail East: 37% South: 37% Midwest: 22% West: 4% Office: 34% Multifamily: 25% Industrial: 17% Retail: 16% Hotel: 8% $20,115 $38,938 $139,067 $69,534 $14,000 2020 2021 2022 2023 2024 2025 $0 $20,000 $40,000 $60,000 $80,000 $100,000 $120,000 $140,000 $160,000 Geographic Diversification by Investment (based on book value of loans held for investment as of December 31, 2020) Property Type by Investment (based on book value of loans held for investment as of December 31, 2020) Maximum Maturity Profile (based on principal balances as of December 31, 2020)
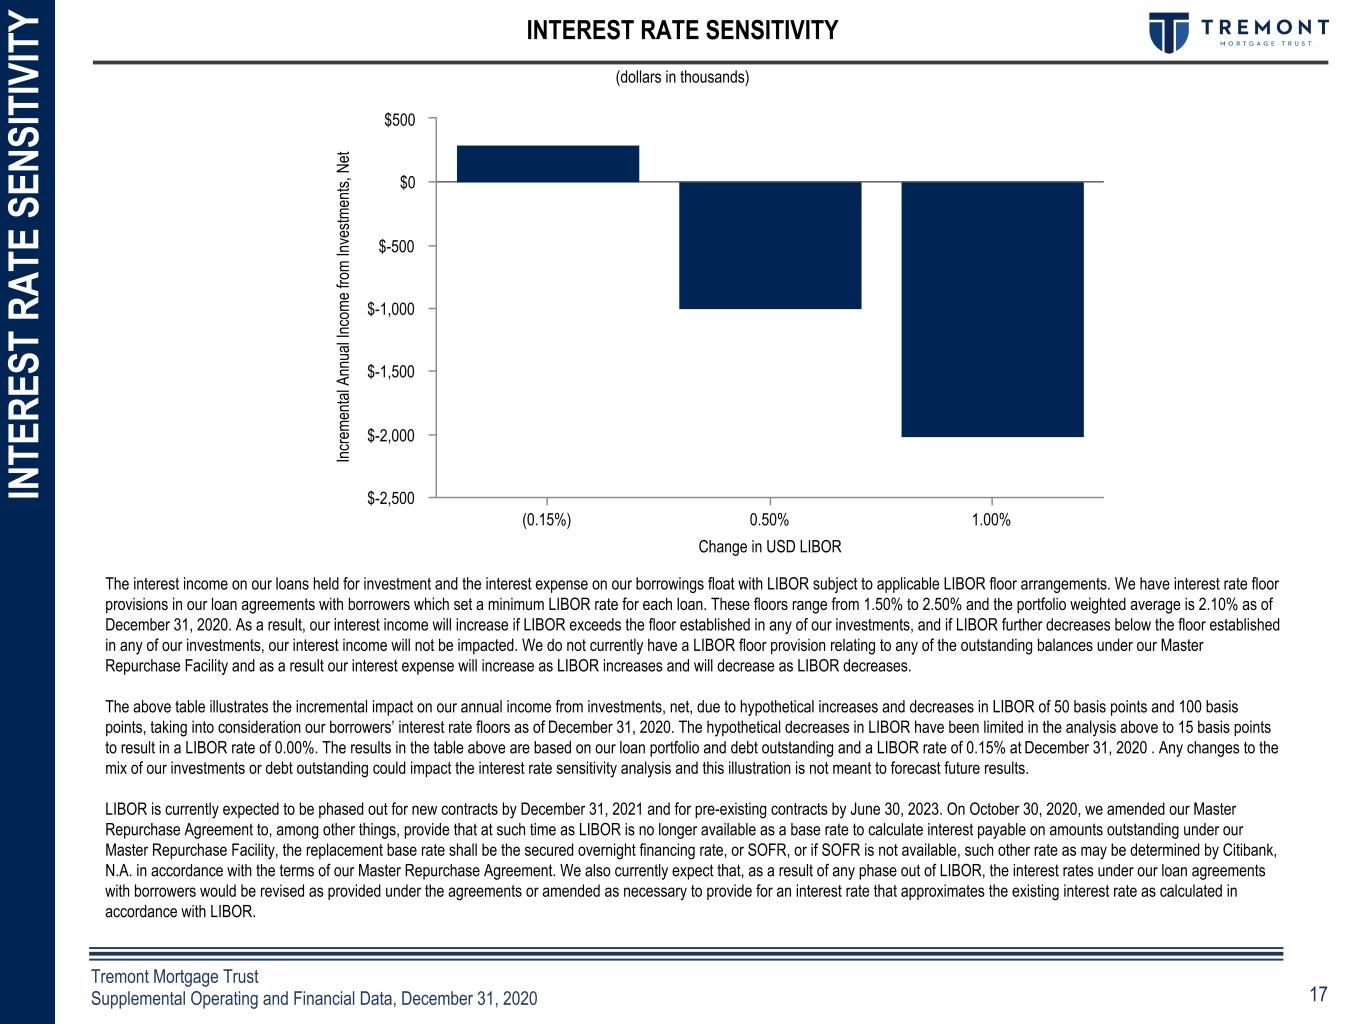
17Confidential Tremont Mortgage Trust Supplemental Operating and Financial Data, December 31, 2020 INTEREST RATE SENSITIVITY The interest income on our loans held for investment and the interest expense on our borrowings float with LIBOR subject to applicable LIBOR floor arrangements. We have interest rate floor provisions in our loan agreements with borrowers which set a minimum LIBOR rate for each loan. These floors range from 1.50% to 2.50% and the portfolio weighted average is 2.10% as of December 31, 2020. As a result, our interest income will increase if LIBOR exceeds the floor established in any of our investments, and if LIBOR further decreases below the floor established in any of our investments, our interest income will not be impacted. We do not currently have a LIBOR floor provision relating to any of the outstanding balances under our Master Repurchase Facility and as a result our interest expense will increase as LIBOR increases and will decrease as LIBOR decreases. The above table illustrates the incremental impact on our annual income from investments, net, due to hypothetical increases and decreases in LIBOR of 50 basis points and 100 basis points, taking into consideration our borrowers’ interest rate floors as of December 31, 2020. The hypothetical decreases in LIBOR have been limited in the analysis above to 15 basis points to result in a LIBOR rate of 0.00%. The results in the table above are based on our loan portfolio and debt outstanding and a LIBOR rate of 0.15% at December 31, 2020 . Any changes to the mix of our investments or debt outstanding could impact the interest rate sensitivity analysis and this illustration is not meant to forecast future results. LIBOR is currently expected to be phased out for new contracts by December 31, 2021 and for pre-existing contracts by June 30, 2023. On October 30, 2020, we amended our Master Repurchase Agreement to, among other things, provide that at such time as LIBOR is no longer available as a base rate to calculate interest payable on amounts outstanding under our Master Repurchase Facility, the replacement base rate shall be the secured overnight financing rate, or SOFR, or if SOFR is not available, such other rate as may be determined by Citibank, N.A. in accordance with the terms of our Master Repurchase Agreement. We also currently expect that, as a result of any phase out of LIBOR, the interest rates under our loan agreements with borrowers would be revised as provided under the agreements or amended as necessary to provide for an interest rate that approximates the existing interest rate as calculated in accordance with LIBOR. (dollars in thousands) IN TE RE ST R AT E SE NS IT IV IT Y Change in USD LIBOR In cr em en ta l A nn ua l I nc om e fro m In ve st m en ts , N et (0.15%) 0.50% 1.00% $-2,500 $-2,000 $-1,500 $-1,000 $-500 $0 $500
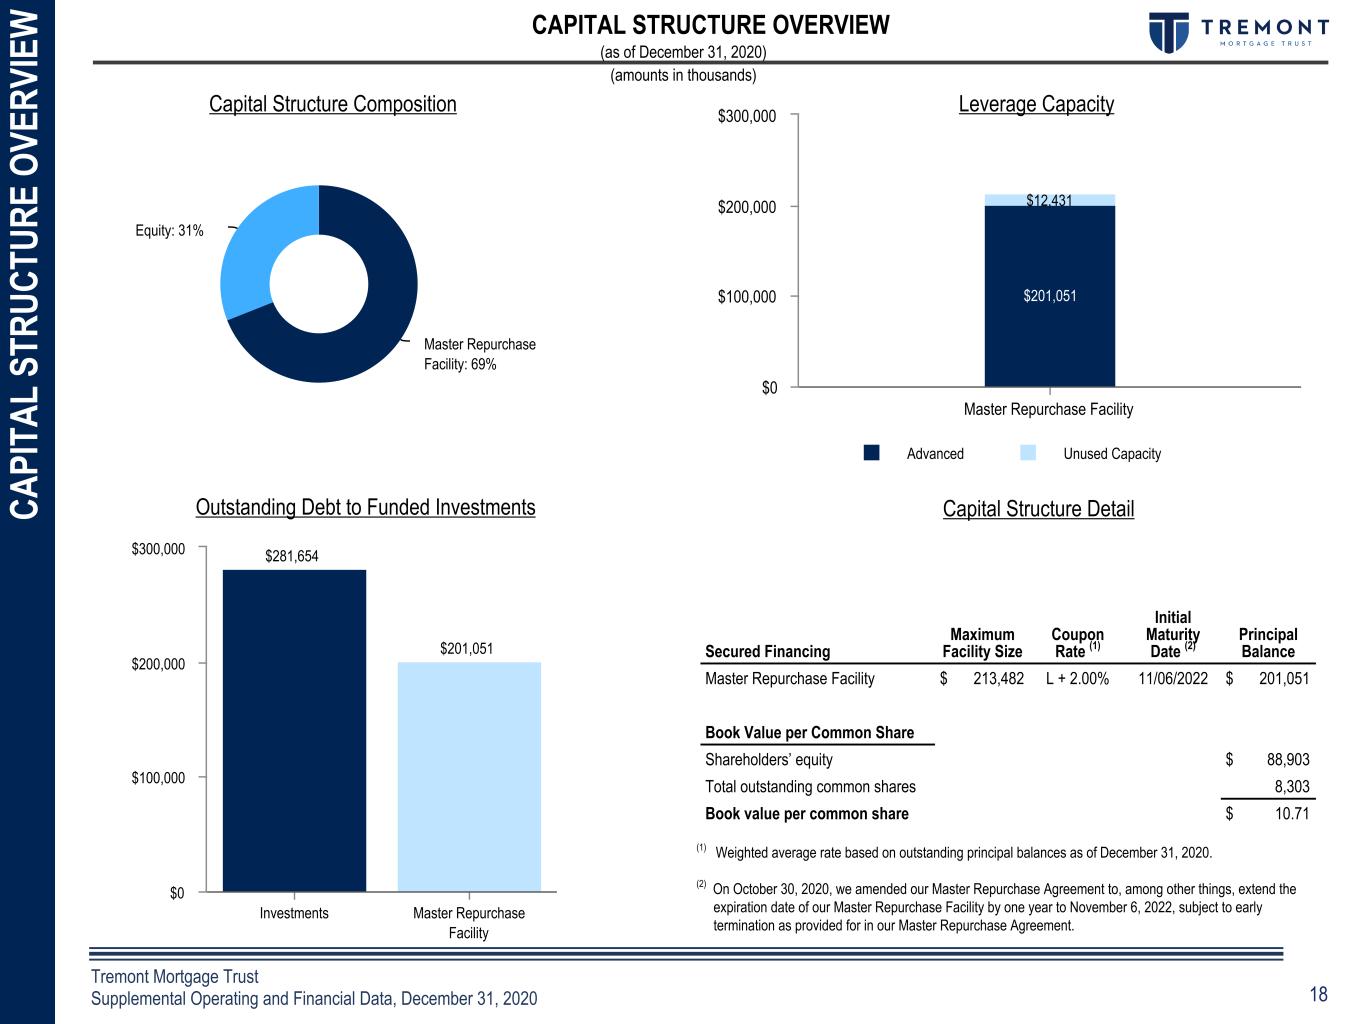
18Confidential Tremont Mortgage Trust Supplemental Operating and Financial Data, December 31, 2020 CA PI TA L ST RU CT UR E O VE RV IE W CAPITAL STRUCTURE OVERVIEW (as of December 31, 2020) (amounts in thousands) Secured Financing Maximum Facility Size Coupon Rate (1) Initial Maturity Date (2) Principal Balance Master Repurchase Facility $ 213,482 L + 2.00% 11/06/2022 $ 201,051 Book Value per Common Share Shareholders’ equity $ 88,903 Total outstanding common shares 8,303 Book value per common share $ 10.71 Capital Structure Detail (1) Weighted average rate based on outstanding principal balances as of December 31, 2020. (2) On October 30, 2020, we amended our Master Repurchase Agreement to, among other things, extend the expiration date of our Master Repurchase Facility by one year to November 6, 2022, subject to early termination as provided for in our Master Repurchase Agreement. Master Repurchase Facility: 69% Equity: 31% $281,654 $201,051 Investments Master Repurchase Facility $0 $100,000 $200,000 $300,000 $201,051 $12,431 Advanced Unused Capacity Master Repurchase Facility $0 $100,000 $200,000 $300,000 Outstanding Debt to Funded Investments Capital Structure Composition Leverage Capacity
19Confidential Tremont Mortgage Trust Supplemental Operating and Financial Data, December 31, 2020 WARNING CONCERNING FORWARD-LOOKING STATEMENTS W AR NI NG C O NC ER NI NG F O RW AR D- LO O KI NG S TA TE M EN TS This supplemental operating and financial data may contain forward-looking statements within the meaning of the Private Securities Litigation Reform Act of 1995 and other securities laws. Also, whenever we use words such as “believe”, “expect”, “anticipate”, “intend”, “plan”, “estimate”, “will”, “may” and negatives or derivatives of these or similar expressions, we are making forward-looking statements. These forward- looking statements are based upon our present intent, beliefs or expectations, but forward-looking statements are not guaranteed to occur and may not occur. Actual results may differ materially from those contained in or implied by our forward-looking statements. Forward-looking statements involve known and unknown risks, uncertainties and other factors, some of which are beyond our control. The information contained in our filings with the SEC, including under “Risk Factors” in our periodic reports, or incorporated therein, identifies important factors that could cause our actual results to differ materially from those stated in or implied by our forward-looking statements. Our filings with the SEC are available on the SEC's website at www.sec.gov. You should not place undue reliance upon forward-looking statements. Except as required by law, we do not intend to update or change any forward-looking statements as a result of new information, future events or otherwise.
20Confidential Tremont Mortgage Trust Supplemental Operating and Financial Data, December 31, 2020 NO N- G AA P FI NA NC IA L M EA SU RE S AN D CE RT AI N DE FI NI TI O NS NON-GAAP FINANCIAL MEASURES AND CERTAIN DEFINITIONS Non-GAAP Financial Measures: We present Distributable Earnings, which is considered a “non-GAAP financial measure” within the meaning of the applicable SEC rules. Distributable Earnings does not represent net income or cash generated from operating activities and should not be considered as an alternative to net income determined in accordance with GAAP or an indication of our cash flows from operations determined in accordance with GAAP, a measure of our liquidity or operating performance or an indication of funds available for our cash needs. In addition, our methodology for calculating Distributable Earnings may differ from the methodologies employed by other companies to calculate the same or similar supplemental performance measures; therefore, our reported Distributable Earnings may not be comparable to the distributable earnings as reported by other companies. In order to maintain our qualification for taxation as a REIT, we are generally required to distribute substantially all of our taxable income, subject to certain adjustments, to our shareholders. We believe that one of the factors that investors consider important in deciding whether to buy or sell securities of a REIT is its distribution rate. Over time, Distributable Earnings has been a useful indicator of distributions to our shareholders and is a measure that is considered by our Board of Trustees when determining the amount of such distributions. We believe that Distributable Earnings provides meaningful information to consider in addition to net income and cash flows from operating activities determined in accordance with GAAP. This measure helps us to evaluate our performance excluding the effects of certain transactions and GAAP adjustments that we believe are not necessarily indicative of our current loan portfolio and operations. In addition, Distributable Earnings is used in determining the amount of base management and incentive fees payable by us to our Manager under our management agreement. Distributable Earnings: We calculate Distributable Earnings as net income, computed in accordance with GAAP, including realized losses not otherwise included in net income determined in accordance with GAAP, and excluding: (a) the incentive fees earned by our Manager, if any; (b) depreciation and amortization, if any; (c) non-cash equity compensation expense; (d) unrealized gains, losses and other similar non-cash items that are included in net income for the period of the calculation (regardless of whether such items are included in or deducted from net income or in other comprehensive income under GAAP), if any; and (e) one-time events pursuant to changes in GAAP and certain non-cash items, if any. Distributable Earnings are reduced for realized losses on loan investments when amounts are deemed uncollectable. Other Measures: All In Yield: All In Yield represents the yield on a loan, excluding any repurchase debt funding applicable to the loan and including amortization of deferred fees over the initial term of the loan. Maximum Maturity: Maximum Maturity assumes all loan extension options are exercised, which options are subject to the borrower meeting certain conditions. LTV: Loan to value ratio, or LTV, represents the initial loan amount divided by the underwritten in place value of the underlying collateral at closing. Net Debt: Principal balance of debt, less cash.
