Attached files
| file | filename |
|---|---|
| EX-10.7 - EX-10.7 - Olo Inc. | d867519dex107.htm |
| EX-23.1 - EX-23.1 - Olo Inc. | d867519dex231.htm |
| EX-10.19 - EX-10.19 - Olo Inc. | d867519dex1019.htm |
| EX-10.18 - EX-10.18 - Olo Inc. | d867519dex1018.htm |
| EX-10.17 - EX-10.17 - Olo Inc. | d867519dex1017.htm |
| EX-10.15 - EX-10.15 - Olo Inc. | d867519dex1015.htm |
| EX-10.14 - EX-10.14 - Olo Inc. | d867519dex1014.htm |
| EX-10.13 - EX-10.13 - Olo Inc. | d867519dex1013.htm |
| EX-10.9 - EX-10.9 - Olo Inc. | d867519dex109.htm |
| EX-10.8 - EX-10.8 - Olo Inc. | d867519dex108.htm |
| EX-10.6 - EX-10.6 - Olo Inc. | d867519dex106.htm |
| EX-10.5 - EX-10.5 - Olo Inc. | d867519dex105.htm |
| EX-10.4 - EX-10.4 - Olo Inc. | d867519dex104.htm |
| EX-10.3 - EX-10.3 - Olo Inc. | d867519dex103.htm |
| EX-10.2 - EX-10.2 - Olo Inc. | d867519dex102.htm |
| EX-10.1 - EX-10.1 - Olo Inc. | d867519dex101.htm |
| EX-3.3 - EX-3.3 - Olo Inc. | d867519dex33.htm |
| EX-3.1 - EX-3.1 - Olo Inc. | d867519dex31.htm |
Table of Contents
As filed with the Securities and Exchange Commission on February 19, 2021.
Registration No. 333-
UNITED STATES
SECURITIES AND EXCHANGE COMMISSION
WASHINGTON, D.C. 20549
FORM S-1
REGISTRATION STATEMENT
UNDER
THE SECURITIES ACT OF 1933
Olo Inc.
(Exact name of Registrant as specified in its charter)
| Delaware | 7372 | 20-2971562 | ||
| (State or other jurisdiction of incorporation or organization) |
(Primary Standard Industrial Classification Code Number) |
(I.R.S. Employer Identification Number) |
285 Fulton Street
One World Trade Center, 82nd Floor
New York, New York 10007
(212) 260-0895
(Address, including zip code, and telephone number, including area code, of Registrant’s principal executive offices)
Noah Glass
Founder and Chief Executive Officer
Olo Inc.
285 Fulton Street
One World Trade Center, 82nd Floor
New York, New York 10007
(212) 260-0895
(Name, address, including zip code, and telephone number, including
area code, of agent for service)
Copies to:
| Nicole Brookshire Stephane Levy Brandon Fenn Cooley LLP 55 Hudson Yards New York, NY 10001 (212) 479-6000 |
Nithya B. Das Chief Legal Officer and Corporate Secretary Olo Inc. 285 Fulton Street One World Trade Center, 82nd Floor New York, NY 10007 (212) 260-0895 |
John J. Egan, III Edwin M. O’Connor Andrew R. Pusar Goodwin Procter LLP 620 Eighth Avenue New York, NY 10018 (212) 813-8800 |
Approximate date of commencement of proposed sale to the public:
As soon as practicable after this registration statement is declared effective.
If any of the securities being registered on this Form are to be offered on a delayed or continuous basis pursuant to Rule 415 under the Securities Act of 1933, check the following box. ☐
If this Form is filed to register additional securities for an offering pursuant to Rule 462(b) under the Securities Act, check the following box and list the Securities Act registration statement number of the earlier effective registration statement for the same offering. ☐
If this Form is a post-effective amendment filed pursuant to Rule 462(c) under the Securities Act, check the following box and list the Securities Act registration statement number of the earlier effective registration statement for the same offering. ☐
If this Form is a post-effective amendment filed pursuant to Rule 462(d) under the Securities Act, check the following box and list the Securities Act registration statement number of the earlier effective registration statement for the same offering. ☐
Indicate by check mark whether the registrant is a large accelerated filer, an accelerated filer, a non-accelerated filer, a smaller reporting company or an emerging growth company. See the definitions of “large accelerated filer,” “accelerated filer,” “smaller reporting company” and “emerging growth company” in Rule 12b-2 of the Exchange Act.
| Large accelerated filer ☐ | Accelerated filer ☐ | Non-accelerated filer ☒ | Smaller reporting company ☒ | Emerging growth company ☒ |
If an emerging growth company, indicate by check mark if the registrant has elected not to use the extended transition period for complying with any new or revised financial accounting standards provided pursuant to Section 7(a)(2)(B) of the Securities Act. ☐
CALCULATION OF REGISTRATION FEE
|
| ||||
| Title of each Class of Securities to be Registered |
Proposed Maximum Aggregate Offering Price(1)(2) |
Amount of Registration Fee(3) | ||
| Class A common stock, par value $0.001 per share |
$100,000,000 | $10,910 | ||
|
| ||||
|
| ||||
| (1) | Estimated solely for the purpose of calculating the registration fee in accordance with Rule 457(o) of the Securities Act of 1933, as amended. |
| (2) | Includes the aggregate offering price of additional shares that the underwriters have the option to purchase, if any. |
| (3) | Calculated pursuant to Rule 457(o) based on an estimate of the proposed maximum aggregate offering price. |
The Registrant hereby amends this Registration Statement on such date or dates as may be necessary to delay its effective date until the Registrant will file a further amendment which specifically states that this Registration Statement will thereafter become effective in accordance with Section 8(a) of the Securities Act of 1933, as amended, or until the Registration Statement will become effective on such date as the Securities and Exchange Commission, acting pursuant to said Section 8(a), may determine.
Table of Contents
The information in this preliminary prospectus is not complete and may be changed. We may not sell these securities until the registration statement filed with the Securities and Exchange Commission is effective. This preliminary prospectus is not an offer to sell nor does it seek an offer to buy these securities in any jurisdiction where the offer or sale is not permitted.
Subject to Completion, Dated , 2021
Shares

CLASS A COMMON STOCK
This is an initial public offering of shares of Class A common stock of Olo Inc. We are offering shares of Class A common stock.
Prior to this offering, there has been no public market for our Class A common stock. It is currently estimated that the initial public offering price for our Class A common stock will be between $ and $ per share. We intend to apply to list our Class A common stock on the New York Stock Exchange, or NYSE, under the symbol “OLO.”
Following this offering, we will have two classes of common stock: Class A common stock and Class B common stock. The rights of the holders of Class A common stock and Class B common stock are identical, except with respect to voting, conversion and transfer rights. Each share of Class A common stock is entitled to one vote. Each share of Class B common stock is entitled to ten votes and is convertible at any time into one share of Class A common stock. All shares of our capital stock outstanding immediately prior to this offering, including all shares held by our executive officers, directors and their respective affiliates, and all shares issuable on the conversion of our outstanding convertible preferred stock, will be reclassified into shares of our Class B common stock immediately prior to the completion of this offering. The holders of our outstanding Class B common stock will hold approximately % of the voting power of our outstanding capital stock immediately following this offering.
We are an “emerging growth company” and a smaller reporting company as defined under the federal securities laws and, as such, we have elected to comply with certain reduced reporting requirements for this prospectus and may elect to do so in future filings.
Investing in our Class A common stock involves risks. See “Risk Factors” beginning on page 23 to read about factors you should consider before buying our Class A common stock.
Neither the Securities and Exchange Commission nor any other regulatory body has approved or disapproved of these securities or passed upon the accuracy or adequacy of this prospectus. Any representation to the contrary is a criminal offense.
| Per Share | Total | |||||||
| Initial public offering price |
$ | $ | ||||||
| Underwriting discounts and commissions(1) |
$ | $ | ||||||
| Proceeds, before expenses, to Olo Inc. |
$ | $ | ||||||
| (1) | See the section titled “Underwriting” for additional information regarding compensation payable to the underwriters. |
At our request, the underwriters have reserved up to shares of Class A common stock, or up to % of the shares to be issued by us and offered by this prospectus for sale, at the initial public offering price, to our directors, certain of our customers and partners, and the friends and family members of certain of our employees, directors, customers, and partners. See “Underwriting—Directed Share Program” for additional information.
We have granted the underwriters an option for a period of 30 days to purchase up to an additional shares of Class A common stock at the initial public offering price less the underwriting discounts and commissions.
The underwriters expect to deliver the shares of Class A common stock to purchasers on , 2021.
| Goldman Sachs & Co. LLC | J.P. Morgan | RBC Capital Markets |
| Piper Sandler | Stifel | Truist Securities | William Blair |
Prospectus dated , 2021.
Table of Contents

Leading SaaS Platform for On-Demand Restaurant Commerce
Table of Contents

OLO AT-A-GLANCE 2005 NYC FOUNDED HEADQUARTERS 64K 400 RESTAURANTS BRANDS 1.8M $14.6B ORDERS PER DAY 2020 GMV AS OF Q4 2020 (1) Gross Merchandise Value
Table of Contents

ATTRACTIVE OPERATING MODEL 94% 120%+ Y/Y REVENUE GROWTH* NET REVENUE RETENTION** 81% 16% GROSS MARGIN* OPERATING MARGIN* AS OF 2020 SUSTAINED SINCE Q1 2018 ; See Management’s Discussion and Analysis of Financial Condition and Results of Operations for additional information on Net Revenue Retention
Table of Contents
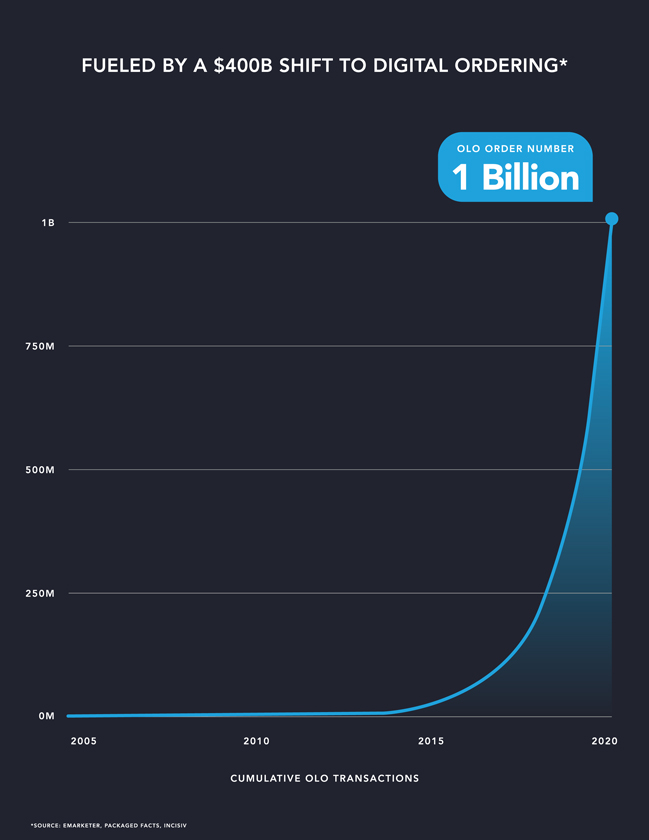
FUELED BY A $400B SHIFT TO DIGITAL ORDERING* 1 Billion 1B 750M 500M 250M 0M 2005 2010 2015 2020 OLO ORDER NUMBER CUMULATIVE OLO TRANSACTIONS * SOU R C E : EMA R K E T E R , PA C K A G E D FA C T S , I N C I S I V
Table of Contents
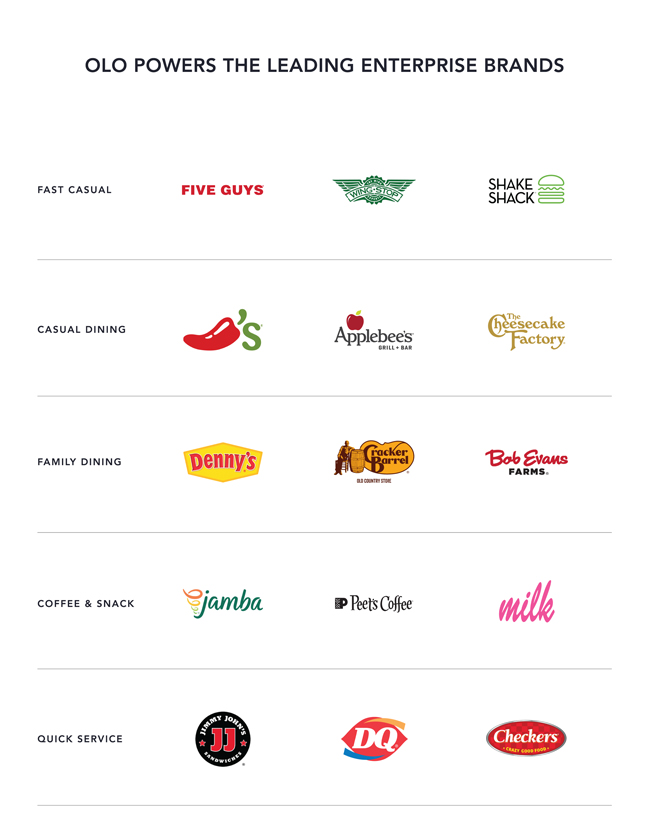
OLO POWERS THE LEADING ENTERPRISE BRANDS FAST CASUAL CASUAL DINING FAMILY DINING COFFEE & SNACK QUICK SERVICE
Table of Contents
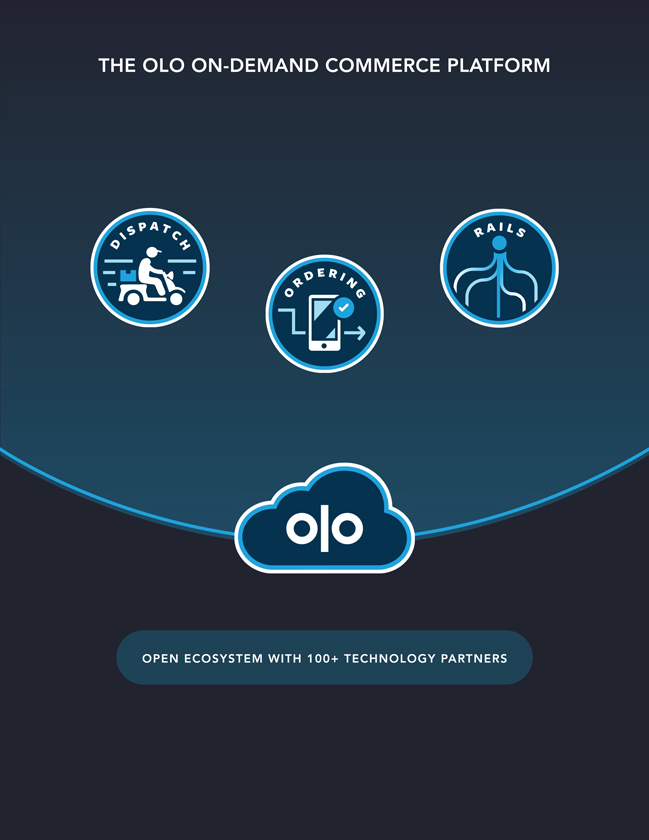
THE OLO ON-DEMAND COMMERCE PLATFORM OPEN ECOSYSTEM WITH 100+ TECHNOLOGY PARTNERS
Table of Contents
Prospectus
| Page | ||||
| 1 | ||||
| 23 | ||||
| 61 | ||||
| 63 | ||||
| 64 | ||||
| 65 | ||||
| 66 | ||||
| 69 | ||||
| MANAGEMENT’S DISCUSSION AND ANALYSIS OF FINANCIAL CONDITION AND RESULTS OF OPERATIONS |
72 | |||
| 100 | ||||
| 103 | ||||
| 128 | ||||
| 137 | ||||
| 155 | ||||
| 159 | ||||
| 163 | ||||
| 169 | ||||
| MATERIAL U.S. FEDERAL INCOME TAX CONSEQUENCES TO NON-U.S. HOLDERS OF OUR CLASS A COMMON STOCK |
172 | |||
| 177 | ||||
| 183 | ||||
| 183 | ||||
| 183 | ||||
| F-1 | ||||
Through and including , 2021 (the 25th day after the date of this prospectus), all dealers effecting transactions in these securities, whether or not participating in this offering, may be required to deliver a prospectus. This is in addition to a dealer’s obligation to deliver a prospectus when acting as an underwriter and with respect to an unsold allotment or subscription.
Neither we nor any of the underwriters have authorized anyone to provide any information or to make any representations other than those contained in this prospectus or in any free writing prospectuses we have prepared. Neither we nor any of the underwriters take responsibility for, or can provide no assurance as to the reliability of, any other information that others may give you. We and the underwriters are offering to sell, and seeking offers to buy, shares of our Class A common stock only under circumstances and in jurisdictions where offers and sales are permitted. The information contained in this prospectus is accurate only as of the date of this prospectus, regardless of the time of delivery of this prospectus or of any sale of our Class A common stock. Our business, financial condition, results of operations, and prospects may have changed since such date.
i
Table of Contents
For investors outside the United States: neither we nor any of the underwriters have done anything that would permit this offering or possession or distribution of this prospectus in any jurisdiction where action for that purpose is required, other than in the United States. Persons outside of the United States who come into possession of this prospectus must inform themselves about, and observe any restrictions relating to, the offering of the shares of our Class A common stock and the distribution of this prospectus outside of the United States.
We use in this prospectus our Olo logo, for which a U.S. trademark application has been filed. The Olo logo, “Olo” and our other registered and common law trade names, trademarks, and service marks are the property of Olo. This prospectus also includes trademarks, tradenames, and service marks that are the property of other organizations. Solely for convenience, trademarks and tradenames referred to in this prospectus appear (after the first usage) without the ® and ™ symbols, but those references are not intended to indicate, in any way, that we will not assert, to the fullest extent under applicable law, our rights or that the applicable owner will not assert its rights, to these trademarks and tradenames.
ii
Table of Contents
This summary highlights selected information contained elsewhere in this prospectus. This summary does not contain all of the information you should consider before investing in our Class A common stock. You should read this entire prospectus carefully, including the sections titled “Risk Factors,” “Management’s Discussion and Analysis of Financial Condition and Results of Operations,” “Business,” and our financial statements and the related notes included elsewhere in this prospectus, before making an investment decision. Unless the context otherwise requires, all references in this prospectus to “Olo,” the “company,” “we,” “our,” “us” or similar terms refer to Olo Inc.
Overview
Olo provides a leading cloud-based, on-demand commerce platform for multi-location restaurant brands.
Our platform powers restaurant brands’ on-demand commerce operations, enabling digital ordering and delivery, while further strengthening and enhancing the restaurants’ direct consumer relationships. Consumers today expect more on-demand convenience and personalization from restaurants, particularly through digital channels, but many restaurants lack the in-house infrastructure and expertise to satisfy this increasing demand in a cost-effective manner. Olo provides restaurants with a business-to-business-to-consumer, enterprise-grade, open SaaS platform to manage their complex digital businesses and enable fast and more personalized experiences for their customers. Our platform and application programming interfaces, or APIs, seamlessly integrate with a wide range of solutions, unifying disparate technologies across the restaurant ecosystem. Restaurant brands rely on Olo to increase their digital and in-store sales, maximize profitability, establish and maintain direct consumer relationships, and collect, protect, and leverage valuable consumer data. As a result, we nearly doubled the gross merchandise value, or GMV, which we define as the gross value of orders processed through our platform, in each of the last five years and reached nearly $14.6 billion in GMV during the year ended December 31, 2020. Our well-established platform has led many of the major publicly traded and top 50 fastest growing private restaurant brands, measured by overall sales, in the United States to work with us and has been a factor in our high gross brand retention rate. Further, industry-recognized outlets, including Restaurant Business Online, QSR Magazine, and AP News, have also deemed Olo the leading food ordering platform for the restaurant industry.
The $1.6 trillion food industry is one of the largest consumer markets in the United States. According to the National Restaurant Association, restaurants accounted for $863 billion of that spend in 2019, surpassing grocery in aggregate consumer spending, before dropping to $659 billion in 2020 as a result of COVID-19. However, consumer spending on restaurants is expected to rebound to $1.1 trillion by 2024 according to analysis by The Freedonia Group. Growing consumer demand for convenience has made off-premise consumption, which includes take-out, drive-thru, and delivery orders, the single largest contributor to restaurant industry growth. Even before the onset of the COVID-19 pandemic, off-premise consumption accounted for 60% of restaurant orders in 2020, and was expected to contribute 70% to 80% of total restaurant industry growth in the next five years, according to the National Restaurant Association. Meanwhile, delivery continues to grow as a percentage of sales. The average portion of total sales from third-party delivery in the 12 months ending August 2019 was 6.5%. Even prior to the COVID-19 pandemic, that was expected to increase to 10% in 2020. As consumers have become accustomed to the immediate convenience of on-demand commerce, they are demanding the same digital experience from restaurants, placing significant pressure on restaurants to deploy solutions. This demand has only accelerated since the onset of COVID-19, as on-demand commerce has become a necessity for the majority of restaurants.
1
Table of Contents
Restaurants are an incredibly complex segment of the retail industry, making their shift to on-demand commerce especially challenging. The four walls of the restaurant uniquely serve as both the factory and showroom floor: restaurant operators must manage the intricacies of food production and customer service simultaneously while providing the high-quality, consistency, and hospitality that engenders consumer loyalty and trust. Furthermore, restaurants serve food that is perishable, has near infinite configurations, and must be made to order for just-in-time consumption under strict regulatory standards for health and safety. Most restaurant brands, which we define as a specific restaurant brand or restaurant chain, do not have the expertise or the resources to develop their own solutions to manage on-demand commerce and are more acutely challenged because their in-store technology is comprised of a fragmented set of legacy solutions, many of which were developed before the internet. At the same time, delivery service providers, or DSPs, and ordering aggregators have catalyzed digital demand, but pose new challenges for restaurant brands through lower long-term profitability, increased complexity, disintermediation of the restaurant’s direct relationship with the consumer and, increasingly, directly competitive food offerings. Additionally, restaurants face increasing economic pressure with an intensely competitive landscape, which has only been exacerbated by the COVID-19 pandemic. Due to its unique complexities and challenges, the restaurant industry has historically been one of the lowest penetrated on-demand commerce segments of the retail industry, with digital sales accounting for less than 10% of sales, according to a report published by Cowen Equity Research in 2019.
Our open SaaS platform is purpose-built to meet these complex needs and align with the interests of the restaurant industry. For over 10 years, we have developed our platform in collaboration with many of the leading restaurant brands in the United States. We believe our platform is the only independent open SaaS platform for restaurants to provide seamless digital ordering and efficient delivery enablement, offering centralized management of a restaurant’s entire digital business. Our platform includes the following core modules:
| ● | Ordering. A fully-integrated, white-label, on-demand commerce solution, enabling consumers to order directly from and pay restaurants via mobile, web, kiosk, voice, and other digital channels. |
| ● | Dispatch. A fulfillment solution, enabling restaurants to offer, manage and expand direct delivery while optimizing price, timing, and service quality. |
| ● | Rails. An aggregator and channel management solution, allowing restaurants to control and syndicate menu, pricing, location data, and availability, while directly integrating and optimizing orders from third-parties into the restaurants’ point-of-sale, or POS, systems. |
Leading restaurant brands trust Olo’s enterprise-grade platform for its capabilities, reliability, security, scalability, and interoperability. Our platform currently handles, on average, nearly 2 million orders per day. We continually invest in architectural improvements so our system can scale in tandem with our continued growth. Additionally, both internal and external security experts frequently test our system for vulnerabilities. We have never experienced a material breach of customer or consumer data. Our open SaaS platform integrates with over 100 restaurant technology solutions including POS systems, aggregators, DSPs, payment processors, user experience, or UX, and user interface, or UI, providers, and loyalty programs, giving our customers significant control over the configuration and features of their distinct digital offering.
We are the exclusive direct digital ordering provider for our leading brands across all service models of the restaurant industry, including quick service, fast casual, casual, family, and snack food. Our customers include major publicly traded and the fastest growing private restaurant brands such as Chili’s, Wingstop, Shake Shack, Five Guys, and sweetgreen. As of December 31, 2020, we had
2
Table of Contents
approximately 400 brand customers representing over 64,000 active locations using our platform. We consider each specific restaurant brand to be a customer, even if owned by a parent organization that owns multiple restaurant brands, and define an active location as a specific restaurant location that has deployed one or more of our modules. Our average initial contract length is generally three years with continuous one-year automatic renewal periods, providing visibility into our future financial performance. Our enterprise brands, meaning those brands having 50 or more locations, are also highly loyal. Over the last five years, on average nearly 99% of our enterprise brand customers, which accounted for 91% of our total active locations as of December 31, 2020, have continued using our Ordering module each year. Our customers’ digital same-store sales has increased, on average, by 44% for the month ended December 31, 2019 when compared to the month ended December 31, 2018. This trend has further accelerated over the past year, with digital same-store sales up 156% for the month ended December 31, 2020 when compared to the month ended December 31, 2019.
We have a highly efficient go-to-market model as a result of our industry thought leadership, partnership approach with our restaurant customers, and experienced enterprise sales, customer success, and deployment teams. Unlike other enterprise software businesses, where the sales team works to add a single location or division and expand to others, we enter into relationships at the brand’s corporate level and secure exclusivity across all company-owned and franchise locations. This enables us to deploy our modules across all new and existing brand locations without any additional sales and marketing costs, and upsell new offerings to the brand itself, rather than each individual location. As of December 31, 2019 and 2020, 44% and 71% of our customers used all three of our modules, respectively.
We refer to our business model as a transactional SaaS model as it includes both subscription and transaction-based revenue streams, and we designed it to align with our customers’ success. Our model allows our customers to forego the cost of building, maintaining, and securing their own digital ordering and delivery platforms and to retain direct relationships with their consumers while maximizing profitability. Our hybrid-pricing model provides us with a predictable revenue stream and enables us to further grow our revenue as our customers increase their digital order volume. We generate subscription revenue from our Ordering module and transaction revenue from our Rails and Dispatch modules. We charge our customers a fixed monthly subscription fee per restaurant location for access to our Ordering module. In addition, a growing portion of our customers purchase an allotment of monthly orders for a fixed monthly fee and pay us an additional fee for each excess order, which we also consider to be subscription revenue. Our transaction revenue includes revenue generated from our Rails and Dispatch modules. Customers who subscribe to our Rails and Dispatch modules pay a fee on a per transaction basis. In most cases, we also charge aggregators, channel partners, and other service providers in our ecosystem on a per transaction basis for access to our Rails and Dispatch modules. We also derive transactional revenue from other products, including Network, which allows brands to take orders from non-marketplace digital channels (e.g., Google Food Ordering, which enables restaurants to fulfill orders directly through Google search results and Maps pages). These products generate fees predominantly through revenue sharing agreements with partners. For the years ended December 31, 2018, 2019, and 2020, 93.2%, 80.8%, and 56.7% of our platform revenue was subscription revenue, respectively, and 6.8%, 19.2%, and 43.3% was transaction revenue, respectively.
Our business has experienced rapid growth in a highly capital efficient manner. Since inception 15 years ago, we have raised less than $100.0 million of primary investment capital, net of share repurchases, and as of December 31, 2020, we had cash and cash equivalents of $75.8 million with no outstanding debt. During the years ended December 31, 2018, 2019, and 2020, we generated revenue of $31.8 million, $50.7 million, and $98.4 million, respectively, representing year-over-year growth of 59.4% and 94.2%.
3
Table of Contents
During the years ended December 31, 2018, 2019, and 2020, we generated gross profit of $21.0 million, $35.1 million, and $79.8 million, respectively, or 66.0%, 69.3%, and 81.0% as a percentage of revenue, respectively. During the years ended December 31, 2018 and 2019, we incurred net losses of $11.6 million and $8.3 million, respectively, and during the year ended December 31, 2020, we generated net income of $3.1 million. During the years ended December 31, 2018 and 2019, we incurred operating losses of $8.8 million and $5.1 million, respectively and during the year ended December 31, 2020, we generated operating income of $16.1 million. During the years ended December 31, 2018 and 2019, we incurred non-GAAP operating losses of $4.6 million and $0.2 million, respectively, and during the year ended December 31, 2020, we generated non-GAAP operating income of $21.8 million. See the section titled “Management’s Discussion and Analysis of Financial Condition and Results of Operations” for additional information on our non-GAAP metrics.
COVID-19 Update
On March 11, 2020, the World Health Organization declared COVID-19 a global pandemic, impacting communities in the United States and across the world. Responses to the outbreak continue to develop, as consequences have affected communities and economies across the world. State mandated lockdowns have adversely impacted many restaurants, as public health regulations transformed or even halted daily operations. In order to stay in business, restaurants were forced to more aggressively adopt digital solutions to provide on-demand services, off-premise dining and delivery solutions for consumers, if they were not already. In just the first few weeks of the COVID-19 shutdowns in the United States, 59% of restaurant operators added new curbside pickup offerings and 20% added new online ordering or pre-pay functionalities as a direct response to the coronavirus pandemic, according to a survey by eMarketer. Consumers were receptive to these changes, with 30% of them affirming that they had begun using restaurant delivery and 50% affirming they had begun take out services, mostly due to COVID-19, according to a report by Packaged Facts.
Although we are optimistic that the emphasis on on-demand commerce in the food services industry will be an enduring trend, we do not have certainty on the long-term impact these developments will have on the industry. The degree of the pandemic’s effect on our restaurant partners across the food services industry will depend on many factors, particularly on government regulations and their impact on the financial viability of restaurant operations as well as the duration of the pandemic. We will continue to monitor these developments and their implications on our business. The COVID-19 pandemic could materially adversely impact our business, financial condition, and results of operations. In the absence of updated industry sources giving effect to the market shifts precipitated by COVID-19, we have included in this prospectus select market research that was published prior to the COVID-19 outbreak and without considerations for its potential effects. Refer to “Risk Factors” in this prospectus for additional information regarding the impact of COVID-19 on our business.
| ● | Impact on Our Operations: |
During the month of March 2020, in accordance with local, state, and national regulations, we closed our offices in New York, and transitioned our employees to work-from-home and efficiently adapted our operations to a remote working environment. In addition, we were able to operate without terminating or furloughing our employees. As the pandemic continued, we grew our employee base to scale the business in order to meet the increased customer demands we were facing.
We continue to monitor updates and consider regulatory guidance for reopening office locations. We believe that we are well equipped to support full or partial remote work without disruption to our business.
4
Table of Contents
| ● | Impact on Our Customers: |
As many restaurants faced on-premise dining restrictions, our customers needed to transition and adapt their businesses quickly. In a recent survey of Olo customers, approximately 70% of respondents offered more off-premise delivery and pick-up options in response to COVID-19. We focused on optimizing the deployment process for our new customers and offered adaptive solutions to help them navigate through this challenging business environment. We reprioritized our strategic roadmap to address the most important solutions for our customers, including enhancements to our curbside pick-up functionality. As curbside pick-up became an even more integral component of restaurant transactions, we further enabled our platform capabilities so restaurants could more efficiently manage these orders, adding quick response, or QR, code functionality, kiosk ordering solutions, and additional ecosystem partners. We engaged with our customers to collaborate on implementing the most relevant short- and long-term solutions. In addition to helping our customer brands react to COVID-19, we recognized the importance of supporting the restaurant industry and front-line workers directly and made donations to the Restaurant Employee Relief Fund.
| ● | Impact on Our Financials: |
Our revenue for the quarters ended March 31, 2020, June 30, 2020, September 30, 2020, and December 31, 2020 increased by 55.2%, 100.2%, 94.2%, and 117.6%, respectively, compared to 2019. While many restaurants have been struggling during this period, we have been uniquely positioned to expand our footprint and help support the restaurant industry when it was most in need. While we expect on-premise dining to return over time, we believe that off-premise offerings will continue to be an essential part of a restaurant’s operations.
Industry Background
There are a number of important industry trends driving our market opportunity.
| ● | Restaurants are facing complex challenges and are under significant economic pressure. The restaurant landscape has become increasingly dynamic, with competition coming from existing restaurant brands, new restaurant brands, aggregators and ghost kitchens, that frequently have sophisticated digital, marketing, ordering, and distribution strategies. As a result, it is difficult for some restaurants to attract and retain loyal consumers. Moreover, restaurant brands are increasingly having to share their revenue with aggregators. These challenges have only been exacerbated by COVID-19 as many governments imposed restrictions to on-premise dining, resulting in significant financial losses and many closures. All restaurant operators have had to adapt to these new, complex challenges or risk losing their business. There is now a real urgency for restaurants to adopt cost-effective digital solutions in order to support their businesses and drive margin expansion and incremental sales over the longer term. |
| ● | The restaurant industry is massive and enterprises are rapidly expanding market share. The nearly $700 billion restaurant industry is undergoing a dynamic transformation, being forced to adapt to the new market environment created by COVID-19. According to the National Restaurant Association, the restaurant industry’s share of the dollars spent on food increased from 25% in 1955 to 51% in 2019, representing the first time in history that restaurants have surpassed grocery in aggregate sales. While restaurants have lost some traction against grocery due to COVID-19, we expect the increase in restaurant spend when compared to grocery to continue over the long-term, and according to analysis by The Freedonia Group, consumer spending on restaurants is expected to increase to $1.1 trillion by 2024. Enterprise restaurant brands in particular are rapidly increasing their share |
5
Table of Contents
| of the market as they are able to leverage their scale to more effectively deploy on-demand commerce solutions than many small and medium business, or SMB, restaurants. We expect consumers will continue to demand digital solutions from restaurants that offer more convenience and personalization, helping to drive sales and expand the industry. |
| ● | Consumer behavior is shifting towards on-demand commerce convenience. In today’s on-demand economy, and even more so during the COVID-19 pandemic, consumers expect goods and services to be easily ordered through digital means. According to a 2019 Salesforce.com, Inc. publication, 66% of all consumers cite instant and on-demand fulfillment of purchases as important and approximately 50% say that they will switch brands if a company does not proactively anticipate their needs. The COVID-19 pandemic has only accelerated this long-term shift in consumer demand for adaptive on-demand commerce platforms. We believe these trends will continue to accelerate in the restaurant industry in particular as advances in technology allow restaurants to further reduce friction in digital ordering and fulfillment to further satisfy consumers’ new engagement preferences. |
| ● | Off-premise dining is the main engine of restaurant growth, with pickup continuing to lead. Off-premise dining has continued to grow rapidly, accounting for 63% of U.S. restaurant transactions in 2019. Prior to the COVID-19 pandemic, off-premise dining had been expected to contribute 70% to 80% of total restaurant industry growth in the next five years according to the National Restaurant Association. Since then, off-premise offerings have become an even more critical part of a restaurant’s business and long-term growth. While off-premise consumption is growing rapidly, only approximately 3% of total restaurant orders were fulfilled through delivery in 2018, and 39% and 21% were attributed to take-out and drive-thru, respectively. Restaurants operators have known the importance of off-premise offerings, with 78% of operators identifying off-premise solutions as a strategic priority, according to the State of the Industry Report published by the National Restaurant Association in 2019. COVID-19 has accelerated this shift with at least 27% of restaurant operators reporting having added new off-premise delivery options since the pandemic began, according to a survey by the National Restaurant Association. While consumers currently appear less apprehensive to visit restaurants and dine-in than they did at the beginning of the pandemic, usage of delivery and carry-out options remains higher than pre-COVID-19 levels. According to a recent survey by the National Restaurant Association, approximately 70% of restaurant operators across service categories plan to keep the changes they made to their restaurant after COVID-19 has subsided. |
| ● | Digital restaurant ordering is experiencing rapid growth in a shifting landscape. Both direct and indirect digital ordering channels are powering this expansion. Aggregators created consumer applications to meet the growing demand for convenient restaurant food, helping expand off-premise dining. In addition, major consumer facing platforms are embedding food ordering into products such as maps and search results, making it even more convenient for consumers to place orders from their favorite restaurant brands. Furthermore, COVID-19 tailwinds have accelerated this expansion, forcing restaurants to develop direct digital ordering operations or leverage indirect channels to meet customers’ digital demands through this unpredictable period. These channels are expected to drive the expansion of the U.S. online food delivery market, a subset of the restaurant digital ordering market, from $356 billion in 2019 to $470 billion by 2025, according to industry research. |
| ● | Restaurant brands must evolve to own digital relationships with their consumers. Like any other retailer, understanding and owning the consumer relationship is vital to restaurants |
6
Table of Contents
| as it allows them to better analyze interactions, customize offerings, and maximize the long-term value of their consumers. However, restaurants risk losing direct consumer relationships if they are heavily reliant on aggregators, which generally do not provide visibility into who is ordering or enable a restaurant to articulate its unique brand value. According to a recent survey by the National Restaurant Association, 64% of adults prefer to order directly through the restaurant for delivery, compared to only 18% who prefer to order through a third-party service for delivery. In fact, over 70% of Olo customers in a recent survey indicated that their primary reason to own their own branded digital storefront was to own a direct relationship with their guests. The majority of respondents have 50% or less of their online orders coming through an aggregator compared to their own channel, and they expect their mix of aggregator order volumes to decrease in the future relative to their own channel. Additionally, aggregators typically limit a restaurant’s ability to collect and use data about consumers and orders transacted through the aggregator. Consumers also value this direct and personal connectivity with restaurant brands, and we believe consumers would rather interact directly with a brand than through an intermediary. |
| ● | On-demand commerce has substantial opportunity to expand penetration in the restaurant industry. The nearly $700 billion restaurant market in the United States continues to be one of the most underpenetrated in terms of on-demand commerce at less than 10% of industry sales, according to research published by Cowen Equity Research, as well as U.S. government data. In comparison, sectors such as books and electronics have digital penetration well over 50%. Restaurants are uniquely positioned to benefit from consumers’ demand for digital convenience, but are limited by significant complexities in the restaurant ecosystem, which have slowed penetration to-date. |
Complexities of the Current Ecosystem
The key complexities that hinder restaurants’ digital transformation progress include:
POS and Technology Integration
| ● | Inconsistent technologies within and across brand locations. Restaurant brands historically have not standardized the type of technology platforms that must be deployed across their locations. For example, in our survey, 70% of respondents indicated they use two to four different technology providers to collect orders across various channels. This has led to significant differences in the types of technology that restaurants use across a brand and even within a given restaurant location. |
| ● | Multiple platforms within a restaurant. Many brands have multiple POS systems, payment processors, and now tablets to manage incoming orders across various aggregators. In addition, many of these technologies have become deeply entrenched into their operations, making them difficult to replace with more modern solutions. These platforms cannot act quickly and harmoniously to meet the changing needs of restaurants, particularly during the COVID-19 pandemic. |
| ● | Disparate integrations across the ecosystem. Many restaurants have adopted narrow point solutions that do not integrate seamlessly with other systems, such as POS systems, aggregators, DSPs, payment processors, UI and UX providers, and loyalty programs. Restaurant location operators often lack the technical expertise and resources necessary to integrate both legacy and modern technologies. |
7
Table of Contents
| ● | Static, legacy software infrastructure. Legacy restaurant systems were not built for modern, cloud-based environments. As a result, many lack the reliability, scalability, and security capabilities that today’s SaaS solutions offer, leaving restaurants and their consumer data vulnerable. Furthermore, brands are unable to access their consumer data, as it resides in different systems and databases that cannot communicate with each other. |
Food and Menu Management
| ● | Numerous, highly modifiable menu items. Restaurant menus are inherently complex, highly configurable, and frequently updated for changing consumer preferences, out-of-stock ingredients, or product recalls. In addition, restaurants must ensure menus and pricing are always accurately reflected across their various channels to ensure consumers have the latest information and receive the exact food they order, particularly as food allergies, dietary preferences, and other health issues become more prevalent. This has made it challenging for restaurant brands, who are increasingly expected to offer intuitive digital menus where consumers can add, subtract, or modify a wide variety of ingredients or menu items, creating a nearly infinite number of order permutations. |
Order Channels
| ● | Multiple ordering channels. Today’s restaurants need to seamlessly manage on-premise and off-premise operations to ensure they provide the optimal experience to all of their consumers. In-store orders are only one part of the overall operation, as restaurants receive off-premise orders from several different direct and indirect channels, which often require multiple POS systems and tablets at a single location. Food orders can be placed directly through restaurants’ mobile applications or over the phone and indirectly from aggregators at the same time. Many restaurants are not equipped to balance this on-premise and off-premise dynamic, let alone the direct and indirect channels of ordering. |
| ● | Shifting from serial to parallel processing. Restaurants are accustomed to serial order processing, which means that they receive an order from an on-premise consumer and fulfill it accordingly. With the rise of off-premise dining and multiple direct and indirect channels for ordering, restaurants increasingly receive multiple orders simultaneously. Legacy restaurant technology is not properly equipped to centralize and track these orders or help restaurants prioritize orders to ensure high quality fulfillment or to provide accurate estimates of when the food will be ready. Restaurants require modernization to better accommodate parallel processing and streamline their operations. |
Operations and Logistics
| ● | Complex, on-demand logistics management. A report published by Cowen Equity Research in 2019 projects that the majority of restaurant growth will come from expanded off-premises dining, which we expect will continue to place significant operational burdens on restaurants. Restaurant staff must prepare food at exactly the right time to ensure optimal quality. Restaurants must adapt locations to better accommodate take-out orders and manage multiple DSPs to ensure consumers get their food reliably at a cost-effective price. The COVID-19 pandemic has only exacerbated these complexities, as restaurants have had to adapt their operations to accommodate the massive increase in delivery and take-out orders, in particular. |
8
Table of Contents
Building a Digital Brand and Owning the Consumer Relationship
| ● | Navigating the shift to digital branding. Many restaurants have spent decades building brand equity with their consumers and securing their loyalty. Meanwhile, consumers themselves are seeking direct engagement with brands through digital channels. However, restaurants lack the tools they need to interact and engage with their consumers across digital channels and to foster those direct relationships. |
| ● | Competition for the direct consumer relationship. As aggregators have scaled, they have often disintermediated restaurants’ direct consumer relationships. Each consumer is more valuable to an aggregator than any individual restaurant brand and, therefore, aggregators can afford to spend more than a particular restaurant brand to acquire a consumer. These aggregators are digitally savvy, have more capabilities in search engine marketing and optimization, and are specialists at leveraging data to acquire consumers and extract much higher customer lifetime value relative to the cost of acquiring a consumer. Many restaurants do not have the digital aptitude to stay competitive, and are at risk of losing direct contact with their consumers. |
| ● | Inability to access and leverage consumer data. Establishing direct digital relationships enables restaurants to collect data and learn from consumer interactions, evolve their offerings, and drive increased consumer loyalty. However, restaurants’ legacy technologies generally do not have the capabilities to collect, organize, and analyze these consumer data sets. There are also no major customer relationship management solutions built exclusively for the restaurant industry at scale. As a result, restaurants are forced to collect and integrate data from disparate systems, making it almost impossible to draw impactful, data-driven insights. |
Our Platform
We provide the leading on-demand commerce platform designed for multi-location restaurant brands. Our customers use our software to create unique direct-to-consumer digital ordering experiences, manage orders across channels, and enable delivery across their restaurant locations. We have an open SaaS platform that seamlessly integrates with technology solutions throughout the restaurant ecosystem, including most POS systems, aggregators, DSPs, payment processors, UI and UX providers, and loyalty programs. We provide restaurants with a centralized system to manage their digital business and ensure consumers receive better, faster, and more personalized service while increasing restaurant order volume and improving yield at lower cost.
We engineered our platform to handle the most complex issues for the leading restaurant brands, but with the simplicity and ease-of-use required within an individual restaurant. We developed our infrastructure with application programming interfaces, or APIs, which facilitate interactions across and integrate with multiple software programs and components of the restaurant ecosystem. We enable more streamlined data collection and facilitate analytical decision-making, so restaurants can better understand and adapt to unique consumer preferences. We are constantly innovating and enhancing our platform, with our continuously deployed, multi-tenant architecture ensuring all restaurant locations are always using the latest technology.
9
Table of Contents
Our platform includes the following core modules:
Ordering
| ● | Secure, white-label, direct-to-consumer, front-end solution enables consumers to directly order from and pay restaurants via mobile, web, kiosk, car, voice, and other digital channels. |
| ● | Integrates with our customers’ back-end systems and provides a scalable digital ordering infrastructure behind custom front-end applications. |
Dispatch
| ● | Enables restaurants to offer and expand delivery for orders generated via their own websites and applications. |
| ● | Manages each restaurant’s delivery options and selects DSPs, including in-house couriers, based on optimal price, timing, availability, and other attributes. |
Rails
| ● | Centralizes and manages location specific menu, pricing, and availability, enabling automatic updates across multiple ordering channels. |
| ● | Integrates orders from aggregators into a restaurant’s POS systems. |
Our Position in the Restaurant Industry
Restaurants rely on our enterprise-grade open SaaS platform to power their critically important digital ordering and fulfillment offerings. Our focus on developing solutions has aligned with restaurant brands’ interests, and our history of deploying our platform to approximately 400 restaurant brands through exclusive direct digital ordering relationships has allowed us to build what we believe is one of the largest technology ecosystems in the restaurant industry. We integrate with over 100 technology partners and believe that this positions us to be the only party able to unify and enhance the utility of disparate technologies across the industry, including POS systems, aggregators, DSPs, payment processors, UI and UX providers, and loyalty programs.
We believe that our approach to building this two-sided network, comprised of restaurants and technology partners, has given us a valuable position that is deeply embedded within the restaurant industry. We intend to expand our influence and position as we onboard new customer brands, integrate with additional modern or legacy software systems and technology providers, improve our platform’s functionality, develop new modules, continue to provide industry-leading security, and as our restaurant customers increasingly process orders through digital channels.
Key Benefits of Our Platform
Restaurants use our intuitive ordering, delivery, and aggregator enablement platform to streamline restaurant operations and provide a superior consumer experience. Our platform enables restaurants to overcome the complexities of building and growing a digital business, own the overall consumer relationship, and scale, secure, and centralize their on-demand commerce operations with our enterprise-grade technology. The key benefits of our platform include:
10
Table of Contents
Overcome the Complexities of Restaurant On-Demand Commerce Operations
| ● | Utilize Olo as a centralized source of data. Our restaurant brand customers, many of whom leverage multiple technology providers across locations, can manage menus, including menu-item availability, and day-to-day operations with permission-based administration tools and reporting, utilizing Olo as a centralized source of data. |
| ● | Extensible, modular platform. We have an open SaaS platform that integrates with over 100 restaurant technology solutions across the restaurant ecosystem. These integrations allow us to streamline order processing and fulfillment, and keep information in sync with a variety of POS systems, aggregators, DSPs, payment processors, UX and UI providers, and loyalty programs. Our platform’s extensibility ensures restaurants are able to quickly adapt and address problems they face as the landscape rapidly evolves. |
| ● | Manage demand across platforms to optimize yield. Our Rails module consolidates demand across aggregators, allowing our customers to generate more orders through an intuitive, coordinated system. Our customers are able to monitor and parallel process orders across the various channels and more easily and accurately prioritize and fulfill orders. We also help our restaurant brand customers optimize yield during peak periods by prioritizing different ordering channels as needed to ensure the highest priority items are fulfilled while maximizing profitability. |
| ● | Enable and manage a restaurant’s delivery functions across providers. Our Dispatch module enables restaurants to automatically select the optimal delivery provider for an individual order based on dozens of attributes, such as delivery time, order size or value, cost of delivery, or service level, for each individual order at each individual location. Restaurant brands are able to fulfill orders just-in-time to allow for a better consumer experience at a competitive cost. |
Enhance and Own the Consumer Experience
| ● | Own the consumer relationship. Our platform enables restaurants to provide individually branded and direct-to-consumer experiences across devices through our web and mobile front-end or via customized consumer experiences using our APIs and third-party UI and UX providers. This unique consumer experience extends beyond aesthetic and operative functionality to expanded order offerings like upsell, group ordering, and loyalty programs. With Olo, restaurants know their consumers better and can more effectively meet their needs while maximizing on-demand commerce results. |
| ● | Leverage powerful data and analytics to guarantee the highest quality consumer experience. We enable our customers to collect a significant amount of data that they can use to generate valuable insights into their consumers’ ordering behaviors. Restaurant brands and their individual locations can leverage this data to better manage operations, provide consumers with a more personalized experience, and drive incremental sales. |
Scalable and Secure Operations with Enterprise Grade Technology
| ● | Built for ensuring scalability and reliability. Our software infrastructure is cloud-hosted and highly flexible with the ability to handle large spikes in traffic and withstand many failure scenarios. Our high-availability, frequently deployed, multi-tenant architecture ensures that all of our customers are able to operate with the latest features and the |
11
Table of Contents
| newest innovations of the latest version of our platform. While our platform currently handles, on average, nearly 2 million orders per day, we continually invest in architectural improvements so our system can scale in tandem with our continued growth. |
| ● | Enterprise-grade security and privacy. Our customers trust our platform with their most sensitive consumer and business data and many have run security assessments of our platform to verify that it has robust security capable of protecting their consumer data. We also employ in-house Blue and Red Security Teams that constantly monitor the platform, testing for and addressing vulnerabilities. Our technology also incorporates privacy-safe practices and tools as an integral and foundational part of our platform’s approach. Privacy best practices are proactively embedded into our systems and infrastructure. |
| ● | Secure by design. Our software engineering practices consider, evaluate, and manage risk throughout the design, development, and deployment phases to provide best-in-class security across our platform. This includes risk and threat evaluation at the inception of all of our products and services, leveraging zero trust, least privilege, and role based access concepts, secure development training, avoiding common security anti-patterns, and extensive automated and manual security testing. Our security program also includes regular third-party examinations for security, including annual PCI-DSS Attestation of Compliance, or AoC, and SOC 1 and SOC 2 audits. The SOC 2 report demonstrates our compliance with the American Institute of Certified Public Accountants’ trust service principles criteria for security, availability, confidentiality, and processing integrity. |
Our Market Opportunity
We believe our total addressable market opportunity is $7 billion based on our current product offerings and focus on enterprise restaurants primarily in the United States. To arrive at this figure, we determined the number of enterprise restaurant locations and number of orders that we could generate revenue from on a per location basis. According to a 2019 publication by the NPD Group, there are approximately 300,000 enterprise restaurant locations across the United States. We determined the number of orders per enterprise location, based on industry research, by dividing their total sales by the average order value in the United States. To determine our opportunity per location, we then multiplied the implied number of orders by the percentage of digital orders, and by our actual average fee per order, and then added our actual annual average subscription fee per location as of December 31, 2020 to get the estimated total annual average revenue per restaurant location. This figure was then multiplied by the number of enterprise locations to arrive at the U.S. estimate.
Driven by the COVID-19 pandemic, digital platforms are enabling many more restaurant transactions, including on-premise solutions such as table-top dining through the use of QR codes and kiosk ordering. While this is one of many potential opportunities, we believe that we can fulfill these transactions as we introduce new solutions to enable these services. By providing more products and services to our customers, we believe we can increase our fees per transaction, which could expand our total addressable market further to $15 billion.
As we provide more products and services and increase our efforts to pursue SMB restaurants, we believe our total addressable market will expand further. This is based on an increase the total number of SMB restaurants we serve, which would expand our market potential by an approximately 400,000 additional estimated restaurant locations. If successful, we believe this expansion would allow Olo to reach a total addressable market of $20 billion. We believe our opportunity outside of the United States is at least as large as our domestic opportunity implying a total global addressable market of $40 billion.
12
Table of Contents
Our Growth Strategies
We aim to be the leading on-demand commerce platform for the restaurant industry. The principal components of our growth strategy are:
| ● | Add new large multi-location and high-growth restaurant brands and scale with them. We believe there is a substantial opportunity to continue to grow our customer base within the U.S. restaurant industry, adding to our approximately 400 existing brands across more than 64,000 active locations. We intend to continue to drive new customer growth by leveraging our brand and experience within the industry, and expanding our sales and marketing efforts. We have also historically pursued and will continue to target the most well-capitalized, fastest growing restaurant brands in the industry. As our restaurant brand customers open new locations, we are well-positioned to organically grow our revenue with little to no incremental sales and marketing costs to target additional locations. |
| ● | Upsell existing customers additional modules. As of December 31, 2019 and 2020, 44% and 71% of our customers used all three of our modules, respectively. We believe that we are well-positioned to upsell our remaining customers, as our modules provide significant value, are simple to add, operate seamlessly together, and improve restaurant brands’ on-demand commerce capabilities and consumer experience. |
| ● | Enable higher transaction volume. We will continue to work with our existing restaurant customers to enable higher transaction volumes at their locations particularly through direct channels. As on-demand commerce grows to represent a larger share of total off-premise food consumption, we expect to significantly benefit from this secular trend through increased revenue. As we continue to expand our product offerings across both on and off-premise dining and improve our current software, we also believe there is an opportunity to increase our share of the transaction volume that flows through our platform both through direct channels and revenues from aggregators. |
| ● | Develop and launch new product offerings. We intend to continue to invest in expanding the functionality of our current platform and broadening capabilities that address new opportunities, particularly around payments, on-premise dining, and data analytics. We plan to continue broadening our new product offerings for on-premise transactions, such as table top ordering, as the COVID-19 impacted restaurant landscape offers increased opportunity for technology integration even for on-premise dining. We believe this strategy will provide new avenues for growth and allow us to continue to deliver differentiated high-value outcomes to both our customers and stockholders. |
| ● | Expand our ecosystem. We plan to expand our current ecosystem of developers, user experience designers, and other partners to better support our customers, attract new customers, and strengthen our competitive position. We believe that we can leverage our partnerships with POS systems, aggregators, DSPs, payment processors, UX and UI providers, and loyalty programs to deliver additional value to our customers. |
| ● | Grow our longer-term market opportunity. While we have not made any significant investments in this area to date, we believe there is an opportunity to partner with SMB brands to enable their on-demand commerce presence. Additionally, as many of our customers operate internationally, we believe there is a robust opportunity to expand their usage of our platform outside of the United States. We also believe that our platform can be applied to other verticals beyond the restaurant industry that are undergoing similar digital transformations. For example, we currently work with a number of grocery chains and convenience stores who use our software to help their consumers order ready-to-eat meals, and we may expand our efforts in these or other verticals in the future. |
13
Table of Contents
Risk Factors Summary
Investing in our Class A common stock involves substantial risks. The risks described in the section titled “Risk Factors” immediately following this summary may cause us to not realize the full potential of our key benefits or to be unable to successfully execute all or part of our strategy. Some of the more significant risks include the following:
| ● | Our rapid growth may not be sustainable and depends on our ability to attract new customers, retain revenue from existing customers, and increase sales to both new and existing customers. |
| ● | The COVID-19 pandemic could materially adversely affect our business, financial condition, and results of operations. |
| ● | Our limited operating history with our new modules in a new and developing market makes it difficult to evaluate our current business and future prospects, and may increase the risk that we will not be successful. |
| ● | Our business could be harmed if we fail to manage our growth effectively. |
| ● | We have a history of losses and we may be unable to sustain profitability. |
| ● | Our sales cycles can be long and unpredictable, and our sales efforts require considerable investment of time and expense. If our sales cycle lengthens or we invest substantial resources pursuing unsuccessful sales opportunities, our operating results and growth would be harmed. |
| ● | We expect fluctuations in our financial results, making it difficult to project future results, and if we fail to meet the expectations of securities analysts or investors with respect to our results of operations, our stock price and the value of your investment could decline. |
| ● | Our business depends on customers increasing their use of our platform, and any loss of customers or decline in their use of our platform could materially and adversely affect our business, results of operations, and financial condition. |
| ● | If we fail to continue to improve and enhance the functionality, performance, reliability, design, security, or scalability of our platform in a manner that responds to our customers’ evolving needs, our business may be adversely affected. |
| ● | Our growth depends in part on the success of our strategic relationships with third parties and our ability to integrate with third-party applications and software. |
| ● | Our Dispatch module currently relies on a limited number of DSPs. |
| ● | Our Rails module currently relies on a limited number of aggregators. |
| ● | We currently generate significant revenue from our largest restaurant customers, and the loss or decline in revenue from any of these customers could harm our business, results of operations and financial condition. |
14
Table of Contents
| ● | Security breaches, denial of service attacks, or other hacking and phishing attacks on our systems or the systems with which our platform integrates could harm our reputation or subject us to significant liability and adversely affect our business and financial results. |
| ● | Our business is highly competitive. We may not be able to compete successfully against current and future competitors. |
| ● | If we cannot maintain our corporate culture as we grow, our success and our business and competitive position may be harmed. |
| ● | Our future success depends in part on our ability to drive the adoption of our platform by international and SMB customers, and to expand into new, on-demand commerce verticals. |
| ● | We may be subject to claims by third parties of intellectual property infringement. |
| ● | We identified a material weakness in our internal control over our financial reporting process. If we are unable to remediate this material weakness, we may not be able to accurately or timely report our financial condition or results of operations. |
| ● | The dual-class structure of our common stock will have the effect of concentrating voting control with our existing stockholders, executive officers, directors, and their affiliates, which will limit your ability to influence the outcome of important transactions and to influence corporate governance matters, such as electing directors, and to approve material mergers, acquisitions, or other business combination transactions that may not be aligned with your interests. |
Our Corporate Information
We were incorporated in Delaware in June 2005. In January 2020, we changed our name from Mobo Systems, Inc. to Olo Inc. Our principal executive offices are located at 285 Fulton Street, One World Trade Center, 82nd Floor, New York, New York 10007, and our telephone number is (212) 260-0895. Our website address is www.olo.com. Information contained on, or that can be accessed through, our website is not incorporated by reference in this prospectus, and you should not consider information on our website to be part of this prospectus or in deciding to purchase our Class A common stock.
Implications of Being an Emerging Growth Company and a Smaller Reporting Company
We are an “emerging growth company” as defined in the Jumpstart Our Business Startups Act of 2012, or the JOBS Act. We may take advantage of certain exemptions from various public company reporting requirements, including not being required to have our internal control over financial reporting audited by our independent registered public accounting firm under Section 404 of the Sarbanes-Oxley Act of 2002, or the Sarbanes-Oxley Act, reduced disclosure obligations regarding executive compensation in our periodic reports and proxy statements and exemptions from the requirements of holding a non-binding advisory vote on executive compensation and any golden parachute payments. We may take advantage of these exemptions for up to five years or until we are no longer an emerging growth company, whichever is earlier. In addition, the JOBS Act provides that an “emerging growth company” can delay adopting new or revised accounting standards until those standards apply to private companies. We have elected to use the extended transition period under the JOBS Act.
15
Table of Contents
Accordingly, our financial statements may not be comparable to the financial statements of public companies that comply with such new or revised accounting standards.
We will remain an emerging growth company until the earliest of: (1) the last day of the fiscal year following the fifth anniversary of this offering; (2) the last day of the first fiscal year in which our annual gross revenue is $1.07 billion or more; (3) the date on which we have, during the previous rolling three-year period, issued more than $1.0 billion in non-convertible debt securities; and (4) the last day of the fiscal year in which the market value of our equity securities, which includes Class A common stock and Class B common stock held by non-affiliates exceeds $700 million as of June 30 of such fiscal year.
We are also a smaller reporting company as defined in the Securities Exchange Act of 1934, as amended. We may continue to be a smaller reporting company even after we are no longer an emerging growth company. We may take advantage of certain of the scaled disclosures available to smaller reporting companies and will be able to take advantage of these scaled disclosures for so long as (i) the market value of our voting and non-voting common stock held by non-affiliates is less than $250 million measured on the last business day of our second fiscal quarter or (ii) our annual revenue is less than $100 million during the most recently completed fiscal year and the market value of our voting and non-voting common stock held by non-affiliates is less than $700 million measured on the last business day of our second fiscal quarter. Specifically, as a smaller reporting company, we may choose to present only the two most recent fiscal years of audited financial statements in our Annual Report on Form 10-K and have reduced disclosure obligations regarding executive compensation, and, similar to emerging growth companies, if we are a smaller reporting company with less than $100 million in annual revenue, we would not be required to obtain an attestation report on internal control over financial reporting issued by our independent registered public accounting firm.
16
Table of Contents
THE OFFERING
| Class A common stock offered by us |
shares |
| Option to purchase additional shares of Class A common stock offered by us |
shares |
| Class A common stock to be outstanding immediately after this offering |
shares ( shares if the option to purchase additional shares is exercised in full). |
| Class B common stock to be outstanding immediately after this offering |
shares |
| Total Class A common stock and Class B common stock to be outstanding after this offering |
shares |
| Use of proceeds |
We estimate that our net proceeds from the sale of our Class A common stock that we are offering will be approximately $ million (or approximately $ million if the underwriters’ option to purchase additional shares of our Class A common stock from us is exercised in full), assuming an initial public offering price of $ per share, the midpoint of the estimated price range set forth on the cover page of this prospectus, and after deducting estimated underwriting discounts and commissions and estimated offering expenses payable by us. |
| The principal purposes of this offering are to increase our capitalization and financial flexibility, to create a public market for our Class A common stock, and to facilitate our future access to the capital markets. As of the date of this prospectus, we cannot specify with certainty all of the particular uses for the net proceeds we receive from this offering. However, we currently intend to use the net proceeds we receive from this offering for general corporate purposes, including working capital, operating expenses, and capital expenditures. We may also use a portion of the net proceeds we receive from this offering to acquire complementary businesses, products, services, or technologies. However, we do not have agreements or commitments to enter into any acquisitions at this time. |
| See the section titled “Use of Proceeds” for additional information. |
17
Table of Contents
| Directed share program |
At our request, the underwriters have reserved up to shares of Class A common stock, or % of the shares offered by this prospectus, for sale at the initial public offering price, to our directors, certain of our customers and partners, and the friends and family members of certain of our employees, directors, customers, and partners. Shares purchased through the directed share program will not be subject to a lock-up restriction, except in the case of shares purchased by any of our directors or officers and certain of our employees and existing equity holders. The number of shares of Class A common stock available for sale to the general public will be reduced to the extent these individuals purchase such reserved shares. Any reserved shares not so purchased will be offered by the underwriters to the general public as the same basis as the other shares of Class A common stock offered by this prospectus. See the section titled “Underwriting—Directed Share Program” for additional information. |
| Voting rights |
We will have two classes of common stock: Class A common stock and Class B common stock. Class A common stock is entitled to one vote per share and Class B common stock is entitled to ten votes per share. Holders of Class A common stock and Class B common stock will generally vote together as a single class, unless otherwise required by law or our amended and restated certificate of incorporation that will be in effect in connection with the closing of this offering. Once this offering is completed, based on the number of shares outstanding as of December 31, 2020, the holders of our outstanding Class B common stock will own approximately % of our outstanding shares and control approximately % of the voting power of our outstanding shares, and our executive officers, directors, and stockholders holding more than 5% of our outstanding shares, together with their affiliates, will beneficially own, in the aggregate, approximately % of our outstanding shares and control approximately % of the voting power of our outstanding shares. The holders of our outstanding Class B common stock will have the ability to control the outcome of matters submitted to our stockholders for approval, including the election of directors and the approval of any change in control transaction. See the section titled “Principal Stockholders” and “Description of Capital Stock” for additional information. |
| Risk factors |
You should carefully read the section titled “Risk Factors” beginning on page 23 and the other information included in this prospectus for a discussion of facts that you should consider before deciding to invest in shares of our Class A common stock. |
| Proposed NYSE trading symbol |
“OLO” |
18
Table of Contents
The number of shares of Class A common stock and Class B common stock that will be outstanding after this offering is based on no shares of Class A common stock and 7,210,075 shares of Class B common stock outstanding as of December 31, 2020, and excludes:
| ● | 482,079 shares and 1,821,535 shares of Class B common stock issuable upon the exercise of stock options outstanding as of December 31, 2020 under our 2005 Equity Incentive Plan, or 2005 Plan, and our 2015 Equity Incentive Plan, or 2015 Plan, respectively, with a weighted-average exercise price of $2.69 per share and $40.75 per share, respectively; |
| ● | 386,940 shares of Class B common stock issuable upon the exercise of outstanding stock options issued after December 31, 2020 pursuant to our 2015 Plan, with a weighted-average exercise price of $165.32 per share; |
| ● | 8,920 shares of Class B common stock issuable upon the exercise of a warrant to purchase preferred stock, which will become a warrant to purchase shares of Class B common stock upon the closing of this offering, at an exercise price of $2.80 per share; |
| ● | 96,853 shares of Class B common stock issuable upon the exercise of outstanding stock appreciation rights issued pursuant to our 2015 Plan which will become vested upon the completion of this offering; |
| ● | shares of Class A common stock reserved for future issuance under our 2021 Equity Incentive Plan, or 2021 Plan, which will become effective in connection with this offering, as well as any future increases, including annual automatic evergreen increases, in the number of shares of Class A common stock reserved for issuance thereunder, and any shares underlying outstanding stock awards granted under our 2005 Plan or our 2015 Plan that expire or are repurchased, forfeited, cancelled or withheld, as more fully described in the section titled “Executive Compensation—Equity Incentive Plans”; |
| ● | shares of Class A common stock reserved for issuance under our 2021 Employee Stock Purchase Plan, or ESPP, as well as any future increases, including annual automatic evergreen increases, in the number of shares of Class A common stock reserved for future issuance under our ESPP; and |
| ● | shares of our Class A common stock that we plan to donate to a donor-advised fund after the completion of this offering, as more fully described in “Business—Social Responsibility and Community Initiatives.” |
In addition, unless we specifically state otherwise, the information in this prospectus assumes:
| ● |
a for stock split of our Class B common stock to be effected prior to the completion of this offering; |
| ● | the filing of our amended and restated certificate of incorporation, which will occur immediately prior to the completion of this offering; |
| ● | the automatic conversion of all outstanding shares of redeemable convertible preferred stock outstanding as of December 31, 2020 into an aggregate of 5,794,996 shares of Class B common stock, which will occur immediately prior to the completion of this offering; |
19
Table of Contents
| ● | the reclassification of all outstanding shares of our common stock into an equivalent number of shares of our Class B common stock, which will occur immediately prior to the completion of this offering; |
| ● | the exercise of warrants to purchase 90,071 shares of preferred stock; |
| ● | no exercise of the underwriters’ option to purchase additional shares of Class A common stock in this offering; and |
| ● | no exercise of the outstanding stock options or warrants to purchase 8,920 shares of preferred stock described above. |
20
Table of Contents
SUMMARY FINANCIAL DATA
The summary statement of operations data for the years ended December 31, 2018, December 31, 2019, and December 31, 2020 and the summary balance sheet data as of December 31, 2020 have been derived from our audited financial statements included elsewhere in this prospectus. You should read the financial data set forth below in conjunction with our financial statements and the accompanying notes and the information in the section titled “Management’s Discussion and Analysis of Financial Condition and Results of Operations” contained elsewhere in this prospectus. Our historical results are not necessarily indicative of the results to be expected for any period in the future.
| Year Ended December 31, | ||||||||||||
| 2018 | 2019 | 2020 | ||||||||||
| (in thousands) | ||||||||||||
| Revenue: |
||||||||||||
| Platform |
$ | 28,319 | $ | 45,121 | $ | 92,764 | ||||||
| Professional services and other |
3,480 | 5,570 | 5,660 | |||||||||
|
|
|
|
|
|
|
|||||||
| Total revenue |
31,799 | 50,691 | 98,424 | |||||||||
| Cost of revenues: |
||||||||||||
| Platform(1) |
8,722 | 11,920 | 14,334 | |||||||||
| Professional services and other(1) |
2,095 | 3,666 | 4,334 | |||||||||
|
|
|
|
|
|
|
|||||||
| Total cost of revenue |
10,817 | 15,586 | 18,668 | |||||||||
|
|
|
|
|
|
|
|||||||
| Gross profit |
20,982 | 35,105 | 79,756 | |||||||||
| Operating expenses: |
||||||||||||
| Research and development(1) |
17,123 | 21,687 | 32,907 | |||||||||
| General and administrative(1) |
8,341 | 12,157 | 22,209 | |||||||||
| Sales and marketing(1) |
4,299 | 6,351 | 8,545 | |||||||||
|
|
|
|
|
|
|
|||||||
| Total operating expenses |
29,763 | 40,195 | 63,661 | |||||||||
|
|
|
|
|
|
|
|||||||
| Income (loss) from operations |
(8,781 | ) | (5,090 | ) | 16,095 | |||||||
| Other income (expenses): |
||||||||||||
| Interest expense |
(173 | ) | (219 | ) | (157 | ) | ||||||
| Other income, net |
100 | 36 | 28 | |||||||||
| Change in fair value of warrant liability |
(2,681 | ) | (2,959 | ) | (12,714 | ) | ||||||
|
|
|
|
|
|
|
|||||||
| Total other expenses |
(2,754 | ) | (3,142 | ) | (12,843 | ) | ||||||
|
|
|
|
|
|
|
|||||||
| Income (loss) before income taxes |
(11,535 | ) | (8,232 | ) | 3,252 | |||||||
| Provision for income taxes |
17 | 26 | 189 | |||||||||
|
|
|
|
|
|
|
|||||||
| Net income (loss) and comprehensive income (loss) |
$ | (11,552 | ) | $(8,258) | $3,063 | |||||||
|
|
|
|
|
|
|
|||||||
| Accretion of redeemable convertible preferred stock to redemption |
(136 | ) | (136 | ) | (70 | ) | ||||||
| Undeclared 8% non-cumulative dividend on participating securities |
— | — | (2,993 | ) | ||||||||
|
|
|
|
|
|
|
|||||||
| Net income (loss) attributable to common stockholders |
$ | (11,688 | ) | $ | (8,394 | ) | $ | — | ||||
|
|
|
|
|
|
|
|||||||
| Net loss per share attributable to common stockholders, basic and diluted(2) |
$ | (16.62 | ) | (8.18 | ) | — | ||||||
|
|
|
|
|
|
|
|||||||
| Weighted-average shares used in computing net loss per share, basic and diluted(2) |
703,245 | 1,026,248 | 1,181,314 | |||||||||
|
|
|
|
|
|
|
|||||||
| Pro forma earnings per share attributable to common stockholders, basic and diluted(2) |
$ | |||||||||||
|
|
|
|||||||||||
21
Table of Contents
| (1) | Includes stock-based compensation expense as follows: |
| Year Ended December 31, | ||||||||||||
| 2018 | 2019 | 2020 | ||||||||||
| (in thousands) | ||||||||||||
| Cost of revenue—platform |
$ | 410 | $ | 253 | $ | 556 | ||||||
| Cost of revenue—professional services and other |
34 | 46 | 124 | |||||||||
| Research and development |
1,409 | 814 | 1,497 | |||||||||
| General and administrative |
1,928 | 3,493 | 2,827 | |||||||||
| Sales and marketing |
415 | 220 | 376 | |||||||||
|
|
|
|
|
|
|
|||||||
| Total stock-based compensation expense |
$ | 4,196 | $ | 4,826 | $ | 5,380 | ||||||
|
|
|
|
|
|
|
|||||||
| (2) | See Note 13 to our financial statements included elsewhere in this prospectus for an explanation of the calculations of our basic and diluted earnings per share attributable to common stockholders, pro forma earnings per share attributable to common stockholders and the weighted-average number of shares used in the computation of the per share amounts. |
| As of December 31, 2020 | ||||||||||||
| Actual | Pro Forma(1) | Pro Forma As Adjusted(2)(3) |
||||||||||
| (in thousands) | ||||||||||||
| Balance Sheet Data: |
||||||||||||
| Cash and cash equivalents |
$ | 75,756 | $ | $ | ||||||||
| Total assets |
134,424 | |||||||||||
| Working capital(4) |
53,242 | |||||||||||
| Redeemable convertible preferred stock warrant liability |
111,737 | |||||||||||
| Total stockholders’ (deficit) equity |
52,481 | |||||||||||
| (1) | The pro forma balance sheet data gives effect to (a) the reclassification of all outstanding shares of our common stock into an equivalent number of shares of our Class B common stock, which will occur immediately prior to the completion of this offering, (b) the automatic conversion of all outstanding shares of redeemable convertible preferred stock into an aggregate of 5,230,827 shares of Class B common stock, (c) the reclassification of our redeemable convertible preferred stock warrant liability to additional paid-in capital in connection with this offering with respect warrants to purchase 98,991 shares of our outstanding redeemable convertible preferred stock, 90,071 will be exercised in connection with this offering and 8,920 will remain outstanding and convert into warrants to purchase our Class B common stock, and (d) the filing and effectiveness of our amended and restated certificate of incorporation, each of which will occur immediately prior to the completion of this offering. |
| (2) | The pro forma as adjusted balance sheet data gives effect to (a) the items described in footnote (1) above and (b) our receipt of estimated net proceeds from the sale of shares of Class A common stock that we are offering at an assumed initial public offering price of $ per share, the midpoint of the estimated price range set forth on the cover page of this prospectus, after deducting the estimated underwriting discounts and commissions and estimated offering expenses payable by us. |
| (3) | A $1.00 increase (decrease) in the assumed initial public offering price of $ per share, the midpoint of the estimated price range set forth on the cover page of this prospectus, would increase (decrease) each of cash and cash equivalents, total assets, working capital and total stockholders’ (deficit) equity by $ million, assuming that the number of shares of Class A common stock offered by us, as set forth on the cover page of this prospectus, remains the same, and after deducting the estimated underwriting discounts and commissions. Similarly, each increase (decrease) of 1,000,000 shares in the number of shares of Class A common stock offered by us would increase (decrease) each of cash and cash equivalents, total assets, working capital and total stockholders’ (deficit) equity by $ million, assuming the assumed initial public offering price of $ per share of Class A common stock remains the same, and after deducting the estimated underwriting discounts and commissions. |
| (4) | Working capital is defined as current assets less current liabilities. |
22
Table of Contents
Investing in our Class A common stock involves a high degree of risk. You should consider and read carefully all of the risks and uncertainties described below, as well as other information included in this prospectus, including our financial statements and related notes appearing elsewhere in this prospectus, before making an investment decision. The risks described below are not the only ones we face. The occurrence of any of the following risks or additional risks and uncertainties not presently known to us or that we currently believe to be immaterial could materially and adversely affect our business, financial condition, or results of operations. In such case, the trading price of our Class A common stock could decline, and you may lose some or all of your original investment.
Risks Related to Our Business and Industry
Our rapid growth may not be sustainable and depends on our ability to attract new customers, retain revenue from existing customers, and increase sales to both new and existing customers.
We principally generate revenues through subscription revenue from our Ordering module, transaction fees associated with the use of our Rails and Dispatch modules, and professional service fees from the deployment and integration of our platform. While the number of customers using our platform, the number of modules that each customer uses, and the volume of transactions on our platform have grown rapidly in recent years, there can be no assurance that we will be able to retain these customers or acquire new customers, deploy additional modules to these customers, or that the volume of transactions on our platform will continue to increase. Our costs associated with subscription renewals and additional module deployments are substantially lower than costs associated with generating revenue from new customers. Therefore, if we are unable to retain or increase revenue from existing customers, even if such losses are offset by an increase in new customers or an increase in other revenues, our operating results could be adversely impacted.
We may also fail to attract new customers, increase the volume of transactions on our platform, retain or increase revenue from existing customers, or increase sales of our modules to both new and existing customers as a result of a number of factors, including:
| ● | reductions in our current or potential customers’ spending levels; |
| ● | reduction in the number of transactions using our Ordering, Rails, and Dispatch modules due to the abatement of the effects of COVID-19 or otherwise; |
| ● | competitive factors affecting the software as a service, or SaaS, or restaurant brand software applications markets, including the introduction of competing platforms, discount pricing, and other strategies that may be implemented by our competitors; |
| ● | our ability to execute on our growth strategy and operating plans; |
| ● | a decline in our customers’ level of satisfaction with our platform and customers’ usage of our platform; |
| ● | the difficulty and cost to switch to a competitor may not be significant for many of our customers; |
| ● | changes in our relationships with third parties, including our delivery service provider, or DSP, ordering aggregator, or aggregator, customer loyalty, and payment processor partners; |
| ● | failure to maintain compatibility with third party systems or failure to integrate with new systems; |
| ● | the timeliness and success of new modules we may develop; |
23
Table of Contents
| ● | concerns relating to actual or perceived security breaches; |
| ● | the frequency and severity of any system outages; and |
| ● | technological changes or problems. |
Additionally, we anticipate that our revenue growth rate will decline over time to the extent that the number of customers using our platform increases and we achieve higher market penetration rates. Furthermore, to the extent our market penetration among larger potential customers increases, we may be required to target smaller customers to maintain our revenue growth rates, which could result in lower gross profits. As our growth rate declines, investors’ perception of our business may be adversely affected and the trading price of our Class A common stock could decline as a result. To the extent our growth rate slows, our business performance will become increasingly dependent on our ability to retain revenue from existing customers and increase sales to existing customers.
The COVID-19 pandemic could materially adversely affect our business, financial condition, and results of operations.
The COVID-19 pandemic, the measures attempting to contain and mitigate the effects of the COVID-19 pandemic, including stay-at-home, business closures, indoor dining restrictions, and other restrictive orders, and the resulting changes in consumer behaviors, have disrupted the restaurant industry, our normal operations and impacted our employees, partners, and customers. We expect these disruptions and impacts to continue. In response to the COVID-19 pandemic, we have taken a number of actions that have impacted and continue to impact our business, including transitioning employees across our offices (including our corporate headquarters) to remote work-from-home arrangements, potentially cancelling business development events, and imposing travel and related restrictions. Given the continued spread of COVID-19 and the resultant personal, economic, and governmental reactions, we may have to take additional actions in the future that could harm our business, financial condition, and results of operations. We continue to monitor the situation and may adjust our current policies as more information and guidance become available. Once our employees are able to return to our office space, we may experience decreased workforce productivity and disruptions if employees return on a staggered basis. Suspending travel and doing business remotely on a long-term basis could negatively impact our marketing efforts, our ability to enter into customer contracts in a timely manner, our international expansion efforts, and our ability to recruit employees across the organization. These changes could negatively impact our sales and marketing in particular, which could create operational or other challenges as our workforce remains predominantly remote. In addition, our management team has spent, and will likely continue to spend, significant time, attention, and resources monitoring the COVID-19 pandemic and associated global economic uncertainty and seeking to manage its effects on our business and workforce.
With the onset of COVID-19, we began to see an increase in transaction volumes as consumers turned to online ordering as compared to in-person dining. This shift began at end of the first quarter of 2020 and continued through the balance of 2020. We also experienced an increase in our penetration of our Rails and Dispatch modules, as evidenced by an increase from 44% in 2019 to 71% in 2020 of our customers using all three of our modules. The combination of increased transaction volumes and increased multi-module adoption resulted in an increase in transaction revenue as a percentage of platform revenue. For the years ended December 31, 2018, 2019, and 2020, 93.2%, 80.8%, and 56.7% of our platform revenue was subscription revenue, respectively, and 6.8%, 19.2%, and 43.3% was transaction revenue, respectively. While we have benefited from the acceleration of demand for off-premise dining, our business and financial results could be materially adversely affected in the future if these trends do not continue. For example, as the effects of shelter-in-place orders abate with the roll-out of vaccines in the United States and consumers potentially return to pre-COVID digital ordering preferences and habits, the trends we experienced in 2020 on multi-module adoption and transaction volume may not continue and our revenue may fluctuate in the near term.
24
Table of Contents
The degree to which COVID-19 will affect our business and results of operations will depend on future developments that are highly uncertain and cannot currently be predicted. These development include but are not limited to the duration, extent, and severity of the COVID-19 pandemic, actions taken to contain the COVID-19 pandemic, including restrictions on indoor dining that could impact our customers, the impact of the COVID-19 pandemic and related restrictions on economic activity and domestic and international trade, and the extent of the impact of these and other factors on our employees, partners, vendors, and customers. The COVID-19 pandemic and related restrictions could limit our customers’ ability to continue to operate, serve customers, or make timely payments to us. It could disrupt or delay the ability of employees to work because they become sick or are required to care for those who become sick, or for dependents for whom external care is not available. It could cause delays or disruptions in services provided by key suppliers and vendors, increase vulnerability of us and our partners and service providers to security breaches, denial of service attacks or other hacking or phishing attacks, or cause other unpredictable effects. It could also result in declines in order volume as consumers potentially return to pre-COVID digital ordering preferences and habits.
The COVID-19 pandemic also has caused heightened uncertainty in the global economy. If economic conditions further deteriorate, consumers may not have the financial means to make purchases from our customers and may delay or reduce discretionary purchases, negatively impacting our customers and our results of operations. Uncertainty from the pandemic may cause prospective or existing customers to defer purchasing decisions in anticipation of new modules or enhancements by us or our competitors. Our small and medium business, or SMB, brands may be more susceptible to general economic conditions than our enterprise brands, which may have greater liquidity and access to capital. Uncertain and adverse economic conditions also may lead to increased refunds and chargebacks, reduced demand for our platform, lengthening of sales cycles, loss of customers, and difficulty in collections. Since the impact of COVID-19 is ongoing, the effect of the COVID-19 pandemic and the related impact on the global economy may not be fully reflected in our results of operations until future periods. Volatility in the capital markets has been heightened during recent months and such volatility may continue, which may cause declines in the price of our Class A common stock.
Further, to the extent there is a sustained general economic downturn and our solutions are perceived by customers and potential customers as costly, or too difficult to deploy or migrate to, our revenue may be disproportionately affected by delays or reductions in on-demand commerce spending. Competitors may respond to market conditions by lowering prices and attempting to lure away our customers. In addition, the increased pace of consolidation in the restaurant industry and the loss of partners that may have gone out of business or may have merged with other of our partners, may result in reduced overall spending on our platform. We cannot predict the timing, strength, or duration of any economic slowdown, instability, or recovery, generally or within the restaurant industry. If the economic conditions of the general economy or markets in which we operate worsen from present levels, our business, results of operations, and financial condition could be materially and adversely affected.
Our limited operating history with our new modules in a new and developing market makes it difficult to evaluate our current business and future prospects, and may increase the risk that we will not be successful.
In 2015 and 2017, we launched our Dispatch and Rails modules, respectively, and in 2016 we began to offer a transactional-based pricing model for our Ordering module. While the recent introduction of these new offerings and this new pricing model have contributed significantly to our recent growth in revenue, we have little experience with these new modules and pricing model, which makes it difficult to accurately assess our future prospects. You should consider our future prospects in light of the challenges and uncertainties that we face, including:
| ● | the fact that our business has grown rapidly and it may not be possible to fully discern the trends that we are subject to; |
25
Table of Contents
| ● | that we operate in a new and developing market with a rapidly changing competitive landscape; |
| ● | that we may be unable to accurately predict our revenue and operating expenses for new modules that we release; |
| ● | our ability to enhance or retain our brand among customers and potential customers; |
| ● | that we may in the future enter into additional new and developing markets that may not develop as we expect or that our platform or modules may not adequately address; and |
| ● | that elements of our business strategy are new and subject to ongoing development. |
We have encountered and will continue to encounter risks and difficulties frequently experienced by growing companies in rapidly changing industries, including increasing and unforeseen expenses as we continue to grow our business. If our assumptions regarding these risks and uncertainties, which we use to plan and operate our business, are incorrect or change, or if we do not manage these risks successfully, our reputation, business, results of operations, and prospects will be harmed.
Our business could be harmed if we fail to manage our growth effectively.
The rapid growth we have experienced in our business places significant demands on our operational infrastructure. The scalability and flexibility of our platform depends on the functionality of our technology and cloud infrastructure and its ability to handle increased traffic and demand. The growth in the number of third-party ecosystem partners, customers using our platform, and the number of orders processed, coordinated, and delivered through our Ordering, Rails, and Dispatch modules has increased the amount of data and requests that we process. Additionally, new modules, solutions, services, and restaurant ecosystem partners that we integrate may significantly increase the load on our technology infrastructure. Any problems with the transmission or storage of increased data and requests could result in harm to our brand or reputation. Moreover, as our business grows, we will need to devote additional resources to improving our operational infrastructure and continuing to enhance its scalability in order to maintain the performance of our platform, including by improving or expanding cloud infrastructure.
This rapid growth has also placed, and will likely continue to place, a significant strain on our managerial, administrative, operational, financial, and other resources. As a result, we intend to increase headcount significantly in the near future to further expand our overall business, with no assurance that our revenues will continue to grow. As we grow, we will be required to continue to improve our operational and financial controls and reporting procedures and we may not be able to do so effectively. In addition, our management team has little experience leading a large, potentially global business operation, so our management may not be able to lead any such growth effectively.
We have a history of losses and we may be unable to achieve or sustain profitability.
We have incurred significant losses since inception. We generated net losses of $11.6 million and $8.3 million for the years ended December 31, 2018 and December 31, 2019, respectively. We generated net income of $3.1 million for the year ended December 31, 2020. As of December 31, 2020, we had an accumulated deficit of $69.3 million. These losses and accumulated deficit are a result of the substantial investments we made to grow our business and we expect to make significant expenditures to expand our business in the future. We anticipate that we will continue to incur losses in the near-term as we increase our operating expenses, including, without limitation, as a result of expected increases in:
| ● | sales and marketing expenses, as we continue to expand our sales efforts and spend on marketing activities; |
| ● | research and development expenses, as we continue to introduce new modules and enhance existing modules to extend the functionality of our platform; |
26
Table of Contents
| ● | expenses related to customer service and support, which is critical to our continued success and ability to maintain a strong reputation for our brand; |
| ● | expenses related to further investments in our network infrastructure in order to support the continued growth of our business and to meet the demands of continuously changing security and operational requirements; and |
| ● | general costs and administrative expenses as a result of our continued growth and the increased costs associated with being a public company. |
These increased expenditures will make it harder for us to achieve or sustain profitability and we cannot predict if we will achieve or sustain profitability in the near term or at all. Historically, our costs have increased each year due to these investments and we expect to continue to incur increasing costs to support our anticipated future growth. In addition, the costs associated with acquiring new customers may materially rise in the future, including if we expand international sales efforts outside of the United States and Canada, increase our efforts to pursue SMB restaurant brands, or increase sales efforts to other verticals. If we are unable to generate adequate revenue growth and manage our expenses, we may continue to incur significant losses and may not achieve or sustain profitability.
We may also make decisions that would reduce our short-term operating results if we believe those decisions will improve the experiences of our customers and consumers and if we believe such decisions will improve our operating results over the long-term. These decisions may not be consistent with the expectations of investors and may not produce the long-term benefits that we expect, in which case our business may be materially harmed.
Our sales cycles can be long and unpredictable, and our sales efforts require considerable investment of time and expense. If our sales cycle lengthens or we invest substantial resources pursuing unsuccessful sales opportunities, our operating results and growth would be harmed.
We have historically incurred significant costs and experienced long sales cycles when selling to customers. In the restaurant brand market segment, the decision to adopt our modules may require the approval of multiple technical and business decision makers, including security, compliance, operations, finance and treasury, marketing, and IT. In addition, while our customers may more quickly deploy our modules on a limited basis, before they will commit to deploying our modules at scale, they often require extensive education about our modules and significant customer support time or pilot programs, engage in protracted pricing negotiations and seek to secure development resources. In addition, sales cycles for our customers in general and larger customers in particular, are inherently complex and unpredictable. These complex and resource intensive sales efforts could place additional strain on our development and engineering resources. Further, even after our customers contract to use our platform, they may require extensive integration or deployment resources from us before they become active customers, which have at times extended to multiple quarterly periods following the execution of the agreement. Because we generally only generate Ordering, Rails, and Dispatch module revenue after our platform is deployed, if we are unable to deploy our platform with our customers in a timely manner, our results of operations and financial condition may be harmed. Finally, our customers may choose to develop their own solutions that do not include any or all of our modules. They also may demand reductions in pricing as their usage of our modules increases, which could have an adverse impact on our gross margin. If we are unable to increase the revenue that we derive from these customers, then our business, results of operations and financial condition may be adversely affected.
27
Table of Contents
We expect fluctuations in our financial results, making it difficult to project future results, and if we fail to meet the expectations of securities analysts or investors with respect to our results of operations, our stock price and the value of your investment could decline.
Our results of operations have fluctuated in the past and are expected to fluctuate in the future due to a variety of factors, many of which are outside of our control. As a result, our past results may not be indicative of our future performance. In addition to the other risks described herein, factors that may affect our results of operations include the following:
| ● | fluctuations in demand for or pricing of our platform, or any of our modules; |
| ● | fluctuations in usage of our platform, or any of our modules, including due to the potential lack of durability of the growth we have experienced in the near term due to COVID-19 and the associated shelter-in-place orders on consumer preferences for digital ordering and customer adoption of multi-modules as COVID-19 associated restrictions abate; |
| ● | our ability to attract new customers; |
| ● | our ability to retain our existing customers; |
| ● | the timing of our customer purchases and deployments; |
| ● | customer expansion rates and the pricing and quantity of subscriptions renewed and transactions processed through our platform; |
| ● | timing and amount of our investments to expand the capacity of our third-party cloud infrastructure providers; |
| ● | the investment in new modules relative to investments in our existing infrastructure and platform; |
| ● | fluctuations or delays in purchasing decisions in anticipation of new modules or enhancements by us or our competitors; |
| ● | changes in customers’ budgets and in the timing of their budget cycles and purchasing decisions; |
| ● | our ability to control costs, including our operating expenses; |
| ● | the amount and timing of payment for operating expenses, particularly research and development and sales and marketing expenses, including sales commissions; |
| ● | the amount and timing of non-cash expenses, including stock-based compensation, goodwill impairments and other non-cash charges; |
| ● | the amount and timing of costs associated with recruiting, training and integrating new employees and retaining and motivating existing employees; |
| ● | the effects of acquisitions and their integration; |
| ● | general economic conditions, both domestically and internationally, as well as economic conditions specifically affecting industries in which our customers participate; |
| ● | health epidemics or pandemics, such as the COVID-19 pandemic; |
| ● | the impact of new accounting pronouncements; |
28
Table of Contents
| ● | changes in regulatory or legal environments that may cause us to incur, among other elements, expenses associated with compliance; |
| ● | changes in the competitive dynamics of our market, including consolidation among competitors, customers, or our partners; and |
| ● | significant security breaches of, technical difficulties with, or interruptions to, the delivery and use of our modules and platform capabilities or third-party applications or point of sale or management systems that our platform integrates with. |
Any of these and other factors, or the cumulative effect of some of these factors, may cause our results of operations to vary significantly. If our quarterly results of operations fall below the expectations of investors and securities analysts who follow our stock, the price of our Class A common stock could decline substantially, and we could face costly lawsuits, including securities class action suits.
Our business depends on customers increasing their use of our platform, and any loss of customers or decline in their use of our platform could materially and adversely affect our business, results of operations, and financial condition.
Our ability to grow and generate incremental revenue depends, in part, on our ability to maintain and grow our relationships with existing customers, to have them increase their deployment and use of our platform and Ordering, Rails, and Dispatch modules, and to increase or maintain transaction volume on our platform. Although our customers generally have multi-year contracts with us, they generally have the right to elect not to renew by providing at least 90 days’ written notice prior to the expiration date of the contract. In addition, if our customers do not increase their use of our platform or adopt and deploy additional modules, or if they reduce the number of locations using our platform, then our revenue may decline and our results of operations may be harmed. Customers may not renew their contracts with us or reduce their use of our platform for any number of reasons, including if they are not satisfied with our platform or modules, the value proposition of our platform or our ability to meet their needs and expectations, security or platform reliability issues, or if they decide to build their own solution internally or if they decide to temporarily or permanently close their restaurants in a location then affected by the COVID-19 pandemic. Additionally, consumers may change their purchasing habits or reduce their orders from our current customers, which could harm their business and reduce their use of our platform. We cannot accurately predict our customers’ usage levels and the loss of customers or reductions in the number of locations that use our platform or their usage levels of our modules may each have a negative impact on our business, results of operations, and financial condition and may cause our expansion rate to decline. If a significant number of customers cease using, or reduce their usage of our platform, then we may be required to spend significantly more on sales and marketing than we currently plan to spend in order to maintain or increase revenue from our customers. Such additional sales and marketing expenditures could adversely affect our business, results of operations, and financial condition.
If we fail to continue to improve and enhance the functionality, performance, reliability, design, security, or scalability of our platform in a manner that responds to our customers’ evolving needs, our business may be adversely affected.
The on-demand commerce and digital ordering markets are characterized by rapid technological change, frequent new product and service introductions, and evolving industry standards. Our success has been based on our ability to identify and anticipate the needs of our customers and design and maintain a platform that provides them with the tools they need to operate their businesses in a manner that is productive and meets or exceeds their expectations. Our ability to attract new
29
Table of Contents
customers, retain revenue from existing customers, and increase sales to both new and existing customers will depend in large part on our ability to continue to improve and enhance the functionality, performance, reliability, design, security, and scalability of our platform. Additionally, to achieve and maintain market acceptance for our platform, we must effectively integrate with new or existing software solutions that meet changing customer demands in a timely manner.
As we expand our platform and services, and as the number of our customers with higher volume sales increases, we expect that we will need to offer increased functionality, scalability and support, including to keep our platform, systems, and services secure, which requires us to devote additional resources to such efforts. To the extent we are not able to enhance our platform’s functionality in order to maintain its utility and security, enhance our platform’s scalability in order to maintain its performance and availability, or improve our support functions in order to meet increased customer service demands, our business, operating results, and financial condition could be adversely affected.
We may experience difficulties with software development that could delay or prevent the development, deployment, introduction, or implementation of new modules and enhancements. Software development involves a significant amount of time, as it can take our developers months to update, code, and test new and upgraded modules, and integrate those modules into our platform. We must also continually update, test, certify, maintain, and enhance our software platform. We may make significant investments in new modules or enhancements that may not achieve expected returns. The continual improvement and enhancement of our platform requires significant investment and we may not have the resources to make such investment. Our improvements and enhancements may not result in our ability to recoup our investments in a timely manner, or at all. The improvement and enhancement of the functionality, performance, reliability, design, security, and scalability of our platform is expensive and complex, and to the extent we are not able to perform it in a manner that responds to our customers’ evolving needs, our business, operating results, and financial condition will be adversely affected.
Our growth depends in part on the success of our strategic relationships with third parties and our ability to integrate with third-party applications and software.
The success of our platform depends, in part, on our ability to integrate third-party applications, software, and other offerings into our platform. We anticipate that the growth of our business will continue to depend on third-party relationships, including relationships with our point of sale, or POS, systems, DSPs, aggregators, digital agencies, payment processors, loyalty providers, and other partners. In addition to growing our third-party partner ecosystem, we have entered into agreements with, and intend to pursue additional relationships with, other third parties, such as search engine and social media, location services, voice ordering, autonomous vehicle, and virtual kitchen providers. Identifying, negotiating, and documenting relationships with third parties and integrating third-party content and technology requires significant time and resources, and third-party providers may choose to terminate their relationship with us, compete directly against us, enter into exclusive arrangements with our competitors, or make material changes to their businesses, solutions, or services that could be detrimental to our business.
Third-party developers may change the features of their offering of applications and software or alter the terms governing the use of their offerings in a manner that is adverse to us. We may also be unable to maintain our relationships with certain third-parties if we are unable to integrate our platform with their offerings. In addition, third-parties may refuse to partner with us or limit or restrict our access to their offerings. We may not be able to adapt to the data transfer requirements of third party offerings. If third-party applications or software change such that we do not, or cannot, maintain the compatibility of our platform with these applications and software, or if we fail to ensure there are
30
Table of Contents
third-party applications and software that our customers desire to add to their ordering or delivery portals, demand for our platform could decline. If we are unable to maintain technical interoperability, our customers may not be able to effectively integrate our platform with other systems and services they use. If we fail to integrate our platform with new third-party offerings that our customers need to operate their businesses, or to provide the proper support or ease of integration our customers require, we may not be able to offer the functionality that our customers and their consumers expect, which would harm our business.
The third party service providers we integrate with may not perform as expected under our agreements or under their agreements with our customers, we or our customers may in the future have disagreements or disputes with such providers, or such providers may experience reduced growth, reduce incentives for our customers’ consumers to make delivery orders or otherwise change their business models in ways that are disadvantageous to us or our customers. For example, if the DSP providers we partner with for our Dispatch module were to increase prices of the delivery to customers, the number of orders made through our platform could be reduced and our business may be harmed. In addition, if our Rails providers were to reduce incentives for consumers to order through those respective aggregators, our revenue and business may be harmed. If we lose access to solutions or services from a particular partner, or experience a significant reduction or disruption in the supply of services from a current partner, it could have an adverse effect on our business and operating results.
Our Dispatch module currently relies on a limited number of DSPs.
The availability of DSPs generally, and of specific DSPs in certain markets, is integral to the value that our Dispatch module provides to our customers and our ability to generate revenue from orders fulfilled through Dispatch. However, the delivery service provider market has not yet fully developed and could be adversely affected by various conditions, including industry consolidation, changes in labor and independent contractor laws and changes in pricing models, the success of competitors or competing solutions for customers, and general economic conditions. In general, there is more than one DSP available to fulfill delivery orders through Dispatch. In certain markets, however, delivery orders are fulfilled by one or a limited number of DSPs, with a subset of such DSPs being responsible for fulfilling a majority of orders in that market. In addition, certain of these DSPs may be, or may be perceived to be, in competition with us with respect to some of our offerings and, as a result, may be less incentivized to continue to partner with us. If one or more DSPs that represents a significant volume of our Dispatch transactions overall, or DSPs that represent a significant volume of our Dispatch transactions in any single market, are no longer able to continue to provide timely and reliable delivery services, or if we or a DSP terminate our partnership, we could experience significant interruptions in the delivery of orders through our Dispatch module, which could have an adverse effect on our business, financial condition, and results of operations.
Our Rails module currently relies on a limited number of aggregators.
Our Rails module integrates with a limited number of digital ordering aggregators to fulfill third-party ordering transactions on our platform. These aggregators could decide to create new software that is incompatible with our platform, enter into exclusive agreements directly with our customers or potential customers, or enter into agreements directly with our competitors or potential future competitors of ours that are exclusive or on terms that are more favorable than those we offer to our customers. Certain of these aggregators may be, or may be perceived to be, in competition with us with respect to some of our offerings and, as a result, may be less incentivized to continue to partner with us. Moreover, recently a number of aggregators have merged, consolidated, or gone out of business, which could reduce the number of aggregators on our Rails module, reduce our revenue and limit the effectiveness of Rails. In the event that any of the largest digital ordering aggregators do not integrate with our platform, or create software that is incompatible or competes with our platform by
31
Table of Contents
directly integrating with one of our customers, our ability to generate transactional revenue using our Rails module will decline, which could harm our business and results of operation. If we or one or more of these aggregators that represents a significant volume of our Rails transactions overall terminate our partnership, it could have an adverse effect on our business, financial condition, and results of operations.
For the years ended December 31, 2018, 2019, and 2020, Rails module transaction revenue from our largest digital ordering aggregator, DoorDash Inc., or DoorDash, accounted for an aggregate of 2.6%, 10.2%, and 19.3% of our total revenue, respectively, and DoorDash accounted for a substantial majority of our transaction revenue from our Rails module during the years ended December 31, 2018, 2019, and 2020.
Our agreement with DoorDash has an initial two-year term, which began on March 30, 2017, with a one-year renewal period, unless either party notifies the other party in writing at least 90 days prior to the renewal term. Either party may terminate the agreement upon material breach of the terms of the agreement by the other party, subject to notice and opportunity to cure. The termination of this agreement would materially and adversely impact our revenue and could impair our profitability.
Security breaches, denial of service attacks, or other hacking and phishing attacks on our systems or the systems with which our platform integrates could harm our reputation or subject us to significant liability, and adversely affect our business and financial results.
We operate in the on-demand commerce industry, which is prone to cyber-attacks. In our operation as a private company, our board of directors reviews cybersecurity risks brought to its attention by members of senior management who report up to our board of directors. We have an established in-house security team which is responsible for reviewing and overseeing our cybersecurity program and bringing any cybersecurity risks to the attention of the board of directors and the audit committee at regular meetings of the audit committee. Failure to prevent or mitigate security breaches and improper access to or disclosure of our data, our customers’ data, or their consumers’ data, could result in the loss or misuse of such data, which could harm our business and reputation. The security measures we have integrated into our systems and processes, which are designed to prevent or minimize security breaches, may not function as expected or may not be sufficient to protect our internal networks and platform against attacks. Further, our platform also integrates with third-party applications and POS and management systems over which we exercise no control. Such third-party applications and POS and management systems are also susceptible to security breaches, which could directly or indirectly result in a breach of our platform. The failure of a customer’s third-party front-end provider to adequately protect their systems could result in an attack that we are unable to prevent from the back-end, which could result in a service outage for all customers, and may require us to take the affected customer offline to restore service to the platform for other customers. In addition, techniques used to sabotage or to obtain unauthorized access to data change frequently. As a result, we may be unable to anticipate these techniques or implement adequate measures to prevent an intrusion into our networks directly, or into our platform through the third-party applications or POS and management systems with which our platform integrates. Our exposure to security breaches may be heightened because our platform is accessible through hundreds of our customers’ white label domains and mobile applications.
Our storage and use of our customers’ data concerning their restaurants and consumers is essential to their use of our platform, which stores, transmits and processes our customers’ proprietary information and information relating to them and consumers. If a security breach were to occur, as a result of third-party action, employee error, malfeasance, or otherwise, and the confidentiality, integrity or availability of our customers’ data was disrupted, we could incur significant liability to our customers and their consumers, and our platform may be perceived as less desirable, which could negatively
32
Table of Contents
affect our business and damage our reputation. In addition, any loss of customer or individual consumer data could create significant monetary damages for us that may harm our ability to operate the business.
A security vulnerability in our platform or point of sale integration software could compromise our customers’ in-store networks, which could expose customer or consumer information beyond what we collect through our platform. As a multitenant SaaS provider, despite our logical separation of data between customers, we may face an increased risk of accidentally commingling data between customers due to employee error, a software bug, or otherwise, which may result in unauthorized disclosure of data between customers. We may in the future be subject to distributed denial of service, or DDoS, attacks, a technique used by hackers to take an internet service offline by overloading its servers. A DDoS attack could delay or interrupt service to our customers and their consumers and may deter consumers from ordering or engaging with our customers’ restaurants. Our platform and third-party applications may also be subject to DDoS attacks in the future and we cannot guarantee that applicable recovery systems, security protocols, network protection mechanisms and other procedures are or will be adequate to prevent network and service interruption, system failure, or data loss. In addition, computer malware, viruses, hacking, credential stuffing, social engineering, phishing, physical theft, and other attacks by third parties are prevalent in our industry. We may experience such attacks in the future and, as a result of our increased visibility, we believe that we are increasingly a target for such breaches and attacks.
Moreover, our platform and third-party applications, services, or POS and management systems integrated with our platform could be breached if vulnerabilities in our platform or third-party applications or POS and management systems are exploited by unauthorized third parties or due to employee error, malfeasance, or otherwise. Further, third parties may attempt to fraudulently induce employees or customers into disclosing sensitive information such as user names, passwords, or other information or otherwise compromise the security of our internal networks, electronic systems and/or physical facilities in order to gain access to our data or our customers’ data. Because techniques used to obtain unauthorized access change frequently and the size and severity of DDoS attacks and security breaches are increasing, we may be unable to implement adequate preventative measures or stop DDoS attacks or security breaches while they are occurring. In addition to our own platform and applications, some of the third parties we work with may receive information provided by us, by our customers, or by our customers’ consumers through web or mobile applications integrated with our platform. If these third parties fail to adhere to adequate data security practices, or in the event of a breach of their networks, our own and our customers’ data may be improperly accessed, used, or disclosed.
Any actual or perceived DDoS attack or security breach of our platform, systems, and networks could damage our reputation and brand, expose us to a risk of litigation and possible liability and require us to expend significant capital and other resources to respond to and alleviate problems caused by the DDoS attack or security breach. Our ability to retain adequate cyber-crime and liability insurance may be reduced. Some jurisdictions have enacted laws requiring companies to notify individuals of data security breaches involving certain types of personal data and our agreements with certain customers and partners require us to notify them in the event of a security incident. Such mandatory disclosures are costly, could lead to negative publicity, and may cause our customers to lose confidence in the effectiveness of our data security measures. Moreover, if a high-profile security breach occurs with respect to another SaaS provider or one of the service providers we partner with, customers may lose trust in the security of the SaaS business model generally, which could adversely impact our ability to retain revenue from existing customers or attract new ones. Any of these events could harm our reputation or subject us to significant liability, and materially and adversely affect our business and financial results.
33
Table of Contents
If our software or APIs contain serious errors or defects, we may lose revenue and market acceptance and may incur costs to defend or settle claims with our customers.
Software or APIs such as ours may contain errors, defects, security vulnerabilities, or software bugs that are difficult to detect or correct, particularly when first introduced or when new versions or enhancements are released. Despite internal testing, our platform may contain serious errors or defects, security vulnerabilities, or software bugs that we may be unable to successfully correct in a timely manner or at all, which could result in lost revenue, significant expenditures of capital, a delay or loss in market acceptance, and damage to our reputation and brand, any of which could have an adverse effect on our business and results of operations. For example, our payment processing code may contain a software bug or other misconfiguration, resulting in failure to collect payment for orders that are otherwise fulfilled, which could result in significant refunds owed to our customers. A software or API bug could also result in a customer receiving an item other than what they ordered or an ingredient to which they are allergic, causing reputational harm to us. In addition, our tax calculation code may also contain errors or defects, which may result in differences payable by us or fines owed by us, or our fraud detection software could identify false positives in the system, and in turn could reduce transactional revenue. Furthermore, our platform allows us to deploy new versions and enhancements to all of our customers simultaneously. To the extent we deploy new versions or enhancements that contain errors, defects, security vulnerabilities, or software bugs to all of our customers simultaneously, the consequences would be more severe than if such versions or enhancements were only deployed to a smaller number of our customers.
Because our customers use our platform for processes that are critical to their businesses, errors, defects, security vulnerabilities, service interruptions, or software bugs in our platform and APIs could result in losses to our customers. Although we endeavor to limit our liability in customer agreements, our customers may be entitled to significant compensation from us in the form of service level credits or to pursue litigation against us for any losses they suffer or cease conducting business with us altogether. Further, a customer could share information about bad experiences on social media, at industry conferences, or with peer companies, which could result in damage to our reputation and loss of future sales. There can be no assurance that provisions typically included in our agreements with our customers that attempt to limit our exposure to claims against us would be enforceable or adequate or would otherwise protect us from liabilities or damages with respect to any particular claim. Even if not successful, a claim brought against us by any of our customers would likely be time-consuming and distracting to our management team and costly to defend, and such a claim could seriously damage our reputation and brand, making it harder for us to sell our modules.
We and certain of our third-party partners, service providers, and subprocessors transmit and store personal information of our customers and consumers. If the security of this information is compromised or is otherwise accessed without authorization, our reputation may be harmed and we may be exposed to liability and loss of business.
We transmit and store personal information and other confidential information of our partners, our customers, and consumers. Third-party applications integrated with our platform may also handle or store personal information, credit card information, including cardholder data and sensitive authentication data, or other confidential information. We do not proactively monitor the content that our customers upload and store, or the information provided to us through the applications integrated with our platform, and, therefore, we do not control the substance of the content on our servers, which may include personal information. Additionally, we use dozens of third-party service providers and subprocessors to help us deliver services to customers and consumers. These service providers and subprocessors may handle or store personal information, credit card information, or other confidential information. There may in the future be successful attempts by third parties to obtain unauthorized access to the personal information of our partners, our customers, and consumers. This information
34
Table of Contents
could also be otherwise exposed through human error, malfeasance, or otherwise. The unauthorized release, unauthorized access, or compromise of this information could have an adverse effect on our business, financial condition, and results of operations. Even if such a data breach did not arise out of our actions or inactions, or if it were to affect one or more of our competitors or our customers’ competitors, the resulting consumer concern could negatively affect our customers and our business.
We integrate with a number of third-party service providers in order to meet our customers’ needs, and although we contractually require our customers to ensure the security of such service providers, a security breach of one of these providers could become negatively associated with our brand, or our assistance in responding to such a breach could tie up our internal resources. By the nature of the integrations, we could also get directly drawn into any resulting lawsuits. We are also subject to federal, state, and provincial laws regarding cybersecurity and the protection of data. Some jurisdictions have enacted laws requiring companies to notify individuals of security breaches involving certain types of personal information and our agreements with customers and partners require us to notify them in the event of certain security incidents. Additionally, some jurisdictions, as well as our contracts with certain customers, require us to use industry-standard or reasonable measures to safeguard personal information or confidential information. As cardholder data and sensitive authentication data is transmitted through our platform, we may be required by card networks and our contracts with payment processors to adhere to the Payment Card Industry Data Security Standards, or PCI-DSS.
Our failure to comply with legal, regulatory or contractual requirements, and the rules of payment card networks and self-regulatory organizations, including PCI-DSS, around the security of personal information, cardholder data, or sensitive authentication data, could lead to significant fines and penalties imposed by regulators and card networks, as well as claims by our customers, consumers, or other relevant stakeholders. These proceedings or violations could force us to spend money in defense or settlement of these proceedings, result in the imposition of monetary liability or injunctive relief, divert management’s time and attention, increase our costs of doing business, and materially adversely affect our reputation and the demand for our platform. In addition, if our security measures fail to protect credit card information adequately, we could be liable to our partners, our customers and, consumers for their losses. As a result, we could be subject to fines, we could face regulatory or other legal action, and our customers could end their relationships with us. There can be no assurance that the limitations of liability in our contracts would be enforceable or adequate or would otherwise protect us from any such liabilities or damages with respect to any particular claim. We also cannot be sure that our existing insurance coverage and coverage for errors and omissions will continue to be available on acceptable terms or will be available in sufficient amounts to cover one or more large claims, or that our insurers will not deny coverage as to any future claim. The successful assertion of one or more large claims against us that exceeds our available insurance coverage, or changes in our insurance policies, including premium increases, or the imposition of large deductible or co-insurance requirements, could have an adverse effect on our business and results of operations.
We are subject to stringent and changing privacy laws, regulations and standards, and contractual obligations related to data privacy and security. Our actual or perceived failure to comply with such obligations could harm our reputation, subject us to significant fines and liability, or adversely affect our business.
The regulatory framework for privacy and security issues in the United States is rapidly evolving. Laws in all 50 states require us to provide notice to customers when certain sensitive personal information has been disclosed as a result of a data breach. These laws are frequently inconsistent, and compliance in the event of a widespread data breach is costly. Moreover, states regularly enact new laws and regulations, which require us to provide consumers with certain disclosures related to our privacy practices, as well as maintain systems necessary to allow customers
35
Table of Contents
to invoke their rights. For example, on January 1, 2020, California adopted the California Consumer Privacy Act of 2018, or CCPA, which provides new data privacy rights for consumers and new operational requirements for covered businesses. The CCPA gives California residents more control over their personal information and includes a statutory damages framework and private right of action imposing civil penalties against businesses that fail to comply with certain security practices. Although the CCPA’s implementation standards and enforcement practices are likely to remain uncertain for the foreseeable future, the CCPA may increase our compliance costs and exposure to liability. More so, additional states that adopt privacy laws that differ from the CCPA may require us to do unanticipated and unbudgeted work in order to comply with additional privacy and data security requirements. The costs associated with compliance may impede our development and could limit the adoption of our services. Finally, any failure by our vendors to comply with applicable law or regulations could result in proceedings against us by governmental entities or others.
Additionally, virtually every foreign jurisdiction in which our current or potential future customers may operate has established privacy and data security laws, rules, and regulations. The European Union, or EU, has adopted the General Data Protection Regulation, or GDPR, which went into effect on May 25, 2018. Among other requirements, the GDPR regulates transfers of personally identifiable information from the EU to non-EU countries, such as the United States. Under the GDPR, fines of up to €20 million or up to 4% of the annual global revenue of the noncompliant company, whichever is greater, could be imposed for violations of certain GDPR requirements. Moreover, individuals can claim damages as a result of GDPR violations. Other jurisdictions outside the EU are similarly introducing or enhancing privacy and data security laws, rules, and regulations, which may increase the risks associated with non-compliance.
Certain current or potential future customers are subject to the GDPR and we may be required to assist such customers with their compliance obligations. While we are not currently subject to the GDPR ourselves, many of our customers are subject to the GDPR. We may be required to expend resources to assist our customers with such compliance obligations. Assisting our customers in complying with the GDPR or complying with the GDPR ourselves if we expand our business to the EU in the future may cause us to incur substantial operational costs or require us to change our business practices to maintain such information in the European Economic Area.
We publish privacy policies, self-certifications, such as the EU-US Privacy Shield, and other documentation regarding our collection, processing, use and disclosure of personal information, credit card information, and other confidential information. Recently the ES-US Privacy Shield was declared insufficient by the Court of Justice of the European Union and the EU-US Privacy Shield is no longer a valid mechanism to comply with EU data protection requirements relating to data transfers. We do not know when, or if, the EU-US Privacy Shield will become an effective mechanism for data transfers. Although we endeavor to comply with our published policies, certifications, and documentation, we may at times fail to do so or may be perceived to have failed to do so. Such failures can subject us to potential international, local, state, and federal action if they are found to be deceptive, unfair, or misrepresentative of our actual practices, resulting in reputational or financial harm to the company. Globally, there have been numerous lawsuits brought against technology companies related to their privacy and data security practices. If those lawsuits are successful, it could increase the risk that we may be exposed to liability for similar practices. Furthermore, if customer concerns regarding data security increase, customers may be hesitant to provide us with the data necessary to provide our service effectively. This could generally limit the adoption of our product and the growth of our company.
36
Table of Contents
Payment transactions processed on our platform may subject us to regulatory requirements and the rules of payment card networks, and other risks that could be costly and difficult to comply with or that could harm our business.
The payment card networks require us to comply with payment card network operating rules, including special operating rules that apply to us as a “payment service provider” that provides payment processing-related services to merchants and payment processors. The payment card networks set these network rules and have discretion to interpret them and change them. We are also required by our payment processors to comply with payment card network operating rules and we have agreed to reimburse our payment processors for any fines they are assessed by payment card networks as a result of any rule violations by us or our customers. Any changes to or interpretations of the network rules that are inconsistent with the way we and the payment processors and merchants currently operate may require us to make changes to our business that could be costly or difficult to implement. If we fail to make such changes or otherwise resolve the issue with the payment card networks, the networks could fine us, cancel or suspend our registration as a payment service provider, or prohibit us from processing payment cards, which would have an adverse effect on our business, financial condition, and operating results. In addition, violations of the network rules or any failure to maintain good standing with the payment card networks as a payment service provider could impact our ability to facilitate payment card transactions on our platform, increase our costs, or could otherwise harm our business. If we were unable to facilitate payment card transactions on our platform, or were limited in our ability to do so, our business would be materially and adversely affected.
If we fail to comply with the rules and regulations adopted by the payment card networks, we would be in breach of our contractual obligations to our payment processors, financial institutions, or partners. Such failure to comply may subject us to fines, penalties, damages, higher transaction fees and civil liability, and could eventually prevent us from processing or accepting payment cards or could lead to a loss of payment processor partners, even if there is no compromise of customer or consumer information. In the event that we are found to be in violation of any of these legal or regulatory requirements, our business, financial condition, and results of operations could be harmed.
We believe the licensing requirements of the Financial Crimes Enforcement Network and state agencies that regulate banks, money service businesses, money transmitters, and other providers of electronic commerce services do not apply to us. One or more governmental agencies may conclude that, under its statutes or regulations, we are engaged in activity requiring licensing or registration. In that event, we may be subject to monetary penalties, adverse publicity, and may be required to cease doing business with residents of those states until we obtain the requisite license or registration.
We currently generate significant revenue from our largest restaurant customers, and the loss or decline in revenue from any of these customers could harm our business, results of operations, and financial condition.
For the years ended December 31, 2018, 2019, and 2020, our 10 largest restaurant customers generated an aggregate of approximately 35%, 30%, and 21% of our revenue, respectively. Although these customers enter into long-term contracts with us, they may reduce or terminate their usage of our platform or decide not to renew their agreements with us.
We have in the past, and we may in the future, lose one or more of our largest restaurant customers. While no such losses have been material to date, in the event that any other of our largest restaurant customers do not continue to use our platform, use fewer of our modules, use our modules in a more limited capacity, or not at all, or if the volume of transactions processed on our platform declines, our business, results of operations, and financial condition could be adversely affected in the future.
37
Table of Contents
Our business is highly competitive. We may not be able to compete successfully against current and future competitors.
We face competition in various aspects of our business and we expect such competition to intensify in the future, as existing and new competitors, including some of our current ecosystem partners, introduce new solutions or enhance existing solutions that are directly competitive with our modules. Our platform combines functionality from numerous product categories, and we may compete against providers in each of these categories including white-label digital ordering solution providers, restaurant-focused POS platforms, aggregators that provide direct digital ordering solutions, and custom software providers. Our potential new or existing competitors may be able to develop solutions that are better received by customers or may be able to respond more quickly and effectively than we can to new or changing opportunities, technologies, regulations, or customer requirements. Some ordering aggregators sell solutions that are competitive with our core platform and they may become more aggressive in their sales tactics, including by bundling competitive solutions with their delivery or aggregator products. If competitors, many of which are much better capitalized than we are, are successful in providing our customers with a more attractive solution or pricing, our business and results of operation may be harmed.
Competition may intensify as current or future competitors enter into business combinations or alliances or raise additional capital, or as established companies in other market segments or geographic markets expand into our market segments or geographic markets. For instance, current or future competitors could use strong or dominant positions in one or more markets to gain a competitive advantage against us in areas where we operate including by integrating additional or competing platforms or features into solutions they control, such as additional payment, rewards, or delivery platforms or features. In addition, certain customers may choose to partner with our competitors in a specific geographic market, or choose to engage exclusively with our competitors. Further, our current ecosystem partners could add features to their solutions, including point of sale functionality, limit or terminate the availability of their products on our platform, or directly compete with our solutions by expanding their product offerings. Current and future competitors may also choose to offer a different pricing model or to undercut prices in an effort to increase their market share. If we cannot compete successfully against current and future competitors, our business, results of operations, and financial condition could be negatively impacted.
Mergers of or other strategic transactions by our competitors, our customers, or our partners could weaken our competitive position or reduce our revenue.
If one or more of our competitors, aggregator partners, or DSPs were to consolidate or partner with another one of our competitors, aggregator partners, or DSPs, the change in landscape could adversely affect our ability to compete effectively. Our competitors may also establish or strengthen cooperative relationships with our third party ecosystem partners, thereby limiting our ability to promote our platform. In addition, we may lose customers that merge with or are acquired by companies using a competitor’s or an internally developed solution. Disruptions in our business caused by these events could adversely affect our revenue growth and results of operations.
If we fail to maintain a consistently high level of customer service or if we fail to manage our reputation, our brand, business, and financial results may be harmed.
We believe our focus on customer service and support is critical to onboarding new customers, retaining our existing customers and growing our business. As a result, we have invested heavily in the quality and training of our support team along with the tools they use to provide this service. If we are unable to maintain a consistently high level of customer service, we may lose existing customers or fail to increase revenues from existing customers. In addition, our ability to attract new customers is highly
38
Table of Contents
dependent on our reputation and on positive recommendations from our existing customers. Any failure to maintain a consistently high level of customer service, or a market perception that we do not maintain high-quality customer service, could adversely affect our reputation and the number of positive customer referrals that we receive.
We are dependent on the continued services and performance of our senior management and other key employees, the loss of any of whom could adversely affect our business, operating results, and financial condition. We may also engage the services of third parties who provide consulting services to support our business and the failure to identify and/or retain such third parties could adversely affect our business, operating results and financial condition.
Our future performance depends on the continued services and contributions of our senior management, including our Founder and Chief Executive Officer, Noah Glass, and other key employees to execute on our business plan, keep our platform stable and secure, and to identify and pursue new opportunities and platform innovations. The failure to properly manage succession plans or the loss of services of senior management or other key employees could significantly delay or prevent the achievement of our strategic objectives. From time to time, there may be changes in our senior management team resulting from the hiring or departure of executives, which could disrupt our business. We do not maintain key person life insurance policies on any of our employees with the exception of Noah Glass, our Founder and Chief Executive Officer. The loss of the services of one or more of our senior management or other key employees for any reason could adversely affect our business, financial condition, and operating results, and require significant amounts of time, training, and resources to find suitable replacements and integrate them within our business, and could affect our corporate culture.
We engage the services of third parties who provide us with certain consulting services to support our business. Any failure to identify and/or retain such third parties could adversely affect our business, operating results and financial condition and could require significant amounts of time and resources to find suitable replacements.
If we cannot maintain our corporate culture as we grow, our success and our business and competitive position may be harmed.
We believe that a key contributor to our success to date has been our corporate culture, which is based on transparency, innovation, and entrepreneurial spirit. Any failure to preserve our culture could negatively affect our ability to retain and recruit personnel, which is critical to our growth, and to effectively focus on and pursue our corporate objectives. Our substantial anticipated headcount growth and our transition from a private company to a public company may make it difficult to maintain these important aspects of our culture. If we fail to maintain our corporate culture, or if we are unable to retain or hire key personnel, our business and competitive position may be harmed.
If we are unable to hire, retain, and motivate qualified personnel, our business may be adversely affected.
Our future success depends, in part, on our ability to continue to attract and retain highly skilled personnel. Competition for these personnel is intense, especially for engineers experienced in designing and developing SaaS or on-demand commerce applications, products managers and designers, and experienced enterprise sales professionals.
Further, our ability to increase our customer base, especially among restaurant brands, SMBs, potential international customers and other customers we may pursue, or to achieve broader market acceptance of our platform will depend, in part, on our ability to effectively organize, focus and train our sales, marketing and customer success personnel.
39
Table of Contents
Our ability to convince restaurant brands to use our platform or adopt additional modules will depend, in part, on our ability to attract and retain sales personnel with experience selling to large enterprises. We believe that there is significant competition for experienced sales professionals with the skills and technical knowledge that we require. Our ability to achieve significant revenue growth in the future will depend, in part, on our ability to recruit, train, and retain a sufficient number of experienced sales professionals, particularly those with experience selling to restaurant brands or large enterprises. In addition, even if we are successful in hiring qualified sales personnel, new hires require significant training and experience before they achieve full productivity, particularly for sales efforts targeted at restaurant brands and new territories. Our recent hires and planned hires may not become as productive as quickly as we expect and we may be unable to hire or retain sufficient numbers of qualified individuals in the future in the markets where we do business.
In the past we have experienced, and we expect to continue to experience, difficulty in hiring employees with the appropriate qualifications, particularly if we significantly expand headcount in the near-term. Many of the companies with which we compete for experienced personnel have greater resources than we have. If we hire employees from competitors or other companies, their former employers may attempt to assert that these employees or we have breached their legal obligations, resulting in a diversion of our time and resources. In addition, prospective and existing employees often consider the value of the equity awards they receive in connection with their employment. If the perceived value of our equity awards declines, experiences significant volatility, or increases such that prospective employees believe there is limited upside to the value of our equity awards, it may adversely affect our ability to recruit and retain key employees. If we fail to attract new personnel or fail to retain and motivate our current personnel, our business and future growth prospects would be harmed.
Additionally, many of our employees currently work remotely, which has allowed us to reduce capital expenditures on office space, leases, and other related costs. If we increase the number of employees who do not work remotely, we could incur increased costs and expenses in order to provide the appropriate office infrastructure for these personnel.
We rely upon Amazon Web Services and other infrastructure to operate our platform, and any disruption of or interference with our use of these providers would adversely affect our business, results of operations, and financial condition.
We outsource substantial portions of our cloud infrastructure to Amazon Web Services, or AWS, Cloudflare, and other infrastructure providers. Our customers need to be able to access our platform at any time, without interruption or degradation of performance. Their failure to access our platform could make us liable for service credits or, in more severe cases, contractual breaches. We are, therefore, vulnerable to service interruptions at AWS, Cloudflare, and other infrastructure providers, which could decrease the number of transactions we process on our platform and negatively impact our revenue. We have experienced, and expect that in the future we may experience interruptions, delays and outages in service and availability due to a variety of factors, including infrastructure changes, human or software errors, website hosting disruptions, and capacity constraints including those related to the complexity and number of order permutations. Capacity constraints could be due to a number of potential causes, including technical failures, natural disasters, fraud, or security attacks. In addition, if an infrastructure provider’s security is compromised, or our modules or platform are unavailable or our customers or their consumers are unable to use our platform within a reasonable amount of time or at all, then our business, results of operations, and financial condition could be adversely affected. In some instances, we may not be able to identify the cause or causes of these performance problems within a period of time acceptable to our customers. It may become increasingly difficult to maintain and improve our platform performance, especially during peak usage times, as our platform become more complex and the usage of our platform increases. To the extent that we do not effectively address capacity constraints, either through AWS or
40
Table of Contents
alternative providers of cloud infrastructure, our business, results of operations, and financial condition may be adversely affected. In addition, any changes in service levels from AWS may adversely affect our ability to meet our customers’ requirements.
In addition, AWS provides us with service pursuant to an agreement that continues until terminated by either party. Pursuant to our agreement with AWS, we have committed to spending $3.4 million over the two-year period of November 2019 through November 2021. AWS may terminate the agreement by providing 90 days prior written notice, and it may, in some cases, terminate the agreement immediately for cause upon notice. Although we expect that we could receive similar services from other third parties, arranging alternative cloud infrastructure services could be costly, complicated, and time-consuming, and we could experience interruptions on our platform and in our ability to make our modules available to customers. Our agreement with AWS also includes a minimum spending commitment, part of which may be forfeited if we were to switch providers.
Any of the above circumstances or events may harm our reputation, cause customers to stop using our platform, impair our ability to increase revenue from existing customers, impair our ability to grow our customer base, subject us to financial penalties and liabilities under our service level agreements and otherwise harm our business, results of operations, and financial condition.
We may be unable to achieve or maintain data transmission capacity.
Our customers often draw significant numbers of consumers to their websites and mobile applications over short periods of time, including during key television events, marketing events, holidays, or during peak delivery times, which significantly increases the traffic on our servers and the volume of transactions processed on our platform. Our infrastructure or software may be unable to achieve or maintain capacity high enough to handle increased traffic or process transactions in a timely manner. Our failure to achieve or maintain high capacity could significantly reduce demand for our platform. Further, as we continue to attract larger restaurant customers, the volume of data stored and transactions processed on our platform will increase, especially if such customers draw significant numbers of consumers over short periods of time. In the future, we may be required to allocate resources, including spending substantial amounts of money, to build, purchase, or lease additional infrastructure in order to handle the increased load. Our ability to deliver our platform also depends on the development and maintenance of internet and mobile application infrastructure by third parties, including by our cloud service provider. Such development and maintenance includes the maintenance of reliable networks with the necessary speed, data capacity, and bandwidth. If one of these third parties suffers from capacity constraints, our business may be adversely affected.
Our business and prospects would be harmed if changes to technologies used in our platform or new versions or upgrades of operating systems or applications adversely impact the process by which customers and consumers interface with our platform.
We believe that our platform’s functionality, simplicity, positive user experience, and ability to integrate with multiple technology partners in the restaurant ecosystem have helped us to expand and offer our platform to customers who may have limited technical personnel. In the future, providers of mobile, website, or other operating systems or applications could introduce new features, policies or rules that would make it difficult for customers to use our platform. In addition, mobile devices, websites, operating systems, or other applications could introduce new features, change existing operating systems, APIs, or other specifications such that they would be incompatible with our platform, or prevent delivery or aggregator partners from accessing customers who are using our platform. Any changes to technologies used in our platform, existing features that we rely on, or operating systems, APIs, or applications that make it difficult for customers to access our platform or consumers to access our customers’ ordering applications or websites, may make it more difficult for us to maintain or increase our revenue and could adversely impact our business and prospects.
41
Table of Contents
The estimates of market opportunity and forecasts of market growth included in this prospectus may prove to be inaccurate, and even if the market in which we compete achieves the forecasted growth, our business could fail to grow at similar rates, if at all.
The estimates of market opportunity and forecasts of market growth included in this prospectus may prove to be inaccurate. Market opportunity estimates and growth forecasts included in this prospectus are subject to significant uncertainty and are based on assumptions and estimates that may not prove to be accurate, including the risks described herein. Even if the market in which we compete achieves the forecasted growth, our business could fail to grow at similar rates, if at all.
The variables that go into the calculation of our market opportunity are subject to change over time, and there is no guarantee that any particular number or percentage of addressable customers covered by our market opportunity estimates will purchase our platform at all or generate any particular level of revenue for us. Any expansion in our market depends on a number of factors, including the cost, performance, and perceived value associated with our platform and those of our competitors. Even if the market in which we compete meets the size estimates and growth forecasted in this prospectus, our business could fail to grow at similar rates, if at all. Additionally, ghost or dark kitchens could become more prominent, thereby reducing the total number of potential restaurant brand customers, and they may not use our platform or modules as much as restaurant brand customers. Our growth is subject to many additional factors, including our success in implementing our business strategy, which is subject to many risks and uncertainties. Accordingly, the forecasts of market growth included in this prospectus should not be taken as indicative of our future growth. For more information regarding our estimates of market opportunity and the forecasts of market growth included in this prospectus, see the section titled “Market, Industry, and Other Data.”
Our future success depends in part on our ability to drive the adoption of our platform by international and SMB customers, and to expand into new, on-demand commerce verticals.
Although we currently do not derive significant revenue from customer accounts located outside the United States, and do not derive any revenue from customer accounts outside of North America, the future success of our business may depend, in part, on our ability to expand our customer base worldwide. However, because we have limited experience with international customers or in selling our platform internationally, our business model may not be successful or have the same traction outside the United States. As a result, our investment in marketing our platform to these potential customers may not be successful. Additionally, our success may depend in part on our ability to increase our partnerships with SMB customers. These customers may have different requirements than our larger restaurant brand customers, and therefore may not find our platform to be as attractive as our existing customers. They may also be unwilling to agree to pay subscription or transactional fees for our platform or modules at the levels required to make these transaction profitable, or they may request additional functionality, training, customer service, or software integrations. We also believe that our platform can be applied to other on-demand commerce verticals beyond the restaurant industry, and plan to focus on sectors or opportunities that are also undergoing the digital transformations. If we are unable to increase the revenue that we derive from international and SMB restaurant customers, or deploy our platform in other on-demand commerce verticals, then our business, results of operations, and financial condition may be adversely affected.
We may be subject to claims by third parties of intellectual property infringement.
The software industry is characterized by the existence of a large number of patents, trademarks, copyrights, trade secrets, and other intellectual property rights, and frequent claims and related litigation regarding such intellectual property rights. Third parties have in the past asserted, and may in the future assert, that our platform, modules, technology, methods or practices infringe,
42
Table of Contents
misappropriate, or otherwise violate their intellectual property or other proprietary rights. Such claims may be made by our competitors seeking to obtain a competitive advantage or by other parties. Additionally, non-practicing entities purchasing intellectual property assets for the purpose of making claims of infringement may attempt to extract settlements from us. The risk of claims may increase as the number of modules that we offer and competitors in our market increases and overlaps occur. In addition, to the extent that we gain greater visibility and market exposure, we face a higher risk of being the subject of intellectual property infringement claims.
Any such claims, regardless of merit, that result in litigation could result in substantial expenses, divert the attention of management, cause significant delays in introducing new or enhanced services or technology, materially disrupt the conduct of our business and have a material and adverse effect on our brand, business, financial condition, and results of operations. Although we do not believe that our proprietary technology, processes, and methods have been patented by any third party, it is possible that patents have been issued to third parties that cover all or a portion of our business. As a consequence of any patent or other intellectual property claims, we could be required to pay substantial damages, develop non-infringing technology, enter into royalty-bearing licensing agreements, stop selling or marketing some or all of our modules, or re-brand our modules. We may also be obligated to indemnify our customers against intellectual property claims, and we may have to pay substantial settlement costs, including royalty payments, in connection with any such claim or litigation and to obtain licenses, or modify applications, which could be costly. If it appears necessary, we may seek to secure license rights to intellectual property that we are alleged to infringe at a significant cost, potentially even if we believe such claims to be without merit. If required licenses cannot be obtained, or if existing licenses are not renewed, litigation could result. Litigation is inherently uncertain and can cause us to expend significant money, time and attention to it, even if we are ultimately successful. Any adverse decision could result in a loss of our proprietary rights, subject us to significant liabilities, require us to seek licenses for alternative technologies from third parties, prevent us from offering all or a portion of our modules and otherwise negatively affect our business and operating results.
We could incur substantial costs in protecting or defending our intellectual property rights, and any failure to protect our intellectual property or prevent third parties from making unauthorized use of our technology could adversely affect our business, results of operations, and financial condition.
Our success depends, in part, on our ability to protect our brand and the proprietary methods and technologies that we develop under the intellectual property laws of the United States and, potentially in the future, foreign jurisdictions so that we can prevent others from using our inventions and proprietary information. Although we own one registered trademark in the United States as of December 31, 2020, we hold no issued patents and therefore would not be entitled to exert patents to exclude or prevent our competitors from using our proprietary technology, methods, and processes to the extent independently developed by our competitors.
We rely primarily on trade secret laws and confidentiality agreements with our business partners, employees, consultants, advisors, customers, and other current or prospective partners in our efforts to protect our proprietary technology, confidential information, processes, methods, and intellectual property. These confidentiality agreements may not effectively prevent disclosure of our confidential information or the unauthorized use of our technology, and it may be possible for unauthorized parties to copy our software or other proprietary technology or information, or to develop similar software independently without our having an adequate remedy for unauthorized use or disclosure of our confidential information. In addition, others may independently discover our trade secrets and proprietary information, and in these cases, we would not be able to assert any trade secret rights against those parties. Costly and time-consuming litigation could be necessary to enforce
43
Table of Contents
and determine the scope of our proprietary rights, and failure to obtain or maintain trade secret protection could adversely affect our competitive business position.
In addition, the laws of some countries do not protect intellectual property and other proprietary rights to the same extent as the laws of the United States. To the extent we expand our international activities, our exposure to unauthorized copying, transfer and use of our proprietary technology or information may increase.
We cannot be certain that our means of protecting our intellectual property and proprietary rights will be adequate or that our competitors will not independently develop similar technology. If we fail to meaningfully protect our intellectual property and proprietary rights, our business, results of operations, and financial condition could be adversely affected.
Any future litigation against us could be costly and time-consuming to defend.
We may become subject to legal proceedings and claims that arise in the ordinary course of business, such as claims brought by our customers, our partners, or third parties in connection with commercial disputes or our technology or employment claims made by our current or former employees. Litigation might result in substantial costs and may divert management’s attention and resources, which might seriously harm our business, financial condition, and results of operations. Insurance might not cover such claims, might not provide sufficient payments to cover all the costs to resolve one or more such claims, and might not continue to be available on terms acceptable to us. A claim brought against us that is uninsured or underinsured could result in unanticipated costs, potentially harming our business, financial position, and results of operations.
We use open source software in our platform, which could negatively affect our ability to sell our services or subject us to litigation or other actions.
We rely on open source software in our proprietary platforms and we expect to continue to rely on open source software in our platform in the future. The terms of certain open source licenses to which we are subject have not been interpreted by U.S. or foreign courts, and there is a risk that these licenses could be construed in a manner that could impose unanticipated conditions or restrictions on our ability to commercialize our platforms. Certain open source projects also include other open source software and there is a risk that those dependent open source libraries may be subject to inconsistent licensing terms. This could create further uncertainties as to the governing terms for the open source software. Moreover, we cannot ensure that we have not incorporated and are currently relying on additional open source software in our platform in a manner that is inconsistent with the terms of the applicable license or our current policies and procedures. Although we employ open source software license screening measures, if we were to combine our proprietary software platform with open source software in a certain manner we could, under certain open source licenses, be required to release the source code of our proprietary platform, which could allow our customers and competitors to freely use such software solutions without compensation to us. Additionally, we may from time to time face claims from third parties: claiming ownership of, or demanding release of, the open source software or derivative works that we developed using such software, which could include our proprietary source code, or otherwise seeking to enforce the terms of the applicable open source license. These claims could result in litigation and we could be required to incur significant legal expenses defending against such allegations and could be subject to significant damages, required to comply with onerous conditions or restrictions, required to make our proprietary source code for our platform and any modifications and derivative works developed using such open source software generally available at no cost, purchase a costly license or cease offering the implicated services unless and until we can re-engineer them to avoid use of the open source software in dispute, which could disrupt the business dependent on the affected platforms. This re-engineering process could require significant additional
44
Table of Contents
research and development resources, and we may not be able to complete it successfully. In addition to risks related to license requirements, use of certain open source software can lead to greater risks than use of third-party commercial software, as open source licensors generally do not provide warranties or controls on the origin of software. From time to time, there have been claims challenging the ownership rights in open source software against companies that incorporate it into their products and the licensors of such open source software provide no warranties or indemnities with respect to such claims. As a result, we and our customers could be subject to lawsuits by parties claiming ownership of what we believe to be open source software. Some open source projects have known vulnerabilities and architectural instabilities and are provided on an “as-is” basis which, if not properly addressed, could negatively affect the performance of our platform. Any of these risks could be difficult to eliminate or manage, and if not addressed, could have a negative effect on our business, results of operations, and financial condition.
Our brand is integral to our success. If we fail to effectively maintain, promote, and enhance our brand, our business and competitive advantage may be harmed.
We believe that maintaining, promoting, and enhancing the Olo brand is critical to expanding our business. Maintaining and enhancing our brand will depend largely on our ability to continue to provide high-quality, well-designed, useful, reliable, and innovative modules, which we may not do successfully in the future.
Errors, defects, security incidents, disruptions, or other performance problems with our platform, including with third-party applications, services, or partners, may harm our reputation and brand. We may introduce new modules or terms of service that our customers or consumers do not like, which may negatively affect our brand. Additionally, if our customers or consumers have a negative experience using our modules or third-party solutions integrated with our platform, such an experience may affect our brand, especially as and if we continue to attract multi-location restaurant customers to our platform.
We receive significant media coverage in the United States, especially in the restaurant trade press. Any unfavorable media coverage or negative publicity about our company, for example, the quality and reliability of our platform, our privacy and security practices or the loss or misuse of our customer data or consumers’ personal information, our platform changes, litigation, or regulatory activity, or regarding the actions of our partners or our customers, could seriously harm our reputation. Such negative publicity could also adversely affect the size, demographics, engagement, and loyalty of our customers, and result in decreased revenue, which could seriously harm our business.
We believe that the importance of brand recognition will increase as competition in our market increases. In addition to our ability to provide reliable and useful modules at competitive prices, successful promotion of our brand will depend on the effectiveness of our marketing efforts. While we primarily market our platform through direct sales efforts, our platform is also marketed through a number of free traffic sources, including customer referrals and word-of-mouth. Our efforts to market our brand have involved significant expenses, which we intend to increase, and as our market becomes increasingly competitive, these marketing initiatives may become increasingly difficult and expensive. Our marketing spend may not yield increased revenue, and even if it does, any increased revenue may not offset the expenses we incur in building and maintaining our brand.
Activities of customers or partners or the content of our customers’ websites or mobile applications could damage our brand, subject us to liability, and harm our business and financial results.
Our terms of service and acceptable use policy prohibit our customers and partners from using our platform to engage in illegal or otherwise prohibited activities and our terms of service and
45
Table of Contents
acceptable use policy permit us to terminate a customer’s or partner’s account if we become aware of such use. Customers or partners may nonetheless engage in prohibited or illegal activities including in connection with their use of our products and services, which could subject us to civil or governmental liability or enforcement. We do not proactively monitor or review the appropriateness of the content of our customers’ websites or mobile applications and we do not have control over such content or our customers’ activities. The safeguards we have in place may not be sufficient for us to avoid liability, including through litigation, or avoid harm to our brand, especially if such inappropriate or illegal use is high profile, which could adversely affect our business and financial results. In addition, if we expand internationally, we may be subject to similar actions in foreign jurisdictions alleging that customers’ store content violates laws in foreign jurisdictions.
Unfavorable conditions in our industry or the global economy, or reductions in digital ordering transaction volume or technology spending, could adversely impact the health of our customers and limit our ability to grow our business and negatively affect our results of operations.
Our results of operations may vary based on the impact of changes in our industry or the global economy on us or our customers and potential customers. Negative conditions in the general economy both in the United States and abroad, including conditions resulting from changes in gross domestic product growth, decreases in restaurant and digital ordering spending, financial and credit market fluctuations, international trade relations, political turmoil, natural catastrophes, epidemics, warfare and terrorist attacks on the United States, Canada, or elsewhere, could cause a reduction in customer locations and digital ordering transaction volumes, a decrease in business investments, including spending on technology, business interruptions resulting from a destruction of our headquarters, and negatively affect the growth of our business.
More specifically, we are heavily reliant on the restaurant, food, and delivery industries and any downturn or fundamental shift in those industries could significantly impact our results. Reports, whether true or not, of foodborne illnesses and injuries caused by food tampering have severely injured the reputations of participants in the food business and could do so in the future. The potential for acts of terrorism on the United States’ food supply also exists and, if such an event occurs, it could harm our business and results of operations. In addition, reports of foodborne illnesses or food tampering could, as a result of negative publicity about the restaurant industry, harm our business and results of operations.
In addition, we contract directly with our DSPs to provide delivery services to our restaurant customers through Dispatch and then invoice our restaurant customers for the cost associated with DSP services. As a result, we may be required to make payments to DSPs prior to receiving payment from our restaurant customers for DSP transactions, which could reduce the amount of cash and cash equivalents we have available for the period between payment to the DSPs and receipt of payment from the restaurant customer. In addition, if any of our restaurant customers were to go out of business, become insolvent, or otherwise be unable to pay for DSP transactions, we would be responsible for making payments to the DSPs that our customers otherwise would have made, which could adversely affect our business.
Lastly, the increased pace of consolidation in certain industries may result in reduced overall spending on our platform and modules. We cannot predict the timing, strength, or duration of any economic slowdown, instability, or recovery, generally or within any particular industry.
Increases in food, labor, and occupancy costs could adversely affect results of operations.
Our financial success is dependent, in part, on the ability of our restaurant customers to increase digital ordering and maintain profitability. These customers may experience increased
46
Table of Contents
operating costs, including as a result of changes to food, labor, occupancy, insurance, and supply costs, as well as costs of safety equipment related to the COVID-19 pandemic, and they may be unable to recover these costs through increased menu prices. Various factors beyond our control, including government regulations relating to independent contractor classifications and minimum wage increases, may affect the total cost of digital food orders to consumers. If our current or future customers are unable to maintain or increase digital orders, or maintain profitability, our business, financial condition, and results of operations could be harmed.
We may make acquisitions or enter into joint ventures or other partnerships, which could divert management’s attention, result in operating difficulties and dilution to our shareholders and otherwise disrupt our operations and adversely affect our business, operating results, or financial position.
From time to time, we may evaluate potential strategic acquisition, joint venture, or partnership opportunities. Any transactions that we enter into could be material to our financial condition and results of operations. The process of acquiring and integrating another company or technology could create unforeseen operating difficulties and expenditures. Acquisitions and other partnerships involve a number of risks, such as:
| ● | diversion of management time and focus from operating our business; |
| ● | use of resources that are needed in other areas of our business; |
| ● | in the case of an acquisition, implementation or remediation of controls, procedures, and policies of the acquired company; |
| ● | in the case of an acquisition, difficulty integrating the accounting systems and operations of the acquired company and maintaining the quality and security standards consistent with our brand, including potential risks to our corporate culture; |
| ● | coordination of product, engineering, and selling and marketing functions, including difficulties and additional expenses associated with supporting legacy services and platform and hosting infrastructure of the acquired company and difficulty converting the customers of the acquired company onto our platform and contract terms, including disparities in the revenues, licensing, support, or professional services model of the acquired company; |
| ● | in the case of an acquisition, retention and integration of employees from the acquired company; |
| ● | unforeseen costs or liabilities, including potential legal liability for violations of applicable law or industry rules and regulations arising from prior or ongoing acts or omissions by the acquired company or partner that are not discovered by due diligence during the acquisition or partnership process; |
| ● | adverse effects to our existing business relationships with partners and customers as a result of the acquisition or joint venture; |
| ● | the possibility of adverse tax consequences; |
| ● | litigation or other claims arising in connection with the acquired company or partner; and |
47
Table of Contents
| ● | in the case of foreign acquisitions, the need to integrate operations across different cultures and languages and to address the particular economic, currency, political, and regulatory risks associated with specific countries. |
In addition, a significant portion of the purchase price of companies we acquire may be allocated to acquired goodwill and other intangible assets, which must be assessed for impairment at least annually. In the future, if our acquisitions do not yield expected returns, we may be required to take charges to our operating results based on this impairment assessment process, which could adversely affect our results of operations.
Acquisitions and investments may also result in dilutive issuances of equity securities, which could adversely affect our share price, or result in issuances of securities with superior rights and preferences to our Class A common stock, or the incurrence of debt with restrictive covenants that limit our future uses of capital in pursuit of business opportunities.
We may not be able to identify acquisition or investment opportunities that meet our strategic objectives, or to the extent such opportunities are identified, we may not be able to negotiate terms with respect to the acquisition or investment that are acceptable to us. At this time, we have made no commitments or agreements with respect to any such material transactions.
We rely on software licensed from, and services rendered by, third parties in order to provide our modules and run our business.
We rely on software licensed from, and services rendered by, third parties in order to provide our modules and run our business. Third-party software and services may not continue to be available on commercially reasonable terms, or at all. Any loss of the right to use, or any failures of, third-party software or services could result in delays in our ability to provide our modules or run our business until equivalent software or services are developed by us or, if available, identified, obtained and integrated, which could be costly and time-consuming and may not result in an equivalent module, any of which could cause an adverse effect on our business and operating results. Further, customers could assert claims against us in connection with such service disruption or cease conducting business with us altogether. Even if not successful, a claim brought against us by any of our customers would likely be time-consuming and costly to defend and could seriously damage our reputation and brand, making it harder for us to sell our modules.
Our pricing decisions and pricing models may adversely affect our ability to attract new customers and retain existing customers.
In 2015 and 2017, we launched our Dispatch and Rails modules, respectively, and in 2016 we began to offer a transactional-based pricing model for our Ordering module. As a result, we have limited experience determining the optimal prices for our modules and may be unable to convert existing customers from a flat-fee model to our transactional based pricing models. We have changed our pricing model from time to time and expect to do so in the future or sell new modules. However, given our limited experience with selling new modules, it may turn out that the new pricing models, or the pricing for any other modules we may develop, is not optimal, which may result in our modules not being profitable or not gaining market share. As competitors introduce new solutions that compete with ours, especially in the digital ordering and delivery spaces where we face significant competition, we may be unable to attract new customers at the same price or based on the same pricing models that we have used historically. Pricing decisions and pricing models may also impact the mix of adoption among our modules and negatively impact our overall revenue. Moreover, restaurant brands may be sensitive to price increases or to the prices offered by competitors. As a result, in the future we may be required to reduce our prices, which could adversely affect our revenue, profitability, financial position, and cash flows.
48
Table of Contents
Provisions of our financial instruments may restrict our ability to pursue our business strategies.
We currently have a credit facility, which requires us, and any debt instruments we may enter into in the future may require us, to comply with various covenants that limit our ability to, among other things:
| ● | dispose of or encumber assets; |
| ● | complete mergers or acquisitions; |
| ● | incur additional indebtedness; |
| ● | pay dividends or make other distributions to holders of our shares; |
| ● | make specified investments; |
| ● | change certain key management personnel; |
| ● | engage in any business other than the businesses we currently engage in; and |
| ● | engage in transactions with affiliates. |
These restrictions could inhibit our ability to pursue our business strategies. If we default under our credit facility, and such event of default is not cured or waived, the lender could terminate commitments to lend and cause all amounts outstanding with respect to the debt to be due and payable immediately. Our assets and cash flow may not be sufficient to fully repay borrowings under our outstanding debt instruments if some or all of these instruments are accelerated upon a default.
We may also incur additional indebtedness in the future. The instruments governing such indebtedness could contain provisions that are as, or more, restrictive than our existing debt instruments. If we are unable to repay, refinance, or restructure our indebtedness when payment is due, the lenders could proceed against the collateral granted to them to secure such indebtedness, as applicable, or force us into bankruptcy or liquidation.
Changes in our effective tax rate or tax liability may have an adverse effect on our results of operations.
Our effective tax rate could increase due to several factors, including:
| ● | changes in the relative amounts of income before taxes in the various jurisdictions in which we operate that have differing statutory tax rates; |
| ● | changes in tax laws, tax treaties, and regulations or the interpretation of them, including the Tax Cuts and Jobs Act; |
| ● | changes to our assessment about our ability to realize our deferred tax assets that are based on estimates of our future results, the prudence and feasibility of possible tax planning strategies, and the economic and political environments in which we do business; |
| ● | the outcome of current and future tax audits, examinations, or administrative appeals; and |
| ● | limitations or adverse findings regarding our ability to do business in some jurisdictions. |
Any of these developments could adversely affect our results of operations.
49
Table of Contents
We could be required to collect additional sales taxes or be subject to other tax liabilities that may increase the costs our customers would have to pay for our modules and adversely affect our results of operations.
An increasing number of states have considered or adopted laws that attempt to impose tax collection obligations on out-of-state companies. Additionally, the Supreme Court of the United States recently ruled in South Dakota v. Wayfair, Inc. et al, or Wayfair, that online sellers can be required to collect sales and use tax despite not having a physical presence in the buyer’s state. In response to Wayfair, or otherwise, states or local governments may adopt, or begin to enforce, laws requiring us to calculate, collect, and remit taxes on sales in their jurisdictions. A successful assertion by one or more states requiring us to collect taxes where we presently do not do so, or to collect more taxes in a jurisdiction in which we currently do collect some taxes, could result in substantial tax liabilities, including taxes on past sales, as well as penalties and interest. The imposition by state governments or local governments of sales tax collection obligations on out-of-state sellers could also create additional administrative burdens for us, put us at a competitive disadvantage if they do not impose similar obligations on our competitors, and decrease our future sales, which could have a material adverse effect on our business and results of operations.
Our ability to use our net operating losses to offset future taxable income may be subject to certain limitations.
As of December 31, 2019 and 2020, we had approximately $46.8 million and $31.7 million of federal net operating losses, or NOLs. Approximately $28.4 million of the federal NOLs will expire at various dates beginning in 2035 through 2037 if not utilized, while the remaining amount will have an indefinite life. As of December 31, 2019 and 2020, we had approximately $38.0 million and $26.2 million of state NOLs. Of the state NOLs, some may follow the Tax Cut and Jobs Act and are indefinite life and most are definite life with various expiration dates beginning in 2025 through 2039. The federal research and development tax credits were approximately $1.3 million as of each of December 31, 2019 and 2020, respectively. The federal research credits will begin to expire in 2026. In general, under Section 382 of the Internal Revenue Code of 1986, as amended, or the Code, a corporation that undergoes an “ownership change,” as defined under Section 382 of the Code and applicable Treasury Regulations, is subject to limitations on its ability to utilize its pre-change NOLs to offset future taxable income. We may experience a future ownership change, including, potentially, in connection with this offering, under Section 382 of the Code that could affect our ability to utilize the NOLs to offset our income. Furthermore, our ability to utilize NOLs of companies that we have acquired or may acquire in the future may be subject to limitations. There is also a risk that due to regulatory changes, such as suspensions on the use of NOLs or other unforeseen reasons, our existing NOLs could expire or otherwise be unavailable to reduce future income tax liabilities, including for state tax purposes. For these reasons, we may not be able to utilize a material portion of the NOLs reflected on our balance sheet, even if we attain profitability, which could potentially result in increased future tax liability to us and could adversely affect our operating results and financial condition.
Our reported financial results may be adversely affected by changes in accounting principles generally accepted in the United States.
U.S. generally accepted accounting principles, or GAAP, are subject to interpretation by the Financial Accounting Standards Board, or FASB, the Securities and Exchange Commission, or SEC, and various bodies formed to promulgate and interpret appropriate accounting principles. A change in these principles or interpretations could have a significant effect on our reported results of operations and could affect the reporting of transactions already completed before the announcement of a change.
50
Table of Contents
If our estimates or judgments relating to our critical accounting policies prove to be incorrect, our results of operations could be adversely affected.
The preparation of financial statements in conformity with GAAP requires management to make estimates and assumptions that affect the amounts reported in our consolidated financial statements and accompanying notes appearing elsewhere in this prospectus. We base our estimates on historical experience and on various other assumptions that we believe to be reasonable under the circumstances, as provided in the section titled “Management’s Discussion and Analysis of Financial Condition and Results of Operations—Critical Accounting Policies and Estimates.” The results of these estimates form the basis for making judgments about the carrying values of assets, liabilities and equity, and the amount of revenue and expenses that are not readily apparent from other sources. Significant estimates and judgments involve revenue recognition, and the valuation of our stock-based compensation awards, including the determination of fair value of our Class A common stock, among others. Our results of operations may be adversely affected if our assumptions change or if actual circumstances differ from those in our assumptions, which could cause our results of operations to fall below the expectations of securities analysts and investors, resulting in a decline in the market price of our Class A common stock.
We identified a material weakness in our internal control over our financial reporting process. If we are unable to remediate this material weakness, we may not be able to accurately or timely report our financial condition or results of operations.
A material weakness is a deficiency, or a combination of deficiencies, in internal control over financial reporting, such that there is a reasonable possibility that a material misstatement of a company’s annual or interim financial statements will not be prevented or detected on a timely basis. We identified a material weakness in our internal control over our financial statement close process specifically related to insufficient written policies and procedures for accounting and financial reporting and the lack of properly designed controls related to accounting for revenue recognition in accordance with standards under Accounting Standards Codification (“ASC”) Topic 606 (“ASC 606”), Revenue from Contracts with Customers. These control deficiencies could result in a misstatement of our accounts or disclosures that would result in a material misstatement of our financial results that would not be prevented or detected, and accordingly, we determined that these control deficiencies constitute a material weakness.
We are working to remediate this material weakness through the development and implementation of processes and controls over the financial reporting process. Specifically, we have:
| ● | in the process of implementing a new revenue recognition system which will significantly reduce the number of manual controls currently required to recognize revenue; |
| ● | engaged external resources to assist with remediation efforts and internal control execution as well as to provide additional training to existing personnel, including the development of written policies and procedures in certain areas; and |
| ● | continued to hire additional internal resources with appropriate knowledge and expertise to effectively operate financial reporting processes and internal controls. |
While we have designed and are implementing new controls to remediate this material weakness, they have not operated for a sufficient period of time to demonstrate the material weakness has been remediated. We cannot assure you that the measures we have taken to date will be sufficient to remediate the material weakness we identified or avoid the identification of additional material weaknesses in the future. If the steps we take do not remediate the material weakness in a timely manner, there could continue to be a reasonable possibility that this control deficiency or others could
51
Table of Contents
result in a material misstatement of our annual or interim financial statements that would not be prevented or detected on a timely basis.
Furthermore, investors’ perceptions that our internal controls are inadequate or that we are unable to produce accurate financial statements on a timely basis may harm our stock price.
As a result of being a public company, we are obligated to develop and maintain proper and effective internal controls over financial reporting, and any failure to maintain the adequacy of these internal controls may adversely affect investor confidence in our company and, as a result, the value of our Class A common stock.
We are required, pursuant to Section 404 of the Sarbanes-Oxley Act of 2002, or Section 404, to furnish a report by management on, among other things, the effectiveness of our internal control over financial reporting for the fiscal year ending December 31, 2021. This assessment will need to include disclosure of any material weaknesses identified by our management in our internal control over financial reporting. In addition, our independent registered public accounting firm will be required to attest to the effectiveness of our internal control over financial reporting in our first annual report required to be filed with the SEC following the date we are no longer an “emerging growth company” or after we are no longer a “smaller reporting company.” We have recently commenced the costly and challenging process of compiling the system and processing documentation necessary to perform the evaluation needed to comply with Section 404, but we may not be able to complete our evaluation, testing, and any required remediation in a timely fashion once initiated. Our compliance with Section 404 will require that we incur substantial expenses and expend significant management efforts. We currently do not have an internal audit group, and we will need to hire additional accounting and financial staff with appropriate public company experience and technical accounting knowledge and compile the system and process documentation necessary to perform the evaluation needed to comply with Section 404.
During the evaluation and testing process of our internal controls, if we identify one or more material weaknesses in our internal control over financial reporting, we will be unable to certify that our internal control over financial reporting is effective. We cannot assure you that there will not be material weaknesses or significant deficiencies in our internal control over financial reporting in the future. As we have had a material weakness in the past, any failure to maintain internal control over financial reporting could severely inhibit our ability to accurately report our financial condition or results of operations. If we are unable to conclude that our internal control over financial reporting is effective, or if our independent registered public accounting firm determines we have a material weakness or significant deficiency in our internal control over financial reporting, we could lose investor confidence in the accuracy and completeness of our financial reports, the market price of our Class A common stock could decline, and we could be subject to sanctions or investigations by the SEC or other regulatory authorities. Failure to remedy any material weakness in our internal control over financial reporting, or to implement or maintain other effective control systems required of public companies, could also restrict our future access to the capital markets.
We may require additional capital, which additional financing may result in restrictions on our operations or substantial dilution to our stockholders, to support the growth of our business, and this capital might not be available on acceptable terms, if at all.
We have funded our operations since inception primarily through equity financings, borrowings under our credit facility, and sales of our platform and core modules. We cannot be certain when or if our operations will generate sufficient cash to fully fund our ongoing operations or the growth of our business. We intend to continue to make investments to support our business, which may require us to engage in equity or debt financings to secure additional funds. Additional financing may not be
52
Table of Contents
available on terms favorable to us, if at all. In particular, the current COVID-19 pandemic has caused disruption in the global financial markets, which may reduce our ability to access capital and negatively affect our liquidity in the future. If adequate funds are not available on acceptable terms, we may be unable to invest in future growth opportunities, which could harm our business, operating results, and financial condition. If we incur additional debt, the debt holders would have rights senior to holders of common stock to make claims on our assets, and the terms of any debt could restrict our operations, including our ability to pay dividends on our Class A common stock. Furthermore, if we issue additional equity securities, stockholders will experience dilution, and the new equity securities could have rights senior to those of our Class A common stock. Because our decision to issue securities in the future will depend on numerous considerations, including factors beyond our control, we cannot predict or estimate the amount, timing, or nature of any future issuances of debt or equity securities. As a result, our stockholders bear the risk of future issuances of debt or equity securities reducing the value of our Class A common stock and diluting their interests.
We recognize revenue from customer subscriptions over the term of the subscription agreement and, therefore, a significant downturn in our business may not be immediately reflected in our operating results.
We recognize revenue from subscription agreements monthly over the terms of these agreements, which is typically three years or longer. As a result, a significant portion of the revenue we report in each quarter is generated from customer agreements entered into during previous periods. Consequently, a decline in new subscriptions or renewed subscriptions in any one quarter may not impact our financial performance in that quarter, but might negatively affect our revenue in future quarters. If a number of contracts expire and are not renewed in the same quarter, our revenue may decline significantly in that quarter and subsequent quarters. Accordingly, the effect of significant declines in sales of our platform or modules may not be reflected in our short-term results of operations.
We experience significant seasonal fluctuations in our financial results, which could cause our stock price to fluctuate.
Our business is highly dependent on the behavior patterns of restaurant brands and consumers. We may experience a relative increase or decrease in the use of our Ordering, Rails, and Dispatch modules depending on the season and customer type, which may be difficult to assess. Additionally, our revenue can also be impacted by sales cycles and seasonality, which vary depending on customer type. Finally, even after we have executed a contract with a customer, deployment of our platform and the related modules is typically lower than average in the fourth quarter. As a result, seasonality will likely cause fluctuations in our financial results on a quarterly basis, and other seasonality trends may develop may similarly impact our results of operation.
Risks Related to this Offering and Ownership of Our Class A Common Stock
Our stock price may be volatile, and the value of our Class A common stock may decline.
The market price of our Class A common stock may be highly volatile and may fluctuate or decline substantially as a result of a variety of factors, some of which are beyond our control, including:
| ● | actual or anticipated fluctuations in our financial condition or results of operations; |
| ● | variance in our financial performance from expectations of securities analysts; |
| ● | changes in the pricing of our modules; |
53
Table of Contents
| ● | changes in our projected operating and financial results; |
| ● | changes in laws or regulations applicable to our platform and modules; |
| ● | announcements by us or our competitors of significant business developments, acquisitions, or new offerings; |
| ● | our involvement in litigation; |
| ● | future sales of our Class A common stock by us or our stockholders, as well as the anticipation of lock-up releases; |
| ● | significant data breaches, disruptions to or other incidents involving our software; |
| ● | changes in senior management or key personnel; |
| ● | the trading volume of our Class A common stock; |
| ● | changes in the anticipated future size and growth rate of our markets; and |
| ● | general economic and market conditions. |
Broad market and industry fluctuations, as well as general economic, political, regulatory, and market conditions, may also negatively impact the market price of our Class A common stock. In addition, technology stocks have historically experienced high levels of volatility. In the past, companies that have experienced volatility in the market price of their securities have been subject to securities class action litigation. We may be the target of this type of litigation in the future, which could result in substantial expenses and divert our management’s attention.
The dual-class structure of our common stock will have the effect of concentrating voting control with our existing stockholders, executive officers, directors, and their affiliates, which will limit your ability to influence the outcome of important transactions and to influence corporate governance matters, such as electing directors, and to approve material mergers, acquisitions, or other business combination transactions that may not be aligned with your interests.
Our Class B common stock has ten votes per share, whereas our Class A common stock, which is the stock we are offering in this offering, has one vote per share. Our existing stockholders, all of which hold shares of Class B common stock, will collectively own shares representing approximately % of the voting power of our outstanding capital stock immediately following the closing of this offering, based on the number of shares outstanding as of December 31, 2020. Our directors and executive officers and their affiliates will collectively beneficially own, in the aggregate, shares representing approximately % of the voting power of our outstanding capital stock immediately following the closing of this offering, based on the number of shares outstanding as of December 31, 2020. As a result, the holders of our Class B common stock will be able to exercise considerable influence over matters requiring stockholder approval, including the election of directors and approval of significant corporate transactions, such as a merger or other sale of our company or our assets, even if their stock holdings represent less than % of the outstanding shares of our capital stock. This concentration of ownership will limit the ability of other stockholders to influence corporate matters and may cause us to make strategic decisions that could involve risks to you or that may not be aligned with your interests. This control may adversely affect the market price of our Class A common stock.
54
Table of Contents
Further, future transfers by holders of our Class B common stock will generally result in those shares converting into shares of our Class A common stock, subject to limited exceptions, such as certain transfers effected for tax or estate planning purposes. The conversion of shares of our Class B common stock into shares of our Class A common stock will have the effect, over time, of increasing the relative voting power of those holders of Class B common stock who retain their shares in the long term.
We cannot predict the impact our dual-class structure may have on the market price of our Class A common stock.
We cannot predict whether our dual-class structure, combined with the concentrated control of our stockholders who held our capital stock prior to the completion of our offering, including our executive officers, employees, and directors and their affiliates, will result in a lower or more volatile market price of our Class A common stock or in adverse publicity or other adverse consequences. For example, certain index providers have announced restrictions on including companies with multiple class share structures in certain of their indices. In July 2017, FTSE Russell and Standard & Poor’s announced that they would cease to allow most newly public companies utilizing dual or multi-class capital structures to be included in their indices. Under the announced policies, our dual class capital structure would make us ineligible for inclusion in any of these indices. Given the sustained flow of investment funds into passive strategies that seek to track certain indexes, exclusion from stock indexes would likely preclude investment by many of these funds and could make our Class A common stock less attractive to other investors. As a result, the market price of our Class A common stock could be adversely affected.
No public market for our Class A common stock currently exists, and an active public trading market may not develop or be sustained following this offering.
No public market for our Class A common stock currently exists. An active public trading market for our Class A common stock may not develop following the completion of this offering or, if developed, it may not be sustained. The lack of an active market may impair your ability to sell your shares at the time you wish to sell them or at a price that you consider reasonable. The lack of an active market may also reduce the fair value of your shares. An inactive market may also impair our ability to raise capital to continue to fund operations by selling shares and may impair our ability to acquire other companies or technologies by using our shares as consideration.
We will have broad discretion in the use of the net proceeds to us from this offering and may not use them effectively, which could affect our results of operations and cause our stock price to decline.
We will have broad discretion in the application of the net proceeds to us from this offering, including for any of the purposes described in the section titled “Use of Proceeds,” and you will not have the opportunity as part of your investment decision to assess whether the net proceeds are being used appropriately. Because of the number and variability of factors that will determine our use of the net proceeds from this offering, our ultimate use may vary substantially from our currently intended use. Investors will need to rely upon the judgment of our management with respect to the use of proceeds. Pending use, we may invest the net proceeds from this offering in short-term, investment-grade, interest-bearing securities, such as money market accounts, certificates of deposit, commercial paper, and guaranteed obligations of the U.S. government that may not generate a high yield for our stockholders. If we do not use the net proceeds that we receive in this offering effectively, our business, financial condition, results of operations, and prospects could be harmed, and the market price of our Class A common stock could decline.
55
Table of Contents
Future sales of our Class A common stock in the public market following this offering, including sales of a substantial number of shares of our Class A common stock by our existing stockholders, could cause the market price of our Class A common stock to decline.
Sales of a substantial number of shares of our Class A common stock in the public market following the completion of this offering, or the perception that these sales might occur, could depress the market price of our Class A common stock and could impair our ability to raise capital through the sale of additional equity securities. Many of our existing equity holders have substantial unrecognized gains on the value of the equity they hold based upon the price of this offering, and therefore they may take steps to sell their shares or otherwise secure the unrecognized gains on those shares. We are unable to predict the timing of or the effect that such sales may have on the prevailing market price of our Class A common stock.
All of our directors and officers and the holders of substantially all of our Class B common stock and securities convertible into our Class B common stock are subject to lock-up agreements that restrict their ability to transfer shares of our capital stock for 175 days from the date of this prospectus, subject to certain exceptions, provided that, up to 20% of the common stock (including common stock issuable upon exercise of vested options) held by employees and former employees (but excluding current executive officers and directors and certain members of management) may be sold beginning at the commencement of trading on the first trading day on which our common stock is listed on the NYSE and ending on the last day of the quarter following the most recent quarter for which quarterly or annual, as applicable, financial statements are included in this prospectus. Goldman Sachs & Co. LLC and J.P. Morgan Securities LLC may, in their sole discretion, permit our stockholders who are subject to these lock-up agreements to sell shares prior to the expiration of the lock-up agreements, subject to applicable notice requirements. If not earlier released, all of the shares of Class A common stock sold in this offering will become eligible for sale upon expiration of the 175-day lock-up period, except for any shares held by our affiliates as defined in Rule 144 under the Securities Act of 1933, as amended, or the Securities Act.
In addition, there were 2,208,475 shares of Class B common stock issuable upon the exercise of options outstanding as of December 31, 2020. We intend to register all of the shares of Class A common stock and Class B common stock issuable upon exercise of outstanding options or other equity incentives we may grant in the future, for public resale under the Securities Act. The shares of Class A common stock will become eligible for sale in the public market to the extent such options are exercised, subject to the lock-up agreements described above and compliance with applicable securities laws.
Further, based on shares outstanding as of December 31, 2020, holders of approximately shares, or % of our capital stock after the completion of this offering, will have rights, subject to some conditions, to require us to file registration statements covering the sale of their shares or to include their shares in registration statements that we may file for ourselves or other stockholders.
Our issuance of additional capital stock in connection with financings, acquisitions, investments, our equity incentive plans, or otherwise will dilute all other stockholders.
We expect to issue additional capital stock in the future that will result in dilution to all other stockholders. We expect to grant equity awards to employees, directors, and consultants under our equity incentive plans. We may also raise capital through equity financings in the future. As part of our business strategy, we may acquire or make investments in companies, products, or technologies and issue equity securities to pay for any such acquisition or investment. Any such issuances of additional capital stock may cause stockholders to experience significant dilution of their ownership interests and the per share value of our Class A common stock to decline.
56
Table of Contents
If our operating and financial performance in any given period does not meet the guidance that we provide to the public or the expectations of investment analysts, the market price of our Class A common stock may decline.
We may, but are not obligated to, provide public guidance on our expected operating and financial results for future periods. Any such guidance will comprise forward-looking statements, subject to the risks and uncertainties described in this prospectus and in our other public filings and public statements. Our ability to provide this public guidance, and our ability to accurately forecast our results of operations, may be impacted by the COVID-19 pandemic. Our actual results may not always be in line with or exceed any guidance we have provided, especially in times of economic uncertainty, such as the current global economic uncertainty being experienced as a result of the COVID-19 pandemic. If, in the future, our operating or financial results for a particular period do not meet any guidance we provide or the expectations of investment analysts, or if we reduce our guidance for future periods, the market price of our Class A common stock may decline as well. Even if we do issue public guidance, there can be no assurance that we will continue to do so in the future.
If securities or industry analysts do not publish research or publish unfavorable or inaccurate research about our business, the market price and trading volume of our Class A common stock could decline.
The market price and trading volume of our Class A common stock following the completion of this offering will be heavily influenced by the way analysts interpret our financial information and other disclosures. We do not have control over these analysts. If few securities analysts commence coverage of us, or if industry analysts cease coverage of us, our stock price would be negatively affected. If securities or industry analysts do not publish research or reports about our business, downgrade our Class A common stock, or publish negative reports about our business, our stock price would likely decline. If one or more of these analysts cease coverage of us or fail to publish reports on us regularly, demand for our Class A common stock could decrease, which might cause our stock price to decline and could decrease the trading volume of our Class A common stock.
You will experience immediate and substantial dilution in the net tangible book value of the shares of Class A common stock you purchase in this offering.
The initial public offering price of our Class A common stock will be substantially higher than the pro forma net tangible book value per share of our Class A common stock immediately after this offering. If you purchase shares of our Class A common stock in this offering, you will suffer immediate dilution of $ per share, or $ per share if the underwriters exercise their over-allotment option in full, representing the difference between our pro forma as adjusted net tangible book value per share after giving effect to the sale of Class A common stock in this offering and the assumed public offering price of $ per share, the midpoint of the price range set forth on the cover page of this prospectus. See the section titled “Dilution.”
We do not intend to pay dividends for the foreseeable future and, as a result, your ability to achieve a return on your investment will depend on appreciation in the price of our Class A common stock.
We have never declared or paid any cash dividends on our capital stock, and we do not intend to pay any cash dividends in the foreseeable future. Any determination to pay dividends in the future will be at the discretion of our board of directors. Accordingly, you may need to rely on sales of our Class A common stock after price appreciation, which may never occur, as the only way to realize any future gains on your investment.
57
Table of Contents
We are an “emerging growth company” and a “smaller reporting company,” and we cannot be certain if the reduced reporting and disclosure requirements applicable to emerging growth companies and smaller reporting companies will make our Class A common stock less attractive to investors.
We are an “emerging growth company” and a “smaller reporting company,” as defined in the JOBS Act, and we may take advantage of certain exemptions from various reporting requirements that are applicable to other public companies that are not “emerging growth companies” and “smaller reporting companies,” including the auditor attestation requirements of Section 404, reduced disclosure obligations regarding executive compensation in our periodic reports and proxy statements, and exemptions from the requirements of holding a nonbinding advisory vote on executive compensation and stockholder approval of any golden parachute payments not previously approved. Pursuant to Section 107 of the JOBS Act, as an emerging growth company, we have elected to use the extended transition period for complying with new or revised accounting standards until those standards would otherwise apply to private companies. As a result, our consolidated financial statements may not be comparable to the financial statements of issuers who are required to comply with the effective dates for new or revised accounting standards that are applicable to public companies, which may make our Class A common stock less attractive to investors. In addition, if we cease to be an emerging growth company, we will no longer be able to use the extended transition period for complying with new or revised accounting standards.
We will remain an emerging growth company until the earliest of: (1) the last day of the fiscal year following the fifth anniversary of this offering; (2) the last day of the first fiscal year in which our annual gross revenue is $1.07 billion or more; (3) the date on which we have, during the previous rolling three-year period, issued more than $1 billion in non-convertible debt securities; and (4) the last day of the fiscal year in which the market value of our equity securities, which includes Class A common stock and Class B common stock held by non-affiliates exceeds $700 million as of June 30 of such fiscal year.
We may continue to be a smaller reporting company even after we are no longer an emerging growth company. We may take advantage of certain of the scaled disclosures available to smaller reporting companies and will be able to take advantage of these scaled disclosures for so long as (i) the market value of our voting and non-voting common stock held by non-affiliates is less than $250 million measured on the last business day of our second fiscal quarter or (ii) our annual revenue is less than $100 million during the most recently completed fiscal year and the market value of our voting and non-voting common stock held by non-affiliates is less than $700 million measured on the last business day of our second fiscal quarter.
We cannot predict if investors will find our Class A common stock less attractive if we choose to rely on these exemptions. For example, if we do not adopt a new or revised accounting standard, our future results of operations may not be as comparable to the results of operations of certain other companies in our industry that adopted such standards. If some investors find our Class A common stock less attractive as a result, there may be a less active trading market for our Class A common stock, and our stock price may be more volatile.
Our management team has limited experience managing a public company.
Our management team has limited experience managing a publicly-traded company, interacting with public company investors and securities analysts, and complying with the increasingly complex laws pertaining to public companies. These new obligations and constituents require significant attention from our management team and could divert their attention away from the day-to-day management of our business, which could harm our business, results of operations, and financial condition.
58
Table of Contents
We will incur increased costs as a result of operating as a public company, and our management will be required to devote substantial time to compliance with our public company responsibilities and corporate governance practices.
As a public company, we will incur significant legal, accounting, and other expenses that we did not incur as a private company, which we expect to further increase after we are no longer an “emerging growth company.” The Sarbanes-Oxley Act, the Dodd-Frank Wall Street Reform and Consumer Protection Act, the listing requirements of the NYSE and other applicable securities rules and regulations impose various requirements on public companies. Our management and other personnel devote a substantial amount of time to compliance with these requirements. Moreover, these rules and regulations will increase our legal and financial compliance costs and will make some activities more time-consuming and costly. We cannot predict or estimate the amount of additional costs we will incur as a public company or the specific timing of such costs.
Anti-takeover provisions in our charter documents and under Delaware law could make an acquisition of our company more difficult, limit attempts by our stockholders to replace or remove our current management, and limit the market price of our Class A common stock.
Provisions in our amended and restated certificate of incorporation and amended and restated bylaws, as they will be in effect upon the completion of this offering, may have the effect of delaying or preventing a change of control or changes in our management. Our amended and restated certificate of incorporation and amended and restated bylaws will include provisions that:
| ● | authorize our board of directors to issue, without further action by the stockholders, shares of undesignated preferred stock with terms, rights, and preferences determined by our board of directors that may be senior to our Class A common stock; |
| ● | require that any action to be taken by our stockholders be affected at a duly called annual or special meeting and not by written consent; |
| ● | specify that special meetings of our stockholders can be called only by our board of directors, the chairperson of our board of directors, or our chief executive officer; |
| ● | establish an advance notice procedure for stockholder proposals to be brought before an annual meeting, including proposed nominations of persons for election to our board of directors; |
| ● | establish that our board of directors is divided into three classes, with each class serving three-year staggered terms; |
| ● | prohibit cumulative voting in the election of directors; |
| ● | provide that our directors may be removed for cause only upon the vote of at least 66 2/3% of our outstanding shares of voting stock; |
| ● | provide that vacancies on our board of directors may be filled only by a majority of directors then in office, even though less than a quorum; and |
| ● | require the approval of our board of directors or the holders of at least 66 2/3% of our outstanding shares of voting stock to amend our bylaws and certain provisions of our certificate of incorporation. |
59
Table of Contents
These provisions may frustrate or prevent any attempts by our stockholders to replace or remove our current management by making it more difficult for stockholders to replace members of our board of directors, which is responsible for appointing the members of our management. In addition, because we are incorporated in Delaware, we are governed by the provisions of Section 203 of the Delaware General Corporation Law, which generally, subject to certain exceptions, prohibits a Delaware corporation from engaging in any of a broad range of business combinations with any “interested” stockholder for a period of three years following the date on which the stockholder became an “interested” stockholder. Any of the foregoing provisions could limit the price that investors might be willing to pay in the future for shares of our Class A common stock, and they could deter potential acquirers of our company, thereby reducing the likelihood that you would receive a premium for your shares of our Class A common stock in an acquisition.
Our amended and restated certificate of incorporation will designate the Court of Chancery of the State of Delaware and, to the extent enforceable, the federal district courts of the United States of America as the exclusive forums for substantially all disputes between us and our stockholders, which will restrict our stockholders’ ability to choose the judicial forum for disputes with us or our directors, officers, or employees.
Our amended and restated certificate of incorporation, as will be in effect upon the completion of this offering, will provide that the Court of Chancery of the State of Delaware is the exclusive forum for the following types of claims or causes of action under Delaware statutory or common law: any derivative claims or causes of action brought on our behalf; any claims or causes of action asserting a breach of a fiduciary duty; any action asserting a claim against us arising pursuant to the Delaware General Corporation Law, our amended and restated certificate of incorporation, or our amended and restated bylaws; or any action asserting a claim against us that is governed by the internal affairs doctrine. The provisions would not apply to suits brought to enforce a duty or liability created by the Exchange Act. In addition, our amended and restated certificate of incorporation will provide that the federal district courts of the United States of America will be the exclusive forum for resolving any complaint asserting a cause of action arising under the Securities Act, subject to and contingent upon a final adjudication in the State of Delaware of the enforceability of such exclusive forum provision.
These choice of forum provisions may limit a stockholder’s ability to bring a claim in a judicial forum that it finds favorable for disputes with us or our directors, officers, or other employees. If a court were to find either choice of forum provision contained in our amended and restated certificate of incorporation to be inapplicable or unenforceable in an action, we may incur additional costs associated with resolving such action in other jurisdictions. For example, the Court of Chancery of the State of Delaware recently determined that the exclusive forum provision of federal district courts of the United States of America for resolving any complaint asserting a cause of action arising under the Securities Act is not enforceable.
60
Table of Contents
SPECIAL NOTE REGARDING FORWARD-LOOKING STATEMENTS
This prospectus contains forward-looking statements about us and our industry that involve substantial risks and uncertainties. All statements other than statements of historical facts contained in this prospectus, including statements regarding our future results of operations or financial condition, business strategy and plans and objectives of management for future operations, are forward-looking statements. In some cases, you can identify forward-looking statements because they contain words such as “anticipate,” “believe,” “contemplate,” “continue,” “could,” “estimate,” “expect,” “intend,” “may,” “plan,” “potential,” “predict,” “project,” “should,” “target,” “will,” or “would” or the negative of these words or other similar terms or expressions. These forward-looking statements include, but are not limited to, statements concerning the following:
| ● | our expectations regarding our revenue, expenses, and other operating results; |
| ● | the durability of the growth we have experienced in the near term due to COVID-19 and the associated shelter-in-place orders on consumer preferences for digital ordering and customer adoption of multi-modules as COVID-19 associated restrictions abate; |
| ● | our ability to acquire new customers and successfully retain existing customers; |
| ● | our ability to increase usage of our platform and upsell and cross sell additional modules; |
| ● | our ability to achieve or sustain our profitability; |
| ● | the effects of COVID-19 and the associated global economic uncertainty or other public health crises; |
| ● | future investments in our business, our anticipated capital expenditures, and our estimates regarding our capital requirements; |
| ● | the loss or decline in revenue from any of our largest customers and our resulting financial condition; |
| ● | our ability to compete effectively with existing competitors and new market entrants; |
| ● | the costs and success of our sales and marketing efforts, and our ability to promote our brand; |
| ● | our reliance on key personnel and our ability to identify, recruit, and retain skilled personnel; |
| ● | our ability to effectively manage our growth, including any international expansion; |
| ● | our ability to protect our intellectual property rights and any costs associated therewith; and |
| ● | the growth rates of the markets in which we compete. |
You should not rely on forward-looking statements as predictions of future events. We have based the forward-looking statements contained in this prospectus primarily on our current expectations and projections about future events and trends that we believe may affect our business, financial condition and operating results. The outcome of the events described in these forward-looking statements is subject to risks, uncertainties and other factors described in the section titled “Risk Factors” and elsewhere in this prospectus. Moreover, we operate in a very competitive and rapidly changing environment. New risks and uncertainties emerge from time to time, and it is not possible for us to predict all risks and uncertainties that could have an impact on the forward-looking statements contained in this prospectus. The results, events and circumstances reflected in the forward-looking statements may not be achieved or occur, and actual results, events or circumstances could differ materially from those described in the forward-looking statements.
61
Table of Contents
In addition, statements that “we believe” and similar statements reflect our beliefs and opinions on the relevant subject. These statements are based on information available to us as of the date of this prospectus. And while we believe that information provides a reasonable basis for these statements, that information may be limited or incomplete. Our statements should not be read to indicate that we have conducted an exhaustive inquiry into, or review of, all relevant information. These statements are inherently uncertain, and investors are cautioned not to unduly rely on these statements.
The forward-looking statements made in this prospectus relate only to events as of the date on which the statements are made. We undertake no obligation to update any forward-looking statements made in this prospectus to reflect events or circumstances after the date of this prospectus or to reflect new information or the occurrence of unanticipated events, except as required by law. We may not actually achieve the plans, intentions, or expectations disclosed in our forward-looking statements, and you should not place undue reliance on our forward-looking statements. Our forward-looking statements do not reflect the potential impact of any future acquisitions, mergers, dispositions, joint ventures, or investments.
62
Table of Contents
MARKET, INDUSTRY, AND OTHER DATA
This prospectus contains estimates, projections, and other information concerning our industry, our business, and the markets for our products. Some market data and statistical information contained in this prospectus are also based on management’s estimates and calculations, which are derived from our review and interpretation of the independent sources listed below, our internal research, and knowledge of our market. This information involves a number of assumptions and limitations, and you are cautioned not to give undue weight to these estimates. In addition, projections, assumptions, and estimates of the future performance of the industry in which we operate and our future performance are necessarily subject to uncertainty and risk due to a variety of factors, including those described in the sections titled “Risk Factors” and “Special Note Regarding Forward-Looking Statements.” These and other factors could cause results to differ materially from those expressed in the projections and estimates made by the independent third parties and us.
Unless otherwise expressly stated, we obtained industry, business, market, and other data from the reports, publications and other materials and sources listed below. In some cases, we do not expressly refer to the sources from which this data is derived. In that regard, when we refer to one or more sources of this type of data in any paragraph, you should assume that other data of this type appearing in the same paragraph is derived from the same sources, unless otherwise expressly stated or the context otherwise requires.
63
Table of Contents
We estimate that we will receive net proceeds from this offering of approximately $ million (or approximately $ million if the underwriters exercise their option to purchase additional shares of our Class A common stock from us) based on an assumed initial public offering price of $ per share of Class A common stock, the midpoint of the estimated price range set forth on the cover page of this prospectus, after deducting estimated underwriting discounts and commissions and estimated offering expenses payable by us.
A $1.00 increase (decrease) in the assumed initial public offering price of $ per share of Class A common stock, the midpoint of the estimated price range set forth on the cover page of this prospectus, would increase (decrease) the net proceeds to us from this offering by approximately $ million, assuming the number of shares of Class A common stock offered by us, as set forth on the cover page of this prospectus, remains the same, and after deducting estimated underwriting discounts and commissions. Similarly, each increase (decrease) of 1,000,000 shares in the number of shares of Class A common stock offered by us would increase (decrease) the net proceeds to us from this offering by approximately $ million, assuming the assumed initial public offering price of $ per share of Class A common stock remains the same, and after deducting estimated underwriting discounts and commissions.
The principal purposes of this offering are to increase our capitalization and financial flexibility, to create a public market for our Class A common stock, and to facilitate our future access to the capital markets. As of the date of this prospectus, we cannot specify with certainty all of the particular uses for the net proceeds we receive from this offering. However, we currently intend to use the net proceeds we receive from this offering for general corporate purposes, including working capital, operating expenses, and capital expenditures. We may also use a portion of the net proceeds we receive from this offering to acquire complementary businesses, products, services, or technologies. However, we do not have agreements or commitments to enter into any acquisitions at this time.
We will have broad discretion over how to use the net proceeds we receive from this offering. We intend to invest the net proceeds we receive from the offering that are not used as described above in investment-grade, interest-bearing instruments.
64
Table of Contents
We have never declared or paid cash dividends on our capital stock. We currently intend to retain all available funds and future earnings, if any, to fund the development and expansion of our business, and we do not anticipate paying any cash dividends in the foreseeable future. In addition, our loan and security agreement with Pacific Western Bank contains restrictive covenants that prohibit us, subject to certain exceptions, from paying dividends on our Class A common stock and Class B common stock, and future debt securities or other financing arrangements could contain similar or more restrictive negative covenants. Any future determination regarding the declaration and payment of dividends, if any, will be at the discretion of our board of directors and will depend on then-existing conditions, including our financial condition, operating results, contractual restrictions, including in our then-existing debt arrangements, capital requirements, business prospects, and other factors our board of directors may deem relevant.
65
Table of Contents
The following table sets forth our cash and capitalization as of December 31, 2020:
| ● | on an actual basis; |
| ● | on a pro forma basis, giving effect to (1) the reclassification of all outstanding shares of our common stock into an equivalent number of shares of our Class B common stock, (2) the automatic conversion of all outstanding shares of redeemable convertible preferred stock into an aggregate of 5,230,827 shares of Class B common stock, (3) the reclassification of our redeemable convertible preferred stock warrant liability to additional paid-in capital in connection with this offering with respect warrants to purchase 98,991 shares of our outstanding redeemable convertible preferred stock, 90,071 will be exercised in connection with this offering and 8,920 will remain outstanding and convert into warrants to purchase our Class B common stock, and (4) the filing and effectiveness of our amended and restated certificate of incorporation, each of which will occur immediately prior to the completion of this offering; and |
| ● | on a pro forma as adjusted basis, giving effect to (1) the pro forma adjustments described above and (2) our receipt of estimated net proceeds from the sale of shares of Class A common stock that we are offering at an assumed initial public offering price of $ per share, the midpoint of the price range set forth on the cover page of this prospectus, after deducting the estimated underwriting discounts and commissions and estimated offering expenses payable by us. |
66
Table of Contents
You should read this table together with the section titled “Management’s Discussion and Analysis of Financial Condition and Results of Operations” and our financial statements and related notes included elsewhere in this prospectus.
| As of December 31, 2020 | ||||||||||||
| Actual | Pro Forma | Pro Forma As Adjusted |
||||||||||
| (in thousands, except share and per share amounts) | ||||||||||||
| Cash and cash equivalents |
$ | 75,756 | $ | $ | ||||||||
|
|
|
|
|
|
|
|||||||
| Long-term debt, including current portion |
||||||||||||
| Redeemable convertible preferred stock, $0.001 par value, 3,559,380 shares authorized, 3,468,397 shares issued and outstanding, actual, and no shares authorized, issued and outstanding, pro forma and pro forma as adjusted |
111,737 | |||||||||||
| Redeemable convertible preferred stock warrant liability |
19,735 | |||||||||||
| Stockholders’ (deficit) equity: |
||||||||||||
| Preferred stock, $0.001 par value, shares authorized, issued, and outstanding, actual, and shares authorized, no shares issued and outstanding, pro forma and pro forma as adjusted |
||||||||||||
| Common stock, $0.001 par value, 9,500,000 shares authorized, 1,312,958 shares issued and outstanding, actual, and shares authorized, and shares issued and outstanding, pro forma, and shares authorized, and shares issued and outstanding, pro forma as adjusted |
1 | |||||||||||
| Class A common stock, $0.001 par value, shares authorized, issued and outstanding, actual, shares authorized and shares issued and outstanding, pro forma, shares authorized and shares issued and outstanding, pro forma as adjusted |
||||||||||||
| Class B common stock, $0.001 par value, shares authorized, issued and outstanding, actual, shares authorized and shares issued and outstanding, pro forma and pro forma as adjusted |
||||||||||||
| Additional paid-in capital |
|
16,819 |
|
|||||||||
| Accumulated Deficit |
(69,301 | ) | ||||||||||
|
|
|
|
|
|
|
|||||||
| Total stockholders’ (deficit) equity |
$ | (52,481 | ) | $ | $ | |||||||
|
|
|
|
|
|
|
|||||||
| Total capitalization |
$ | 78,991 | $ | $ | ||||||||
|
|
|
|
|
|
|
|||||||
A $1.00 increase (decrease) in the assumed initial public offering price of $ per share of Class A common stock, the midpoint of the estimated price range set forth on the cover page of this prospectus, would increase (decrease) each of our pro forma as adjusted cash and cash equivalents, additional paid-in capital, total stockholders’ (deficit) equity and total capitalization by approximately $ million, assuming the number of shares of Class A common stock offered by us, as set forth on the cover page of this prospectus, remains the same, and after deducting estimated underwriting
67
Table of Contents
discounts and commissions. Similarly, each increase (decrease) of 1,000,000 shares in the number of shares of Class A common stock offered by us would increase (decrease) each of our pro forma as adjusted cash and cash equivalents, additional paid-in capital, total stockholders’ (deficit) equity and total capitalization by approximately $ million, assuming the assumed initial public offering price of $ per share of Class A common stock remains the same, and after deducting estimated underwriting discounts and commissions.
The number of shares of common stock that will be outstanding after this offering is based on no shares of Class A common stock and 7,210,075 shares of Class B common stock outstanding as of December 31, 2020, and excludes:
| ● | 482,079 shares and 1,821,535 shares of Class B common stock issuable upon the exercise of stock options outstanding as of December 31, 2020 under our 2005 Equity Incentive Plan, or 2005 Plan, and our 2015 Equity Incentive Plan, or 2015 Plan, respectively, with a weighted-average exercise price of $2.69 per share and $40.75 per share, respectively; |
| ● | 386,940 shares of Class B common stock issuable upon the exercise of outstanding stock options issued after December 31, 2020 pursuant to our 2015 Plan, with a weighted average exercise price of $165.32 per share; |
| ● | 8,920 shares of Class B common stock issuable upon the exercise of a warrant to purchase preferred stock, which will become a warrant to purchase shares of common stock upon the closing of this offering, at a weighted-average exercise price of $2.80 per share; |
| ● | 96,853 shares of Class B common stock issuable upon the exercise of outstanding stock appreciation rights issued pursuant to our 2015 Plan which will become vested upon the completion of this offering; |
| ● | shares of Class A common stock reserved for future issuance under our 2021 Equity Incentive Plan, or 2021 Plan, which will become effective in connection with this offering, as well as any future increases, including annual automatic evergreen increases, in the number of shares of Class A common stock reserved for issuance thereunder, and any shares underlying outstanding stock awards granted under our 2005 Plan or our 2015 Plan that expire or are repurchased, forfeited, cancelled or withheld, as more fully described in the section titled “Executive Compensation—Equity Incentive Plans”; |
| ● | shares of Class A common stock reserved for issuance under our 2021 Employee Stock Purchase Plan, or ESPP, as well as any future increases, including annual automatic evergreen increases, in the number of shares of Class A common stock reserved for future issuance under our ESPP; and |
| ● | shares of our Class A common stock that we plan to donate to a donor-advised fund after the completion of this offering, as more fully described in “Business—Social Responsibility and Community Initiatives.” |
68
Table of Contents
If you invest in our Class A common stock in this offering, your interest will be diluted to the extent of the difference between the initial public offering price per share of Class A common stock and the pro forma as adjusted net tangible book value per share immediately after this offering.
Our pro forma net tangible book value as of December 31, 2020 was $ million, or $ per share of common stock. Our pro forma net tangible book value per share represents the amount of our total tangible assets less our total liabilities, divided by the number of our shares of Class A common stock and Class B common stock outstanding as of December 31, 2020, after giving effect to (1) the reclassification of all outstanding shares of our common stock into an equivalent number of shares of our Class B common stock, (2) the automatic conversion of all outstanding shares of redeemable convertible preferred stock into an aggregate of 5,230,827 shares of Class B common stock, and (3) the reclassification of our redeemable convertible preferred stock warrant liability to additional paid-in capital in connection with this offering with respect warrants to purchase 98,991 shares of our outstanding redeemable convertible preferred stock, 90,071 will be exercised in connection with this offering and 8,920 will remain outstanding and convert into warrants to purchase our Class B common stock.
After giving effect to the sale by us of shares of Class A common stock in this offering at an assumed initial public offering price of $ per share, the midpoint of the estimated price range set forth on the cover page of this prospectus, and after deducting estimated underwriting discounts and commissions and estimated offering expenses payable by us, our pro forma as adjusted net tangible book value as of December 31, 2020 would have been $ million, or $ per share. This amount represents an immediate increase in pro forma net tangible book value of $ per share to our existing stockholders and an immediate dilution in pro forma net tangible book value of $ per share to new investors purchasing Class A common stock in this offering. We determine dilution by subtracting the pro forma as adjusted net tangible book value per share after this offering from the initial public offering price per share paid by investors purchasing Class A common stock in this offering. The following table illustrates this dilution on a per share basis:
| Assumed initial public offering price per share |
$ | |||||||
| Pro forma net tangible book value per share as of December 31, 2020 |
$ | |||||||
| Increase in pro forma as adjusted net tangible book value per share attributable to new investors purchasing shares of Class A common stock in this offering |
||||||||
|
|
|
|||||||
| Pro forma as adjusted net tangible book value per share after giving effect to this offering |
||||||||
|
|
|
|||||||
| Dilution in pro forma net tangible book value per share to new investors in this offering |
$ | |||||||
|
|
|
The dilution information discussed above is illustrative only and may change based on the actual initial public offering price and other terms of this offering. A $1.00 increase (decrease) in the assumed initial public offering price of $ per share of Class A common stock, the midpoint of the estimated price range set forth on the cover page of this prospectus, would increase (decrease) our pro forma as adjusted net tangible book value per share after this offering by $ per share and increase (decrease) the dilution to new investors by $ per share, in each case assuming the number of shares of Class A common stock offered by us, as set forth on the cover page of this prospectus, remains the same, and after deducting estimated underwriting discounts and commissions. Similarly, each increase (decrease) of 1,000,000 shares in the number of shares of Class A common stock offered by us would increase (decrease) our pro forma as adjusted net tangible book value by approximately $ per share and increase (decrease) the dilution to new investors by
69
Table of Contents
approximately $ per share, assuming the assumed initial public offering price of $ per share of Class A common stock remains the same, and after deducting estimated underwriting discounts and commissions.
If the underwriters exercise their option to purchase additional shares of Class A common stock from us in full, our pro forma as adjusted net tangible book value would be $ per share, and the dilution in pro forma net tangible book value per share to new investors in this offering would be $ per share.
The following table summarizes, as of December 31, 2020, on a pro forma as adjusted basis as described above, the number of shares of our common stock, the total consideration and the average price per share (1) paid to us by existing stockholders and (2) to be paid by new investors acquiring our Class A common stock in this offering at an assumed initial public offering price of $ per share, the midpoint of the estimated price range set forth on the cover page of this prospectus, before deducting estimated underwriting discounts and commissions and estimated offering expenses payable by us.
| Shares Purchased | Total Consideration | Average Price Per Share |
||||||||||||||||||
| Number | Percent | Amount | Percent | |||||||||||||||||
| Existing stockholders |
% | % | ||||||||||||||||||
| New investors |
||||||||||||||||||||
|
|
|
|
|
|
|
|
|
|||||||||||||
| Totals |
100.0 | % | $ | 100.0 | % | |||||||||||||||
|
|
|
|
|
|
|
|
|
|||||||||||||
Each $1.00 increase (decrease) in the assumed initial public offering price of $ per share, the midpoint of the estimated price range set forth on the cover page of this prospectus, would increase (decrease) the total consideration paid by new investors and total consideration paid by all stockholders by approximately $ million, assuming that the number of shares of Class A common stock offered by us, as set forth on the cover page of this prospectus, remains the same and after deducting estimated underwriting discounts and commissions.
The number of shares of Class A common stock and Class B common Stock that will be outstanding after this offering is based on no shares of Class A common stock and 7,210,075 shares of Class B common stock outstanding as of December 31, 2020, and excludes:
| ● | 482,079 shares and 1,821,535 shares of Class B common stock issuable upon the exercise of stock options outstanding as of December 31, 2020 under our 2005 Equity Incentive Plan, or 2005 Plan, and our 2015 Equity Incentive Plan, or 2015 Plan, respectively, with a weighted-average exercise price of $2.69 per share and $40.75 per share, respectively; |
| ● | 386,940 shares of Class B common stock issuable upon the exercise of outstanding stock options issued after December 31, 2020 pursuant to our 2015 Plan, with a weighted average exercise price of $165.32 per share; |
| ● | 8,920 shares of Class B common stock issuable upon the exercise of a warrant to purchase Series A-1 Preferred Stock, which will become a warrant to purchase shares of Class B common stock upon the closing of this offering, at a weighted-average exercise price of $2.80 per share; |
| ● | 96,853 shares of Class B common stock issuable upon the exercise of outstanding stock appreciation rights issued pursuant to our 2015 Plan which will become vested upon the completion of this offering; |
70
Table of Contents
| ● | shares of Class A common stock reserved for future issuance under our 2021 Equity Incentive Plan which will become effective in connection with this offering, as well as any future increases, including annual automatic evergreen increases, in the number of shares of common stock reserved for issuance thereunder, and any shares underlying outstanding stock awards granted under our 2005 Plan or our 2015 Plan that expire or are repurchased, forfeited, cancelled or withheld, as more fully described in the section titled “Executive Compensation—Equity Incentive Plans”; |
| ● | shares of Class A common stock reserved for issuance under our 2021 Employee Stock Purchase Plan, or ESPP, as well as any future increases, including annual automatic evergreen increases, in the number of shares of Class A common stock reserved for future issuance under our ESPP; and |
| ● | shares of our Class A common stock that we plan to donate to a donor-advised fund after the completion of this offering, as more fully described in “Business—Social Responsibility and Community Initiatives.” |
To the extent that any outstanding options or warrants are exercised or new options are issued under our stock-based compensation plans, or that we issue additional shares of capital stock in the future, there will be further dilution to investors participating in this offering. If all outstanding options under each of our 2005 Plan and 2015 Plan as of December 31, 2020 were exercised or settled, then our holders of our Class B common stock, including the holders of these options, would own %, and our new investors would own %, of the total number of shares of our Class A common stock outstanding following the completion of this offering.
71
Table of Contents
MANAGEMENT’S DISCUSSION AND ANALYSIS OF
FINANCIAL CONDITION AND RESULTS OF OPERATIONS
The following discussion and analysis summarizes the significant factors affecting the operating results, financial condition, liquidity, and cash flows of our company as of and for the period presented below. The following discussion and analysis should be read in conjunction with our financial statements and the related notes thereto included elsewhere in this prospectus. The discussion contains forward-looking statements, including with respect to the durability of the acceleration we have experienced in the near term on consumer preferences for digital ordering and customer adoption of multi-modules, that are based on the beliefs of management, as well as assumptions made by, and information currently available to, our management. Actual results could differ materially from those discussed in or implied by forward-looking statements as a result of various factors, including those discussed below and elsewhere in this prospectus, particularly in the sections entitled “Risk Factors” and “Special Note Regarding Forward-Looking Statements.”
Overview
Olo provides a leading cloud-based, on-demand commerce platform for multi-location restaurant brands.
Our platform powers restaurant brands’ on-demand commerce operations, enabling digital ordering and delivery, while further strengthening and enhancing the restaurants’ direct consumer relationships. Consumers today expect more on-demand convenience and personalization from restaurants, particularly through digital channels, but many restaurants lack the in-house infrastructure and expertise to satisfy this increasing demand in a cost-effective manner. Olo provides restaurants with a business-to-business-to-consumer, enterprise-grade, open SaaS platform to manage their complex digital businesses and enable fast and more personalized experiences for their customers. Our platform and application programming interfaces, or APIs, seamlessly integrate with a wide range of solutions, unifying disparate technologies across the restaurant ecosystem. Restaurant brands rely on Olo to increase their digital and in-store sales, maximize profitability, establish and maintain direct consumer relationships, and collect, protect, and leverage valuable consumer data. As a result, we nearly doubled the gross merchandise value, or GMV, which we define as the gross value of orders processed through our platform, in each of the last five years and reached nearly $14.6 billion in GMV during the year ended December 31, 2020. Our well-established platform has led many of the major publicly traded and top 50 fastest growing private restaurant brands, measured by overall sales, in the United States to work with us and has been a factor in our high gross brand retention rate. Further, industry-recognized outlets, including Restaurant Business Online, QSR Magazine, and AP News, have also deemed Olo the leading food ordering platform for the restaurant industry.
We built Olo with the goal of being the leading SaaS platform for the restaurant industry by aligning the solutions we have developed with the needs of our customers. Our platform initially focused on enabling digital ordering, through the deployment of white label on-demand commerce websites and applications, and tools for digital order management. We then expanded our platform by launching Dispatch, our delivery enablement module, and Rails, our aggregator and channel management module. We believe our solution is the only independent SaaS platform for restaurants to provide seamless digital ordering and efficient delivery enablement, offering centralized management of a restaurant’s entire digital business. The key milestones in our corporate history are the following:
| ● | 2005: Founder & CEO Noah Glass accepted $500,000 in Series A funding to start Mobo. |
| ● | 2010: We renamed our product as Olo and shifted our focus to enterprise customers. |
| ● | 2013: We surpassed $50 million in GMV and expanded our executive leadership team. |
72
Table of Contents
| ● | 2014: We surpassed $100 million in GMV, and restauranteur Danny Meyer joined our board of directors. |
| ● | 2015: We launched Dispatch, our first significant product extension. |
| ● | 2016: We surpassed $500 million in GMV. |
| ● | 2017: We launched Rails and surpassed $1 billion in GMV. |
| ● | 2018: We surpassed $2 billion in GMV. |
| ● | 2019: We reached nearly $4.6 billion in GMV. |
| ● | 2020: We reached nearly $14.6 billion in GMV. |
Leading restaurant brands trust Olo’s enterprise-grade platform for its capabilities, reliability, security, scalability, and interoperability. Our platform currently handles, on average, nearly 2 million orders per day. We continually invest in architectural improvements so our system can scale in tandem with our continued growth. Additionally, both internal and external security experts frequently test our system for vulnerabilities. We have never experienced a material breach of customer or consumer data. Our open SaaS platform integrates with over 100 restaurant technology solutions including point-of-sale, or POS, systems, aggregators, delivery service providers, or DSPs, payment processors, user experience, or UX, and user interface, or UI, providers, and loyalty programs, giving our customers significant control over the configuration and features of their distinct digital offering.
We are the exclusive direct digital ordering provider for our leading brands across all service models of the restaurant industry, including quick service, fast casual, casual, family, and snack food. Our customers include major publicly traded and the fastest growing private restaurant brands such as Chili’s, Wingstop, Shake Shack, Five Guys, and sweetgreen. As of December 31, 2020, we had approximately 400 brand customers representing over 64,000 locations using our platform. Our average initial contract length is generally three years with continuous one-year automatic renewal periods, providing visibility into our future financial performance. Our enterprise brands, meaning those brands having 50 or more locations, are also highly loyal. Over the last five years, on average nearly 99% of our enterprise brand customers, which accounted for 91% of our total active locations as of December 31, 2020, have continued using our Ordering module each year. Our customers’ digital same-store sales has increased, on average, by 44% for the month ended December 31, 2019 when compared to the month ended December 31, 2018. This trend has further accelerated over the past year, with digital same-store sales up 156% for the month ended December 31, 2020 when compared to the month ended December 31, 2019.
We have a highly efficient go-to-market model as a result of our industry thought leadership, partnership approach with our restaurant customers, and experienced enterprise sales, customer success, and deployment teams. Unlike other enterprise software businesses, where the sales team works to add a single location or division and expand to others, we enter into relationships at the brand’s corporate level and secure exclusivity across all company-owned and franchise locations. This enables us to deploy our modules across all new and existing brand locations without any additional sales and marketing costs, and upsell new offerings to the brand itself, rather than each individual location. As of December 31, 2019 and 2020, 44% and 71% of our customers used all three of our modules, respectively.
We refer to our business model as a transactional SaaS model as it includes both subscription and transaction-based revenue streams, and we designed it to align with our customers’ success. Our
73
Table of Contents
model allows our customers to forego the cost of building, maintaining, and securing their own digital ordering and delivery platforms and to retain direct relationships with their consumers while maximizing profitability. Our hybrid-pricing model provides us with a predictable revenue stream and enables us to further grow our revenue as our customers increase their digital order volume. We generate subscription revenue from our Ordering module and transaction revenue from our Rails and Dispatch modules. We charge our customers a fixed monthly subscription fee per restaurant location for access to our Ordering module. In addition, a growing portion of our customers purchase an allotment of monthly orders for a fixed monthly fee and pay us an additional fee for each excess order, which we also consider to be subscription revenue. Our transaction revenue includes revenue generated from our Rails and Dispatch modules. Customers who subscribe to our Rails and Dispatch modules pay a fee on a per transaction basis. In most cases, we also charge aggregators, channel partners, and other service providers in our ecosystem on a per transaction basis for access to our Rails and Dispatch modules. We also derive transactional revenue from other products, including Network, which allows brands to take orders from non-marketplace digital channels (e.g., Google Food Ordering, which enables restaurants to fulfill orders directly through Google search results and Maps pages). These products generate fees predominantly through revenue sharing agreements with partners. For the years ended December 31, 2018, 2019, and 2020, 93.2%, 80.8%, and 56.7% of our platform revenue was subscription revenue, respectively, and 6.8%, 19.2%, and 43.3% was transaction revenue, respectively.
Our business has experienced rapid growth in a highly capital efficient manner. Since inception 15 years ago, we have raised less than $100.0 million of primary investment capital, net of share repurchases, and as of December 31, 2020, we had cash and cash equivalents of $75.8 million with no outstanding debt. During the years ended December 31, 2018, 2019, and 2020, we generated revenue of $31.8 million, $50.7 million, and $98.4 million, respectively, representing year-over-year growth of 59.4% and 94.2%. During the years ended December 31, 2018, 2019, and 2020, we generated gross profit of $21.0 million, $35.1 million, and $79.8 million, respectively, or 66.0% , 69.3%, and 81.0% as a percentage of revenue, respectively. During the years ended December 31, 2018 and 2019, we incurred net losses of $11.6 million and $8.3 million, respectively and during the year ended December 31, 2020, we generated net income of $3.1 million. During the years ended December 31, 2018 and 2019, we incurred operating losses of $8.8 million and $5.1 million, respectively, and during the year ended December 31, 2020 we generated operating income of $16.1 million. During the years ended December 31, 2018 and 2019, we incurred non-GAAP operating losses of $4.6 million, and $0.2 million, respectively, and during the year ended December 31, 2020, we generated non-GAAP operating income of $21.8 million.
Key Factors Affecting Our Performance
Add New Large Multi-Location and High-Growth Restaurant Brands
We believe there is a substantial opportunity to continue to grow our customer base across the U.S. restaurant industry, adding to our approximately 400 existing brands across more than 64,000 active locations. We consider each specific restaurant brand to be a customer, even if owned by a parent organization that owns multiple restaurant brands, and define active locations as a location where at least one of our modules is deployed. Our active locations increased 19% for the period from December 31, 2018 to December 31, 2019. The following year, our active locations increased 53% for the period from December 31, 2019 to December 31, 2020. We intend to continue to drive new customer growth by leveraging our brand and experience within the industry, and expanding our sales and marketing efforts. We have also historically pursued and will continue to target the most well-capitalized, fastest-growing restaurant brands in the industry. Our ability to attract new customers will depend on a number of factors, including our ability to innovate, the effectiveness and pricing of our new and existing modules, the growth of digital ordering, and the success of our marketing efforts.
74
Table of Contents
Expand Within Our Existing Customer Base
Our large base of enterprise customers and transactional SaaS revenue model represent an opportunity for further revenue expansion from the sale of additional modules, and the addition of new restaurant locations. A key factor to our success in executing our expansion strategy will be our ability to retain our existing and future restaurant customers. Our exclusive, long-term, direct digital ordering contracts with our customers provide us the opportunity to form unique, trusted partnerships with our restaurant brands, further enhancing our ability to satisfy and retain our customers. Our average initial contract length is generally three years, providing visibility into our future performance. Over the last five years, on average nearly 99% of our enterprise brand customers have continued to use our Ordering module each year.
As of December 31, 2019 and 2020, 44% and 71% of our customers used all three of our modules, respectively. We believe this demonstrates a continued opportunity to further increase revenue within our existing customer base by expanding and deploying additional modules. We believe that we are well-positioned to upsell our remaining customers, as our modules provide significant value, are simple to add, and operate seamlessly together. In addition, we intend to continue to work with our existing brand customers in implementing their digital strategies, which we expect will promote continued growth. In addition, our average revenue per location in 2020 was approximately $1,760, which we calculate by dividing the total platform revenue in a given period by the average active locations in that same period. We believe this demonstrates our ability to grow within our customer base through the development of our products that our customers value.
We work to build relationships with the fastest growing restaurant brands in the industry, enabling us to grow our revenue as our customers scale their locations. As our customers expand locations, we are well positioned to expand to new locations beyond the existing 64,000 active locations that we serve. Our contracts with our customers provide that our modules are implemented across an entire restaurant chain, growing as our customers expand locations. Our ability to increase sales to existing customers will depend on a number of factors, including our customers’ satisfaction with our platform, competition, pricing, and overall shift in the market to digital ordering and delivery.
We have a history of growing with our customers as they increase their annual spend with us over time. The chart below illustrates the total revenue generated within a given cohort over the years presented. All brands from which we received revenue for the first time at any time prior to January 1, 2017 are grouped as a single cohort. Each other cohort represents brands from which we received revenue for the first time in a given fiscal year. For example, the fiscal year 2018 cohort represents all brands who earned revenue for the first time at any point between January 1, 2018 and December 31, 2018. We have seen significant expansion across all of our cohorts, even from brands that have been customers prior to 2017. For example, the fiscal year 2018 cohort increased its initial revenue from approximately $3.0 million to approximately $21.0 million in fiscal year 2020, representing an increase of approximately 700%. We expect cohort revenue will fluctuate from one period to another depending on, among other factors, our ability to increase revenue generated by the brands within a given cohort and other changes to products and services we offer to such brands. While we believe these cohorts are a fair representation of our overall customer base, there is no assurance that they will be representative of any future group of brands or periods.
75
Table of Contents
EXPANDING CUSTOMER COHORTS
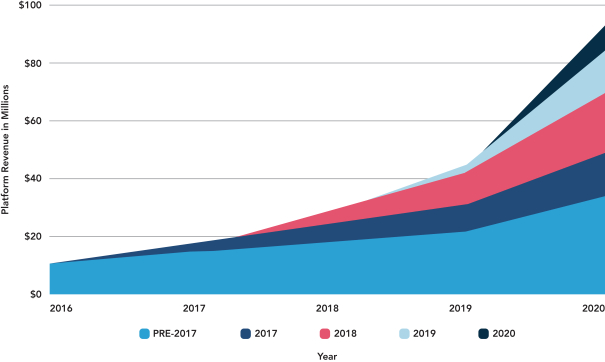
A further indication of the propensity of our customers to continue to work with and expand their relationship with us over time is our dollar-based net revenue retention, which compares our revenue from the same set of active customers in one period to the prior year period. For the years ended December 31, 2018, 2019, and 2020, our dollar-based net revenue retention was above 120% for each fiscal quarter. We calculate dollar-based net revenue retention as of a period-end by starting with the revenue from the cohort of all active customers as of 12 months prior to such period-end, or the prior period revenue. Revenue is defined as all platform revenue. We define active customers as those that generate platform revenue in all three months within a given quarterly period. We then calculate the platform revenue from these same customers as of the current period-end, or the current period revenue. Current period revenue includes any expansion and is net of contraction or attrition over the last 12 months, but excludes platform revenue from new customers in the current period. We then divide the total current period revenue by the total prior period revenue to arrive at the point-in-time dollar-based net revenue retention. While we have maintained this high net revenue retention over the past three years, we expect this number to decrease over time as our customer base matures. We are also seeing a trend where customers are purchasing all of our products at signing, which provides us with more platform revenue from the start, but leaves less room for expansion.
Enable Higher Transaction Volume
Transaction revenue will continue to be an important source of our growth. We intend to continue to work with our existing restaurant customers to enable higher transaction volume at their locations, which may enable us to generate additional subscription and transaction revenue. As on-demand commerce grows to represent a larger share of total off-premise food consumption, we expect to significantly benefit from this secular trend as we capture a portion of this increased on-demand commerce order volume. Not only does our software create the opportunity to drive more orders for our customers, but we also expect that the industry’s secular tailwinds will help increase transaction order volume as more consumers order food for off-premise consumption. As transaction volume
76
Table of Contents
increases, the subscription revenue we receive from our Ordering module may also increase as customers subscribe for higher tier ordering packages to enable more transactions. We evaluate our ability to drive increased transaction revenue by measuring digital same-store sales growth for our customers. Our customers’ digital same-store sales has increased, on average, by 44% for the month ended December 31, 2019 when compared to the month ended December 31, 2018. This trend has further accelerated over the past year, with digital same-store sales up 156% for the month ended December 31, 2020 when compared to the month ended December 31, 2019. We measure digital same-store sales by measuring the GMV for a given active restaurant brand location as compared to the GMV for the equivalent monthly period in the prior year. To determine same-store sales, we exclude locations that were not active in either the prior or current period. We believe that digital same-store sales growth is reflective of the future revenue opportunity inherent in our transactional SaaS revenue model because we expect our transaction revenue from our Rails and Dispatch modules to increase as the number of transactions and total GMV on our platform increases. In addition, as we continue to expand our product offerings and improve our current software, we also believe that we may be able to increase our share of the transaction revenue that flows through our platform. Our ability to increase transaction volume is dependent on the continued shift to digital ordering for off-premise food consumption and our ability to capture a meaningful portion of that shift. See “Components of Results of Operations — Revenue” for a further discussion of the impact of COVID- 19 and the associated shelter-in-place orders on our business.
Investment in Innovation and Growth
We have invested and intend to continue to invest in expanding the functionality of our current platform and broadening our capabilities to address new market opportunities, particularly around payments, catering, and data analytics. We also intend to continue to invest in enhancing awareness of our brand and developing more modules, features, and functionality that expand our capabilities to facilitate the extension of our platform to new use cases and industry verticals. We believe this strategy will provide new avenues for growth and allow us to continue to deliver differentiated, high-value outcomes to both our customers and stockholders. Specifically, we intend to invest in research and development to expand existing and build new modules, sales and marketing to promote our modules to new and existing customers and in existing and expanded geographies, professional services to ensure the success of our customers’ implementations of our platform, and other operational and administrative functions to support our expected growth and our transition to a public company. We expect our total operating expenses will increase over time and, in some cases, have short-term negative impacts on our operating margin. We also intend to continue to evaluate strategic acquisitions and investments in businesses and technologies to drive product and market expansion. Our future success is dependent, in part, on our ability to successfully develop, market, and sell new and existing modules to new and existing customers.
Grow Our Ecosystem
We plan to expand our current ecosystem of third-party partners to better support our customers. Our platform is highly configurable and deeply embedded into our customers’ disparate existing infrastructures. Our platform seamlessly integrates with technology providers across the restaurant ecosystem, including most POS systems, DSPs, aggregators, payment processors, and loyalty programs. We believe that we can leverage these unique partnerships to deliver additional value to our customers. We see opportunity to further broaden our partnership group and build upon the integrations we currently offer. We plan to continue to invest and expand our ecosystem of compatible third-party technology providers to allow us to service a broader network of restaurant brands. We believe that these technology partnerships make us a critical component for restaurant brands looking to enhance their digital ordering and delivery platforms. We intend to continue to invest in building functionality that further integrates our platform with additional third-party technology providers, which expands our capabilities and facilitates the extension of our platform to new use cases
77
Table of Contents
and industry verticals. Our future success is dependent on our ability to continue to integrate with third-party technology providers in the restaurant ecosystem.
Expand Our Longer-Term Market Opportunity
While we have not made any significant investments in this area to date, we believe there is an opportunity to partner with small and medium businesses to enable their on–demand commerce presence. Additionally, as many of our customers operate internationally, we believe there is a significant opportunity to expand the usage of our platform outside of the United States. We also believe that our platform can be applied to other commerce verticals beyond the restaurant industry that are undergoing a similar digital transformation to deliver real-time experiences and on-demand fulfillment to consumers. For example, we currently partner with a number of grocery chains who use our Ordering module to help their consumers order ready-to-eat meals and may potentially expand these or other partnerships in the future. We anticipate that our operating expenses will increase as a result of these initiatives.
Components of Results of Operations
Revenue
We generate revenue primarily from platform fees and professional services.
Platform
Platform revenue primarily consists of fees that provide customers access to one or more of our modules and standard customer support. Our contracts typically begin with a minimum three-year term and auto-renew on an annual basis thereafter. We bill monthly in arrears. A majority of our platform revenue is derived from subscription fees from our Ordering module. Customers with subscriptions to our Ordering module can pay either a monthly flat fee or a reduced flat fee with a minimum, fixed number of monthly orders for a monthly fee once active with a module. Customers who elect the fixed number of monthly orders pay an additional fee for each excess order, which is also treated as subscription revenue.
We also generate platform revenue primarily from transaction revenue from our Rails, Dispatch, and other modules. Customers who subscribe to our Rails and Dispatch modules pay a fee on a per transaction basis. We may also charge third-party aggregators and other service providers in our ecosystem a per transaction fee for access to our Rails and Dispatch modules.
For the years ended December 31, 2018, 2019 and 2020, Rails module transaction revenue from our largest digital ordering aggregator, DoorDash, accounted for an aggregate of 2.6%, 10.2%, and 19.3% of our total revenue, respectively, and this digital ordering aggregator accounted for a substantial majority of our transaction revenue from our Rails module during the years ended December 31, 2018, 2019, and 2020.
With the onset of COVID-19, we began to see an increase in transaction volumes as consumers turned to online ordering as compared to in-person dining. This shift began at end of the first quarter of 2020 and continued through the balance of 2020. We also experienced an increase in our penetration of our Rails and Dispatch modules, as evidenced by an increase from 44% in 2019 to 71% in 2020 of our customers using all three of our modules. The combination of increased transaction volumes and increased multi-module adoption resulted in an increase in transaction revenue as a percentage of platform revenue. For the years ended December 31, 2018, 2019, and 2020, 93.2%, 80.8%, and 56.7% of our platform revenue was subscription revenue, respectively, and 6.8%, 19.2%, and 43.3% was transaction revenue, respectively. While we have benefited from the acceleration of
78
Table of Contents
demand for off-premise dining, our business and financial results could be materially adversely affected in the future if these trends do not continue. For example, as the effects of shelter-in-place orders abate with the roll-out of vaccines in the United States and consumers potentially return to pre-COVID digital ordering preferences and habits, the trends we experienced in 2020 on multi-module adoption and transaction volume may not continue and our revenue may fluctuate in the near term.
Professional Services and Other
Professional services and other revenue primarily consists of fees paid to us by our customers for the implementation of our platform. The majority of our professional service fees are billed on a fixed fee basis upon execution of our agreement.
Cost of Revenues
Platform
Platform cost of revenue primarily consists of costs directly related to our platform services, including expenses for customer support and infrastructure personnel, including salaries, taxes, benefits, bonuses, and stock-based compensation, which we refer to as personnel costs, third-party software licenses, hosting, amortization of internal-use software, and allocated overhead. We expect platform cost of revenue to increase in absolute dollars in order to support additional customer and transaction volume growth on our platform and decline as a percent of revenue over time.
Professional Services and Other
Professional services and other cost of revenue primarily consists of the personnel costs of our deployment team associated with delivering these services and allocated overhead.
Gross Profit
Gross profit, or revenue less cost of revenue, has been, and will continue to be, affected by various factors, including revenue fluctuations, our mix of revenue associated with various modules, the timing and amount of investments in personnel, increased hosting capacity to align with customer growth, and third-party licensing costs.
Operating Expenses
Our operating expenses consist of research and development, general and administrative, and sales and marketing expenses. Personnel costs are the most significant component of operating expenses.
Research and Development
Research and development expenses primarily consist of engineering and product development personnel costs and allocated overhead costs. Research and development costs exclude capitalized software development costs as they are capitalized as a component of property and equipment, net and amortized to platform cost of revenue over the term of their useful life. We expect our research and development expenses to increase in absolute dollars and as a percentage of revenue in the near term as we hire additional personnel and continue to make investments to innovate our platform and add additional modules.
79
Table of Contents
General and Administrative
General and administrative expenses primarily consist of personnel costs and contractor fees for finance, legal, human resources, information technology, and other administrative functions. In addition, general and administrative expenses include insurance and travel-related expenses and allocated overhead. We expect our general and administrative expenses to increase on an absolute dollar basis and as a percent of revenue in the near-term. Following the completion of this offering, we expect to incur additional general and administrative expenses as a result of operating as a public company.
Sales and Marketing
Sales and marketing expenses primarily consist of sales, marketing, and other personnel costs, commissions, general marketing and promotional activities, and allocated overhead costs. Sales commissions earned by our sales force are deferred and amortized on a straight-line basis over the expected benefit period. We plan to continue to invest in sales and marketing by expanding our go-to-market activities, hiring additional sales representatives, and sponsoring additional marketing events and trade shows. We expect our sales and marketing expenses to increase on an absolute dollar basis and as a percent of revenue.
Other Income (Expenses)
Interest Expense
Interest expense consists of interest incurred on our outstanding borrowings under our outstanding debt facility. In 2020, we amended our loan agreement for our revolving line of credit. See “Management’s Discussion and Analysis of Financial Condition and Results of Operations—Liquidity and Capital Resources.”
Other Income, Net
Other income, net consists primarily of income earned on our money-market funds in cash and cash equivalents.
Change in Fair Value of Redeemable Convertible Preferred Stock Warrant Liability
The change in the fair value of warrant liability relates to warrants issued to purchase our convertible preferred stock that are classified as liabilities on the balance sheet.
Provision for Income Taxes
Provision for income taxes primarily relates to U.S. federal and state income taxes where we conduct business.
80
Table of Contents
Results of Operations
The following table sets forth our statement of operations data for the periods indicated:
| Year Ended December 31, | ||||||||||||
| 2018 | 2019 | 2020 | ||||||||||
| (in thousands, except per share data) | ||||||||||||
| Revenue: |
||||||||||||
| Platform |
$ | 28,319 | $ | 45,121 | $ | 92,764 | ||||||
| Professional services and other |
3,480 | 5,570 | 5,660 | |||||||||
|
|
|
|
|
|
|
|||||||
| Total revenue |
31,799 | 50,691 | 98,424 | |||||||||
| Cost of revenues: |
||||||||||||
| Platform (1) |
8,722 | 11,920 | 14,334 | |||||||||
| Professional services and other (1) |
2,095 | 3,666 | 4,334 | |||||||||
|
|
|
|
|
|
|
|||||||
| Total cost of revenue |
10,817 | 15,586 | 18,668 | |||||||||
|
|
|
|
|
|
|
|||||||
| Gross profit |
20,982 | 35,105 | 79,756 | |||||||||
| Operating expenses: |
||||||||||||
| Research and development (1) |
17,123 | 21,687 | 32,907 | |||||||||
| General and administrative (1) |
8,341 | 12,157 | 22,209 | |||||||||
| Sales and marketing (1) |
4,299 | 6,351 | 8,545 | |||||||||
|
|
|
|
|
|
|
|||||||
| Total operating expenses |
29,763 | 40,195 | 63,661 | |||||||||
|
|
|
|
|
|
|
|||||||
| Income (loss) from operations |
(8,781 | ) | (5,090 | ) | 16,095 | |||||||
| Other income (expenses): |
||||||||||||
| Interest expense |
(173 | ) | (219 | ) | (157 | ) | ||||||
| Other income, net |
100 | 36 | 28 | |||||||||
| Change in fair value of warrant liability |
(2,681 | ) | (2,959 | ) | (12,714 | ) | ||||||
|
|
|
|
|
|
|
|||||||
| Total other expenses |
(2,754 | ) | (3,142 | ) | (12,843 | ) | ||||||
|
|
|
|
|
|
|
|||||||
| Income (loss) before income taxes |
(11,535 | ) | (8,232 | ) | 3,252 | |||||||
| Provision for income taxes |
17 | 26 | 189 | |||||||||
|
|
|
|
|
|
|
|||||||
| Net income (loss) and comprehensive income (loss) |
$ | (11,552 | ) | $ | (8,258 | ) | $ | 3,063 | ||||
|
|
|
|
|
|
|
|||||||
| Accretion of redeemable convertible preferred stock to redemption |
(136 | ) | (136 | ) | (70 | ) | ||||||
| Undeclared 8% non-cumulative dividend on participating securities |
— | — | (2,993 | ) | ||||||||
|
|
|
|
|
|
|
|||||||
| Net income (loss) attributable to common stockholders |
$ | (11,688 | ) | $ | (8,394 | ) | $ | — | ||||
|
|
|
|
|
|
|
|||||||
| (1) | Includes stock-based compensation expense as follows: |
| Year Ended December 31, | ||||||||||||
| 2018 | 2019 | 2020 | ||||||||||
| Cost of revenue—platform |
$ | 410 | $ | 253 | $ | 556 | ||||||
| Cost of revenue—professional services and other |
34 | 46 | 124 | |||||||||
| Research and development |
1,409 | 814 | 1,497 | |||||||||
| General and administrative |
1,928 | 3,493 | 2,827 | |||||||||
| Sales and marketing |
415 | 220 | 376 | |||||||||
|
|
|
|
|
|
|
|||||||
| Total stock-based compensation expense |
$ | 4,196 | $ | 4,826 | $ | 5,380 | ||||||
|
|
|
|
|
|
|
|||||||
81
Table of Contents
The following table sets forth our statement of operations data expressed as a percentage of total revenue for the periods indicated:
| Year Ended December 31, | ||||||||||||
| 2018 | 2019 | 2020 | ||||||||||
| Revenue: |
||||||||||||
| Platform |
89.1 | % | 89.0 | % | 94.2 | % | ||||||
| Professional services and other |
10.9 | 11.0 | 5.8 | |||||||||
|
|
|
|
|
|
|
|||||||
| Total revenue |
100.0 | 100.0 | 100.0 | |||||||||
| Cost of revenues: |
||||||||||||
| Platform |
27.4 | 23.5 | 14.6 | |||||||||
| Professional services and other |
6.6 | 7.2 | 4.4 | |||||||||
|
|
|
|
|
|
|
|||||||
| Total cost of revenue |
34.0 | 30.7 | 19.0 | |||||||||
| Gross profit |
66.0 | 69.3 | 81.0 | |||||||||
| Operating expenses: |
||||||||||||
| Research and development |
53.8 | 42.8 | 33.4 | |||||||||
| General and administrative |
26.2 | 24.0 | 22.6 | |||||||||
| Sales and marketing |
13.5 | 12.5 | 8.7 | |||||||||
|
|
|
|
|
|
|
|||||||
| Total operating expenses |
93.6 | 79.3 | 64.7 | |||||||||
|
|
|
|
|
|
|
|||||||
| Income (loss) from operations |
(27.6 | ) | (10.0 | ) | 16.4 | |||||||
| Other income (expenses): |
||||||||||||
| Interest expense |
(0.5 | ) | (0.4 | ) | (0.2 | ) | ||||||
| Other income, net |
0.3 | 0.1 | 0.0 | |||||||||
| Change in fair value of warrant liability |
(8.5 | ) | (5.9 | ) | (12.9 | ) | ||||||
|
|
|
|
|
|
|
|||||||
| Total other expenses |
(8.7 | ) | (6.2 | ) | (13.0 | ) | ||||||
|
|
|
|
|
|
|
|||||||
| Income (loss) before income taxes |
(36.3 | ) | (16.2 | ) | 3.3 | |||||||
| Provision for income taxes |
0.1 | 0.1 | 0.2 | |||||||||
|
|
|
|
|
|
|
|||||||
| Net income (loss) and comprehensive income (loss) |
(36.4 | ) | (16.3 | ) | 3.1 | |||||||
|
|
|
|
|
|
|
|||||||
| Accretion of redeemable convertible preferred stock to redemption value |
(0.4 | ) | (0.3 | ) | (0.1 | ) | ||||||
| Undeclared 8% non-cumulative dividend on participating securities |
0.0 | 0.0 | (3.0 | ) | ||||||||
|
|
|
|
|
|
|
|||||||
| Net income (loss) attributable to common stockholders |
(36.8 | )% | (16.6 | )% | 0 | % | ||||||
|
|
|
|
|
|
|
|||||||
82
Table of Contents
Comparison of the Years Ended December 31, 2018, 2019, and 2020
Revenue
| Year Ended December 31, | 2018 Change to 2019 Change |
2019 Change to 2020 Change |
||||||||||||||||||
| 2018 | 2019 | 2020 | % Change | % Change | ||||||||||||||||
| (in thousands) | ||||||||||||||||||||
| Revenue: |
||||||||||||||||||||
| Platform |
$ | 28,319 | $ | 45,121 | $ | 92,764 | 59.3 | % | 105.6 | % | ||||||||||
| Professional services and other |
3,480 | 5,570 | 5,660 | 60.1 | % | 1.6 | % | |||||||||||||
|
|
|
|
|
|
|
|
|
|
|
|||||||||||
| Total revenue |
$ | 31,799 | $ | 50,691 | $ | 98,424 | 59.4 | % | 94.2 | % | ||||||||||
2019 Compared to 2020
Platform
Total platform revenue increased $47.6 million, or 105.6%, from $45.1 million for the year ended December 31, 2019 to $92.8 million for the year ended December 31, 2020. This increase was primarily the result of additional active customer locations coming onto the platform, as well as an increase in average revenue per location. Active customer locations increased to approximately 64,000 as of December 31, 2020 from approximately 42,000 as of December 31, 2019, and average revenue per location increased to approximately $1,760 for the fiscal year ending December 31, 2020 from approximately $1,160 for the fiscal year ending December 31, 2019. For the years ended December 31, 2019 and 2020, 80.8% and 56.7% of our platform revenue was subscription revenue, respectively, and 19.2% and 43.3% was transaction revenue, respectively.
Professional Services and Other
Total professional services and other revenue increased $0.1 million, or 1.6%, from $5.6 million for the year ended December 31, 2019 to $5.7 million for the year ended December 31, 2020. This increase was primarily a result of continued deployment of additional active locations, partially offset by lower other revenue.
2018 Compared to 2019
Platform
Total platform revenue increased $16.8 million, or 59.3%, from $28.3 million for the year ended December 31, 2018 to $45.1 million for the year ended December 31, 2019. This increase was primarily the result additional active customer locations coming onto the platform, as well as increased average revenue per location. Active customer locations increased to approximately 42,000 as of December 31, 2019 from approximately 35,000 as of December 31, 2018, and average revenue per unit increased to approximately $1,160 for the fiscal year ending December 31, 2019 from approximately $930 for the fiscal year ending December 31, 2018. For the years ended December 31, 2018 and 2019, 93.2% and 80.8% of our platform revenue was subscription revenue, respectively, and 6.8% and 19.2% was transaction revenue, respectively.
Professional Services and Other
Total professional services and other revenue increased $2.1 million, or 60.1%, from $3.5 million for the year ended December 31, 2018 to $5.6 million for the year ended December 31, 2019. This increase was primarily a result of continued deployment of additional active locations and increases in other revenue.
83
Table of Contents
Cost of Revenue and Gross Margin
| Year Ended December 31, | 2018 Change to 2019 Change |
2019 Change to 2020 Change |
||||||||||||||||||
| 2018 | 2019 | 2020 | % Change | % Change | ||||||||||||||||
| (in thousands) | ||||||||||||||||||||
| Cost of revenues: |
||||||||||||||||||||
| Platform |
$ | 8,722 | $ | 11,920 | $ | 14,334 | 36.7 | % | 20.3 | % | ||||||||||
| Professional services and other |
2,095 | 3,666 | 4,334 | 75.0 | % | 18.2 | % | |||||||||||||
|
|
|
|
|
|
|
|
|
|
|
|||||||||||
| Total cost of revenue |
$ | 10,817 | $ | 15,586 | $ | 18,668 | 44.1 | % | 19.8 | % | ||||||||||
| Percentage of revenue |
34.0 | % | 30.7 | % | 19.0 | % | ||||||||||||||
2019 Compared to 2020
Platform Cost of Revenue
Total platform cost of revenue increased $2.4 million, or 20.3%, from $11.9 million for the year ended December 31, 2019 to $14.3 million for the year ended December 31, 2020. This increase was primarily the result of higher hosting costs due to increased transaction volume, as well as higher compensation costs associated with additional personnel to support growth in active locations.
Professional Services and Other Cost of Revenue
Total professional services and other cost of revenue increased $0.7 million, or 18.2%, from $3.7 million for the year ended December 31, 2019 to $4.3 million for the year ended December 31, 2020. This increase was primarily the result of higher compensation costs associated with additional personnel to support growth in active locations.
Gross Profit
Gross margin increased to 81.0% for the year ended December 31, 2020 from 69.3% for the year ended December 31, 2019. Increases in gross margin were driven by increased platform revenue and improved platform cost of revenue optimization.
2018 Compared to 2019
Platform Cost of Revenue
Total platform cost of revenue increased $3.2 million, or 36.7%, from $8.7 million for the year ended December 31, 2018 to $11.9 million for the year ended December 31, 2019. This increase was primarily the result of higher hosting costs due to increased transaction volume, as well as higher compensation costs associated with additional personnel to support growth in active locations.
Professional Services and Other Cost of Revenue
Total professional services and other cost of revenue increased $1.6 million, or 75.0%, from $2.1 million for the year ended December 31, 2018 to $3.7 million for the year ended December 31, 2019. This increase was primarily the result of higher compensation costs associated with additional personnel to support growth in active locations.
Gross Profit
Gross margin increased to 69.3% for the year ended December 31, 2019 from 66.0% for the year ended December 31, 2018.
84
Table of Contents
Operating Expenses
| Year Ended December 31, | 2018 Change to 2019 Change |
2019 Change to 2020 Change |
||||||||||||||||||
| 2018 | 2019 | 2020 | % Change | % Change | ||||||||||||||||
| (in thousands) | ||||||||||||||||||||
| Operating expenses: |
||||||||||||||||||||
| Research and development |
$ | 17,123 | $ | 21,687 | $ | 32,907 | 26.7 | % | 51.7 | % | ||||||||||
| General and administrative |
8,341 | 12,157 | 22,209 | 45.7 | % | 82.7 | % | |||||||||||||
| Sales and marketing |
4,299 | 6,351 | 8,545 | 47.7 | % | 34.5 | % | |||||||||||||
|
|
|
|
|
|
|
|
|
|
|
|||||||||||
| Total operating expenses |
$ | 29,763 | $ | 40,195 | $ | 63,661 | 35.1 | % | 58.4 | % | ||||||||||
| Percentage of revenue |
93.6 | % | 79.3 | % | 64.7 | % | ||||||||||||||
2019 Compared to 2020
Research and Development
Research and development expense increased $11.2 million, or 51.7%, from $21.7 million for the year ended December 31, 2019 to $32.9 million for the year ended December 31, 2020, primarily the result of higher compensation costs associated with additional personnel to support further investments in our platform development and continued product innovation. As a percent of total revenue, research and development expenses decreased to 33.4% for the year ended December 31, 2020 from 42.8% for the year ended December 31, 2019.
General and Administrative
General and administrative expense increased $10.1 million, or 82.7%, from $12.2 million for the year ended December 31, 2019 to $22.2 million for the year ended December 31, 2020, a result of increased compensation costs due to increased headcount to support the growth and stage of the organization, as well as, increased professional fees incurred in preparation for becoming a public company. As a percent of total revenue, general and administrative expenses decreased to 22.6% for the year ended December 31, 2020 from 24.0% for the year ended December 31, 2019.
Sales and Marketing
Sales and marketing expense increased $2.2 million, or 34.5%, from $6.4 million for the year ended December 31, 2019 to $8.5 million for the year ended December 31, 2020. This increase was primarily the result of additional compensation costs due to increases in headcount, as well as increased marketing spend associated with our annual user conference. As a percent of total revenue, sales and marketing expense decreased to 8.7% for the year ended December 31, 2020 from 12.5% for the year ended December 31, 2019.
2018 Compared to 2019
Research and Development
Research and development expense increased $4.6 million, or 26.7%, from $17.1 million for the year ended December 31, 2018 to $21.7 million for the year ended December 31, 2019, primarily the result of higher compensation costs associated with additional personnel to support further investments in our platform development as well as continued product innovation. As a percent of total revenue, research and development expenses decreased to 42.8% for the year ended December 31, 2019 from 53.8% for the year ended December 31, 2018.
85
Table of Contents
General and Administrative
General and administrative expense increased $3.8 million, or 45.7%, from $8.3 million for the year ended December 31, 2018 to $12.2 million for the year ended December 31, 2019, primarily the result of additional compensation costs and professional fees incurred in preparation for becoming a public company, as well as additional rent expense associated with our new corporate headquarters. As a percent of total revenue, general and administrative expenses decreased to 24.0% for the year ended December 31, 2019 from 26.2% for the year ended December 31, 2018.
Sales and Marketing
Sales and marketing expense increased $2.1 million, or 47.7%, from $4.3 million for the year ended December 31, 2018 to $6.4 million for the year ended December 31, 2019. This increase was primarily the result of additional compensation costs due to increases in headcount. As a percent of total revenue, sales and marketing expense decreased to 12.5% for the year ended December 31, 2019 from 13.5% for the year ended December 31, 2018.
Other Income (Expense)
| Year Ended December 31, |
2018 Change to 2019 Change |
2019 Change to 2020 Change |
||||||||||||||||||
| 2018 | 2019 | 2020 | % Change | % Change | ||||||||||||||||
| (in thousands) | ||||||||||||||||||||
| Other income (expenses): |
||||||||||||||||||||
| Interest expense |
$ | (173 | ) | $ | (219 | ) | $ | (157 | ) | 26.6 | % | (28.3 | )% | |||||||
| Other income, net |
100 | 36 | 28 | (64.0 | )% | (22.2 | )% | |||||||||||||
| Change in fair value of warrant liability |
(2,681 | ) | (2,959 | ) | (12,714 | ) | 10.4 | % | 329.7 | % | ||||||||||
|
|
|
|
|
|
|
|
|
|
|
|||||||||||
| Total other expenses |
$ | (2,754 | ) | $ | (3,142 | ) | $ | (12,843 | ) | 14.1 | % | 308.8 | % | |||||||
2019 Compared to 2020
Interest Expense
Interest expense remained consistent at approximately $0.2 million in total costs for the years ended December 31, 2019 and December 31, 2020, a result of consistent borrowing amounts under our credit facility.
Other Income, Net
Other income, net remained consistent at approximately $0.1 million for the years ended December 31, 2019 and December 31, 2020, a result of interest earned on our money-market funds in cash and cash equivalents.
Change in Fair Value of Warrant Liability
The increase of $9.8 million in the fair value of warrant liability for the year ended December 31, 2020 was the result of an increase in value of our redeemable convertible preferred stock warrant liability.
2018 Compared to 2019
Interest Expense
Interest expense remained consistent at approximately $0.2 million in total costs for the years ended December 31, 2018 and December 31, 2019, a result of consistent borrowing amounts under our credit facility.
86
Table of Contents
Other Income, Net
Other income, net remained consistent at approximately $0.1 million for the years ended December 31, 2018 and December 31, 2019, a result of interest earned on our money-market funds in cash and cash equivalents.
Change in Fair Value of Warrant Liability
The increase of $0.3 million in the fair value of warrant liability for the year ended December 31, 2019 was the result of an increase in value of our redeemable convertible preferred stock.
Provision for Income Taxes
| Year Ended December 31, |
2018 Change to 2019 Change |
2019 Change to 2020 Change |
||||||||||||||||||
| 2018 | 2019 | 2020 | % Change | % Change | ||||||||||||||||
| (in thousands) | ||||||||||||||||||||
| Provision for income taxes |
$ | 17 | $ | 26 | $ | 189 | 52.9 | % | 626.9 | % | ||||||||||
Provision for income taxes primarily consists of state income taxes for the years ended December 31, 2018, 2019, and 2020. We maintain a full valuation allowance on our net federal and state deferred tax assets as we have concluded that it is not more likely than not that the deferred tax assets will be realized.
Quarterly Results of Operations
Quarterly Results of Operations
The following table sets forth our unaudited quarterly statements of operations data for each of the eight quarters in the period ended December 31, 2020. The information for each of these quarters has been prepared on a basis consistent with our audited annual financial statements appearing elsewhere in this prospectus and, in our opinion, include all normal recurring adjustments necessary for the fair statement of the financial information contained in those statements. The following unaudited quarterly financial data should be read in conjunction with our annual financial statements and the related notes included elsewhere in this prospectus. These quarterly results are not necessarily indicative of our operating results for a full year or any future period.
Quarterly Trends
Revenue
Our quarterly revenue increased in each period presented primarily due to increases in the number of active locations on the platform, increased adoption of additional product modules by our existing customers as evidenced by our net revenue retention rate, and an increase in transaction volumes. See “Components of Results of Operations — Revenue” for a further discussion of the impact of COVID- 19 and the associated shelter-in-place orders on our business.
Gross Margin
Our gross margin has improved over time as a result of increased average revenue per unit over this time period, driven by increased adoption of additional product modules per customer, and an increase in transaction volumes.
87
Table of Contents
Operating Expenses
Research and development expense increased for all periods presented, primarily due to an increase in personnel-related expenses as we have continued to increase our headcount to support product and platform innovation.
General and administrative expense generally increased for all periods presented, primarily due to increases in personnel-related expenses, facilities costs, and professional service fees as we grow our business and scale operations.
Sales and marketing expense increased in the first, third and fourth quarter of each fiscal year due to an increase in expenses associated with higher personnel-related expenses as we continue to grow and scale the team and marketing expenses associated with our annual user conference. Our annual user conference occurs in the first quarter of the year, which generally results in lower second quarter spend relative to the first quarter.
| Three Months Ended | ||||||||||||||||||||||||||||||||
| March 31, | June 30, | September 30, | December 31, | March 31, | June 30, | September 30, | December 31, | |||||||||||||||||||||||||
| 2019 | 2019 | 2019 | 2019 | 2020 | 2020 | 2020 | 2020 | |||||||||||||||||||||||||
| (in thousands) | ||||||||||||||||||||||||||||||||
| Revenue: |
||||||||||||||||||||||||||||||||
| Platform |
$ | 9,715 | $ | 11,133 | $ | 11,640 | $ | 12,633 | $ | 14,808 | $ | 22,519 | $ | 26,197 | $ | 29,240 | ||||||||||||||||
| Professional services and other |
637 | 1,006 | 2,522 | 1,405 | 1,260 | 1,785 | 1,308 | 1,307 | ||||||||||||||||||||||||
|
|
|
|
|
|
|
|
|
|
|
|
|
|
|
|
|
|||||||||||||||||
| Total revenue |
10,352 | 12,139 | 14,162 | 14,038 | 16,068 | 24,304 | 27,505 | 30,547 | ||||||||||||||||||||||||
| Cost of revenues: |
||||||||||||||||||||||||||||||||
| Platform |
2,608 | 2,803 | 3,189 | 3,320 | 3,460 | 3,148 | 3,583 | 4,143 | ||||||||||||||||||||||||
| Professional services and other |
416 | 938 | 1,354 | 958 | 882 | 1,113 | 1,196 | 1,143 | ||||||||||||||||||||||||
|
|
|
|
|
|
|
|
|
|
|
|
|
|
|
|
|
|||||||||||||||||
| Total cost of revenue |
3,024 | 3,741 | 4,543 | 4,278 | 4,342 | 4,261 | 4,779 | 5,286 | ||||||||||||||||||||||||
|
|
|
|
|
|
|
|
|
|
|
|
|
|
|
|
|
|||||||||||||||||
| Gross profit |
7,328 | 8,398 | 9,619 | 9,760 | 11,726 | 20,043 | 22,726 | 25,261 | ||||||||||||||||||||||||
| Operating expenses: |
||||||||||||||||||||||||||||||||
| Research and development |
4,497 | 5,034 | 5,658 | 6,498 | 7,217 | 7,628 | 7,870 | 10,192 | ||||||||||||||||||||||||
| General and administrative |
1,928 | 4,958 | 2,327 | 2,944 | 4,832 | 4,844 | 5,462 | 7,071 | ||||||||||||||||||||||||
| Sales and marketing |
1,650 | 1,433 | 1,609 | 1,659 | 2,280 | 1,806 | 2,002 | 2,457 | ||||||||||||||||||||||||
|
|
|
|
|
|
|
|
|
|
|
|
|
|
|
|
|
|||||||||||||||||
| Total operating expenses |
8,075 | 11,425 | 9,594 | 11,101 | 14,329 | 14,278 | 15,334 | 19,720 | ||||||||||||||||||||||||
|
|
|
|
|
|
|
|
|
|
|
|
|
|
|
|
|
|||||||||||||||||
| Income (loss) from operations |
(747 | ) | (3,027 | ) | 25 | (1,341 | ) | (2,603 | ) | 5,765 | 7,392 | 5,541 | ||||||||||||||||||||
| Other income (expenses): |
||||||||||||||||||||||||||||||||
| Interest expense |
(58 | ) | (56 | ) | (55 | ) | (50 | ) | (46 | ) | (111 | ) | — | — | ||||||||||||||||||
| Other income, net |
18 | (11 | ) | 18 | 11 | 11 | 7 | (4 | ) | 14 | ||||||||||||||||||||||
| Change in fair value of warrant liability |
(997 | ) | (649 | ) | (656 | ) | (657 | ) | (341 | ) | (1,676 | ) | (2,233 | ) | (8,464 | ) | ||||||||||||||||
|
|
|
|
|
|
|
|
|
|
|
|
|
|
|
|
|
|||||||||||||||||
| Total other expenses |
(1,037 | ) | (716 | ) | (693 | ) | (696 | ) | (376 | ) | (1,780 | ) | (2,237 | ) | (8,450 | ) | ||||||||||||||||
|
|
|
|
|
|
|
|
|
|
|
|
|
|
|
|
|
|||||||||||||||||
| Income (loss) before income taxes |
(1,784 | ) | (3,743 | ) | (668 | ) | (2,037 | ) | (2,979 | ) | 3,985 | 5,155 | (2,909 | ) | ||||||||||||||||||
| Provision (benefit) for income taxes |
(1 | ) | — | 23 | 4 | 47 | 47 | 47 | 48 | |||||||||||||||||||||||
|
|
|
|
|
|
|
|
|
|
|
|
|
|
|
|
|
|||||||||||||||||
| Net income (loss) and comprehensive income (loss) |
$ | (1,783 | ) | $ | (3,743 | ) | $ | (691 | ) | $ | (2,041 | ) | $ | (3,026 | ) | $ | 3,938 | $ | 5,108 | $ | (2,957 | ) | ||||||||||
|
|
|
|
|
|
|
|
|
|
|
|
|
|
|
|
|
|||||||||||||||||
88
Table of Contents
| Three Months Ended | ||||||||||||||||||||||||||||||||
| March 31, | June 30, | September 30, | December 31, | March 31, | June 30, | September 30, | December 31, | |||||||||||||||||||||||||
| 2019 | 2019 | 2019 | 2019 | 2020 | 2020 | 2020 | 2020 | |||||||||||||||||||||||||
| Revenue: |
||||||||||||||||||||||||||||||||
| Platform |
93.8 | % | 91.7 | % | 82.2 | % | 90.0 | % | 92.2 | % | 92.7 | % | 95.2 | % | 95.7 | % | ||||||||||||||||
| Professional services and other |
6.2 | 8.3 | 17.8 | 10.0 | 7.8 | 7.3 | 4.8 | 4.3 | ||||||||||||||||||||||||
|
|
|
|
|
|
|
|
|
|
|
|
|
|
|
|
|
|||||||||||||||||
| Total revenue |
100.0 | 100.0 | 100.0 | 100.0 | 100.0 | 100.0 | 100.0 | 100.0 | ||||||||||||||||||||||||
| Cost of revenues: |
||||||||||||||||||||||||||||||||
| Platform |
25.2 | 23.1 | 22.5 | 23.7 | 21.5 | 13.0 | 13.0 | 13.6 | ||||||||||||||||||||||||
| Professional services and other |
4.0 | 7.7 | 9.6 | 6.8 | 5.5 | 4.6 | 4.3 | 3.7 | ||||||||||||||||||||||||
|
|
|
|
|
|
|
|
|
|
|
|
|
|
|
|
|
|||||||||||||||||
| Total cost of revenue |
29.2 | 30.8 | 32.1 | 30.5 | 27.0 | 17.5 | 17.4 | 17.3 | ||||||||||||||||||||||||
|
|
|
|
|
|
|
|
|
|
|
|
|
|
|
|
|
|||||||||||||||||
| Gross profit |
70.8 | 69.2 | 67.9 | 69.5 | 73.0 | 82.5 | 82.6 | 82.7 | ||||||||||||||||||||||||
| Operating expenses: |
||||||||||||||||||||||||||||||||
| Research and development |
43.4 | 41.5 | 40.0 | 46.3 | 44.9 | 31.4 | 28.6 | 33.4 | ||||||||||||||||||||||||
| General and administrative |
18.6 | 40.8 | 16.4 | 21.0 | 30.1 | 19.9 | 19.9 | 23.1 | ||||||||||||||||||||||||
| Sales and marketing |
15.9 | 11.8 | 11.4 | 11.8 | 14.2 | 7.4 | 7.3 | 8.0 | ||||||||||||||||||||||||
|
|
|
|
|
|
|
|
|
|
|
|
|
|
|
|
|
|||||||||||||||||
| Total operating expenses |
78.0 | 94.1 | 67.7 | 79.1 | 89.2 | 58.7 | 55.7 | 64.6 | ||||||||||||||||||||||||
|
|
|
|
|
|
|
|
|
|
|
|
|
|
|
|
|
|||||||||||||||||
| Income (loss) from operations |
(7.2 | ) | (24.9 | ) | 0.2 | (9.6 | ) | (16.2 | ) | 23.7 | 26.9 | 18.1 | ||||||||||||||||||||
| Other income (expenses): |
||||||||||||||||||||||||||||||||
| Interest expense |
(0.6 | ) | (0.5 | ) | (0.4 | ) | (0.4 | ) | (0.3 | ) | (0.5 | ) | — | — | ||||||||||||||||||
| Other income, net |
0.2 | (0.1 | ) | 0.1 | 0.1 | 0.1 | — | — | — | |||||||||||||||||||||||
| Change in fair value of warrant liability |
(9.6 | ) | (5.3 | ) | (4.6 | ) | (4.7 | ) | (2.1 | ) | (6.9 | ) | (8.1 | ) | (27.7 | ) | ||||||||||||||||
|
|
|
|
|
|
|
|
|
|
|
|
|
|
|
|
|
|||||||||||||||||
| Total other expenses |
(10.0 | ) | (5.9 | ) | (4.9 | ) | (5.0 | ) | (2.3 | ) | (7.3 | ) | (8.1 | ) | (27.7 | ) | ||||||||||||||||
|
|
|
|
|
|
|
|
|
|
|
|
|
|
|
|
|
|||||||||||||||||
| Income (loss) before income taxes |
(17.2 | ) | (30.8 | ) | (4.7 | ) | (14.5 | ) | (18.5 | ) | 16.4 | 18.7 | (9.5 | ) | ||||||||||||||||||
| Provision (benefit) for income taxes |
— | — | 0.2 | — | 0.3 | 0.2 | 0.2 | 0.2 | ||||||||||||||||||||||||
|
|
|
|
|
|
|
|
|
|
|
|
|
|
|
|
|
|||||||||||||||||
| Net income (loss) and comprehensive income (loss) |
(17.2 | )% | (30.8 | )% | (4.9 | )% | (14.5 | )% | (18.8 | )% | 16.2 | % | 18.6 | % | (9.7 | )% | ||||||||||||||||
|
|
|
|
|
|
|
|
|
|
|
|
|
|
|
|
|
|||||||||||||||||
Liquidity and Capital Resources
General
As of December 31, 2020, our principal source of liquidity was cash and cash equivalents totaling $75.8 million, which was held for working capital purposes, as well as the available balance of our revolving line of credit, described further below.
We have financed our operations primarily through sales of our equity securities and borrowings under our credit facility. We believe our existing cash and cash equivalents and amounts available under our outstanding credit facility will be sufficient to support our working capital and capital expenditure requirements for at least the next twelve months. Our future capital requirements will depend on many factors, including but not limited to our obligation to repay any remaining balance under our credit facility,
89
Table of Contents
our platform revenue growth rate, receivable and payable cycles, the timing and extent of investments in research and development, sales and marketing, and general and administrative.
Credit Facility
We are party to an Amended and Restated Loan and Security Agreement with Pacific Western Bank, or the Amended Loan and Security Agreement, for a revolving line of credit, or the credit facility. Under the Amended Loan and Security Agreement, effective February 11, 2020, we can borrow up to $35.0 million under a formula revolving line of credit, of which $25.0 million became available to us immediately on the agreement date. An additional $10.0 million will become available under the credit facility upon our achievement of revenue of at least $75.0 million in the year ended December 31, 2020. The amount available to us at any time is the lesser of (A) $25.0 million (or $35.0 million if revenue targets are achieved) or (B) five times our previous month’s recurring revenue. We can also borrow up to $5.0 million under a non-formula revolving line with aggregate borrowings under the formula and non-formula revolving line not to exceed $25.0 million (or $35.0 million if revenue targets are achieved). Advances under the formula revolving line of credit bear interest equal to the greater of (A) 0.20% above Pacific Western Bank’s prime rate then in effect; or (B) 4.50%. Advances under the non-formula revolving line of credit bear interest equal to the greater of (A) 0.75% above Pacific Western Bank’s prime rate then in effect; or (B) 5.00%. Interest is due and payable monthly in arrears. We may prepay advances under the credit facility in whole or in part at any time without premium or penalty, and the credit facility matures on February 11, 2022. Our obligations under the Amended Loan and Security Agreement are secured by substantially all of our assets. As of December 31, 2019, we had $3.5 million of outstanding borrowings under the credit facility. In March 2020, we borrowed an additional $15.0 million under the Amended Loan and Security Agreement, and the entire outstanding balance of $18.5 million was repaid in April 2020. As of December 31, 2020 we did not have any outstanding borrowings under the credit facility and had $25.0 million available to us under the credit facility.
The credit facility contains customary affirmative and negative covenants, including covenants that require Pacific Western Bank’s consent to, among other things, merge or consolidate or acquire assets outside the ordinary course of business, make investments, incur additional indebtedness or guarantee indebtedness of others, pay dividends and redeem and repurchase our capital stock, enter into transactions with affiliates outside the ordinary course of business, and create liens on our assets. We are also required to comply with certain minimum EBITDA and minimum revenue covenants. Specifically, measured monthly and calculated on a trailing three-month basis, we are required to achieve a minimum EBITDA target and a minimum revenue target as of the end of each month in 2020, including EBITDA of at least ($64,000) for the reporting period ending December 31, 2020 and revenue of at least $66.1 million for the reporting period ending December 31, 2020. We are in compliance with these covenants and would have been in compliance with these covenants as of December 31, 2020.
The credit facility also contains events of default that include, among other things, non-payment defaults, covenant defaults, insolvency defaults, cross-defaults to other indebtedness and material obligations, judgment defaults, inaccuracy of representations and warranties, and a material adverse change default. Any default that is not cured or waived could result in the acceleration of the obligations under the credit facility, an increase in the applicable interest rate under the credit facility to a per annum rate equal to 5.00% above the applicable interest rate, and would permit Pacific Western Bank to exercise remedies with respect to all of the collateral that is securing the credit facility.
The Amended Loan and Security Agreement will continue in full force and effect for so long as any obligations remain outstanding thereunder, provided, that, Pacific Western Bank has the right to terminate its obligation to make further advances to us immediately and without notice upon the occurrence and during the continuance of an event of default. We may terminate the formula revolving
90
Table of Contents
line or the non-formula revolving line at any time prior to the maturity date, upon two business days written notice to Pacific Western Bank, at which time all then outstanding obligations arising under the Amended Loan and Security Agreement, including any unpaid interest thereon, will accelerate and become immediately due and payable.
Redeemable Convertible Preferred Stock
In April 2020, we issued we issued 564,169 shares of Series E redeemable convertible preferred stock at a price per share of $88.62 for total proceeds of approximately $50.0 million.
Cash Flows
The following table presents a summary of our cash flows from operating, investing, and financing activities for the period indicated.
| Year Ended December 31, |
2018 Change to 2019 Change |
2019 Change to 2020 Change |
||||||||||||||||||
| 2018 | 2019 | 2020 | % Change | % Change | ||||||||||||||||
| (in thousands) | ||||||||||||||||||||
| Net cash (used in) provided by operating activities |
$ | (4,178 | ) | $ | 2,422 | $ | 20,768 | (158.0 | )% | 757.5 | % | |||||||||
| Net cash used in investing activities |
(195 | ) | (1,352 | ) | (1,273 | ) | 593.3 | % | (5.8 | )% | ||||||||||
| Net cash provided by financing activities |
$ | 4,431 | $ | 225 | $ | 45,326 | (94.9 | )% | 20,044.9 | % | ||||||||||
Operating Activities
For the year ended December 31, 2020, net cash provided by operating activities was $20.8 million, primarily due to net income of $3.1 million adjusted for non-cash charges of $19.4 million and a net decrease in our operating assets and liabilities of $1.7 million. The non-cash adjustments primarily relate to the change in the fair value of warrants of $12.7 million, stock-based compensation of $5.4 million, depreciation and amortization of $0.7 million and allowance for doubtful accounts of $0.6 million. The net decrease in operating assets and liabilities is primarily driven by an increase in accounts receivable of $31.5 million and deferred contract costs of $2.0 million due to the growth in our revenue. These increases are offset by an increase in accounts payable and accrued expenses of $32.0 million related primarily to higher fees owed to delivery service providers and vendors of $25.4 million and $2.7 million, respectively, a result of growth in Dispatch order volumes and operations and an increase in deferred rent of $0.6 million in connection with our new corporate headquarters.
For the year ended December 31, 2019, net cash provided by operating activities was $2.4 million, primarily due to a net loss of $8.3 million adjusted for non-cash charges of $8.2 million and a net decrease in our operating assets and liabilities of $2.5 million. The non-cash adjustments primarily relate to stock-based compensation of $4.8 million, the change in the fair value of warrants of $3.0 million and depreciation of $0.4 million. The net decrease in operating assets and liabilities is primarily driven by an increase in accounts receivable of $7.1 million and deferred contract costs of $1.1 million due to the growth in our revenue. These increases are offset by an increase in accounts payable and accrued expenses of $9.0 million related primarily to higher fees owed to delivery service providers and vendors of $4.1 million and $3.4 million, respectively, and an increase in deferred rent of $1.5 million in connection with our new corporate headquarters.
91
Table of Contents
For the year ended December 31, 2018, net cash used in operating activities was $4.2 million, primarily due to a net loss of $11.6 million adjusted for non-cash charges of $7.1 million and a net decrease in our operating assets and liabilities of $0.3 million. The non-cash adjustments primarily relate to stock-based compensation of $4.2 million, the change in the fair value of warrants of $2.7 million and depreciation of $0.2 million. The net decrease in operating assets and liabilities is primarily driven by an increase in accounts payable and accrued expenses of $6.0 million related primarily to increased fees owed to vendors and Delivery Service Providers of $2.9 million and $1.7 million, respectively, and an increase in unearned revenue and contract assets of $0.4 million related to the overall growth of our business. These increases are offset by increases in accounts receivable of $4.3 million and deferred contract costs of $0.8 million due to an increase in revenue and increases in prepaid expenses of $1.0 million to support the growth in the business.
Investing Activities
Cash used in investing activities was $1.3 million during the year ended December 31, 2020, primarily due to $0.8 million for the development of internal software and $0.5 million for purchases of computer and office equipment, furniture and fixtures, and leasehold improvements, investments to support further product development and to expand our corporate office.
Cash used in investing activities was $1.4 million during the year ended December 31, 2019, primarily due to $0.8 million for the development of internal software and $0.6 million for purchases of computer and office equipment, furniture and fixtures, and leasehold improvements, investments to support further product development and to expand our corporate office.
Cash used in investing activities was $0.2 million during the year ended December 31, 2018, primarily due to purchases of office equipment and leasehold improvements to expand our corporate office.
Financing Activities
Cash provided by financing activities was $45.3 million during the year ended December 31, 2020, reflecting $49.8 million of proceeds from the issuance of preferred stock, net of cost, $15.0 million of proceeds from the line of credit, and $2.6 million of net proceeds from the exercise of stock options. Increases were partially offset by $18.5 million of repayment of the line of credit, $2.2 million of payments for offering costs related to this offering, and $1.4 million for payment of employee taxes related to stock option net exercise.
Cash provided by financing activities was $0.2 million during the year ended December 31, 2019, reflecting $0.4 million of proceeds from the exercise of stock options and warrants, partially offset by $0.2 million of payments for offering costs related to this offering.
Cash provided by financing activities was $4.4 million during the year ended December 31, 2018, reflecting proceeds from borrowings under our line of credit for $3.5 million and the exercise of stock options and warrants, which were $0.8 million and $0.1 million, respectively.
Certain Non-GAAP Financial Measures
We report our financial results in accordance with generally accepted accounting principles in the United States, or GAAP. To supplement our financial statements, we provide investors with non-GAAP operating income (loss) and free cash flow, each of which is a non-GAAP financial measure.
92
Table of Contents
Non-GAAP Operating Income (Loss)
Non-GAAP operating income (loss) is defined as operating income (loss), adjusted for the impact of stock-based compensation expense and amortization of internally developed software expense. Management believes that it is useful to exclude certain non-cash charges and non-core operational charges from non-GAAP operating income (loss) because (1) the amount of such expenses in any specific period may not directly correlate to the underlying performance of our business operations; and (2) such expenses can vary significantly between periods as a result of the timing of new stock-based awards and secondary transactions. The presentation of the non-GAAP financial measures is not intended to be considered in isolation, or as a substitute for, or superior to, the financial information prepared and presented in accordance with GAAP.
The following table presents a reconciliation of GAAP operating loss to non-GAAP operating income (loss) for the following periods:
| Year Ended December 31, | ||||||||||||
| 2018 | 2019 | 2020 | ||||||||||
| (in thousands) | ||||||||||||
| Operating income (loss) |
$ | (8,781 | ) | $ | (5,090 | ) | $ | 16,095 | ||||
| Stock-based compensation expense |
4,196 | 4,826 | 5,380 | |||||||||
| Internally developed software amortization |
— | 108 | 316 | |||||||||
|
|
|
|
|
|
|
|||||||
| Non-GAAP operating income (loss) |
$ | (4,585 | ) | $ | (156 | ) | $ | 21,791 | ||||
|
|
|
|
|
|
|
|||||||
Non-GAAP Free Cash Flow
Free cash flow represents net cash used in operating activities, reduced by purchases of property and equipment, and capitalization of internally developed software. Free cash flow is a measure used by management to understand and evaluate our liquidity and to generate future operating plans. The reduction of capital expenditures facilitates comparisons of our liquidity on a period-to-period basis and excludes items that we do not consider to be indicative of our liquidity. We believe that free cash flow is a measure of liquidity that provides useful information to investors and others in understanding and evaluating the strength of our liquidity and future ability to generate cash that can be used for strategic opportunities or investing in our business in the same manner as our management and board of directors. Nevertheless, our use of free cash flow has limitations as an analytical tool, and you should not consider it in isolation or as a substitute for analysis of our financial results as reported under GAAP. Further, our definition of free cash flow may differ from the definitions used by other companies and therefore comparability may be limited. You should consider free cash flow alongside our other GAAP-based financial performance measures, such as net cash used in operating activities, and our other GAAP financial results. The following table presents a reconciliation of free cash flow to net cash used in operating activities, the most directly comparable GAAP measure, for each of the periods indicated.
| Year Ended December 31, | ||||||||||||
| 2018 | 2019 | 2020 | ||||||||||
| (in thousands) | ||||||||||||
| Net cash (used in) provided by operating activities |
$ | (4,178 | ) | $ | 2,422 | $ | 20,768 | |||||
| Purchase of property and equipment |
(195 | ) | (573 | ) | (399 | ) | ||||||
| Capitalization of internally developed software |
— | (779 | ) | (874 | ) | |||||||
|
|
|
|
|
|
|
|||||||
| Non-GAAP free cash flow |
$ | (4,373 | ) | $ | 1,070 | $ | 19,495 | |||||
|
|
|
|
|
|
|
|||||||
93
Table of Contents
Contractual Obligations and Commitments
The following table sets forth the amounts of our significant contractual obligations and commitments with definitive payment terms as of December 31, 2020:
| Payment due by Period | ||||||||||||||||||||
| Total | Less than 1 year |
1-3 years | 3-5 years | More than 5 years |
||||||||||||||||
| (in thousands) | ||||||||||||||||||||
| Operating lease obligations |
$ | 29,138 | $ | 3,514 | $ | 6,885 | $ | 5,665 | $ | 13,074 | ||||||||||
| Unconditional purchase obligations(1) |
1,750 | 1,750 | — | — | — | |||||||||||||||
|
|
|
|
|
|
|
|
|
|
|
|||||||||||
| Total |
$ | 30,888 | $ | 5,264 | $ | 6,885 | $ | 5,665 | $ | 13,074 | ||||||||||
|
|
|
|
|
|
|
|
|
|
|
|||||||||||
| (1) | Unconditional purchase obligations relate to cloud-based services to support our infrastructure. |
The commitment amounts in the table above are associated with contracts that are enforceable and legally binding and that specify all significant terms, including fixed or minimum services to be used, fixed, minimum or variable price provisions, and the approximate timing of the actions under the contracts. The table does not include obligations under agreements that we can cancel without a significant penalty.
Off-Balance Sheet Arrangements
We did not have during the periods presented, and we do not currently have, any off-balance sheet financing arrangements or any relationships with unconsolidated entities or financial partnerships, including entities sometimes referred to as structured finance or special purpose entities, that were established for the purpose of facilitating off-balance sheet arrangements or other contractually narrow or limited purposes.
Critical Accounting Policies
Our discussion and analysis of financial condition and results of operations are based upon our financial statements included elsewhere in this prospectus. The preparation of our financial statements in accordance with GAAP requires us to make estimates and assumptions that affect the reported amounts of assets, liabilities, revenue, and expenses. We base our estimates on past experience and other assumptions that we believe are reasonable under the circumstances, and we evaluate these estimates on an ongoing basis. Actual results may differ from those estimates.
Our critical accounting policies are those that materially affect our financial statements and involve difficult, subjective or complex judgments by management. A thorough understanding of these critical accounting policies is essential when reviewing our financial statements. We believe that the critical accounting policies listed below are the most difficult management decisions as they involve the use of significant estimates and assumptions as described above.
Revenue Recognition
We recognize revenue in accordance with Topic 606, which we adopted as of January 1, 2018 on a modified retrospective basis. We generate revenue from providing our customers access to our platform. We recognize revenue when we transfer promised goods or services in an amount that reflects the consideration to which the entity expects to be entitled in exchange for those goods or
94
Table of Contents
services. This is determined by following a five-step process which includes (1) identifying the contract with a customer, (2) identifying the performance obligations in the contract, (3) determining the transaction price, (4) allocating the transaction price, and (5) recognizing revenue when or as we satisfy a performance obligation.
The identification of distinct performance obligations in a contract requires judgment. Our performance obligations primarily include access to our platform and its different modules and implementation services associated with the platform. We believe that non-complex implementation services are generally distinct performance obligations while complex implementation services are generally combined with our platform services into one performance obligation.
The implementation fees in our contracts are variable. We estimate how many months it will take to implement the platform into the customer environment, including time to get restaurant franchise locations onboarded. This estimate is multiplied by the fixed monthly fee to determine the transaction price.
We allocate the transaction price of the contract to each distinct performance obligation based on a relative standalone selling price basis. We determine standalone selling price based on the price at which the performance obligation is sold separately. If the standalone selling price is not observable through past transactions, we estimate the standalone selling price taking into account available information such as market conditions and internally approved pricing guidelines related to the performance obligations.
Stock-Based Compensation
Accounting for stock-based compensation requires us to make a number of judgments, estimates, and assumptions. If any of our estimates prove to be inaccurate, our net loss and operating results could be adversely affected.
We estimate the fair value of stock options granted to employees using the Black-Scholes option-pricing model, which requires the input of subjective assumptions, including (1) the fair value of common stock, (2) the expected stock price volatility, (3) the expected term of the award, (4) the risk-free interest rate, and (5) expected dividends. Effective January 1, 2018, we changed our accounting policy to account for forfeitures as they occur. Prior to January 1, 2018, forfeitures were estimated at the date of grant and revised, if necessary, in subsequent periods. These assumptions are estimated as follows:
| ● | Fair value of common stock. Because our Class A common stock is not yet publicly traded, we are required to estimate the fair value of our Class A common stock, as discussed in “Common Stock Valuations” below. |
| ● | Expected volatility. Due to the lack of historical and implied volatility data of our Class A common stock, the expected stock price volatility has been estimated based on the average historical stock volatilities of several peer public companies over a period equivalent to the expected term of the awards. We selected companies with comparable characteristics to us, including enterprise value, risk profiles and position within the industry and with historical share price information sufficient to meet the expected term of the stock options. The historical volatility data has been computed using the daily closing prices for the selected companies. |
| ● | Expected term. For employee awards granted at-the-money, we estimate the expected term based on the simplified method, which is the mid-point between the vesting date and |
95
Table of Contents
| the end of the contractual term for each award since our historical share option exercise experience does not provide a reasonable basis upon which to estimate the expected term. For non-employee awards and employee awards granted out-of-the-money, our best estimate of the expected term is the contractual term of the award. |
| ● | Risk-free rate. The risk-free rate is based on the United States Treasury yield curve in effect at the time of the grant, whose term is consistent with the expected life of the stock option. |
The fair value of each stock option grant is estimated on the date of grant using the Black Scholes option pricing model with the following assumptions:
| Year Ended December 31, | ||||||
| 2018 | 2019 | 2020 | ||||
| Expected term (years) |
5.53 – 10.0 | 5.09 – 10.0 | 5.50 – 6.08 | |||
| Volatility |
45% – 50% | 45% – 50% | 43% – 66% | |||
| Risk-free interest rate |
2.85% – 3.19% | 1.60% – 2.50% | 0.37% – 1.63% | |||
| Fair value of common stock |
$23.45 – $43.56 | $45.27 – $63.86 | $69.00 – $153.89 | |||
Common Stock Valuations
The fair value of our shares of common stock underlying the stock options has historically been determined by the board of directors, with contemporaneous third-party valuations, as there was no public market for our common stock. We believe that our board of directors has the relevant experience and expertise to determine the fair value of our common stock. Given the absence of a public trading market of our common stock, and in accordance with the American Institute of Certified Public Accountants Practice Aid, Valuation of Privately Held Company Equity Securities Issued as Compensation, our board of directors exercised reasonable judgment and considered a number of objective and subjective factors to determine the best estimate of the fair value of our common stock at each grant date.
These factors include:
| ● | relevant precedent transactions involving our capital stock; |
| ● | the liquidation preferences, rights, and privileges of our convertible preferred stock relative to the common stock; |
| ● | our actual operating and financial performance; |
| ● | current business conditions and projections; |
| ● | our stage of development; |
| ● | the likelihood and timing of achieving a liquidity event for the shares of common stock underlying the stock options, such as an initial public offering, given prevailing market conditions; |
| ● | any adjustment necessary to recognize a lack of marketability of the common stock underlying the granted options; |
96
Table of Contents
| ● | recent secondary stock sales and tender offers; |
| ● | the market performance of comparable publicly traded companies; and |
| ● | U.S. and global capital market conditions. |
In valuing our common stock, our board of directors determines the value using both the income and the market approach valuation methods. The income approach estimates value based on the expectation of future cash flows that a company will generate. These future cash flows are discounted to their present values using a discount rate based on our weighted average cost of capital, or WACC. To derive our WACC, a cost of equity was developed using the Capital Asset Pricing Model and comparable company betas, and a cost of debt was determined based on our estimated cost of borrowing. The costs of debt and equity were then weighted based on our actual capital structure. The market approach estimates value based on a comparison of our company to comparable public companies in a similar line of business and acquisitions in the market. From the comparable companies, a representative market multiple is determined and subsequently applied to our financial results to estimate our enterprise value.
Application of these approaches involves the use of estimates, judgment, and assumptions that are highly complex and subjective, such as those regarding our expected future revenue, expenses, and future cash flows, discount rates, market multiples, the selection of comparable companies, and the probability of possible future events. Changes in any or all of these estimates and assumptions or the relationships between those assumptions impact our valuations as of each valuation date and may have a material impact on the valuation of our common stock.
For valuations after the completion of this offering, our board of directors will determine the fair value of each share of underlying common stock based on the closing price of our common stock as reported on the date of grant. Future expense amounts for any particular period could be affected by changes in our assumptions or market conditions.
Based on the assumed initial public offering price per share of $ , which is the midpoint of the estimated offering price range set forth on the cover page of this prospectus, the aggregate intrinsic value of our outstanding stock options as of December 31, 2020 was $ , with $ million related to vested stock options.
Redeemable Convertible Preferred Stock Warrant Liability
Accounting for warrants requires us to make judgments, estimates, and assumptions. If any of our estimates prove to be inaccurate, our net loss and operating results could be adversely affected.
The fair value of the warrants was determined by first estimating the fair value of the enterprise based on recent transactions of our securities. An Option-Pricing Method, or OPM, was then used to allocate our total equity value to our different classes of equity according to their rights and preferences. This method treats classes having the attributes of common stock and preferred stock securities as call options on the value of the company equity, with exercise prices based on the liquidation preferences of preferred stockholders. Our classes of stock are modeled as a call option that give the owner the right to buy the underlying enterprise value at an exercise price. The OPM requires the input of subjective assumptions, including the expected term, which represents the estimate point for when liquidity will be achieved.
97
Table of Contents
At December 31, 2018, the fair value of each warrant was estimated using the OPM with the following assumptions:
| Expected term (years) |
3.0 | |||
| Volatility |
45 | % | ||
| Risk-free interest rate |
2.9 | % |
At December 31, 2019 and 2020, given the significant increase in fair value of each series of redeemable convertible preferred stock relative to the warrant’s exercise price, we estimated the preferred stock warrant liability using the intrinsic value of each warrant since the warrants are significantly in-the-money and the Black Scholes input have a de minimis impact on their value.
Recent Accounting Pronouncements
For a description of our recently adopted accounting pronouncements and recently issued accounting standards not yet adopted, see Note 2 to our financial statements: “Significant Accounting Policies” appearing elsewhere in this prospectus.
Quantitative and Qualitative Disclosures About Market Risk
We are exposed to market risks in the ordinary course of our business. Market risk represents the risk of loss that may impact our financial position due to adverse changes in financial market prices and rates. Our market risk exposure is primarily a result of exposure to potential changes in interest rates. We do not enter into investments for trading or speculative purposes and have not used any derivative financial instruments to manage our interest rate risk exposure.
Interest Rate Risk
Our primary market risk exposure is changing interest rates in connection with the Amended Loan and Security Agreement with Pacific Western Bank. Interest rate risk is highly sensitive due to many factors, including U.S. monetary and tax policies, U.S. and international economic factors and other factors beyond our control. As of December 31, 2020, advances under the formula revolving line bear interest equal to the greater of (A) 0.75% above the Prime Rate then in effect; or (B) 5.00%. As of December 31, 2020, we had no outstanding debt under our credit facility.
Our interest-earning instruments also carry a degree of interest rate risk. As of December 31, 2020, we had cash and cash equivalents of $75.8 million.
Foreign Currency Exchange Risk
Our revenue and costs are denominated in U.S. dollars and are not subject to foreign currency exchange risk. However, to the extent we commence generating revenue outside of the United States that is denominated in currencies other than the U.S. dollar, our results of operations could be impacted by changes in exchange rates.
Inflation Risk
We do not believe that inflation has had a material effect on our business, results of operations, or financial condition. If our costs were to become subject to significant inflationary pressures, we may not be able to fully offset such higher costs through price increases. Our inability or failure to do so could harm our business, results of operations and financial condition.
98
Table of Contents
JOBS Act Accounting Election
We qualify as an “emerging growth company” pursuant to the provisions of the Jumpstart Our Business Startups Act of 2012, or the JOBS Act. For as long as we are an “emerging growth company,” we may take advantage of certain exemptions from various reporting requirements that are applicable to other public companies that are not “emerging growth companies,” including, but not limited to, not being required to comply with the auditor attestation requirements of Section 404(b) of the Sarbanes-Oxley Act, reduced disclosure obligations regarding executive compensation in our periodic reports and proxy statements, exemptions from the requirements of holding advisory “say-on-pay” votes on executive compensation, and stockholder advisory votes on golden parachute compensation.
The JOBS Act also permits an emerging growth company like us to take advantage of an extended transition period to comply with new or revised accounting standards applicable to public companies. We have elected to “opt-in” to this extended transition period for complying with new or revised accounting standards and, therefore, we will not be subject to the same new or revised accounting standards as other public companies that comply with such new or revised accounting standards on a non-delayed basis.
99
Table of Contents
LETTER FROM NOAH GLASS, FOUNDER AND CEO
Hi, I’m Noah Glass, the Founder and CEO of Olo. Thank you for reading our prospectus and considering an investment in Olo. I’ve been obsessed with on-demand commerce since moving to New York City in 2003.
You cannot ship a hot cup of coffee from a warehouse. That was the original insight that first led me to think about how to more effectively connect the convenience of on-demand commerce with the nearly $700 billion restaurant industry over 15 years ago. What if you could utilize the convenience and technology of the burgeoning e-commerce sector to order and pay for a coffee directly from your mobile phone and have it ready when you got to the restaurant? At Olo, we call that “on-demand commerce”: a form of e-commerce that is focused on the restaurant industry and allows a consumer to order and pay on-demand and have a made-to-order product prepared just-in-time for real-time pickup or same-hour delivery.
Today, Olo has grown to become a leading software-as-a-service (SaaS) platform for the restaurant industry, enabling over $14.6 billion in on-demand commerce in 2020 for a network of over 400 top restaurant brands across 64,000 locations. As a result of the substantial investments we have made to grow our business, we have incurred significant losses since inception and as of December 31, 2020, we had an accumulated deficit of $69.3 million. Our well-established platform has led many of the major publicly traded and top 50 fastest growing private restaurant brands, measured by overall sales, in the United States to work with us and has been a factor in our high gross brand retention rate. Further, industry-recognized outlets, including Restaurant Business Online, QSR Magazine, and AP News, have also deemed Olo the leading food ordering platform for the restaurant industry.
Olo’s mission is to help our restaurant customers thrive by best meeting the needs of on-demand consumers. Olo is a software platform for restaurants. We are not an aggregator or marketplace for consumers. Our business-to-business-to-consumer (B2B2C) approach means that we are truly partners with our restaurant customers. We enable our restaurant customers to better serve their consumers, rather than competing with them for those same consumers. This differentiated market position has enabled us to establish one of the largest restaurant technology ecosystems with over 100 restaurant technology partners that integrate into Olo’s open SaaS platform and add value for our joint restaurant customers.
My fascination with the idea of more effectively connecting on-demand commerce with restaurants began when I first moved to New York City in 2003, carrying a Palm Pilot personal digital assistant. I came to believe that mobile devices would soon become ubiquitous and forever change how consumers conducted commerce with brick and mortar stores. My instinct was informed in equal parts by (1) my first restaurant industry job in 1998, as a pizza delivery driver at Pizzaman in my hometown of Newton, Massachusetts, and (2) spending a large chunk of 2003 and 2004 working in Johannesburg, South Africa with Endeavor (an organization dedicated to fostering high-growth entrepreneurship around the globe), where I first met mobile phone software developers and saw the inevitable ubiquity of smartphones and their potential impact for on-demand commerce in the restaurant industry. Throughout 2004, I worked with a small team of engineers based in Johannesburg to build a working prototype that enabled a simple mobile Internet device to construct and place a basic order from a limited menu and have that order ping a rudimentary point-of-sale (POS) application. Upon seeing the demo and hearing my business plan, my mentor David Frankel, a successful Internet entrepreneur and investor and current Olo board member, asked me if I had enough confidence in this idea to withdraw my admission to Harvard Business School and quit my job to pursue Olo in exchange for seed funding. It was a “burn the boats” prerequisite, with David testing my conviction level to make Olo my only path forward. I knew immediately that it was the right time to pursue the Olo opportunity. Smartphone mass adoption would happen exactly once in human history. This was the opportunity to plant a stake in the ground. Olo was born on June 1, 2005.
100
Table of Contents
We live our values at Olo. Our three primary values are:
| 1. | Family First: Our families make us who we are and are who we work for every day. Olo is our second family. This focus on family and a balanced approach to work and family life has enabled Olo to recruit, attract, and retain a world-class team. Olo has indeed become my second family. The initial twelve Olo employees have been together for over a decade. The relatively “new” members of the executive team joined when we truly hit market-product fit in 2013 and have been with the company ever since, making our average executive tenure over eight years. We have all built this company together, having one another’s backs, fighting through setbacks, and laughing all the way. Our family first value has never been more important than during COVID-19. |
| 2. | Drive: As a high school All American and four-year starting defenseman for Yale Men’s Lacrosse, I introduced Team Olo to the concept of a “groundball” and we speak often about the importance of having a “groundball mentality.” A groundball is not like a jump ball in basketball, which is disproportionately won by the player who is the tallest or has the highest vertical leap. Instead, a groundball transcends physicality and requires both skill and creativity at peak physical intensity in order to win. We celebrate that grit at Olo. We dig deep to do what others are unwilling or unable to do. |
| 3. | Excelsior: The New York state motto meaning “ever upward” in Latin. We are constantly striving for self and company improvement at all levels. We do not get comfortable. We do not stop. This manifests in a greater desire to improve our community and our world, not just our financials. One example of our work to strive for improvement in our community is our long-standing affiliation with Share Our Strength: the parent organization behind the No Kid Hungry campaign to end childhood hunger in America. We seek to be an advocate for the restaurant industry as its most restaurant-aligned technology partner. In furtherance of this value, we have launched an Olo for Good initiative focused on fostering a sustainable contribution to the communities in which we live, work, and service by integrating social responsibility and impact into our business. As part of this initiative, we have created a donor-advised fund, which will be funded with shares of our Class A common stock upon completion of this offering, and have joined the Pledge 1% movement committing one percent of Olo’s time and product, in addition to equity, to Olo for Good Initiatives. |
Restaurants are an incredibly complex type of retailer. They are a mashup of a showroom and a factory, making on-demand commerce for restaurants more difficult than typical on-demand commerce. Our restaurant customers serve perishable, made-to-order products just-in-time with modifications, substitutions, and combinations, manifesting in a scale of permutations that non-restaurant retailers do not face. Add to that the uphill battle that we faced in our efforts to integrate legacy software and POS systems that were coded pre-Internet with our cloud-based platform, retrofitting a brick and mortar store for an on-demand experience. We knew that building an enterprise-grade, on-demand commerce software platform with the security and robust features restaurants need would be one of the most challenging vertical on-demand commerce developments and took an “if we can make it here, we can make it anywhere” approach that has served us well over the years.
Consumers place a premium on safety and food convenience. Consumers are outsourcing food preparation more than ever, with the restaurant industry recently surpassing the grocery industry in aggregate consumer spending for the first time in history. Even before the onset of the COVID-19 pandemic, 63% of restaurant transactions were for off-premise consumption (with delivery representing only 3%) and leaving just 37% of restaurant meals consumed at restaurants. Those numbers are shocking even to restaurant industry insiders and they represent the voracious consumer appetite for on-demand commerce at restaurants. COVID-19 has led to more consumers
101
Table of Contents
utilizing digital ordering, many forging new habits based on the safety of never having to leave their vehicle or home and the convenience of still being able to enjoy their favorite dishes from the restaurants they love.
The nearly $700 billion restaurant industry is facing new and significant challenges with pressured growth and margins as it adapts to on-demand commerce, exacerbated by COVID-19. COVID-19 has forced many restaurants (particularly independent and small chain restaurants) to close their doors temporarily or permanently. Nearly all restaurants that remain open for business have had to shift their operational model to be off-premise focused. We have helped our restaurant customers to launch new capabilities to meet the new consumer needs: delivery, curbside pickup, and tableside digital ordering.
We believe that our success is distinctly aligned with the long-term success of the restaurants we serve. In January 2020, Nation’s Restaurant News’ named me as the #1 most powerful restaurant executive in its 2020 Power List. I was deeply honored by this recognition of Olo’s important role in the restaurant industry. We know that Olo’s responsibility to perform has never been greater. We built Olo to align with our restaurant customers and to help them continue to thrive. As we have stepped up to help our customers manage through the COVID-19 crisis as a mission-critical component of the essential service restaurant industry, we are even more driven by our mission to help our customers survive and thrive.
If you believe that consumers like restaurant food and on-demand commerce, we hope you will also believe in the core tenets of Olo’s ongoing success. We are the restaurant industry’s leading open SaaS platform. Our first-scaler advantage enabled us to build industry wide solutions like Dispatch (nationwide same-hour delivery-as-a-service) and Rails (aggregator channel and revenue management). As of December 31, 2020, 71% of our customers used all three of our modules because these products met their needs and the shifting demands of consumers. However, as we model our opportunity over 15 years into our journey, we believe there is an incredible opportunity to add more restaurant customers, sales volume, and product offerings. That’s our not-so-secret formula. Although we have incurred significant losses since inception and we have a substantial accumulated deficit, these losses and accumulated deficit are a result of the substantial investments we made to grow our business and we expect to make significant expenditures to expand our business in the future. We will continue to invest in Team Olo and Olo’s customers, community, and partners, in keeping with Olo Director Danny Meyer’s “Enlightened Hospitality” philosophy that we believe to be in our stakeholders’ long-term best interest.
The restaurant industry is our first, not our only vertical. For now, we remain laser-focused on restaurants and supporting our restaurant customers. However, we believe that the on-demand commerce platform we are building for the restaurant industry is ultimately transferable to other retail verticals like the grocery stores, convenience stores, and others that have faced similar struggles adopting traditional on-demand commerce.
We have miles to go before we sleep. I’ve been running Olo for over 15 years. I’d sign on to do it for the rest of my career, if given the chance. I’ve never been more excited about Olo’s opportunity and driven by our mission than I am today. Luckily, that has been true each day that I can remember and I’m confident that it will be true for a lifetime of tomorrows.
We would be honored for you to join us on this historic journey.
My best, Noah
102
Table of Contents
Overview
Olo provides a leading cloud-based, on-demand commerce platform for multi-location restaurant brands.
Our platform powers restaurant brands’ on-demand commerce operations, enabling digital ordering and delivery, while further strengthening and enhancing the restaurants’ direct consumer relationships. Consumers today expect more on-demand convenience and personalization from restaurants, particularly through digital channels, but many restaurants lack the in-house infrastructure and expertise to satisfy this increasing demand in a cost-effective manner. Olo provides restaurants with a business-to-business-to-consumer, enterprise-grade, open SaaS platform to manage their complex digital businesses and enable fast and more personalized experiences for their customers. Our platform and application programming interfaces, or APIs, seamlessly integrate with a wide range of solutions, unifying disparate technologies across the restaurant ecosystem. Restaurant brands rely on Olo to increase their digital and in-store sales, maximize profitability, establish and maintain direct consumer relationships, and collect, protect, and leverage valuable consumer data. As a result, we nearly doubled the gross merchandise value, or GMV, which we define as the gross value of orders processed through our platform, in each of the last five years and reached nearly $14.6 billion in GMV during the year ended December 31, 2020. Our well-established platform has led many of the major publicly traded and top 50 fastest growing private restaurant brands, measured by overall sales, in the United States to work with us and has been a factor in our high gross brand retention rate. Further, industry-recognized outlets, including Restaurant Business Online, QSR Magazine, and AP News, have also deemed Olo the leading food ordering platform for the restaurant industry.
The $1.6 trillion food industry is one of the largest consumer markets in the United States. According to the National Restaurant Association, restaurants accounted for $863 billion of that spend in 2019, surpassing grocery in aggregate consumer spending, before dropping to $659 billion in 2020 as a result of COVID-19. However, consumer spending on restaurants is expected to rebound to $1.1 trillion by 2024 according to analysis by The Freedonia Group. Growing consumer demand for convenience has made off-premise consumption, which includes take-out, drive-thru, and delivery orders, the single largest contributor to restaurant industry growth. Even before the onset of the COVID-19 pandemic, off-premise consumption accounted for 60% of restaurant orders in 2020, and was expected to contribute 70% to 80% of total restaurant industry growth in the next five years, according to the National Restaurant Association. Meanwhile, delivery continues to grow as a percentage of sales. The average portion of total sales from third-party delivery in the 12 months ending August 2019 was 6.5%. Even prior to the COVID-19 pandemic, that was expected to increase to 10% in 2020. As consumers have become accustomed to the immediate convenience of on-demand commerce, they are demanding the same digital experience from restaurants, placing significant pressure on restaurants to deploy solutions. This demand has only accelerated since the onset of COVID-19, as on-demand commerce has become a necessity for the majority of restaurants.
Restaurants are an incredibly complex segment of the retail industry, making their shift to on-demand commerce especially challenging. The four walls of the restaurant uniquely serve as both the factory and showroom floor: restaurant operators must manage the intricacies of food production and customer service simultaneously while providing the high-quality, consistency, and hospitality that engenders consumer loyalty and trust. Furthermore, restaurants serve food that is perishable, has near infinite configurations, and must be made to order for just-in-time consumption under strict regulatory standards for health and safety. Most restaurant brands, which we define as a specific restaurant brand or restaurant chain, do not have the expertise or the resources to develop their own solutions to manage on-demand commerce and are more acutely challenged because their in-store technology is
103
Table of Contents
comprised of a fragmented set of legacy solutions, many of which were developed before the internet. At the same time, delivery service providers, or DSPs, and ordering aggregators have catalyzed digital demand, but pose new challenges for restaurant brands through lower long-term profitability, increased complexity, disintermediation of the restaurant’s direct relationship with the consumer and, increasingly, directly competitive food offerings. Additionally, restaurants face increasing economic pressure with an intensely competitive landscape, which has only been exacerbated by the COVID-19 pandemic. Due to its unique complexities and challenges, the restaurant industry has historically been one of the lowest penetrated on-demand commerce segments of the retail industry, with digital sales accounting for less than 10% of sales, according to a report published by Cowen Equity Research in 2019.
Our open SaaS platform is purpose-built to meet these complex needs and align with the interests of the restaurant industry. For over 10 years, we have developed our platform in collaboration with many of the leading restaurant brands in the United States. We believe our platform is the only independent open SaaS platform for restaurants to provide seamless digital ordering and efficient delivery enablement, offering centralized management of a restaurant’s entire digital business. Our platform includes the following core modules:
| ● | Ordering. A fully-integrated, white-label, on-demand commerce solution, enabling consumers to order directly from and pay restaurants via mobile, web, kiosk, car, voice, and other digital channels. |
| ● | Dispatch. A fulfillment solution, enabling restaurants to offer, manage and expand direct delivery while optimizing price, timing, and service quality. |
| ● | Rails. An aggregator and channel management solution, allowing restaurants to control and syndicate menu, pricing, location data, and availability, while directly integrating and optimizing orders from third-parties into the restaurants’ point-of-sale, or POS, systems. |
Leading restaurant brands trust Olo’s enterprise-grade platform for its capabilities, reliability, security, scalability, and interoperability. Our platform currently handles, on average, nearly 2 million orders per day. We continually invest in architectural improvements so our system can scale in tandem with our continued growth. Additionally, both internal and external security experts frequently test our system for vulnerabilities. We have never experienced a material breach of customer or consumer data. Our open SaaS platform integrates with over 100 restaurant technology solutions including POS systems, aggregators, DSPs, payment processors, user experience, or UX, and user interface, or UI, providers, and loyalty programs, giving our customers significant control over the configuration and features of their distinct digital offering.
We are the exclusive direct digital ordering provider for our leading brands across all service models of the restaurant industry, including quick service, fast casual, casual, family, and snack food. Our customers include major publicly traded and the fastest growing private restaurant brands such as Chili’s, Wingstop, Shake Shack, Five Guys, and sweetgreen. As of December 31, 2020, we had approximately 400 brand customers representing over 64,000 active locations using our platform. Our average initial contract length is generally three years with continuous one-year automatic renewal periods, providing visibility into our future financial performance. Our enterprise brands, meaning those brands having 50 or more locations, are also highly loyal. Over the last five years, on average nearly 99% of our enterprise brand customers, which accounted for 91% of our total active locations as of December 31, 2020, have continued using our Ordering module each year. Our customers and the success they have had increasing their digital sales volumes are the best reflection of the value of our platform. Our customers’ digital same-store sales has increased, on average, by 44% for the month ended December 31, 2019 when compared to the month ended December 31, 2018. This trend has further accelerated over the past year, with digital same-store sales up 156% for the month ended December 31, 2020 when compared to the month ended December 31, 2019.
104
Table of Contents
We have a highly efficient go-to-market model as a result of our industry thought leadership, partnership approach with our restaurant customers, and experienced enterprise sales, customer success, and deployment teams. Unlike other enterprise software businesses, where the sales team works to add a single location or division and expand to others, we enter into relationships at the brand’s corporate level and secure exclusivity across all company-owned and franchise locations. This enables us to deploy our modules across all new and existing brand locations without any additional sales and marketing costs, and upsell new offerings to the brand itself, rather than each individual location. As of December 31, 2019 and 2020, 44% and 71% of our customers used all three of our modules, respectively.
We refer to our business model as a transactional SaaS model as it includes both subscription and transaction-based revenue streams, and we designed it to align with our customers’ success. Our model allows our customers to forego the cost of building, maintaining, and securing their own digital ordering and delivery platforms and to retain direct relationships with their consumers while maximizing profitability. Our hybrid-pricing model provides us with a predictable revenue stream and enables us to further grow our revenue as our customers increase their digital order volume. We generate subscription revenue from our Ordering module and transaction revenue from our Rails and Dispatch modules. We charge our customers a fixed monthly subscription fee per restaurant location for access to our Ordering module. In addition, a growing portion of our customers purchase an allotment of monthly orders for a fixed monthly fee and pay us an additional fee for each excess order, which we also consider to be subscription revenue. Our transaction revenue includes revenue generated from our Rails and Dispatch modules. Customers who subscribe to our Rails and Dispatch modules pay a fee on a per transaction basis. In most cases, we also charge aggregators, channel partners, and other service providers in our ecosystem on a per transaction basis for access to our Rails and Dispatch modules. We also derive transactional revenue from other products, including Network, which allows brands to take orders from non-marketplace digital channels (e.g., Google Food Ordering, which enables restaurants to fulfill orders directly through Google search results and Maps pages). These products generate fees predominantly through revenue sharing agreements with partners. For the years ended December 31, 2018, 2019, and 2020, 93.2%, 80.8%, and 56.7% of our platform revenue was subscription revenue, respectively, and 6.8%, 19.2%, and 43.3% was transaction revenue, respectively.
Our business has experienced rapid growth in a highly capital efficient manner. Since inception 15 years ago, we have raised less than $100.0 million of primary investment capital, net of share repurchases, and as of December 31, 2020, we had cash and cash equivalents of $75.8 million with no outstanding debt. During the years ended December 31, 2018, 2019, and 2020, we generated revenue of $31.8 million, $50.7 million, and $98.4 million, respectively, representing year-over-year growth of 59.4% and 94.2%. During the years ended December 31, 2018, 2019, and 2020, we generated gross profit of $21.0 million, $35.1 million, and $79.8 million, respectively, or 66.0%, 69.3% and 81.0% as a percentage of revenue, respectively. During the years ended December 31, 2018 and 2019, we incurred net losses of $11.6 million and $8.3 million, respectively and, during the year ended December 31, 2020, we generated net income of $3.1 million. During the years ended December 31, 2018 and 2019, we incurred operating losses of $8.8 million and $5.1 million, respectively, and during the year ended December 31, 2020, we generated operating income of $16.1 million. During the years ended December 31, 2018 and 2019, we incurred non-GAAP operating losses of $4.6 million and $0.2 million, respectively, and during the year ended December 31, 2020, we generated non-GAAP operating income of $21.8 million. See the section titled “Management’s Discussion and Analysis of Financial Condition and Results of Operations” for additional information on our non-GAAP metrics.
COVID-19 Update
On March 11, 2020, the World Health Organization declared COVID-19 a global pandemic, impacting communities in the United States and across the world. Responses to the outbreak continue
105
Table of Contents
to develop, as consequences have affected communities and economies across the world. State mandated lockdowns have adversely impacted many restaurants, as public health regulations transformed or even halted daily operations. In order to stay in business, restaurants were forced to more aggressively adopt digital solutions to provide on-demand services, off-premise dining and delivery solutions for consumers, if they were not already. In just the first few weeks of the COVID-19 shutdowns in the United States, 59% of restaurant operators added new curbside pickup offerings and 20% added new online ordering or pre-pay functionalities as a direct response to the coronavirus pandemic, according to a survey by eMarketer. Consumers were receptive to these changes, with 30% of them affirming that they had begun using restaurant delivery and 50% affirming they had begun take out services, mostly due to COVID-19, according to a report by Packaged Facts.
Although we are optimistic that the emphasis on on-demand commerce in the food services industry will be an enduring trend, we do not have certainty on the long-term impact these developments will have on the industry. The degree of the pandemic’s effect on our restaurant partners across the food services industry will depend on many factors, particularly on government regulations and their impact on the financial viability of restaurant operations as well as the duration of the pandemic. We will continue to monitor these developments and their implications on our business. The COVID-19 pandemic could materially adversely impact our business, financial condition, and results of operations. In the absence of updated industry sources giving effect to the market shifts precipitated by COVID-19, we have included in this prospectus select market research that was published prior to the COVID-19 outbreak and without considerations for its potential effects. Refer to “Risk Factors” in this prospectus for additional information regarding the impact of COVID-19 on our business.
| ● | Impact on Our Operations: |
During the month of March, in accordance with local, state, and national regulations, we closed our offices in New York, and transitioned our employees to work-from-home and efficiently adapted our operations to a remote working environment. In addition, we were able to operate without terminating or furloughing our employees. As the pandemic continued, we grew our employee base to scale the business in order to meet the increased customer demands we were facing.
We continue to monitor updates and consider regulatory guidance for reopening office locations. We believe that we are well equipped to support full or partial remote work without disruption to our business.
| ● | Impact on Our Customers: |
As many restaurants faced on-premise dining restrictions, our customers needed to transition and adapt their businesses quickly. In a recent survey of Olo customers, approximately 70% of respondents offered more off-premise delivery and pick-up options in response to COVID-19. We focused on optimizing the deployment process for our new customers and offered adaptive solutions to help them navigate through this challenging business environment. We reprioritized our strategic roadmap to address the most important solutions for our customers, including enhancements to our curbside pick-up functionality. As curbside pick-up became an even more integral component of restaurant transactions, we further enabled our platform capabilities so restaurants could more efficiently manage these orders, adding quick response, or QR, code functionality, kiosk ordering solutions, and additional ecosystem partners. We engaged with our customers to collaborate on implementing the most relevant short- and long-term solutions. In addition to helping our customer brands react to COVID-19, we recognized the importance of supporting the restaurant industry and front-line workers directly and made donations to the Restaurant Employee Relief Fund.
106
Table of Contents
| ● | Impact on Our Financials: |
Our revenue for the quarters ended March 31, 2020, June 30, 2020, September 30, 2020, and December 31, 2020 increased by 55.2%, 100.2%, 94.2%, and 117.6%, respectively, compared to 2019. For the years ended December 31, 2018, 2019, and 2020, 93.2%, 80.8%, and 56.7% of our platform revenue was subscription revenue, respectively, and 6.8%, 19.2%, and 43.3% was transaction revenue, respectively. While many restaurants have been struggling during this period, we have been uniquely positioned to expand our footprint and help support the restaurant industry when it was most in need. While we expect on-premise dining to return over time, we believe that off-premise offerings will continue to be an essential part of a restaurant’s operations. See “Components of Results of Operations - Revenue” for a further discussion of the impact of COVID-19 and the associated shelter-in-place orders on our business.
Industry Background
There are a number of important industry trends driving our market opportunity.
| ● | Restaurants are facing complex challenges and are under significant economic pressure. The restaurant landscape has become increasingly dynamic, with competition coming from existing restaurant brands, new restaurant brands, aggregators and ghost kitchens, that frequently have sophisticated digital, marketing, ordering, and distribution strategies. As a result, it is difficult for some restaurants to attract and retain loyal consumers. Moreover, restaurant brands are increasingly having to share their revenue with aggregators. These challenges have only been exacerbated by COVID-19 as many governments imposed restrictions to on-premise dining, resulting in significant financial losses and many closures. All restaurant operators have had to adapt to these new, complex challenges or risk losing their business. There is now a real urgency for restaurants to adopt cost-effective digital solutions in order to support their businesses and drive margin expansion and incremental sales over the longer term. |
| ● | The restaurant industry is massive and enterprises are rapidly expanding market share. The nearly $700 billion restaurant industry is undergoing a dynamic transformation, being forced to adapt to the new market environment created by COVID-19. According to the National Restaurant Association, the restaurant industry’s share of the dollars spent on food increased from 25% in 1955 to 51% in 2019, representing the first time in history that restaurants have surpassed grocery in aggregate sales. While restaurants have lost some traction against grocery due to COVID-19, we expect the increase in restaurant spend when compared to grocery to continue over the long-term, and according to analysis by The Freedonia Group, consumer spending on restaurants is expected to increase to $1.1 trillion by 2024. Enterprise restaurant brands in particular are rapidly increasing their share of the market as they are able to leverage their scale to more effectively deploy on-demand commerce solutions than many small and medium business, or SMB restaurants. We expect consumers will continue to demand digital solutions from restaurants that offer more convenience and personalization, helping to drive sales and expand the industry. |
| ● | Consumer behavior is shifting towards on-demand commerce convenience. In today’s on-demand economy, and even more so during the COVID-19 pandemic, consumers expect goods and services to be easily ordered through digital means. According to a 2019 Salesforce.com, Inc. publication, 66% of all consumers cite instant and on-demand fulfillment of purchases as important and approximately 50% say that they will switch brands if a company does not proactively anticipate their needs. The COVID-19 |
107
Table of Contents
| pandemic has only accelerated this long-term shift in consumer demand for adaptive on-demand commerce platforms. We believe these trends will continue to accelerate in the restaurant industry in particular as advances in technology allow restaurants to further reduce friction in digital ordering and fulfillment to further satisfy consumers’ new engagement preferences. |
| ● | Off-premise dining is the main engine of restaurant growth, with pickup continuing to lead. Off-premise dining has continued to grow rapidly, accounting for 63% of U.S. restaurant transactions in 2019. Prior to the COVID-19 pandemic, off-premise dining had been expected to contribute 70% to 80% of total restaurant industry growth in the next five years according to the National Restaurant Association. Since then, off-premise offerings have become an even more critical part of a restaurant’s business and long-term growth. While off-premise consumption is growing rapidly, only approximately 3% of total restaurant orders were fulfilled through delivery in 2018, and 39% and 21% were attributed to take-out and drive-thru, respectively. Restaurants operators have known the importance |
| of off-premise offerings with 78% of operators identifying off-premise solutions as a strategic priority, according to the State of the Industry Report published by the National Restaurant Association in 2019. COVID-19 has accelerated this shift with at least 27% of restaurant operators reporting having added new off-premise delivery options since the pandemic began, according to a survey by the National Restaurant Association. While consumers currently appear less apprehensive to visit restaurants and dine-in than they did at the beginning of the pandemic, usage of delivery and carry-out options remains higher than pre-COVID-19 levels. According to a recent survey by the National Restaurant Association, approximately 70% of restaurant operators across service categories plan to keep the changes they made to their restaurant after COVID-19 has subsided. |
| ● | Digital restaurant ordering is experiencing rapid growth in a shifting landscape. Both direct and indirect digital ordering channels are powering this expansion. Aggregators created consumer applications to meet the growing demand for convenient restaurant food, helping expand off-premise dining. In addition, major consumer facing platforms are embedding food ordering into products such as maps and search results, making it even more convenient for consumers to place orders from their favorite restaurant brands. Furthermore, COVID-19 tailwinds have accelerated this expansion, forcing restaurants to develop direct digital ordering operations or leverage indirect channels to meet customers’ digital demands through this unpredictable period. These channels are expected to drive the expansion of the U.S. online food delivery market, a subset of the restaurant digital ordering market, from $356 billion in 2019 to $470 billion by 2025, according to industry research. |
| ● | Restaurant brands must evolve to own digital relationships with their consumers. Like any other retailer, understanding and owning the consumer relationship is vital to restaurants as it allows them to better analyze interactions, customize offerings, and maximize the long-term value of their consumers. However, restaurants risk losing direct consumer relationships if they are heavily reliant on aggregators, which generally do not provide visibility into who is ordering or enable a restaurant to articulate its unique brand value. According to a recent survey by the National Restaurant Association, 64% of adults prefer to order directly through the restaurant for delivery, compared to only 18% who prefer to order through a third-party service for delivery. In fact, over 70% of Olo customers in a recent survey indicated that their primary reason to own their own branded digital storefront was to own a direct relationship with their guests. The majority of respondents have 50% or less of their online orders coming through an aggregator compared to their own channel, and they expect their mix of aggregator order volumes to decrease in the future relative to their own channel. Additionally, aggregators typically limit a restaurant’s |
108
Table of Contents
| ability to collect and use data about consumers and orders transacted through the aggregator. Consumers also value this direct and personal connectivity with restaurant brands, and we believe consumers would rather interact directly with a brand than through an intermediary. |
| ● | On-demand commerce has substantial opportunity to expand penetration in the restaurant industry. The nearly $700 billion restaurant market in the United States continues to be one of the most underpenetrated in terms of on-demand commerce at less than 10% of industry sales, according to research published by Cowen Equity Research, as well as U.S. government data. In comparison, sectors such as books and electronics have digital penetration well over 50%. Restaurants are uniquely positioned to benefit from consumers’ demand for digital convenience, but are limited by significant complexities in the restaurant ecosystem, which have slowed penetration to-date. |
Complexities of the Current Ecosystem
The key complexities that hinder restaurants’ digital transformation progress include:
POS and Technology Integration
| ● | Inconsistent technologies within and across brand locations. Restaurant brands historically have not standardized the type of technology platforms that must be deployed across their locations. For example, in our survey, 70% of respondents indicated they use two to four different technology providers to collect orders across various channels. This has led to significant differences in the types of technology that restaurants use across a brand and even within a given restaurant location. |
| ● | Multiple platforms within a restaurant. Many brands have multiple POS systems, payment processors, and now tablets to manage incoming orders across various aggregators. In addition, many of these technologies have become deeply entrenched into their operations, making them difficult to replace with more modern solutions. These platforms cannot act quickly and harmoniously to meet the changing needs of restaurants, particularly during the COVID-19 pandemic. |
| ● | Disparate integrations across the ecosystem. Many restaurants have adopted narrow point solutions that do not integrate seamlessly with other systems, such as POS systems, aggregators, DSPs, payment processors, UI and UX providers, and loyalty programs. Restaurant location operators often lack the technical expertise and resources necessary to integrate both legacy and modern technologies. |
| ● | Static, legacy software infrastructure. Legacy restaurant systems were not built for modern, cloud–based environments. As a result, many lack the reliability, scalability, and security capabilities that today’s SaaS solutions offer, leaving restaurants and their consumer data vulnerable. Furthermore, brands are unable to access their consumer data, as it resides in different systems and databases that cannot communicate with each other. |
Food and Menu Management
| ● | Numerous, highly modifiable menu items. Restaurant menus are inherently complex, highly configurable, and frequently updated for changing consumer preferences, out-of-stock ingredients, or product recalls. In addition, restaurants must ensure menus and pricing are always accurately reflected across their various channels to ensure |
109
Table of Contents
| consumers have the latest information and receive the exact food they order, particularly as food allergies, dietary preferences, and other health issues become more prevalent. This has made it challenging for restaurant brands, who are increasingly expected to offer intuitive digital menus where consumers can add, subtract, or modify a wide variety of ingredients or menu items, creating a nearly infinite number of order permutations. |
Order Channels
| ● | Multiple ordering channels. Today’s restaurants need to seamlessly manage on-premise and off-premise operations to ensure they provide the optimal experience to all of their consumers. In-store orders are only one part of the overall operation, as restaurants receive off-premise orders from several different direct and indirect channels, which often require multiple POS systems and tablets at a single location. Food orders can be placed directly through restaurants’ mobile applications or over the phone and indirectly from aggregators at the same time. Many restaurants are not equipped to balance this on-premise and off-premise dynamic, let alone the direct and indirect channels of ordering. |
| ● | Shifting from serial to parallel processing. Restaurants are accustomed to serial order processing, which means that they receive an order from an on-premise consumer and fulfill it accordingly. With the rise of off-premise dining and multiple direct and indirect channels for ordering, restaurants increasingly receive multiple orders simultaneously. Legacy restaurant technology is not properly equipped to centralize and track these orders or help restaurants prioritize orders to ensure high quality fulfillment or to provide accurate estimates of when the food will be ready. Restaurants require modernization to better accommodate parallel processing and streamline their operations. |
Operations and Logistics
| ● | Complex, on-demand logistics management. A report published by Cowen Equity Research in 2019 projects that the majority of restaurant growth will come from expanded off-premises dining, which we expect will continue to place significant operational burdens on restaurants. Restaurant staff must prepare food at exactly the right time to ensure optimal quality. Restaurants must adapt locations to better accommodate take-out orders and manage multiple DSPs to ensure consumers get their food reliably at a cost-effective price. The COVID-19 pandemic has only exacerbated these complexities, as restaurants have had to adapt their operations to accommodate the massive increase in delivery and take-out orders, in particular. |
Building a Digital Brand and Owning the Consumer Relationship
| ● | Navigating the shift to digital branding. Many restaurants have spent decades building brand equity with their consumers and securing their loyalty. Meanwhile, consumers themselves are seeking direct engagement with brands through digital channels. However, restaurants lack the tools they need to interact and engage with their consumers across digital channels and to foster those direct relationships. |
| ● | Competition for the direct consumer relationship. As aggregators have scaled, they have often disintermediated restaurants’ direct consumer relationships. Each consumer is more valuable to an aggregator than any individual restaurant brand and, therefore, aggregators can afford to spend more than a particular restaurant brand to acquire a consumer. These aggregators are digitally savvy, have more capabilities in search engine marketing and optimization, and are specialists at leveraging data to acquire consumers |
110
Table of Contents
| and extract much higher customer lifetime value relative to the cost of acquiring a consumer. Many restaurants do not have the digital aptitude to stay competitive, and are at risk of losing direct contact with their consumers. |
| ● | Inability to access and leverage consumer data. Establishing direct digital relationships enables restaurants to collect data and learn from consumer interactions, evolve their offerings, and drive increased consumer loyalty. However, restaurants’ legacy technologies generally do not have the capabilities to collect, organize, and analyze these consumer data sets. There are also no major customer relationship management solutions built exclusively for the restaurant industry at scale. As a result, restaurants are forced to collect and integrate data from disparate systems, making it almost impossible to draw impactful, data-driven insights. |
Our Platform
We provide the leading on-demand commerce platform designed for multi-location restaurant brands. Our customers use our software to create unique direct-to-consumer digital ordering experiences, manage orders across channels, and enable delivery across their restaurant locations. We have an open SaaS platform that seamlessly integrates with technology solutions throughout the restaurant ecosystem, including most POS systems, aggregators, DSPs, payment processors, UI and UX providers, and loyalty programs. We provide restaurants with a centralized system to manage their digital business and ensure consumers receive better, faster, and more personalized service while increasing restaurant order volume and improving yield at lower cost.
We engineered our platform to handle the most complex issues for the leading restaurant brands, but with the simplicity and ease-of-use required within an individual restaurant. We developed our infrastructure with application programming interfaces, or APIs, which facilitate interactions across and integrate with multiple software programs and components of the restaurant ecosystem. We enable more streamlined data collection and facilitate analytical decision-making, so restaurants can better understand and adapt to unique consumer preferences. We are constantly innovating and enhancing our platform, with our continuously deployed, multi-tenant architecture ensuring all restaurant locations are always using the latest technology.
Our platform includes the following core modules:
Ordering
| ● | Secure, white-label, direct-to-consumer, front-end solution enables consumers to directly order from and pay restaurants via via mobile, web, kiosk, car, voice, and other digital channels. |
| ● | Integrates with our customers’ back-end systems and provides a scalable digital ordering infrastructure behind custom front-end applications. |
Dispatch
| ● | Enables restaurants to offer and expand delivery for orders generated via their own websites and applications. |
| ● | Manages each restaurant’s delivery options and selects DSPs, including in-house couriers, based on optimal price, timing, availability, and other attributes. |
111
Table of Contents
Rails
| ● | Centralizes and manages location specific menu, pricing, and availability, enabling automatic updates across multiple ordering channels. |
| ● | Integrates orders from aggregators into a restaurant’s POS systems. |
Our Position in the Restaurant Industry
Restaurants rely on our enterprise-grade open SaaS platform to power their critically important digital ordering and fulfillment offerings. Our focus on developing solutions has aligned with restaurant brands’ interests, and our history of deploying our platform to approximately 400 restaurant brands through exclusive direct digital ordering relationships has allowed us to build what we believe is one of the largest technology ecosystems in the restaurant industry. We integrate with over 100 technology partners and believe that this positions us to be the only party able to unify and enhance the utility of disparate technologies across the industry, including POS systems, aggregators, DSPs, payment processors, UI and UX providers, and loyalty programs.
We believe that our approach to building this two-sided network, comprised of restaurants and technology partners, has given us a valuable position that is deeply embedded within the restaurant industry. We intend to expand our influence and position as we onboard new customer brands, integrate with additional modern or legacy software systems and technology providers, improve our platform’s functionality, develop new modules, continue to provide industry-leading security, and as our restaurant customers increasingly process orders through digital channels.
Key Benefits of Our Platform
Restaurants use our intuitive ordering, delivery, and aggregator enablement platform to streamline restaurant operations and provide a superior consumer experience. Our platform enables restaurants to overcome the complexities of building and growing a digital business, own the overall consumer relationship, and scale, secure, and centralize their on-demand commerce operations with our enterprise-grade technology. The key benefits of our platform include:
Overcome the Complexities of Restaurant On-Demand Commerce Operations
| ● | Utilize Olo as a centralized source of data. Our restaurant brand customers, many of whom leverage multiple technology providers across locations, can manage menus, including menu-item availability, and day-to-day operations with permission-based administration tools and reporting, utilizing Olo as a centralized source of data. |
| ● | Extensible, modular platform. We have an open SaaS platform that integrates with over 100 restaurant technology solutions across the restaurant ecosystem. These integrations allow us to streamline order processing and fulfillment, and keep information in sync with a variety of POS systems, aggregators, DSPs, payment processors, UX and UI providers, and loyalty programs. Our platform’s extensibility ensures restaurants are able to quickly adapt and address problems they face as the landscape rapidly evolves. |
| ● | Manage demand across platforms to optimize yield. Our Rails module consolidates demand across aggregators, allowing our customers to generate more orders through an intuitive, coordinated system. Our customers are able to monitor and parallel process orders across the various channels and more easily and accurately prioritize and fulfill orders. We also help our restaurant brand customers optimize yield during peak periods by prioritizing different ordering channels as needed to ensure the highest priority items are fulfilled while maximizing profitability. |
112
Table of Contents
| ● | Enable and manage a restaurant’s delivery functions across providers. Our Dispatch module enables restaurants to automatically select the optimal delivery provider for an individual order based on dozens of attributes, such as delivery time, order size or value, cost of delivery, or service level, for each individual order at each individual location. Restaurant brands are able to fulfill orders just-in-time to allow for a better consumer experience at a competitive cost. |
Enhance and Own the Consumer Experience
| ● | Own the consumer relationship. Our platform enables restaurants to provide individually branded and direct-to-consumer experiences across devices through our web and mobile front-end or via customized consumer experiences using our APIs and third-party UI and UX providers. This unique consumer experience extends beyond aesthetic and operative functionality to expanded order offerings like upsell, group ordering, and loyalty programs. With Olo, restaurants know their consumers better and can more effectively meet their needs while maximizing on-demand commerce results. |
| ● | Leverage powerful data and analytics to guarantee the highest quality consumer experience. We enable our customers to collect a significant amount of data that they can use to generate valuable insights into their consumers’ ordering behaviors. Restaurant brands and their individual locations can leverage this data to better manage operations, provide consumers with a more personalized experience, and drive incremental sales. |
Scalable and Secure Operations with Enterprise Grade Technology
| ● | Built for ensuring scalability and reliability. Our software infrastructure is cloud-hosted and highly flexible with the ability to handle large spikes in traffic and withstand many failure scenarios. Our high-availability, frequently deployed, multi-tenant architecture ensures that all of our customers are able to operate with the latest features and the newest innovations of the latest version of our platform. While our platform currently handles, on average, nearly 2 million orders per day, we continually invest in architectural improvements so our system can scale in tandem with our continued growth. |
| ● | Enterprise-grade security and privacy. Our customers trust our platform with their most sensitive consumer and business data and many have run security assessments of our platform to verify that it has robust security capable of protecting their consumer data. We also employ in-house Blue and Red Security Teams that constantly monitor the platform, testing for and addressing vulnerabilities. Our technology also incorporates privacy-safe practices and tools as an integral and foundational part of our platform’s approach. Privacy best practices are proactively embedded into our systems and infrastructure. |
| ● | Secure by design. Our software engineering practices consider, evaluate and manage risk throughout the design, development and deployment phases to provide best-in-class security across our platform. This includes risk and threat evaluation at the inception of all of our products and services, leveraging zero trust, least privilege and role based access concepts, secure development training, avoiding common security anti-patterns, and extensive automated and manual security testing. Our security program also includes regular third-party examinations for security, including annual PCI-DSS Attestation of Compliance, and SOC 1 and SOC 2 audits. The SOC 2 report demonstrates our compliance with the American Institute of Certified Public Accountants’ trust service principles criteria for security, availability, confidentiality, and processing integrity. |
113
Table of Contents
Our Market Opportunity
We believe our total addressable market opportunity is $7 billion based on our current product offerings and focus on enterprise restaurants primarily in the United States. To arrive at this figure, we determined the number of enterprise restaurant locations and number of orders that we could generate revenue from on a per location basis. According to a 2019 publication by the NPD Group, there are approximately 300,000 enterprise restaurant locations across the United States. We determined the number of orders per enterprise location, based on industry research, by dividing their total sales by the average order value in the United States. To determine our opportunity per location, we then multiplied the implied number of orders by the percentage of digital orders, and by our actual average fee per order, and then added our actual annual average subscription fee per location as of December 31, 2020 to get the estimated total annual average revenue per restaurant location. This figure was then multiplied by the number of enterprise locations to arrive at the U.S. estimate.
Driven by the COVID-19 pandemic, digital platforms are enabling many more restaurant transactions, including on-premise solutions such as table-top dining through the use of QR codes and kiosk ordering. While this is one of many potential opportunities, we believe that we can fulfill these transactions as we introduce new solutions to enable these services. By providing more products and services to our customers, we believe we can increase our fees per transaction, which could expand our total addressable market further to $15 billion.
As we increase our efforts to pursue SMB restaurants, we believe our total addressable market will expand further. This is based on an increase in the total number of SMB restaurants we serve, which would expand our market potential by an approximately 400,000 additional estimated restaurant locations. If successful, we believe this expansion would allow Olo to reach a total addressable market of $20 billion. We believe our opportunity outside of the United States is at least as large as our domestic opportunity, implying a total global addressable market of $40 billion.
Our Growth Strategies
We aim to be the leading on-demand commerce platform for the restaurant industry. The principal components of our growth strategy are:
| ● | Add new large multi-location and high-growth restaurant brands and scale with them. We believe there is a substantial opportunity to continue to grow our customer base within the U.S. restaurant industry, adding to our approximately 400 existing brands across more than 64,000 active locations. We intend to continue to drive new customer growth by leveraging our brand and experience within the industry, and expanding our sales and marketing efforts. We have also historically pursued and will continue to target the most well-capitalized, fastest growing restaurant brands in the industry. As our restaurant brand customers open new locations, we are well-positioned to organically grow our revenue with little to no incremental sales and marketing costs to target additional locations. |
| ● | Upsell existing customers additional modules. As of December 31, 2019 and 2020, 44% and 71% of our customers used all three of our modules, respectively. We believe that we are well-positioned to upsell our remaining customers, as our modules provide significant value, are simple to add, operate seamlessly together, and improve restaurant brands’ on-demand commerce capabilities and consumer experience. |
| ● | Enable higher transaction volume. We will continue to work with our existing restaurant customers to enable higher transaction volumes at their locations particularly through direct channels. As on-demand commerce grows to represent a larger share of total |
114
Table of Contents
| off-premise food consumption, we expect to significantly benefit from this secular trend through increased revenue. As we continue to expand our product offerings across both on and off-premise dining and improve our current software, we also believe there is an opportunity to increase our share of the transaction volume that flows through our platform both through direct channels and revenues from aggregators. |
| ● | Develop and launch new product offerings. We intend to continue to invest in expanding the functionality of our current platform and broadening capabilities that address new opportunities, particularly around payments, on-premise dining, and data analytics. We plan to continue broadening our new product offerings for on-premise transactions, such as table top ordering, as the COVID-19 impacted restaurant landscape offers increased opportunity for technology integration even for on-premise dining. We believe this strategy will provide new avenues for growth and allow us to continue to deliver differentiated high-value outcomes to both our customers and stockholders. |
| ● | Expand our ecosystem. We plan to expand our current ecosystem of developers, user experience designers, and other partners to better support our customers, attract new customers, and strengthen our competitive position. We believe that we can leverage our partnerships with POS systems, aggregators, DSPs, payment processors, UX and UI providers, and loyalty programs to deliver additional value to our customers. |
| ● | Grow our longer-term market opportunity. While we have not made any significant investments in this area to date, we believe there is an opportunity to partner with SMB brands to enable their on-demand commerce presence. Additionally, as many of our customers operate internationally, we believe there is a robust opportunity to expand their usage of our platform outside of the United States. We also believe that our platform can be applied to other verticals beyond the restaurant industry that are undergoing similar digital transformations. For example, we currently work with a number of grocery chains and convenience stores who use our software to help their consumers order ready-to-eat meals, and we may expand our efforts in these or other verticals in the future. |
Our Product Modules
The Olo platform provides restaurant brands with the capabilities necessary to develop, provision, and operate best-in-class, operationally-scalable digital ordering and delivery programs. Our platform provides digital order processing, in-restaurant order management, delivery enablement, and digital channel management features suitable for enterprise, multi-location brands regardless of service model, food type, and scale of operations. We designed our transactional SaaS business model to align with our customers’ success, as it includes both subscription and transaction-based revenue streams. We generate subscription revenue from our Ordering module and transaction revenue from our Rails and Dispatch modules. We charge our customers a fixed monthly subscription fee that is priced in tiers per restaurant location for access to our Ordering module. In addition, a growing portion of our customers purchase an allotment of monthly orders for a fixed monthly fee and pay us an additional fee for each excess order, which we also consider to be subscription revenue. Our transaction revenue includes revenue generated from our Rails and Dispatch modules. Customers who subscribe to our Rails and Dispatch modules pay a fee on a per transaction basis.
Olo has organized its platform into three principal product modules:
Ordering Module. Our Ordering module enables restaurants to provide seamless, fully-branded digital ordering programs to their consumers, and to process, manage, and integrate digital orders from direct and indirect channels into the restaurants’ other legacy systems.
115
Table of Contents
The key capabilities of our Ordering module include:
Create Customized Ordering Channels
| ● | White-label native mobile applications (iOS and Android), web, phone-in order-taking application, and other digital channels that are customizable to reflect elements of a brand’s identity. |
| ● | User-interface APIs facilitate the development of rich, fully custom consumer experiences across digital channels, such as mobile apps, kiosks, interactive voice applications, and other digital channels. |
Manage Complex Menus
| ● | Store and host discrete versions of the restaurant’s menus that include consumer-friendly descriptions, high resolution, and ADA-compliant menu item images. |
| ● | Synchronize and manage menu item availability, ingredient modifier availability, and prices on a per-location basis, including limited-time or regional offers, out of stock items or modifiers and prices, with integrations between established POS and menu management systems. |
Process and Monitor Orders and Restaurant Operations
| ● | Transmit orders to the restaurant for preparation and order fulfilment via integrations to established in-restaurant systems, including POS, menu management systems, and kitchen display systems, or KDS. |
| ● | Establish and implement distinct ordering rules and limitations for each order type, including by setting minimum and maximum order size, or by establishing menu item availability for given meal occasions (individual meals, catering), dayparts (breakfast, lunch, dinner), and handoff methods (drive-thru, delivery, in-restaurant pickup, curbside pickup, dine-in), on a brand-wide or per-location basis. |
| ● | Complete ordering functionality for commercial food preparation kitchens and virtual branded concepts with no retail dining space. |
| ● | Facilitate centralized telephone ordering via our optional Switchboard offering, which modernizes phone orders, in some cases enabling order entry to occur offsite, allowing in-restaurant employees to focus on consumers in the restaurant. The responsive web UI provides flexibility to those store locations choosing to leverage in-store employees to take phone-in orders via a mobile device, such as a tablet. |
| ● | Provide easy-to-navigate in-restaurant order management via Expo, our tablet-friendly web application intended for use by restaurant staff, which offers visibility into past, current, and upcoming digital orders and pick-up methods from all direct and indirect digital channels, and highlights time-sensitive tasks. |
| ● | Utilize permission-based administration tools and reporting to both brand management and in-restaurant staff via the Olo dashboard. |
Enhance Consumer Engagement and Build Brand Loyalty
| ● | Create and manage one-time and multi-use promotions via the Olo Coupon Manager, which empowers restaurants to create compelling promotional offers, build brand loyalty, increase consumer engagement, and encourage repeat business. |
| ● | Retrieve, apply, and integrate with established consumer loyalty and rewards platforms. |
116
Table of Contents
| ● | Transmit consumer and transaction details to established loyalty and customer relationship management platforms via system integration, API integration, or webhooks. |
Dispatch Module. Dispatch enables delivery directly from the restaurant’s digital ordering program channels through a network of third-party DSPs and a brand’s own delivery couriers, if available.
The key capabilities of our Dispatch module include:
Enable Delivery
| ● | Integrate with a nationwide network of third-party DSPs that are operationalized together on a single software platform, in some cases offering up to eight different delivery providers per market and covering 97% of our customers’ U.S. store locations. |
| ● | Evaluate and select a DSP for each order in real time using a number of different criteria, including time, cost, or level of service, either on a brand-wide or per-location basis. With this flexibility, brands are able to partially or wholly subsidize the cost of delivery to the consumer. |
| ● | Apply preference to specific DSPs and exclude specific DSPs from participating on a brand-wide or per-location basis. |
Manage and Optimize Delivery Logistics
| ● | Include seamless integration with our Ordering module and APIs that allow for full integration to any third-party ordering platform, including direct integration to in-restaurant POS systems. |
| ● | Coordinate the arrival of a DSP or internal delivery personnel with the estimated time an order will be available for pickup in-restaurant to ensure food is of the highest quality by the time it reaches the consumer. |
| ● | Monitor and communicate status of en-route deliveries through to completion and provide alerts regarding status changes. |
| ● | Provide activity reports and consolidated billing for all deliveries with tools to resolve and adjust billing for unsatisfactory or cancelled deliveries on a brand-wide or per-location basis. |
| ● | Offer comprehensive tools for DSPs, allowing them to create their own delivery areas, optimize their participation by geography, time, and pricing, and expand demand and additional delivery trips for their drivers. |
Rails Module. Our Rails module facilitates the operational and systems integration of aggregators and other indirect channels, and better equips brands to handle multi-channel digital ordering and delivery at scale. Our Rails Premium offering drives direct digital orders and replicates the features of a more traditional affiliate type of model, sending orders to our customer’s locations via deep links on sites across the internet.
The key capabilities of our Rails module include:
| ● | Real-time syndication of menu, item availability, price, and location attributes to marketplace and channel partners via a robust API integration on a brand-wide or per-location basis. |
117
Table of Contents
| ● | Transmit marketplace orders via APIs to our Ordering module, and subsequently to all relevant in-restaurant systems such as POS and KDS. |
| ● | Fully integrate ordering partners into the Olo platform, without significant infrastructure and personnel investment. |
| ● | Eliminate the need for standalone order management tablets by direct API integrations. |
| ● | Provide permission-based administration tools and consolidated marketplace sales reporting to both brand management and in-restaurant staff via the Olo dashboard. |
Other Products. Beyond our core product modules, we offer several additional products:
| ● | Network. Allows brands to take orders from non-marketplace digital channels, including, among others, Google Food Ordering, which enables restaurants to fulfill orders directly through Google search results and Maps pages. |
| ● | Switchboard. Phone-in ordering platform that allows restaurants and third-party call centers to accept meal-time and catering orders for pick-up or delivery. The Switchboard software then sends these orders to the POS at a given restaurant. |
Our Restaurant Technology Ecosystem
Restaurants need to seamlessly manage on-premise and off-premise operations to ensure they provide the optimal experience to all of their consumers. This has generally required restaurants to integrate with and use solutions like POS systems, payments processors, fraud prevention solutions, loyalty programs, front-end designers, UX and UI providers, aggregators, and DSPs. We currently integrate with over 100 technology solutions. These solutions historically did not integrate together, as they offered competing services or non-standard technology. Our platform is the neutral solution that is able to integrate, unite, and partner with these players, thereby enabling restaurants to seamlessly manage their operations. We give restaurants the ability to pick and choose their technology providers. Our flexibility and large partner ecosystem is designed to ensure that our offering remains relevant and critical to our customers. We believe our decision to support a variety of technology partners using our API-first strategy is essential in ensuring that restaurants can efficiently meet the needs of consumers.
Building, enhancing, and growing our partner ecosystem is a critical component of our growth strategy. We have developed our ecosystem so that we can provide our customers with complementary offerings across a range of services that we do not focus on today. Our goal is to ensure that our customers always have the choice of using best-in-class providers across the restaurant industry, and we have grown our partner ecosystem, and allocated additional personnel to partner and developer support, as the needs of our customers have changed over time. Instead of locking our customers into a set of technology providers, we proactively seek innovative partners, and embrace partners introduced to us directly by our customers. Our developer and partner support teams work closely with our partners on technical and product issues, collaborating together with the goal of ensuring our mutual customers receive an excellent product.
Our Technology
Our managed multi-tenant, multi-partner SaaS platform is designed to provide our customers with enterprise-grade security, reliability, and performance. Because we have historically integrated with disparate and fragmented technology providers, we have invested significant development resources into connecting a variety of systems using APIs and other solutions. By sharing infrastructure and code across our customer base, we believe we will be able to further leverage our
118
Table of Contents
technology and technical infrastructure investment. The key components of our technology platform include:
| ● | Enterprise-grade security. Our customers trust our platform with their most sensitive consumer and business data and many have run security assessments of our platform to verify that it has robust security capable of protecting their consumer data. We also employ in-house Blue and Red Security Teams that constantly monitor the platform, testing for and addressing vulnerabilities. Our technology also incorporates privacy-safe practices and tools as an integral and foundational part of our platform’s approach. Privacy best practices are proactively embedded into our systems and infrastructure. |
| ● | Platform reliability and resilience. Multiple data centers host our platform for redundancy. Features are equipped with metrics and logging to provide visibility into operations, with alerts configured to automatically notify our 24/7 on-call rotation in the event of a problem. All changes undergo peer reviews, automated tests, and quality assurance before they can be deployed. Continuous integration, frequent releases, and infrastructure as code are designed to optimize for efficient deployment. We are also SOC 1, Type 2 and SOC 2, Type 2 compliant. |
| ● | Proprietary infrastructure provides scalability. We designed the components of our platform to scale for high transaction volumes. We use Amazon Web Services’, or AWS’s, cloud infrastructure, which we overprovision in order to minimize the risk of outages from surges in traffic. If required, we can also increase our platform’s capacity with AWS. Multiple layers of caching are leveraged to reduce load on downstream components and improve performance. We build and extract features as modular services to align with the engineering teams that maintain them, and these services are scaled independently on their own infrastructure. Where possible, we use event-driven, asynchronous workflows to offload work to background services. Our system undergoes regular automated load tests. |
| ● | Focus on the restaurant ecosystem allows extensive integrations. We designed our platform to integrate with multiple POS providers, loyalty programs, payment processors, front-end developers, aggregators, and DSPs. Our platform allows our customers to integrate their systems using our APIs, webhooks, and other specifications. We have published a POS API and loyalty API standard that has been adopted by many POS and loyalty providers respectively. We use both cloud based APIs and, where necessary, older in-store agent-based technologies. In-store agent software uses our proprietary real-time protocol, which can operate over low-bandwidth connections and does not require restaurants to open incoming firewall ports. Customers may also use our fully managed, white-label web and mobile ordering module, or they may build more tailored front-ends on our APIs. In some circumstances, a restaurant customer may decide it would like to add additional functionality or a new provider to our platform, and in those circumstances our development support team may assist in integrating a new provider or technology component. |
Our solution offers our restaurant customers a customizable, white-label ordering platform, with the ability to integrate to a variety of third-party technology partners such as POS systems, payment processors, loyalty providers, and others. We also provide our customers with easy to use APIs, access to a development portal, and a development support team to assist with questions and to facilitate integrations.
To deploy our modules, some of the steps our customers take to operationalize our platform’s functionality are: learn to build and customize a digital ordering menu; coordinating with our team to test their digital menus; provide us with or integrate their digital assets, including logos, fonts and color schemes; train franchisee operators how to use our platform, including how to enable or disable certain DSPs, how to
119
Table of Contents
override regular restaurant hours for holiday hours; and coordinating with various third-parties to obtain relevant information needed to enable payment processing and loyalty or gift card programs, as applicable. Internally at each location, customers must also create physical signage or redesign the restaurant to designate pickup and delivery areas and review and evaluate how digital orders print, are processed in the kitchen, and coordinated with other staff to ensure an efficient take-out or delivery process.
Our Customers
Approximately 400 restaurant brands, representing over 64,000 active locations nationwide, currently offer consumers the opportunity to order ahead for pick-up or delivery through our platform. Both private and public restaurants choose our platform, including over 50% of publicly-traded restaurant focused companies and over 50% of the top 50 fastest growing private restaurant brands, measured by overall sales, in the United States. We accommodate service models of all types, including quick service, fast casual, casual dining, family dining, convenience store, and coffee and snack locations. In every one of our customer relationships, we are the exclusive provider of direct digital ordering services with 100% franchisee participation. Brands use our platform to strengthen their customer relationships and boost their digital orders. Our average initial contract length is three years with a one year auto-renewal period, providing visibility into our forward performance.
| Fast Casual |
Casual Dining |
Family Dining |
Coffee & Snack |
Quick Service | ||||
| Five Guys MOD Pizza Wingstop Noodles & Company Qdoba |
BJ’s Restaurant & Brewhouse P.F. Chang’s Red Lobster Red Robin |
Denny’s Cracker Barrel Bob Evans First Watch IHOP |
Jamba Cold Stone Smoothie King Tropical Smoothie |
Jimmy John’s Checkers Del Taco Panda Express Subway | ||||
For the years ended December 31, 2018, 2019 and 2020, Rails module transaction revenue from our largest digital ordering aggregator, DoorDash, accounted for an aggregate of 2.6%, 10.2% and 19.3% of our total revenue, respectively, and this digital ordering aggregator accounted for a substantial majority of our transaction revenue from our Rails module during the years ended December 31, 2018, 2019 and 2020.
Customer Case Studies
We believe that the following case studies provide a representative sample of how our restaurant customers leverage the Olo platform to enhance their business.
Chili’s
Background: Chili’s Grill & Bar is the flagship casual dining brand of Dallas-based Brinker International (NYSE: EAT). Chili’s partnered with Olo in 2016 and invested in Chili’s To-Go, enabling a convenient extension of the dine-in experience. Olo worked closely with Chili’s to deploy various parts of the Olo technology stack to assist with the brand’s digital maturation and steady ordering growth over several years. When suddenly forced to cease dine-in operations at the onset of the COVID-19 pandemic, Chili’s leveraged Olo as a stable platform to navigate a drastic shift to a fully off-premise offering at most open locations.
Solution: Building on the foundation of several years of digital success and growth, Olo worked closely with Chili’s at the onset of COVID-19 to maximize guest safety and streamline sales to off-premise. During the height of dining room closures caused by the pandemic, approximately 70% of the brand’s restaurant transactions were handled by Olo. Chili’s cites digital investment with Olo as a competitive advantage and engine that creates more efficient marketing spend for the brand.
120
Table of Contents
“We view Olo as a strategic partner within our digital transformation.” -SVP, Head of Innovation, Chili’s
Wingstop
Background: Wingstop (Nasdaq: WING) is a high growth fast casual chicken wing dining concept with over 1,500 restaurants. In 2019, Wingstop’s system-wide sales increased 20.1% year-over-year to $1.5 billion, marking the 16th consecutive year of same store sales growth. Prior to going public, Wingstop upgraded its digital ordering infrastructure to Olo.
Solution: Wingstop and Olo have worked closely together to deploy various components of Olo’s platform by using Ordering, Dispatch, and Rails modules. Wingstop is continuing to work to digitize transactions through incremental delivery growth and by removing obstacles to convert orders to digital.
Milk Bar
Background: Milk Bar is a quick service dessert bakery with 13 locations that was founded by chef Christina Tosi. Milk Bar operates traditional in-store retail as well as an ecommerce site with nationwide shipping. Most recently, Milk Bar launched its unique treats into the grocery aisle. Milk Bar and Olo began working together to serve customers looking for local pickup and delivery, leveraging the brand’s data and inventory prowess to satisfy Milk Bar guests in various scenarios and occasions based on the type of interaction they want to have with the brand.
Solution: Carefully leveraging technology to provide a positive experience is highly important to Milk Bar. The Olo and Milk Bar teams worked together starting in mid 2020 to deploy several modules of Olo’s platform including Ordering, Dispatch, and Rails. Careful management of third-party delivery is extremely important to Milk Bar, where close attention and care to Rails orders and controls has come into play.
“It’s never been more apparent that consumers want joy and lightness at their fingertips. So, having the technology to unlock on-demand delivery for our community, and streamline the process so they never even have to leave our website has been critical for us as we’re constantly adapting to the new world we live in.” -VP of Marketing, Milk Bar
MOD Pizza
Background: MOD Pizza is a fast casual artisanal build-your-own pizza brand with almost 500 system-wide locations. MOD Pizza is one of the fastest growing restaurant chains in the United States. In the infancy of MOD’s rapid growth, MOD sought an e-commerce platform that could scale and deliver a great customer experience. By partnering with Olo, in early 2018 MOD migrated to Olo’s stable platform to handle increasing demand.
Solution: Since deploying with Olo, MOD Pizza has been able to serve guests on a secure, reliable system that serves the needs of a fast-growing brand. The Olo platform allows for customization of a complex menu and the convenience of ordering from home, work, or on-the-go. During COVID-19, the brand pivoted to better serve their off-premise consumers, working closely with Olo along the way.
121
Table of Contents
“Our partnership with Olo brought us the strategic advantages we needed for our digital infrastructure. Olo’s technology has scaled with us, provided powerful integration to our systems, and proven to be a reliable platform during our continuing rapid growth.” -VP of Technology, MOD Pizza
Qdoba
Background: Qdoba is a fast-casual Mexican restaurant with more than 740 locations in the U.S. and Canada. Qdoba was seeking digital systems solutions that could grow while being flexible. Strategically, Qdoba looked to capitalize on direct orders to drive stronger guest relationships while delivering a compelling, feature-rich experience to guests. Qdoba implemented Olo in early 2020 to support commerce “because it was critical to choose a provider that not only offers a frictionless ordering experience, but also to help navigate the rapidly evolving world of third-party marketplaces,” according to Qdoba’s Director of Digital Experience.
Solution: Olo played an important role supporting Qdoba in achieving positive business results: year-over-year digital sales growth improvement, higher average order ticket, and a better customer experience. Olo supports a growing percentage of the overall sales mix. Qdoba has expanded use of the Olo platform by adding modules. Using Rails to inject third-party marketplace orders into the POS saves seconds of line time per customer by eliminating manual processes that took staff time away from guests. During COVID-19, Olo helped Qdoba respond quickly by helping to enable features such as curbside pickup in a matter of days.
“Team Olo is a critical enabler of our brand transformation. We’re able to identify guests by ordering channel, analyze their behavior, and better understand how to bring them back to Qdoba. That rich customer insight will be a critical driver of growth in the coming years.” -Director of Digital Experience, Qdoba
sweetgreen
Background: sweetgreen is a seasonal fast casual restaurant brand with over 120 locations, located primarily in large metropolitan areas. sweetgreen is a digital-first brand that is constantly optimizing the ordering experience. sweetgreen led the industry in the move to dedicated digital production lines and methods for managing customer pickup timing and experience. Since 2016, sweetgreen’s line speed and transactions per hour have continued to improve as a direct result of the mobile and web ordering experience they’ve enabled in partnership with Olo and their internal digital team.
Solution: Olo’s suite of APIs allowed sweetgreen to build a completely custom ordering experience while increasing throughput and order volume. For several years in a row, Olo’s platform has processed digital pickup and delivery orders for sweetgreen during peak lunch and dinner times. Operationally, sweetgreen has been able to integrate growing digital order demand into a consistent and repeatable workflow, resulting in a 4.9 rating on the App Store based on over 72,000 reviews.
“The demand for customer convenience inspired us to launch a digital ordering capability that has helped sweetgreen set the standard for customer convenience and team member experience. As we’ve grown, our partnership with Olo has allowed us to craft a unique digital experience that helps us to accomplish our mission of inspiring healthier communities by connecting people to real food.” -Co-Founder, sweetgreen
Sales and Marketing
Our sales team is divided into four functional areas: a customer success team that manages day-to-day customer relationships, a field sales team focused on selling our platform to major
122
Table of Contents
enterprise restaurant brands, an inside sales team focused on acquiring other restaurant brands outside of the major enterprise segment, and a sustaining sales team that advocates and upsells the use of new modules and services to existing customers, and works to renew agreements as they approach expiration. The sales teams actively pursue leads generated from marketing programs and help take prospective customers through an evaluation and purchase process. We sell our solution primarily to C-level executives at the restaurant brands, including quick service, fast casual, casual dining, family dining, and coffee and snack businesses.
Our customer success team manages the relationships with our customers. In addition to being the day-to-day contact for our customers, our customer success team monitors customer sentiment and program performance, and advocates for the customers’ use of additional modules and services. Our customer success team ensures that customers are receiving value from our platform, while supporting a growing relationship over time through increased usage of our platform and adoption of newer modules.
We focus our marketing efforts on the strength of our product innovation, the value we provide, and our unique ability to deliver a solution that is suited to benefit our restaurant brand customers. We target all aspects of the restaurant and food and beverage communities through our marketing activities, and actively develop our prospective customer base through numerous channels, including paid online search, email marketing, industry events, digital advertising, social media, public relations, and partner marketing. Once a prospective customer is using our platform, our sales efforts aim to expand into broader use cases and broaden the range of modules or services that we are providing. We also host an annual user conference, Beyond4, where customer stakeholders gather to engage with our team, deliver product training, share best practices, and foster community, though we do not plan to host Beyond4 in person during the coming year due to the effect of the COVID-19 pandemic.
As of December 31, 2020, we had 134 employees in our sales, marketing, and customer success teams. We intend to continue to invest in our sales and marketing capabilities to capitalize on our market opportunity.
Research and Development
Our research and development organization is responsible for the design, development, testing, and delivery of new technologies, products, features, and integrations of our platform, as well as the continued improvement and iteration of our existing modules. This team is also responsible for operating and scaling our platform. Our most significant investments in research and development are to drive core technology innovation and bring new modules and features to market.
Our research and development team consists of our software engineering, user experience, product management, development, test and quality assurance, and engineering teams. As of December 31, 2020, we had 215 employees in our research and development organization. We intend to continue to invest in our research and development capabilities to extend our platform.
Our Competition
The markets in which we compete are competitive and evolving rapidly. Our platform combines functionality from numerous product categories, and we therefore compete in each of these categories:
| ● | with respect to white-label digital ordering solution providers, we primarily compete with Tillster, Inc., Onosys, Inc., and NovaDine, Inc.; |
| ● | with respect to restaurant-focused POS platforms that offer digital ordering solutions, we primarily compete with NCR Corporation and Xenial, Inc.; |
123
Table of Contents
| ● | with respect to aggregators that provide direct digital ordering solutions, we compete with Grubhub Inc., DoorDash Inc., and UberEats; and |
| ● | with respect to custom software, developed internally by restaurants or in partnership with consultancies and enterprise software providers, we primarily compete with Deloitte Touche Tohmatsu Limited, Accenture plc, SAP SE, Sitecore Corporation A/S, and various development agencies. |
We compete on the basis of a number of factors, including:
| ● | the ability to integrate with existing restaurant technology solutions and flexible enough to integrate with future technology solutions; |
| ● | the ability to operationalize in a prescribed timeframe set by the prospective customer; |
| ● | the breadth of offering and ability to furnish specific functionality in the manner desired by the prospective customer; |
| ● | solution performance, security, scalability, and reliability; |
| ● | the ability to operationally implement with a customer’s infrastructure; |
| ● | ability to operate and support all geographic markets specified by the prospective customer; |
| ● | the availability and quality of support and other professional services; |
| ● | our ability to integrate our systems seamlessly and at low costs; and |
| ● | brand recognition, reputation, and the satisfaction of customers. |
We believe that we compete favorably with respect to the factors listed above. However, many of our competitors have greater financial, technical, and other resources, greater brand recognition, larger sales forces and marketing budgets, broader distribution networks, more diverse product and services offerings, and larger and more mature intellectual property portfolios. They may be able to leverage these resources to gain business in a manner that discourages customers from purchasing our offerings. Furthermore, we expect that our industry will continue to attract new market entrants, including smaller emerging companies, which could introduce new offerings. We may also expand into new markets and encounter additional competitors in such markets.
Our Employees and Culture
Our employees and the culture that we have created are the backbone of our success. We believe our founder-led corporate culture is critical in recruiting and retaining our employees. We are proud that most of the first few dozen of our employees are still with the company, and many of them have advanced to management and executive roles. Our current employees actively aid in the recruiting process as shown through our successful employee referral program. Our Founder and Chief Executive Officer meets with every new employee to review our company’s values and our executives lead discussions on our values on a quarterly basis.
Every year we undertake a robust employee engagement survey and we are proud that we have had 100% participation in that survey every year. We benchmark the answers we receive against
124
Table of Contents
the prior year’s survey and against a peer set of technology companies. Compared to our peers, our employees rate us significantly higher in service and quality focus, collaboration, communication, action, and innovation. We take our employees’ feedback seriously, and we have assessed and optimized many of our practices over time based on the feedback we’ve received in our surveys. As we grow and scale our business and employee base, we will be making significant investments in training and development of our employees.
We are proud of our remote work culture, and we spend a significant amount of time focused on our remote employees, making sure that all employees working remotely are fully engaged with the company and their respective teams.
Our initiatives to develop a strong remote working environment proved valuable as we transitioned all our employees to work-from-home in response to COVID-19. We will continue to monitor updates regarding reopening our offices in accordance with local public health safety guidance. We put the health and safety of our employees first and are committed to our continued efforts in providing an optimal work environment consistent with our culture. As of December 31, 2020, we had 433 employees operating across the United States, with no employees in our New York City headquarters and 100% working remotely. None of our employees are represented by a labor union with respect to their employment. We have not experienced any work stoppages and we consider our relations with our employees to be strong.
We also aspire to be a diverse, equitable, and inclusive company where employees are empowered to bring their authentic selves to work every day. As part of our investment in our people, we make diversity, equity, and inclusion a priority, and offer high-quality benefits, wellness initiatives and competitive compensation packages. Our goal is to foster a culture where we value, respect, and provide fair treatment and equal opportunities for all of our employees. By recognizing and celebrating our differences, we aim to cultivate an environment that is the right fit for all Olo employees. To that end, we support employee-resource groups, or ERGs, which are aimed at fostering a diverse, equitable, and inclusive workplace. We currently have five ERGs: Olo Pride (LGBTQ+), Olo Green (Eco-conscious), Oloites of Color, Olo’s Women Network, and Vets@Olo.
Social Responsibility and Community Initiatives
One of Olo’s company values is “Excelsior,” meaning “ever upward” in Latin. This manifests in a greater desire to improve our community and our world, not just our financials. We launched Olo for Good in 2021, building off of our years long commitment to organizations like Share Our Strength, to foster a sustainable contribution to the communities in which we live, work, and service by integrating social responsibility and impact into our business. Olo for Good will leverage people, technology, and our equity to support non-profit organizations aligned with our mission and values, including those focused on:
| ● | advancing racial, ethnic and gender diversity, equity, and inclusion; |
| ● | providing relief and support for the restaurant industry and its front-line workers; and |
| ● | ending childhood hunger and increasing access to food. |
We seek to increase diversity, equity, and inclusion in our communities and to be an advocate for the restaurant industry as its most restaurant-aligned technology partner.
Our Olo for Good initiative will include a donor-advised fund created through Tides Foundation. In 2021, our board of directors approved the issuance of shares of our Class A common
125
Table of Contents
stock to such fund after the completion of this offering. On each anniversary of the effective date of this offering, 1/10th of the total shares approved will be donated into the fund. Upon the exercise and sale of these shares, we intend to instruct Tides Foundation to donate the proceeds from such sale in accordance with our direction.
In addition to the donor-advised fund and our commitment to donate 1% of our equity, representing 1% of our fully diluted equity outstanding as of immediately prior to this offering, we joined Pledge 1% with the commitment to donate 1% of product and 1% of employee time to social responsibility initiatives. The pledge strengthens our social responsibility initiatives through inclusion efforts with community partners, empowering volunteerism, and support for nonprofits. Our pledge builds upon our volunteer time off and gift-matching policy for employees. We also have a gift-matching policy where we match contributions made by our employees to non-profit organizations of up to $250 per employee per calendar year. We believe creating community engagement opportunities for employees that are meaningful, purposeful and help those in need is important to enriching and inspiring the lives of our employees and improving our communities.
We believe that building a sustainable program for charitable donations fosters employee morale and engagement, enhances our community presence, and further aligns us with the restaurant industry.
Intellectual Property
Intellectual property rights are important to our success. We rely on a combination of copyright, trademark, and trade secret laws in the United States and other jurisdictions, as well as license agreements, confidentiality procedures, non-disclosure agreements with third parties, and other contractual protections, to protect our intellectual property rights, including our proprietary technology, software, know-how, and brand. We use open source software in our services.
As of December 31, 2020, we owned one registered trademark in the United States.
We control access to and use of our proprietary technology and other confidential information through the use of internal and external controls, including contractual protections with employees, contractors, customers, and partners. We require our employees, consultants, and other third parties to enter into confidentiality and proprietary information and invention assignment agreements, and we control and monitor access to our software, documentation, proprietary technology, and other confidential information. Our policy is to require all employees and independent contractors to sign agreements assigning to us any inventions, trade secrets, works of authorship, developments, processes, and other intellectual property generated by them on our behalf and under which they agree to protect our confidential information. In addition, we generally enter into confidentiality agreements with our customers and partners. See the section titled “Risk Factors” for a description of the risks related to our intellectual property.
Our Facilities
Our headquarters is located in New York City, where we lease approximately 36,100 square feet at One World Trade Center. We also lease approximately 14,700 square feet at 26 Broadway. Our lease at One World Trade Center expires in May 2029. We currently sublease our space in 26 Broadway and that lease will expire in September 2023. We believe that our current facilities are adequate to meet our current needs.
Legal Proceedings
On or about October 21, 2020, DoorDash, Inc., or DoorDash, filed a lawsuit against us in New York State Supreme Court, New York County. The complaint alleges breach of contract related to fees
126
Table of Contents
charged to DoorDash. DoorDash seeks damages in excess of $7.0 million. We believe this lawsuit is without merit, and we plan to vigorously defend against it.
We have also received, and may in the future continue to receive, claims from third parties asserting, among other things, infringement of their intellectual property rights. Future litigation may be necessary to defend ourselves or our customers by determining the scope, enforceability and validity of third-party proprietary rights or to establish our proprietary rights. Defending such proceedings is costly and can impose a significant burden on management and employees. The results of any current or future litigation cannot be predicted with certainty, and regardless of the outcome, litigation can have an adverse impact on us because of defense and settlement costs, diversion of management resources and other factors.
127
Table of Contents
The following table sets forth information for our executive officers and directors as of December 31, 2020:
| Name |
Age | Position | ||||
| Executive Officers: |
||||||
| Noah Glass |
39 | Founder, Chief Executive Officer and Director | ||||
| Matthew Tucker |
55 | President and Chief Operating Officer | ||||
| Peter Benevides |
40 | Chief Financial Officer | ||||
| Nithya B. Das |
40 | Chief Legal Officer and Corporate Secretary | ||||
| Marty Hahnfeld |
53 | Chief Customer Officer | ||||
| Andrew Murray |
40 | Chief Technology Officer | ||||
| Deanne Rhynard |
38 | Chief People Officer | ||||
| Non-Employee Directors: |
||||||
| Brandon Gardner |
46 | Director (Chairman) | ||||
| David Frankel |
50 | Director | ||||
| Russell Jones |
61 | Director | ||||
| Daniel Meyer |
62 | Director | ||||
| Colin Neville |
37 | Director | ||||
| James D. Robinson IV |
58 | Director | ||||
| Linda Rottenberg |
52 | Director | ||||
| Warren C. Smith Jr*. |
64 | Director | ||||
| Zuhairah Washington |
43 | Director | ||||
| * | Warren C. Smith Jr. will resign from our board of directors effective immediately prior to, but subject to, the effectiveness of this registration statement of which this prospectus forms a part. |
Executive Officers
Noah Glass is our Founder and Chief Executive Officer. He has served as a member of our board of directors since the company’s inception in 2005. Prior to founding Olo, Mr. Glass held the position of International Expansion Manager for Endeavor Global, Inc., or Endeavor, a non-profit global organization leading the high-impact entrepreneurship movement, where he launched the first African Endeavor affiliate. In addition to serving as our Chief Executive Officer, Mr. Glass also serves on the board of directors of Portillo’s, a fast casual, chain based restaurant specializing in Chicago-style food, on the board of directors of Share Our Strength, a non-profit focused on ending childhood hunger in the United States, as well as the board of trustees for the Culinary Institute of America, providing guidance and advisory to the world’s premier culinary college. Mr. Glass holds a B.A. in Political Science (International Relations) from Yale University. We believe that Mr. Glass is qualified to serve on our board of directors due to his experience building and leading our business as well as his insight into corporate matters as our Founder and Chief Executive Officer.
Matthew Tucker has served as our Chief Operating Officer since September 2013 and as our President since January 2020. Prior to joining us, Mr. Tucker served as Chief Operating Officer of Payfone, Inc., a digital identity authentication company, Chief Executive Officer of Rely Software, Inc., a provider of transportation and logistics SaaS solutions (acquired by Odyssey Logistics & Technology Corporation), and was a member of the founding management team and Vice President of Sales & Marketing at LendingTree, Inc. Mr. Tucker holds a B.A. in Political Science from the University of Michigan and an M.B.A. from the McDonough School of Business at Georgetown University.
Peter Benevides has served as our Chief Financial Officer since January 2020. Mr. Benevides previously held the positions of Senior Vice President from January 2018 until December 2019 and Vice President of Finance from April 2015 until January 2018. Prior to joining us,
128
Table of Contents
Mr. Benevides held the position of Vice President of Finance and Controller at UrbanDaddy, Inc., a digital media and e-commerce company. Earlier in his career, Mr. Benevides served as the Director of Finance at several companies, including Turntable.fm, Inc., a social music service, and Sony Music Entertainment, a global recorded music company. Mr. Benevides serves on the board of the University of Rhode Island’s College of Business, Innovation & Entrepreneurship Program. Mr. Benevides is a Certified Public Accountant and Certified Management Accountant and holds a B.S. and an M.S. in Accounting from the College of Business Administration at the University of Rhode Island.
Nithya B. Das has served as our Chief Legal Officer and Corporate Secretary since November 2020. Ms. Das previously held the positions of General Counsel from October 2019 and Secretary from November 2019 until November 2020. Prior to joining us, from September 2011 to December 2018, Ms. Das served in several roles at AppNexus Inc., an advertising technology company, including as the Chief Legal and People Officer where she oversaw the company’s global legal, corporate development and human resources affairs. Prior to AppNexus, Ms. Das served as an attorney in the New York office of Goodwin Procter LLP where she represented public and private growth technology companies. Ms. Das holds a B.A. in Business Administration (Finance) from the South Carolina Honors College at University of South Carolina and a J.D. from Brooklyn Law School.
Marty Hahnfeld has served as our Chief Customer Officer, leading our sales, marketing, and post-sale customer support services, since July 2013. Prior to joining us, Mr. Hahnfeld served as the Senior Vice President of Community Solutions at Recyclebank LLC, a consumer loyalty company. Throughout his career, Mr. Hahnfeld has served in leadership roles at numerous internet and telecommunications companies, including roles as Senior Vice President of Worldwide Sales at SkyPilot Networks, Inc., a wireless solutions provider, Chief Executive Officer at HyperEdge Corp., a telecommunications solutions company, a member of the founding executive team and Vice President of Sales at Zhone Technologies, Inc. (merged into DASAN Zhone Solutions, Inc.) and as Vice President, Sales at Ascend Communications, Inc. (acquired by Lucent Technologies Inc.).
Andrew Murray has served as our Chief Technology Officer since joining us in July 2005. Prior to joining us, Mr. Murray held various technology positions at Internet Solutions and Dimension Data in Johannesburg, South Africa from 1996 to 2005. Mr. Murray holds a B.Com Informatics from the University of South Africa.
Deanne Rhynard has served as our Chief People Officer since January 2021. Mrs. Rhynard previously held the positions of Senior Vice President of People and Culture from January 2020 until January 2021, Vice President of People and Culture from January 2018 until January 2020, Senior Director of Operations, Head of People Culture from January 2017 until January 2018, and Director of Operations from January 2014 until January 2017. Prior to joining us, Mrs. Rhynard held various people, corporate relations, and management roles at University of Virginia’s Darden School of Business, KKR, Marriott, and other technology startups. Mrs. Rhynard holds a B.A. in Business from Walla Walla University.
Non-Employee Directors
Brandon Gardner has served as a member of our board of directors since January 2016 and as Chairman of our board of directors since June 2017. Mr. Gardner is a Founding Partner and the President of The Raine Group, a global merchant bank dedicated to the technology, media and telecommunications sectors. Prior to Raine, Mr. Gardner founded and was the Senior Operating Officer of Serengeti Asset Management LP, a multi-strategy investment advisor. During his tenure at Serengeti, Mr. Gardner was an active member of the investment team, managing sector- and strategy-specific portfolios as well as the firm’s private investment opportunities. Prior to joining Serengeti in 2007, Mr. Gardner was a practicing attorney at Cleary Gottlieb Steen & Hamilton LLP from 1999 to 2007. Mr. Gardner serves on the boards of numerous companies held in the Raine investment
129
Table of Contents
portfolio. Mr. Gardner holds a B.A. from the College of Arts and Sciences at the University of Pennsylvania, a B.S. from the Wharton School at the University of Pennsylvania and a J.D. from Columbia University. We believe Mr. Gardner is qualified to serve on our board of directors due to his experience in structuring securities transactions and advising private and public companies in the technology space.
David Frankel has served as a member of our board of directors since August 2005. Mr. Frankel is a Managing Partner of Founder Collective, a seed-stage venture capital firm, which he co-founded in 2009. Previously, Mr. Frankel was the co-founder and Chief Executive Officer of Internet Solutions, an internet service provider acquired by Dimension Data, which was later acquired by NTT Group. Mr. Frankel serves on the boards of numerous companies held in the Founder Collective investment portfolio. Mr. Frankel holds a B.S. in Electrical Engineering from the University of Witwatersrand and an M.B.A. from Harvard University. We believe Mr. Frankel is qualified to serve on our board of directors due to his experience building, financing and advising companies from the earliest stages of growth.
Russell Jones has served as a member of the board of directors since June 2020. Mr. Jones currently serves as a director at Sierra Wireless and The Ottawa Hospital Foundation. Mr. Jones has extensive experience in the technology industry and has demonstrated experience in financial oversight and reporting. Previously, Mr. Jones served as Chief Financial Officer of Shopify Inc. from 2011 through 2018. Mr. Jones has also held senior executive roles at a number of companies including Mitel Corporation, Newbridge Networks, Watchfire, Quake Technologies, and Xambala Incorporated. He also co-founded a CFO advisory firm focused on early stage technology companies. Mr. Jones is a CPA, CA and holds a B.Com in Accounting from Carleton University and an ICD.D certification from the Institute of Corporate Directors. We believe that Mr. Jones is qualified to serve on our board of directors due to his extensive experience serving as Chief Financial Officer, including of a public company.
Daniel Meyer has served as a member of the board of directors since October 2014. Mr. Meyer is the founder and Chief Executive Officer of Union Square Hospitality Group, or USHG, which owns and operates an event services business, Union Square Events, as well as the following restaurants: Union Square Cafe, Gramercy Tavern, Blue Smoke, Jazz Standard, The Modern, the Cafes at MOMA, Maialino, Untitled, Studio Cafe, Porchlight, Marta, Cafe Marchio, Vini E Fritti, Maialino Mare, and Daily Provisions. The restaurants have earned 28 James Beard Awards among them. Mr. Meyer is also the founder of Shake Shack, where he is Chairman of the Board. Mr. Meyer previously served as a member of the board of directors of The Container Store from 2013 to 2017, Sotheby’s from 2011 to 2015 and OpenTable from 2000 through 2014, as well as the following organizations: Trinity College, Share Our Strength, Union Square Partnership, Madison Square Park Conservancy, and NYC & Co. Mr. Meyer holds a B.A. in Political Science from Trinity College. We believe Mr. Meyer is qualified to serve on our board of directors due to his long career in hospitality, his wealth of restaurant technology experience, and his particular experience in strategic planning and leadership of complex organizations and board practices of other major corporations.
Colin Neville has served as a member of our board of directors since January 2016. Mr. Neville is a Partner at The Raine Group, a global merchant bank dedicated to the technology, media and telecommunications sectors, and has been with the firm since its inception in 2009. Prior to joining Raine, Mr. Neville worked in the Mergers and Acquisitions group at Bank of America Merrill Lynch with a focus on technology, media and telecom. Mr. Neville sits on the boards of several companies held in the Raine investment portfolio. Mr. Neville holds a B.A. in Political Science from Yale University. We believe that Mr. Neville is qualified to serve on our board of directors due to his deep understanding of technology trends and his experience investing in technology companies.
130
Table of Contents
James D. Robinson IV has served as a member of our board of directors since March 2008. Mr. Robinson is a founder and Managing Partner of RRE Ventures, LLC. Previously, Mr. Robinson was employed by H&Q Venture Capital and J.P. Morgan & Company. Earlier in his career, he founded IV Systems, Inc., a developer of unix-based applications. Mr. Robinson has been active within the technology community for over 30 years and has led investments in and served on the boards of more than 40 technology companies. Mr. Robinson is a co-founder and director of Plutus Financial, Inc. (d/b/a Abra), and serves on the boards of HYPR Corp., Netsertive, Inc., Noom Inc., and theSkimm, Inc. He is also a board observer at Digital Currency Group Inc. and Bitpay, Inc. Additionally, Mr. Robinson is a director of the New York City Partnership Investment Fund and Harvard Business School Alumni Angels. Mr. Robinson holds a B.A. with a joint degree in Computer Science and Business Administration from Antioch College and an M.B.A. from Harvard University. We believe Mr. Robinson is qualified to serve on our board of directors due to his extensive management and board experience in the information technology industry.
Linda Rottenberg has served as a member of our board of directors since October 2016. Ms. Rottenberg is the co-founder and Chief Executive Officer of Endeavor, a global nonprofit organization that catalyzes economic growth by selecting, mentoring and accelerating high-impact entrepreneurs around the world. With 60 offices spanning the world, Endeavor identifies, selects, and co-invests in high-impact entrepreneurs in emerging and underserved markets, including secondary U.S. cities. Ms. Rottenberg also oversees the Endeavor Catalyst LP Fund, which currently has over $200M assets under management, and co-invests in the equity financing rounds of Endeavor Entrepreneurs. In addition to her responsibilities at Endeavor, Ms. Rottenberg is a member of the Young Presidents’ Organization. Ms. Rottenberg sits on the boards of several technology companies, including Zayo Group, LLC and Globant, LLC. Ms. Rottenberg holds a B.A. in Social Studies from Harvard University and a J.D. from Yale Law School. We believe that Ms. Rottenberg is qualified to serve on our board of directors due to her extensive experience in entrepreneurship, innovation, business development, and leadership.
Warren C. Smith Jr. has served as a member of our board of directors since October 2014. Mr. Smith is a co-founder and the Managing Partner of Staley Capital Management and has over 25 years of private equity investing experience. Prior to Staley Capital, Mr. Smith co-founded T.H. Lee Putnam Ventures in 2000, where he led growth equity investments across the digital marketing services, retail IT, tech-enabled BPO, and enterprise software sectors. Mr. Smith began his private equity career at Thomas H. Lee Partners in 1990, leading investments in consumer companies including Finlay Fine Jewelry, Thermoscan, Rayovac, and Eye Care Center of America. Previously, he worked in the Investment Banking Division of Merrill Lynch & Co. Mr. Smith currently serves on the boards of SmartAction, Aspire Marketing Services, and 4R Systems, and as a board observer of SteelHouse. Mr. Smith also serves on the Board of Advisors of the Tuck School of Business at Dartmouth College and is the Chairman of the Board of Advisors for Tuck’s Center for Private Equity and Venture Capital. In addition, Mr. Smith is a Trustee Emeritus of Wesleyan University and is a former member of Wesleyan’s Investment Committee. Mr. Smith is also the former Chairman of the Board of Trustees of Burke Mountain Academy. Mr. Smith holds a B.A. in Economics from Wesleyan University and an M.B.A. from the Tuck School of Business at Dartmouth College. We believe that Mr. Smith is qualified to serve on our board of directors due to his long history of investing in retail and consumer product companies as well as marketing services and IT solutions for those markets.
Zuhairah Washington has served as a member of our board of directors since November 2020. She currently serves as the SVP and Global Head of Strategic Partners at Expedia Group, whose brands include Expedia, Hotels.com, Orbitz and VRBO. Prior to her tenure at Expedia Group, from 2018 to 2019, she was at Egon Zehnder, a global management consulting and executive search firm, and from 2013 to 2018, at Uber, where she grew businesses from startup to scale and ran one of the top five U.S. markets. She founded Kahnoodle, which was named to Entrepreneur Magazine’s 100
131
Table of Contents
Brilliant Companies of 2012. Ms. Washington also sits on the board of directors of Five Below. Ms. Washington earned a joint graduate degree: a J.D. from Harvard Law School and an M.B.A. from Harvard Business School, and graduated magna cum laude from UCLA with a B.A. in political science and public policy. We believe that Ms. Washington is qualified to serve on our board of directors due to her 20 years of operations and leadership experience in the technology and consumer space.
Family Relationships
There are no family relationships among any of the directors or executive officers.
Composition of Our Board of Directors
Our business and affairs are managed under the direction of our board of directors. We currently have eight directors. All of our directors currently serve on the board of directors pursuant to the provisions of a voting agreement between us and several of our stockholders. These provisions of our voting agreement will terminate upon the completion of this offering, after which there will be no further contractual obligations regarding the election or designation of our directors. Our current directors will continue to serve as directors until their resignation, removal, or successor is duly elected.
Our board of directors may establish the authorized number of directors from time to time by resolution. In accordance with our amended and restated certificate of incorporation that will be in effect on the completion of this offering, immediately after this offering, our board of directors will be divided into three classes with staggered three-year terms. At each annual meeting of stockholders, the successors to directors whose terms then expire will be elected to serve from the time of election and qualification until the third annual meeting following election. Our directors will be divided among the three classes as follows:
| ● | the Class I directors will be Noah Glass, Linda Rottenberg, and James D. Robinson IV, whose terms will expire at the first annual meeting of stockholders to be held following the completion of this offering; |
| ● | the Class II directors will be Colin Neville, Daniel Meyer, and Russell Jones, whose terms will expire at the second annual meeting of stockholders to be held following the completion of this offering; and |
| ● | the Class III director will be David Frankel, Zuhairah Washington, and Brandon Gardner, whose terms will expire at the third annual meeting of stockholders to be held following the completion of this offering. |
We expect that any additional directorships resulting from an increase in the number of directors will be distributed among the three classes so that, as nearly as possible, each class will consist of one third of the directors. The division of our board of directors into three classes with staggered three-year terms may delay or prevent a change of our management or a change in control.
Director Independence
Our board of directors has undertaken a review of the independence of each director. Based on information provided by each director concerning her or his background, employment and affiliations, our board of directors has determined that none of our directors, other than Mr. Glass, has any relationships that would interfere with the exercise of independent judgment in carrying out the responsibilities of a director and that each of these directors is “independent” as that term is defined under the listing standards of the NYSE. In making these determinations, our board of directors considered the current and prior relationships that each non-employee director has with our company and all other facts and circumstances our board of directors deemed relevant in determining their
132
Table of Contents
independence, including the beneficial ownership of our shares by each non-employee director and the transactions described in the section titled “Certain Relationships and Related Party Transactions.”
Committees of Our Board of Directors
Our board of directors has established an audit committee, a compensation committee, and a nominating and corporate governance committee. The composition and responsibilities of each of the committees of our board of directors are described below. Members serve on these committees until their resignation or until otherwise determined by our board of directors. Our board of directors may establish other committees as it deems necessary or appropriate from time to time.
Audit Committee
Our audit committee consists of Russell Jones, Colin Neville, and Zuhairah Washington. Our board of directors has determined that each of Mr. Jones, Mr. Neville, and Ms. Washington satisfies the independence requirements under the listing standards of the NYSE and Rule 10A-3(b)(1) of the Securities Exchange Act of 1934, as amended, or the Exchange Act. The chair of our audit committee is Mr. Jones, who our board of directors has determined is an “audit committee financial expert” within the meaning of SEC regulations. Each member of our audit committee can read and understand fundamental financial statements in accordance with applicable requirements. In arriving at these determinations, our board of directors has examined each audit committee member’s scope of experience and the nature of their employment in the corporate finance sector.
The primary purpose of the audit committee is to discharge the responsibilities of our board of directors with respect to our corporate accounting and financial reporting processes, systems of internal control and financial statement audits, and to oversee our independent registered public accounting firm. Specific responsibilities of our audit committee include:
| ● | helping our board of directors oversee our corporate accounting, and financial reporting processes; |
| ● | managing the selection, engagement, qualifications, independence, and performance of a qualified firm to serve as the independent registered public accounting firm to audit our financial statements; |
| ● | reviewing security policies and processes, systems, and decisions in conjunction with our Chief Information Security Officer, or CISO; |
| ● | discussing the scope and results of the audit with the independent registered public accounting firm, and reviewing, with management and the independent accountants, our interim and year-end operating results; |
| ● | developing procedures for employees to submit concerns anonymously about questionable accounting or audit matters; |
| ● | reviewing related person transactions; |
| ● | obtaining and reviewing a report by the independent registered public accounting firm at least annually that describes our internal quality control procedures, any material issues with such procedures, and any steps taken to deal with such issues when required by applicable law; and |
| ● | approving or, as permitted, pre-approving, audit and permissible non-audit services to be performed by the independent registered public accounting firm. |
133
Table of Contents
Our audit committee will operate under a written charter, to be effective prior to the completion of this offering, that satisfies the applicable listing standards of the NYSE.
Compensation Committee
Our compensation committee consists of Linda Rottenberg, Brandon Gardner, and James D. Robinson IV. The chair of our compensation committee is Linda Rottenberg. Our board of directors has determined that each of Messrs. Gardner and Robinson and Ms. Rottenberg is independent under the listing standards of the NYSE and is a “non-employee director” as defined in Rule 16b-3 promulgated under the Exchange Act.
The primary purpose of our compensation committee is to discharge the responsibilities of our board of directors in overseeing our compensation policies, plans and programs and to review and determine the compensation to be paid to our executive officers, directors, and other senior management, as appropriate. Specific responsibilities of our compensation committee include:
| ● | reviewing and approving the compensation of our chief executive officer, other executive officers, and senior management; |
| ● | reviewing, evaluating, and recommending to our board of directors succession plans for our executive officers; |
| ● | reviewing and recommending to our board of directors the compensation paid to our directors; |
| ● | administering our equity incentive plans and other benefit programs; |
| ● | reviewing, adopting, amending, and terminating incentive compensation and equity plans, severance agreements, profit sharing plans, bonus plans, change-of-control protections, and any other compensatory arrangements for our executive officers and other senior management; and |
| ● | reviewing and establishing general policies relating to compensation and benefits of our employees, including our overall compensation philosophy. |
Our compensation committee will operate under a written charter, to be effective prior to the completion of this offering, that satisfies the applicable listing standards of the NYSE.
Nominating and Corporate Governance Committee
Our nominating and corporate governance committee consists of Daniel Meyer, Linda Rottenberg, and David Frankel. The chair of our nominating and corporate governance committee is Daniel Meyer. Our board of directors has determined that each of Mr. Meyer, Ms. Rottenberg, and Mr. Frankel is independent under the listing standards of the NYSE.
Specific responsibilities of our nominating and corporate governance committee will include:
| ● | identifying and evaluating candidates, including the nomination of incumbent directors for reelection and nominees recommended by stockholders, to serve on our board of directors; |
| ● | considering and making recommendations to our board of directors regarding the composition and chairmanship of the committees of our board of directors; |
134
Table of Contents
| ● | instituting plans or programs for the continuing education of our board of directors and orientation of new directors; |
| ● | developing and making recommendations to our board of directors regarding corporate governance guidelines and matters; and |
| ● | overseeing periodic evaluations of the board of directors’ performance, including committees of the board of directors. |
Our nominating and corporate governance committee will operate under a written charter, to be effective prior to the completion of this offering, that satisfies the applicable listing standards of the NYSE.
Code of Conduct and Ethics
We have adopted a Code of Conduct and Ethics that applies to all our employees, officers, and directors. This includes our principal executive officer, principal financial officer and principal accounting officer or controller, or persons performing similar functions. The full text of our Code of Conduct and Ethics will be posted on our website at www.olo.com. We intend to disclose on our website any future amendments to our Code of Conduct and Ethics or waivers that exempt any principal executive officer, principal financial officer, principal accounting officer or controller, persons performing similar functions, or our directors from provisions in the Code of Conduct and Ethics. Information contained on, or that can be accessed through, our website is not incorporated by reference in this prospectus, and you should not consider information on our website to be part of this prospectus.
Compensation Committee Interlocks and Insider Participation
None of the members of the compensation committee are currently, or have been at any time, one of our officers or employees. None of our executive officers currently serve, or have served during the last year, as a member of the board of directors or compensation committee of any entity that has one or more executive officers serving as a member of our board of directors or compensation committee.
Non-Employee Director Compensation
We did not pay cash compensation to any of our non-employee directors during the year ended December 31, 2020. However, we did provide stock-based compensation to each of Linda Rottenberg, Russell Jones, and Zuhairah Washington during the year ended December 31, 2020. On June 14, 2020, we granted Russell Jones an option to purchase 11,989 shares of Class B common stock at a strike price of $66.40. On November 30, 2020, we granted Linda Rottenberg an option to purchase 5,994 shares of Class B common stock at a strike price of $101.48 and we granted Zuhairah Washington an option to purchase 11,989 shares of Class B common stock at a strike price of $101.48. Additionally, we have reimbursed and will continue to reimburse all of our non-employee directors for their reasonable out-of-pocket expenses incurred in attending board of directors and committee meetings. The compensation of Mr. Glass as a named executive officer is set forth in the section titled “Executive Compensation.”
The table below shows the aggregate number of option awards outstanding, and granted for such individual’s service as a director, for each of our directors who is not a named executive officer as of December 31, 2020, or our outside directors:
| Name |
Option Awards (#) | |||
| Linda Rottenberg |
66,494 | (1) | ||
| Russell Jones |
11,989 | (2) | ||
| Zuhairah Washington |
11,989 | (3) | ||
135
Table of Contents
| (1) | Ms. Rottenberg holds (1) an option to purchase 30,250 shares of our Class B common stock, which is fully vested, (2) an option to purchase 30,250 shares of our Class B common stock, which vests in 24 equal monthly installments from December 3, 2018 and is subject to full acceleration on a change in control, subject to her continuous service through each such vesting date, and (3) an option to purchase 5,994 shares of our Class B common stock, which vests in 24 equal monthly installments from December 10, 2020 and is subject to full acceleration on a change in control, subject to her continuous service through each such vesting date. These options were granted under the 2015 Plan. |
| (2) | Mr. Jones holds an option to purchase 11,989 shares of our Class B common stock, which vests in 24 equal monthly installments from June 11, 2020 and is subject to full acceleration on a change in control, subject to his continuous service through each such vesting date. This option was granted under the 2015 Plan. |
| (3) | Ms. Washington holds an option to purchase 11,989 shares of our Class B common stock, which vests in 24 equal monthly installments from November 10, 2020 and is subject to full acceleration on a change in control, subject to her continuous service through each such vesting date. This option was granted under the 2015 Plan. |
The balance of our outside directors have not been issued equity awards in connection with their service on our board of directors to date.
We intend to adopt a non-employee director compensation policy in connection with this offering and on terms to be determined by our board of directors. Under the non-employee director policy, our non-employee directors will be eligible to receive compensation for service on our board of directors and committees of our board of directors.
136
Table of Contents
Our named executive officers for the year ended December 31, 2020, consisting of our principal executive officer and the next two most highly compensated executive officers, were:
| ● | Noah Glass, who serves as our Founder, Chief Executive Officer, and a director; |
| ● | Nithya B. Das, who serves as our Chief Legal Officer and Corporate Secretary; and |
| ● | Marty Hahnfeld, who serves as our Chief Customer Officer. |
2020 Summary Compensation Table
The following table presents all of the compensation awarded to or earned by or paid to our named executive officers for the year ended December 31, 2020.
| Name and Principal Position |
Salary ($) |
Option Awards ($)(1) |
Non-Equity Incentive Plan Compensation ($)(2) |
Total ($) | ||||
| Noah Glass |
350,000 | 927,881.59 | 210,000 | 1,487,882 | ||||
| Founder, Chief Executive Officer and Director |
||||||||
| Nithya B. Das |
303,333 | 1,905,420.00 | 108,833 | 2,317,586 | ||||
| Chief Legal Officer and Corporate Secretary |
||||||||
| Marty Hahnfeld |
350,000 | 517,744.50 | 996,501 | 1,864,246 | ||||
| Chief Customer Officer |
| (1) | This column reflects the full grant date fair value of options granted during the year measured pursuant to Financial Accounting Standards Board Accounting Standards Codification Topic 718 (ASC 718), the basis for computing stock-based compensation in our consolidated financial statements. Unlike the calculations contained in our consolidated financial statements, this calculation does not give effect to any estimate of forfeitures related to service-based vesting, but assumes that the named executive officer will perform the requisite service for the award to vest in full as required by SEC rules. The assumptions we used in valuing options are described in note 9 to our financial statements included in this prospectus. |
| (2) | See “—Non-Equity Incentive Plan Compensation” for a description of the material terms of the plans pursuant to which this compensation was awarded. |
Narrative to the Summary Compensation Table
Annual Base Salary
Our named executive officers receive a base salary to compensate them for services rendered to us. The base salary payable to each named executive officer is intended to provide a fixed component of compensation reflecting the executive’s skill set, experience, role, and responsibilities. The 2020 base salaries for our named executive officers were as stated in the table above.
Non-Equity Incentive Plan Compensation
We have a bonus policy and a historical practice of setting target bonus amounts for our executive officers expressed as a percentage of base salary and reflected in their employment agreements. Our practice has been to provide for annual bonus payments to our executive officers conditioned upon the achievement of certain performance goals established by our board of directors and individual goals determined by our Chief Executive Officer. We have historically established target bonus amounts which we felt was appropriate considering factors such as compensation opportunities that these executive officers were foregoing from their prior employers, cash bonuses provided to executive officers of our peer companies, the executive officer’s anticipated role criticality relative to others at our company, and the determination by our board of directors or committee thereof and, as applicable, the Chief Executive Officer, of the essential need to attract and retain these executive officers.
137
Table of Contents
In 2020, Mr. Glass was eligible to receive a target bonus of $210,000, or 60% of his base salary, based on the attainment of company performance goals set by the compensation committee. Mr. Glass received an aggregate bonus for 2020 of $210,000.
For 2020, Ms. Das was eligible to receive a target bonus of $108,833, based on the attainment of company performance goals set by the compensation committee. Ms. Das’ cash compensation in 2020 increased from $300,000 to $320,000 effective November 1, 2020. Ms. Das’ bonus target also increased from 35% to 40% effective November 1, 2020. Ms. Das received an aggregate bonus for 2020 of $108,833.
In 2021, Mr. Glass and Ms. Das are eligible to receive target bonuses of 80% and 41%, of his and her base salary, respectively, based on the attainment of company performance goals set by the compensation committee.
In 2020, Mr. Hahnfeld was eligible to participate in our sales compensation plan. Our sales compensation plan is designed to compensate members of the sales team, including Mr. Hahnfeld, for the attainment of sales targets set by our compensation committee at the beginning of each fiscal year. The variable compensation for 2020 for Mr. Hahnfeld was measured and paid on a quarterly basis based on attainment of the sales targets over the fiscal year. Mr. Hahnfeld received an aggregate variable compensation payment of $996,501 for 2020 pursuant to the terms of our sales compensation plan. For 2021, Mr. Hahnfeld will continue to participate in our sales commission plan, with a target commission equal to 100% of his base salary.
In connection with this offering, we adopted a formal executive bonus plan, or the Executive Bonus Plan. The purpose of the Executive Bonus Plan is to create a direct relationship between key business performance measurements and individual bonus amounts. The Executive Bonus Plan will provide for annual bonus payments to each executive officer conditioned upon the achievement of certain performance goals established by the compensation committee, which may differ for each executive officer. Our compensation committee will establish such performance goals based on one or more established performance criteria relating to financial, operational, workforce, or partner performance.
Equity-Based Incentive Awards
Our equity award program is the primary vehicle for offering long-term incentives to our executives. We believe that equity awards provide our executives with a strong link to our long-term performance, create an ownership culture and help to align the interests of our executives and our stockholders. To date, we have used stock option grants for this purpose because we believe they are an effective means by which to align the long-term interests of our executive officers with those of our stockholders. The use of options also can provide tax and other advantages to our executive officers relative to other forms of equity compensation. We believe that our equity awards are an important retention tool for our executive officers, as well as for our other employees.
We award stock options broadly to our employees, including to our non-executive employees. Grants to our executives and other employees are made at the discretion of our board of directors and are not made at any specific time period during a year.
Prior to this offering, all of the stock options we have granted were made pursuant to our 2005 Plan or our 2015 Plan. The terms of the stock options granted to our named executive officers are set forth in the section titled “Outstanding Equity Awards as of December 31, 2020.” Following this offering, we will grant equity incentive awards under the terms of our 2021 Plan. The terms of our equity plans are described under “—Equity Incentive Plans” below.
138
Table of Contents
Outstanding Equity Awards as of December 31, 2020
The following table presents estimated information regarding outstanding equity awards held by our named executive officers as of December 31, 2020. All awards were granted pursuant to the 2005 Plan or the 2015 Plan. See “—Equity Incentive Plans—2005 Incentive Plan” and “—Equity Incentive Plans—2015 Incentive Plan” below for additional information.
| Option Awards(1) | ||||||||||||||||||||||||
| Name |
Grant Date | Number of Securities Underlying Unexercised Options(#) Exercisable |
Number of Securities Underlying Unexercised Options(#) Unexercisable |
Equity Incentive Plan Awards: Number of Securities Underlying Unexercised Unearned Options(#) |
Option Exercise Price($) |
Option Expiration Date |
||||||||||||||||||
| Noah Glass |
2/12/2013 | 63,345 | — | — | 2.73 | 2/11/2023 | ||||||||||||||||||
| 1/12/2016 | 338,187 | — | — | 28.38 | 1/11/2026 | |||||||||||||||||||
| 1/12/2016 | — | — | 91,051 | (2) | 28.38 | 1/11/2026 | ||||||||||||||||||
| 1/12/2016 | 3,523 | — | — | 28.38 | 1/11/2026 | |||||||||||||||||||
| 1/21/2020 | — | 24,463 | (3) | — | 46.62 | 1/20/2030 | ||||||||||||||||||
| Nithya B. Das |
11/14/2019 | 903 | 15,356 | (4) | — | 46.62 | 11/13/2029 | |||||||||||||||||
| 11/30/2020 | — | 22,000 | (5) | — | 101.48 | 11/29/2030 | ||||||||||||||||||
| Marty Hahnfeld |
9/10/2013 | 33,608 | — | — | 2.73 | 9/9/2023 | ||||||||||||||||||
| 1/12/2016 | 3,523 | — | — | 28.38 | 1/11/2026 | |||||||||||||||||||
| 1/12/2016 | 87,584 | — | — | 28.38 | 1/11/2026 | |||||||||||||||||||
| 1/21/2020 | — | 13,650 | (3) | — | 46.62 | 1/20/2030 | ||||||||||||||||||
| (1) | All option awards listed in this table were granted pursuant to our 2005 Plan or our 2015 Plan, the terms of which are described below under “—Equity Incentive Plans—2005 Equity Incentive Plan” and “—Equity Incentive Plans—2015 Equity Incentive Plan,” respectively. |
| (2) | The shares underlying this option will fully vest immediately prior to a company exit, as defined in Mr. Glass’ amended and restated employment agreement, which includes a qualifying public offering, subject to Mr. Glass’ continuous service through each such vesting date. This option is also subject to accelerated vesting in connection with certain termination events and a change in control as described more fully under “—Employment Arrangements—Noah Glass.” |
| (3) | 25% of the shares underlying this option will vest on January 15, 2021, with the remaining shares vested in equal monthly installments over the three years following January 15, 2021. This option is also subject to accelerated vesting in connection with a change in control as described more fully under “—Employment Arrangements—Noah Glass” and “—Employment Arrangements—Marty Hahnfeld.” |
| (4) | 25% of the shares underlying this option will vest on October 1, 2020, with the remaining shares vesting in equal monthly installments over the next three years, subject to Ms. Das’ continuous service through each such vesting date. This option is also subject to accelerated vesting in connection with a change in control as described more fully under “—Employment Arrangements—Nithya B. Das.” |
| (5) | 25% of the shares underlying this option will vest on November 1, 2021, with the remaining shares vesting in equal monthly installments over the next three years, subject to Ms. Das’ continuous service through each such vesting date. This option is also subject to accelerated vesting in connection with a change in control as described more fully under “—Employment Arrangements—Nithya B. Das.” |
Employment Arrangements
Each of our named executive officers is an at-will employee. Except as set forth below, we have not entered into any employment agreements or offer letters with our named executive officers.
Noah Glass
On January 1, 2021, we entered into an employment agreement with Noah Glass, our Founder and Chief Executive Officer. This employment agreement supersedes and replaces the amended and
139
Table of Contents
restated employment agreement with Mr. Glass entered into on January 12, 2016 and amended on May 24, 2016.
Mr. Glass’ employment agreement provides for an annual base salary of $443,000. Mr. Glass is eligible for an annual target bonus of eighty percent (80%) of Mr. Glass’ current annual salary. The actual amount of any bonus, and Mr. Glass’ entitlement to the bonus, will be subject to our discretion subject and based on our and Mr. Glass’ achievement of objectives and milestones as set forth in our Executive Bonus Plan. Historical equity grants made to Mr. Glass are outlined above in the section titled “Outstanding Equity Awards as of December 31, 2020.”
Mr. Glass is entitled to receive severance and change in control benefits, as more fully described in “Potential Payments Upon Termination or Change in Control or Upon a Qualifying Company Exit.”
Potential Payments Upon Termination or Change in Control or Upon a Qualifying Company Exit
Upon termination of Mr. Glass’ employment by us without cause or by him for good reason, each as defined in his employment agreement, Mr. Glass would be entitled to receive the following severance benefits:
| ● | payment of Mr. Glass’ then-current base salary from the date of his termination of employment until twelve (12) months (payable in equal instalments in accordance with our regular schedule); |
| ● | payment of a portion of Mr. Glass’ annual target bonus, which is calculated based on our and Mr. Glass’ achievement of objectives and milestones as set forth in our Executive Bonus Plan, pro-rated for the period of employment during the applicable year (payable on the date we make the first severance payment); and |
| ● | payment of the monthly premium we were paying for Mr. Glass and his eligible dependents with respect to our health insurance plan (as of the day of his separation from employment), if he timely elects benefits pursuant to Consolidated Omnibus Reconciliation Act of 1985 as amended (COBRA), from the date of his termination of employment until the earlier of: (1) twelve (12) months, (2) the time Mr. Glass accepts employment with another employer that provides comparable benefits, or (3) or the date Mr. Glass ceases to be eligible for COBRA continuation coverage for any reason, including plan termination. |
Upon termination of Mr. Glass’ employment by us without cause or by him for good reason, each as defined in his employment agreement, within either three (3) months prior to or eighteen (18) months following a change of control as defined in our 2015 Equity Incentive Plan, Mr. Glass would be entitled to receive the following severance benefits:
| ● | a lump sum payment of an amount equivalent to eighteen (18) months of Mr. Glass’ then-current base salary (payable within sixty (60) days following his separation from employment); |
| ● | payment of a portion of Mr. Glass’ annual target bonus, which is calculated based on our and Mr. Glass’ achievement of objectives and milestones as set forth in our Executive Bonus Plan, pro-rated for the period of employment during the applicable year (payable on the date we pay the severance); |
140
Table of Contents
| ● | payment of the monthly premium we were paying for Mr. Glass and his eligible dependents with respect to our health insurance plan (as of the day of his separation from employment), if he timely elects benefits pursuant to Consolidated Omnibus Reconciliation Act of 1985 as amended (COBRA), from the date of his termination of employment until the earlier of: (1) eighteen (18) months, (2) the time Mr. Glass accepts employment with another employer that provides comparable benefits, or (3) or the date Mr. Glass ceases to be eligible for COBRA continuation coverage for any reason, including plan termination; and |
| ● | any unvested shares subject to Mr. Glass’ outstanding equity awards as described above in the section titled “Outstanding Equity Awards as of December 31, 2020” subject to time-based vesting will become fully vested upon the date Mr. Glass is terminated from employment with us. |
Further, upon a company exit, which includes a public offering of at least $75.0 million (net of the underwriting discount and commissions) with a per share price of at least two times the original issue price of the Series D preferred stock, any unvested shares subject to Mr. Glass’ performance option granted to Mr. Glass on January 12, 2016 with respect to 91,051 shares of our Class B common stock (as described in his employment agreement and above in the section titled “Outstanding Equity Awards as of December 31, 2020”) will be fully vested on the date immediately preceding the consummation of the company exit.
In addition, if we consummate a qualifying company exit as set forth therein on or prior to January 12, 2026, and Mr. Glass is still employed by us on the date the qualifying company exit is consummated, then we will pay Mr. Glass a bonus equal to the product of: 91,051 multiplied by (the difference between (1) the value of a share of our Class B common stock at the time of the qualifying company exit, and (2) $2.73), up to a maximum aggregate amount of $2,335,484.00, provided that in the event the qualifying company exit is a deemed liquidation event as set forth therein, the proceeds of the holders of our Series C Preferred Stock with respect to their shares of Series C Preferred Stock in such company exit equals or exceeds $35.5197 per share, and in the event the qualifying company exit is a qualifying public offering as set forth therein, the closing price of a share of our common stock equals or exceeds $35.5197 per share on the 180th day following the closing of such qualifying public offering. If earned, this bonus will be paid to Mr. Glass within either 30 days following the consummation of a deemed liquidation event or 30 days following the expiration of the 180 day period following the closing of our qualifying public offering. If the qualifying company exit is a deemed liquidation event as set forth therein, and all or a portion of the consideration received by us or the shareholders in connection with the qualifying company exit consist of contingent or deferred consideration, then we will pay Mr. Glass the bonus earned in connection with the payment of the contingent or deferred consideration within 30 days after the date such amounts are actually received by us or shareholders, except that no such bonus will be due to Mr. Glass on any consideration paid in connection with a qualifying company exit after the fifth anniversary of the closing date of the qualifying company exit.
The payment of all such severance benefits are subject to Mr. Glass’ execution of a separation agreement that has become enforceable and irrevocable and that includes a general release of all claims against us.
In addition, in the event any amounts Mr. Glass will or may receive would constitute a “parachute payment” within the meaning of Section 280G of the Internal Revenue Code of 1986, as amended, or the Code, and such payments would be subject to the excise tax imposed by Section 4999 of the Code, then such payments will either be (i) provided to Mr. Glass in full, or (ii) reduced to such lesser amount that would result in a smaller or no portion of such payments being subject to the
141
Table of Contents
excise tax, whichever amount, after taking into account all applicable taxes, including the excise tax, would result in Mr. Glass’ receipt, on an after-tax basis, of the greatest amount of such payments.
Nithya B. Das
On January 1, 2021, we entered into an employment agreement with Nithya B. Das, our Chief Legal Officer and Corporate Secretary. This employment agreement supersedes and replaces the employment agreement with Ms. Das entered into on October 1, 2019.
Ms. Das’ employment agreement provides for an initial annual base salary of $338,000. Ms. Das is eligible for an annual target bonus of (41%) of Ms. Das’ current annual salary. The actual amount of any bonus, and Ms. Das’ entitlement to the bonus, will be subject to our discretion and based on our and Ms. Das’ achievement of objectives and milestones as set forth in our Executive Bonus Plan. Historical equity grants made to Ms. Das are outlined above in the section titled “Outstanding Equity Awards as of December 31, 2020.”
Ms. Das is entitled to receive severance and change in control benefits, as more fully described in “Potential Payments Upon Termination or Change in Control.”
Potential Payments Upon Termination or Change in Control
Upon termination of Ms. Das’ employment by us without cause or by her for good reason, each as defined in her employment agreement, Ms. Das would be entitled to receive the following severance benefits:
| ● | payment of Ms. Das’ then-current base salary for nine (9) months following the date her employment is terminated payable in equal instalments in accordance with our regular payroll schedule; |
| ● | payment of a portion of Ms. Das’ annual target bonus, pro-rated for the period of employment during the applicable year (payable on the date we make the first severance payment); and |
| ● | reimbursement of the monthly premium payments Ms. Das makes for COBRA coverage, if she timely elects benefits pursuant to COBRA, from the date of her termination of employment until the earlier of: (1) nine (9) months following her employment ending, (2) the time Ms. Das accepts employment with another employer, or (3) or the date Ms. Das ceases to be eligible for COBRA continuation coverage for any reason. |
Upon termination of Ms. Das’ employment by us without cause or by her for good reason, each as defined in her employment agreement, within either three (3) months prior to or eighteen (18) months following a change of control as defined in our 2015 Equity Incentive Plan, Ms. Das would be entitled to receive the following severance benefits:
| ● | a lump sum payment of an amount equivalent to twelve (12) months of Ms. Das’ then-current base salary (payable within sixty (60) days following her separation from employment); |
| ● | payment of a portion of Ms. Das’ annual target bonus, pro-rated for the period of employment during the applicable year (payable on the same timeline as the severance); |
| ● | payment of the monthly premium we were paying for Ms. Das and her eligible dependents with respect to our health insurance plan (as of the day of her separation from employment), if she timely elects benefits pursuant to Consolidated Omnibus Reconciliation Act of 1985 as amended (COBRA), from the date of her termination of |
142
Table of Contents
| employment until the earlier of: (1) twelve (12) months, (2) the time Ms. Das accepts employment with another employer that provides comparable benefits, or (3) or the date Ms. Das ceases to be eligible for COBRA continuation coverage for any reason; and |
| ● | any unvested shares subject to Ms. Das’ outstanding equity awards as described above in the section titled “Outstanding Equity Awards as of December 31, 2020” subject to time-based vesting will become fully vested upon the date Ms. Das is terminated from employment with us. |
The payment of all such severance benefits are subject to Ms. Das’ execution of a separation agreement that has become enforceable and irrevocable and that includes a general release of all claims against us.
In addition, in the event any amounts Ms. Das will or may receive would constitute a “parachute payment” within the meaning of Section 280G of the Internal Revenue Code of 1986, as amended, or the Code, and such payments would be subject to the excise tax imposed by Section 4999 of the Code, then such payments will either be (i) provided to Ms. Das in full, or (ii) reduced to such lesser amount that would result in a smaller or no portion of such payments being subject to the excise tax, whichever amount, after taking into account all applicable taxes, including the excise tax, would result in Ms. Das’ receipt, on an after-tax basis, of the greatest amount of such payments.
Marty Hahnfeld
On January 1, 2021, we entered into an employment agreement with Marty Hahnfeld, our Chief Customer Officer. This employment agreement supersedes and replaces the employment agreement with Mr. Hahnfeld entered into on January 1, 2018.
Mr. Hahnfeld’s employment agreement provides for an annual base salary of $364,000. Mr. Hahnfeld is eligible to earn commission compensation according to our sales compensation plan and a commission structure that our Board of Directors may approve for our senior executives. Mr. Hahnfeld will be eligible to earn commission at an annual target equal to 100% of Mr. Hahnfeld’s current annual salary. The actual amount of any commission, and Mr. Hahnfeld’s entitlement to any commission, will be subject to the sole discretion of our compensation committee and subject to Mr. Hahnfeld’s achievement of objectives and milestones as set forth in the sales compensation plan.
Historical equity grants made to Mr. Hahnfeld are outlined above in the section titled “Outstanding Equity Awards as of December 31, 2020.”
Mr. Hahnfeld is entitled to receive severance and change in control benefits, as more fully described in “Potential Payments Upon Termination or Change in Control.”
Potential Payments Upon Termination or Change in Control
Upon termination of Mr. Hahnfeld’s employment by us without cause or by him for good reason, each as defined in his employment agreement, Mr. Hahnfeld would be entitled to receive the following severance benefits:
| ● | payment of Mr. Hahnfeld’s then-current base salary for nine (9) months following the date his employment is terminated (payable in equal instalments in accordance with our regular payroll schedule); |
| ● | monthly payments, in an amount equal to the average sales commission Mr. Hahnfeld earned monthly during the twelve (12) months prior to his employment ending, for six (6) months following the date his employment is terminated (payable in equal instalments in accordance with our standard payroll procedures with the first installment payable on the date we make the first severance payment); and |
143
Table of Contents
| ● | reimbursement of the monthly premium payments Mr. Hahnfeld makes for COBRA coverage, if he timely elects benefits pursuant to COBRA, from the date of his termination of employment until the earlier of: (1) nine (9) months following his employment ending, or (2) the time Mr. Hahnfeld accepts employment with another employer, or (3) or the date Mr. Hahnfeld ceases to be eligible for COBRA continuation coverage for any reason . |
Upon termination of Mr. Hahnfeld’s employment by us without cause or by him for good reason, each as defined in his employment agreement, within either three (3) months prior to or eighteen (18) months following a change of control as defined in our 2015 Equity Incentive Plan, Mr. Hahnfeld would be entitled to receive the following severance benefits:
| ● | a lump sum payment of an amount equivalent to twelve (12) months of Mr. Hahnfeld’s then-current base salary (payable within sixty (60) days following his separation from employment); |
| ● | monthly payments, in an amount equal to the average sales commission Mr. Hahnfeld earned monthly during the twelve (12) months prior to his employment ending, for twelve (12) months following the date his employment is terminated (payable in equal instalments in accordance with our standard payroll procedures with the first installment payable on the date we make the first severance payment); |
| ● | payment of the monthly premium we were paying for Mr. Hahnfeld and his eligible dependents with respect to our health insurance plan (as of the day of his separation from employment), if he timely elects benefits pursuant to Consolidated Omnibus Reconciliation Act of 1985 as amended (COBRA), from the date of his termination of employment until the earlier of: (1) twelve (12) months, (2) the time Mr. Hahnfeld accepts employment with another employer that provides comparable benefits, or (3) or the date Mr. Hahnfeld ceases to be eligible for COBRA continuation coverage for any reason; and |
| ● | any unvested shares subject to Mr. Hahnfeld’s outstanding equity awards as described above in the section titled “Outstanding Equity Awards as of December 31, 2020” subject to time-based vesting will become fully vested upon the date Mr. Hahnfeld is terminated from employment with us. |
The payment of all such severance benefits are subject to Mr. Hahnfeld’s execution of a separation agreement that has become enforceable and irrevocable and that includes a general release of all claims against us.
In addition, if Mr. Hahnfeld’s employment terminates for any reason prior to payment of any earned portion of his commission, he will be paid such earned commission otherwise in accordance with the terms of his employment agreement and the sales compensation plan.
Finally, in the event any amounts Mr. Hahnfeld will or may receive would constitute a “parachute payment” within the meaning of Section 280G of the Internal Revenue Code of 1986, as amended, or the Code, and such payments would be subject to the excise tax imposed by Section 4999 of the Code, then such payments will either be (i) provided to Mr. Hahnfeld in full, or (ii) reduced to such lesser amount that would result in a smaller or no portion of such payments being subject to the excise tax, whichever amount, after taking into account all applicable taxes, including the excise tax, would result in Mr. Hahnfeld’s receipt, on an after-tax basis, of the greatest amount of such payments.
Health and Welfare and Retirement Benefits; Perquisites
All of our current named executive officers are eligible to participate in our employee benefit plans, including our medical, dental, vision, disability and life insurance plans, in each case on the
144
Table of Contents
same basis as all of our other employees. We generally do not provide perquisites or personal benefits to our named executive officers, except in limited circumstances.
401(k) Plan
We maintain a 401(k) plan that provides eligible U.S. employees with an opportunity to save for retirement on a tax advantaged basis. Eligible employees are able to defer eligible compensation up to certain Code limits, which are updated annually. Contributions are allocated to each participant’s individual account and are then invested in selected investment alternatives according to the participants’ directions. Employees are immediately and fully vested in their own contributions. The 401(k) plan is intended to be qualified under Section 401(a) of the Code, with the related trust intended to be tax exempt under Section 501(a) of the Code. As a tax-qualified retirement plan, contributions to the 401(k) plan are deductible by us when made, and contributions and earnings on those amounts are not taxable to the employees until withdrawn or distributed from the 401(k) plan.
Equity Incentive Plans
The principal features of our equity plans and are summarized below. These summaries are qualified in their entirety by reference to the actual text of the plans, which are filed as exhibits to the registration statement of which this prospectus is a part.
2021 Equity Incentive Plan
Our board of directors adopted and our stockholders approved our 2021 Plan on , 2021 and on , 2021, respectively. The 2021 Plan will become effective, and no stock awards may be granted under the 2021 Plan until, immediately prior to the execution of the underwriting agreement related to this offering. Once the 2021 Plan is effective, no further grants will be made under the 2015 Plan.
Stock Awards. The 2021 Plan provides for the grant of incentive stock options, or ISOs, within the meaning of Section 422 of the Code, nonstatutory stock options, or NSOs, stock appreciation rights, restricted stock awards, restricted stock unit awards, performance stock awards, and other forms of equity compensation, which are collectively referred to as stock awards. ISOs may be granted only to our employees and to any of the employees of our subsidiary corporations. All other awards may be granted to employees, including officers, and to non-employee directors and consultants of ours and any of our affiliates.
Share Reserve. Initially, the aggregate number of shares of our Class A common stock that may be issued pursuant to stock awards under the 2021 Plan is the sum of (i) shares of our Class A common stock plus (ii) the number of shares of Class A common stock reserved, and remaining available for issuance, under our 2015 Plan at the time our 2021 Plan became effective and (iii) the number of shares subject to stock options or other stock awards granted under our 2015 Plan that would have otherwise returned to our 2015 Plan and 2005 Plan (such as upon the expiration or termination of a stock award prior to vesting). The number of shares of our Class A common stock reserved for issuance under our 2021 Plan will automatically increase on January 1 of each year, beginning on January 1, 2022 (assuming the 2021 Plan becomes effective in 2021) and continuing through and including January 1, 2031, by % of the total number of shares of our Class A common stock outstanding on December 31 of the preceding calendar year, or a lesser number of shares determined by our board of directors. The maximum number of shares that may be issued upon the exercise of ISOs under our 2021 Plan is shares.
If a stock award granted under the 2021 Plan expires or otherwise terminates without being exercised in full, or is settled in cash, the shares of our Class A common stock not acquired pursuant to
145
Table of Contents
the stock award again will become available for subsequent issuance under the 2021 Plan. In addition, the following types of shares under the 2021 Plan may become available for the grant of new stock awards under the 2021 Plan: (1) shares that are forfeited to or repurchased by us prior to becoming fully vested; (2) shares withheld to satisfy income or employment withholding taxes; or (3) shares used to pay the exercise or purchase price of a stock award. Shares issued under the 2021 Plan may be previously unissued shares or reacquired shares bought by us on the open market.
The maximum number of shares of Class A common stock subject to stock awards granted under the 2021 Plan or otherwise during any one calendar year to any non-employee director, taken together with any cash fees paid by us to such non-employee director during such calendar year for service on the board of directors, will not exceed $ in total value (calculating the value of any such stock awards based on the grant date fair value of such stock awards for financial reporting purposes), or, with respect to the calendar year in which a non-employee director is first appointed or elected to our board of directors, $ .
Administration. Our board of directors, or a duly authorized committee thereof, has the authority to administer the 2021 Plan, and is referred to herein as the “plan administrator”. Our board of directors may also delegate to one or more of our officers the authority to (1) designate employees (other than other officers) to be recipients of certain stock awards, (2) determine the number of shares of Class A common stock to be subject to such stock awards, and (3) specify the other terms and conditions, including the strike price or purchase price and vesting schedule, applicable to such awards. Subject to the terms of the 2021 Plan, our board of directors or the authorized committee, referred to as the plan administrator, determines recipients, dates of grant, the numbers and types of stock awards to be granted and the terms and conditions of the stock awards, including the period of their exercisability and the vesting schedule applicable to a stock award. Subject to the limitations set forth below, the plan administrator will also determine the exercise price, strike price or purchase price of stock awards granted and the types of consideration to be paid for the stock award.
The plan administrator has the authority to modify outstanding stock awards under our 2021 Plan. Subject to the terms of our 2021 Plan, the plan administrator has the authority, without stockholder approval, to reduce the exercise, purchase or strike price of any outstanding stock award, cancel any outstanding stock award in exchange for new stock awards, cash or other consideration, or take any other action that is treated as a repricing under generally accepted accounting principles, with the consent of any adversely affected participant.
Stock Options. ISOs and NSOs are evidenced by stock option agreements adopted by the plan administrator. The plan administrator determines the exercise price for a stock option, within the terms and conditions of the 2021 Plan, provided that the exercise price of a stock option generally cannot be less than 100% of the fair market value of our Class A common stock on the date of grant. Options granted under the 2021 Plan vest at the rate specified by the plan administrator.
The plan administrator determines the term of stock options granted under the 2021 Plan, up to a maximum of 10 years. Unless the terms of an option holder’s stock option agreement provide otherwise, if an option holder’s service relationship with us, or any of our affiliates, ceases for any reason other than disability, death or cause, the option holder may generally exercise any vested options for a period of three months following the cessation of service. The option term will automatically be extended in the event that exercise of the option following such a termination of service is prohibited by applicable securities laws or our insider trading policy. If an option holder’s service relationship with us or any of our affiliates ceases due to disability or death, or an option holder dies within a certain period following cessation of service, the option holder or a beneficiary may generally exercise any vested options for a period of 12 months in the event of disability and 18 months in the event of death. In the event of a termination for cause, options generally terminate immediately. In no event may an option be exercised beyond the expiration of its term.
146
Table of Contents
Acceptable consideration for the purchase of Class A common stock issued upon the exercise of a stock option will be determined by the plan administrator and may include (1) cash, check, bank draft or money order, (2) a broker-assisted cashless exercise, (3) the tender of shares of our Class A common stock previously owned by the option holder, (4) a net exercise of the option if it is an NSO and, (5) other legal consideration approved by the plan administrator.
Unless the plan administrator provides otherwise, options generally are not transferable except by will, the laws of descent and distribution, or pursuant to a domestic relations order. An option holder may designate a beneficiary, however, who may exercise the option following the option holder’s death.
Tax Limitations on ISOs. The aggregate fair market value, determined at the time of grant, of our Class A common stock with respect to ISOs that are exercisable for the first time by an option holder during any calendar year under all of our stock plans may not exceed $100,000. Options or portions thereof that exceed such limit will be treated as NSOs. No ISOs may be granted to any person who, at the time of the grant, owns or is deemed to own stock possessing more than 10% of our total combined voting power or that of any of our subsidiary corporations unless (1) the option exercise price is at least 110% of the fair market value of the stock subject to the option on the date of grant and (2) the term of the ISO does not exceed five years from the date of grant.
Restricted Stock Awards. Restricted stock awards are evidenced by restricted stock award agreements adopted by the plan administrator. Restricted stock awards may be granted in consideration for (1) cash, check, bank draft or money order, (2) services rendered to us or our affiliates, or (3) any other form of legal consideration. Class A common stock acquired under a restricted stock award may, but need not, be subject to a share repurchase option in our favor in accordance with a vesting schedule as determined by the plan administrator. Rights to acquire shares under a restricted stock award may be transferred only upon such terms and conditions as set by the plan administrator. Except as otherwise provided in the applicable award agreement, restricted stock awards that have not vested will be forfeited upon the participant’s cessation of continuous service for any reason.
Restricted Stock Unit Awards. Restricted stock unit awards are evidenced by restricted stock unit award agreements adopted by the plan administrator. Restricted stock unit awards may be granted in consideration for any form of legal consideration or for no consideration. A restricted stock unit award may be settled by cash, delivery of stock, a combination of cash and stock as deemed appropriate by the plan administrator, or in any other form of consideration set forth in the restricted stock unit award agreement. Additionally, dividend equivalents may be credited in respect of shares covered by a restricted stock unit award. Rights under a restricted stock unit award may be transferred only upon such terms and conditions as set by the plan administrator. Restricted stock unit awards may be subject to vesting as determined by the plan administrator. Except as otherwise provided in the applicable award agreement, restricted stock units that have not vested will be forfeited upon the participant’s cessation of continuous service for any reason.
Stock Appreciation Rights. Stock appreciation rights are evidenced by stock appreciation grant agreements adopted by the plan administrator. The plan administrator determines the strike price for a stock appreciation right, which generally cannot be less than 100% of the fair market value of our Class A common stock on the date of grant. Upon the exercise of a stock appreciation right, we will pay the participant an amount in cash or stock equal to (1) the excess of the per share fair market value of our Class A common stock on the date of exercise over the strike price, multiplied by (2) the number of shares of Class A common stock with respect to which the stock appreciation right is exercised. A stock appreciation right granted under the 2021 Plan vests at the rate specified in the stock appreciation right agreement as determined by the plan administrator.
147
Table of Contents
The plan administrator determines the term of stock appreciation rights granted under the 2021 Plan, up to a maximum of 10 years. Unless the terms of a participant’s stock appreciation right agreement provides otherwise, if a participant’s service relationship with us or any of our affiliates ceases for any reason other than cause, disability or death, the participant may generally exercise any vested stock appreciation right for a period of three months following the cessation of service. The stock appreciation right term will be further extended in the event that exercise of the stock appreciation right following such a termination of service is prohibited by applicable securities laws. If a participant’s service relationship with us, or any of our affiliates, ceases due to disability or death, or a participant dies within a certain period following cessation of service, the participant or a beneficiary may generally exercise any vested stock appreciation right for a period of 12 months in the event of disability and 18 months in the event of death. In the event of a termination for cause, stock appreciation rights generally terminate immediately upon the occurrence of the event giving rise to the termination of the individual for cause. In no event may a stock appreciation right be exercised beyond the expiration of its term.
Unless the plan administrator provides otherwise, stock appreciation rights generally are not transferable except by will, the laws of descent and distribution, or pursuant to a domestic relations order. A stock appreciation right holder may designate a beneficiary, however, who may exercise the stock appreciation right following the holder’s death.
Performance Awards. Our 2021 Plan permits the grant of performance stock and cash awards. The performance goals that may be selected include one or more of the following: (1) earnings (including earnings per share and net earnings); (2) earnings before interest, taxes and depreciation; (3) earnings before interest, taxes, depreciation and amortization; (4) total stockholder return; (5) return on equity or average stockholder’s equity; (6) return on assets, investment, or capital employed; (7) stock price; (8) margin (including gross margin); (9) income (before or after taxes); (10) operating income; (11) operating income after taxes; (12) pre-tax profit; (13) operating cash flow; (14) sales or revenue targets; (15) increases in revenue or product revenue; (16) expenses and cost reduction goals; (17) improvement in or attainment of working capital levels; (18) economic value added (or an equivalent metric); (19) market share; (20) cash flow; (21) cash flow per share; (23) share price performance; (24) debt reduction; (25) customer satisfaction ; (26) stockholders’ equity; (27) capital expenditures; (28) debt levels; (29) operating profit or net operating profit; (30) workforce diversity; (31) growth of net income or operating income; (32) billings; (33) financing; (34) regulatory milestones; (35) stockholder liquidity; (36) corporate governance and compliance; (37) intellectual property; (38) personnel matters; (39) progress of partnered programs (40) employee retention; (41) partner or collaborator achievements; (42) internal controls, including those related to the Sarbanes-Oxley Act of 2002; (43) investor relations, analysts and communication; (44) implementation or completion of projects or processes; (45) strategic partnerships or transactions (including in-licensing and out-licensing of intellectual property); (46) establishing relationships with respect to the marketing, distribution, and sale of the Company’s products; (47) co-development, co-marketing, profit sharing, joint venture, or other similar arrangements; (48) individual performance goals; (49) corporate development and planning goals; (50) bookings goals; (51) budget management; and (52) other measures of performance selected by our board of directors or a committee thereof.
The performance goals may be based on company-wide performance or performance of one or more business units, divisions, affiliates, or business segments, and may be either absolute or relative to the performance of one or more comparable companies or the performance of one or more relevant indices. Unless specified otherwise by our board of directors when the performance award is granted, we will appropriately make adjustments in the method of calculating the attainment of performance goals as follows: (1) to exclude restructuring and/or other nonrecurring charges; (2) to exclude exchange rate effects; (3) to exclude the effects of changes to generally accepted accounting principles; (4) to exclude the effects of any statutory adjustments to corporate tax rates; (5) to exclude
148
Table of Contents
the effects of any items that are unusual in nature or occur infrequently as determined under generally accepted accounting principles; (6) to exclude the dilutive effects of acquisitions or joint ventures; (7) to assume that any business divested by us achieved performance objectives at targeted levels during the balance of a performance period following such divestiture; (8) to exclude the effect of any change in the outstanding shares of our Class A common stock by reason of any stock dividend or split, stock repurchase, reorganization, recapitalization, merger, consolidation, spin-off, combination or exchange of shares or other similar corporate change, or any distributions to common stockholders other than regular cash dividends; (9) to exclude the effects of stock-based compensation and the award of bonuses under our bonus plans; (10) to exclude costs incurred in connection with potential acquisitions or divestitures that are required to be expensed under generally accepted accounting principles; and (11) to exclude the goodwill and intangible asset impairment charges that are required to be recorded under generally accepted accounting principles. In addition, we retain the discretion to adjust or eliminate the compensation or economic benefit due upon attainment of the goals. The performance goals may differ from participant to participant and from award to award.
Other Stock Awards. The plan administrator may grant other awards based in whole or in part by reference to our Class A common stock. The plan administrator will set the number of shares under the stock award and all other terms and conditions of such awards.
Stock Appreciation Rights. Stock appreciation rights are granted under stock appreciation grant agreements adopted by the administrator. The administrator determines the purchase price or strike price for a stock appreciation right, and in a manner consistent with the provisions of Section 409A the Code. A stock appreciation right granted under the 2015 Plan vests at the rate specified in the stock appreciation right agreement as determined by the administrator. Each stock appreciation right is denominated in shares of our Class B common stock equivalents.
Changes to Capital Structure. In the event that there is a specified type of change in our capital structure, such as a stock split or recapitalization, appropriate adjustments will be made to (1) the class and maximum number of shares reserved for issuance under the 2021 Plan, (2) the class and maximum number of shares by which the share reserve may increase automatically each year, (3) the class and number of shares that may be issued upon the exercise of ISOs, and (4) the class and number of shares and exercise price, strike price, or purchase price, if applicable, of all outstanding stock awards.
Corporate Transactions. The following applies to stock awards under the 2021 Plan in the event of certain specified corporate transactions, unless otherwise provided in a participant’s stock award agreement or other written agreement with us or one of our affiliates or unless otherwise expressly provided by the plan administrator at the time of grant.
In the event of a corporate transaction, any stock awards outstanding under the 2021 Plan may be assumed, continued or substituted for by any surviving or acquiring corporation (or its parent company), and any reacquisition or repurchase rights held by us with respect to the stock award may be assigned to our successor (or its parent company). If the surviving or acquiring corporation (or its parent company) does not assume, continue or substitute for such stock awards, then (i) with respect to any such stock awards that are held by participants whose continuous service has not terminated prior to the effective time of the corporate transaction, or current participants, the vesting (and exercisability, if applicable) of such stock awards will be accelerated in full (or, in the case of performance awards with multiple vesting levels depending on the level of performance, vesting will accelerate at 100% of the target level) to a date prior to the effective time of the corporate transaction (contingent upon the effectiveness of the corporate transaction), and such stock awards will terminate if not exercised (if applicable) at or prior to the effective time of the corporate transaction, and any reacquisition or repurchase rights held by us with respect to such stock awards will lapse (contingent
149
Table of Contents
upon the effectiveness of the corporate transaction), and (ii) any such stock awards that are held by persons other than current participants will terminate if not exercised (if applicable) prior to the effective time of the corporate transaction, except that any reacquisition or repurchase rights held by us with respect to such stock awards will not terminate and may continue to be exercised notwithstanding the corporate transaction.
In the event a stock award will terminate if not exercised prior to the effective time of a corporate transaction, the plan administrator may provide, in its sole discretion, that the holder of such stock award may not exercise such stock award but instead will receive a payment equal in value to the excess (if any) of (i) the per share amount payable to holders of our Class A common stock in connection with the corporate transaction, over (ii) any per share exercise price payable by such holder, if applicable. In addition, any escrow, holdback, earn out or similar provisions in the definitive agreement for the corporate transaction may apply to such payment to the same extent and in the same manner as such provisions apply to the holders of our Class A common stock.
Under the 2021 Plan, a significant corporate transaction is generally the consummation of (1) a sale or other disposition of all or substantially all of our consolidated assets, (2) a sale or other disposition of at least 50% of our outstanding securities, (3) a merger, consolidation or similar transaction following which we are not the surviving corporation or (4) a merger, consolidation or similar transaction following which we are the surviving corporation but the shares of our Class A common stock outstanding immediately prior to such transaction are converted or exchanged into other property by virtue of the transaction.
Amendment and Termination. Our board of directors has the authority to amend, suspend or terminate our 2021 Plan, provided that such action does not materially impair the existing rights of any participant without such participant’s written consent and provided further that certain types of amendments will require the approval of our stockholders. No ISOs may be granted after the tenth anniversary of the date our board of directors adopts our 2021 Plan.
2015 Equity Incentive Plan
Our board of directors adopted and our stockholders approved our 2015 Plan on October 8, 2015 and on October 30, 2015, respectively. Our 2015 Plan has been periodically amended, most recently on February 1, 2021. Our 2015 Plan permits the grant of ISOs, NSOs, stock appreciation rights, restricted or unrestricted stock awards, phantom stock, restricted stock units, performance awards, and other stock-based awards. ISOs may be granted only to our employees and to any of the employees of our subsidiary corporations’ employees. All other awards may be granted to employees, directors and consultants of ours and to any of our parent or subsidiary corporation’s employees or consultants. Our 2015 Plan will be terminated prior to the completion of this offering, and thereafter we will not grant any additional awards under our 2015 Plan. However, our 2015 Plan will continue to govern the terms and conditions of the outstanding awards previously granted thereunder.
As of December 31, 2020, stock options and stock appreciation rights covering 1,821,535 shares of our Class B common stock with a weighted-average exercise price of $40.75 per share were outstanding, and 114,357 shares of our Class B common stock remained available for the future grant of awards under our 2015 Plan. Any shares of our Class B common stock remaining available for issuance under our 2015 Plan when our 2021 Plan becomes effective will become available for issuance under our 2021 Plan. In addition, any shares subject to awards that expire or terminate prior to exercise or settlement or are withheld to satisfy tax withholding obligations will be added to the number of shares then available for issuance under our 2021 Plan.
Administration. Our board of directors or a committee delegated by our board of directors administers our 2015 Plan. Subject to the terms of our 2015 Plan, the administrator has the power to,
150
Table of Contents
among other things, determine the eligible persons to whom, and the times at which, awards will be granted, to determine the terms and conditions of each award (including the number of shares subject to the award, the exercise price of the award, if any, and when the award will vest and, as applicable, become exercisable), to modify or amend outstanding awards, or accept the surrender of outstanding awards and substitute new awards, to accelerate the time(s) at which an award may vest or be exercised, and to construe and interpret the terms of our 2015 Plan and awards granted thereunder.
Options. The exercise price per share of ISOs granted under our 2015 Plan must be at least 100% of the fair market value per share of our Class B common stock on the grant date. NSOs may be granted with a per share exercise price that is less than 100% of the per share fair market value of our Class B common stock. Subject to the provisions of our 2015 Plan, the administrator determines the other terms of options, including any vesting and exercisability requirements, the method of payment of the option exercise price, the option expiration date, and the period following termination of service during which options may remain exercisable.
Changes to Capital Structure. In the event there is a specified type of change in our capital structure, such as any merger, consolidation, reorganization, recapitalization, stock dividend, stock split, reverse stock split, liquidating dividend, exchange of shares, change in corporate structure or any other such equity restructuring transaction, appropriate adjustments will be made to our board of directors will make final, binding and conclusive adjustments to (i) the classes and maximum number of shares subject to the 2015 Plan, (ii) the classes and maximum number of shares that may be issued upon the exercise of incentive stock options and the classes, number, and (iii) the classes, number of shares and price per share of stock subject to outstanding stock awards.
Transactions. In the event of certain specified significant transactions, our administrator generally may take one or more of the following actions with respect to outstanding awards:
| ● | arrange for the assumption, continuation or substitution of a stock award by a surviving or acquiring entity or parent company; |
| ● | arrange for the assignment of any reacquisition or repurchase rights held by us to the surviving or acquiring entity or parent company; |
| ● | accelerate the vesting, in whole or in part, of the stock award and provide for its termination if not exercised at or prior to the effective time of the transaction; |
| ● | arrange for the lapse, in whole or in part, of any reacquisition or repurchase right held by us; |
| ● | cancel or arrange for the cancellation of the stock award, to the extent not vested or not exercised prior to the effective time of the transaction, in exchange for such cash consideration, if any, in the sole discretion of the board of directors, or for no consideration; or |
| ● | make a payment equal to the excess of (1) the value of the property the participant would have received upon exercise of the stock award immediately prior to the effective time of such corporate transaction over (2) the exercise price or strike price otherwise payable in connection with the stock award. |
Our board of directors is not obligated to treat all awards in the same manner. Under the 2015 Plan, a significant transaction is generally the consummation of (1) a sale or other disposition of all or substantially all of our consolidated assets, (2) a sale or other disposition of at least 50% of our
151
Table of Contents
outstanding securities, (3) a merger, consolidation or similar transaction following which we are not the surviving corporation, (4) a merger, consolidation or similar transaction following which we are the surviving corporation but the shares of our Class B common stock outstanding immediately prior to such transaction are converted or exchanged into other property by virtue of the transaction, or (5) a change in control. Under the 2015 Plan, a change in control is generally (a) the acquisition by a person or entity of more than 50% of our combined voting power other than by merger, consolidation or similar transaction, (b) a consummated merger, consolidation or similar transaction immediately after which our stockholders cease to own more than 50% of the combined voting power of the surviving entity, or (c) a consummated sale, lease or exclusive license or other disposition of all or substantially all of our consolidated assets. The plan administrator may provide, in an individual award agreement or in any other written agreement between a participant and us, that the stock award will be subject to additional acceleration of vesting and exercisability in the event of a change in control.
Dissolution and Liquidation. In the event of a dissolution or liquidation, except as otherwise provided in the stock award agreement, all outstanding stock awards not subject to a forfeiture condition or our right of repurchase will terminate immediately prior to such dissolution or liquidation. Shares subject to a forfeiture condition or our right of repurchase may be repurchased or reacquired by us. Our board of directors, in its sole discretion, may cause all or some of the outstanding stock awards to fully vest and no longer be subject to any forfeiture condition or our right of repurchase prior to, and contingent upon, any dissolution or liquidation.
Plan Amendment or Termination. Our board of directors may amend, modify or, terminate our 2015 Plan at any time provided that such action does not impair the existing rights of any participant without such participant’s written consent and provided further that certain types of amendments will require the approval of our stockholders. No incentive stock options may be granted after the tenth anniversary of the date our board of directors adopts our 2015 Plan. As discussed above, we will terminate our 2015 Plan prior to the completion of this offering and no new awards will be granted thereunder following such termination.
Transferability. Unless the plan administrator provides otherwise, options granted under the 2015 Plan are generally are not transferable except by will, the laws of descent and distribution, or pursuant to a domestic relations order. An option holder may designate a beneficiary, however, who may exercise the option following the option holder’s death. Rights to acquire shares of common stock under any restricted stock award may only be transferred as set forth in the applicable restricted stock award agreement.
2005 Equity Incentive Plan
Our board of directors adopted and our stockholders approved the 2005 Plan in October 2005. The 2005 Plan was terminated upon the effectiveness of the 2015 Plan. However, any outstanding stock awards under our 2005 Plan will continue to be governed by their existing terms. As of December 31, 2020, options to purchase an aggregate of 482,079 shares of our Class B common stock remained outstanding with a weighted-average exercise price of $2.69 per share.
Our board of directors, or a committee thereof appointed by our board of directors, administers our 2005 Plan and the stock awards granted under it. Our administrator has the authority to modify outstanding stock awards under our 2005 Plan.
Our 2005 Plan provides that in the event of certain specified significant corporate transactions, generally including: (1) a sale of all or substantially all of our assets, (2) the sale or disposition of at least 90% of our outstanding securities, (3) the consummation of a merger or consolidation where we do not survive the transaction, and (4) the consummation of a merger or consolidation where we do
152
Table of Contents
survive the transaction but the shares of our Class B common stock outstanding before such transaction are converted or exchanged into other property by virtue of the transaction, unless otherwise provided in an award agreement or other written agreement between us and the award holder, the administrator may arrange for the assumption, continuation, or substitution of a stock award by a successor corporation, or arrange for the assignment of any reacquisition or repurchase rights held by us to a successor corporation. In the event that any surviving corporation or acquiring corporation does not assume or continue any or all outstanding stock awards or substitute similar stock awards for such outstanding stock awards, then with respect to the stock awards that have not been assumed, continued, or substituted and are held by a participant whose continuous service has not terminated prior to the effective time of the corporate transaction, (a) the vesting of such stock awards shall be accelerated in full to a date prior to the effective time of such corporate transaction as the board shall determine, (b) such stock awards shall terminate if not exercised (if applicable), and (c) any reacquisition or repurchase rights held by us with respect to such stock awards shall lapse. With respect to any other stock awards outstanding under the 2005 Plan that have not been assumed, continued, or substituted in the event of such significant corporate transaction, the vesting of such stock awards (and if applicable, the time at which such stock award may be exercised) shall not be accelerated, unless otherwise provided in a written agreement between us and the holder of such stock award, and such stock award shall terminate if not exercised (if applicable) prior to the effective time of such corporate transaction. Further, a stock award held by any participant whose continuous service has not terminated prior to the effective time of a “change in control” (as defined in the 2005 Plan) may be subject to additional acceleration of vesting and exercisability upon or after such event as may be provided in the stock award agreement of the stock award or as may be provided in any other written agreement between us and the participant, but in absence of such provision, no such acceleration shall occur.
Indemnification Matters
Our amended and restated certificate of incorporation that will be in effect on the completion of this offering will contain provisions that limit the liability of our current and former directors for monetary damages to the fullest extent permitted by Delaware law. Delaware law provides that directors of a corporation will not be personally liable for monetary damages for any breach of fiduciary duties as directors, except liability for:
| ● | any breach of the director’s duty of loyalty to the corporation or its stockholders; |
| ● | any act or omission not in good faith or that involves intentional misconduct or a knowing violation of law; |
| ● | unlawful payments of dividends or unlawful stock repurchases or redemptions; or |
| ● | any transaction from which the director derived an improper personal benefit. |
Such limitation of liability does not apply to liabilities arising under federal securities laws and does not affect the availability of equitable remedies such as injunctive relief or rescission.
Our amended and restated certificate of incorporation that will be in effect on the completion of this offering will authorize us to indemnify our directors, officers, employees and other agents to the fullest extent permitted by Delaware law. Our amended and restated bylaws that will be in effect on the completion of this offering will provide that we are required to indemnify our directors and officers to the fullest extent permitted by Delaware law and may indemnify our other employees and agents. Our amended and restated bylaws will also provide that, on satisfaction of certain conditions, we will advance expenses incurred by a director or officer in advance of the final disposition of any action or
153
Table of Contents
proceeding, and permit us to secure insurance on behalf of any officer, director, employee, or other agent for any liability arising out of his or her actions in that capacity regardless of whether we would otherwise be permitted to indemnify him or her under the provisions of Delaware law. We have entered and expect to continue to enter into agreements to indemnify our directors, executive officers, and other employees as determined by our board of directors. With certain exceptions, these agreements provide for indemnification for related expenses, including attorneys’ fees, judgments, fines, and settlement amounts incurred by any of these individuals in any action or proceeding. We believe these provisions in our amended and restated certificate of incorporation and amended and restated bylaws and these indemnification agreements are necessary to attract and retain qualified persons as directors and officers. We also maintain customary directors’ and officers’ liability insurance.
The limitation of liability and indemnification provisions in our amended and restated certificate of incorporation and amended and restated bylaws may discourage stockholders from bringing a lawsuit against our directors for breach of their fiduciary duty. They may also reduce the likelihood of derivative litigation against our directors and officers, even though an action, if successful, might benefit us and other stockholders. Further, a stockholder’s investment may be adversely affected to the extent that we pay the costs of settlement and damage awards against directors and officers as required by these indemnification provisions.
Insofar as indemnification for liabilities arising under the Securities Act of 1933, as amended, or the Securities Act, may be permitted for directors, executive officers or persons controlling us, we have been informed that, in the opinion of the Securities and Exchange Commission, such indemnification is against public policy as expressed in the Securities Act and is therefore unenforceable.
Rule 10b5-1 Sales Plans
Our directors and officers may adopt written plans, known as Rule 10b5-1 plans, in which they will contract with a broker to buy or sell shares of our common stock on a periodic basis. Under a Rule 10b5-1 plan, a broker executes trades under parameters established by the director or officer when entering into the plan, without further direction from them. The director or officer may amend a Rule 10b5-1 plan in some circumstances and may terminate a plan at any time. Our directors and executive officers may also buy or sell additional shares outside of a Rule 10b5-1 plan when they do not possess of material nonpublic information, subject to compliance with the terms of our insider trading policy.
154
Table of Contents
CERTAIN RELATIONSHIPS AND RELATED PARTY TRANSACTIONS
Other than compensation arrangements for our directors and executive officers, which are described elsewhere in this prospectus, below we describe transactions since January 1, 2018 to which we were a party or will be a party, in which:
| ● | the amounts involved exceeded or will exceed $120,000; and |
| ● | any of our directors, executive officers or holders of more than 5% of our capital stock, or any member of the immediate family of, or person sharing the household with, the foregoing persons, had or will have a direct or indirect material interest. |
Third-Party Tender Offers
In November 2018, we entered into an agreement with certain investors, including Tiger Global Private Investment Partners XI, L.P. and its directors, pursuant to which we agreed to waive certain transfer restrictions in connection with, and assist in the administration of, a tender offer that such investors proposed to commence. In November 2018, these investors commenced a tender offer to purchase shares of our capital stock from certain of our stockholders at a price of approximately $52.00 per share, pursuant to an offer to purchase to which we were not a party. In connection with the tender offer, and to the extent not already bound by such agreements, the investors signed a joinder to our investors’ rights agreement, right of first refusal and co-sale agreement, and our voting agreement. These investors did not receive any rights or privileges beyond those afforded to all holders of Class B common stock. In addition, the shares purchased by the investors in the tender offer will be subject to lock-up agreements that restrict their ability to transfer such shares for up to 175 days from the date of this prospectus. See “Shares Eligible for Future Sale—Lock-Up Arrangements” for more information.
Noah Glass, our Founder and Chief Executive Officer and a member of our board of directors, and his affiliated entity, the Glass Family Trust, and certain of our executive officers, including Peter Benevides, Marty Hahnfeld, Andrew Murray, and Matthew Tucker, sold shares of our Class B common stock in the tender offer.
In December 2018, an aggregate of 346,484 shares of our Class B common stock were successfully tendered pursuant to the tender offer from the sellers for an aggregate price of approximately $18.0 million. Tiger Global Private Investment Partners XI, L.P. and its affiliates are beneficial holders of more than 5% of our outstanding capital stock.
In March 2019, we entered into an agreement with certain investors, including Tiger Global Private Investment Partners XI, L.P., certain of its directors and RPII Order LLC, pursuant to which we agreed to waive certain transfer restrictions in connection with, and assist in the administration of, a tender offer that such stockholders proposed to commence. In March 2019, these investors commenced a tender offer to purchase shares of our capital stock from certain of our stockholders at a price of approximately $55.00 per share, pursuant to an offer to purchase to which we were not a party. In connection with the tender offer, and to the extent not already bound by such agreements, the investors signed a joinder to our investors’ rights agreement, right of first refusal and co-sale agreement and our voting agreement. These investors did not receive any rights or privileges beyond those afforded to all holders of Class B common stock. In addition, the shares purchased by the investors in the tender offer are subject to lock-up agreements that restrict their ability to transfer such shares for up to days from the date of this prospectus. See “Shares Eligible for Future Sale—Lock-Up Arrangements” for more information.
In April 2019, an aggregate of 146,283 shares of our Class B common stock were successfully tendered pursuant to the tender offer from the sellers for an aggregate price of approximately
155
Table of Contents
$8.0 million. Entities associated with each of Tiger Global Management and the Raine Group are beneficial holders of more than 5% of our outstanding capital stock.
In June 2020, we entered into an agreement with certain investors, including Battery Investment Partners XII, LLC, Battery Ventures XII Side Fund, L.P., Battery Ventures XII, L.P., Hospitality Investment Partners, RPII Order LLC, RRE Advisors LLC, Tiger Global Private Investment Partners XI, L.P., and Wellington Hadley Harbor Master Investors (Cayman) III L.P, pursuant to which we agreed to waive certain transfer restrictions in connection with, and assist in the administration of, a tender offer that such stockholders proposed to commence. In June 2020, these investors commenced a tender offer to purchase shares of our capital stock from certain of our stockholders at a price of approximately $79.76 per share, pursuant to an offer to purchase to which we were not a party. In connection with the tender offer, and to the extent not already bound by such agreements, the investors signed a joinder to our investors’ rights agreement, right of first refusal and co-sale agreement, and our voting agreement. These investors did not receive any rights or privileges beyond those afforded to all holders of Class B common stock. In addition, the shares purchased by the investors in the tender offer are subject to lock-up agreements that restrict their ability to transfer such shares for up to days from the date of this prospectus. See “Shares Eligible for Future Sale—Lock-Up Arrangements” for more information.
Noah Glass, our Founder and Chief Executive Officer and a member of our board of directors, and his affiliated entity, the Glass Family Trust, and certain of our executive officers, including Peter Benevides, Marty Hahnfeld, Andrew Murray, and Matthew Tucker, sold shares of our Class B common stock in the tender offer.
In July 2020, an aggregate of 223,090 shares of our Class B common stock were successfully tendered pursuant to the tender offer from the sellers for an aggregate price of approximately $17.8 million. Entities associated with Battery Ventures, the Raine Group, RRE Ventures, Tiger Global Management, and Wellington Management are beneficial holders of more than 5% of our outstanding capital stock.
In January 2021, an aggregate of 5,236 shares of our Class B common stock were sold by Alvaro Gutierrez, a stockholder of the company, to entities associated with Battery Ventures, Tiger Global Management, and Wellington Management for an aggregate price of approximately $0.9 million. Entities associated with Battery Ventures, Tiger Global Management, and Wellington Management are beneficial holders of more than 5% of our outstanding capital stock.
Stockholder Agreements
In connection with our preferred stock financings, we entered into certain stockholder agreements, including an investors’ rights agreement, a voting agreement and a right of first refusal and co-sale agreement, which contain, among other things, registration rights, information rights, voting rights with respect to the election of directors, co-sale rights and rights of first refusal, with certain holders of our capital stock. The parties to these stockholder agreements include: Noah Glass, entities affiliated with Raqtinda Investments LLC, where our director, David Frankel, is a co-manager; entities affiliated with RRE Ventures IV, L.P., where our director, James D. Robinson IV, is a Managing Partner; entities affiliated with Staley Capital Fund I, LP, where our director Warren C. Smith, Jr. is the Managing Partner; entities affiliated with RPII Order LLC, where our directors, Brandon Gardner and Colin Neville are Partners; and entities affiliated with Hospitality Investment Partners, G.P., of which Daniel Meyer Revocable Trust is the Managing Partner, where our director Daniel Meyer is one of the trustees, and Wellington Hadley Harbor Master Investors (Cayman) III L.P.
The investors’ rights agreement, voting agreement, and right of first refusal and co-sale agreement will terminate upon the completion of this offering, except with respect to registration rights,
156
Table of Contents
as more fully described in the section titled “Description of Capital Stock—Stockholder Registration Rights.” See also the section titled “Principal Stockholders” for additional information regarding beneficial ownership of our capital stock.
Series E Preferred Stock Financing
In April 2020, we sold an aggregate of 564,169 shares of our Series E redeemable convertible preferred stock at a purchase price of $88.62581 per share for an aggregate purchase price of approximately $50,000,000, or the Series E Financing. All purchasers of our Series E redeemable convertible preferred stock are entitled to specified registration rights. See the section titled “Description of Capital Stock—Registration Rights” for more information regarding these registration rights. The following table summarizes the Series E redeemable convertible preferred stock purchased by our executive officers, members of our board of directors or their affiliates, and holders of more than 5% of our outstanding capital stock:
| Name of Stockholder |
Shares of Series E Preferred Stock |
Total Purchase Price | ||||||
| Wellington Hadley Harbor Master Investors (Cayman) III L.P. |
451,335 | $ | 39,999,929.96 | |||||
| RPII Order LLC |
88,783 | $ | 7,868,465.29 | |||||
| RRE Leaders II, L.P. |
22,566 | $ | 1,999,930.03 | |||||
| Hospitality Investment Partners |
1,485 | $ | 131,609.33 | |||||
Equity Grants to Directors and Executive Officers
We have granted stock options to certain of our directors and executive officers. For more information regarding the stock options and stock awards granted to our directors and named executive officers, see the sections titled “Management—Non-Employee Director Compensation” and “Executive Compensation.”
Employment Agreements
We have entered into employment agreements with our executive officers. For more information regarding employment agreements with our named executive officers, see the section titled “Executive Compensation—Employment Arrangements.”
Directed Share Program
At our request, the underwriters have reserved up to shares of Class A common stock, or % of the shares offered by this prospectus, for sale at the initial public offering price, to our directors, certain of our customers and partners, and the friends and family members of certain of our employees, directors, customers, and partners.
Indemnification Agreements
Our amended and restated certificate of incorporation that will be in effect on the completion of this offering will contain provisions limiting the liability of directors, and our amended and restated bylaws that will be in effect on the completion of this offering will provide that we will indemnify each of our directors and officers to the fullest extent permitted under Delaware law. Our amended and restated certificate of incorporation and amended and restated bylaws that will be in effect on the completion of this offering will also provide our board of directors with discretion to indemnify our employees and other agents when determined appropriate by the board of directors. In addition, we have entered into an indemnification agreement with each of our directors and executive officers, which requires us to indemnify them. For more information regarding these agreements, see the section titled “Executive Compensation—Limitations on Liability and Indemnification Matters.”
157
Table of Contents
Policies and Procedures for Transactions with Related Persons
Prior to the completion of this offering, we intend to adopt a policy that our executive officers, directors, nominees for election as a director, beneficial owners of more than 5% of any class of our common stock, and any members of the immediate family of any of the foregoing persons are not permitted to enter into a related person transaction with us without the approval or ratification of our board of directors or our audit committee. Any request for us to enter into a transaction with an executive officer, director, nominee for election as a director, beneficial owner of more than 5% of any class of our common stock, or any member of the immediate family of any of the foregoing persons, in which the amount involved exceeds $120,000 and such person would have a direct or indirect interest, must be presented to our board of directors or our audit committee for review, consideration, and approval. In approving or rejecting any such proposal, our board of directors or our audit committee is to consider the material facts of the transaction, including whether the transaction is on terms no less favorable than terms generally available to an unaffiliated third party under the same or similar circumstances and the extent of the related person’s interest in the transaction.
158
Table of Contents
The following table sets forth information with respect to the beneficial ownership of our shares as of December 31, 2020 by:
| ● | each named executive officer; |
| ● | each of our directors; |
| ● | our directors and executive officers as a group; and |
| ● | each person or entity known by us to own beneficially more than 5% of our Class A common stock and Class B common stock (by number or by voting power). |
We have determined beneficial ownership in accordance with the rules and regulations of the Securities Exchange Commission, or SEC, and the information is not necessarily indicative of beneficial ownership for any other purpose. Except as indicated by the footnotes below, we believe, based on information furnished to us, that the persons and entities named in the table below have sole voting and sole investment power with respect to all shares that they beneficially own, subject to applicable community property laws.
Applicable percentage ownership before this offering is based on 7,210,075 shares of Class B common stock outstanding as of December 31, 2020, assuming the reclassification of all outstanding shares of our common stock into an equivalent number of shares of our Class B common stock, the automatic conversion of all outstanding shares of redeemable convertible preferred stock into 5,794,996 shares of Class B common stock. Applicable percentage ownership after this offering is based on shares of Class A common stock and Class B common stock outstanding immediately after the completion of this offering, assuming no exercise by the underwriters of their option to purchase additional shares of Class A common stock and shares of Class B common stock from us. In computing the number of shares beneficially owned by a person and the percentage ownership of such person, we deemed to be outstanding all shares subject to options held by the person that are currently exercisable, or exercisable or would vest based on service-based vesting conditions within 60 days of December 31, 2020. However, except as described above, we did not deem such shares outstanding for the purpose of computing the percentage ownership of any other person.
159
Table of Contents
Unless otherwise indicated, the address for each beneficial owner listed in the table below is c/o Olo Inc., 285 Fulton Street One World Trade Center, 82nd Floor New York, New York 10007.
| Shares of Class A Common Stock Beneficially Owned Before the Offering |
Shares of Class B Common Stock Beneficially Owned Before the Offering |
Shares of Class A Common Stock Beneficially Owned After the Offering |
Shares of Class B Common Stock Beneficially Owned After the Offering |
|||||||||||||||||||||||||||||
| Shares | % | Shares | % | Shares | % | Shares | % | |||||||||||||||||||||||||
| Name of Beneficial Owner |
||||||||||||||||||||||||||||||||
| 5% or greater stockholders: |
||||||||||||||||||||||||||||||||
| Entities associated with The Raine Group(1) |
2,008,203 | 27.9 | ||||||||||||||||||||||||||||||
| Entitles associated with RRE Ventures(2) |
998,574 | 13.9 | ||||||||||||||||||||||||||||||
| Entitles associated with Tiger Global Management(3) |
1,027,298 | 14.3 | ||||||||||||||||||||||||||||||
| Entities associated with Raqtinda Investments (4) |
773,998 | 10.7 | ||||||||||||||||||||||||||||||
| Entities associated with Battery Ventures(5) |
707,958 | 9.8 | ||||||||||||||||||||||||||||||
| Entities associated with Staley Capital(6) |
561,144 | 7.8 | ||||||||||||||||||||||||||||||
| Entities associated with Wellington Management(7) |
471,695 | 6.5 | ||||||||||||||||||||||||||||||
| Directors and Named Executive Officers: |
||||||||||||||||||||||||||||||||
| Noah Glass (8) |
680,454 | 8.9 | ||||||||||||||||||||||||||||||
| Brandon Gardner(1) |
2,008,203 | 27.9 | ||||||||||||||||||||||||||||||
| David Frankel(4) |
773,998 | 10.7 | ||||||||||||||||||||||||||||||
| Daniel Meyer (9) |
72,466 | 1.0 | ||||||||||||||||||||||||||||||
| Russell Jones(10) |
3,996 | * | ||||||||||||||||||||||||||||||
| Colin Neville(1) |
2,008,203 | 27.9 | ||||||||||||||||||||||||||||||
| James D. Robinson IV(2) |
967,290 | 13.6 | ||||||||||||||||||||||||||||||
| Linda Rottenberg(11) |
61,249 | * | ||||||||||||||||||||||||||||||
| Warren C. Smith Jr.(6) |
492,405 | 7.8 | ||||||||||||||||||||||||||||||
| Zuhairah Washington(12) |
1,498 | * | ||||||||||||||||||||||||||||||
| Nithya B. Das(13) |
7,677 | * | ||||||||||||||||||||||||||||||
| Marty Hahnfeld(14) |
135,411 | 1.9 | ||||||||||||||||||||||||||||||
| All directors and executive officers as a
|
1,283,151 | 15.7 | ||||||||||||||||||||||||||||||
| * | Represents beneficial ownership of less than 1%. |
160
Table of Contents
| (1) | Consists of (a) 159,824 shares of Class B common stock, (b) 310,010 shares of Class B common stock issuable upon the conversion of Series A-1 preferred stock, (c) 12,429 shares of Class B common stock issuable upon conversion of Series B preferred stock, (d) 27,578 shares of Class B common stock issuable upon conversion of Series C preferred stock, (e) 1,409,579 shares of Class B common stock issuable upon conversion of Series D preferred stock and (f) 88,783 shares of Class B common stock issuable upon conversion of Series E preferred stock, held by RPII Order LLC. The sole member of RPII Order LLC is Raine Partners II LP, a private equity-fund managed by Raine Capital LLC, an SEC-registered Investment Advisor and subsidiary of The Raine Group LLC. The Investment Committee members of Raine Partners II LP who share voting and dispositive power with respect to such shares are Jeffrey A. Sine, Joseph Ravitch, Brandon W. Gardner, John Salter, and Deborah Mei. The address of RPII Order LLC is 65 East 55th Street, 24th Floor, New York, NY 10022. |
| (2) | Consists of (a) 19,432 shares of Class B common stock held by RRE Advisors LLC, (b) 18,179 shares of Class B common stock held by RRE Leaders II, L.P., (c) 800,090 shares of Class B common stock issuable upon the conversion of Series A-1 preferred stock held by RRE Ventures IV, L.P., (d) 20,879 shares of Class B common stock issuable upon the conversion of Series B preferred stock held by RRE Ventures IV, L.P., (e) 105,576 shares of Class B common stock issuable upon the conversion of Series C preferred stock held by RRE Ventures IV, L.P., (f) 11,852 shares of Class B common stock issuable upon the conversion of Series C preferred warrants held by RRE Ventures IV, L.P., and (g) 22,566 shares of Class B common stock issuable upon conversion of Series E preferred stock, held by RRE Leaders II, L.P. The sole general partner of RRE Ventures IV, L.P. is RRE Ventures GP IV, LLC. The sole general partner of RRE Leaders II, L.P. is RRE Leaders GP II, LLC. The managing members and officers of these entities are James D. Robinson IV, Stuart J. Ellman, and William D. Porteous. RRE Advisors LLC is managed and owned by James D. Robinson IV and Stuart J. Ellman. The address of each of these entities is 150 East 59th Street, 17th Floor, New York, NY 10022. |
| (3) | Consists of (a) 479,169 shares of Class B common stock, (b) 309,980 shares of Class B common stock issuable upon the conversion of Series A preferred stock, (c) 210,571 shares of Class B common stock issuable upon the conversion of Series B preferred stock, and (d) 27,578 shares of Class B common stock issuable upon the conversion of Series C preferred stock, held by Tiger Global Private Investment Partners XI, L.P. and other affiliates of Tiger Global Management, LLC. Tiger Global Management, LLC is controlled by Chase Coleman and Scott Shleifer. The business address for each of these entities and individuals is c/o Tiger Global Management, LLC, 9 West 57th Street, 35th Floor, New York, NY 10019. The table above does not reflect the 2,437 shares of Class B common stock acquired by Tiger Global PIP 11 Holdings, L.P. from the Alvaro Gutierrez transfer on January 25, 2021. |
| (4) | Consists of (a) 3,136 shares of Class B common stock, (b) 409,550 shares of Class B common stock issuable upon the conversion of Series A preferred stock, (b) 331,570 shares of Class B common stock issuable upon the conversion of Series A-1 preferred stock, (c) 29,742 shares of Class B common stock issuable upon the conversion of Series B preferred stock, held by Raqtinda Investments LLC. Raqtinda Investments LLC is managed by Peter Rosenberg and David Frankel. The Raqtinda Trust is the member of Raqtinda Investments LLC. Peter Rosenberg and Tracey Nicole Frankel are trustees of the Raqtinda Trust and David Andrew Frankel is the Grantor of the Raqtinda Trust. The address of Raqtinda Investments LLC is c/o Stonehage Fleming US LLC, One Liberty Place, 1700 Market Street, Suite 3010, Philadelphia, PA 19103. |
| (5) | Consists of (a) 1,034 shares of Class B common stock held by Battery Investment Partners XII, LLC (“BIP XII”), (b) 8,050 shares of Class B common stock issuable upon the conversion of Series A-1 preferred stock, held by BIP XII, (c) 3,949 shares of Class B common stock issuable upon the conversion of Series B preferred stock, held by BIP XII, (d) 413 shares of Class B common stock issuable upon the conversion of Series C preferred stock, held by BIP XII, (e) 26,705 shares of Class B common stock held by Battery Ventures XII Side Fund, L.P. (“BV XII SF”), (f) 207,930 shares of Class B common stock issuable upon the conversion of Series A-1 preferred stock, held by BV XII SF, (g) 101,937 shares of Class B common stock issuable upon the conversion of Series B preferred stock, held by BV XII SF, (h) 10,684 shares of Class B common stock issuable upon the conversion of Series C preferred stock, held by BV XII SF, (i) 26,705 shares of Class B common stock held by Battery Ventures XII, L.P. (“BV XII”), (j) 207,930 shares of Class B common stock issuable upon the conversion of Series A-1 preferred stock, held by BV XII, (k) 101,937 shares of Class B common stock issuable upon the conversion of Series B preferred stock, held by BV XII and (l) 10,684 shares of Class B common stock issuable upon the conversion of Series C preferred stock, held by BV XII. The sole general partner of BV XII is Battery Partners XII, LLC (“BP XII”). The sole managing member of BIP XII is BIP XII. The sole general partner of BV XII SF is Battery Partners XII Side Fund, LLC (“BP XII SF”). BP XII and BP XII SF’s investment adviser is Battery Management Corp. (together with BP XII and BP XII SF, the “Battery Companies”). The managing members and officers of the Battery Companies who share voting and dispositive power with respect to such shares are Neeraj Agrawal, Michael Brown, Morad Elhafed, Jesse Feldman, Russell Fleischer, Roger Lee, Itzhak Parnafes, Chelsea Stoner, Dharmesh Thakker, and Scott Tobin. Each of the foregoing persons disclaims beneficial ownership of these shares except to the extent of his/her pecuniary interest therein. The address of each of these entities is One Marina Park Drive, Suite 1100, Boston, MA 02210. The table above does not reflect the 32 shares of Class B common stock acquired by Battery Investment Partners XII, LLC, the 824 shares of Class B common stock acquired by Battery Ventures XII Side Fund, L.P., and the 824 shares of Class B common stock acquired by Battery Ventures XII, L.P. from the Alvaro Gutierrez transfer on January 25, 2021. |
| (6) | Consists of (a) 378,642 shares of Class B common stock issuable upon the conversion of Series C preferred stock, held by Staley Capital Fund I, LP, (b) 52,859 shares of Class B common stock issuable upon the exercise of Series C preferred warrants, held by Staley Capital Fund I, LP, (c) 113,763 shares of Class B common stock issuable upon the conversion of Series C preferred stock, held by Staley Capital Olo Fund LLC and (d) 15,880 shares of Class B common stock issuable upon the exercise of Series C preferred warrants, held by Staley Capital Olo Fund LLC. Staley Capital Partners LLC is the general partner of Staley Capital Fund I, L.P. Warren C. Smith, Jr. and Amit Basak are the |
161
Table of Contents
| managers of Staley Capital Partners LLC and have shared voting and investment power over the shares held by Staley Capital Fund I, L.P. Staley Capital Management, LLC is the sole manager of Staley Capital Olo Fund LLC. Warren C. Smith, Jr. is the sole manager of Staley Capital Management, LLC and has sole voting and investment power over the shares held by Staley Capital Olo Fund LLC. Messrs. Smith and Basak disclaim beneficial ownership of any shares held by Staley Capital Fund I, L.P. and Staley Capital Olo Fund LLC except to the extent of their respective proportionate pecuniary interests therein. The address of each of these entities is 20 William Street, Suite 270, Wellesley, MA 02481. |
| (7) | Consists of (a) 20,360 shares of Class B common stock and (b) 451,335 shares of Class B common stock issuable upon the conversion of Series E preferred stock, held by Wellington Hadley Harbor Master Investors (Cayman) III L.P. Wellington Management Company LLP (“Wellington Management”) is the investment adviser of Wellington Hadley Harbor Master Investors (Cayman) III L.P. Wellington Management is an investment adviser registered under the Investment Advisers Act of 1940. Under Section 13(d) of the Securities Exchange Act of 1934, as amended, and Rule 13d-3 thereunder, Wellington Management shares beneficial ownership over shares held by Wellington Hadley Harbor Master Investors (Cayman) III L.P., for which the portfolio manager, Michael Carmen, makes investment decisions, including proxy voting decisions for the fund, subject to the terms of Wellington Management’s investment management agreement with the fund, and subject to various policies and oversight committees of Wellington Management. The business address of Wellington Hadley Harbor Master Investors (Cayman) III L.P. is c/o Wellington Management Company, Attn: Valerie Tipping, 280 Congress St, Boston, MA 02210. The table above does not reflect the 1,119 shares of Class B common stock acquired by Wellington Hadley Harbor Master Investors (Cayman) III L.P. from the Alvaro Gutierrez transfer on January 25, 2021. |
| (8) | Consists of (a) 56,739 shares of Class B common stock, held by Noah Glass, (b) 411,680 shares of Class B common stock issuable upon the exercise of options held by Noah Glass, and (c) 212,035 shares of Class B common stock, held by Glass Family Trust, of which Noah Glass is a trustee. The table above does not reflect the issuance of 52,800 shares of Class B common stock issuable upon the exercise of options granted on February 1, 2021. |
| (9) | Consists of (a) 3,537 shares of Class B common stock, (b) 67,444 shares of Class B common stock issuable upon the conversion of Series C preferred stock, (c) 1,485 shares of Class B common stock issuable upon the conversion of Series E preferred stock and (d) 9,480 shares of Class B common stock issuable upon the exercise of Series C preferred warrants, each held by Hospitality Investment Partners. |
| (10) | Consists of 3,996 shares of Class B common stock issuable upon the exercise of options. |
| (11) | Consists of 61,249 shares of Class B common stock issuable upon the exercise of options. |
| (12) | Consists of 1,498 shares of Class B common stock issuable upon the exercise of options. |
| (13) | Consists of (a) 5,419 shares of Class B common stock and (b) 2,258 shares of Class B common stock issuable upon the exercise of options. The table above does not reflect the issuance of 8,250 shares of Class B common stock issuable upon the exercise of options granted on February 1, 2021. |
| (14) | Consists of (a) 7,000 shares of Class B common stock and (b) 128,411 shares of Class B common stock issuable upon the exercise of options. The table above does not reflect the issuance of 10,150 shares of Class B common stock issuable upon the exercise of options granted on February 1, 2021. |
| (15) | Consists of (a) 290,139 shares of Class B common stock and (b) 992,9584 shares of Class B common stock issuable upon the exercise of options. The table above does not reflect the issuance of 135,700 shares of Class B common stock issuable upon the exercise of options granted to Noah Glass, Nithya B. Das, Marty Hahnfeld, Matthew Tucker, Peter Benevides, Andrew Murray, and Deanne Rhynard on February 1, 2021. |
162
Table of Contents
General
The following description of our capital stock and certain provisions of our amended and restated certificate of incorporation and amended and restated bylaws are summaries and are qualified by reference to the amended and restated certificate of incorporation and the amended and restated bylaws that will be in effect on the completion of this offering. Copies of these documents have been filed with the Securities Exchange Commission, or SEC, as exhibits to our registration statement, of which this prospectus forms a part. The descriptions of the common stock and preferred stock reflect changes to our capital structure that will be in effect on the completion of this offering.
Upon the completion of this offering, our amended and restated certificate of incorporation will provide for shares of Class A common stock, par value $0.001 per share, shares of Class B common stock, par value $0.001 per share, and shares of undesignated preferred stock, par value $0.001 per share, the rights, preferences, and privileges of which may be designated from time to time by our board of directors.
As of December 31, 2020, we had outstanding 7,210,075 shares of Class B common stock, which assumes the reclassification of all outstanding shares of our common stock into an equivalent number of shares of our Class B common stock, which will occur immediately prior to the completion of this offering, and the automatic conversion of all outstanding shares of redeemable convertible preferred stock into shares of Class B common stock.
Our outstanding capital stock was held by 73 stockholders of record as of December 31, 2020. Our board of directors will be authorized, without stockholder approval except as required by the listing standards of the NYSE, to issue additional shares of our capital stock.
Class A Common Stock and Class B Common Stock
Voting Rights
The Class A common stock is entitled to one vote per share on any matter that is submitted to a vote of our stockholders. Holders of our Class B common stock are entitles to ten votes per share on any matter submitted to our stockholders. Holders of shares of Class B common stock and Class A common stock will vote together as a single class on all matters (including the election of directors) submitted to a vote of stockholders, unless otherwise required by Delaware law.
Under Delaware law, holders of our Class A common stock or Class B common stock would be entitled to vote as a separate class if a proposed amendment to our amended and restated certificate of incorporation would increase or decrease the aggregate number or authorized shares of such class, increase or decrease the par value of the shares of such class, or alter or change the powers, preferences, or special rights of the shares of such class so as to affect them adversely. As a result, in these limited instances, the holders of a majority of the Class A common stock could defeat any amendment to our amended and restated certificate of incorporation. For example, if a proposed amendment of our amended and restated certificate of incorporation provided for the Class A common stock to rank junior to the Class B common stock with respect to (1) any dividend or distribution, (2) the distribution of proceeds were we to be acquired, or (3) any other right, Delaware law would require the vote of the Class A common stock. In this instance, the holders of a majority of Class A common stock could defeat that amendment to our amended and restated certificate of incorporation.
Our amended and restated certificate of incorporation that will be in effect upon the completion of this offering will not provide for cumulative voting for the election of directors. The affirmative vote of holders of at least 66% of the voting power of all of the then-outstanding shares of our capital stock entitled to vote generally in the election of directors, voting together as a single class, will be required to amend certain provisions of our amended and restated certificate of incorporation.
163
Table of Contents
Economic Rights
Except as otherwise will be expressly provided in our amended and restated certificate of incorporation that will be in effect upon the completion of this offering or required by applicable law, all shares of Class A common stock and Class B common stock will have the same rights and privileges and rank equally, share ratably, and be identical in all respects for all matters, including those described below.
Dividends and Distributions. Subject to preferences that may apply to any shares of preferred stock outstanding at the time, the holders of Class A common stock and Class B common stock will be entitled to share equally, identically, and ratably, on a per share basis, with respect to any dividend or distribution of cash or property paid or distributed by the company, unless different treatment of the shares of the affected class is approved by the affirmative vote of the holders of a majority of the outstanding shares of such affected class, voting separately as a class. See the section titled “Dividend Policy” for additional information.
Liquidation Rights. In the event of our liquidation, dissolution or winding-up, the holders of Class A common stock and Class B common stock will be entitled to share equally, identically, and ratably in all assets remaining after the payment of any liabilities, liquidation preferences, and accrued or declared but unpaid dividends, if any, with respect to any outstanding preferred stock, unless a different treatment is approved by the affirmative vote of the holders of a majority of the outstanding shares of such affected class, voting separately as a class.
Change of Control Transactions. The holders of Class A common stock and Class B common stock will be treated equally and identically with respect to shares of Class A common stock and Class B common stock owned by them, on (a) the closing of the sale, transfer, or other disposition of all or substantially all of our assets, (b) the consummation of a merger, reorganization, consolidation, or share transfer which results in our voting securities outstanding immediately before the transaction (or the voting securities issued with respect to our voting securities outstanding immediately before the transaction) representing less than a majority of the combined voting power of the voting securities of the company or the surviving or acquiring entity, or (c) the closing of the transfer (whether by merger, consolidation or otherwise), in one transaction or a series of related transactions, to a person or group of affiliated persons of securities of the company if, after closing, the transferee person or group would hold 50% or more of the outstanding voting power of the company (or the surviving or acquiring entity). However, consideration to be paid or received by a holder of common stock in connection with any such assets sale, merger, reorganization, consolidation, or share transfer under any employment, consulting, severance, or other arrangement will be disregarded for the purposes of determining whether holders of common stock are treated equally and identically.
Subdivisions and Combinations. If we subdivide or combine in any manner outstanding shares of Class A common stock or Class B common stock, the outstanding shares of the other classes will be subdivided or combined in the same manner.
No Preemptive or Similar Rights
Holders of our Class A common stock and Class B common stock are not entitled to preemptive rights, and are not subject to conversion, redemption or sinking fund provisions.
Conversion
Each share of Class B common stock is convertible at any time at the option of the holder into one share of Class A common stock. After the closing of this offering, on any transfer of shares of
164
Table of Contents
Class B common stock, whether or not for value, each such transferred share will automatically convert into one share of Class A common stock, except for certain transfers described in our amended and restated certificate of incorporation that will be in effect on the closing of this offering, including transfers for tax and estate planning purposes, so long as the transferring holder continues to hold sole voting and dispositive power with respect to the shares transferred.
Any holder’s shares of Class B common stock will convert automatically into Class A common stock, on a one-to-one basis, upon the following: (1) the sale or transfer of such share of Class B common stock; (2) the death of the Class B common stockholder; and (3) on the final conversion date, defined as the earlier of (A) the trading day immediately following the seventh anniversary of this offering, (B) the last trading day of the fiscal quarter immediately following the date upon which the then outstanding shares of Class B common stock first represent less than 10% of the aggregate number of the then outstanding shares of Class A common stock and Class B common stock, or (C) the date specified by a vote of the holders of a majority of the outstanding shares of Class B common stock, voting as a single class.
Once transferred and converted into Class A common stock, the Class B common may not be reissued.
Fully Paid and Non-Assessable
All outstanding shares of our Class B common stock are fully paid and non-assessable. In connection with this offering, our legal counsel will opine that the shares of our Class A common stock to be issued under this offering will be fully paid and non-assessable.
Preferred Stock
As of December 31, 2020, there were 3,468,397 shares of our redeemable convertible preferred stock outstanding. Immediately prior to the completion of this offering, 3,209,886 of our outstanding shares of our redeemable convertible preferred stock will automatically convert into one share of our Class B common stock and 258,511 of our outstanding shares of our redeemable convertible preferred stock will automatically convert into ten shares of our Class B common stock.
On the completion of this offering and under our amended and restated certificate of incorporation that will be in effect on the completion of this offering, our board of directors may, without further action by our stockholders, fix the rights, preferences, privileges, and restrictions of up to an aggregate of shares of preferred stock in one or more series and authorize their issuance. These rights, preferences, and privileges could include dividend rights, conversion rights, voting rights, terms of redemption, liquidation preferences, and the number of shares constituting any series or the designation of such series, any or all of which may be greater than the rights of our Class A common stock or Class B common stock. Any issuance of our preferred stock could adversely affect the voting power of holders of our Class B common stock, and the likelihood that such holders would receive dividend payments and payments on liquidation. In addition, the issuance of preferred stock could have the effect of delaying, deferring, or preventing a change of control or other corporate action. On the completion of this offering, no shares of preferred stock will be outstanding. We have no present plan to issue any shares of preferred stock.
Options
As of December 31, 2020, 482,079 shares of our Class B common stock were issuable upon the exercise of outstanding stock options under our 2005 Plan, with a weighted-average exercise price of $2.69 per share.
As of December 31, 2020, 1,821,535 shares of our Class B common stock were issuable upon the exercise of outstanding stock options under our 2015 Plan, with a weighted-average exercise price of $40.75 per share.
165
Table of Contents
Warrants
As of December 31, 2020, we had warrants to purchase 98,991 shares of our outstanding redeemable convertible preferred stock, of which 90,071 will be exercised in connection with this offering and 8,920 will remain outstanding and convert into warrants to purchase our Class B common stock. The warrants are exercisable at a weighted-average exercise price of $11.84 per share. A warrant to acquire 892 of such shares will become a warrant to purchase 8,920 shares of Class B common stock upon the closing of this offering, at a weighted-average exercise price of $28.00 per share. These warrants contain provisions for the adjustment of the exercise price and the number of shares issuable upon the exercise of the warrant in the event of certain stock dividends, stock splits, reorganizations, reclassifications, and consolidations.
Registration Rights
Stockholder Registration Rights
We are party to an investors’ rights agreement that provides that certain holders of our capital stock, including certain holders of at least 5% of our capital stock and entities affiliated with certain of our directors, have certain registration rights, as set forth below. This investors’ rights agreement was entered into in January 2016. The registration of shares of our common stock by the exercise of registration rights described below would enable the holders to sell these shares without restriction under the Securities Act when the applicable registration statement is declared effective. We will pay the registration expenses, other than underwriting discounts and commissions, of the shares registered by the demand, piggyback, and Form S-3 registrations described below.
Generally, in an underwritten offering, the managing underwriter, if any, has the right, subject to specified conditions, to limit the number of shares such holders may include. The demand, piggyback, and Form S-3 registration rights described below will expire upon the earliest to occur of: (a) five years after the first sale of our common stock following the effective date of the registration statement, of which this prospectus is a part; (b) the closing of a Deemed Liquidation Event, as defined in our amended and restated certificate of incorporation; or (c) with respect to any particular stockholder, such time as such stockholder can sell all of its shares under Rule 144 of the Securities Act or another similar exemption during any three-month period.
Demand Registration Rights
The holders of an aggregate of 6,623,716 shares of our Class B common stock will be entitled to certain demand registration rights. At any time beginning 180 days after the effective date of the registration statement, of which this prospectus is a part, such holders are entitled to registration rights under the investors’ rights agreement, on not more than one occasion, provided that the holders of at least 50% of registrable securities then outstanding request that we register all or a portion of their shares.
Piggyback Registration Rights
In connection with this offering, the holders of an aggregate of 7,103,859 shares of our Class B common stock were entitled to, and the necessary percentage of holders waived, their rights to notice of this offering and to include their shares of registrable securities in this offering. After this offering, in the event that we propose to register any of our securities under the Securities Act, either for our own account or for the account of other security holders, the holders of these shares will be entitled to certain piggyback registration rights allowing such holders to include their shares in such registration, subject to certain marketing and other limitations. As a result, whenever we propose to file a registration statement under the Securities Act, subject to certain exceptions, the holders of these
166
Table of Contents
shares are entitled to notice of the registration and have the right to include their shares in the registration, subject to limitations that the underwriters may impose on the number of shares included in the offering.
Form S-3 Registration Rights
The holders of an aggregate of 6,623,716 shares of Class B common stock will be entitled to certain Form S-3 registration rights. If we are eligible to file a registration statement on Form S-3, these holders have the right, upon written request from holders of at least 30% of the registrable securities then outstanding, to have such shares registered by us if the anticipated aggregate offering price of such shares, net of underwriting discounts and commissions, is at least $1 million, subject to exceptions set forth in the investors’ rights agreement.
Anti-Takeover Provisions
Certificate of Incorporation and Bylaws to be in Effect on the Completion of this Offering
Because our stockholders do not have cumulative voting rights, stockholders holding a majority of the voting power of our shares of common stock will be able to elect all of our directors. Our amended and restated certificate of incorporation and amended and restated bylaws to be effective on the completion of this offering will provide for stockholder actions at a duly called meeting of stockholders. A special meeting of stockholders may be called by a majority of our board of directors, the chair of our board of directors, or our chief executive officer. Our amended and restated bylaws to be effective on the completion of this offering will establish an advance notice procedure for stockholder proposals to be brought before an annual meeting of our stockholders, including proposed nominations of persons for election to our board of directors.
Our amended and restated certificate of incorporation to be effective on the closing of this offering will further provide for a dual-class common stock structure, which provides our current investors, officers, and employees with control over all matters requiring stockholder approval, including the election of directors and significant corporate transactions, such as a merger or other sale of our company or its assets. Our amended and restated certificate of incorporation and amended and restated bylaws will eliminate the right of stockholders to act by written consent without a meeting.
In accordance with our amended and restated certificate of incorporation to be effective on the completion of this offering, immediately after this offering, our board of directors will be divided into three classes with staggered three-year terms.
The foregoing provisions will make it more difficult for another party to obtain control of us by replacing our board of directors. Since our board of directors has the power to retain and discharge our officers, these provisions could also make it more difficult for existing stockholders or another party to effect a change in management. In addition, the authorization of undesignated preferred stock makes it possible for our board of directors to issue preferred stock with voting or other rights or preferences that could impede the success of any attempt to change our control.
These provisions, including the dual-class structure of our common stock, are intended to preserve our existing control structure after completion of this offering, facilitate our continued product innovation and the risk-taking that it requires, permit us to continue to prioritize our long-term goals rather than short-term results, enhance the likelihood of continued stability in the composition of our board of directors and its policies, and to discourage certain types of transactions that may involve an actual or threatened acquisition of us. These provisions are also designed to reduce our vulnerability to
167
Table of Contents
an unsolicited acquisition proposal and to discourage certain tactics that may be used in proxy fights. However, such provisions could have the effect of discouraging others from making tender offers for our shares and may have the effect of deterring hostile takeovers or delaying changes in our control or management. As a consequence, these provisions may also inhibit fluctuations in the market price of our stock that could result from actual or rumored takeover attempts.
Section 203 of the Delaware General Corporation Law
When we have a class of voting stock that is either listed on a national securities exchange or held of record by more than 2,000 stockholders, we will be subject to Section 203 of the Delaware General Corporation Law, which prohibits a Delaware corporation from engaging in any business combination with any interested stockholder for a period of three years after the date that such stockholder became an interested stockholder, subject to certain exceptions.
Choice of Forum
Our amended and restated certificate of incorporation to be effective on the completion of this offering will provide that the Court of Chancery of the State of Delaware be the exclusive forum for actions or proceedings brought under Delaware statutory or common law: (1) any derivative action or proceeding brought on our behalf; (2) any action asserting a breach of fiduciary duty; (3) any action asserting a claim against us arising under the Delaware General Corporation Law; (4) any action regarding our amended and restated certificate of incorporation or our amended and restated bylaws; (5) any action as to which the Delaware General Corporate Law confers jurisdiction to the Court of Chancery of the State of Delaware; or (6) any action asserting a claim against us that is governed by the internal affairs doctrine. The provisions would not apply to suits brought to enforce a duty or liability created by the Exchange Act. Our amended and restated certificate of incorporation further provides that the federal district courts of the United States of America will be the exclusive forum for resolving any complaint asserting a cause of action arising under the Securities Act, subject to and contingent upon a final adjudication in the State of Delaware of the enforceability of such exclusive forum provision.
Limitations of Liability and Indemnification
See the section titled “Executive Compensation—Limitations on Liability and Indemnification Matters.”
Exchange Listing
Our Class A common stock is currently not listed on any securities exchange. We intend to apply to have our Class A common stock approved for listing on the NYSE under the symbol “OLO.”
Transfer Agent and Registrar
On the completion of this offering, the transfer agent and registrar for our Class A common stock and Class B common stock will be Computershare Inc. The transfer agent’s address is 150 Royall Street, Canton, Massachusetts 02021.
168
Table of Contents
SHARES ELIGIBLE FOR FUTURE SALE
Prior to this offering, there has been no public market for our Class A common stock. Future sales of substantial amounts of our Class A common stock, including shares issued on the exercise of outstanding options, in the public market after this offering, or the possibility of these sales or issuances occurring, could adversely affect the prevailing market price for our Class A common stock or impair our ability to raise equity capital.
Based on our shares outstanding as of December 31, 2020, on the completion of this offering, a total of shares of Class A common stock and shares of Class B common stock will be outstanding, assuming the reclassification of all outstanding shares of our common stock into an equivalent number of shares of our Class B common stock, which will occur immediately prior to the completion of this offering, and the automatic conversion of all of our outstanding shares of redeemable convertible preferred stock into an aggregate of shares of Class B common stock. Of these shares, all of the Class A common stock sold in this offering by us, plus any shares sold by exercise of the underwriters’ option to purchase additional common stock, will be freely tradable in the public market without restriction or further registration under the Securities Act, unless these shares are held by “affiliates,” as that term is defined in Rule 144 under the Securities Act, or Rule 144.
The remaining shares of Class B common stock will be, and shares of Class B common stock subject to stock options will be on issuance, deemed “restricted securities,” as that term is defined in Rule 144. These restricted securities are eligible for public sale only if they are registered under the Securities Act or if they qualify for an exemption from registration under Rule 144 or Rule 701 under the Securities Act, or Rule 701, which are summarized below. Restricted securities may also be sold outside of the United States to non-U.S. persons in accordance with Rule 904 of Regulation S under the Securities Act, or Regulation S.
As a result of lock-up agreements described in this prospectus and subject to the provisions of Rule 144 and Rule 701 as discussed below, shares of our common stock sold in this offering or otherwise subject to lock-up agreements and market stand-off agreements will be available for sale in the public market as follows:
| ● | beginning on the date of this prospectus, all shares of our common stock sold in this offering will be immediately available for sale in the public market; |
| ● | beginning at the commencement of trading on the first trading day on which our common stock is traded on the NYSE and ending on the last day of the quarter following the most recent quarter for which quarterly or annual, as applicable, financial statements are included in this prospectus, shares of common stock (including shares issuable upon exercise of vested options) will be eligible for sale in the public market as set forth in the section titled “— Lock-Up Agreements”; |
| ● | beginning on the 175th day after the date of this prospectus, the remainder of the shares of our common stock will be eligible for sale in the public market from time to time thereafter. |
Rule 144
In general, under Rule 144 as currently in effect, once we have been subject to public company reporting requirements of Section 13 or Section 15(d) of the Exchange Act for at least 90 days, an eligible stockholder is entitled to sell such shares without complying with the manner of sale, volume limitation or notice provisions of Rule 144, subject to compliance with the public information requirements of Rule 144. To be an eligible stockholder under Rule 144, such stockholder must not be deemed to have been one of our affiliates for purposes of the Securities Act at any time during the 90 days preceding a sale and must have beneficially owned the shares proposed to be sold for at least six
169
Table of Contents
months, including the holding period of any prior owner other than our affiliates. If such a person has beneficially owned the shares proposed to be sold for at least one year, including the holding period of any prior owner other than our affiliates, then such person is entitled to sell such shares without complying with any of the requirements of Rule 144, subject to the expiration of the lock-up agreements described below.
In general, under Rule 144, as currently in effect, our affiliates or persons selling shares on behalf of our affiliates are entitled to sell shares on expiration of the lock-up agreements described below, subject, in the case of restricted securities, to such shares having been beneficially owned for at least six months. Beginning 90 days after the date of this prospectus, within any three-month period, such stockholders may sell a number of shares that does not exceed the greater of:
| ● | 1% of the number of Class A common stock then outstanding, which will equal approximately shares immediately after this offering, assuming no exercise of the underwriters’ option to purchase additional shares of Class A common stock; or |
| ● | the average weekly trading volume of our Class A common stock on during the four calendar weeks preceding the filing of a notice on Form 144 with respect to such sale. |
Sales under Rule 144 by our affiliates or persons selling shares on behalf of our affiliates are also subject to certain manner of sale provisions and notice requirements and to the availability of current public information about us.
Rule 701
Rule 701 generally allows a stockholder who was issued shares under a written compensatory plan or contract and who is not deemed to have been an affiliate of our company during the immediately preceding 90 days, to sell these shares in reliance on Rule 144, but without being required to comply with the public information, holding period, volume limitation or notice provisions of Rule 144. Rule 701 also permits affiliates of our company to sell their Rule 701 shares under Rule 144 without complying with the holding period requirements of Rule 144. All holders of Rule 701 shares, however, are required by that rule to wait until 90 days after the date of this prospectus before selling those shares under Rule 701, subject to the expiration of the lock-up agreements described below.
Form S-8 Registration Statements
We intend to file one or more registration statements on Form S-8 under the Securities Act with the SEC to register the offer and sale of shares of our Class A common stock and Class B common stock to be issued under our 2005 Plan, 2015 Plan, and 2021 Plan. These registration statements will become effective immediately on filing. Shares covered by these registration statements will then be eligible for sale in the public markets, subject to vesting restrictions, any applicable lock-up agreements described below, and Rule 144 limitations applicable to affiliates.
Lock-Up Arrangements
We, all of our directors, executive officers, and the holders of substantially all of our Class B common stock and securities exercisable for or convertible into our Class B common stock outstanding immediately on the completion of this offering, have agreed, or will agree, with the underwriters that, subject to certain exceptions, until 175 days after the date of this prospectus, we and they will not, without the prior written consent of Goldman Sachs & Co. LLC and J.P. Morgan Securities LLC, offer, sell, contract to sell, pledge, grant any option to purchase, lend make any short sale or otherwise dispose of any shares of common stock, or any options or warrants to purchase any shares of common
170
Table of Contents
stock, or any securities convertible into, exchangeable for or that represent the right to receive shares of common stock. However, up to 20% of the common stock (including common stock issuable upon exercise of vested options) held by employees and former employees (but excluding current executive officers and directors and certain members of management) may be sold beginning at the commencement of trading on the first trading day on which our common stock is listed on the NYSE and ending on the last day of the quarter following the most recent quarter for which quarterly or annual, as applicable, financial statements are included in this prospectus. The number of shares eligible for early release equals shares of common stock, including shares issuable upon exercise of vested options. These agreements are described in the section titled “Underwriting.” Goldman Sachs & Co. LLC and J.P. Morgan Securities LLC may, in their sole discretion, permit our stockholders who are subject to these lock-up agreements to sell shares prior to the expiration of the lock-up agreements, subject to applicable notice requirements.
In addition to the restrictions contained in the lock-up agreements described above, our standard form of option agreement and our standard form of RSU agreement contain market stand-off provisions imposing restrictions on the ability of such security holders to offer, sell or transfer our equity securities for a period of 180 days following the date of this prospectus.
Registration Rights
Upon the completion of this offering, the holders of 7,129,462 shares of our Class B common
stock will be entitled to certain rights with respect to the registration of the offer and sale of their shares under the Securities Act. Registration of these shares under the Securities Act would result in the shares becoming freely tradable without restriction under the Securities Act immediately on the effectiveness of the registration. See the section titled “Description of Capital Stock—Registration Rights” for additional information.
171
Table of Contents
MATERIAL U.S. FEDERAL INCOME TAX CONSEQUENCES TO NON-U.S. HOLDERS
OF OUR CLASS A COMMON STOCK
The following discussion is a summary of the material U.S. federal income tax consequences to Non-U.S. Holders (as defined below) of the purchase, ownership, and disposition of our Class A common stock issued pursuant to this offering, but does not purport to be a complete analysis of all potential tax effects. The effects of other U.S. federal tax laws, such as estate and gift tax laws, and any applicable state, local, or non-U.S. tax laws are not discussed. This discussion is based on the U.S. Internal Revenue Code of 1986, as amended, or the Code, Treasury Regulations promulgated thereunder, judicial decisions, and published rulings and administrative pronouncements of the U.S. Internal Revenue Service, or the IRS, in each case in effect as of the date hereof. These authorities may change or be subject to differing interpretations. Any such change or differing interpretation may be applied retroactively in a manner that could adversely affect a Non-U.S. Holder. We have not sought and will not seek any rulings from the IRS regarding the matters discussed below. There can be no assurance the IRS or a court will not take a contrary position to that discussed below regarding the tax consequences of the purchase, ownership, and disposition of our Class A common stock.
This discussion is limited to Non-U.S. Holders that hold our Class A common stock as a “capital asset” within the meaning of Section 1221 of the Code (generally, property held for investment). This discussion does not address all U.S. federal income tax consequences relevant to a Non-U.S. Holder’s particular circumstances, including the impact of the Medicare contribution tax on net investment income and the alternative minimum tax. In addition, it does not address consequences relevant to Non-U.S. Holders subject to special rules, including, without limitation:
| ● | U.S. expatriates and former citizens or long-term residents of the United States; |
| ● | persons holding our Class A common stock as part of a hedge, straddle or other risk reduction strategy or as part of a conversion transaction or other integrated investment; |
| ● | banks, insurance companies, and other financial institutions; |
| ● | brokers, dealers or traders in securities; |
| ● | “controlled foreign corporations,” “passive foreign investment companies” and corporations that accumulate earnings to avoid U.S. federal income tax; |
| ● | partnerships or other entities or arrangements treated as partnerships for U.S. federal income tax purposes (and investors therein); |
| ● | tax-exempt organizations or governmental organizations; |
| ● | persons deemed to sell our Class A common stock under the constructive sale provisions of the Code; |
| ● | tax-qualified retirement plans; |
| ● | persons that hold more than 5% of our outstanding Class A common stock, directly or indirectly during the applicable testing period; and |
| ● | “qualified foreign pension funds” as defined in Section 897(l)(2) of the Code and entities all of the interests of which are held by qualified foreign pension funds. |
172
Table of Contents
If an entity treated as a partnership for U.S. federal income tax purposes holds our Class A common stock, the tax treatment of a partner in the partnership will depend on the status of the partner, the activities of the partnership and certain determinations made at the partner level. Accordingly, partnerships holding our Class A common stock and the partners in such partnerships should consult their tax advisors regarding the U.S. federal income tax consequences to them.
THIS DISCUSSION IS NOT TAX ADVICE. INVESTORS SHOULD CONSULT THEIR TAX ADVISORS WITH RESPECT TO THE APPLICATION OF THE U.S. FEDERAL INCOME TAX LAWS TO THEIR PARTICULAR SITUATIONS AS WELL AS ANY TAX CONSEQUENCES OF THE PURCHASE, OWNERSHIP AND DISPOSITION OF OUR CLASS A COMMON STOCK ARISING UNDER THE U.S. FEDERAL ESTATE OR GIFT TAX LAWS OR UNDER THE LAWS OF ANY STATE, LOCAL, OR NON-U.S. TAXING JURISDICTION OR UNDER ANY APPLICABLE INCOME TAX TREATY.
Definition of Non-U.S. Holder
For purposes of this discussion, a “Non-U.S. Holder” is any beneficial owner of our Class A common stock that is neither a “U.S. person” nor an entity treated as a partnership for U.S. federal income tax purposes. A U.S. person is any person that, for U.S. federal income tax purposes, is or is treated as any of the following:
| ● | an individual who is a citizen or resident of the United States; |
| ● | a corporation created or organized under the laws of the United States, any state thereof, or the District of Columbia; |
| ● | an estate, the income of which is subject to U.S. federal income tax regardless of its source; or |
| ● | a trust that (1) is subject to the primary supervision of a U.S. court and all substantial decisions of which are subject to the control of one or more “United States persons” (within the meaning of Section 7701(a)(30) of the Code), or (2) has a valid election in effect to be treated as a United States person for U.S. federal income tax purposes. |
Distributions
As described in the section titled “Dividend Policy,” we do not anticipate paying any cash dividends on our capital stock in the foreseeable future. However, if we do make distributions of cash or property on our Class A common stock, such distributions will constitute dividends for U.S. federal income tax purposes to the extent paid from our current or accumulated earnings and profits, as determined under U.S. federal income tax principles. Amounts not treated as dividends for U.S. federal income tax purposes will constitute a return of capital and first be applied against and reduce a Non-U.S. Holder’s adjusted tax basis in its Class A common stock, but not below zero. Any excess will be treated as capital gain and will be treated as described below under “—Sale or Other Taxable Disposition.”
Subject to the discussion below on effectively connected income, dividends paid to a Non-U.S. Holder will be subject to U.S. federal withholding tax at a rate of 30% of the gross amount of the dividends (or such lower rate specified by an applicable income tax treaty, provided the Non-U.S. Holder furnishes a valid IRS Form W-8BEN or W-8BEN-E (or other applicable documentation) certifying qualification for the lower treaty rate).
173
Table of Contents
If dividends paid to a Non-U.S. Holder are effectively connected with the Non-U.S. Holder’s conduct of a trade or business within the United States (and, if required by an applicable income tax treaty, the Non-U.S. Holder maintains a permanent establishment in the United States to which such dividends are attributable), the Non-U.S. Holder will be exempt from the U.S. federal withholding tax described above. To claim the exemption, the Non-U.S. Holder must furnish to the applicable withholding agent a valid IRS Form W-8ECI, certifying that the dividends are effectively connected with the Non-U.S. Holder’s conduct of a trade or business within the United States. Any such effectively connected dividends will be subject to U.S. federal income tax on a net income basis at the regular rates. A Non-U.S. Holder that is a corporation also may be subject to a branch profits tax at a rate of 30% (or such lower rate specified by an applicable income tax treaty) on such effectively connected dividends, as adjusted for certain items. Non-U.S. Holders should consult their tax advisors regarding any applicable tax treaties that may provide for different rules.
A Non-U.S. Holder that does not timely furnish the required documentation, but that qualifies for a reduced treaty rate, may obtain a refund of any excess amounts withheld by timely filing an appropriate claim for refund with the IRS. Non-U.S. Holders should consult their tax advisors regarding their entitlement to benefits under any applicable tax treaties.
Sale or Other Taxable Disposition
Subject to the discussions below regarding backup withholding, a Non-U.S. Holder will not be subject to U.S. federal income tax on any gain realized upon the sale or other taxable disposition of our Class A common stock unless:
| ● | the gain is effectively connected with the Non-U.S. Holder’s conduct of a trade or business within the United States (and, if required by an applicable income tax treaty, the Non-U.S. Holder maintains a permanent establishment in the United States to which such gain is attributable); |
| ● | the Non-U.S. Holder is a nonresident alien individual present in the United States for a period or periods aggregating 183 days or more during the taxable year of the disposition and certain other requirements are met; or |
| ● | our Class A common stock constitutes a U.S. real property interest, or USRPI, by reason of our status as a U.S. real property holding corporation, or USRPHC, for U.S. federal income tax purposes. |
Gain described in the first bullet point above generally will be subject to U.S. federal income tax on a net income basis at the regular rates. A Non-U.S. Holder that is a corporation also may be subject to a branch profits tax at a rate of 30% (or such lower rate specified by an applicable income tax treaty) on such effectively connected gain, as adjusted for certain items.
Gain described in the second bullet point above will be subject to U.S. federal income tax at a rate of 30% (or such lower rate specified by an applicable income tax treaty), which may be offset by certain U.S. source capital losses of the Non-U.S. Holder (even though the individual is not considered a resident of the United States), provided the Non-U.S. Holder has timely filed U.S. federal income tax returns with respect to such losses.
With respect to the third bullet point above, we believe we currently are not, and do not anticipate becoming, a USRPHC. Because the determination of whether we are a USRPHC depends, however, on the fair market value of our USRPIs relative to the fair market value of our worldwide real property interests and other assets use or held for use in a trade or business, there can be no
174
Table of Contents
assurance we currently are not a USRPHC or will not become one in the future. Even if we are or were to become a USRPHC, gain arising from the sale or other taxable disposition by a Non-U.S. Holder will not be subject to U.S. federal income tax if our Class A common stock is “regularly traded,” as defined by applicable Treasury Regulations, on an established securities market, and such Non-U.S. Holder owned, actually and constructively, 5% or less of our Class A common stock throughout the shorter of the five-year period ending on the date of the sale or other taxable disposition or the Non-U.S. Holder’s holding period.
Non-U.S. Holders should consult their tax advisors regarding any applicable tax treaties that may provide for different rules.
Information Reporting and Backup Withholding
Payments of distributions on our Class A common stock will not be subject to backup withholding, provided the Non-U.S. Holder certifies its non-U.S. status, such as by furnishing a valid IRS Form W-8BEN, W-8BEN-E or W-8ECI, or otherwise establishes an exemption. However, information returns are required to be filed with the IRS in connection with any distributions on our Class A common stock paid to the Non-U.S. Holder, regardless of whether any tax was actually withheld. In addition, proceeds of the sale or other taxable disposition of our Class A common stock within the United States or conducted through certain U.S.-related brokers generally will not be subject to backup withholding or information reporting if the applicable withholding agent receives the certification described above or the Non-U.S. Holder otherwise establishes an exemption. Proceeds of a disposition of our Class A common stock conducted through a non-U.S. office of a non-U.S. broker that does not have certain enumerated relationships with the United States generally will not be subject to backup withholding or information reporting.
Copies of information returns that are filed with the IRS may also be made available under the provisions of an applicable treaty or agreement to the tax authorities of the country in which the Non-U.S. Holder resides or is established.
Backup withholding is not an additional tax. Any amounts withheld under the backup withholding rules may be allowed as a refund or a credit against a Non-U.S. Holder’s U.S. federal income tax liability, provided the required information is timely furnished to the IRS.
Additional Withholding Tax on Payments Made to Foreign Accounts
Withholding taxes may be imposed under Sections 1471 to 1474 of the Code (such Sections commonly referred to as the Foreign Account Tax Compliance Act, or FATCA) on certain types of payments made to non-U.S. financial institutions and certain other non-U.S. entities. Specifically, a 30% withholding tax may be imposed on dividends on, or (subject to the proposed Treasury Regulations discussed below) gross proceeds from the sale or other disposition of, our Class A common stock paid to a “foreign financial institution” or a “non-financial foreign entity” (each as defined in the Code), unless (1) the foreign financial institution undertakes certain diligence and reporting obligations, (2) the non-financial foreign entity either certifies it does not have any “substantial United States owners” (as defined in the Code) or furnishes identifying information regarding each substantial United States owner, or (3) the foreign financial institution or non-financial foreign entity otherwise qualifies for an exemption from these rules. If the payee is a foreign financial institution and is subject to the diligence and reporting requirements in (1) above, it must enter into an agreement with the U.S. Department of the Treasury requiring, among other things, that it undertake to identify accounts held by certain “specified United States persons” or “United States owned foreign entities” (each as defined in the Code), annually report certain information about such accounts, and withhold 30% on certain payments to non-compliant foreign financial institutions and certain other account holders. Foreign
175
Table of Contents
financial institutions located in jurisdictions that have an intergovernmental agreement with the United States governing FATCA may be subject to different rules.
Under the applicable Treasury Regulations and administrative guidance, withholding under FATCA generally applies to payments of dividends on our Class A common stock. While withholding under FATCA would have applied also to payments of gross proceeds from the sale or other disposition of stock on or after January 1, 2019, proposed Treasury Regulations eliminate FATCA withholding on payments of gross proceeds entirely. Taxpayers, including withholding agents, generally may rely on these proposed Treasury Regulations until final Treasury Regulations are issued.
Prospective investors should consult their tax advisors regarding the potential application of withholding under FATCA to their investment in our Class A common stock.
176
Table of Contents
We and the underwriters named below have entered into an underwriting agreement with respect to the shares being offered. Subject to certain conditions, each underwriter has severally agreed to purchase the number of shares of Class A common stock indicated in the following table. Goldman Sachs & Co. LLC and J.P. Morgan Securities LLC are the representatives of the underwriters.
| Underwriters |
Number of Shares | |||
| Goldman Sachs & Co. LLC |
||||
| J.P. Morgan Securities LLC |
||||
| RBC Capital Markets, LLC |
||||
| Piper Sandler & Co. |
||||
| Stifel, Nicolaus & Company, Incorporated |
||||
| Truist Securities, Inc. |
||||
| William Blair & Company, L.L.C. |
||||
|
|
|
|||
| Total |
||||
|
|
|
|||
The underwriters will be committed to take and pay for all of the shares of Class A common stock being offered, if any are taken, other than the shares of Class A common stock covered by the option described below unless and until this option is exercised.
The underwriters have an option to buy up to an additional shares of Class A common stock to cover sales by the underwriters of a greater number of shares than the total number set forth in the table above. They may exercise that option for 30 days. If any shares of Class A common stock are purchased pursuant to this option, the underwriters will severally purchase shares in approximately the same proportion as set forth in the table above.
The following tables show the per share and total underwriting discounts and commissions to be paid to the underwriters by us. Such amounts are shown assuming both no exercise and full exercise of the underwriters’ option to purchase additional shares of Class A common stock.
| No Exercise | Full Exercise | |||||||
| Per Share |
||||||||
| Total |
||||||||
Shares of Class A common stock sold by the underwriters to the public will initially be offered at the initial public offering price set forth on the cover of this prospectus. Any shares of Class A common stock sold by the underwriters to securities dealers may be sold at a discount of up to $ per share from the initial public offering price. After the initial offering of the shares of Class A common stock, the representatives may change the offering price and the other selling terms. The offering of the shares of Class A common stock by the underwriters is subject to receipt and acceptance and subject to the underwriters’ right to reject any order in whole or in part.
We, all of our directors, executive officers, and the holders of substantially all of our Class B common stock and securities exercisable for or convertible into our Class B common stock outstanding immediately on the completion of this offering, have agreed, or will agree, with the underwriters that, subject to certain exceptions, until 175 days after the date of this prospectus, we and they will not, without the prior written consent of the representatives, offer, sell, contract to sell, pledge, grant any option to purchase, lend make any short sale or otherwise dispose of any shares of common stock, or any options or warrants to purchase any shares of common stock, or any securities convertible into, exchangeable for or that represent the right to
177
Table of Contents
receive shares of common stock. However, up to 20% of the common stock (including common stock issuable upon exercise of vested options) held by employees and former employees (but excluding current executive officers and directors and certain members of management) may be sold beginning at the commencement of trading on the first trading day on which our common stock is listed on the NYSE and ending on the last day of the quarter following the most recent quarter for which quarterly or annual, as applicable, financial statements are included in this prospectus. See the section titled “Shares Eligible for Future Sale” for a discussion of certain transfer restrictions.
Prior to the offering, there has been no public market for the shares of Class A common stock. The initial public offering price will be negotiated among the representatives and us. Among the factors to be considered in determining the initial public offering price of the shares of Class A common stock, in addition to prevailing market conditions, will be our historical performance, estimates of our business potential and earnings prospects, an assessment of our management and the consideration of the above factors in relation to market valuation of companies in related businesses.
We intend to apply to have our Class A common stock approved for listing on the NYSE under the symbol “OLO.”
In connection with the offering, the underwriters may purchase and sell shares of our Class A common stock in the open market. These transactions may include short sales, stabilizing transactions and purchases to cover positions created by short sales. Short sales involve the sale by the underwriters of a greater number of shares than they are required to purchase in this offering, and a short position represents the amount of such sales that have not been covered by subsequent purchases. A “covered short position” is a short position that is not greater than the amount of additional shares for which the underwriters’ option described above may be exercised. The underwriters may cover any covered short position by either exercising their option to purchase additional shares or purchasing shares in the open market. In determining the source of shares to cover the covered short position, the underwriters will consider, among other things, the price of shares available for purchase in the open market as compared to the price at which they may purchase additional shares pursuant to the option described above. “Naked” short sales are any short sales that create a short position greater than the amount of additional shares for which the option described above may be exercised. The underwriters must cover any such naked short position by purchasing shares in the open market. A naked short position is more likely to be created if the underwriters are concerned that there may be downward pressure on the price of our Class A common stock in the open market after pricing that could adversely affect investors who purchase in this offering. Stabilizing transactions consist of various bids for or purchases of our Class A common stock made by the underwriters in the open market prior to the completion of this offering.
The underwriters may also impose a penalty bid. This occurs when a particular underwriter repays to the underwriters a portion of the underwriting discount received by it because the representatives have repurchased shares sold by or for the account of such underwriter in stabilizing or short covering transactions.
Purchases to cover a short position and stabilizing transactions, as well as other purchases by the underwriters for their own accounts, may have the effect of preventing or retarding a decline in the market price of our Class A common stock, and together with the imposition of the penalty bid, may stabilize, maintain or otherwise affect the market price of our Class A common stock. As a result, the price of our Class A common stock may be higher than the price that otherwise might exist in the open market. The underwriters are not required to engage in these activities and may end any of these activities at any time. These transactions may be effected on the NYSE, in the over-the-counter market or otherwise.
We estimate that our share of the total expenses of this offering, excluding underwriting discounts and commissions, will be approximately $ . We have agreed to reimburse the
178
Table of Contents
underwriters for expenses related to any applicable state securities filings and to the Financial Industry Regulatory Authority, Inc. incurred by them in connection with this offering.
We have agreed to indemnify the several underwriters against certain liabilities, including liabilities under the Securities Act of 1933, as amended.
The underwriters and their respective affiliates are full service financial institutions engaged in various activities, which may include sales and trading, commercial and investment banking, advisory, investment management, investment research, principal investment, hedging, market making, brokerage and other financial and non-financial activities and services. Certain of the underwriters and their respective affiliates have provided, and may in the future provide, a variety of these services to us and to persons and entities with relationships with us, for which they received or will receive customary fees and expenses.
In the ordinary course of their various business activities, the underwriters and their respective affiliates, officers, directors, and employees may purchase, sell or hold a broad array of investments and actively trade securities, derivatives, loans, commodities, currencies, credit default swaps and other financial instruments for their own account and for the accounts of their customers, and such investment and trading activities may involve or relate to assets, securities and/or instruments of the issuer (directly, as collateral securing other obligations or otherwise) and/or persons and entities with relationships with the issuer. The underwriters and their respective affiliates may also communicate independent investment recommendations, market color or trading ideas and/or publish or express independent research views in respect of such assets, securities or instruments and may at any time hold, or recommend to clients that they should acquire, long and/or short positions in such assets, securities and instruments.
Directed Share Program
At our request, the underwriters have reserved up to shares of Class A common stock, or % of the shares offered by this prospectus, for sale at the initial public offering price, to our directors, certain of our customers and partners, and the friends and family members of certain of our employees, directors, customers and partners.
Shares purchased through the directed share program will not be subject to a lock-up restriction, except in the case of shares purchased by any of our directors or officers and certain of our employees and existing equity holders. The number of shares of Class A common stock available for sale to the general public will be reduced to the extent these individuals purchase such reserved shares. Any reserved shares not so purchased will be offered by the underwriters to the general public as the same basis as the other shares of Class A common stock offered by this prospectus. The underwriters will receive the same discount from such reserved shares as they will from other shares of our Class A common stock sold to the public in this offering. We have agreed to indemnify the underwriters against certain liabilities and expenses, including liabilities under the Securities Act, in connection with sales of the reserved shares.
European Economic Area
In relation to each Member State of the European Economic Area (each a “Member State”), no shares of Class A common stock (the “Shares”) have been offered or will be offered pursuant to the offering to the public in that Member State prior to the publication of a prospectus in relation to the Shares which has been approved by the competent authority in that Member State or, where appropriate, approved in another Member State and notified to the competent authority in that Member State, all in accordance with the Prospectus Regulation), except that offers of Shares may be made to
179
Table of Contents
the public in that Member State at any time under the following exemptions under the Prospectus Regulation:
| (a) | to any legal entity which is a qualified investor as defined under the Prospectus Regulation; |
| (b) | to fewer than 150 natural or legal persons (other than qualified investors as defined under the Prospectus Regulation), subject to obtaining the prior consent of the representatives for any such offer ; or |
| (c) | in any other circumstances falling within Article 1(4) of the Prospectus Regulation, |
provided that no such offer of Shares shall require the company or any representatives to publish a prospectus pursuant to Article 3 of the Prospectus Regulation or supplement a prospectus pursuant to Article 23 of the Prospectus Regulation.
For the purposes of this provision, the expression an “offer to the public” in relation to any Shares in any Member State means the communication in any form and by any means of sufficient information on the terms of the offer and any Shares to be offered so as to enable an investor to decide to purchase or subscribe for any Shares, and the expression “Prospectus Regulation” means Regulation (EU) 2017/1129.
United Kingdom
Each Underwriter has represented and agreed that:
| (a) | it has only communicated or caused to be communicated and will only communicate or cause to be communicated an invitation or inducement to engage in investment activity (within the meaning of Section 21 of the Financial Services and Markets Act 2000 (FSMA)) received by it in connection with the issue or sale of the shares in circumstances in which Section 21(1) of the FSMA does not apply to the company; and |
| (b) | it has complied and will comply with all applicable provisions of the FSMA with respect to anything done by it in relation to the shares in, from or otherwise involving the United Kingdom. |
Canada
The securities may be sold in Canada only to purchasers purchasing, or deemed to be purchasing, as principal that are accredited investors, as defined in National Instrument 45-106 Prospectus Exemptions or subsection 73.3(1) of the Securities Act (Ontario), and are permitted clients, as defined in National Instrument 31-103 Registration Requirements, Exemptions, and Ongoing Registrant Obligations. Any resale of the securities must be made in accordance with an exemption form, or in a transaction not subject to, the prospectus requirements of applicable securities laws.
Securities legislation in certain provinces or territories of Canada may provide a purchaser with remedies for rescission or damages if this offering memorandum (including any amendment thereto) contains a misrepresentation, provided that the remedies for rescission or damages are exercised by the purchaser within the time limit prescribed by the securities legislation of the purchaser’s province or territory. The purchaser should refer to any applicable provisions of the securities legislation of the purchaser’s province or territory of these rights or consult with a legal advisor.
Pursuant to section 3A.3 of National Instrument 33-105 Underwriting Conflicts (NI 33-105), the underwriters are not required to comply with the disclosure requirements of NI 33-105 regarding underwriter conflicts of interest in connection with this offering.
180
Table of Contents
Hong Kong
The shares may not be offered or sold in Hong Kong by means of any document other than (i) in circumstances which do not constitute an offer to the public within the meaning of the Companies (Winding Up and Miscellaneous Provisions) Ordinance (Cap. 32 of the Laws of Hong Kong) (“Companies (Winding Up and Miscellaneous Provisions) Ordinance”) or which do not constitute an invitation to the public within the meaning of the Securities and Futures Ordinance (Cap. 571 of the Laws of Hong Kong) (“Securities and Futures Ordinance”), or (ii) to “professional investors” as defined in the Securities and Futures Ordinance and any rules made thereunder, or (iii) in other circumstances which do not result in the document being a “prospectus” as defined in the Companies (Winding Up and Miscellaneous Provisions) Ordinance, and no advertisement, invitation or document relating to the shares may be issued or may be in the possession of any person for the purpose of issue (in each case whether in Hong Kong or elsewhere), which is directed at, or the contents of which are likely to be accessed or read by, the public in Hong Kong (except if permitted to do so under the securities laws of Hong Kong) other than with respect to shares which are or are intended to be disposed of only to persons outside Hong Kong or only to “professional investors” in Hong Kong as defined in the Securities and Futures Ordinance and any rules made thereunder.
Singapore
This prospectus has not been registered as a prospectus with the Monetary Authority of Singapore. Accordingly, this prospectus and any other document or material in connection with the offer or sale, or invitation for subscription or purchase, of the shares may not be circulated or distributed, nor may the shares be offered or sold, or be made the subject of an invitation for subscription or purchase, whether directly or indirectly, to persons in Singapore other than (i) to an institutional investor (as defined under Section 4A of the Securities and Futures Act, Chapter 289 of Singapore (the “SFA”)) under Section 274 of the SFA, (ii) to a relevant person (as defined in Section 275(2) of the SFA) pursuant to Section 275(1) of the SFA, or any person pursuant to Section 275(1A) of the SFA, and in accordance with the conditions specified in Section 275 of the SFA or (iii) otherwise pursuant to, and in accordance with the conditions of, any other applicable provision of the SFA, in each case subject to conditions set forth in the SFA.
Where the shares are subscribed or purchased under Section 275 of the SFA by a relevant person which is a corporation (which is not an accredited investor (as defined in Section 4A of the SFA)) the sole business of which is to hold investments and the entire share capital of which is owned by one or more individuals, each of whom is an accredited investor, the securities (as defined in Section 239(1) of the SFA) of that corporation shall not be transferable for 6 months after that corporation has acquired the shares under Section 275 of the SFA except: (1) to an institutional investor under Section 274 of the SFA or to a relevant person (as defined in Section 275(2) of the SFA), (2) where such transfer arises from an offer in that corporation’s securities pursuant to Section 275(1A) of the SFA, (3) where no consideration is or will be given for the transfer, (4) where the transfer is by operation of law, (5) as specified in Section 276(7) of the SFA, or (6) as specified in Regulation 32 of the Securities and Futures (Offers of Investments) (Shares and Debentures) Regulations 2005 of Singapore (“Regulation 32”)
Where the shares are subscribed or purchased under Section 275 of the SFA by a relevant person which is a trust (where the trustee is not an accredited investor (as defined in Section 4A of the SFA)) whose sole purpose is to hold investments and each beneficiary of the trust is an accredited investor, the beneficiaries’ rights and interest (howsoever described) in that trust shall not be transferable for 6 months after that trust has acquired the shares under Section 275 of the SFA except: (1) to an institutional investor under Section 274 of the SFA or to a relevant person (as defined in Section 275(2) of the SFA), (2) where such transfer arises from an offer that is made on terms that such rights or interest are acquired at a consideration of not less than S$200,000 (or its equivalent in a foreign currency) for each transaction
181
Table of Contents
(whether such amount is to be paid for in cash or by exchange of securities or other assets), (3) where no consideration is or will be given for the transfer, (4) where the transfer is by operation of law, (5) as specified in Section 276(7) of the SFA, or (6) as specified in Regulation 32.
Japan
The securities have not been and will not be registered under the Financial Instruments and Exchange Act of Japan (Act No. 25 of 1948, as amended), or the FIEA. The securities may not be offered or sold, directly or indirectly, in Japan or to or for the benefit of any resident of Japan (including any person resident in Japan or any corporation or other entity organized under the laws of Japan) or to others for reoffering or resale, directly or indirectly, in Japan or to or for the benefit of any resident of Japan, except pursuant to an exemption from the registration requirements of the FIEA and otherwise in compliance with any relevant laws and regulations of Japan.
182
Table of Contents
The validity of the shares of Class A common stock being offered by this prospectus will be passed upon for us by Cooley LLP, New York, New York. Certain legal matters in connection with this offering will be passed upon for the underwriters by Goodwin Procter LLP, New York, New York.
The financial statements of Olo Inc. at December 31, 2019 and 2020, and for each of the three years in the period ended December 31, 2020 appearing in this prospectus and registration statement have been audited by Ernst & Young LLP, independent registered public accounting firm, as set forth in their report thereon appearing elsewhere herein, and are included in reliance upon such report given on the authority of such firm as experts in accounting and auditing.
WHERE YOU CAN FIND ADDITIONAL INFORMATION
We have filed with the SEC a registration statement on Form S-1 under the Securities Act with respect to the shares of Class A common stock offered by this prospectus. This prospectus, which constitutes a part of the registration statement, does not contain all the information set forth in the registration statement, some of which is contained in exhibits to the registration statement as permitted by the rules and regulations of the SEC. For further information with respect to us and our Class A common stock, we refer you to the registration statement, including the exhibits filed as a part of the registration statement. Statements contained in this prospectus concerning the contents of any contract or any other document are not necessarily complete. If a contract or document has been filed as an exhibit to the registration statement, please see the copy of the contract or document that has been filed. Each statement in this prospectus relating to a contract or document filed as an exhibit is qualified in all respects by the filed exhibit. The SEC maintains an internet website that contains reports and other information about issuers, like us, that file electronically with the SEC. The address of that website is www.sec.gov.
On the completion of this offering, we will be subject to the information reporting requirements of the Exchange Act, and we will file reports, proxy statements, and other information with the SEC. These reports, proxy statements and other information will be available at www.sec.gov.
We also maintain a website at www.olo.com. Information contained in, or accessible through, our website is not a part of this prospectus, and the inclusion of our website address in this prospectus is only as an inactive textual reference.
183
Table of Contents
OLO INC.
| Page | ||||
| Index to Audited Financial Statements |
||||
| F-2 | ||||
| F-3 | ||||
| F-4 | ||||
| Statements of Redeemable Convertible Preferred Stock and Stockholders’ Deficit |
F-5 | |||
| F-7 | ||||
| F-9 | ||||
Table of Contents
REPORT OF INDEPENDENT REGISTERED PUBLIC ACCOUNTING FIRM
To the Stockholders and Board of Directors of Olo Inc.
Opinion on the Financial Statements
We have audited the accompanying balance sheets of Olo Inc. (the Company) as of December 31, 2019 and 2020, the related statements of operations and comprehensive income (loss), redeemable convertible preferred stock and stockholders’ deficit, and cash flows for each of the three years in the period ended December 31, 2020, and the related notes (collectively referred to as the “financial statements”). In our opinion, the financial statements present fairly, in all material respects, the financial position of the Company at December 31, 2019 and 2020, and the results of its operations and its cash flows for each of the three years in the period ended December 31, 2020, in conformity with U.S. generally accepted accounting principles.
Basis for Opinion
These financial statements are the responsibility of the Company’s management. Our responsibility is to express an opinion on the Company’s financial statements based on our audits. We are a public accounting firm registered with the Public Company Accounting Oversight Board (United States) (PCAOB) and are required to be independent with respect to the Company in accordance with the U.S. federal securities laws and the applicable rules and regulations of the Securities and Exchange Commission and the PCAOB.
We conducted our audits in accordance with the standards of the PCAOB. Those standards require that we plan and perform the audit to obtain reasonable assurance about whether the financial statements are free of material misstatement, whether due to error or fraud. The Company is not required to have, nor were we engaged to perform, an audit of its internal control over financial reporting. As part of our audits we are required to obtain an understanding of internal control over financial reporting but not for the purpose of expressing an opinion on the effectiveness of the Company’s internal control over financial reporting. Accordingly, we express no such opinion.
Our audits included performing procedures to assess the risks of material misstatement of the financial statements, whether due to error or fraud, and performing procedures that respond to those risks. Such procedures included examining, on a test basis, evidence regarding the amounts and disclosures in the financial statements. Our audits also included evaluating the accounting principles used and significant estimates made by management, as well as evaluating the overall presentation of the financial statements. We believe that our audits provide a reasonable basis for our opinion.
/s/ Ernst & Young LLP
We have served as the Company’s auditor since 2019.
New York, NY
February 19, 2021
F-2
Table of Contents
OLO INC.
(in thousands, except share and per share amounts)
| December 31, | ||||||||
| 2019 | 2020 | |||||||
| ASSETS |
||||||||
| Current assets: |
||||||||
| Cash and cash equivalents |
$ | 10,935 | $ | 75,756 | ||||
| Accounts receivable, net |
14,730 | 45,641 | ||||||
| Contract assets |
479 | 356 | ||||||
| Deferred contract costs |
1,277 | 1,830 | ||||||
| Prepaid expenses and other current assets |
1,480 | 1,661 | ||||||
|
|
|
|
|
|||||
| Total current assets |
28,901 | 125,244 | ||||||
| Property and equipment, net |
1,531 | 2,241 | ||||||
| Contract assets, noncurrent |
250 | 503 | ||||||
| Deferred contract costs, noncurrent |
1,876 | 3,346 | ||||||
| Deferred offering costs |
290 | 2,792 | ||||||
| Security deposit |
298 | 298 | ||||||
|
|
|
|
|
|||||
| Total assets |
$ | 33,146 | $ | 134,424 | ||||
|
|
|
|
|
|||||
| LIABILITIES, REDEEMABLE CONVERTIBLE PREFERRED STOCK |
||||||||
| Current liabilities: |
||||||||
| Accounts payable |
$ | 6,201 | $ | 9,104 | ||||
| Accrued expenses and other current liabilities |
12,858 | 42,578 | ||||||
| Unearned revenue |
707 | 585 | ||||||
| Redeemable convertible preferred stock warrant liability |
7,021 | 19,735 | ||||||
|
|
|
|
|
|||||
| Total current liabilities |
26,787 | 72,002 | ||||||
| Unearned revenue, noncurrent |
759 | 435 | ||||||
| Line of credit |
3,500 | — | ||||||
| Deferred rent, noncurrent |
1,767 | 2,402 | ||||||
| Other liabilities, noncurrent |
— | 329 | ||||||
|
|
|
|
|
|||||
| Total liabilities |
32,813 | 75,168 | ||||||
| Commitment and Contingencies (Note 12) |
||||||||
| Redeemable convertible preferred stock, $0.001 par value, 3,153,784 and 3,559,360 shares authorized at December 31, 2019 and 2020; 2,904,228 and 3,468,397 shares issued and outstanding at December 31, 2019 and 2020, respectively |
61,901 | 111,737 | ||||||
| Stockholders’ deficit: |
||||||||
| Common stock, $0.001 par value; 9,950,000 shares authorized at December 31, 2019 and 2020; 1,085,360 and 1,312,958 shares issued and outstanding at December 31, 2019 and 2020, respectively |
1 | 1 | ||||||
| Additional paid-in capital |
10,795 | 16,819 | ||||||
| Accumulated deficit |
(72,364 | ) | (69,301 | ) | ||||
|
|
|
|
|
|||||
| Total stockholders’ deficit |
(61,568 | ) | (52,481 | ) | ||||
|
|
|
|
|
|||||
| Total liabilities, redeemable convertible preferred stock and stockholders’ deficit |
$ | 33,146 | $ | 134,424 | ||||
|
|
|
|
|
|||||
The accompanying notes are an integral part of these financial statements.
F-3
Table of Contents
OLO INC.
Statements of Operations and Comprehensive Income (Loss)
(in thousands, except share and per share amounts)
| Year Ended December 31, | ||||||||||||
| 2018 | 2019 | 2020 | ||||||||||
| Revenue: |
||||||||||||
| Platform |
$ | 28,319 | $ | 45,121 | $ | 92,764 | ||||||
| Professional services and other |
3,480 | 5,570 | 5,660 | |||||||||
|
|
|
|
|
|
|
|||||||
| Total revenue |
31,799 | 50,691 | 98,424 | |||||||||
| Cost of revenue: |
||||||||||||
| Platform |
8,722 | 11,920 | 14,334 | |||||||||
| Professional services and other |
2,095 | 3,666 | 4,334 | |||||||||
|
|
|
|
|
|
|
|||||||
| Total cost of revenue |
10,817 | 15,586 | 18,668 | |||||||||
|
|
|
|
|
|
|
|||||||
| Gross profit |
20,982 | 35,105 | 79,756 | |||||||||
| Operating expenses: |
||||||||||||
| Research and development |
17,123 | 21,687 | 32,907 | |||||||||
| General and administrative |
8,341 | 12,157 | 22,209 | |||||||||
| Sales and marketing |
4,299 | 6,351 | 8,545 | |||||||||
|
|
|
|
|
|
|
|||||||
| Total operating expenses |
29,763 | 40,195 | 63,661 | |||||||||
|
|
|
|
|
|
|
|||||||
| Income (loss) from operations |
(8,781 | ) | (5,090 | ) | 16,095 | |||||||
| Other income (expenses): |
||||||||||||
| Interest expense |
(173 | ) | (219 | ) | (157 | ) | ||||||
| Other income, net |
100 | 36 | 28 | |||||||||
| Change in fair value of warrant liability |
(2,681 | ) | (2,959 | ) | (12,714 | ) | ||||||
|
|
|
|
|
|
|
|||||||
| Total other expenses |
(2,754 | ) | (3,142 | ) | (12,843 | ) | ||||||
|
|
|
|
|
|
|
|||||||
| Income (loss) before income taxes |
(11,535 | ) | (8,232 | ) | 3,252 | |||||||
| Provision for income taxes |
17 | 26 | 189 | |||||||||
|
|
|
|
|
|
|
|||||||
| Net income (loss) and comprehensive income (loss) |
$ | (11,552 | ) | $ | (8,258 | ) | $ | 3,063 | ||||
|
|
|
|
|
|
|
|||||||
| Accretion of redeemable convertible preferred stock to redemption |
(136 | ) | (136 | ) | (70 | ) | ||||||
| Undeclared 8% non-cumulative dividend on participating securities |
— | — | (2,993 | ) | ||||||||
|
|
|
|
|
|
|
|||||||
| Net income (loss) attributable to common stockholders |
$ | (11,688 | ) | $ | (8,394 | ) | $ | — | ||||
|
|
|
|
|
|
|
|||||||
| Net income (loss) per share attributable to common stockholders: |
||||||||||||
| Basic |
$ | (16.62 | ) | $ | (8.18 | ) | $ | — | ||||
|
|
|
|
|
|
|
|||||||
| Diluted |
$ | (16.62 | ) | $ | (8.18 | ) | $ | — | ||||
|
|
|
|
|
|
|
|||||||
| Weighted-average common shares outstanding: |
||||||||||||
| Basic |
703,245 | 1,026,248 | 1,181,314 | |||||||||
|
|
|
|
|
|
|
|||||||
| Diluted |
703,245 | 1,026,248 | 1,181,314 | |||||||||
|
|
|
|
|
|
|
|||||||
The accompanying notes are an integral part of these financial statements.
F-4
Table of Contents
OLO INC.
Statements of Redeemable Convertible Preferred Stock and Stockholders’ Deficit
(in thousands, except share and per share amounts)
| Redeemable Convertible Preferred Stock |
Common Stock | Additional Paid in Capital |
Accumulated Deficit |
Total Stockholders’ Deficit |
||||||||||||||||||||||||||
| Shares | Amount | Shares | Amount | |||||||||||||||||||||||||||
| Balance at January 1, 2018 |
2,886,819 | $ | 61,269 | 694,247 | $ | 1 | $ | 240 | $ | (54,675 | ) | $ | (54,434 | ) | ||||||||||||||||
| Adoption of ASC 606 |
— | — | — | — | — | 2,121 | 2,121 | |||||||||||||||||||||||
| Issuance of common stock on exercise of stock options |
— | — | 260,367 | — | 804 | — | 804 | |||||||||||||||||||||||
| Issuance of redeemable convertible preferred stock on exercise of warrants |
13,685 | 162 | — | — | 528 | — | 528 | |||||||||||||||||||||||
| Accretion of redeemable convertible preferred stock to redemption value |
— | 136 | — | — | (136 | ) | — | (136 | ) | |||||||||||||||||||||
| Stock-based compensation |
— | — | — | — | 4,196 | — | 4,196 | |||||||||||||||||||||||
| Net loss |
— | — | — | — | — | (11,552 | ) | (11,552 | ) | |||||||||||||||||||||
|
|
|
|
|
|
|
|
|
|
|
|
|
|
|
|||||||||||||||||
| Balance at December 31, 2018 |
2,900,504 | $ | 61,567 | 954,614 | $ | 1 | $ | 5,632 | $ | (64,106 | ) | $ | (58,473 | ) | ||||||||||||||||
|
|
|
|
|
|
|
|
|
|
|
|
|
|
|
|||||||||||||||||
| Redeemable Convertible Preferred Stock |
Common Stock | Additional Paid in Capital |
Accumulated Deficit |
Total Stockholders’ Deficit |
||||||||||||||||||||||||||
| Shares | Amount | Shares | Amount | |||||||||||||||||||||||||||
| Balance as of December 31, 2018 |
2,900,504 | $ | 61,567 | 954,614 | $ | 1 | $ | 5,632 | $ | (64,106 | ) | $ | (58,473 | ) | ||||||||||||||||
| Issuance of common stock on exercise of stock options |
— | — | 125,746 | — | 442 | — | 442 | |||||||||||||||||||||||
| Issuance of redeemable convertible preferred stock on exercise of warrants |
3,724 | 198 | — | — | — | — | — | |||||||||||||||||||||||
| Issuance of common stock on exercise of warrants |
— | — | 5,000 | — | 14 | — | 14 | |||||||||||||||||||||||
| Accretion of redeemable convertible preferred stock to redemption value |
— | 136 | — | — | (136 | ) | — | (136 | ) | |||||||||||||||||||||
| Stock-based compensation |
— | — | — | — | 4,843 | — | 4,843 | |||||||||||||||||||||||
| Net loss |
— | — | — | — | — | (8,258 | ) | (8,258 | ) | |||||||||||||||||||||
|
|
|
|
|
|
|
|
|
|
|
|
|
|
|
|||||||||||||||||
| Balance at December 31, 2019 |
2,904,228 | $ | 61,901 | 1,085,360 | $ | 1 | $ | 10,795 | $ | (72,364 | ) | $ | (61,568 | ) | ||||||||||||||||
|
|
|
|
|
|
|
|
|
|
|
|
|
|
|
|||||||||||||||||
F-5
Table of Contents
OLO INC.
Statements of Redeemable Convertible Preferred Stock and Stockholders’ Deficit
(in thousands, except share and per share amounts)
| Redeemable Convertible Preferred Stock |
Common Stock | Additional Paid in Capital |
Accumulated Deficit |
Total Stockholders’ Deficit |
||||||||||||||||||||||||||
| Shares | Amount | Shares | Amount | |||||||||||||||||||||||||||
| Balance as of December 31, 2019 |
2,904,228 | $ | 61,901 | 1,085,360 | $ | 1 | $ | 10,795 | $ | (72,364 | ) | $ | (61,568 | ) | ||||||||||||||||
| Issuance of common stock on exercise of stock options |
— | — | 244,207 | — | 2,097 | — | 2,097 | |||||||||||||||||||||||
| Repurchase of common stock for withholding tax purposes |
— | — | (16,609 | ) | (1,421 | ) | — | (1,421 | ) | |||||||||||||||||||||
| Issuance of redeemable convertible preferred stock |
564,169 | 49,766 | — | — | — | — | ||||||||||||||||||||||||
| Accretion of redeemable convertible preferred stock to redemption value |
— | 70 | — | — | (70 | ) | — | (70 | ) | |||||||||||||||||||||
| Stock-based compensation |
— | — | — | — | 5,418 | — | 5,418 | |||||||||||||||||||||||
| Net income |
— | — | — | — | — | 3,063 | 3,063 | |||||||||||||||||||||||
|
|
|
|
|
|
|
|
|
|
|
|
|
|
|
|||||||||||||||||
| Balance at December 31, 2020 |
3,468,397 | $ | 111,737 | 1,312,958 | $ | 1 | $ | 16,819 | $ | (69,301 | ) | $ | (52,481 | ) | ||||||||||||||||
|
|
|
|
|
|
|
|
|
|
|
|
|
|
|
|||||||||||||||||
The accompanying notes are an integral part of these financial statements.
F-6
Table of Contents
OLO INC.
(in thousands)
| Year Ended December 31, | ||||||||||||
| 2018 | 2019 | 2020 | ||||||||||
| Operating activities |
||||||||||||
| Net income (loss) |
$ | (11,552 | ) | $ | (8,258 | ) | $ | 3,063 | ||||
| Adjustments to reconcile net income (loss) to net cash provided by (used in) operating activities: |
||||||||||||
| Depreciation and amortization |
171 | 364 | 673 | |||||||||
| Stock-based compensation |
4,196 | 4,826 | 5,380 | |||||||||
| Bad debt expense |
77 | 164 | 614 | |||||||||
| Change in fair value of warrants |
2,681 | 2,959 | 12,714 | |||||||||
| Loss on disposal of property and equipment |
— | 77 | — | |||||||||
| Changes in operating assets and liabilities: |
||||||||||||
| Accounts receivable |
(4,399 | ) | (7,230 | ) | (31,526 | ) | ||||||
| Contract assets |
97 | 487 | (130 | ) | ||||||||
| Prepaid expenses and other current assets |
(1,036 | ) | (263 | ) | (158 | ) | ||||||
| Deferred contract costs |
(778 | ) | (1,069 | ) | (2,023 | ) | ||||||
| Accounts payable |
2,354 | 3,439 | 2,701 | |||||||||
| Accrued expenses and other current liabilities |
3,642 | 5,572 | 29,294 | |||||||||
| Deferred rent |
35 | 1,475 | 612 | |||||||||
| Unearned revenue |
334 | (121 | ) | (446 | ) | |||||||
|
|
|
|
|
|
|
|||||||
| Net cash provided by (used in) operating activities |
(4,178 | ) | 2,422 | 20,768 | ||||||||
| Investing activities |
||||||||||||
| Purchase of property and equipment |
(195 | ) | (1,352 | ) | (1,273 | ) | ||||||
|
|
|
|
|
|
|
|||||||
| Net cash used in investing activities |
(195 | ) | (1,352 | ) | (1,273 | ) | ||||||
| Financing activities |
||||||||||||
| Proceeds from line of credit |
3,500 | — | 15,000 | |||||||||
| Repayment of line of credit |
— | — | (18,500 | ) | ||||||||
| Proceeds from exercise of warrants |
127 | 58 | — | |||||||||
| Payment of deferred offering costs |
— | (143 | ) | (2,154 | ) | |||||||
| Proceeds from exercise of stock options |
804 | 310 | 2,601 | |||||||||
| Surrender of common stock for withholding tax purposes |
— | — | (1,387 | ) | ||||||||
| Proceeds from issuance of preferred stock |
— | — | 50,000 | |||||||||
| Costs incurred from issuance of preferred stock |
— | — | (234 | ) | ||||||||
|
|
|
|
|
|
|
|||||||
| Net cash provided by financing activities |
4,431 | 225 | 45,326 | |||||||||
|
|
|
|
|
|
|
|||||||
| Net increase in cash and cash equivalents |
58 | 1,295 | 64,821 | |||||||||
| Cash and cash equivalents, beginning of year |
9,582 | 9,640 | 10,935 | |||||||||
|
|
|
|
|
|
|
|||||||
| Cash and cash equivalents, end of year |
$ | 9,640 | $ | 10,935 | $ | 75,756 | ||||||
F-7
Table of Contents
OLO INC.
Statements of Cash Flows
(in thousands)
| Supplemental disclosure of cash flow information |
||||||||||||
| Cash paid for income taxes |
$ | 22 | $ | 21 | $ | 42 | ||||||
|
|
|
|
|
|
|
|||||||
| Cash paid for interest |
173 | 214 | 157 | |||||||||
|
|
|
|
|
|
|
|||||||
| Cash received for early exercise of stock options |
— | — | 561 | |||||||||
|
|
|
|
|
|
|
|||||||
| Supplemental disclosure of non-cash investing and financing activities |
||||||||||||
| Exercise of warrants classified as liabilities |
$ | 563 | $ | 154 | $ | — | ||||||
|
|
|
|
|
|
|
|||||||
| Deferred offering costs |
— | 147 | 348 | |||||||||
|
|
|
|
|
|
|
|||||||
| Accretion of redeemable convertible preferred stock to redemption value |
(136 | ) | 136 | 70 | ||||||||
|
|
|
|
|
|
|
|||||||
| Employee receivables for options exercised |
— | 132 | 23 | |||||||||
|
|
|
|
|
|
|
|||||||
| Purchase of property and equipment |
— | 100 | 72 | |||||||||
|
|
|
|
|
|
|
|||||||
| Capitalization of stock-based compensation for internal-use software |
— | 17 | 38 | |||||||||
|
|
|
|
|
|
|
The accompanying notes are an integral part of these financial statements.
F-8
Table of Contents
OLO INC.
(amounts in thousands, except for share and per share amounts)
| 1. | Business |
Description of Business
Olo Inc. was formed on June 1, 2005 in Delaware and is headquartered in New York City. On January 14, 2020, the board of directors and stockholders approved our name change from Mobo Systems, Inc. to Olo Inc. Unless the context otherwise indicates or requires, references to “we,” “us,” “our” and “the Company” shall refer to Olo Inc.
We are a software platform company for the restaurant industry and are focused on enabling digital ordering, through the deployment of white label e-commerce websites and applications and tools for digital order management. Our platform also provides a delivery enablement module and a marketplace management module. Our platform combines digital ordering and delivery enablement to provide restaurants with a holistic view of their digital business and enable them to own and manage their relationships with their customers.
Emerging Growth Company Status
We are an emerging growth company, as defined in the Jumpstart Our Business Startups Act of 2012 (the “JOBS Act”). Under the JOBS Act, emerging growth companies can delay adopting new or revised accounting standards issued subsequent to the enactment of the JOBS Act, until such time as those standards apply to private companies.
We have elected to use this extended transition period for complying with new or revised accounting standards that have different effective dates for public and private companies until the earlier of the date that we (i) are no longer an emerging growth company or (ii) affirmatively and irrevocably opt out of the extended transition period provided in the JOBS Act. As a result, our financial statements may not be comparable to financial statements of issuers who are required to comply with the effective dates for new or revised accounting standards based on public company effective dates.
We will remain an emerging growth company until the earliest of (i) the last day of the first fiscal year (a) following the fifth anniversary of the completion of this offering, (b) in which our total annual gross revenue is at least $1.07 billion or (c) when we are deemed to be a large accelerated filer, which means the market value of our common stock that is held by non-affiliates exceeds $700.0 million as of the prior June 30th and (ii) the date on which we have issued more than $1.0 billion in non-convertible debt securities during the prior three-year period.
| 2. | Significant Accounting Policies |
Basis of Presentation
The financial statements and accompanying notes were prepared in accordance with accounting principles generally accepted in the United States (“U.S. GAAP”).
Use of Estimates
The preparation of financial statements in conformity with U.S. GAAP requires management to make estimates and assumptions that affect the reported amounts of assets and liabilities and the disclosure of contingent assets and liabilities as of the date of the financial statements and the reported amounts of revenues and expenses during the reporting period.
F-9
Table of Contents
OLO INC.
Notes to Financial Statements
(amounts in thousands, except for share and per share amounts)
We regularly assess these estimates, including but not limited to, allowance for doubtful accounts, stock-based compensation including the determination of the fair value of the our stock, fair value of warrant liabilities, realization of deferred tax assets, estimated life of our customers, estimated standalone selling price of our performance obligations and estimated transaction price for implementation services. We base these estimates on historical experience and on various other market-specific and relevant assumptions that we believe to be reasonable under the circumstances. Actual results could differ from these estimates and such differences could be material to the financial position and results of operations.
Reclassifications
Certain items in the prior years’ consolidated financial statements have been reclassified to conform to the current year presentation reflected in the consolidated financial statements.
Segment Information
An operating segment is defined as a component of an enterprise for which discrete financial information is evaluated regularly by the chief operating decision maker (“CODM”). We define the CODM as the Chief Executive Officer as his role is to make decisions about allocating resources and assessing performance. Our business operates in one operating segment as all of our offerings operate on a single platform and are deployed in an identical way, with our CODM evaluating our financial information, resources and performance of these resources on a consolidated basis. Since we operate in one operating segment, all required financial segment information can be found in the financial statements. During the years ended December 31, 2019 and 2020, we did not have assets located outside of the United States and international revenue recognized during the year was not material.
Concentrations of Business and Credit Risk
We are exposed to concentrations of credit risk primarily through our cash held by financial institutions. We primarily deposit our cash with one financial institution and the amount on deposit exceeds federally insured limits. As of December 31, 2019 and 2020, 12% and 11% of our accounts receivable were due from one customer, respectively. No customer accounted for 10% or more of our revenue for the year ended December 31, 2018. For the years ended December 31, 2019 and 2020, one customer accounted for 11% and 21% of our revenue, respectively.
Cash and Cash Equivalents
Cash and cash equivalents are stated at fair value. We consider all short-term, highly liquid investments, with an original maturity of three months or less, to be cash equivalents.
Accounts Receivable, Net
Trade accounts receivable are recorded at the invoiced amount and do not bear interest. Accounts receivable are presented net of an estimate for doubtful accounts based on a review of all outstanding amounts.
F-10
Table of Contents
OLO INC.
Notes to Financial Statements
(amounts in thousands, except for share and per share amounts)
We maintain an allowance for doubtful accounts based upon an analysis of past credit history, the age of each outstanding invoice, and the current financial condition of our customers, as well as the consideration of expected trends based upon characteristics of the accounts and general economic conditions. Account balances are written off against the allowance after all means of collection have been exhausted and the potential for recovery is considered remote. The following summarizes our allowance for doubtful accounts activity as of December 31, 2019 and 2020 (in thousands):
| Balance at December 31, 2018 |
$ | 60 | ||
| Additions |
164 | |||
| Deductions - write offs |
(64 | ) | ||
|
|
|
|||
| Balance at December 31, 2019 |
$ | 160 | ||
| Additions |
614 | |||
| Deductions - write offs |
(143 | ) | ||
|
|
|
|||
| Balance at December 31, 2020 |
$ | 631 | ||
|
|
|
Deferred Contract Costs
We capitalize the incremental costs of obtaining a revenue contract, including sales commissions for new and renewal revenue contracts, certain related incentives, and associated payroll tax and fringe benefit costs. Capitalized amounts are recoverable through future revenue streams under customer contracts.
We allocate costs capitalized for contracts to the related performance obligations and amortize these costs on a straight-line basis over the expected period of benefit of those performance obligations. We determined that commissions paid on renewals are commensurate with commissions paid on initial contracts. Accordingly, we amortize commissions on initial contracts over the contract period which is generally three years. We also amortize commissions on renewal contracts over the renewal contract period, which are generally between one to three years. Amounts expected to be recognized within one year of the balance sheets date are recorded as current deferred contract costs. The remaining portion is recorded as non-current contract costs in the balance sheets. Amortization of costs capitalized to obtain revenue contracts is included in sales and marketing expense in the accompanying statements of operations and comprehensive loss.
We periodically evaluate whether there have been any changes in our business, market conditions, or other events which would indicate that the amortization period should be changed, or if there are potential indicators of impairment. For the years ended December 31, 2018, 2019, and 2020, we have not identified any potential indicators of material impairment.
Deferred Offering Costs
Offering costs, consisting of legal, accounting, printer and filing fees related to the Company’s planned initial public offering (“IPO”), are deferred and will be offset against proceeds from the IPO upon the effectiveness of the offering. In the event the offering is terminated, all deferred offering costs will be expensed. Deferred offering costs capitalized as of December 31, 2019 and 2020 were $290 and $2,792, respectively.
F-11
Table of Contents
OLO INC.
Notes to Financial Statements
(amounts in thousands, except for share and per share amounts)
Property and Equipment, Net
Property and equipment, net is recorded at cost, and presented net of accumulated depreciation. Cost and the related accumulated depreciation are deducted from the accounts upon retirement. Significant additions or improvements extending the useful life of an asset are capitalized, while repairs and maintenance costs are expensed as incurred. Leasehold improvements are amortized on a straight-line basis over the shorter of the term of the lease, or the useful life of the assets. Depreciation is computed using the straight-line method over the estimated useful lives of the related assets.
Long-lived assets are reviewed for impairment whenever events or changes in circumstances indicate that the carrying amount of an asset or asset group may not be recoverable. If circumstances require a long-lived asset or asset group to be tested for possible impairment, we first compare undiscounted cash flows expected to be generated by that asset or asset group to its carrying value. If the carrying value of the long-lived asset or asset group is not recoverable on an undiscounted cash flow basis, an impairment is recognized to the extent that the carrying value exceeds its fair value. No impairment was required on long-lived assets for the years ended December 31, 2018, 2019, and 2020.
Internal-Use Software
We capitalize certain qualified costs incurred in connection with the development of internal-use software. We evaluate the costs incurred during the application development stage of internal use software to determine whether the costs meet the criteria for capitalization. Costs related to preliminary project activities and post implementation activities are expensed as incurred. As of December 31, 2019 and 2020 capitalized costs related to internal-use software of $779 and $1,653 are included within property and equipment, net on the balance sheet, and are amortized on a straight-line basis over the estimated useful life of the software within platform cost of revenues. Amortization expense recorded for the years ended December 31, 2018, 2019, and 2020 were $0, $108, and $316, respectively. Associated with the capitalized balances as of December 31, 2020, we expect our annual amortization expense for internal-use software to be $551 in 2021, $442 in 2022, and $236 in 2023.
Security Deposit
As of December 31, 2019 and 2020, we recognized a non-current asset related to a security deposit of $298 for an operating lease agreement, which expires in 2023. Additionally, we have a standby letter of credit (“LOC”) in the amount of $1,390 as of December 31, 2020. This LOC established with our financial institution is for a security deposit for a long-term property lease with our landlord.
Income Taxes
Deferred income taxes are recorded for the expected tax consequences of temporary differences between the tax basis of assets and liabilities for financial reporting purposes and amounts recognized for income tax purposes. We periodically review the recoverability of deferred tax assets recorded on the balance sheet and provide valuation allowances as deemed necessary to reduce such deferred tax assets to the amount that will, more likely than not, be realized.
F-12
Table of Contents
OLO INC.
Notes to Financial Statements
(amounts in thousands, except for share and per share amounts)
Significant judgment is required in determining any valuation allowance recorded against deferred tax assets. In assessing the need for a valuation allowance, we consider all available evidence for each jurisdiction including past operating results, estimates of future taxable income and the feasibility of ongoing tax planning strategies. In the event we change our determination as to the amount of deferred tax assets that can be realized, we will adjust our valuation allowance with a corresponding impact to income tax expense in the period in which such determination is made.
The amount of deferred tax provided is calculated using tax rates enacted at the balance sheet date. The impact of tax law changes is recognized in periods when the change is enacted.
A two-step approach is applied in the recognition and measurement of uncertain tax positions taken or expected to be taken in a tax return. The first step is to determine if the weight of available evidence indicates that it is more likely than not that the tax position will be sustained in an audit, including resolution of any related appeals or litigation processes. The second step is to measure the tax benefit as the largest amount that is more than 50% likely to be realized upon ultimate settlement.
Our policy is to recognize interest and penalty expenses associated with uncertain tax positions as a component of income tax expense. We are required to file tax returns in the U.S. federal jurisdiction and various states.
Fair Value of Financial Instruments and Fair Value Measurements
Fair value is the exchange price that would be received for an asset or paid to transfer a liability (an exit price) in the principal or most advantageous market for the asset or liability in an orderly transaction between market participants on the measurement date. We apply the following fair value hierarchy, which prioritizes the inputs used to measure fair value into three levels and bases the categorization within the hierarchy upon the lowest level of input that is available and significant to the fair value measurement:
Level 1 inputs: Based on unadjusted quoted prices in active markets for identical assets or liabilities.
Level 2 inputs: Based on observable inputs other than Level 1 prices such as quoted prices for similar assets or liabilities; quoted prices in markets with insufficient volume or infrequent transactions (less active markets); or model-derived valuations in which all significant inputs are observable or can be derived principally from or corroborated by observable market data for substantially the full term of the assets or liabilities.
Level 3 inputs: Based on unobservable inputs to the valuation methodology that are significant to the measurement of fair value of assets or liabilities, and typically reflect management’s estimates of assumptions that market participants would use in pricing the asset or liability.
F-13
Table of Contents
OLO INC.
Notes to Financial Statements
(amounts in thousands, except for share and per share amounts)
The following summarizes assets and liabilities as of December 31, 2019 and 2020 that are measured at fair value on a recurring basis, by level, within the fair value hierarchy (in thousands):
| December 31, 2019 | ||||||||||||
| Level 1 | Level 2 | Level 3 | ||||||||||
| Cash and cash equivalents: |
||||||||||||
| Money market funds |
$ | 6,577 | $ | — | $ | — | ||||||
| Redeemable convertible preferred stock warrant liability |
— | — | 7,021 | |||||||||
|
|
|
|
|
|
|
|||||||
| Total |
$ | 6,577 | $ | — | $ | 7,021 | ||||||
|
|
|
|
|
|
|
|||||||
| December 31, 2020 | ||||||||||||
| Level 1 | Level 2 | Level 3 | ||||||||||
| Cash and cash equivalents: |
||||||||||||
| Money market funds |
$ | 45,039 | $ | — | $ | — | ||||||
| Redeemable convertible preferred stock warrant liability |
— | — | 19,735 | |||||||||
|
|
|
|
|
|
|
|||||||
| Total |
$ | 45,039 | $ | — | $ | 19,735 | ||||||
|
|
|
|
|
|
|
|||||||
There were no transfers of financial instruments between Level 1, Level 2, and Level 3 during the periods presented.
The fair value measurement of the redeemable convertible preferred stock warrant liability is based on significant inputs not observed in the market and thus represents a Level 3 measurement. We estimated the fair value of the liability using the Option Pricing Method and Probability-Weighted Expected Return Method and the change in fair value was recognized as other expense in the accompanying statements of operations and comprehensive loss. See Note 10 for information on the Level 3 inputs used to estimate the fair value of this liability.
Accounts receivable, accounts payable and accrued expenses are stated at their carrying value, which approximates fair value due to the short time to the expected receipt or payment date. The recorded amount of the line of credit approximates fair value as it is based upon rates available for obligations of similar terms and maturities.
Accretion of Redeemable Convertible Preferred Stock
The carrying value of the redeemable convertible preferred stock is accreted to redemption value from the date of issuance to the earliest redemption date using the effective interest method. Increases to the carrying value of redeemable convertible preferred stock recognized in each period are charged to retained earnings, or in the absence of retained earnings, additional paid in capital.
Redeemable Convertible Preferred Stock Liability
We issued freestanding warrants to purchase our redeemable convertible preferred stock which are recognized as liabilities at fair value on the accompanying balance sheets since these
F-14
Table of Contents
OLO INC.
Notes to Financial Statements
(amounts in thousands, except for share and per share amounts)
warrants may obligate us to transfer assets to the warrant holders at a future date under certain circumstances. The warrants are subject to remeasurement to fair value at each balance sheet date, and any change in fair value is recognized in the statements of operations and comprehensive loss. We will continue to adjust the liability for changes in fair value until the earlier of the exercise or expiration of the warrants.
Revenue Recognition
We derive our revenue primarily from platform fees to access our software platform and professional services. Revenue is recognized when control of these services transfers to our customers in an amount that reflects the consideration we expect to be entitled to in exchange for those services.
We apply the principles in the standard using the following steps:
| • | Identify the contract(s) with a customer |
| • | Identify the performance obligations in the contract |
| • | Determine the transaction price |
| • | Allocate the transaction price to the performance obligations in the contract |
| • | Recognize revenue when (or as) we satisfy a performance obligation |
Sales taxes collected from customers and remitted to various governmental authorities are excluded from the measurement of the transaction price and presented on a net basis in our statements of operations. Any balance collected and not paid, is reflected as a liability on the balance sheets.
Platform Revenue
Platform revenue primarily consists of fees generated when we provide our customers access to one or more of our Ordering, Dispatch and Rails modules of our cloud application, with routine customer support.
Our subscription contracts are non-cancellable and typically begin with a minimum three-year term with automatic, annual renewal periods thereafter. The majority of platform services revenue is derived from subscription fees from our Ordering module, which provides digital ordering capabilities for end consumers to place food orders online from restaurants. The Ordering module is a stand-ready obligation to provide access to the platform that is satisfied over the contract term. Our contracts for the Ordering module provide for monthly fixed fees, monthly fixed fees for a specified quantity of orders processed on the platform, plus monthly overage fees. We generally bill customers on a monthly basis, in arrears. We allocate the variable consideration related to the monthly overages to the distinct month during which the related services were performed as those fees relate specifically to providing the Ordering module of the platform in the period and represents the consideration we are entitled to for the access to the platform. As a result, the fixed monthly fees and monthly overages are included in the transaction price and recognized as revenue in the period in which the fee was generated.
Our Dispatch module enables our restaurant customers to offer, manage, and expand delivery to its customers. Our customers for the Dispatch module are both the restaurants and delivery service providers (“DSPs”). The Dispatch module connects restaurants with DSPs to facilitate the ordering and
F-15
Table of Contents
OLO INC.
Notes to Financial Statements
(amounts in thousands, except for share and per share amounts)
delivery of orders to the restaurant’s customer. We typically collect a per transaction fee from both the restaurant and the DSP. Revenue is recognized when we have arranged for a DSP to deliver the order to the end consumer.
Our Rails module allows our customers to control and manage menu availability and pricing and location information while directly integrating orders from third-party channels. Our performance obligation is a stand-ready obligation to provide access to the Rails module that is satisfied over the contract term. We typically receive a fee from the third-party channel for each transaction processed. No minimum monthly amounts or overage fees are charged to third-party channel in these arrangements. Although we do not directly charge our Ordering customers for these transactions, the transactions count toward the specified quantity and overages activity used in determining our Ordering customers monthly Ordering revenue.
Professional Services and Other Revenue
Professional services and other revenue primarily consists of fees for platform implementation services. The implementation fees in our contracts are generally variable, consisting of either a fixed fee or a fixed monthly fee over the duration of the implementation project. For contracts with fixed monthly fees, we estimate this variable consideration using the expected value method whereby, at contract inception, we estimate how many months it will take to implement the platform into the customer environment, including time to onboard restaurant franchise locations. This estimate is multiplied by the fixed monthly professional services fee to determine the transaction price, which is recognized over time as the services are performed. The transaction price may be subject to constraint and is included only to the extent that it is probable that a significant reversal of the amount of cumulative revenues recognized will not occur in a future period. For arrangements where we charge monthly fees, any additional months required for implementation are billed at the same fixed monthly fee. Our customers benefit from our services as they are provided, and we use a cost-to-cost measure of progress to recognize revenue from our implementation services.
In certain contracts, we engage third parties to assist in providing professional services to our customers. We determined we are the principal in transferring these services to the customer and recognize revenue on a gross basis. We control the services being provided to our customer and are responsible for ensuring that the services are performed and are acceptable to our customer. That is, we are responsible for fulfillment of the promise in the contract with our customer, and we also have discretion in setting the price with our customer.
Contracts with Multiple Performance Obligations
Our contracts with customers may contain multiple performance obligations. We identify performance obligations in a contract with a customer based on the goods and services that will be transferred to the customer that are capable of being distinct and that are separately identifiable from other promises in the contract. If not considered distinct, the promised goods or services are combined with other goods or services and accounted for as a combined performance obligation. Identifying distinct performance obligations in a contract requires judgment. Our performance obligations primarily include access to our platform and its different modules and implementation services associated with the platform.
Implementation services that require us to perform significant customization and modification of our platform to interface with the customer’s environment are not distinct from the platform. Since
F-16
Table of Contents
OLO INC.
Notes to Financial Statements
(amounts in thousands, except for share and per share amounts)
our Ordering customers can renew their agreements without paying for implementation again upon renewal, we considered the discounted fees at renewal to provide a material right to the customer. That is, because the customer can renew the implemented service at a discount from the original transaction price, we considered the discount to be a material right since it provides the customer a significant discount to future services. Our obligation to provide future services at a discount is accounted for as a separate performance obligation. Accordingly, we recognize the fair value of the material right over the expected customer life, which commences when the implementation services are complete and the customer obtains access to the platform.
All other implementation services are generally distinct and accounted for as separate performance obligations. For contracts with multiple performance obligations, the transaction price is allocated to the separate performance obligations on a relative standalone selling price basis. We determine standalone selling price based on the price at which the distinct good or service is sold separately. If the standalone selling price is not observable through past transactions, we estimate the standalone selling price taking into account available information such as market conditions, internally approved pricing and cost-plus expected margin guidelines related to the performance obligations.
Contract Balances
The timing of revenue recognition may differ from the timing of invoicing to customers. We record a receivable when revenue is recognized upon invoicing and payment will become due solely due to the passage of time. We record a contract asset when revenue is recognized prior to invoicing or payment is contingent upon transfer of control of another separate performance obligation. We record unearned revenue when revenue is recognized subsequent to cash collection. Unearned revenue that will be recognized during the succeeding 12-month period is recorded as current, and the remaining unearned revenue is recorded as non-current. Contract assets that will be billed to the customer during the succeeding 12-month period is recorded as current and the remaining contract asset is recorded as non-current.
Payment terms and conditions vary by contract type, although terms generally include a requirement of payment within 30 days. We elected the practical expedient to not assess whether a significant financing component exists if the period between when we transfer a promised good or service to a customer and when the customer pays for that good or service is one year or less.
Cost of Revenue
Platform. Platform cost of revenue primarily consists of costs directly related to our platform services, including expenses for customer support and infrastructure personnel, including salaries, taxes, benefits, bonuses, and stock-based compensation, which we refer to as personnel costs, third-party software licenses, hosting, amortization of internal-use software, and data center related costs and allocated overhead costs associated with delivering these services.
Professional services and other. Professional services and other cost of revenue consists primarily of the personnel costs of our deployment team associated with delivering these services and overhead allocations.
F-17
Table of Contents
OLO INC.
Notes to Financial Statements
(amounts in thousands, except for share and per share amounts)
Research and Development Costs
Research and development expenses are expensed as incurred and primarily consist of engineering and product development personnel costs and allocated overhead costs. Research and development costs exclude capitalized software development costs as they are capitalized as a component of property and equipment, net and amortized to platform cost of revenue over the term of their useful life.
Sales and Marketing
Sales and marketing expenses primarily consist of sales, marketing and other personnel costs, commissions, general marketing and promotional activities, and allocated overhead costs. Sales commissions earned by our sales force are deferred and amortized on a straight-line basis over the expected benefit period.
We expense all advertising costs when incurred. We incurred advertising expenses of approximately $363, $427 and $606 during the years ended December 31, 2018, 2019, and 2020, respectively. Advertising expense is recorded as a component of sales and marketing expenses in the statements of operations and comprehensive loss.
General and Administrative
General and administrative expenses primarily consist of personnel costs and contractor fees for finance, legal, human resources, information technology, and other administrative functions. In addition, general and administrative expenses include insurance and travel-related expenses and allocated overhead.
Stock-Based Compensation
We measure compensation expense for all stock-based payment awards, including stock options granted to employees, directors, and nonemployees, based on the estimated fair value of the awards on the date of grant. Compensation expense is recognized ratably in earnings, generally over the period during which an employee is required to provide service. We adjust compensation expense based on actual forfeitures as necessary.
Time-Based Service Awards
Our stock options generally vest ratably over a four-year period and the fair value of our awards is estimated on the date of grant using a Black-Scholes option pricing model. Awards with graded vesting features are recognized over the requisite service period for the entire award. The determination of the grant date fair value of stock awards issued is affected by a number of variables and subjective assumptions, including (i) the fair value of the our common stock, (ii) the expected common stock price volatility over the expected life of the award, (iii) the expected term of the award, (iv) risk-free interest rates, (v) the exercise price, and (vi) the expected dividend yield of our common stock.
The fair value of our shares of common stock underlying the awards has historically been determined by the board of directors with input from management and contemporaneous third-party
F-18
Table of Contents
OLO INC.
Notes to Financial Statements
(amounts in thousands, except for share and per share amounts)
valuations, as there was no public market for our common stock. The board of directors determines the fair value of the common stock by considering a number of objective and subjective factors including: the valuation of comparable companies, our operating and financial performance, the lack of liquidity of common stock, transactions in our common stock, and general and industry specific economic outlook, amongst other factors.
We derive the volatility from the average historical stock volatilities of several peer public companies over a period equivalent to the expected term of the awards. We selected companies with comparable characteristics to us, including enterprise value, risk profiles, and position within the industry and with historical share price information sufficient to meet the expected term of the stock options. The historical volatility data has been computed using the daily closing prices for the selected companies.
For employee awards granted at-the-money, we estimate the expected term based on the simplified method, which is the mid-point between the vesting date and the end of the contractual term for each award since our historical share option exercise experience does not provide a reasonable basis upon which to estimate the expected term. For non-employee awards and employee awards granted out-of the-money, our best estimate of the expected term is the contractual term of the award. The risk-free interest rate is based on the United States Treasury yield curve in effect at the time of grant whose term is consistent with the expected life of the award.
Expected dividend yield is 0.0% as we have not paid and do not anticipate paying dividends on our common stock. Upon the exercise of a stock option award, shares of common stock are issued from authorized but unissued shares.
Performance-Based Awards
We also granted Stock Appreciation Rights (“SARs”) that vest only upon the satisfaction of performance-based conditions. The performance-based conditions are satisfied upon the occurrence of a qualifying event, defined as the earlier of (i) the closing of certain change in control transactions, or (ii) an IPO. We record stock-based compensation expense for performance-based equity awards when the performance-based conditions are considered probable to be satisfied. As of December 31, 2019 and 2020, we had not recognized stock-based compensation expense for awards with performance-based conditions since the qualifying events described above are not considered probable. In the period in which these qualifying events becomes probable, we will record stock-based compensation expense determined using the grant-date fair values.
For performance-based SARs, we determine the grant-date fair value utilizing the valuation model as described above for time-based awards.
Leases
We categorize leases at their inception as either operating or capital. In the ordinary course of business, we entered into a non-cancelable operating lease for office space. We recognize lease costs on a straight-line basis and treat lease incentives as a reduction of rent expense over the term of the agreement. The difference between cash rent payments and rent expense is recorded as a deferred rent liability, with the amount expected to be amortized within the next twelve months classified as a
F-19
Table of Contents
OLO INC.
Notes to Financial Statements
(amounts in thousands, except for share and per share amounts)
current liability. We subleased a portion of our office space and recognize rental income on a straight-line basis as an offset to rent expense within general and administrative costs. The difference between cash rent payments received and rental income is recorded within prepaid expenses and other current assets.
Net Income (Loss) Per Share Attributable to Common Shareholders
We compute net income (loss) per share using the two-class method required for participating securities. The two-class method requires income available to common stockholders for the period to be allocated between common stock and participating securities based upon their respective rights to receive dividends as if all income for the period had been distributed.
We consider our redeemable convertible preferred stock and common stock issued upon early exercise of stock options, subject to repurchase, to be participating securities because holders of such shares have non-forfeitable dividend rights in the event a cash dividend is declared on common stock.
The holders of the redeemable convertible preferred stock would be entitled to dividends in preference to common shareholders, at specified rates, if declared. Then any remaining earnings would be distributed to the holders of common stock, restricted common stock, common stock issued upon early exercise of stock options, and the holders of the redeemable convertible preferred stock on a pro-rata basis assuming conversion of all redeemable convertible preferred stock into common stock. These participating securities do not contractually require the holders of such shares to participate in the Company’s losses. As such, net losses for the periods presented were not allocated to the Company’s participating securities.
Basic net income (loss) per share attributable to common stockholders is calculated by dividing the net income (loss) attributable to common stockholders by the weighted-average number of shares of common stock outstanding for the period. The diluted net income (loss) per share is computed by giving effect to all potentially dilutive securities outstanding for the period using the treasury stock method or the if-converted method based on the nature of such securities. For periods in which we reported net losses, diluted net loss per common share attributable to common stockholders is the same as basic net loss per common share attributable to common stockholders, because potentially dilutive common shares are not assumed to have been issued if their effect is anti-dilutive.
Recently Adopted Accounting Pronouncements
In August 2018, the FASB issued ASU 2018-15, Customer’s Accounting for Implementation Costs Incurred in a Cloud Computing Arrangement that is a Service Contract, which aligns the requirements for capitalizing implementation costs incurred in a hosting arrangement that is a service contract with the requirements for capitalizing implementation costs incurred to develop or obtain internal-use software (and hosting arrangements that include an internal-use software license). We adopted this standard this standard effective January 1, 2020 using the prospective transition approach. The adoption of the new standard did not have a material impact on the consolidated financial statements.
In August 2018, the FASB issued ASU 2018-13, Disclosure Framework-Changes to the Disclosure Requirements for Fair Value Measurements, which amends FASB ASC Topic 820, Fair
F-20
Table of Contents
OLO INC.
Notes to Financial Statements
(amounts in thousands, except for share and per share amounts)
Value Measurements. This ASU eliminates, modifies and adds various disclosure requirements for fair value measurements. We adopted this standard effective January 1, 2020 using the prospective transition approach. The adoption of the new standard did not have a material impact on the consolidated financial statements.
Accounting Pronouncements Issued but Not Yet Adopted
In February 2016, the FASB issued ASU 2016-02, Leases (Topic 842) which requires lessees to recognize the following for all leases (with the exception of short-term leases) at the commencement date; (i) a lease liability, which is a lessee’s obligation to make lease payments arising from a lease, measured on a discounted basis; and (ii) a right-of-use asset, which is an asset that represents the lessee’s right to use, or control the use of, a specified asset for the lease term. Additional disclosures will be required to allow the user to assess the amount, timing and uncertainty of cash flows arising from leasing activities. A modified retrospective transition approach is required for leases existing at the time of adoption. On November 15, 2018, the FASB issued ASU 2019-10 which deferred the effective date of the standard to fiscal years beginning after December 15, 2020. In June 2020, the FASB issued ASU No. 2020-05, Revenue from Contracts with Customers (Topic 606) and Leases (Topic 842): Deferral of the Effective Date, which requires nonpublic companies to adopt the provisions of ASU 2016-02 for fiscal years beginning after December 15, 2021, and for interim periods within fiscal years beginning after December 15, 2022. We plan to adopt this standard as of the effective date for private companies using the modified retrospective approach for all leases entered into before the effective date. The impact of our adoption of Topic 842 to our financial statements will be to recognize the operating lease commitments as operating lease liabilities and right-of-use assets upon adoption, which will result in an increase in the assets and liabilities recorded on the balance sheet. We are continuing our assessment, which may identify additional impacts Topic 842 will have on our financial statements.
In June 2016, the FASB issued ASU No. 2016-13, Financial Instruments—Credit Losses (Topic 326): Measurement of Credit Losses on Financial Instruments, which requires an entity to utilize a new impairment model known as the current expected credit loss (“CECL”) model to estimate its lifetime “expected credit loss” and record an allowance that, when deducted from the amortized cost basis of the financial asset, presents the net amount expected to be collected on the financial asset. The CECL model is expected to result in more timely recognition of credit losses. This guidance also requires new disclosures for financial assets measured at amortized cost, loans and available-for-sale debt securities. This guidance will be effective for us beginning January 1, 2023. We have not yet determined the impact the revised guidance will have on our financial statements.
In December 2019, the FASB issued ASU 2019-12, Income Taxes (Topic 740): Simplifying the Accounting for Income Taxes, which simplifies the accounting for income taxes, eliminates certain exceptions within ASC Topic 740, “Income Taxes,” and clarifies certain aspects of the current guidance to promote consistency among reporting entities. Most amendments within the standard are required to be applied on a prospective basis, while certain amendments must be applied on a retrospective or modified retrospective basis. This guidance will be effective for nonpublic entity fiscal years beginning after December 15, 2021. We have not yet determined the impact the revised guidance will have on our financial statements.
F-21
Table of Contents
OLO INC.
Notes to Financial Statements
(amounts in thousands, except for share and per share amounts)
| 3. | Revenue Recognition |
We adopted Topic 606 using the modified retrospective method as of January 1, 2018. The cumulative effect of applying the new guidance to all contracts with customers that were not completed as of January 1, 2018, was recorded as an adjustment to accumulated deficit as of the adoption date.
As a result of applying the modified retrospective method to adopt the new revenue guidance, the following adjustments were made to accounts on the balance sheet as of January 1, 2018:
| Prior to Adoption |
Adjustments | Adjusted January 1, 2018 |
||||||||||
| Prepaid expenses |
$ | 459 | $ | (410 | ) | $ | 49 | |||||
| Contract assets, current |
— | 738 | 738 | |||||||||
| Contract assets, noncurrent |
— | 575 | 575 | |||||||||
| Deferred contract costs |
— | 716 | 716 | |||||||||
| Deferred contract costs, noncurrent |
— | 590 | 590 | |||||||||
|
|
|
|
|
|
|
|||||||
| Total assets |
$ | 14,161 | $ | 2,209 | $ | 16,370 | ||||||
|
|
|
|
|
|
|
|||||||
| Unearned revenue, current |
$ | 1,165 | $ | (219 | ) | $ | 946 | |||||
| Unearned revenue, noncurrent |
— | 307 | 307 | |||||||||
|
|
|
|
|
|
|
|||||||
| Total liabilities |
$ | 7,326 | $ | 88 | $ | 7,414 | ||||||
|
|
|
|
|
|
|
|||||||
| Accumulated deficit |
$ | (54,675 | ) | $ | 2,121 | $ | (52,554 | ) | ||||
|
|
|
|
|
|
|
|||||||
| Total stockholders’ deficit |
$ | (54,434 | ) | $ | 2,121 | $ | (52,313 | ) | ||||
|
|
|
|
|
|
|
|||||||
| Total liabilities, redeemable convertible preferred stock and stockholders’ deficit |
$ | 14,161 | $ | 2,209 | $ | 16,370 | ||||||
|
|
|
|
|
|
|
|||||||
Disaggregation of Revenue
The following table disaggregates revenue by type (in thousands):
| Year Ended December 31, 2018 | ||||||||||||
| Platform | Professional Services and Other |
Total | ||||||||||
| Timing of revenue recognition |
||||||||||||
| Transferred over time |
$ | 26,386 | $ | 3,480 | $ | 29,866 | ||||||
| Transferred at a point in time |
1,933 | — | 1,933 | |||||||||
|
|
|
|
|
|
|
|||||||
| Total revenue |
$ | 28,319 | $ | 3,480 | $ | 31,799 | ||||||
|
|
|
|
|
|
|
|||||||
| Year Ended December 31, 2019 | ||||||||||||
| Platform | Professional Services and Other |
Total | ||||||||||
| Timing of revenue recognition |
||||||||||||
| Transferred over time |
$ | 36,469 | $ | 5,570 | $ | 42,039 | ||||||
| Transferred at a point in time |
8,652 | — | 8,652 | |||||||||
|
|
|
|
|
|
|
|||||||
| Total revenue |
$ | 45,121 | $ | 5,570 | $ | 50,691 | ||||||
|
|
|
|
|
|
|
|||||||
F-22
Table of Contents
OLO INC.
Notes to Financial Statements
(amounts in thousands, except for share and per share amounts)
| Year Ended December 31, 2020 | ||||||||||||
| Platform | Professional Services and Other |
Total | ||||||||||
| Timing of revenue recognition |
||||||||||||
| Transferred over time |
$ | 52,601 | $ | 5,660 | $ | 58,261 | ||||||
| Transferred at a point in time |
40,163 | — | 40,163 | |||||||||
|
|
|
|
|
|
|
|||||||
| Total revenue |
$ | 92,764 | $ | 5,660 | $ | 98,424 | ||||||
|
|
|
|
|
|
|
|||||||
Contract Balances
Contract Asset
As described in Note 2, professional services revenue is generally recognized ratably over the implementation period, beginning on the commencement date of each contract. Platform revenue is recognized as the services are delivered. Under Topic 606, we record a contract asset when revenue recognized on a contract exceeds the billings and unearned revenue when the billings or payments on a contract exceed the revenue recognized. Our standard billing terms are monthly; however, the billings may not be consistent with the pattern of recognition, based on when services are performed. Contract assets were $729 and $859 as of December 31, 2019 and 2020, respectively.
Unearned Revenue
Unearned revenue primarily consists of billings or payments received in advance of revenue recognition from subscription services and is recognized as revenue when transfer of control to customers has occurred. During 2018, we recognized $946 of revenue related to contracts that were included in unearned revenue at January 1, 2018. During 2019, we recognized $637 of revenue related to contracts that were included in unearned revenue at January 1, 2019. During 2020, we recognized $826 of revenue related to contracts there were included in unearned revenue at December 31, 2019.
As of December 31, 2020, our remaining performance obligations were $38,206, approximately 38% of which we expect to recognize as revenues over the next twelve months and substantially all of the remaining revenues will be recognized thereafter over the next 24 to 48 months. These amounts only include contracts subject to a guaranteed fixed amount or the guaranteed minimum under variable contracts. Unrecognized revenues under contract disclosed above do not include (1) contracts with an original expected term of one year or less; (2) contracts for which variable consideration is determined based on the customer’s subsequent sale or usage, and (3) agreements for which our right to invoice corresponds with the value provided to the customer.
F-23
Table of Contents
OLO INC.
Notes to Financial Statements
(amounts in thousands, except for share and per share amounts)
Deferred Contract Costs
The following table summarizes the activity of deferred contract costs (current and non-current) (in thousands):
| Balance at December 31, 2018 |
$ | 2,084 | ||
| Capitalization of deferred contract costs |
2,163 | |||
| Amortization of deferred contract costs |
(1,094 | ) | ||
|
|
|
|||
| Balance at December 31, 2019 |
$ | 3,153 | ||
| Capitalization of deferred contract costs |
3,750 | |||
| Amortization of deferred contract costs |
(1,727 | ) | ||
|
|
|
|||
| Balance at December 31, 2020 |
$ | 5,176 | ||
|
|
|
| 4. | Property and Equipment, Net |
Property and equipment, net consists of the following (in thousands):
| Estimated Useful Life (in Years) |
December 31, | |||||||||||
| 2019 | 2020 | |||||||||||
| Computer and office equipment |
3-5 | $ | 865 | $ | 1,375 | |||||||
| Capitalized software |
3 | 779 | 1,653 | |||||||||
| Furniture and fixtures |
10 | 386 | 386 | |||||||||
| Leasehold improvements |
|
Shorter of estimated useful life or remaining term of lease |
|
375 | 374 | |||||||
|
|
|
|
|
|||||||||
| Total property and equipment |
2,405 | 3,788 | ||||||||||
| Less: accumulated depreciation and amortization |
(874 | ) | (1,547 | ) | ||||||||
|
|
|
|
|
|||||||||
| Total property and equipment, net |
$ | 1,531 | $ | 2,241 | ||||||||
|
|
|
|
|
|||||||||
Depreciation and amortization expense was $171, $364 and $673 for the years ended December 31, 2018, 2019 and 2020, respectively. In connection with subleasing a portion of our office space, we recorded a $77 loss on disposal within other income, net, for furniture and fixtures sold to the sub-tenant for the year ended December 31, 2019.
| 5. | Prepaid Expenses and Other Current Assets |
Prepaid expenses and other current assets consist of the following (in thousands):
| December 31, | ||||||||
| 2019 | 2020 | |||||||
| Prepaid software licensing fees |
$ | 892 | $ | 855 | ||||
| Other |
588 | 806 | ||||||
|
|
|
|
|
|||||
| $ | 1,480 | $ | 1,661 | |||||
|
|
|
|
|
|||||
F-24
Table of Contents
OLO INC.
Notes to Financial Statements
(amounts in thousands, except for share and per share amounts)
| 6. | Accrued Expenses and Other Current Liabilities |
Accrued expenses and other current liabilities consist of the following (in thousands):
| December 31, | ||||||||
| 2019 | 2020 | |||||||
| Accrued payroll expenses |
$ | 1,800 | $ | 5,168 | ||||
| Accrued delivery service partner fees |
8,633 | 34,067 | ||||||
| Accrued licensing fees |
748 | 237 | ||||||
| Professional and consulting fees |
935 | 909 | ||||||
| Other |
742 | 2,197 | ||||||
|
|
|
|
|
|||||
| $ | 12,858 | $ | 42,578 | |||||
|
|
|
|
|
|||||
| 7. | Line of Credit |
In May 2012, we entered into a Loan and Security Agreement with Square 1 Bank (the “Square 1 Loan Agreement”) for a revolving line of credit with a maturity date of May 15, 2013. Since the original agreement, we have executed subsequent amendments to extend the maturity date until February 2022. On December 1, 2018, we amended the Loan Agreement (the “Amended Loan and Security Agreement”) for the revolving line of credit providing us the ability to borrow up to $15,000 under the Formula Revolving Line, of which $10,000 became available immediately and an additional $5,000 was to become available if we achieved recurring revenue during a three consecutive month period of at least $3,000 prior to September 30, 2019. Advances under the Formula Revolving Line bear interest equal to the greater of (A) 0.75% above the Prime Rate then in effect; or (B) 5.00%. The effective rate of interest as of December 31, 2019 and 2020 was 5.50% and 5.00%, respectively.
The Amended Agreement contains various affirmative and negative covenants and we were in compliance with these covenants as of December 31, 2019 and 2020. As of December 31, 2019 we had $3,500 of outstanding borrowings under the line of credit. As of December 31, 2020 we had no outstanding borrowings under the line of credit.
Interest expense related to the line of credit was $173, $219 and $157 for the years ended December 31, 2018, 2019 and 2020, respectively. Deferred issuance costs were immaterial for the Square 1 Loan Agreement and the Amended Loan and Security Agreement and were expensed as incurred.
On February 11, 2020, we amended the Loan and Security Agreement with Pacific Western Bank (successor in interest by merger to Square 1 Bank), allowing us to borrow up to $35,000, of which $25,000 was available. We currently have $23,600 available under the revolving line of credit, since $1,390 is used towards a letter of credit on the lease of our headquarters.
An additional $10,000 became available under the credit facility upon our achievement of revenue of at least $75,000 in the year ended December 31, 2020. The amount available to us at any time is the lesser of (A) $25,000 (or $35,000 if revenue targets are achieved) or (B) five times our previous month’s recurring revenue (the “Formula Line”. We can also borrow up to $5,000 under a non-formula revolving line (the “Non-Formula Line”) with aggregate borrowings under the Formula and Non-Formula Line not to exceed $25,000 (or $35,000 if revenue targets are achieved). Advances
F-25
Table of Contents
OLO INC.
Notes to Financial Statements
(amounts in thousands, except for share and per share amounts)
under the Formula Line bear interest equal to the greater of (A) 0.20% above Pacific Western Bank’s prime rate then in effect; or (B) 4.50%. Advances under the Non-Formula Line bear interest equal to the greater of (A) 0.75% above Pacific Western Bank’s prime rate then in effect; or (B) 5.00%. Interest is due and payable monthly in arrears. We may prepay advances under the credit facility in whole or in part at any time without premium or penalty, and the credit facility matures on February 11, 2022. In March 2020, we borrowed an additional $15,000 under the Amended Loan and Security Agreement, and the entire outstanding balance of $18,500 was repaid in April 2020. Our obligations under the Amended Loan and Security Agreement are secured by substantially all of our assets.
The credit facility contains customary affirmative and negative covenants, including covenants that require Pacific Western Bank’s consent to, among other things, merge or consolidate or acquire assets outside the ordinary course of business, make investments, incur additional indebtedness or guarantee indebtedness of others, pay dividends and redeem and repurchase our capital stock, enter into transactions with affiliates outside the ordinary course of business and create liens on our assets. We are also required to comply with certain minimum EBITDA and minimum revenue covenants.
The credit facility also contains events of default that if not cured or waived, could result in the acceleration of the obligations under the credit facility, an increase in the applicable interest rate under the credit facility to a per annum rate equal to 5.00% above the applicable interest rate and would permit Pacific Western Bank to exercise remedies with respect to all of the collateral that is securing the credit facility.
Pacific Western Bank has the right to terminate its obligation to make further advances to us immediately and without notice upon the occurrence and during the continuance of an event of default. We may terminate the Formula Line or the Non-Formula Line at any time prior to the maturity date, upon two business days written notice to Pacific Western Bank, at which time all then outstanding obligations arising under the Amended Loan and Security Agreement, including any unpaid interest thereon, will accelerate and become immediately due and payable.
| 8. | Stockholders’ Deficit |
Common Stock
At December 31, 2020, our authorized capital stock consisted of 9,950,000 shares of common stock, par value $0.001.
Common stock reserved for future issuance consisted of the following (in thousands):
| December 31, | ||||||||||||
| 2018 | 2019 | 2020 | ||||||||||
| Redeemable convertible preferred stock |
5,227,103 | 5,230,827 | 5,794,996 | |||||||||
| Redeemable convertible preferred stock warrants |
102,715 | 98,991 | 98,991 | |||||||||
| Common stock warrants |
5,000 | — | — | |||||||||
| Shares available for grant under stock option plan |
63,998 | 10,647 | 99,291 | |||||||||
| Options issued and outstanding under stock option plan |
2,156,800 | 2,230,396 | 2,400,467 | |||||||||
|
|
|
|
|
|
|
|||||||
| Total common stock reserved for future issuance |
7,555,616 | 7,570,861 | 8,393,745 | |||||||||
|
|
|
|
|
|
|
|||||||
F-26
Table of Contents
OLO INC.
Notes to Financial Statements
(amounts in thousands, except for share and per share amounts)
Secondary Transactions
During the year ended December 31, 2018, we facilitated a transaction whereby a third-party investor purchased 337,800 shares of our common stock from our employees (the “Secondary Transaction”). The offer was extended to employees as of November 26, 2018 (“Offer Date”) with at least two years of continuous service to the Company as of October 31, 2018 (“Record Date”). Executive officers or employees with at least four years of service as of the Record Date had the rights to sell 15% of their shares of common stock, options and stock appreciation rights as of the Record Date. Non-executive officers who have been with the Company less than four years had the rights to sell 15% of their shares of common stock and options. In connection with this transaction, the excess purchase price paid over the fair value of the shares of $2,831 was recognized as stock-based compensation. The expense is included in the category of operating expense as the employees’ other compensation.
In April 2019, we facilitated the exercise and immediate sale of 43,496 common options held by a former employee for $46.62 per share. In connection with the sale, we recorded stock-based compensation expense of $2,266, which represents the difference between the price paid and the exercise price of the shares sold. The expense is included in General and administrative expense in the statements of operations and comprehensive income (loss).
In July 2020, we facilitated a transaction whereby a third-party investor and existing investors purchased 223,090 shares of our common stock and vested options directly from current employees, non-employees, and an existing investor at a price per share of $79.76. Employees were eligible to sell up to between 10% and 15% of their common stock and options. Non-employees and the investor were eligible to sell all of their common stock and options, as applicable. We concluded that this transaction was not compensatory since it was offered to both employees and non-employees proportionally and the price per share paid represented fair value of the Company’s common stock on the repurchase date. We did not sell any shares or receive any proceeds from this transaction. Since certain buyers in the transaction were current investors, we determined that the transaction was a related party transaction.
F-27
Table of Contents
OLO INC.
Notes to Financial Statements
(amounts in thousands, except for share and per share amounts)
Redeemable Convertible Preferred Stock
As of December 31, 2018, 2019 and 2020, redeemable convertible preferred stock, authorized, issued, outstanding and liquidation values are as follows (in thousands, except share and per share amounts):
| December 31, 2018 | ||||||||||||||||||||
| Shares Authorized |
Shares Issued and Outstanding |
Net Carrying Value |
Redemption Price/ Liquidation Preference |
Redemption Value/ Liquidation Preference |
||||||||||||||||
| Series A |
53,510 | 40,955 | $ | 957 | $ | 23.36 | $ | 957 | ||||||||||||
| Series A-1 |
250,869 | 217,556 | 6,092 | 28.00 | 6,092 | |||||||||||||||
| Series B |
482,000 | 477,720 | 5,656 | 11.84 | 5,656 | |||||||||||||||
| Series C |
939,414 | 742,362 | 8,711 | 11.84 | 8,789 | |||||||||||||||
| Series D |
1,421,912 | 1,421,911 | 40,151 | 28.38 | 40,350 | |||||||||||||||
|
|
|
|
|
|
|
|
|
|||||||||||||
| Total |
3,147,705 | 2,900,504 | $ | 61,567 | $ | 61,844 | ||||||||||||||
|
|
|
|
|
|
|
|
|
|||||||||||||
| December 31, 2019 | ||||||||||||||||||||
| Shares Authorized |
Shares Issued and Outstanding |
Net Carrying Value |
Redemption Price/ Liquidation Preference |
Redemption Value/ Liquidation Preference |
||||||||||||||||
| Series A |
53,510 | 40,955 | $ | 957 | $ | 23.36 | $ | 957 | ||||||||||||
| Series A-1 |
250,869 | 217,556 | 6,092 | 28.00 | 6,092 | |||||||||||||||
| Series B |
482,000 | 481,444 | 5,854 | 11.84 | 5,700 | |||||||||||||||
| Series C |
939,414 | 742,362 | 8,749 | 11.84 | 8,789 | |||||||||||||||
| Series D |
1,427,991 | 1,421,911 | 40,249 | $ | 28.38 | 40,350 | ||||||||||||||
|
|
|
|
|
|
|
|
|
|||||||||||||
| Total |
3,153,784 | 2,904,228 | $ | 61,901 | $ | 61,888 | ||||||||||||||
|
|
|
|
|
|
|
|
|
|||||||||||||
| December 31, 2020 | ||||||||||||||||||||
| Shares Authorized |
Shares Issued and Outstanding |
Net Carrying Value |
Redemption Price/ Liquidation Preference |
Redemption Value/ Liquidation Preference |
||||||||||||||||
| Series A |
40,955 | 40,955 | $ | 957 | $ | 23.36 | $ | 957 | ||||||||||||
| Series A-1 |
218,448 | 217,556 | 6,092 | 28.00 | 6,092 | |||||||||||||||
| Series B |
481,444 | 481,444 | 5,854 | 11.84 | 5,700 | |||||||||||||||
| Series C |
832,433 | 742,362 | 8,760 | 11.84 | 8,789 | |||||||||||||||
| Series D |
1,421,911 | 1,421,911 | 40,276 | 28.38 | 40,350 | |||||||||||||||
| Series E |
564,169 | 564,169 | 49,798 | $ | 88.63 | 50,000 | ||||||||||||||
|
|
|
|
|
|
|
|
|
|||||||||||||
| Total |
3,559,360 | 3,468,397 | $ | 111,737 | $ | 111,888 | ||||||||||||||
|
|
|
|
|
|
|
|
|
|||||||||||||
The following are the relevant terms related to each series of redeemable convertible preferred stock issued:
Dividends
Dividends are payable to preferred shareholders prior to payment of any dividend to holders of common stock. Dividends are payable when and if declared by the board of directors out of funds
F-28
Table of Contents
OLO INC.
Notes to Financial Statements
(amounts in thousands, except for share and per share amounts)
legally available, and such dividends are not cumulative. The dividend rates on each series of preferred stock is 8% per annum of the original issue price per series of preferred stock. In the event our board of directors declares a dividend payable on the common stock, the holders of the preferred stock would be entitled to receive the amount of dividends per share of preferred stock that would be payable on the number of whole shares of the common stock into which each share of such preferred stock held by each holder could be converted into. No dividends have been declared as of December 31, 2020.
Liquidation
Upon liquidation, dissolution, or winding up of the Company or a deemed liquidation event as defined in the Company’s Amended and Restated Certificate of Incorporation, the stock holders preferred stock will receive in preference to the common stockholders, an amount per share equal to the greater of (1) the liquidation preference, plus all dividends declared but unpaid on such shares, or (2) the amount the holders would receive on an as-converted into common stock basis. The full preferential amount is first paid to the holders of the series of convertible stock that was most recently issued then to the stockholders of the next level of preference in order Series E preferred stock, Series D preferred stock, Series C preferred stock, Series B preferred stock and Series
A-1 preferred stock (ranked pari passu), and Series A preferred stock, which are listed in order of highest liquidation preference to lowest). If the available funds and assets become insufficient to satisfy the full preferential payment to the stockholders of a particular series of preferred stock in order, then all of the available funds and assets shall be distributed among the holders of that series of preferred stock pro rata based on the amounts to which such holders would otherwise be entitled. After payment of the liquidation preference to the holders of preferred stock, the remaining assets of the Company are available for distribution to the holders of common stock on a pro rata basis. These liquidation features cause the preferred stock to be classified as mezzanine equity rather than as a component of stockholders’ deficit.
Conversion Rights
Each share of preferred stock is convertible at any time, at the option of the holder, into such number of shares as is determined by dividing the original issue price by the conversion price in effect at the time. As of December 31, 2020, the conversion price is $2.34, $2.80, $11.84, $11.84, $28.38, and $88.63 for the Series A, Series A-1, Series B, Series C, Series D, and Series E preferred stock, respectively. As of December 31, 2020, each share of Series A and Series A-1 preferred stock was convertible into ten shares of common stock and each share of Series B, Series C, Series D, Series E preferred stock was convertible into one share of common stock.
All outstanding shares of preferred stock will automatically convert upon the earlier of the completion of an IPO resulting in net proceeds to the Company of at least $75.0 million at a price per share of at least equal to two times the Series E original issue price or the vote or written consent of a majority of the holders of the then outstanding shares of preferred stock, voting together as a single class on an as-converted to common stock basis, including the holders of a majority of the then outstanding Series D preferred stock, voting as a separate class.
F-29
Table of Contents
OLO INC.
Notes to Financial Statements
(amounts in thousands, except for share and per share amounts)
Redemption
The Series E preferred stock are redeemable for cash at any time on or after April 28, 2025 in three annual installments commencing not more than 60 days after receipt by the Company of a written notice from the holders of a majority of the then outstanding shares of Series E preferred stock. The redemption price is equal to the Series E original issue price plus all declared but unpaid dividends.
The Series D preferred stock are redeemable for cash at any time on or after the later of (i) April 28, 2025 and (ii) the first date after April 28, 2025 on which no shares of Series E preferred stock remain outstanding, in three annual installments commencing not more than 60 days after receipt by the Company of a written notice from the holders of (A) a majority of the then outstanding shares of Series E preferred stock, voting together as a single class and on an as-converted to common stock basis and (B) a majority of the then outstanding shares of Series D preferred stock, voting together as a separate class. The redemption price is equal to the Series D original issue price plus all declared but unpaid dividends.
The Series C preferred stock are redeemable at any time on or after the later of (i) April 28, 2025 and (ii) the first date after April 28, 2025 on which no shares of Series D preferred stock remain outstanding, in three annual installments commencing not more than 60 days after receipt by the Company of a written notice from the holders of (A) a majority of the then outstanding shares of Series E and Series D preferred stock, voting together as a single class and on an as-converted to common stock basis and (B) a majority of the then outstanding shares of Series C preferred stock, voting together as a separate class. The redemption price is equal to the Series C original issue price plus all declared but unpaid dividends.
The Series A, Series A-1, and Series B preferred stock are redeemable at any time on or after the later of (i) April 28, 2025 and (ii) the first date after April 28, 2025 on which no shares of Series E, Series D and Series C preferred stock remain outstanding, in three annual installments commencing not more than 60 days after receipt by the Company of a written notice from the holders of (A) a majority of the then outstanding shares of Series E, Series D, and Series C preferred stock, voting together as a single class and on an as-converted to common stock basis. The redemption price is equal to the original issue price of each respective series plus all declared but unpaid dividends.
If the funds of the Company are not sufficient to redeem the full number of shares, the funds legally available will be used to redeem the maximum possible number of shares of each series of preferred stock.
Voting
Each holder of preferred stock is entitled to the number of votes equal to the number of shares of common stock into which the shares held by such holder are convertible and has full voting rights and powers equal to the voting rights and powers of the common stock, and except as provided by law or by other provisions of the Company’s Amended and Restated Certificate of Incorporation, shall vote together with the common stock as a single class on an as-converted basis on all matters as to which holders of common stock have the right to vote.
The holders of common stock are entitled to one vote for each share as determined on the record date for the vote provided that holders of common stock shall not be entitled to vote on any
F-30
Table of Contents
OLO INC.
Notes to Financial Statements
(amounts in thousands, except for share and per share amounts)
amendment to the certificate of incorporation that relates to the terms of one or more outstanding share of preferred stock.
At any time when at least 27,000 shares of Series A preferred stock are outstanding, the holders of Series A preferred stock, voting separately as a single class, are entitled to elect one director of the Company’s board of directors. At any time when at least 125,000 shares of Series A-1 preferred stock are outstanding, the holders of Series A-1 preferred stock, voting separately as a single class, are entitled to elect two directors of the Company’s board of directors. At any time when at least 200,000 shares of Series C preferred stock are outstanding, the holders of Series C preferred stock, voting separately as a single class, are entitled to elect one director of the Company’s board of directors. At any time when at least 200,000 shares of Series D preferred stock are outstanding, the holders of Series D preferred stock, voting separately as a single class, are entitled to elect two directors of the Company’s board of directors. The holders of shares of common stock, voting separately as a single class, are entitled to elect one member of the Company’s board of directors. All remaining members of the Company’s board of directors are elected by the holders of the common stock and preferred stock voting together as a single class.
| 9. | Stock-Based Compensation |
We adopted two equity incentive plans: the 2015 Equity Incentive Plan (“2015 Plan”) and the 2005 Equity Incentive Plan (“2005 Plan” and collectively, “Plans”). The 2015 Plan serves as the successor to the 2005 Plan and provides for the issuance of incentive and nonqualified stock options, stock appreciation rights, or SARs, restricted stock and restricted stock units, or RSUs to employees, directors, consultants and advisors.
Stock options under the Plans may be granted with contractual terms of up to ten years (or five years if granted to a 10.0% stockholder) and at prices no less than 100.0% of the estimated fair value of the shares on the date of grant as determined by the board of directors; provided, however, that (i) the exercise price of an incentive stock option (“ISO”) and nonqualified stock option (“NSO”) granted to a greater than 10.0% stockholder shall not be less than 110.0% of the estimated fair value of the shares on the date of grant. Awards granted under the Plans generally vest over four years and include the right of first refusal in favor of the Company in connection with any proposed sale or transfer of the related shares to third-parties.
Certain stock option recipients have an early exercise feature. Shares purchased pursuant to the early exercise of stock options are subject to repurchase until those shares vest; therefore, cash received in exchange for unvested shares exercised is recorded as a liability on the accompanying consolidated balance sheets, and are reclassified to common stock and additional paid-in capital as the shares vest. There were 12,050 early exercised shares outstanding as of December 31, 2020, of which a liability in the amount of $561 was outstanding, of which $232 was recorded in accrued expenses and other current liabilities in our balance sheet since vesting is within the next 12 months, and $329 was recorded in other liabilities, non-current, since vesting is beyond the next 12 months. There were no early exercised shares outstanding as of December 31, 2018 and 2019.
As of December 31, 2018 and 2019, the maximum number of shares available for issuance to participants under the Plans was 2,229,610. As of December 31, 2020 the maximum number of shares available for issuance to participants under the Plans was 2,715,923.
F-31
Table of Contents
OLO INC.
Notes to Financial Statements
(amounts in thousands, except for share and per share amounts)
The following table summarizes the options available for future grants:
| Shares Available for Future Grant |
||||
| Balances at December 31, 2018 |
209,989 | |||
| Options granted |
(245,398 | ) | ||
| SARs granted |
(2,003 | ) | ||
| Options forfeited and expired |
48,059 | |||
|
|
|
|||
| Balance at December 31, 2019 |
10,647 | |||
| Additions to plan |
502,922 | |||
| Options granted |
(459,963 | ) | ||
| Options forfeited and expired |
45,685 | |||
|
|
|
|||
| Balance at December 31, 2020 |
99,291 | |||
|
|
|
|||
During the year ended December 31, 2018 and 2019, we granted 94,850 and 2,003 SARs to employees, respectively. No SARs were granted during the year ended December 31, 2020. As of December 31, 2020, the total SARs outstanding were 96,853. The SARs are equity-classified and are measured at their grant date fair value. These awards vest only on a change of control or initial public offering and compensation expense of $2,847 will be recognized at such time. If vesting does occur, the award can be settled in cash or common stock at our option equal to (a) the excess of (i) fair value of common stock measured on the vesting date over (ii) the measurement price per SAR multiplied by (b) the number of vested SARs subject to the award. The aggregate intrinsic value of the SARs as of December 31, 2018, 2019, and 2020 was $4,106, $6,433 and $17,692, respectively.
The classification of stock-based compensation by line item within the statement of operations and comprehensive income (loss) is as follows (in thousands):
| Year Ended December 31, | ||||||||||||
| 2018 | 2019 | 2020 | ||||||||||
| Cost of revenue – platform |
$ | 410 | $ | 253 | $ | 556 | ||||||
| Cost of revenue – professional services and other |
34 | 46 | 124 | |||||||||
| Research and development |
1,409 | 814 | 1,497 | |||||||||
| General and administrative |
1,928 | 3,493 | 2,827 | |||||||||
| Sales and marketing |
415 | 220 | 376 | |||||||||
|
|
|
|
|
|
|
|||||||
| Total stock-based compensation expense |
$ | 4,196 | $ | 4,826 | $ | 5,380 | ||||||
|
|
|
|
|
|
|
|||||||
F-32
Table of Contents
OLO INC.
Notes to Financial Statements
(amounts in thousands, except for share and per share amounts)
The following summarizes our stock option activity for the years ended December 31, 2018, 2019 and 2020:
| Options Outstanding Number of Shares |
Weighted Average Exercise Price |
Weighted Average Remaining Contractual Life (Years) |
Aggregate Intrinsic Value |
|||||||||||||
| As of January 1, 2018 |
2,232,996 | $ | 15.61 | 6.66 | $ | 19,694 | ||||||||||
| Granted |
156,870 | 34.16 | ||||||||||||||
| Exercised |
(260,367 | ) | 3.13 | |||||||||||||
| Forfeited |
(67,549 | ) | 25.97 | |||||||||||||
|
|
|
|||||||||||||||
| As of December 31, 2018 |
2,061,950 | $ | 18.26 | 6.16 | $ | 53,676 | ||||||||||
| Granted |
245,398 | 45.13 | ||||||||||||||
| Exercised |
(125,746 | ) | 3.43 | |||||||||||||
| Forfeited |
(48,059 | ) | 17.62 | |||||||||||||
|
|
|
|||||||||||||||
| As of December 31, 2019 |
2,133,543 | $ | 22.24 | 5.81 | $ | 96,377 | ||||||||||
| Granted |
459,963 | 70.19 | ||||||||||||||
| Exercised |
(244,207 | ) | 8.59 | |||||||||||||
| Forfeited |
(45,685 | ) | 46.68 | |||||||||||||
|
|
|
|||||||||||||||
| Vested and expected to vest as of December 31, 2020 |
2,303,614 | $ | 32.79 | 5.89 | $ | 347,574 | ||||||||||
|
|
|
|||||||||||||||
| Exercisable as of December 31, 2020 |
1,714,544 | $ | 22.36 | 4.78 | $ | 276,566 | ||||||||||
|
|
|
|||||||||||||||
The weighted-average grant date fair value of options granted for the years ended December 31, 2018, 2019, and 2020 was $20.20, $27.04 and $64.87 per share, respectively. The aggregate intrinsic value of options exercised for the years ended December 31, 2018, 2019, and 2020 was $10,642, $6,120 and $18,706, respectively. The total grant date fair value of options vested for the years ended December 31, 2018, 2019, and 2020 was $1,433, $3,310 and $12,684, respectively.
Future stock-based compensation for unvested employee options granted and outstanding as of December 31, 2018 is $3,540 to be recognized over a weighted-average period of 2.47 years. Future stock-based compensation for unvested employee options granted and outstanding as of December 31, 2019 is $7,216 to be recognized over a weighted-average period of 3.05 years. Future stock-based compensation for unvested employee options granted and outstanding as of December 31, 2020 is $29,601 to be recognized over a weighted-average period of 3.12 years.
We estimated the fair value of stock options granted using the Black-Scholes option pricing model with the following weighted-average assumptions:
| Year Ended December 31, | ||||||
| 2018 | 2019 | 2020 | ||||
| Expected term (in years) |
5.53 - 10.0 | 5.09 - 10.0 | 5.50 - 6.08 | |||
| Volatility |
45% - 50% | 45% - 50% | 43% - 66% | |||
| Risk-free interest rate |
2.85% - 3.19% | 1.60% - 2.50% | 0.37% - 1.63% | |||
| Dividend yield |
0% | 0% | 0% | |||
| Fair value of common stock |
$23.45 - $43.56 | $45.27 - $63.86 | $69.00 - $153.89 | |||
F-33
Table of Contents
OLO INC.
Notes to Financial Statements
(amounts in thousands, except for share and per share amounts)
We elected to use the midpoint practical expedient to calculate the expected term.
| 10. | Warrants |
Redeemable Convertible Preferred Stock Warrants
As of December 31, 2018, 2019, and 2020, we have issued the following preferred stock warrants in connection with the issuance of our preferred stock:
| Issuance Date |
Expiration Date |
Exercise Price |
Warrants Issued |
Warrants Exercised in 2018 |
Warrants Outstanding at December 31, 2018 |
Warrants Exercised in 2019 |
Warrants Outstanding at December 31, 2019 |
Warrants Exercised in 2020 |
Warrants Outstanding at December 31, 2020 |
|||||||||||||||||||||||||||
| 2012 | 5/14/2022 | $ | 28.00 | 8,920 | — | 8,920 | — | 8,920 | — | 8,920 | ||||||||||||||||||||||||||
| 2012 | 1/31/2019 | 11.84 | 3,724 | (8,944 | ) | 3,724 | (3,724 | ) | — | — | — | |||||||||||||||||||||||||
| 2014 | 10/10/2024 | 11.84 | 33,073 | (1,741 | ) | 33,073 | — | 33,073 | — | 33,073 | ||||||||||||||||||||||||||
| 2016 | 1/12/2026 | 0.01 | 56,998 | (3,000 | ) | 56,998 | — | 56,998 | — | 56,998 | ||||||||||||||||||||||||||
|
|
|
|
|
|
|
|
|
|
|
|
|
|
|
|||||||||||||||||||||||
| 102,715 | (13,685 | ) | 102,715 | (3,724 | ) | 98,991 | — | 98,991 | ||||||||||||||||||||||||||||
|
|
|
|
|
|
|
|
|
|
|
|
|
|
|
|||||||||||||||||||||||
The convertible preferred stock warrants outstanding are exercisable immediately upon issuance and they contain redemption options that require us to redeem the warrants, at the warrant holders’ option after a fixed date, for cash.
During the years ended December 31, 2018 and 2019, warrants to purchase 8,944 and 3,724 shares of Series B convertible preferred stock warrants were exercised for $106 and $44, respectively. In addition, warrants to purchase 4,741 shares of Series C convertible preferred stock warrants were exercised for $21 in 2018.
The estimated fair value of the preferred stock underlying the warrants is similar in value and is approximately $53.00, $76.00, and $217.00 per share as of December 31, 2018, 2019 and 2020, respectively.
At December 31, 2018, we estimated the fair value of each series of preferred stock warrant liability using the Black Scholes option pricing model. The following are the assumptions used:
| Year Ended December 31, |
||||
| 2018 | ||||
| Expected term (in years) |
3.0 | |||
| Volatility |
45 | % | ||
| Risk-free interest rate |
2.9 | % | ||
| Dividend yield |
— | % | ||
At December 31, 2019 and 2020, given the significant increase in fair value of each series of redeemable convertible preferred stock relative to the warrant’s exercise price, the Company estimated the preferred stock warrant liability using the intrinsic value of each warrant since the warrants are significantly in-the-money and the Black-Scholes input have a de minimis impact on their value.
F-34
Table of Contents
OLO INC.
Notes to Financial Statements
(amounts in thousands, except for share and per share amounts)
The following table represents the current period’s activity of the redeemable convertible preferred stock warrant liability (in thousands):
| Fair value |
||||
| Balance at January 1, 2018 |
$ | 2,098 | ||
| Change in fair value |
2,681 | |||
| Exercised |
(563 | ) | ||
|
|
|
|||
| Balance at December 31, 2018 |
$ | 4,216 | ||
| Change in fair value |
2,959 | |||
| Exercised |
(154 | ) | ||
|
|
|
|||
| Balance at December 31, 2019 |
$ | 7,021 | ||
| Change in fair value |
12,714 | |||
|
|
|
|||
| Balance at December 31, 2020 |
$ | 19,735 | ||
|
|
|
|||
| 11. | Income Taxes |
The provision for income taxes consists of the following for the years ended December 31, 2018, 2019 and 2020 (in thousands):
| Year Ended December 31, | ||||||||||||
| 2018 | 2019 | 2020 | ||||||||||
| Current income tax provision: |
||||||||||||
| Federal |
$ | — | $ | — | $ |
— |
||||||
| State |
17 | 26 | 189 | |||||||||
|
|
|
|
|
|
|
|||||||
| Total current income tax provision |
17 | 26 | 189 | |||||||||
| Deferred income tax provision: |
||||||||||||
| Federal |
— | — | — | |||||||||
| State |
— | — | — | |||||||||
|
|
|
|
|
|
|
|||||||
| Total deferred income tax provision |
— | — | — | |||||||||
|
|
|
|
|
|
|
|||||||
| Total income tax provision |
$ | 17 | $ | 26 | $ | 189 | ||||||
|
|
|
|
|
|
|
|||||||
A reconciliation of the U.S. statutory income tax rate to our effective tax rate is as follows:
| Year Ended December 31, | ||||||||||||
| 2018 | 2019 | 2020 | ||||||||||
| Federal statutory rate |
21.00 | % | 21.00 | % | 21.00 | % | ||||||
| Change in Fair Value of Warrant |
0.00 | % | 0.00 | % | 82.10 | % | ||||||
| State and local taxes, net of federal benefit |
(0.12 | )% | (0.18 | )% | 6.32 | % | ||||||
| Deferred true-up |
(1.45 | )% | (0.23 | )% | 0.24 | % | ||||||
| Deferred rate change |
(0.22 | )% | (0.09 | )% | (1.70 | )% | ||||||
| Valuation allowance |
(28.63 | )% | (9.35 | )% | (107.62 | )% | ||||||
| Stock-based compensation |
14.28 | % | (3.65 | )% | 4.50 | % | ||||||
| Other permanent items |
(5.01 | )% | (7.82 | )% | 0.99 | % | ||||||
|
|
|
|
|
|
|
|||||||
| Total provision and effective tax rate |
(0.15 | )% | (0.32 | )% | 5.83 | % | ||||||
|
|
|
|
|
|
|
|||||||
F-35
Table of Contents
OLO INC.
Notes to Financial Statements
(amounts in thousands, except for share and per share amounts)
The difference between income taxes at the U.S. federal statutory income tax rate of 21% and the amounts reported primarily relates to change in fair market value of warrants that is disallowed for income tax purpose, offset by the change of valuation allowance.
Income Taxes
The components of our net deferred tax assets and liabilities are as follows (in thousands):
| December 31, | ||||||||
| 2019 | 2020 | |||||||
| Deferred tax assets: |
||||||||
| Accrued expenses |
$ | 1,263 | $ | 1,244 | ||||
| Deferred rent |
437 | 609 | ||||||
| Stock-based compensation |
890 | 1,184 | ||||||
| Net operating losses |
12,269 | 8,365 | ||||||
| Tax credits |
1,331 | 1,331 | ||||||
| Other |
51 | 174 | ||||||
|
|
|
|
|
|||||
| Total deferred tax assets |
16,241 | 12,907 | ||||||
| Less valuation allowance |
(15,103 | ) | (10,868 | ) | ||||
|
|
|
|
|
|||||
| Net deferred tax assets |
1,138 | $ | 2,039 | |||||
| Unearned revenue |
(357 | ) | (209 | ) | ||||
| Deferred contract costs |
(639 | ) | (1,330 | ) | ||||
| Property and equipment |
(142 | ) | (500 | ) | ||||
| Net deferred tax liabilities |
(1,138 | ) | (2,039 | ) | ||||
|
|
|
|
|
|||||
| Total net deferred tax assets (liabilities) |
$ | — | $ | — | ||||
|
|
|
|
|
|||||
Assessing the realizability of deferred tax assets requires the determination of whether it is more-likely-than-not that some portion or all the deferred tax assets will not be realized. In assessing the need for a valuation allowance, we consider all available positive and negative evidence, including future reversals of existing taxable temporary differences, projected future taxable income, loss carry-back and tax-planning strategies. Generally, more weight is given to objectively verifiable evidence, such as the cumulative loss in recent years, as a significant piece of negative evidence to overcome. Accordingly, a full valuation allowance has been established as of December 31, 2019 and 2020, and no deferred tax assets and related tax benefit have been recognized in the accompanying financial statements. The valuation allowance increased $1,005 during the year ended December 31, 2019 and decreased $4,235 during the year ended December 31, 2020 from the valuation allowances that was recorded as of December 31, 2018 and 2019, respectively.
As of December 31, 2019 and 2020, we had approximately $46,823 and $31,668 of federal net operating losses, respectively. Approximately $12,581 of the federal net operating losses will expire at various dates beginning in 2035 through 2037 if not utilized, while the remaining amount will have an indefinite life.
As of December 31, 2019 and 2020, we had approximately $37,973 and $26,229 of state net operating losses, respectively. Of the state net operating losses, some may follow the Tax Cut and Jobs Act and are indefinite life and most are definite life with various expiration dates beginning in 2027 through 2039. The federal research and development tax credits are approximately $1,331 as of December 31, 2019 and 2020. The federal research credits will begin to expire in 2026.
F-36
Table of Contents
OLO INC.
Notes to Financial Statements
(amounts in thousands, except for share and per share amounts)
Utilization of the net operating loss carryforwards and credits may be subject to a substantial annual limitation due to ownership changes that may have occurred previously or that could occur in the future, as provided by Section 382 of the Internal Revenue Code of 1986, as well as similar state provisions. Such annual limitation could result in the expiration of net operating losses and credits before their utilization.
We file U.S. federal and state income tax returns with varying statutes of limitations. All tax years since inception remain open to examination due to the carryover of unused net operating losses and tax credits.
We recognize interest and penalties accrued related to unrecognized tax benefits as a component of tax expense. We had not recorded any interest or penalties related to unrecognized tax benefits as of December 31, 2018, 2019, and 2020. The unrecognized tax benefits at December 31, 2019 and 2020 are not material.
On March 27, 2020, The Coronavirus Aid, Relief, and Economic Security Act (the “CARES Act”) was signed into law in the United States. The CARES Act and related notices include several significant provisions. One provision permits employers to defer payment of the employer share of Social Security payroll taxes they otherwise would be responsible for paying in 2020, effective for such payments due after the date the Act was signed into law. Fifty percent of the deferred payroll taxes are due on December 31, 2021, and the remaining amounts are due on December 31, 2022. We have deferred payment of $1,607 of Social Security payroll taxes under the aforementioned CARES Act provision. We do not expect the other provisions in the CARES Act to have a material impact on our financial results. We will continue to monitor and assess the impact the CARES Act may have on our business and financial results.
| 12. | Commitments and Contingencies |
Commitments
We have a non-cancelable operating lease for our headquarters in New York City that expires in 2030. Total rental payments to be paid over the course of the lease are approximately $28,848, which excludes our option to exercise a renewal for an additional five years commencing on the last day of the initial term. We received a rent abatement for the first eleven months of the lease arrangement. Upon the conclusion of the abatement period, annual rental payments are consistent for five years and then increase 6% for the remaining five years. We were also required to issue a letter of credit in the amount $1,390 as a security deposit. We also sublease our old office space which, in connection with the signing of the new lease, we ceased use and subsequently subleased a portion of our old office space. Rental income escalates yearly and ranges from approximately $348 to $380 annually for total rental income of $1,308. As the rental income is expected to exceed our remaining lease obligations, we will continue to record our remaining lease obligations over the course of the initial lease term. The sublease expires in March 2023.
Rent expense, excluding sublease income, for the years ended December 31, 2018, 2019, and 2020 was $695, $2,192 and $3,283, respectively. Rental income for the years ended December 31, 2018, 2019, and 2020 was $0, $178 and $348, respectively.
F-37
Table of Contents
OLO INC.
Notes to Financial Statements
(amounts in thousands, except for share and per share amounts)
The following represents our future minimum payments under non-cancelable leases for operating facilities for each of the next five years and thereafter (in thousands):
| Years ending December 31: |
||||
| 2021 |
$ | 3,514 | ||
| 2022 |
3,533 | |||
| 2023 |
3,352 | |||
| 2024 |
2,780 | |||
| 2025 |
2,885 | |||
| Thereafter |
13,074 | |||
|
|
|
|||
| Total |
$ | 29,138 | ||
|
|
|
Contingencies
Liabilities for loss contingencies arising from claims, assessments, litigation, fines, and penalties and other sources are recorded when it is probable that a liability has been incurred and the amount can be reasonably estimated. If we determine that a loss is reasonably possible, and the loss or range of loss can be estimated, we will disclose the possible loss in the notes to our financial statements. Accounting for contingencies requires us to use judgment related to both the likelihood of a loss and the estimate of the amount or range of loss. Legal costs incurred in connection with loss contingencies are expensed as incurred.
On or about October 21, 2020, one of our customers filed a complaint with the New York State Supreme Court, New York County alleging breach of contract related to fees we charged them. Our customer is seeking damages in excess of $7.0 million. We are currently evaluating the allegations surrounding the complaint, and we believe this lawsuit is without merit. We plan to vigorously defend against it.
We have also received, and may in the future continue to receive, claims from third parties asserting, among other things, infringement of their intellectual property rights. Future litigation may be necessary to defend ourselves or our customers by determining the scope, enforceability and validity of third-party proprietary rights or to establish our proprietary rights. Defending such proceedings is costly and can impose a significant burden on management and employees. The results of any current or future litigation cannot be predicted with certainty, and regardless of the outcome, litigation can have an adverse impact on us because of defense and settlement costs, diversion of management resources and other factors.
F-38
Table of Contents
OLO INC.
Notes to Financial Statements
(amounts in thousands, except for share and per share amounts)
| 13. | Net Income (Loss) per Share Attributable to Common Stockholders |
A reconciliation of net income (loss) available to common stockholders and the number of shares in the calculation of basic and diluted income (loss) per share is as follows:
| Year Ended December 31, | ||||||||||||
| 2018 | 2019 | 2020 | ||||||||||
| Numerator: |
||||||||||||
| Net income (loss) and comprehensive income (loss) |
$ | (11,552 | ) | $ | (8,258 | ) | $ | 3,063 | ||||
| Less: accretion of redeemable convertible preferred stock to redemption value |
(136 | ) | (136 | ) | (70 | ) | ||||||
| Less: undeclared 8% non-cumulative dividend on participating securities |
— | — | (2,993 | ) | ||||||||
|
|
|
|
|
|
|
|||||||
| Net income (loss) attributable to common stockholders—basic |
$ | (11,688 | ) | $ | (8,394 | ) | $ | — | ||||
| Reallocation of net income attributable to participating securities |
— | — | — | |||||||||
| Accretion on redeemable preferred stock |
136 | 136 | — | |||||||||
|
|
|
|
|
|
|
|||||||
| Net income (loss) attributable to common stockholders—diluted |
$ | (11,552 | ) | $ | (8,258 | ) | $ | — | ||||
|
|
|
|
|
|
|
|||||||
| Year Ended December 31, | ||||||||||||
| 2018 | 2019 | 2020 | ||||||||||
| Denominator: |
||||||||||||
| Weighted-average common shares outstanding—basic |
703,245 | 1,026,248 | 1,181,314 | |||||||||
| Dilutive effect of assumed conversion of preferred stock |
— | — | — | |||||||||
| Weighted average effect of dilutive securities: |
||||||||||||
| Options |
— | — | — | |||||||||
| Warrants |
— | — | — | |||||||||
|
|
|
|
|
|
|
|||||||
| Weighted-average common shares outstanding—diluted |
703,245 | 1,026,248 | 1,181,314 | |||||||||
|
|
|
|
|
|
|
|||||||
| Net income (loss) per share attributable to common stockholders—basic |
$ | (16.62 | ) | $ | (8.18 | ) | $ | — | ||||
|
|
|
|
|
|
|
|||||||
| Net income (loss) per share attributable to common stockholders—diluted |
$ | (16.62 | ) | $ | (8.18 | ) | $ | — | ||||
|
|
|
|
|
|
|
|||||||
The following participating securities were excluded from the computation of diluted net income (loss) per share attributable to common stockholders for the periods presented, because including them would have been anti-dilutive (on an as-converted basis):
| December 31, 2018 |
December 31, 2019 |
December 31, 2020 |
||||||||||
| Redeemable convertible preferred stock |
5,217,668 | 5,230,521 | 5,794,996 | |||||||||
| Outstanding stock options |
1,157,679 | 1,229,745 | 2,388,417 | |||||||||
| Outstanding SARs |
16,849 | 96,853 | 96,853 | |||||||||
| Outstanding redeemable convertible preferred stock warrants |
89,993 | 87,389 | 98,991 | |||||||||
| Outstanding common stock warrants |
4,608 | 3,148 | — | |||||||||
|
|
|
|
|
|
|
|||||||
| Total |
6,486,797 | 6,647,656 | 8,379,257 | |||||||||
|
|
|
|
|
|
|
|||||||
F-39
Table of Contents
OLO INC.
Notes to Financial Statements
(amounts in thousands, except for share and per share amounts)
| 14. | Related Party Transactions |
Two of our board members have ownership interests in companies that we provide services to and one of our executive officers’ serves on the board of one of our customers. During the years ended December 31, 2019 and 2020, the Company generated approximately $580 and $986 of revenue, respectively, from these customers identified as related parties. As of December 31, 2019 and 2020, the outstanding accounts receivable from the related parties was $442 and $407, respectively. As of December 31, 2018, 2019, and 2020, the revenue and accounts receivable from related parties was immaterial.
Certain existing investors purchased 202,730 shares of our common stock and vested options directly from current employees, non-employees, and an existing investor at a price per share of $79.76 as discussed in Note 8.
| 15. | Subsequent Events |
We have evaluated subsequent events from the balance sheet date through February 19, 2021, the date the financial statements were available to be issued.
Stock-Based Compensation
On February 1, 2021, we increased the number of authorized common stock by 500,000 shares to 10,450,000 authorized shares of common stock. We also increased the number of shares available for issuance under the Plan by 450,000 shares to 570,634 shares.
On February 1, 2021, we granted stock options to purchase 386,940 shares of common stock with an exercise price of $165.32.
During 2021, 9,775 stock options were exercised and settled for common stock for cash consideration of $285.
F-40
Table of Contents

Table of Contents
PART II
INFORMATION NOT REQUIRED IN PROSPECTUS
Item 13. Other Expenses of Issuance and Distribution.
The following table sets forth all expenses to be paid by us, other than underwriting discounts and commissions, in connection with this offering. All amounts shown are estimates except for the Securities and Exchange Commission, or the SEC, registration fee, the Financial Industry Regulatory Authority, Inc. or FINRA, filing fee and the exchange listing fee.
| SEC registration fee |
$ | 10,910 | ||
| FINRA filing fee |
$ | 14,850 | ||
| Exchange listing fee |
* | |||
| Printing and engraving expenses |
* | |||
| Legal fees and expenses |
* | |||
| Accounting fees and expenses |
* | |||
| Custodian transfer agent and registrar fees |
* | |||
| Miscellaneous |
* | |||
|
|
|
|||
| Total |
$ | * | ||
|
|
|
| * | To be filed by amendment. |
Item 14. Indemnification of Directors and Officers.
Section 145 of the Delaware General Corporation Law authorizes a court to award, or a corporation’s board of directors to grant, indemnity to directors and officers in terms sufficiently broad to permit such indemnification under certain circumstances for liabilities, including reimbursement for expenses incurred, arising under the Securities Act of 1933, as amended, or the Securities Act. Our amended and restated certificate of incorporation that will be in effect on the completion of this offering permits indemnification of our directors, officers, employees and other agents to the maximum extent permitted by the Delaware General Corporation Law, and our amended and restated bylaws that will be in effect on the completion of this offering provide that we will indemnify our directors and officers and permit us to indemnify our employees and other agents, in each case to the maximum extent permitted by the Delaware General Corporation Law.
We have entered into indemnification agreements with our directors and officers, whereby we have agreed to indemnify our directors and officers to the fullest extent permitted by law, including indemnification against expenses and liabilities incurred in legal proceedings to which the director or officer was, or is threatened to be made, a party by reason of the fact that such director or officer is or was a director, officer, employee or agent of Olo Inc., provided that such director or officer acted in good faith and in a manner that the director or officer reasonably believed to be in, or not opposed to, the best interest of Olo Inc. At present, there is no pending litigation or proceeding involving a director or officer of Olo Inc. regarding which indemnification is sought, nor is the registrant aware of any threatened litigation that may result in claims for indemnification.
We maintain insurance policies that indemnify our directors and officers against various liabilities arising under the Securities Act and the Securities Exchange Act of 1934, as amended, that might be incurred by any director or officer in his capacity as such.
The underwriters are obligated, under certain circumstances, under the underwriting agreement to be filed as Exhibit 1.1 hereto, to indemnify us and our officers and directors against liabilities under the Securities Act.
Table of Contents
Item 15. Recent Sales of Unregistered Securities.
The following sets forth information regarding all unregistered securities sold since January 1, 2018:
(a) Option issuances.
We have granted under our 2015 Plan options to purchase an aggregate of 1,356,464 shares of our Class B common stock to a total of 579 employees, consultants, and directors, having exercise prices ranging from $28.38 to $165.32 per share. 85,685 of such options granted under the 2015 Plan have been exercised at a weighted-average exercise price of $35.08 per share.
(b) Warrants to purchase capital stock.
We issued to RRE Ventures IV, L.P. 4,472 shares of preferred stock at an exercise price of $11.84 per share, pursuant to the exercise of a warrant in full on August 8, 2018, for aggregate cash consideration of approximately $52,938.04.
We issued to Core Capital Partners II, L.P. 805 shares of preferred stock at an exercise price of $11.84 per share, pursuant to the exercise of a warrant in full on September 24, 2018, for aggregate cash consideration of approximately $9,531.12.
We issued to Core Capital Partners Fund II, L.P. 313 shares of preferred stock at an exercise price of $11.84 per share, pursuant to the exercise of a warrant in full on September 24, 2018, for aggregate cash consideration of $3,705.89.
We issued to Core Capital Partners Fund II, L.P. 539 shares of preferred stock at an exercise price of $0.01 per share, pursuant to the exercise of a warrant in full on September 24, 2018, for aggregate cash consideration of $5.39.
We issued to Core Capital Partners II-S, L.P. 3,083 shares of preferred stock at an exercise price of $11.84 per share, pursuant to the exercise of a warrant in full on September 24, 2018, for aggregate cash consideration of approximately $36,502.42.
We issued to Core Capital Partners II-S, L.P. 1,201 shares of preferred stock at an exercise price of $11.84 per share, pursuant to the exercise of a warrant in full on September 24, 2018, for aggregate cash consideration of approximately $14,219.72.
We issued to Core Capital Partners II-S, L.P. 2,069 shares of preferred stock at an exercise price of $0.01 per share, pursuant to the exercise of a warrant in full on September 24, 2018, for aggregate cash consideration of approximately $20.69.
We issued to Core Capital TB SPV, L.P. 584 shares of preferred stock at an exercise price of $11.84 per share, pursuant to the exercise of a warrant in full on September 24, 2018, for aggregate cash consideration of approximately $6,914.51.
We issued to Core Capital TB SPV, L.P. 227 shares of preferred stock at an exercise price of $11.84 per share, pursuant to the exercise of a warrant in full on September 24, 2018, for aggregate cash consideration of approximately $2,687.66.
We issued to Core Capital TB SPV, L.P. 392 shares of preferred stock at an exercise price of $0.01 per share, pursuant to the exercise of a warrant in full on September 24, 2018, for aggregate cash consideration of approximately $3.92.
Table of Contents
We issued to Raqtinda Investments LLC 3,724 shares of preferred stock at an exercise price of $11.84 per share, pursuant to the exercise of a warrant in full on January 30, 2019, for aggregate cash consideration of approximately $44,091.79.
We issued to Focus Brands Inc. 5,000 shares of Class B common stock at an exercise price of $2.73 per share, pursuant to the exercise of a warrant in full on August 30, 2019, for aggregate cash consideration of approximately $13,650.00.
(c) Convertible Preferred Stock Issuances
In April 2020, we issued and sold an aggregate of 564,169 shares of Series E convertible preferred stock to Wellington Hadley Harbor Master Investors (Cayman) III L.P., RPII Order LLC, RRE Leaders II, L.P. and Hospitality Investment Partners at $88.62581 per share for aggregate proceeds of approximately $50 million.
None of the foregoing transactions involved any underwriters, underwriting discounts or commissions, or any public offering. Unless otherwise specified above, we believe these transactions were exempt from registration under the Securities Act in reliance on Section 4(2) of the Securities Act (and Regulation D or Regulation S promulgated thereunder) or Rule 701 promulgated under Section 3(b) of the Securities Act as transactions by an issuer not involving any public offering or under benefit plans and contracts relating to compensation as provided under Rule 701. The recipients of the securities in each of these transactions represented their intentions to acquire the securities for investment only and not with a view to or for sale in connection with any distribution thereof, and appropriate legends were placed on the share certificates issued in these transactions. All recipients had adequate access, through their relationships with us, to information about us. The sales of these securities were made without any general solicitation or advertising.
Item 16. Exhibits and Financial Statement Schedules.
(a) Exhibits.
See the Exhibit Index on the page immediately preceding the signature page for a list of exhibits filed as part of this registration statement on Form S-1, which Exhibit Index is incorporated herein by reference.
(b) Financial Statement Schedules.
All financial statement schedules are omitted because the information required to be set forth therein is not applicable or is shown in the financial statements or the notes thereto.
Item 17. Undertakings.
The undersigned registrant hereby undertakes to provide to the underwriters at the closing specified in the underwriting agreement certificates in such denominations and registered in such names as required by the underwriters to permit prompt delivery to each purchaser.
Insofar as indemnification for liabilities arising under the Securities Act of 1933, or the Securities Act, may be permitted to directors, officers and controlling persons of the registrant pursuant to the foregoing provisions or otherwise, the registrant has been advised that in the opinion of the Securities and Exchange Commission such indemnification is against public policy as expressed in the Securities Act and is, therefore, unenforceable. In the event that a claim for indemnification against such liabilities (other than the payment by the registrant of expenses incurred or paid by a director, officer or controlling person of the registrant in the successful defense of any action, suit or proceeding)
Table of Contents
is asserted by such director, officer or controlling person in connection with the securities being registered, the registrant will, unless in the opinion of its counsel the matter has been settled by controlling precedent, submit to a court of appropriate jurisdiction the question whether such indemnification by it is against public policy as expressed in the Securities Act and will be governed by the final adjudication of such issue.
The undersigned registrant hereby undertakes that:
(1) For purposes of determining any liability under the Securities Act, the information omitted from the form of prospectus filed as part of this registration statement in reliance upon Rule 430A and contained in a form of prospectus filed by the registrant pursuant to Rule 424(b)(1) or (4) or 497(h) under the Securities Act shall be deemed to be part of this registration statement as of the time it was declared effective.
(2) For the purpose of determining any liability under the Securities Act, each post-effective amendment that contains a form of prospectus shall be deemed to be a new registration statement relating to the securities offered therein, and the offering of such securities at that time will be deemed to be the initial bona fide offering thereof.
Table of Contents
EXHIBIT INDEX
The following exhibits are included herein or incorporated herein by reference:
Table of Contents
| Exhibit |
Description | |
| 10.16+* | Non-Employee Director Compensation Policy. | |
| 10.17+ | Form of 2021 Employee Stock Purchase Plan. | |
| 10.18+ | Executive Bonus Policy. | |
| 10.19#† | Delivery Network Agreement, dated March 30, 2017, by and between the Registrant and DoorDash, Inc., as amended. | |
| 23.1 | Consent of Ernst & Young LLP, independent registered public accounting firm. | |
| 23.2* | Consent of Cooley LLP (included in Exhibit 5.1). | |
| 24.1 | Power of Attorney (included on signature page to this registration statement). | |
| * | To be filed by amendment. |
| + | Indicates management contract or compensatory plan. |
| # | Portions of this exhibit (indicated by asterisks) have been omitted because the registrant has determined they are not material and would likely cause competitive harm to the registrant if publicly disclosed. |
| † | Certain schedules have been omitted pursuant to Item 601(a)(5) of Regulation S-K. The registrant hereby undertakes to furnish supplementally a copy of any omitted exhibit or schedule upon request by the SEC. |
Table of Contents
Pursuant to the requirements of the Securities Act of 1933, the registrant has duly caused this registration statement to be signed on its behalf by the undersigned, thereunto duly authorized, in New York, New York, on February 19, 2021.
| OLO INC. | ||
| By: |
/s/ Noah Glass | |
| Name: |
Noah Glass | |
| Title: |
Chief Executive Officer | |
POWER OF ATTORNEY
KNOW ALL PERSONS BY THESE PRESENTS, that each person whose signature appears below constitutes and appoints Noah Glass and Peter Benevides, and each one of them, as his or her true and lawful attorneys-in-fact and agents, with full power of substitution and resubstitution, for him or her and in their name, place and stead, in any and all capacities, to sign any and all amendments (including post-effective amendments) to this registration statement, and to sign any registration statement for the same offering covered by this registration statement that is to be effective on filing pursuant to Rule 462(b) under the Securities Act of 1933, as amended, and all post-effective amendments thereto, and to file the same, with all exhibits thereto and other documents in connection therewith, with the Securities and Exchange Commission, granting unto said attorneys-in-fact and agents, and each of them, full power and authority to do and perform each and every act and thing requisite and necessary to be done in connection therewith, as fully to all intents and purposes as he or she might or could do in person, hereby ratifying and confirming all that said attorneys-in-fact and agents or any of them, or his or her substitute or substitutes, may lawfully do or cause to be done by virtue hereof.
Pursuant to the requirements of the Securities Act of 1933, this registration statement has been signed by the following persons in the capacities and on the dates indicated.
| Signature |
Title |
Date | ||
| /s/ Noah Glass Noah Glass |
Chief Executive Officer (Principal Executive Officer) |
February 19, 2021 | ||
| /s/ Peter Benevides Peter Benevides |
Chief Financial Officer (Principal Financial and Accounting Officer) |
February 19, 2021 | ||
| /s/ Brandon Gardner Brandon Gardner |
Chairman and Director |
February 19, 2021 | ||
| /s/ David Frankel David Frankel |
Director |
February 19, 2021 | ||
| /s/ Russell Jones Russell Jones |
Director |
February 19, 2021 | ||
| /s/ Daniel Meyer Daniel Meyer |
Director |
February 19, 2021 | ||
| /s/ Colin Neville Colin Neville |
Director |
February 19, 2021 | ||
Table of Contents
| /s/ James D. Robinson IV James D. Robinson IV |
Director |
February 19, 2021 | ||
| /s/ Linda Rottenberg Linda Rottenberg |
Director |
February 19, 2021 | ||
| /s/ Warren C. Smith Jr. Warren C. Smith Jr. |
Director |
February 19, 2021 | ||
| /s/ Zuhairah Washington Zuhairah Washington |
Director |
February 19, 2021 | ||