Attached files
| file | filename |
|---|---|
| EX-99.2 - EX-99.2 - DEERE & CO | de-20210219xex99d2.htm |
| EX-99.1 - EX-99.1 - DEERE & CO | de-20210219xex99d1.htm |
| 8-K - 8-K - DEERE & CO | de-20210219x8k.htm |
Exhibit 99.3
| 1Q 2021 Earnings Call 19 February 2021 22 |

| John Deere | 1Q 2021 Earnings Call | February 19, 2021 2 Safe Harbor Statement & Disclosures The earnings call and accompanying material include forward-looking comments and information concerning the company’s plans and projections for the future, including estimates and assumptions with respect to economic, political, technological, weather, market acceptance, acquisitions and divestitures of businesses, anticipated transaction costs, the integration of new businesses, anticipated benefits of acquisitions, and other factors that impact our businesses and customers. They also may include financial measures that are not in conformance with accounting principles generally accepted in the United States of America (GAAP). Words such as “forecast,” “projection,” “outlook,” “prospects,” “expected,” “estimated,” “will,” “plan,” “anticipate,” “intend,” “believe,” or other similar words or phrases often identify forward-looking statements. Actual results may differ materially from those projected in these forward-looking statements based on a number of factors and uncertainties, including those related to the effects of the COVID-19 pandemic. Additional information concerning factors that could cause actual results to differ materially is contained in the company’s most recent Form 8-K and periodic report filed with the U.S. Securities and Exchange Commission, and is incorporated by reference herein. Investors should refer to and consider the incorporated information on risks and uncertainties in addition to the information presented here. The company, except as required by law, undertakes no obligation to update or revise its forward-looking statements whether as a result of new developments or otherwise. The call and accompanying materials are not an offer to sell or a solicitation of offers to buy any of the company’s securities. 23 |
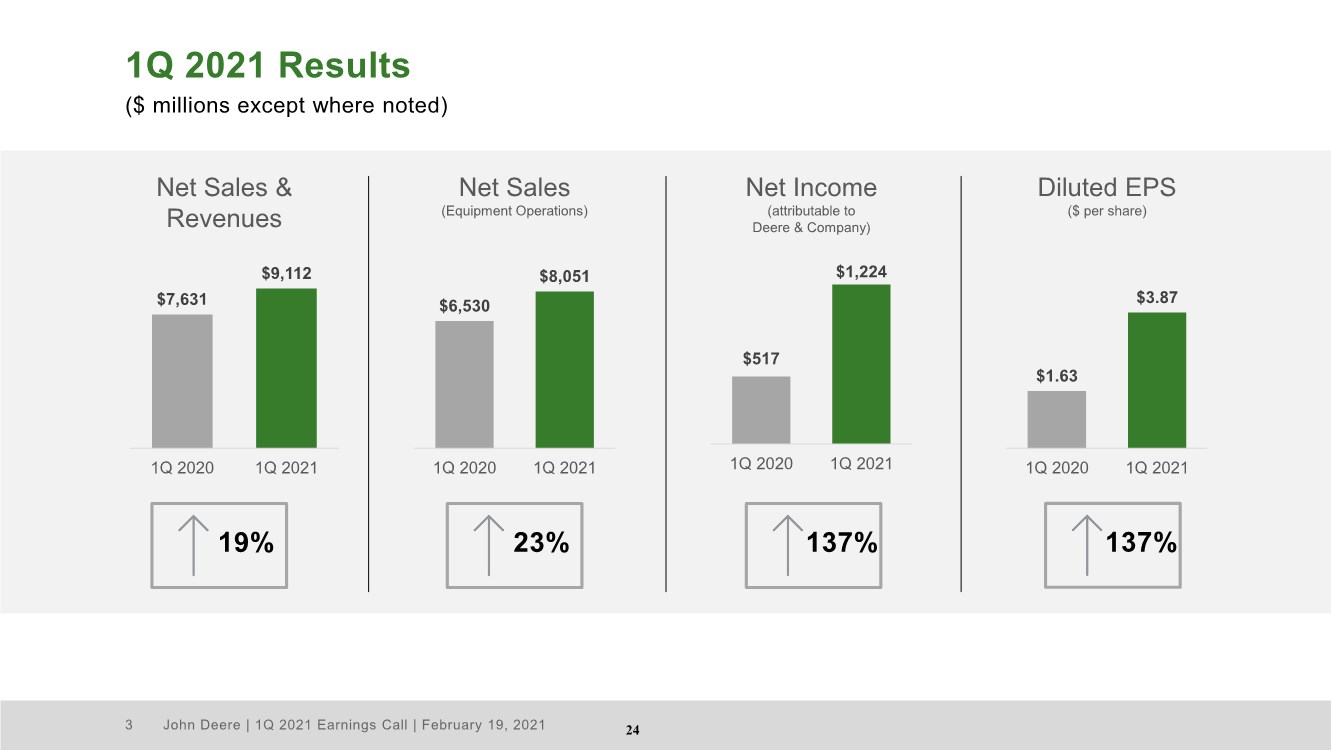
| John Deere | 1Q 2021 Earnings Call | February 19, 2021 3 1Q 2021 Results ($ millions except where noted) $7,631 $9,112 1Q 2020 1Q 2021 $6,530 $8,051 1Q 2020 1Q 2021 $517 $1,224 1Q 2020 1Q 2021 $1.63 $3.87 1Q 2020 1Q 2021 23% Net Sales & Revenues Net Sales (Equipment Operations) Net Income (attributable to Deere & Company) Diluted EPS ($ per share) 19% 137% 137% 24 |
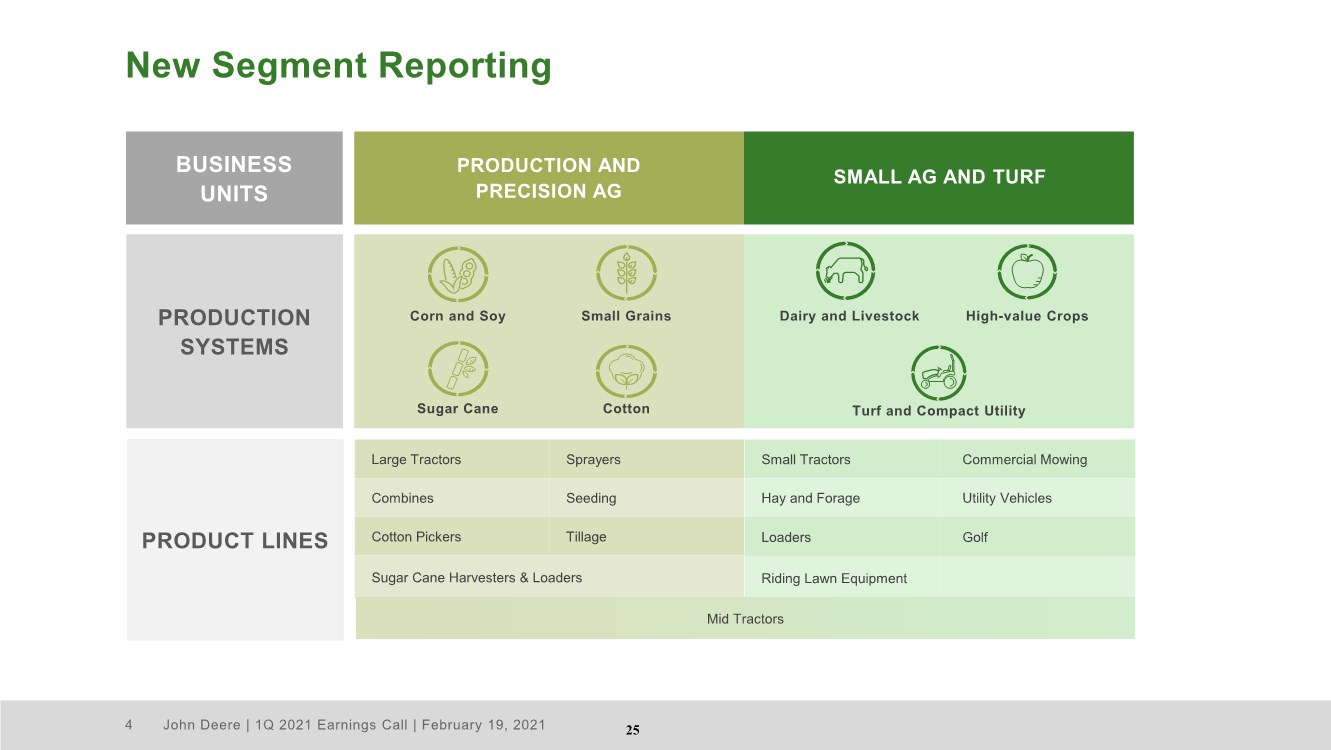
| John Deere | 1Q 2021 Earnings Call | February 19, 2021 4 New Segment Reporting PRODUCTION AND PRECISION AG SMALL AG AND TURF BUSINESS UNITS PRODUCTION SYSTEMS Small Grains Sugar Cane Cotton Corn and Soy Dairy and Livestock High-value Crops Turf and Compact Utility PRODUCT LINES Large Tractors Sprayers Combines Seeding Cotton Pickers Tillage Sugar Cane Harvesters & Loaders Small Tractors Commercial Mowing Hay and Forage Utility Vehicles Loaders Golf Riding Lawn Equipment Mid Tractors 25 |
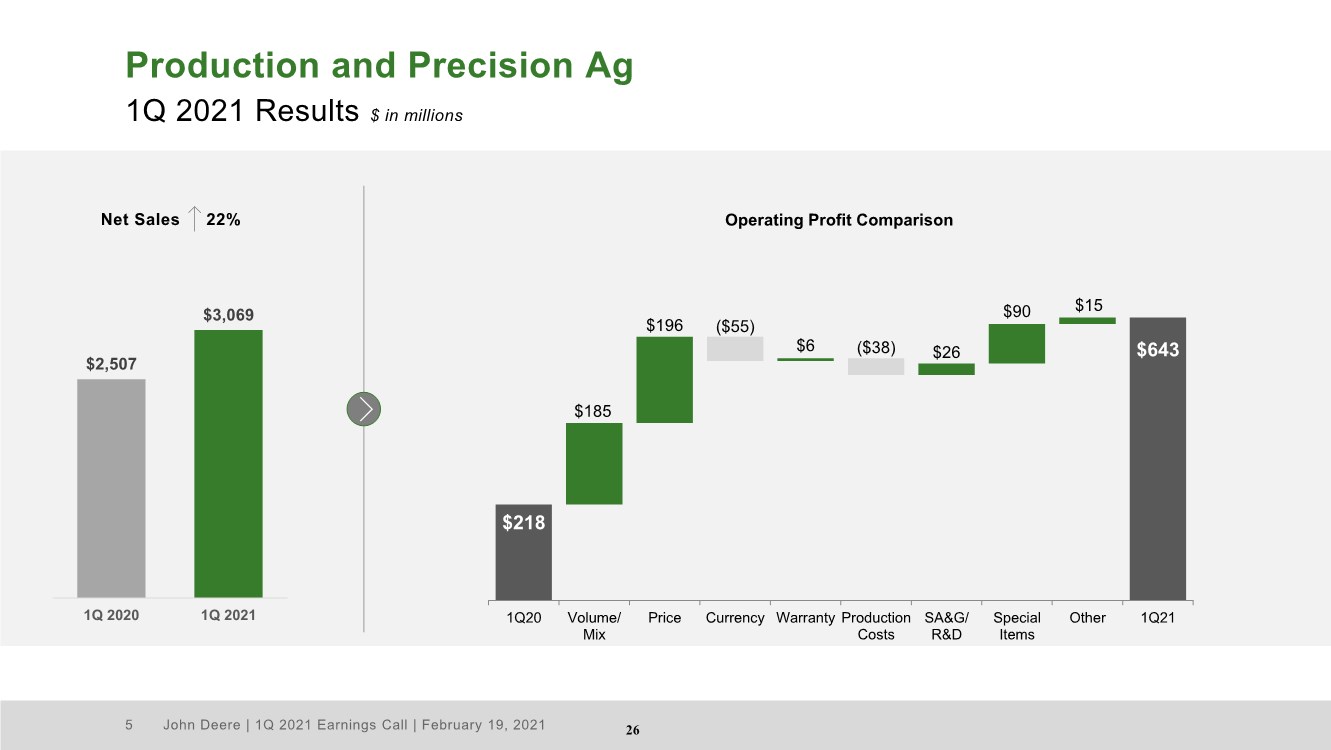
| John Deere | 1Q 2021 Earnings Call | February 19, 2021 5 Production and Precision Ag 1Q 2021 Results $ in millions $2,507 $3,069 1Q 2020 1Q 2021 Net Sales 22% $643 $185 $90 $15 $218 $196 ($55) $6 ($38) $26 1Q20 Volume/ Mix Price Currency Warranty Production Costs SA&G/ R&D Special Items Other 1Q21 Operating Profit Comparison 26 |
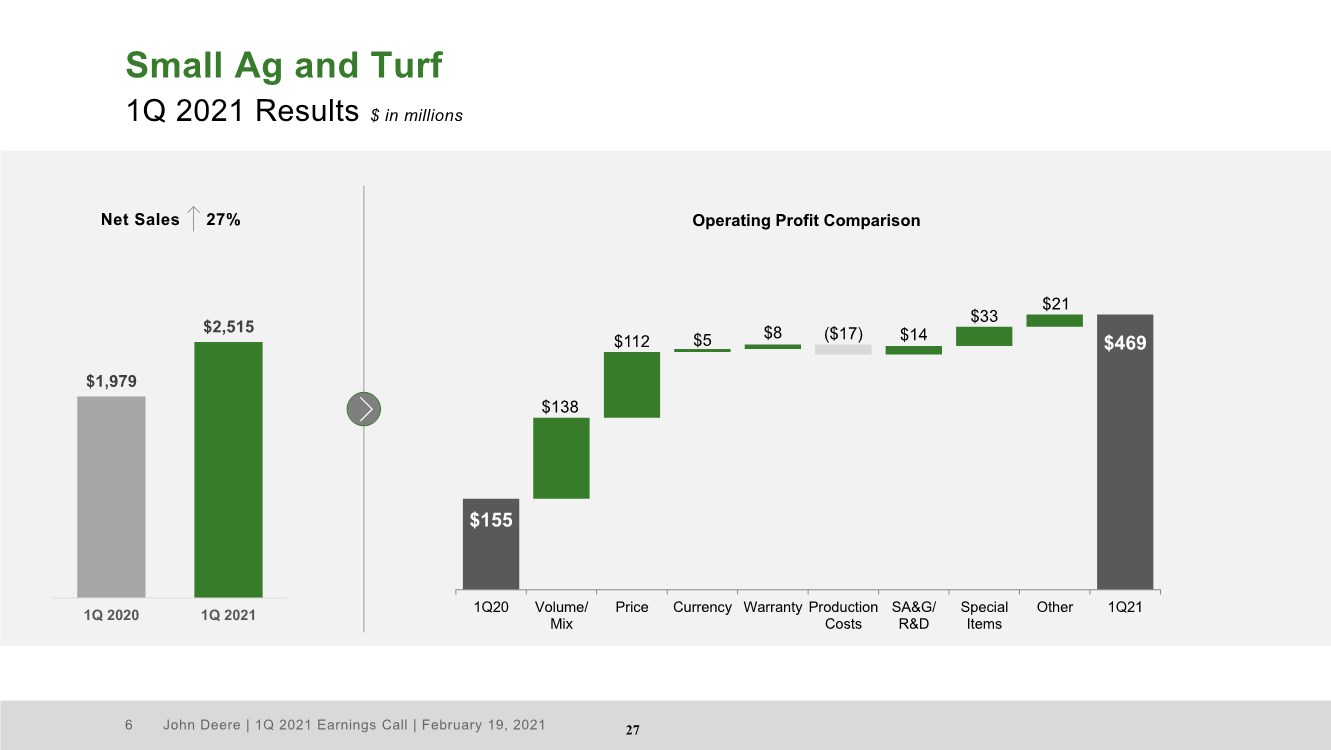
| John Deere | 1Q 2021 Earnings Call | February 19, 2021 6 Small Ag and Turf 1Q 2021 Results $ in millions $1,979 $2,515 1Q 2020 1Q 2021 Net Sales 27% $469 $138 $33 $21 $155 $112 $5 $8 ($17) $14 1Q20 Volume/ Mix Price Currency Warranty Production Costs SA&G/ R&D Special Items Other 1Q21 Operating Profit Comparison 27 |
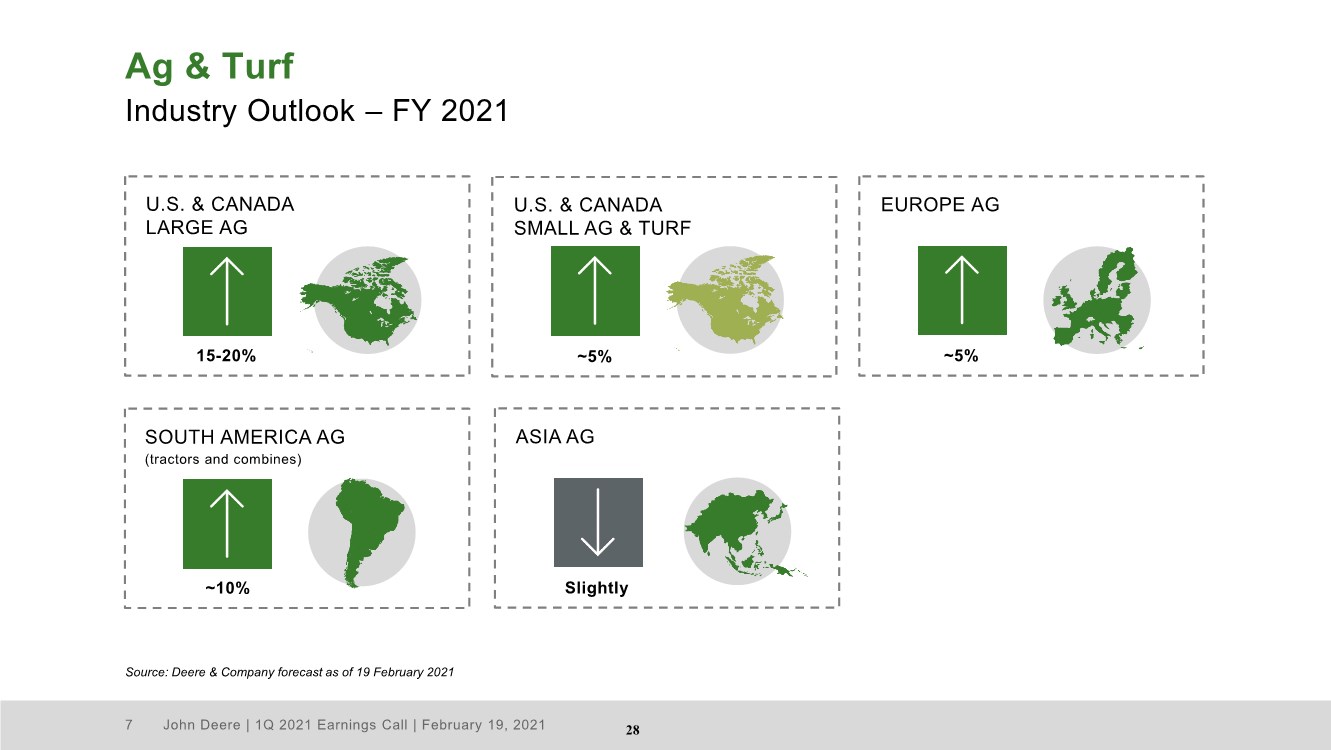
| John Deere | 1Q 2021 Earnings Call | February 19, 2021 7 Ag & Turf Industry Outlook – FY 2021 Source: Deere & Company forecast as of 19 February 2021 U.S. & CANADA LARGE AG 15-20% EUROPE AG ~5% SOUTH AMERICA AG (tractors and combines) ~10% U.S. & CANADA SMALL AG & TURF ~5% ASIA AG Slightly 28 |
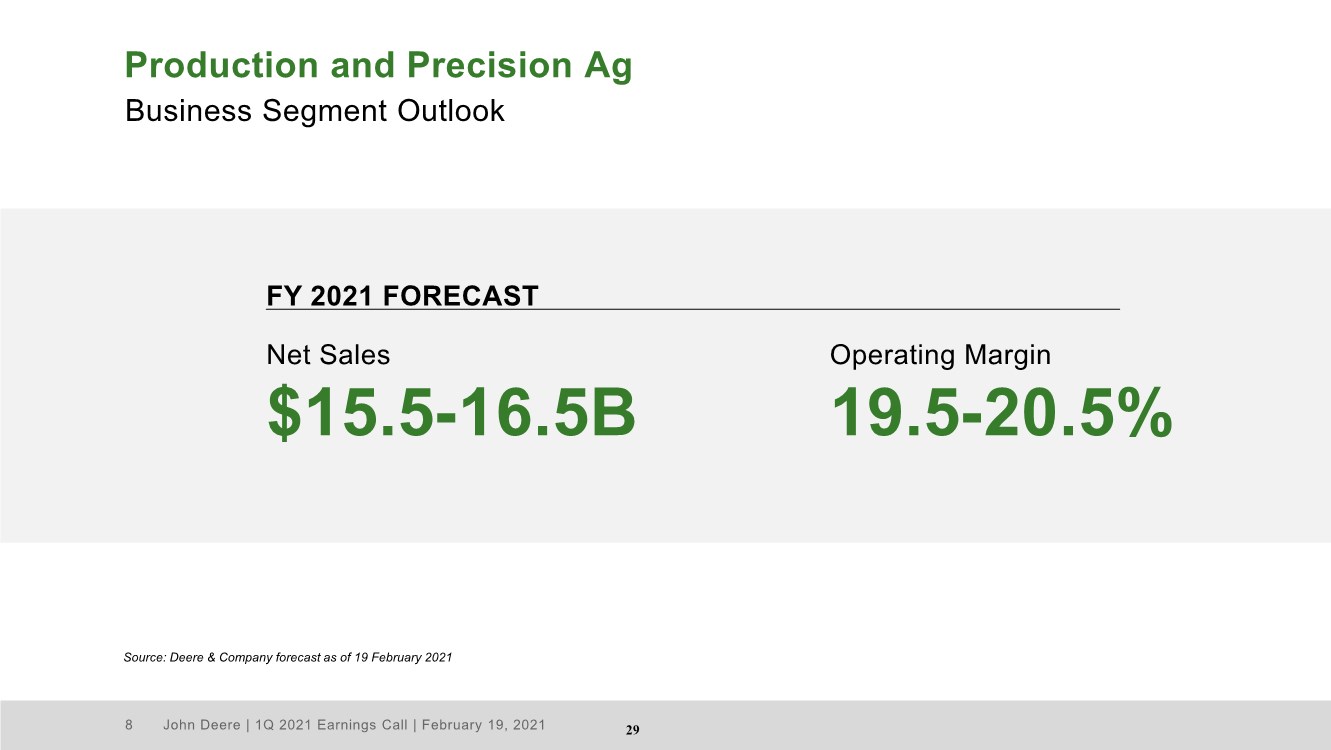
| John Deere | 1Q 2021 Earnings Call | February 19, 2021 8 Production and Precision Ag Net Sales $15.5-16.5B FY 2021 FORECAST Operating Margin 19.5-20.5% Business Segment Outlook Source: Deere & Company forecast as of 19 February 2021 29 |
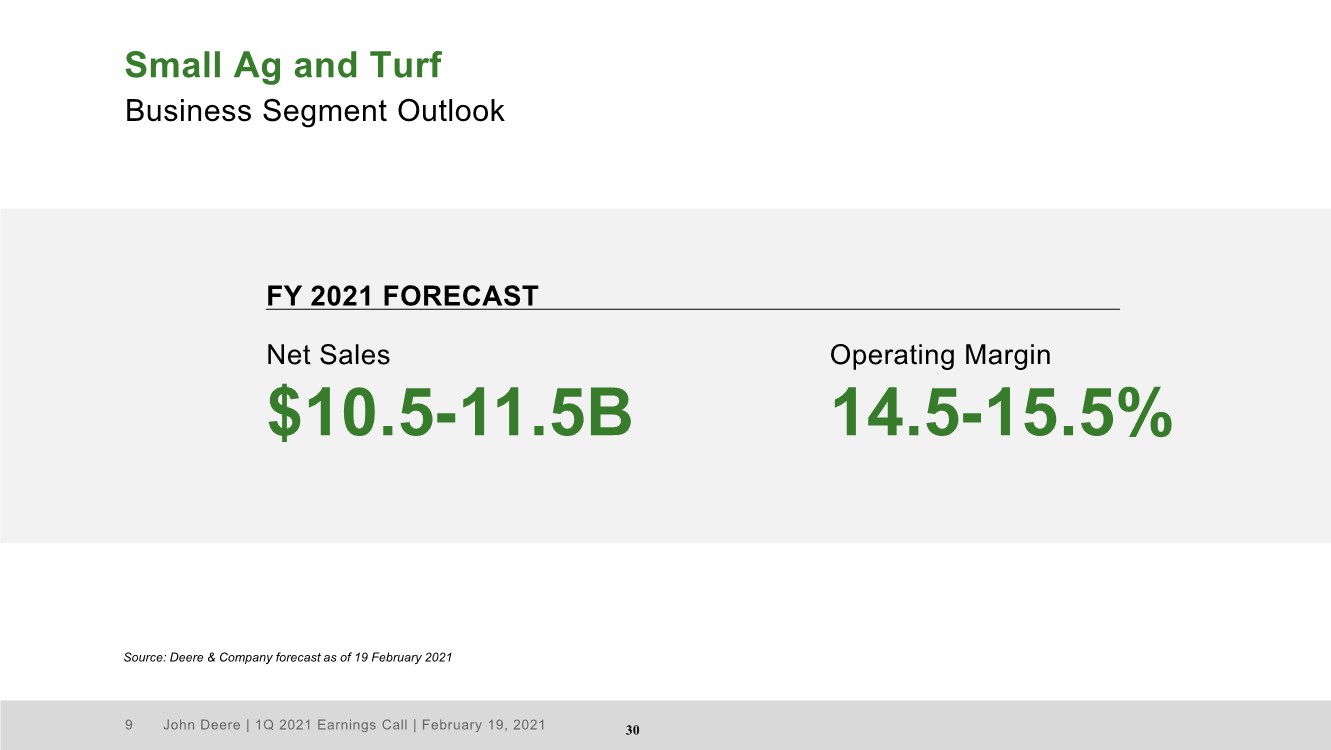
| John Deere | 1Q 2021 Earnings Call | February 19, 2021 9 Small Ag and Turf Net Sales $10.5-11.5B FY 2021 FORECAST Operating Margin 14.5-15.5% Business Segment Outlook Source: Deere & Company forecast as of 19 February 2021 30 |
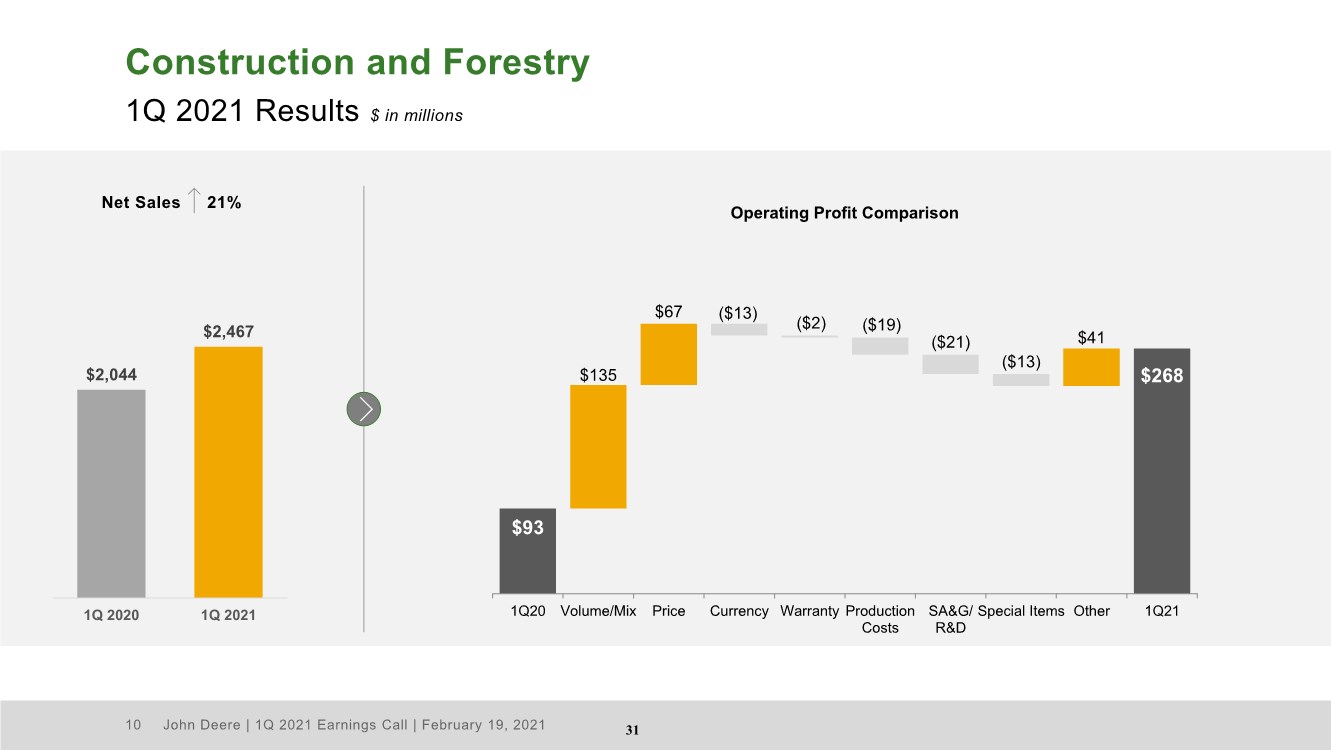
| John Deere | 1Q 2021 Earnings Call | February 19, 2021 10 Construction and Forestry 1Q 2021 Results $ in millions $2,044 $2,467 1Q 2020 1Q 2021 Net Sales 21% $268 $135 ($2) ($19) ($21) ($13) $93 $67 ($13) $41 1Q20 Volume/Mix Price Currency Warranty Production Costs SA&G/ R&D Special Items Other 1Q21 Operating Profit Comparison 31 |
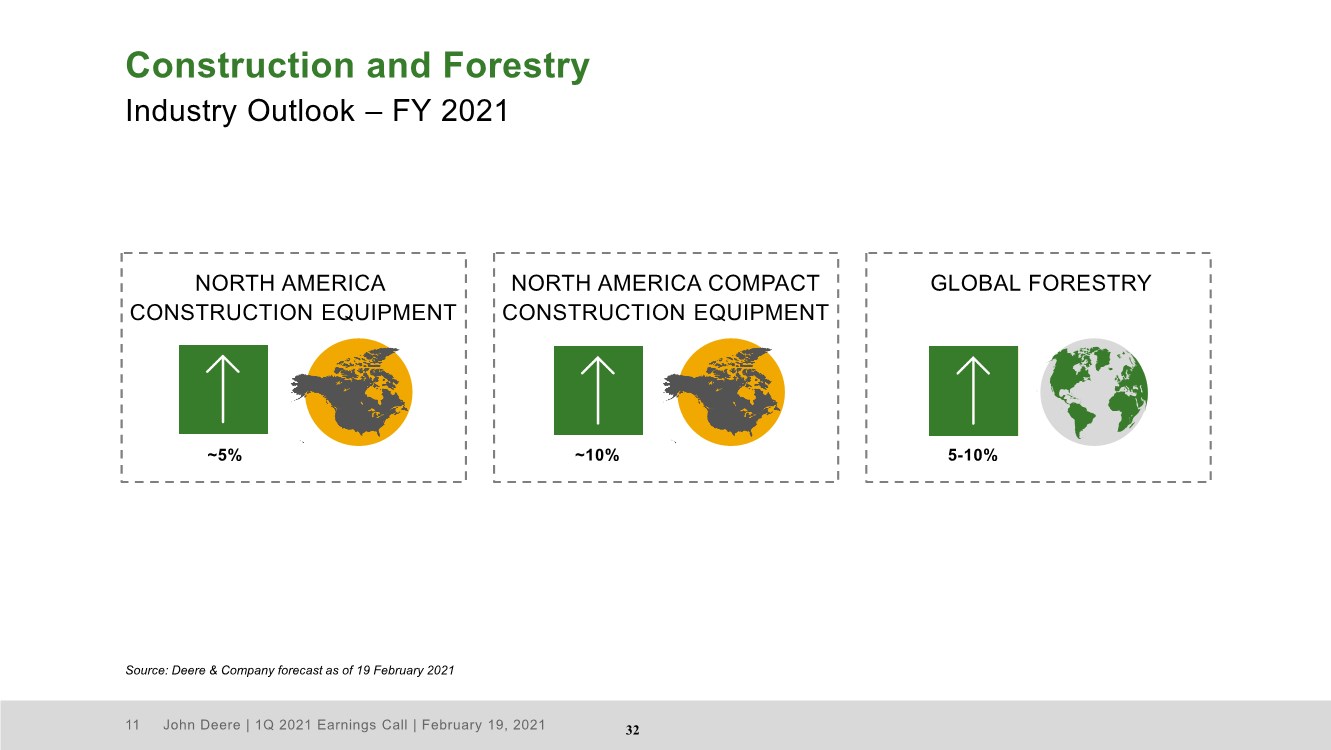
| John Deere | 1Q 2021 Earnings Call | February 19, 2021 11 Construction and Forestry Industry Outlook – FY 2021 Source: Deere & Company forecast as of 19 February 2021 NORTH AMERICA COMPACT CONSTRUCTION EQUIPMENT ~10% GLOBAL FORESTRY 5-10% NORTH AMERICA CONSTRUCTION EQUIPMENT ~5% 32 |
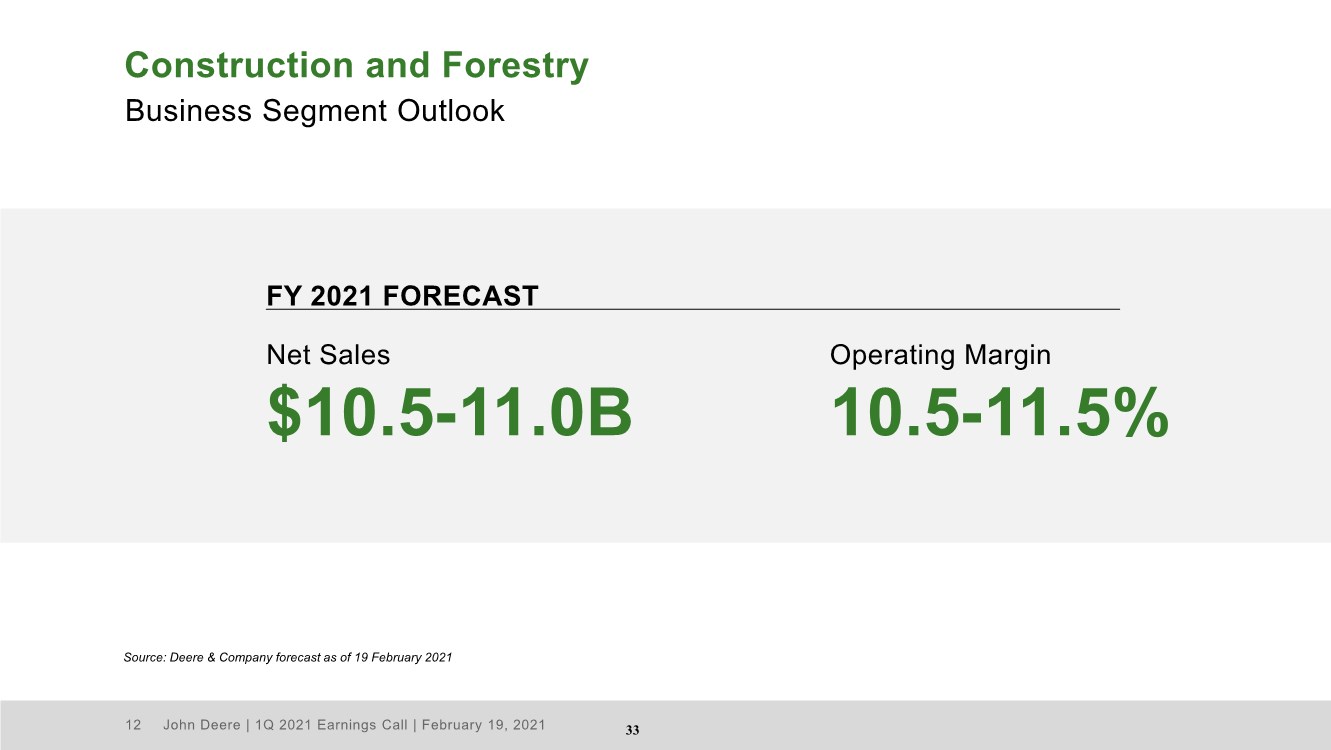
| John Deere | 1Q 2021 Earnings Call | February 19, 2021 12 Construction and Forestry Net Sales $10.5-11.0B FY 2021 FORECAST Operating Margin 10.5-11.5% Business Segment Outlook Source: Deere & Company forecast as of 19 February 2021 33 |
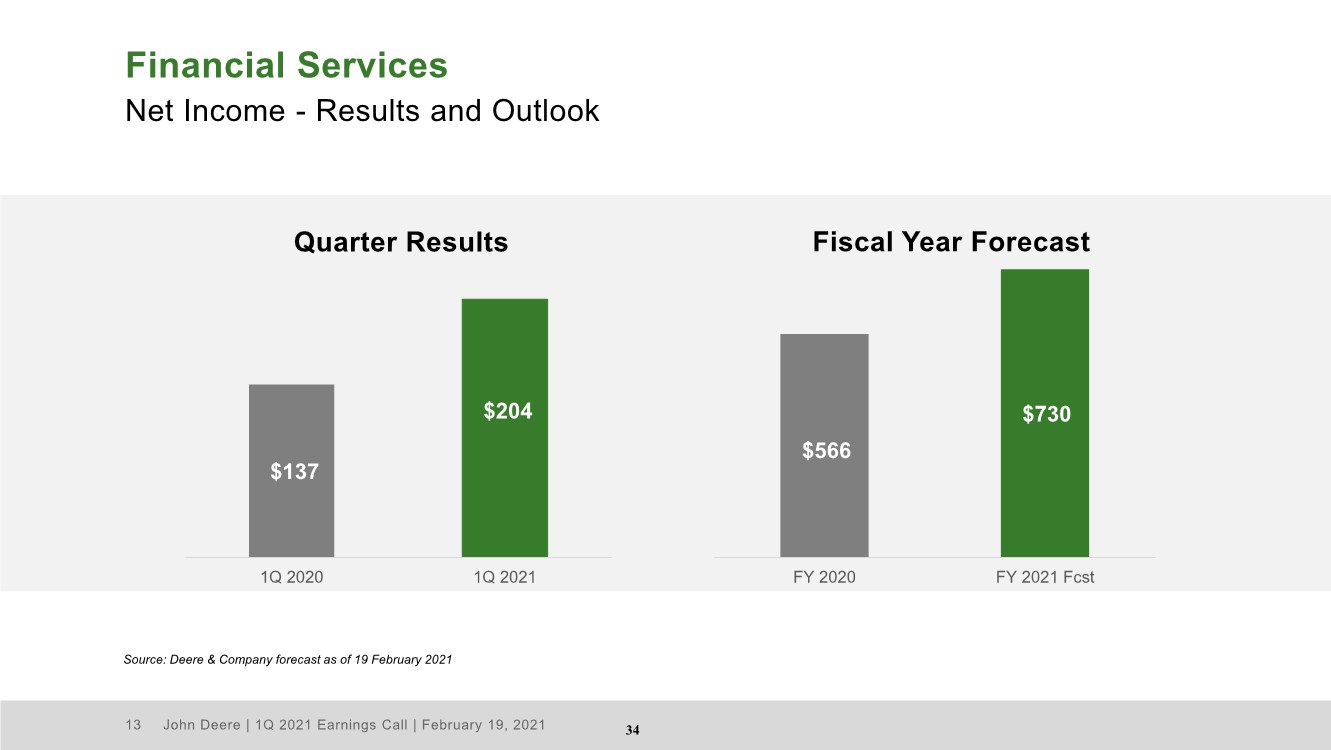
| John Deere | 1Q 2021 Earnings Call | February 19, 2021 13 Financial Services Net Income - Results and Outlook Source: Deere & Company forecast as of 19 February 2021 $137 $204 1Q 2020 1Q 2021 Quarter Results Fiscal Year Forecast $566 $730 FY 2020 FY 2021 Fcst 34 |
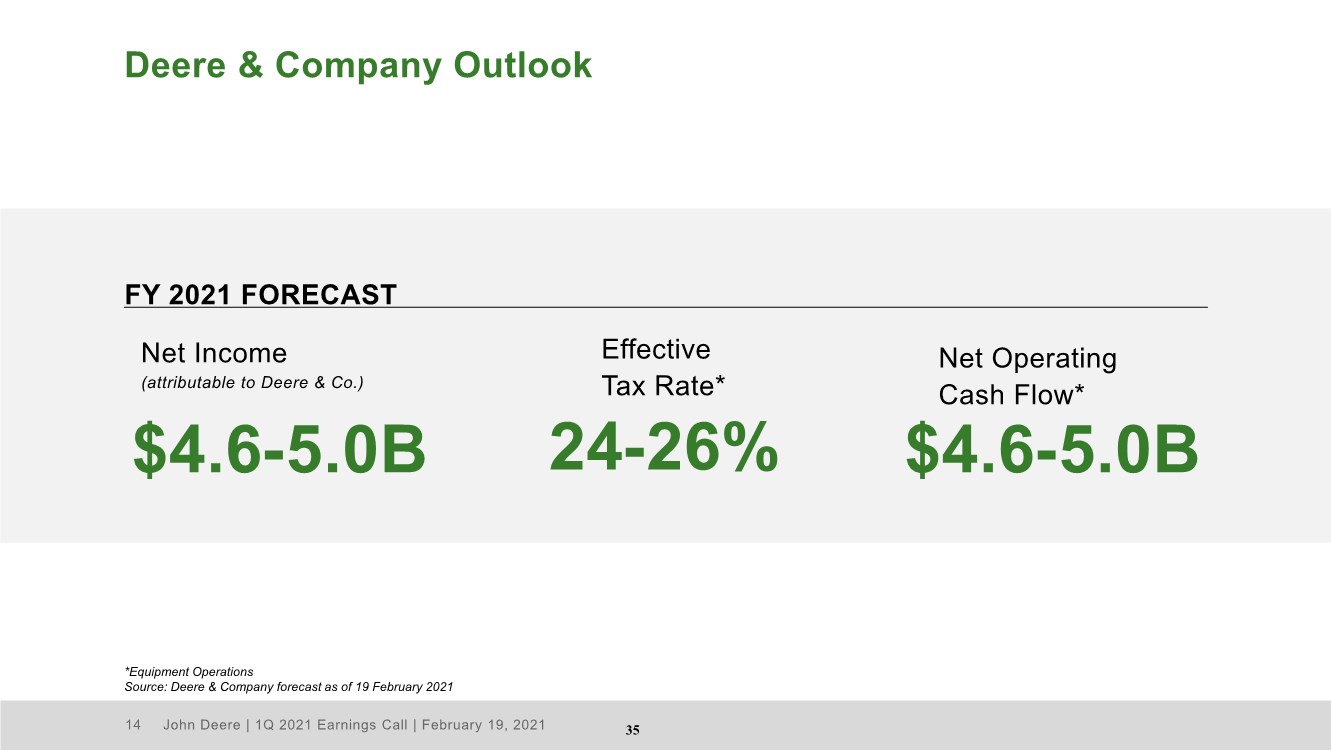
| John Deere | 1Q 2021 Earnings Call | February 19, 2021 14 Deere & Company Outlook Effective Tax Rate* Net Income (attributable to Deere & Co.) 24-26% $4.6-5.0B FY 2021 FORECAST Net Operating Cash Flow* $4.6-5.0B *Equipment Operations Source: Deere & Company forecast as of 19 February 2021 35 |
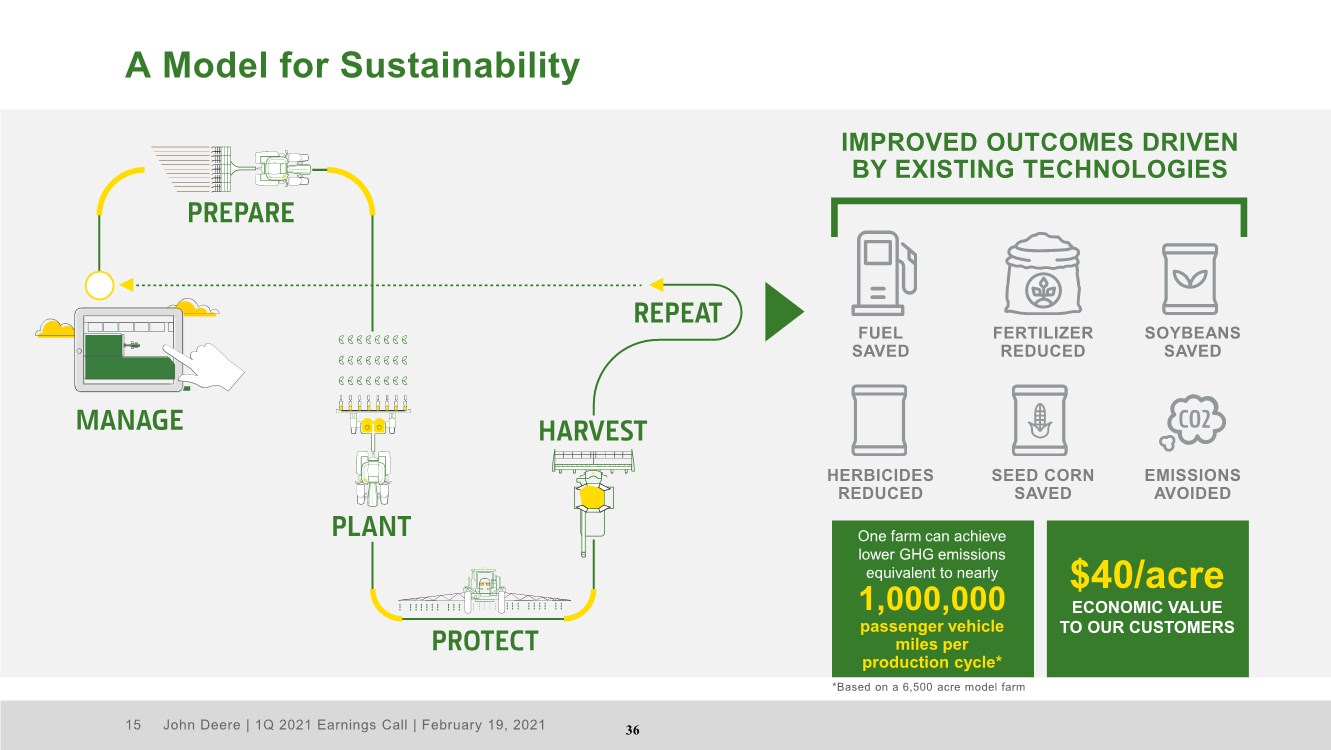
| John Deere | 1Q 2021 Earnings Call | February 19, 2021 15 FUEL SAVED FERTILIZER REDUCED SOYBEANS SAVED HERBICIDES REDUCED SEED CORN SAVED EMISSIONS AVOIDED IMPROVED OUTCOMES DRIVEN BY EXISTING TECHNOLOGIES $40/acre ECONOMIC VALUE TO OUR CUSTOMERS A Model for Sustainability One farm can achieve lower GHG emissions equivalent to nearly 1,000,000 passenger vehicle miles per production cycle* *Based on a 6,500 acre model farm 36 |
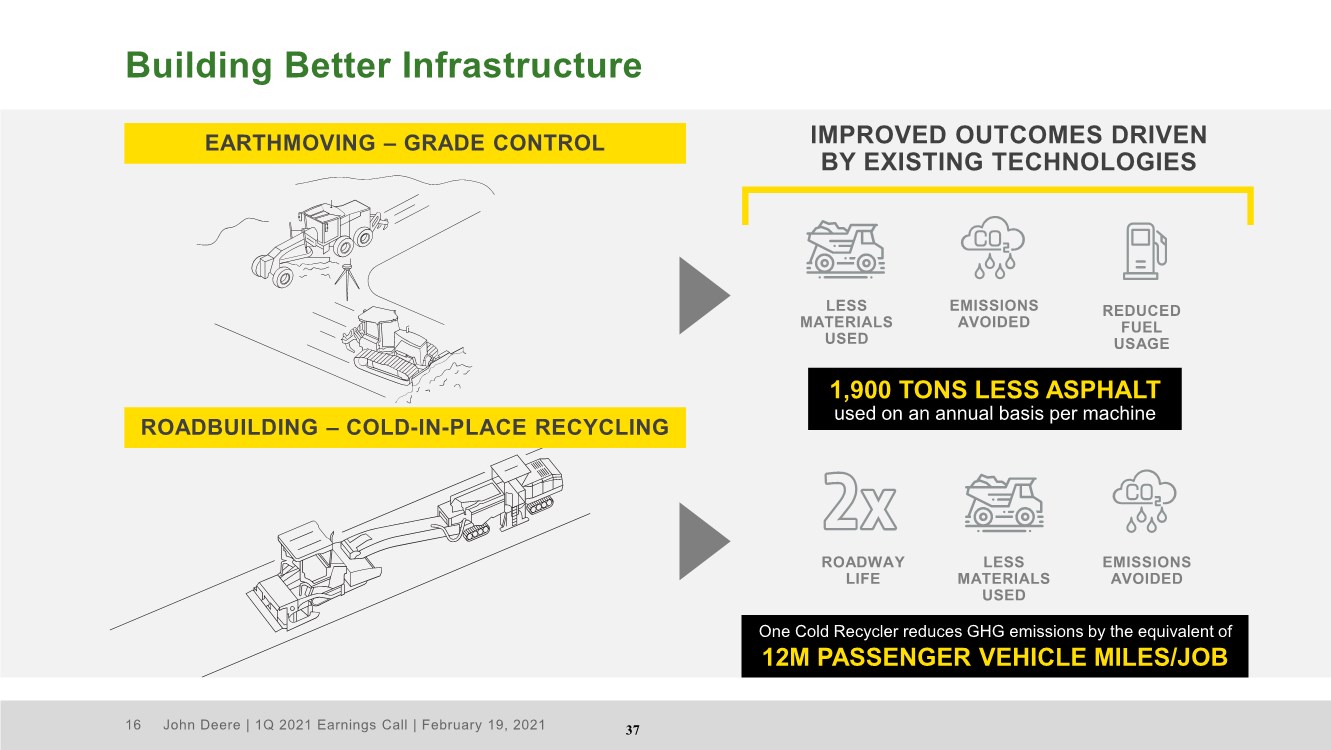
| John Deere | 1Q 2021 Earnings Call | February 19, 2021 16 REDUCED FUEL USAGE IMPROVED OUTCOMES DRIVEN BY EXISTING TECHNOLOGIES LESS MATERIALS USED EMISSIONS AVOIDED ROADWAY LIFE LESS MATERIALS USED EMISSIONS AVOIDED EARTHMOVING – GRADE CONTROL 1,900 TONS LESS ASPHALT used on an annual basis per machine One Cold Recycler reduces GHG emissions by the equivalent of 12M PASSENGER VEHICLE MILES/JOB Building Better Infrastructure ROADBUILDING – COLD-IN-PLACE RECYCLING 37 |
| John Deere | 1Q 2021 Earnings Call | February 19, 2021 17 OCCUPATIONAL SAFETY SUSTAINABLE ENERGY USE INCREASE RECYCLING PRODUCT SUSTAINABILITY PRODUCT INNOVATIONS COMMUNITY INVESTMENT Operating our Business in a Sustainable and Socially Responsible Manner 38 |

| John Deere | 1Q 2021 Earnings Call | February 19, 2021 18 Appendix 39 |
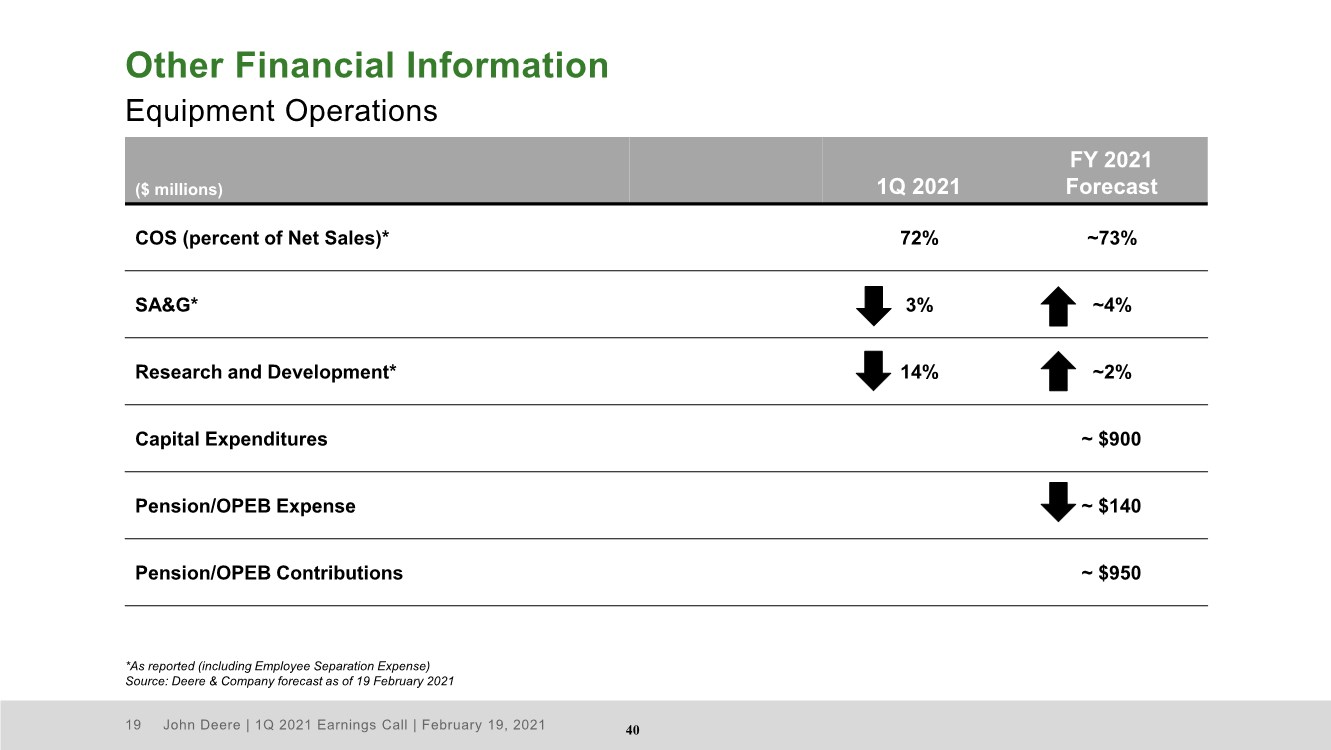
| John Deere | 1Q 2021 Earnings Call | February 19, 2021 19 ($ millions) 1Q 2021 FY 2021 Forecast COS (percent of Net Sales)* 72% ~73% SA&G* 3% ~4% Research and Development* 14% ~2% Capital Expenditures ~ $900 Pension/OPEB Expense ~ $140 Pension/OPEB Contributions ~ $950 Other Financial Information Equipment Operations *As reported (including Employee Separation Expense) Source: Deere & Company forecast as of 19 February 2021 40 |
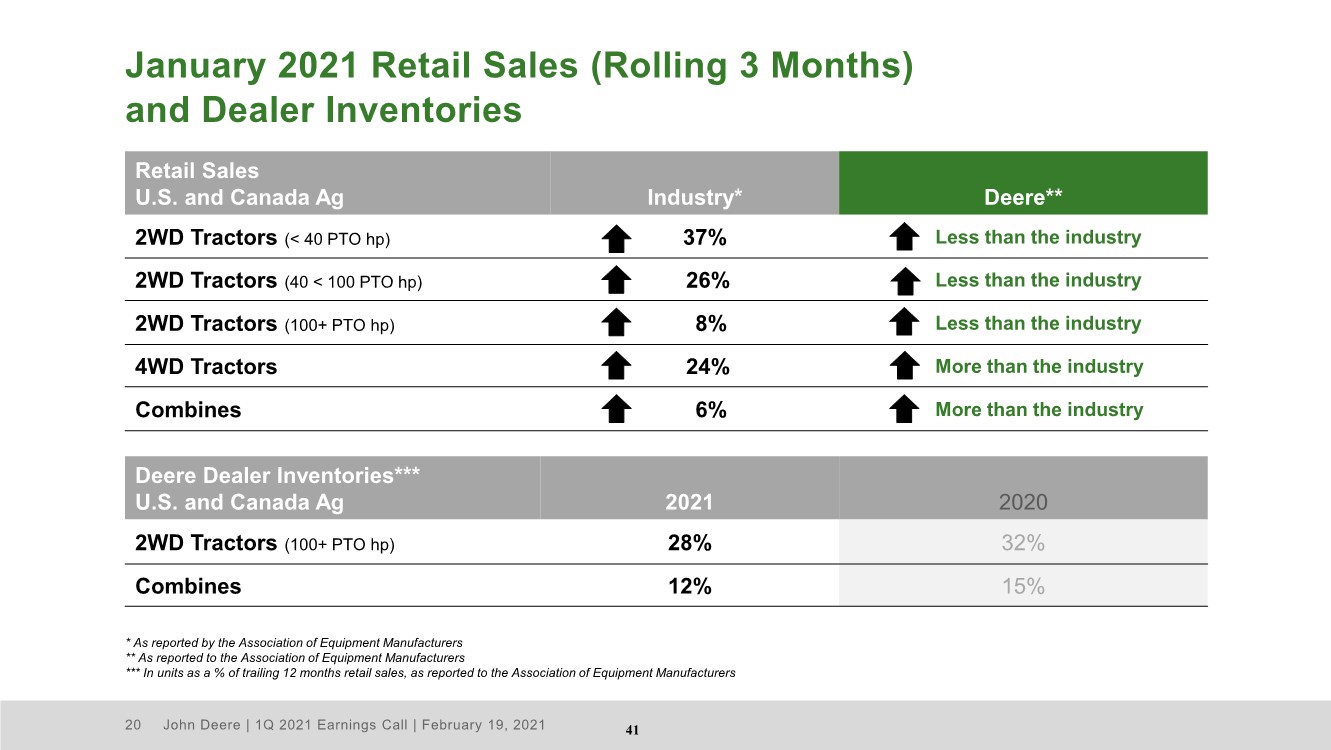
| John Deere | 1Q 2021 Earnings Call | February 19, 2021 20 January 2021 Retail Sales (Rolling 3 Months) and Dealer Inventories Retail Sales U.S. and Canada Ag Industry* Deere** 2WD Tractors (< 40 PTO hp) 37% Less than the industry 2WD Tractors (40 < 100 PTO hp) 26% Less than the industry 2WD Tractors (100+ PTO hp) 8% Less than the industry 4WD Tractors 24% More than the industry Combines 6% More than the industry Deere Dealer Inventories*** U.S. and Canada Ag 2021 2020 2WD Tractors (100+ PTO hp) 28% 32% Combines 12% 15% * As reported by the Association of Equipment Manufacturers ** As reported to the Association of Equipment Manufacturers *** In units as a % of trailing 12 months retail sales, as reported to the Association of Equipment Manufacturers 41 |
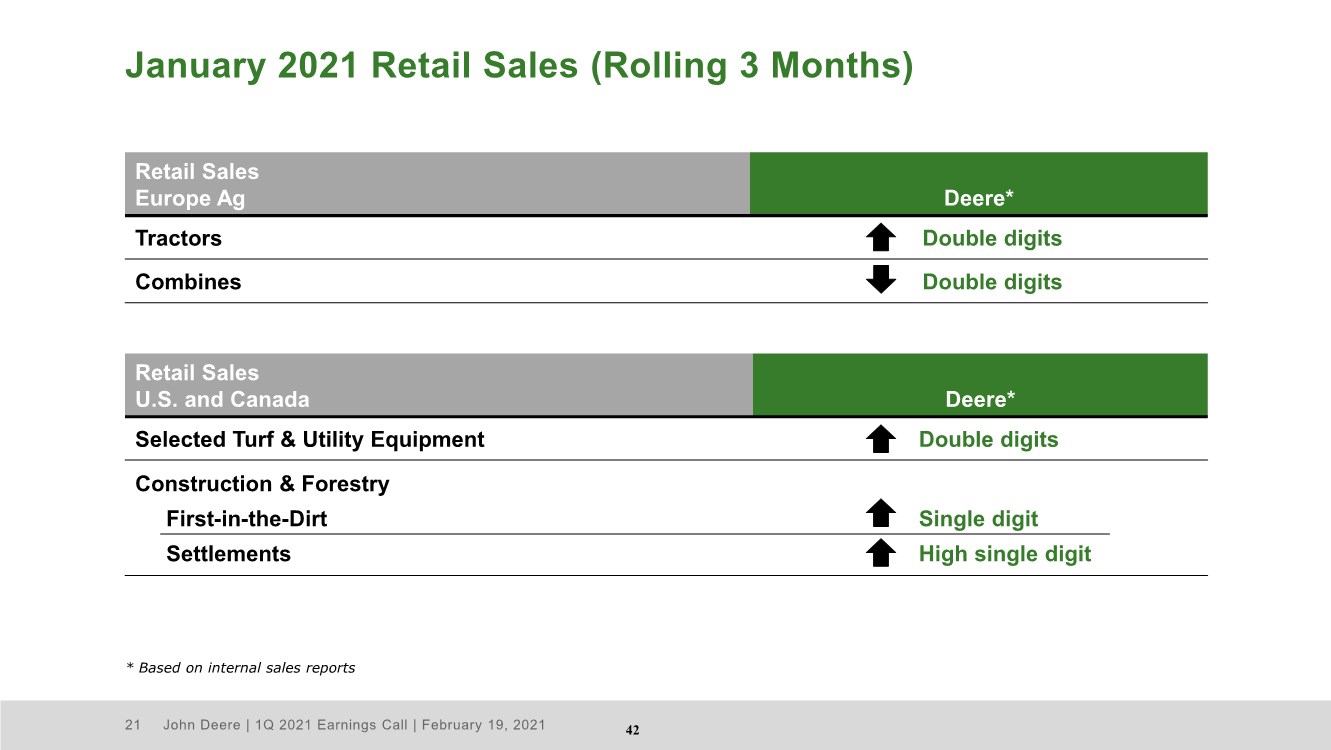
| John Deere | 1Q 2021 Earnings Call | February 19, 2021 21 Retail Sales U.S. and Canada Deere* Selected Turf & Utility Equipment Double digits Construction & Forestry First-in-the-Dirt Settlements Single digit High single digit January 2021 Retail Sales (Rolling 3 Months) Retail Sales Europe Ag Deere* Tractors Double digits Combines Double digits * Based on internal sales reports 42 |
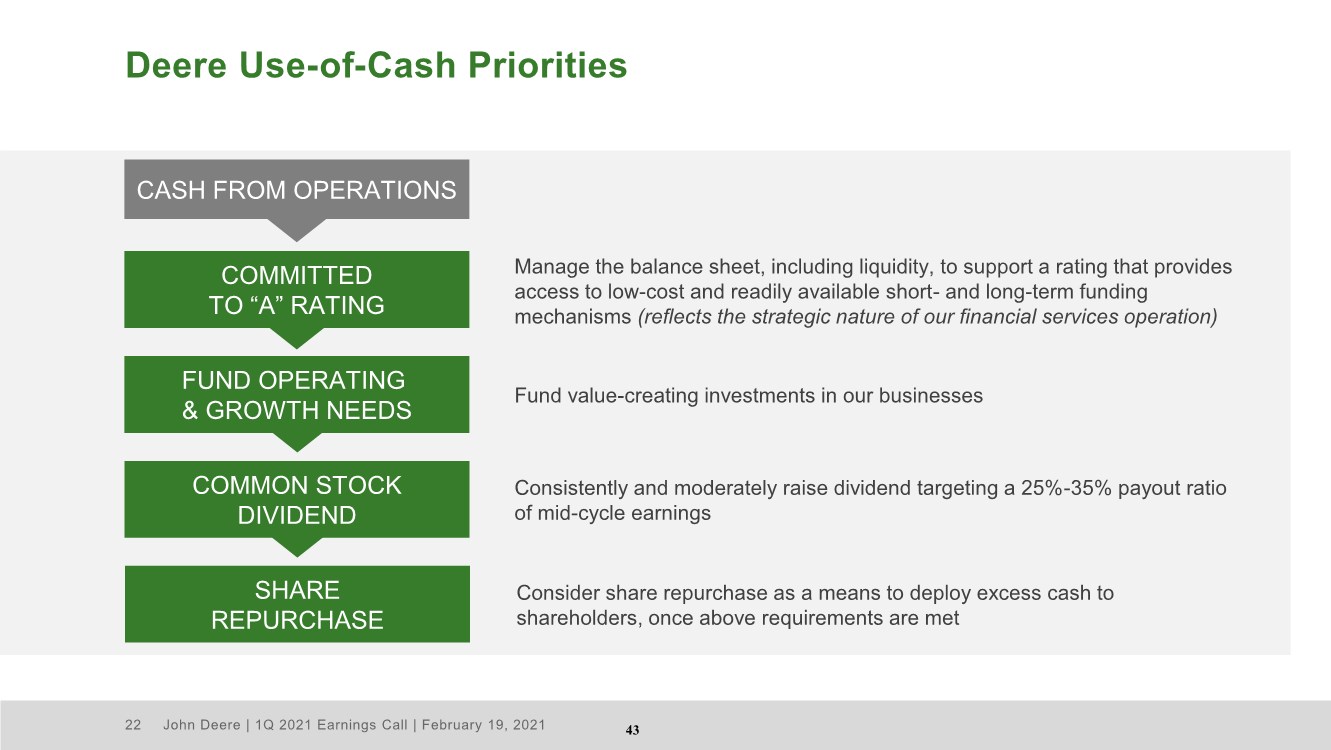
| John Deere | 1Q 2021 Earnings Call | February 19, 2021 22 Deere Use-of-Cash Priorities SHARE REPURCHASE Manage the balance sheet, including liquidity, to support a rating that provides access to low-cost and readily available short- and long-term funding mechanisms (reflects the strategic nature of our financial services operation) Fund value-creating investments in our businesses Consistently and moderately raise dividend targeting a 25%-35% payout ratio of mid-cycle earnings Consider share repurchase as a means to deploy excess cash to shareholders, once above requirements are met COMMITTED TO “A” RATING FUND OPERATING & GROWTH NEEDS COMMON STOCK DIVIDEND CASH FROM OPERATIONS 43 |
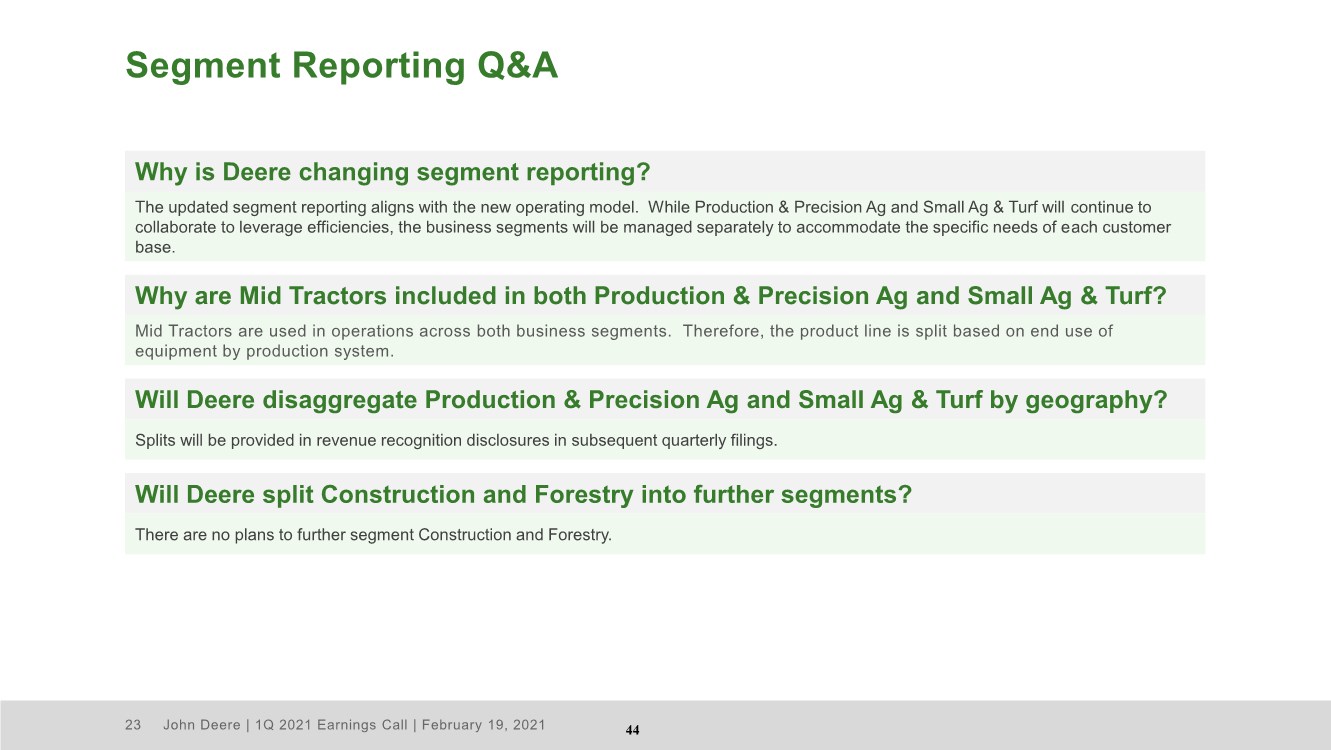
| John Deere | 1Q 2021 Earnings Call | February 19, 2021 23 Segment Reporting Q&A Why is Deere changing segment reporting? The updated segment reporting aligns with the new operating model. While Production & Precision Ag and Small Ag & Turf will continue to collaborate to leverage efficiencies, the business segments will be managed separately to accommodate the specific needs of each customer base. Why are Mid Tractors included in both Production & Precision Ag and Small Ag & Turf? Mid Tractors are used in operations across both business segments. Therefore, the product line is split based on end use of equipment by production system. Will Deere disaggregate Production & Precision Ag and Small Ag & Turf by geography? Splits will be provided in revenue recognition disclosures in subsequent quarterly filings. Will Deere split Construction and Forestry into further segments? There are no plans to further segment Construction and Forestry. 44 |
| John Deere | 1Q 2021 Earnings Call | February 19, 2021 24 Sustainability We run so life can leap forward. For additional information please view the 2020 Sustainability Report at: https://www.deere.com/en/our-company/sustainability/ 45 |
| John Deere | 1Q 2021 Earnings Call | February 19, 2021 25 Deere & Company’s 2Q 2021 earnings call is scheduled for 9:00 a.m. central time on Friday, 21 May 2021. 46 |

| 47 |