Attached files
| file | filename |
|---|---|
| EX-32.2 - EX-32.2 - PPG INDUSTRIES INC | ppg202010kex322.htm |
| EX-32.1 - EX-32.1 - PPG INDUSTRIES INC | ppg202010kex321.htm |
| EX-31.2 - EX-31.2 - PPG INDUSTRIES INC | ppg202010kex312.htm |
| EX-31.1 - EX-31.1 - PPG INDUSTRIES INC | ppg202010kex311.htm |
| EX-24 - EX-24 - PPG INDUSTRIES INC | ppg2020ex24-powerofattorney.htm |
| EX-23 - EX-23 - PPG INDUSTRIES INC | ppg2020ex23-consentofindep.htm |
| EX-21 - EX-21 - PPG INDUSTRIES INC | ppg2020ex21-subsidiariesof.htm |
| EX-13.2 - EX-13.2 - PPG INDUSTRIES INC | ppg2020ex132-selectedfinan.htm |
| EX-4.10 - EX-4.10 - PPG INDUSTRIES INC | ppg2020ex410-descriptionof.htm |
| 10-K - 10-K - PPG INDUSTRIES INC | ppg-20201231.htm |
Exhibit 13.1
PPG INDUSTRIES, INC. AND CONSOLIDATED SUBSIDIARIES
Market Information, Dividends, Holders of Common Stock and Stock Performance Graph
For the Year Ended December 31, 2020
Market Information
PPG common stock is traded on the New York Stock Exchange (symbol:PPG).
Quarterly Stock Market Price
| 2020 | 2019 | ||||||||||||||||||||||
| Quarter Ended | High | Low | High | Low | |||||||||||||||||||
| March 31 | $134.16 | $69.77 | $113.31 | $96.82 | |||||||||||||||||||
| June 30 | $116.45 | $78.01 | $121.29 | $104.44 | |||||||||||||||||||
| September 30 | $131.09 | $103.58 | $121.00 | $105.99 | |||||||||||||||||||
| December 31 | $149.88 | $120.00 | $134.36 | $112.02 | |||||||||||||||||||
Dividends
| $ in millions, except per share data | 2020 | 2019 | |||||||||||||||||||||
| Month of Payment | $ | Per Share | $ | Per Share | |||||||||||||||||||
| March | $120 | $0.51 | $113 | $0.48 | |||||||||||||||||||
| June | 121 | 0.51 | 114 | 0.48 | |||||||||||||||||||
| September | 127 | 0.54 | 120 | 0.51 | |||||||||||||||||||
| December | 128 | 0.54 | 121 | 0.51 | |||||||||||||||||||
| Total | $496 | $2.10 | $468 | $1.98 | |||||||||||||||||||
PPG has paid uninterrupted annual dividends since 1899. The latest quarterly dividend of 54 cents per share was approved by the board of directors on January 21, 2021, payable March 12, 2021 to shareholders of record February 19, 2021.
Holders of Common Stock
The number of holders of record of PPG common stock as of January 31, 2021 was 13,448 as shown on the records of the Company’s transfer agent.
Stock Performance Graph
The following graph compares the yearly percentage changes in the cumulative total shareholder value return of the company’s common stock with the cumulative total return of the Standard & Poor’s Composite 500 Stock Index (“S&P 500”) and a defined Peer Group, for the five-year period beginning December 31, 2015 and ending December 31, 2020. This graph assumes that the investment in the company’s common stock and each index was $100 on December 31, 2015 and that all dividends were reinvested.
The Peer Group includes 3M Co., AkzoNobel N.V., Axalta Coatings Systems Ltd., Dow Chemical, DowDupont Inc. (2017-2019), Eastman Chemical Co., Masco Corp., RPM International Inc., and The Sherwin-Williams Co.
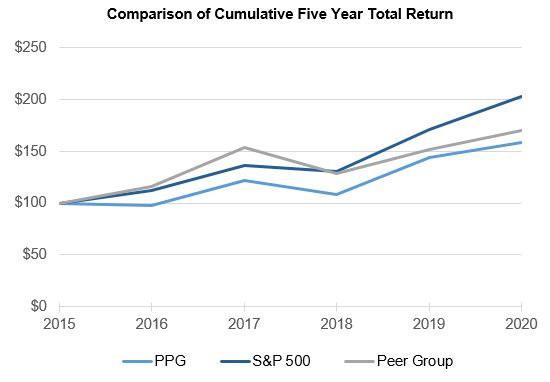
The following table summarizes stock performance graph data points in dollars:
| December 31, | |||||||||||||||||||||||||||||||||||
| 2015 | 2016 | 2017 | 2018 | 2019 | 2020 | ||||||||||||||||||||||||||||||
| PPG | $100 | $97 | $122 | $108 | $144 | $158 | |||||||||||||||||||||||||||||
| S&P 500 | $100 | $112 | $136 | $130 | $171 | $203 | |||||||||||||||||||||||||||||
| Peer Group | $100 | $116 | $154 | $129 | $152 | $170 | |||||||||||||||||||||||||||||