Attached files
| file | filename |
|---|---|
| EX-99.1 - EXHIBIT 99.1 - LTC PROPERTIES INC | tm2037545d1_ex99-1.htm |
| 8-K - FORM 8-K - LTC PROPERTIES INC | tm2037545d1_8k.htm |
Exhibit 99.2
SUPPLEMENTAL OPERATING and FINANCIAL DATA FOURTH QUARTER 2020 North Kansas City Health Retreat Kansas City, MO

4Q 2020 SUPPLEMENTAL REPORT FORWARD - LOOKING STATEMENTS This supplemental information contains forward - looking statements within the meaning of Section 27 A of the Securities Act of 1933 , as amended, and Section 21 E of the Securities Exchange Act of 1934 , as amended, adopted pursuant to the Private Securities Litigation Reform Act of 1995 . Statements that are not purely historical may be forward - looking . You can identify some of the forward - looking statements by their use of forward - looking words, such as ‘‘believes,’’ ‘‘expects,’’ ‘‘may,’’ ‘‘will,’’ ‘‘should,’’ ‘‘seeks,’’ ‘‘approximately,’’ ‘‘intends,’’ ‘‘plans,’’ ‘‘estimates’’ or ‘‘anticipates,’’ or the negative of those words or similar words . Forward - looking statements involve inherent risks and uncertainties regarding events, conditions and financial trends that may affect our future plans of operation, business strategy, results of operations and financial position . A number of important factors could cause actual results to differ materially from those included within or contemplated by such forward - looking statements, including, but not limited to, the status of the economy, the status of capital markets (including prevailing interest rates), and our access to capital ; the income and returns available from investments in health care related real estate, the ability of our borrowers and lessees to meet their obligations to us, our reliance on a few major operators ; competition faced by our borrowers and lessees within the health care industry, regulation of the health care industry by federal, state and local governments, changes in Medicare and Medicaid reimbursement amounts (including due to federal and state budget constraints), compliance with and changes to regulations and payment policies within the health care industry, debt that we may incur and changes in financing terms, our ability to continue to qualify as a real estate investment trust, the relative illiquidity of our real estate investments, potential limitations on our remedies when mortgage loans default, and risks and liabilities in connection with properties owned through limited liability companies and partnerships . For a discussion of these and other factors that could cause actual results to differ from those contemplated in the forward - looking statements, please see the discussion under ‘‘Risk Factors’’ and other information contained in our Annual Report on Form 10 - K for the fiscal year ended December 31 , 2020 and in our publicly available filings with the Securities and Exchange Commission . We do not undertake any responsibility to update or revise any of these factors or to announce publicly any revisions to forward - looking statements, whether as a result of new information, future events or otherwise . NON - GAAP INFORMATION This supplemental information contains certain non - GAAP information including EBITDA re , adjusted EBITDA re , FFO, FFO excluding non - recurring items, FAD, FAD excluding non - recurring items, adjusted interest coverage ratio, and adjusted fixed charges coverage ratio . A reconciliation of this non - GAAP information is provided on pages 21 , 24 and 25 of this supplemental information, and additional information is available under the “Non - GAAP Financial Measures” subsection under the “Selected Financial Data” section of our website at www . LTCreit . com . COMPANY Company Information & Leadership 3 INVESTMENTS Real Estate Activities Investments and Capital Recycling 4 Acquisitions and Loan Originations 5 Mezzanine Loans and Joint Ventures 6 Lease-Up and Renovations 7 Lease-Up History 8 PORTFOLIO Overview 9 Metrics 10 Diversification Geography, MSA, Age of Portfolio 11-12 Operators 13-14 Update 15 Maturity 16 FINANCIAL Enterprise Value 17 Debt Metrics 18 Debt Maturity 19 Financial Data Summary 20-21 Income Statement Data 22 Consolidated Balance Sheets 23 Funds from Operations 24-25 GLOSSARY Glossary 26-27 TABLE OF CONTENTS 2

4Q 2020 SUPPLEMENTAL REPORT 3 Founded in 1992 , LTC Properties, Inc . (NYSE : LTC) is a self - administered real estate investment trust (REIT) investing in seniors housing and health care properties primarily through sale - leaseback transactions, mortgage financing and structured finance solutions including preferred equity and mezzanine’s portfolio encompasses Skilled Nursing Facilities (SNF), Assisted Living Communities (ALF), Independent Living Communities (ILF), Memory Care Communities (MC) and combinations thereof . Our main objective is to build and grow a diversified portfolio that creates and sustains shareholder value while providing our stockholders current distribution income . To meet this objective, we seek properties operated by regional operators, ideally offering upside and portfolio diversification (geographic, operator, property type and investment vehicle) . For more information, visit www . LTCreit . com . Any opinions, estimates, or forecasts regarding LTC’s performance made by the analysts listed above do not represent the opinions, estimates, and forecasts of LTC or its management. WENDY SIMPSON Chairman BOYD HENDRICKSON Lead Independent Director Nominating & Corporate Governance Committee Chairman DEVRA SHAPIRO Audit Committee Chairman TIMOTHY TRICHE, MDCompensation Committee Chairman JAMES PIECZYNSKI CONNOR SIVERSKY Berenberg Capital Markets JUAN SANABRIA BMO Capital Markets Corp. DANIEL BERNSTEIN CapitalOne AARON HECHT JMP Securities, LLC JORDAN SADLER KeyBanc Capital Markets, Inc. OMOTAYO OKUSANYAMizuho Securities USA LLC MIKE CARROLL RBC Capital Markets Corporation RICHARD ANDERSONSMBC Nikko Securities STEVE MANAKER Stifel, Nicolaus & Company, Inc. TODD STENDER Wells Fargo Securities, LLC BOARD OF DIRECTORS ANALYSTS WENDY SIMPSON Chairman and Chief Executive Officer PAM KESSLER Co - President, CFO and Secretary CLINT MALIN Co - President and Chief Investment Officer CECE CHIKHALE Executive Vice President, Chief Accounting Officer, and Treasurer DOUG KOREY Executive Vice President, Managing Director of Business Development PETER LYEW Vice President, Director of Taxes GIBSON SATTERWHITE Senior Vice President, Asset Management MANDI HOGAN Vice President, Marketing & Investor Relations MIKE BOWDEN Vice President, Investments LEADERSHIP RACHEL SON Vice President and Controller LTC PROPERTIES, INC. 2829 Townsgate Road Suite 350 Westlake Village, CA 91361 805 - 981 - 8655 www.LTCreit.com TRANSFER AGENT Broadridge Shareholder Services c/o Broadridge Corporate Issuer Solutions 1155 Long Island Avenue Edgewood, NY 11717 - 8309 ATTN: IWS 866 - 708 - 5586

4Q 2020 SUPPLEMENTAL REPORT Million $ 273.2 Total Sales (1) (1) Reflects total sales price. INVESTMENTS I 4 Million 131.8 Total Gains $ Billion $ 1.5 Total Investments $0 $50 $100 $150 $200 $250 $300 $350 $400 $450 2010 2011 2012 2013 2014 2015 2016 2017 2018 2019 2020 Investments Sales MILLION REAL ESTATE ACTIVITIES – INVESTMENTS AND CAPITAL RECYCLING SINCE 2010

4Q 2020 SUPPLEMENTAL REPORT STATED # OF PROPERTY # BEDS/ LOAN MATURITY FUNDED AT INTEREST PROPERTIES TYPE UNITS LOCATION TYPE DATE OPERATOR ORIGINATION ORIGINATION RATE 2019 6/20 2 SNF 205 beds East Lansing, MI (1) Mortgage Jan-2045 Prestige Healthcare 7,500$ 7,500$ 9.41% 2020 6/2 4 SNF 501 beds Various in MI (2) Mortgage Oct-2045 Prestige Healthcare 2,000$ 2,000$ 8.89% DATE (1) Commitments may include capital improvement or development allowances for approved projects but excludes incentive payments a nd contingent payments. For a comprehensive list of our commitments, see our Annual Report on Form 10 - K. (2) We entered into a JV to purchase and lease an operational 74 - unit ALF/MC community. The non - controlling partner contributed $919 of equity and we contributed $15,976 in cash at closing. LTC’s economic interest in the JV is approximately 95%. We account for the JV on a consolidated basis. See page 6 for a list of our joint ventures. (3) We acquired a 90 - bed post - acute skilled nursing center in Kansas City, MO. We also acquired a parcel of land and developed a 90 - bed post - acute skilled nursing center in Independence, MO. See page 7 for lease - up activities. (4) Capital improvement commitment is available to both properties for a total of $2,285 at 7.40%. (1) We funded additional loan proceeds of $7,500 under an existing mortgage loan. The incremental funding bears interest at 9.41% , f ixed for two years, and escalating annually by 2.25% thereafter. (2) We funded additional loan proceeds of $2,000 under an existing mortgage loan. The incremental funding bears interest at 8.89% , e scalating annually by 2.25% thereafter. ACQUISITIONS LOAN ORIGINATIONS CONTRACTUAL # OF PROPERTY # BEDS/ DATE OF INITIAL PURCHASE PROPERTIES TYPE UNITS LOCATION OPERATOR CONSTRUCTION CASH YIELD PRICE 2019 1/31 1 ALF/MC 74 units Abingdon, VA English Meadows Senior Living 2015 7.40% 16,719$ (2) —$ 8/15 1 SNF (3) 90 beds Kansas City, MO Ignite Medical Resorts 2018 8.25% 19,500 — 8/23 1 UDP (3) 90 beds Independence, MO Ignite Medical Resorts 2019-2020 9.25% 2,622 14,752 12/31 1 ALF/MC 76 units Auburn Hills, MI Randall Residence 1995 7.40% 6,486 2,285 (4) 12/31 1 MC 80 units Sterling Heights, MI Randall Residence 1997 7.40% 12,514 — (4) 5 230 units / 180 beds 57,841$ 17,037$ 2020 1/10 1 SNF 140 beds Longview, TX HMG Healthcare 2014 8.50% 13,500$ —$ ADDITIONAL DATE COMMITMENT (1) 5 INVESTMENTS I REAL ESTATE ACTIVITIES – ACQUISITIONS AND LOAN ORIGINATIONS (DOLLAR AMOUNTS IN THOUSANDS)

4Q 2020 SUPPLEMENTAL REPORT INVESTMENT PROPERTY # BEDS/ YEAR LOCATION OPERATOR TYPE INVESTMENT PURPOSE UNITS 2017 Cedarburg, WI Tealwood Senior Living ALF/MC/ILF Owned Real Estate & Development 110 units 22,244$ 2,305$ 19,939$ 2017 Spartanburg, SC ALG Senior ALF Owned Real Estate 87 units 11,660 1,241 10,419 197 units 33,904 3,546 30,358 2018 Medford, OR Fields Senior Living (1) ALF/MC Owned Real Estate & Development 78 units 17,871 1,081 16,790 2018 Medford, OR Fields Senior Living (1) ILF Owned Real Estate 89 units 14,401 2,858 11,543 167 units 32,272 3,939 28,333 2019 Abingdon, VA English Meadows Senior Living ALF/MC Owned Real Estate 74 units 16,895 919 15,976 438 units 83,071$ 8,404$ 74,667$ CONTRIBUTION LTCJOINT VENTURES INTEREST TOTAL NON-CONTROLLING CONTRIBUTIONCOMMITMENT (1) Represents a single joint venture with ownership in two properties. (1) The initial cash rate is 7.00% increasing to 9.00% in year four until the IRR is 8.00%. After achieving an 8.00% IRR, the cas h r ate drops to 8.00% with an IRR ranging between of 12.00% and 14.00% depending upon timing of redemption. Our investment represents 15.50% of the total estimated project cost. (2) The initial cash rate is 8.00% with an IRR of 12.00%. Our investment represents 11.60% of the total estimated project cost. MEZZANINE LOANS CONSOLIDATED JOINT VENTURES UNCONSOLIDATED JOINT VENTURES PROPERTY MATURITY LOCATION PROPERTIES OPERATOR TYPE DATE 2018 Various 15 Genesis Healthcare SNF Mezzanine Nov 2021 11.90% 1,934 beds 1,618$ 2018 Atlanta, GA 1 Village Park Senior Living ALF/MC/ILF Mezzanine Dec 2023 8.00% (1) 204 units 6,828 16 8,446$ # BEDS/ INVESTMENT YEAR TYPE RETURN UNITS BALANCE 1,934 beds/204 units COMMITMENT INVESTMENT PROPERTY MATURITY # BEDS/ LOCATION PROPERTIES OPERATOR TYPE DATE UNITS 2020 Arlington, WA 1 Fields Senior Living UDP-AL/MC Preferred Equity N/A 7.00% (1) 95 units 6,340$ —$ 6,340$ —$ 2020 Vancouver, WA 1 Koelsch Communities UDP-IL/AL Preferred Equity N/A 8.00% (2) 267 units 13,000 5,000 5,000 8,000 2 362 units 19,340$ 5,000$ 11,340$ 8,000$ YEAR TYPE COMMITMENTRETURN COMMITMENT TOTAL TO DATE REMAINING FUNDING COMMITMENT INVESTMENT INVESTMENT 4Q20 FUNDED INVESTMENTS I 6 REAL ESTATE ACTIVITIES – MEZZANINE AND JOINT VENTURES (DOLLAR AMOUNTS IN THOUSANDS) (1) The initial cash rate is 8% with a 12% IRR. Our investment represents 5% of the total estimated project cost.
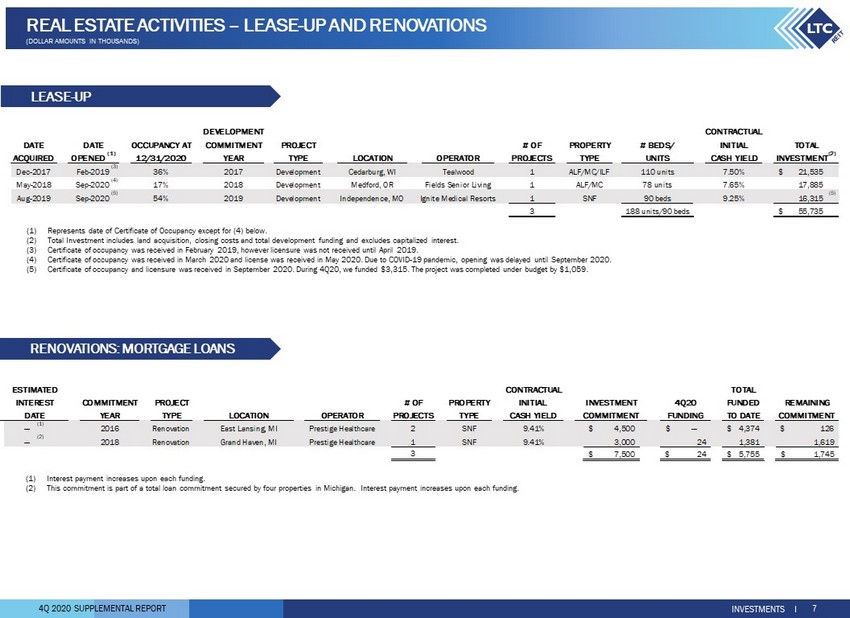
4Q 2020 SUPPLEMENTAL REPORT (1) Interest payment increases upon each funding. (2) This commitment is part of a total loan commitment secured by four properties in Michigan. Interest payment increases upon e ach funding. (1) Represents date of Certificate of Occupancy except for (4) below. (2) Total Investment includes land acquisition, closing costs and total development funding and excludes capitalized interest. (3) Certificate of occupancy was received in February 2019, however licensure was not received until April 2019. (4) Certificate of occupancy was received in March 2020 and license was received in May 2020. Due to COVID - 19 pandemic, opening was delayed until September 2020. (5) Certificate of occupancy and licensure was received in September 2020. During 4Q20, we funded $3,315. The project was complet ed under budget by $1,059. DEVELOPMENT CONTRACTUAL DATE DATE OCCUPANCY AT COMMITMENT PROJECT # OF PROPERTY # BEDS/ INITIAL ACQUIRED OPENED (1) 12/31/2020 YEAR TYPE LOCATION OPERATOR PROJECTS TYPE UNITS CASH YIELD Dec-2017 Feb-2019 (3) 36% 2017 Development Cedarburg, WI Tealwood 1 ALF/MC/ILF 110 units 7.50% 21,535$ May-2018 Sep-2020 (4) 17% 2018 Development Medford, OR Fields Senior Living 1 ALF/MC 78 units 7.65% 17,885 Aug-2019 Sep-2020 (5) 54% 2019 Development Independence, MO Ignite Medical Resorts 1 SNF 90 beds 9.25% 16,315 (5) 3 188 units/90 beds 55,735$ INVESTMENT (2) TOTAL LEASE - UP RENOVATIONS: MORTGAGE LOANS INVESTMENTS I 7 REAL ESTATE ACTIVITIES – LEASE - UP AND RENOVATIONS (DOLLAR AMOUNTS IN THOUSANDS) CONTRACTUAL TOTAL COMMITMENT PROJECT # OF PROPERTY INITIAL INVESTMENT 4Q20 FUNDED REMAINING YEAR TYPE LOCATION OPERATOR PROJECTS TYPE CASH YIELD TO DATE COMMITMENT — (1) 2016 Renovation East Lansing, MI Prestige Healthcare 2 SNF 9.41% 4,500$ —$ 4,374$ 126$ — (2) 2018 Renovation Grand Haven, MI Prestige Healthcare 1 SNF 9.41% 3,000 24 1,381 1,619 3 7,500$ 24$ 5,755$ 1,745$ INCEPTION DATE COMMITMENT FUNDING INTEREST ESTIMATED

4Q 2020 SUPPLEMENTAL REPORT PROPERTY PROJECT # BEDS/ DATE DATE DATE PROPERTY LOCATION OPERATOR TYPE TYPE UNITS ACQUIRED OPENED (1) STABILIZED Highline Place Littleton, CO Anthem MC Development 60 units May-2012 Jul-2013 Sep-2013 2 Willowbrook Place - Kipling Littleton, CO Anthem MC Development 60 units Sep-2013 Aug-2014 Dec-2015 16 Chelsea Place Aurora, CO Anthem MC Development 48 units Sep-2013 Dec-2014 Mar-2016 15 Greenridge Place Westminster, CO Anthem MC Development 60 units Dec-2013 Feb-2015 Feb-2017 24 (2) Harvester Place Burr Ridge, IL Anthem MC Development 66 units Oct-2014 Feb-2016 Feb-2018 24 (2) Vineyard Place Murrieta, CA Anthem MC Development 66 units Sep-2015 Aug-2016 Aug-2018 24 (2) Porter Place Tinley Park, IL Anthem MC Development 66 units May-2015 Jul-2016 Jul-2018 24 (2) Emerald Place Glenview, IL Anthem MC Development 66 units Oct-2015 Dec-2017 Dec-2019 24 (2) Grace Point Place Oak Lawn, IL Anthem MC Development 66 units Oct-2016 Jun-2018 Jun-2020 24 (2) Coldspring Transitional Care Center Cold Spring, KY Carespring SNF Development 143 beds Dec-2012 Nov-2014 Jun-2016 19 Boonespring Healthcare Center Union, KY Carespring SNF Development 143 beds Sep-2016 Feb-2019 Dec-2019 10 Hillside Heights Rehabilitation Suites Amarillo, TX Fundamental SNF Redevelopment 120 beds Oct-2011 Jul-2013 Aug-2013 1 Pavilion at Glacier Valley Slinger, WI Fundamental SNF Redevelopment 106 beds Feb-2015 Feb-2014 Feb-2016 24 (2) Pavilion at Creekwood Mansfield, TX Fundamental SNF Acquisition 126 beds Feb-2016 Jul-2015 Feb-2017 12 Carmel Village Memory Care Clovis, CA Generations MC/ILF Acquisition 73 units Jun-2017 Sep-2016 Jun-2018 12 Carmel Village at Clovis Clovis, CA Generations ALF Acquisition 107 units Jun-2017 Nov-2014 Jun-2018 12 Mustang Creek Estates Frisco, TX Mustang Creek Mgmt ALF/MC Development 80 units Dec-2012 Oct-2014 Dec-2015 14 The Oxford Grand Wichita, KS Oxford Senior Living ALF/MC Development 77 units Oct-2012 Oct-2013 Sep-2014 11 Oxford Villa Wichita, KS Oxford Senior Living ILF Development 108 units May-2015 Nov-2016 Nov-2018 24 (2) Oxford Kansas City Kansas City, MO Oxford Senior Living ALF/MC Acquisition 73 units Oct-2017 Aug-2017 Jun-2019 22 STABILIZATION TO # OF MONTHS (1) Represents date of Certificate of Occupancy. (2) Although this property met our definition of stabilization on page 27 based on the time criteria, it did not meet the occupan cy threshold. INVESTMENTS I 8 REAL ESTATE ACTIVITIES – LEASE - UP HISTORY
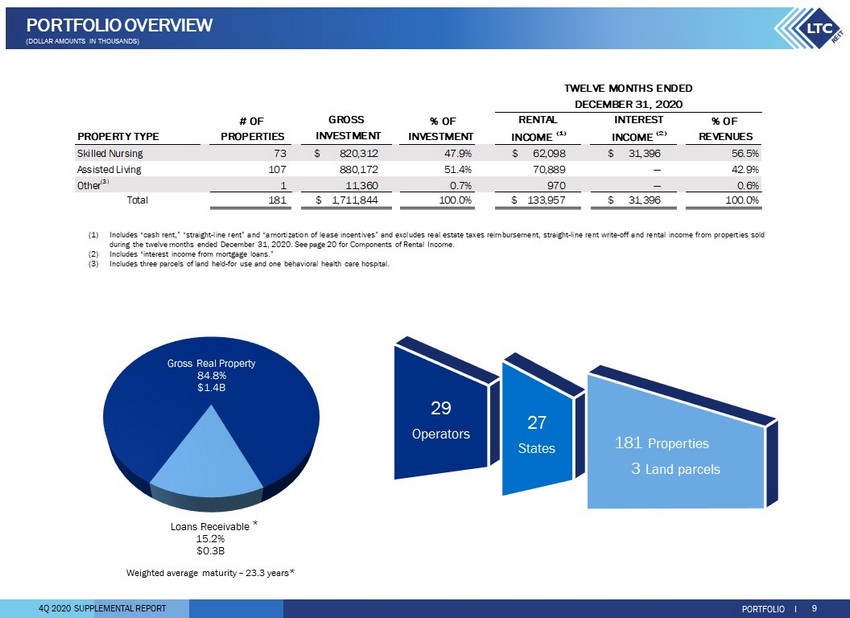
4Q 2020 SUPPLEMENTAL REPORT (1) Includes “cash rent,” “straight - line rent” and “amortization of lease incentives” and excludes real estate taxes reimbursement, straight - line rent write - off and rental income from properties sold during the twelve months ended December 31 , 2020 . See page 20 for Components of Rental Income . (2) Includes “interest income from mortgage loans . ” (3) Includes three parcels of land held - for use and one behavioral health care hospital . 29 Operators 27 States 181 Properties 3 Land parcels Gross Real Property 84.8% $1.4B Loans Receivable 15.2% $0.3B # OF % OF % OF PROPERTY TYPE PROPERTIES INVESTMENT REVENUES Skilled Nursing 73 820,312$ 47.9% 62,098$ 31,396$ 56.5% Assisted Living 107 880,172 51.4% 70,889 — 42.9% Other (3) 1 11,360 0.7% 970 — 0.6% Total 181 1,711,844$ 100.0% 133,957$ 31,396$ 100.0% GROSS INCOME (1) RENTAL INVESTMENT TWELVE MONTHS ENDED DECEMBER 31, 2020 INCOME (2) INTEREST PORTFOLIO I 9 PORTFOLIO OVERVIEW (DOLLAR AMOUNTS IN THOUSANDS) Weighted average maturity – 23.3 years * *
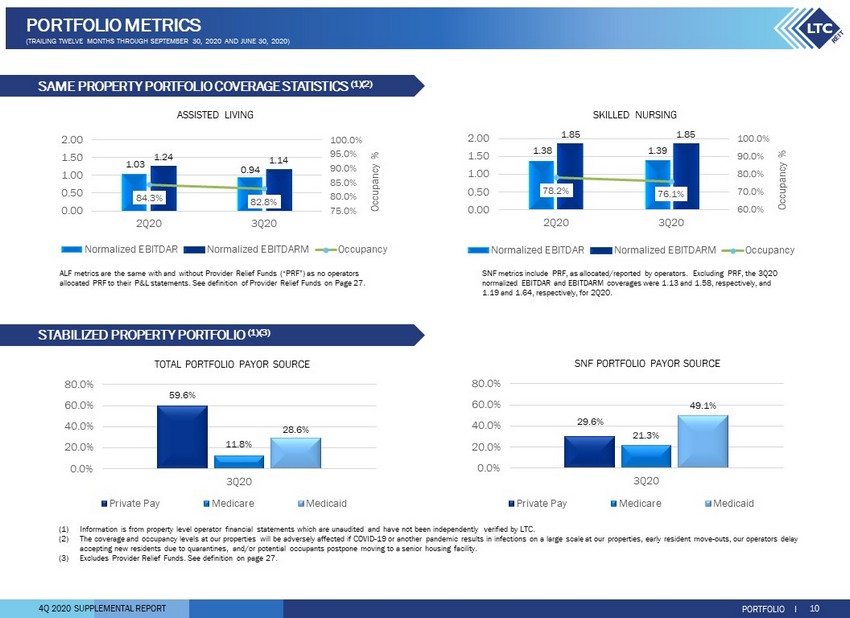
4Q 2020 SUPPLEMENTAL REPORT (1) Information is from property level operator financial statements which are unaudited and have not been independently verified by LTC. (2) The coverage and occupancy levels at our properties will be adversely affected if COVID - 19 or another pandemic results in infect ions on a large scale at our properties, early resident move - outs, our operators delay accepting new residents due to quarantines, and/or potential occupants postpone moving to a senior housing facility. (3) Excludes Provider Relief Funds. See definition on page 27. ASSISTED LIVING TOTAL PORTFOLIO PAYOR SOURCE SNF PORTFOLIO PAYOR SOURCE SKILLED NURSING 29.6% 21.3% 49.1% 0.0% 20.0% 40.0% 60.0% 80.0% 3Q20 Private Pay Medicare Medicaid 1.38 1.39 1.85 1.85 78.2% 76.1% 60.0% 70.0% 80.0% 90.0% 100.0% 0.00 0.50 1.00 1.50 2.00 2Q20 3Q20 Occupancy % Normalized EBITDAR Normalized EBITDARM Occupancy 1.03 0.94 1.24 1.14 84.3% 82.8% 75.0% 80.0% 85.0% 90.0% 95.0% 100.0% 0.00 0.50 1.00 1.50 2.00 2Q20 3Q20 Occupancy % Normalized EBITDAR Normalized EBITDARM Occupancy SNF metrics include PRF, as allocated/reported by operators. Excluding PRF, the 3Q20 normalized EBITDAR and EBITDARM coverages were 1.13 and 1.58, respectively, and 1.19 and 1.64, respectively, for 2Q20. SAME PROPERTY PORTFOLIO COVERAGE STATISTICS (1)(2) STABILIZED PROPERTY PORTFOLIO (1)(3) ALF metrics are the same with and without Provider Relief Funds (“PRF”) as no operators allocated PRF to their P&L statements. See definition of Provider Relief Funds on Page 27. PORTFOLIO I 10 PORTFOLIO METRICS (TRAILING TWELVE MONTHS THROUGH SEPTEMBER 30, 2020 AND JUNE 30, 2020) 59.6% 11.8% 28.6% 0.0% 20.0% 40.0% 60.0% 80.0% 3Q20 Private Pay Medicare Medicaid
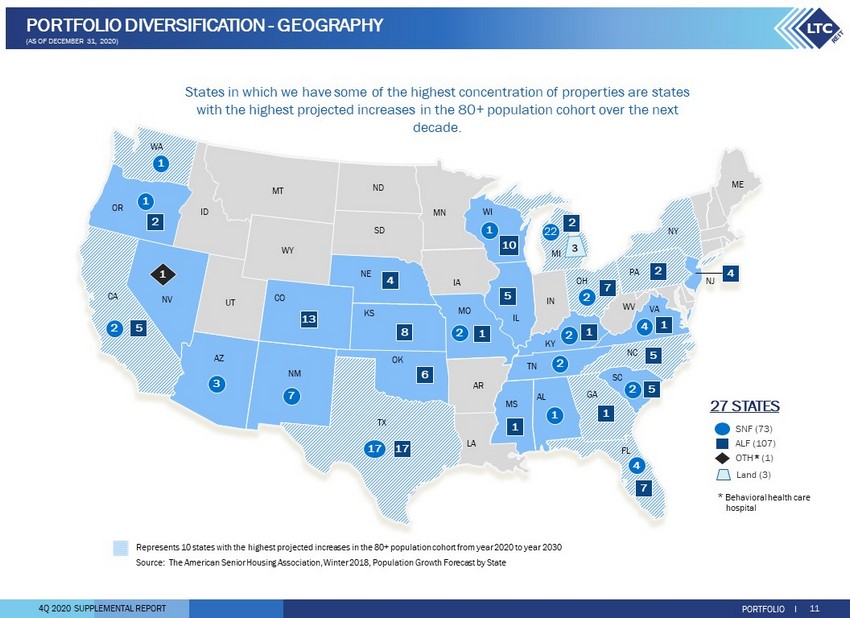
4Q 2020 SUPPLEMENTAL REPORT States in which we have some of the highest concentration of properties are states with the highest projected increases in the 80+ population cohort over the next decade. Represents 10 states with the highest projected increases in the 80+ population cohort from year 2020 to year 2030 Source: The American Senior Housing Association, Winter 2018, Population Growth Forecast by State CA WA ME NV WY IL AR LA WV ND NY OR AZ NM TX UT ID MT SD NE KS OK MS MN WI FL AL GA SC TN MO IA IN OH PA NJ NC VA CO KY 4 17 1 1 2 3 1 2 4 2 1 5 6 17 5 2 7 7 4 8 4 13 7 5 1 22 2 5 10 1 1 1 1 2 2 1 2 2 MI 27 STATES * Behavioral health care hospital SNF (73) ALF (107) OTH * (1) Land (3) PORTFOLIO I 11 PORTFOLIO DIVERSIFICATION - GEOGRAPHY (AS OF DECEMBER 31, 2020)

4Q 2020 SUPPLEMENTAL REPORT 49.1% 19.0% 21.9% 7.5% 2.5% 0.0% 20.0% 40.0% 60.0% MSAs 1-31 MSAs 32-100 MSAs > 100 Cities in Micro- SA Cities not in MSA or Micro- SA 23 years 13 years 0 10 20 30 40 Skilled Nursing Assisted Living Years (1) The MSA rank by population as of July 1, 2019, as estimated by the United States Census Bureau. Approximately 68% of our properties are in the top 100 MSAs. (1) Due to master leases with properties in 27 states, revenue by state is not available. (2) Includes one behavioral health care hospital and three parcels of land. (1) As calculated from construction date or major renovation/expansion date . Includes owned portfolio and mortgage loans secured by 22 SNF properties in Michigan . # OF STATE (1) PROPS % SNF % ALF % % Michigan 24 281,963$ 16.5% 259,843$ 31.7% 21,177$ 2.4% 943$ 8.3% Texas 34 273,287 16.0% 202,604 24.7% 70,683 8.0% — — Wisconsin 11 149,403 8.7% 13,946 1.7% 135,457 15.4% — — California 7 105,163 6.1% 22,262 2.7% 82,901 9.4% — — Colorado 13 104,090 6.1% — — 104,090 11.8% — — Illinois 5 87,670 5.1% — — 87,670 10.0% — — Ohio 9 86,642 5.1% 54,000 6.6% 32,642 3.7% — — Florida 11 71,952 4.2% 32,865 4.0% 39,087 4.4% — — Kentucky 3 62,809 3.7% 48,520 5.9% 14,289 1.6% — — New Jersey 4 62,229 3.6% — — 62,229 7.1% — — All Others 60 426,636 24.9% 186,272 22.7% 229,947 26.2% 10,417 91.7% Total 181 1,711,844$ 100.0% 820,312$ 100.0% 880,172$ 100.0% 11,360$ 100.0% OTH (2) INVESTMENT GROSS GROSS PORTFOLIO BY MSA (1) AVERAGE PORTFOLIO AGE (1) PORTFOLIO I 12 PORTFOLIO DIVERSIFICATION - GEOGRAPHY (AS OF DECEMBER 31, 2020, DOLLAR AMOUNTS IN THOUSANDS)
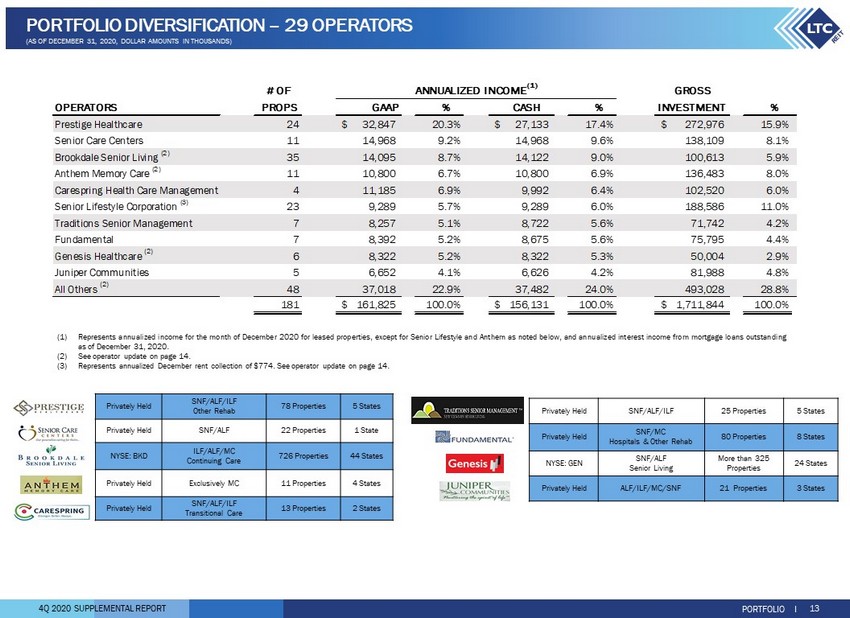
4Q 2020 SUPPLEMENTAL REPORT # OF GROSS OPERATORS PROPS GAAP % CASH % INVESTMENT % Prestige Healthcare 24 32,847$ 20.3% 27,133$ 17.4% 272,976$ 15.9% Senior Care Centers 11 14,968 9.2% 14,968 9.6% 138,109 8.1% Brookdale Senior Living (2) 35 14,095 8.7% 14,122 9.0% 100,613 5.9% Anthem Memory Care (2) 11 10,800 6.7% 10,800 6.9% 136,483 8.0% Carespring Health Care Management 4 11,185 6.9% 9,992 6.4% 102,520 6.0% Senior Lifestyle Corporation (3) 23 9,289 5.7% 9,289 6.0% 188,586 11.0% Traditions Senior Management 7 8,257 5.1% 8,722 5.6% 71,742 4.2% Fundamental 7 8,392 5.2% 8,675 5.6% 75,795 4.4% Genesis Healthcare (2) 6 8,322 5.2% 8,322 5.3% 50,004 2.9% Juniper Communities 5 6,652 4.1% 6,626 4.2% 81,988 4.8% All Others (2) 48 37,018 22.9% 37,482 24.0% 493,028 28.8% 181 161,825$ 100.0% 156,131$ 100.0% 1,711,844$ 100.0% ANNUALIZED INCOME (1) PORTFOLIO I 13 PORTFOLIO DIVERSIFICATION – 29 OPERATORS (AS OF DECEMBER 31, 2020, DOLLAR AMOUNTS IN THOUSANDS) Privately Held SNF/ALF/ILF 25 Properties 5 States Privately Held SNF/MC Hospitals & Other Rehab 80 Properties 8 States NYSE: GEN SNF/ALF Senior Living More than 325 Properties 24 States Privately Held ALF/ILF/MC/SNF 21 Properties 3 States Privately Held SNF/ALF/ILF Other Rehab 78 Properties 5 States Privately Held SNF/ALF 22 Properties 1 State NYSE: BKD ILF/ALF/MC Continuing Care 726 Properties 44 States Privately Held Exclusively MC 11 Properties 4 States Privately Held SNF/ALF/ILF Transitional Care 13 Properties 2 States (1) Represents annualized income for the month of December 2020 for leased properties, except for Senior Lifestyle and Anthem as noted below, and annualized interest income from mortgage loans outstanding as of December 31 , 2020 . (2) See operator update on page 14 . (3) Represents annualized December rent collection of $ 774 . See operator update on page 14 .

4Q 2020 SUPPLEMENTAL REPORT Effective July 2020 , we consolidated the previous four separate lease agreements into a single consolidated master lease and extended Brookdale’s lease maturity date by one year to December 31 , 2021 . This new master lease provides three renewal options consisting of a four - year renewal option, a five - year renewal option and a 10 - year renewal option . The notice period for the first renewal option is January 1 , 2021 to April 30 , 2021 . The economic rent terms remain the same as the consolidated rent terms under the previous four separate lease agreements . In addition, we have extended a $ 4 , 000 capital commitment to Brookdale, which is available through December 31 , 2021 at a 7 % yield . As of December 31 , 2020 , we have funded $ 1 , 693 under this agreement and our remaining commitment is $ 2 , 307 . Rental revenue from Anthem is currently being accounted for on a cash basis due to Anthem’s 2017 default under its master lease . Anthem paid us annual cash rent of $ 9 , 900 in 2020 , and we anticipate they will pay their annualized 4 Q 20 cash rent of $ 10 , 800 through 2021 . We receive regular financial performance updates from Anthem and continue to monitor their performance obligations under the master lease agreement . An affiliate of Senior Lifestyle (“Senior Lifestyle”) was provided deferred rent in the amount of $ 394 in April 2020 which has since been fully repaid, however, they failed to pay full rent during 2 Q 20 . As a result, we wrote off a total of $ 17 , 742 of straight - line rent receivable and lease incentives related to this master lease and transitioned rental revenue recognition to a cash basis effective July 2020 . During 4 Q 20 , we received $ 3 , 877 of Senior Lifestyle’s $ 4 , 683 contractual rent due . Additionally, we applied their letter of credit and deposits totaling $ 3 , 725 to accrued 2 Q 20 rent receivable of $ 2 , 501 and notes receivable of $ 125 and the remaining $ 1 , 099 to 3 Q and 4 Q 20 rent . As of December 31 , 2020 , Senior Lifestyle's unaccrued delinquent rent balance was $ 1 , 002 . Also, during 4 Q 20 , we recorded an impairment loss of $ 3 , 036 related to a memory care community in Colorado that is operated by Senior Lifestyle . Subsequent to December 31 , 2020 , we transitioned 11 assisted living communities previously leased to Senior Lifestyle to two operators . These communities are located in Wisconsin, Ohio and Illinois . Total cash rent expected under these master lease agreements is $ 5 , 250 for the first lease year, $ 7 , 078 for the second lease year, and $ 7 , 303 for the third lease year, escalating 2 % annually thereafter . Genesis reported doubt regarding its ability to continue as a going concern on its Quarterly Report on Form 10 - Q filed in August 2020 . As a result, we wrote off the Genesis straight - line rent receivable balance of $ 4 , 316 and transitioned rental revenue recognition to cash basis in 3 Q 20 . Genesis is current on all of its lease obligations to LTC . During 3 Q 20 , an operator paid $ 542 of its contractual rent of $ 1 , 299 . Effective September 1 , 2020 , we consolidated our two master leases with this operator into one combined master lease . Under the new combined master lease, LTC agreed to abate $ 570 of 3 Q 20 rent along with $ 80 that had been deferred in 2 Q 20 , totaling $ 650 . Additionally, the new combined master lease allows the operator to defer rent as needed through March 31 , 2021 . We also recorded an impairment charge of $ 941 related to an assisted living community that they operated . This community was closed in October 2020 and we are currently evaluating our options to sell this property . During 4 Q 20 , the operator deferred $ 1 , 057 of $ 1 , 299 of contractual rent and repaid $ 888 of its deferred rent . The remaining deferred balance due from the operator is $ 355 as of December 31 , 2020 . PORTFOLIO I 14 PORTFOLIO DIVERSIFICATION – OPERATOR UPDATE (AS OF DECEMBER 31, 2020, DOLLAR AMOUNTS IN THOUSANDS) Other

4Q 2020 SUPPLEMENTAL REPORT 95% 5% ALF/MC SNF DEFERRED RENT OUTSTANDING BY PROPERTY TYPE PORTFOLIO I 15 PORTFOLIO UPDATE (AMOUNTS IN THOUSANDS) ABATED RENT ▪ $360 abated rent during 4Q20 ▪ 2021 rent and mortgage interest escalations were reduced by 50% in the form of a rent credit to provide financial support to our eligible operating partners. The one - time rent escalation reduction is expected to have an approximate $530 impact on 2021 GAAP revenue, and an approximate $1,300 impact on 2021 FAD (funds available for distribution). 98% (1) of 4Q20 contractual cash rent and mortgage interest collected DELINQUENT RENT ▪ As of December 31, 2020, Senior Lifestyle’s unaccrued outstanding rent balance was $1,002. See page 14 for more detail. ▪ Deferred rent of $1,338 and received $969 of deferred rent repayments during 4Q20. ▪ As of December 31, 2020, $1,044 of deferred rent was outstanding. ▪ Our rent deferral agreements generally require the deferred rent to be paid within 6 to 24 months. ▪ LTC evaluated deferral requests with close attention to ongoing operations, rent coverage, corporate financial health and liquidity of the operator. DEFERRED RENT (1) Includes application of Senior Lifestyle’s letter of credit and security deposit . CONTRACTUAL RENT AND MORTGAGE INTEREST 2020 Collected, 98.0% (1) - $157,870 Abated, 0.7% - $1,130 Net Deferred, 0.7% - $1,044 Delinquent, 0.6% - $1,002 ▪ To date in 2021, rent deferrals were $689, net of $14 of deferred rent repayments. Excluding the rent credit related to the rent escalation reduction discussed above, abated rent to date in 2021 is $360. Senior Lifestyle did not pay any of their monthly contractual rent of $1,561 in January or February 2021. We received $545 under the new master leases related to the transitioned assisted living communities discussed on page 14. COLLECTED RENT
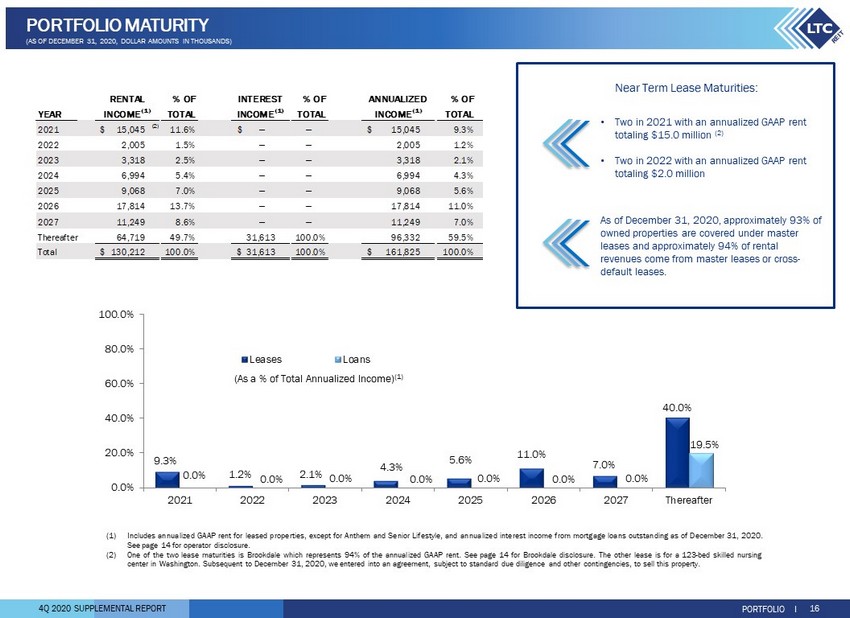
4Q 2020 SUPPLEMENTAL REPORT 9.3% 1.2% 2.1% 4.3% 5.6% 11.0% 7.0% 40.0% 0.0% 0.0% 0.0% 0.0% 0.0% 0.0% 0.0% 19.5% 0.0% 20.0% 40.0% 60.0% 80.0% 100.0% 2021 2022 2023 2024 2025 2026 2027 Thereafter Leases Loans (As a % of Total Annualized Income) (1) Near Term Lease Maturities: • Two in 2021 with an annualized GAAP rent totaling $15.0 million (2) • Two in 2022 with an annualized GAAP rent totaling $2.0 million As of December 31, 2020, approximately 93% of owned properties are covered under master leases and approximately 94% of rental revenues come from master leases or cross - default leases. (1) Includes annualized GAAP rent for leased properties, except for Anthem and Senior Lifestyle, and annualized interest income from mortgage loans outstanding as of December 31 , 2020 . See page 14 for operator disclosure . (2) One of the two lease maturities is Brookdale which represents 94 % of the annualized GAAP rent . See page 14 for Brookdale disclosure . The other lease is for a 123 - bed skilled nursing center in Washington . Subsequent to December 31 , 2020 , we entered into an agreement, subject to standard due diligence and other contingencies, to sell this property . % OF % OF % OF YEAR TOTAL TOTAL TOTAL 2021 15,045$ (2) 11.6% —$ — 15,045$ 9.3% 2022 2,005 1.5% — — 2,005 1.2% 2023 3,318 2.5% — — 3,318 2.1% 2024 6,994 5.4% — — 6,994 4.3% 2025 9,068 7.0% — — 9,068 5.6% 2026 17,814 13.7% — — 17,814 11.0% 2027 11,249 8.6% — — 11,249 7.0% Thereafter 64,719 49.7% 31,613 100.0% 96,332 59.5% Total 130,212$ 100.0% 31,613$ 100.0% 161,825$ 100.0% GAAP INCOME (1) INCOME (1) INCOME (1) RENTAL INTEREST ANNUALIZED PORTFOLIO I 16 PORTFOLIO MATURITY (AS OF DECEMBER 31, 2020, DOLLAR AMOUNTS IN THOUSANDS)

4Q 2020 SUPPLEMENTAL REPORT (1) Subsequent to December 31, 2020, we borrowed $9,000 under our unsecured revolving line of credit. Accordingly, we have $98,90 0 o utstanding with $501,100 available for borrowing. (2) Represents outstanding balance of $560,140, net of debt issue costs of $658. Subsequent to December 31, 2020, we paid $7,000 und er our senior unsecured notes. Accordingly, we have $552,482 outstanding, net of debt issue costs, under our senior unsecured notes. (3) Closing price of our common stock as reported by the NYSE on December 31, 2020. (4) See page 21 for reconciliation of annualized adjusted EBITDA re . Bank borrowings - weighted average rate 1.4% (1) 89,900$ Senior unsecured notes, net of debt issue costs - weighted average rate 4.4% (2) 559,482 Total debt - weighted average rate 4.0% 649,382 29.8% No. of shares Common stock 39,242,225 38.91$ 1,526,915 70.2% Total Market Value 1,526,915 2,176,297$ 100.0% Add: Non-controlling interest 8,404 Less: Cash and cash equivalents (7,772) 2,176,929$ Debt to Enterprise Value 29.8% Debt to Annualized Adjusted EBITDAre (4) 4.3x Net Debt to Annualized Adjusted EBITDAre (4) 4.3x (3) CAPITALIZATION ENTERPRISE VALUE 12/31/2020 DEBT EQUITY Closing Price TOTAL VALUE DECEMBER 31, 2020 FINANCIAL I 17 ENTERPRISE VALUE (AMOUNTS IN THOUSANDS, EXCEPT PER SHARE AMOUNTS AND NUMBER OF SH ARES)
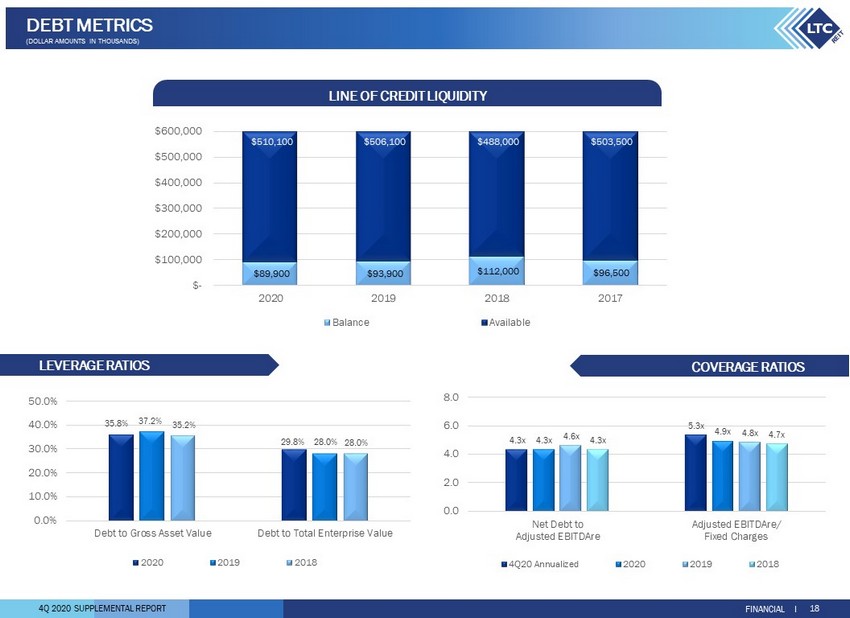
4Q 2020 SUPPLEMENTAL REPORT 4.3x 5.3x 4.3x 4.9x 4.6x 4.8x 4.3x 4.7x 0.0 2.0 4.0 6.0 8.0 Net Debt to Adjusted EBITDAre Adjusted EBITDAre/ Fixed Charges 4Q20 Annualized 2020 2019 2018 $89,900 $93,900 $112,000 $96,500 $510,100 $506,100 $488,000 $503,500 $- $100,000 $200,000 $300,000 $400,000 $500,000 $600,000 2020 2019 2018 2017 Balance Available 35.8% 29.8% 37.2% 28.0% 35.2% 28.0% 0.0% 10.0% 20.0% 30.0% 40.0% 50.0% Debt to Gross Asset Value Debt to Total Enterprise Value 2020 2019 2018 LEVERAGE RATIOS COVERAGE RATIOS LINE OF CREDIT LIQUIDITY FINANCIAL I 18 DEBT METRICS (DOLLAR AMOUNTS IN THOUSANDS)

4Q 2020 SUPPLEMENTAL REPORT Senior Unsecured Notes 86.2% Unsecured Line of Credit 13.8% $0 $89,900 $0 $0 $0 $0 $0 $0 $47,160 $48,160 $49,160 $49,160 $49,500 $51,500 $54,500 $211,000 $- $100,000 $200,000 $300,000 $400,000 $500,000 $600,000 2021 2022 2023 2024 2025 2026 2027 Thereafter Unsecured Line Senior Unsecured Notes (1) Subsequent to December 31, 2020, we borrowed $9,000 under our unsecured revolving line of credit. Accordingly, we have $98,90 0 o utstanding with $501,100 available for borrowing. (2) Reflects scheduled principal payments. (3) Subsequent to December 31, 2020, we paid $7,000 under our senior unsecured notes. Accordingly, we have $553,140 outstanding a nd $40,160 payable during 2021. (4) Excludes debt issue costs which are netted against the principal outstanding in the senior unsecured notes balance on our Con sol idated Balance Sheets shown on page 23. UNSECURED SENIOR LINE OF UNSECURED % OF YEAR CREDIT (1) NOTES (2) TOTAL TOTAL 2021 —$ 47,160$ (3) 47,160$ 7.3% 2022 89,900 48,160 138,060 21.2% 2023 — 49,160 49,160 7.6% 2024 — 49,160 49,160 7.6% 2025 — 49,500 49,500 7.6% 2026 — 51,500 51,500 7.9% 2027 — 54,500 54,500 8.4% Thereafter — 211,000 211,000 32.4% Total 89,900$ 560,140$ (4) 650,040$ (3) 100.0% DEBT STRUCTURE FINANCIAL I 19 DEBT MATURITY (AS OF DECEMBER 31, 2020, DOLLAR AMOUNTS IN THOUSANDS)
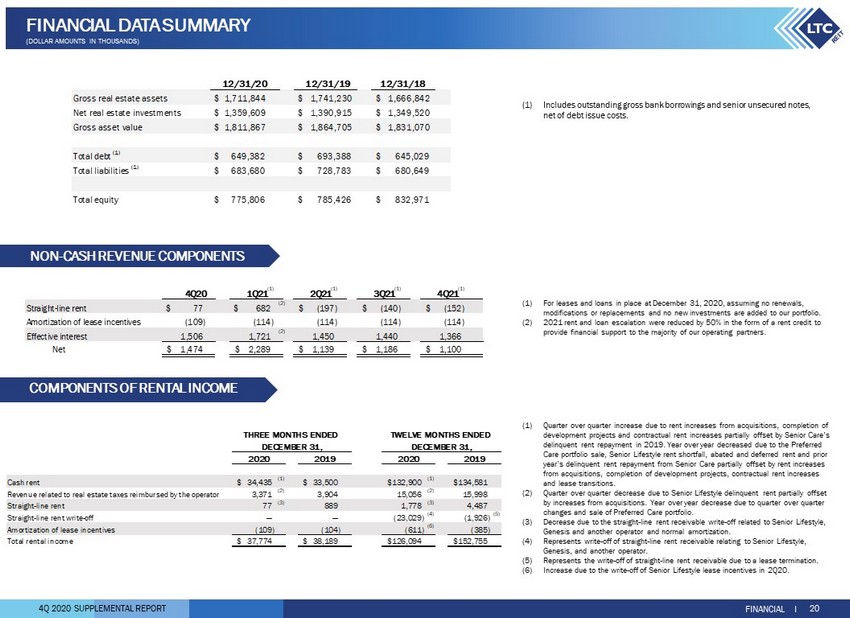
4Q 2020 SUPPLEMENTAL REPORT 12/31/19 12/31/18 Gross real estate assets $ 1,711,844 $ 1,741,230 $ 1,666,842 Net real estate investments $ 1,359,609 $ 1,390,915 $ 1,349,520 Gross asset value $ 1,811,867 $ 1,864,705 $ 1,831,070 Total debt (1) $ 649,382 $ 693,388 $ 645,029 Total liabilities (1) $ 683,680 $ 728,783 $ 680,649 Total equity $ 775,806 $ 785,426 $ 832,971 12/31/20 (1) Includes outstanding gross bank borrowings and senior unsecured notes, net of debt issue costs. (1) For leases and loans in place at December 31, 2020, assuming no renewals, modifications or replacements and no new investments are added to our portfolio. (2) 2021 rent and loan escalation were reduced by 50% in the form of a rent credit to provide financial support to the majority of our operating partners. (1) Quarter over quarter increase due to rent increases from acquisitions, completion of development projects and contractual rent increases partially offset by Senior Care’s delinquent rent repayment in 2019. Year over year decreased due to the Preferred Care portfolio sale, Senior Lifestyle rent shortfall, abated and deferred rent and prior year’s delinquent rent repayment from Senior Care partially offset by rent increases from acquisitions, completion of development projects, contractual rent increases and lease transitions. (2) Quarter over quarter decrease due to Senior Lifestyle delinquent rent partially offset by increases from acquisitions. Year over year decrease due to quarter over quarter changes and sale of Preferred Care portfolio. (3) Decrease due to the straight - line rent receivable write - off related to Senior Lifestyle, Genesis and another operator and normal amortization. (4) Represents write - off of straight - line rent receivable relating to Senior Lifestyle, Genesis, and another operator. (5) Represents the write - off of straight - line rent receivable due to a lease termination. (6) Increase due to the write - off of Senior Lifestyle lease incentives in 2Q20. Cash rent 34,435$ (1) 33,500$ 132,900$ (1) 134,581$ Revenue related to real estate taxes reimbursed by the operator 3,371 (2) 3,904 15,056 (2) 15,998 Straight-line rent 77 (3) 889 1,778 (3) 4,487 Straight-line rent write-off — — (23,029) (4) (1,926) (5) Amortization of lease incentives (109) (104) (611) (6) (385) Total rental income 37,774$ 38,189$ 126,094$ 152,755$ THREE MONTHS ENDED DECEMBER 31, 2020 2019 TWELVE MONTHS ENDED DECEMBER 31, 2020 2019 NON - CASH REVENUE COMPONENTS COMPONENTS OF RENTAL INCOME FINANCIAL I 20 FINANCIAL DATA SUMMARY (DOLLAR AMOUNTS IN THOUSANDS) 4Q20 1Q21 (1) 2Q21 (1) 3Q21 (1) 4Q21 (1) 77$ 682$ (2) (197)$ (140)$ (152)$ (109) (114) (114) (114) (114) 1,506 1,721 (2) 1,450 1,440 1,366 1,474$ 2,289$ 1,139$ 1,186$ 1,100$ Straight-line rent Amortization of lease incentives Effective interest Net
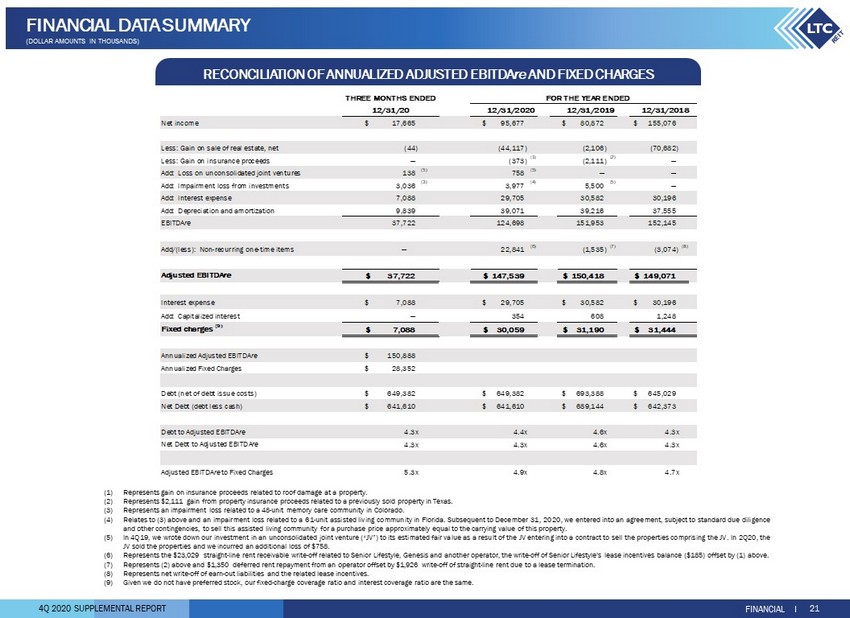
4Q 2020 SUPPLEMENTAL REPORT (1) Represents gain on insurance proceeds related to roof damage at a property . (2) Represents $ 2 , 111 gain from property insurance proceeds related to a previously sold property in Texas . (3) Represents an impairment loss related to a 48 - unit memory care community in Colorado . (4) Relates to ( 3 ) above and an impairment loss related to a 61 - unit assisted living community in Florida . Subsequent to December 31 , 2020 , we entered into an agreement, subject to standard due diligence and other contingencies, to sell this assisted living community for a purchase price approximately equal to the carrying value of this property . (5) In 4 Q 19 , we wrote down our investment in an unconsolidated joint venture (“JV”) to its estimated fair value as a result of the JV entering into a contract to sell the properties comprising the JV . In 2 Q 20 , the JV sold the properties and we incurred an additional loss of $ 758 . (6) Represents the $ 23 , 029 straight - line rent receivable write - off related to Senior Lifestyle, Genesis and another operator, the write - off of Senior Lifestyle’s lease incentives balance ( $ 185 ) offset by ( 1 ) above . (7) Represents ( 2 ) above and $ 1 , 350 deferred rent repayment from an operator offset by $ 1 , 926 write - off of straight - line rent due to a lease termination . (8) Represents net write - off of earn - out liabilities and the related lease incentives . (9) Given we do not have preferred stock, our fixed - charge coverage ratio and interest coverage ratio are the same . Net income 17,665$ 95,677$ 80,872$ 155,076$ Less: Gain on sale of real estate, net (44) (44,117) (2,106) (70,682) Less: Gain on insurance proceeds — (373) (1) (2,111) (2) — Add: Loss on unconsolidated joint ventures 138 (5) 758 (5) — — Add: Impairment loss from investments 3,036 (3) 3,977 (4) 5,500 (5) — Add: Interest expense 7,088 29,705 30,582 30,196 Add: Depreciation and amortization 9,839 39,071 39,216 37,555 EBITDAre 37,722 124,698 151,953 152,145 Add/(less): Non-recurring one-time items — 22,841 (6) (1,535) (7) (3,074) (8) Adjusted EBITDAre 37,722$ 147,539$ 150,418$ 149,071$ Interest expense 7,088$ 29,705$ 30,582$ 30,196$ Add: Capitalized interest — 354 608 1,248 Fixed charges (9) 7,088$ 30,059$ 31,190$ 31,444$ Annualized Adjusted EBITDAre 150,888$ Annualized Fixed Charges 28,352$ Debt (net of debt issue costs) 649,382$ 649,382$ 693,388$ 645,029$ Net Debt (debt less cash) 641,610$ 641,610$ 689,144$ 642,373$ Debt to Adjusted EBITDAre 4.3x 4.4x 4.6x 4.3x Net Debt to Adjusted EBITDAre 4.3x 4.3x 4.6x 4.3x Adjusted EBITDAreto Fixed Charges 5.3x 4.9x 4.8x 4.7x THREE MONTHS ENDED FOR THE YEAR ENDED 12/31/20 12/31/2019 12/31/2018 12/31/2020 RECONCILIATION OF ANNUALIZED ADJUSTED EBITDA re AND FIXED CHARGES FINANCIAL I 21 FINANCIAL DATA SUMMARY (DOLLAR AMOUNTS IN THOUSANDS)

4Q 2020 SUPPLEMENTAL REPORT 2020 2019 2020 2019 Revenues Rental income 37,774$ 38,189$ 126,094$ 152,755$ Interest income from mortgage loans 7,909 7,683 31,396 29,991 Interest and other income 590 591 1,847 2,558 Total revenues 46,273 46,463 159,337 185,304 Expenses Interest expense 7,088 7,578 29,705 30,582 Depreciation and amortization 9,839 9,817 39,071 39,216 Impairment loss from real estate investments 3,036 — 3,977 — (Recovery) provision for doubtful accounts (2) 13 (3) 166 Transaction costs 102 90 299 365 Property tax expense 3,380 4,189 15,065 16,755 General and administrative expenses 5,216 4,541 19,710 18,453 Total expenses 28,659 26,228 107,824 105,537 Other Operating Income Gain (loss) on sale of real estate, net 44 (4,630) 44,117 2,106 Operating Income 17,658 15,605 95,630 81,873 Gain from property insurance proceeds — 2,111 373 2,111 Loss on unconsolidated joint ventures (138) — (758) — Impairment loss from investments in unconsolidated joint ventures — (5,500) — (5,500) Income from unconsolidated joint ventures 145 415 432 2,388 Net Income 17,665 12,631 95,677 80,872 Income allocated to non-controlling interests (92) (89) (384) (346) Net income attributable to LTC Properties, Inc. 17,573 12,542 95,293 80,526 Income allocated to participating securities (103) (93) (422) (391) Net income available to common stockholders 17,470$ 12,449$ 94,871$ 80,135$ Earnings per common share: Basic $0.45 $0.31 $2.42 $2.03 Diluted $0.45 $0.31 $2.42 $2.02 Weighted average shares used to calculate earnings per common share: Basic 39,062 39,588 39,179 39,571 Diluted 39,147 39,775 39,264 39,759 Dividends declared and paid per common share $0.57 $0.57 $2.28 $2.28 (unaudited) (audited) THREE MONTHS ENDED DECEMBER 30, DECEMBER 30, TWELVE MONTHS ENDED FINANCIAL I 22 INCOME STATEMENT DATA (AMOUNTS IN THOUSANDS, EXCEPT PER SHARE AMOUNTS)

4Q 2020 SUPPLEMENTAL REPORT ASSETS Investments: Land $ 127,774 $ 126,703 Buildings and improvements 1,324,227 1,295,899 Accumulated depreciation and amortization (349,643) (312,642) Operating real estate property, net 1,102,358 1,109,960 Properties held-for-sale, net of accumulated depreciation: 2020—$0; 2019—$35,113 — 26,856 Real property investments, net 1,102,358 1,136,816 Mortgage loans receivable, net of loan loss reserve: 2020—$2,592; 2019—$2,560 257,251 254,099 Real estate investments, net 1,359,609 1,390,915 Notes receivable, net of loan loss reserve: 2020—$146; 2019—$181 14,465 17,927 Investments in unconsolidated joint ventures 11,340 19,003 Investments, net 1,385,414 1,427,845 Other assets: Cash and cash equivalents 7,772 4,244 Debt issue costs related to bank borrowings 1,324 2,164 Interest receivable 32,746 26,586 Straight-line rent receivable 24,452 45,703 Lease incentives 2,462 2,552 Prepaid expenses and other assets 5,316 5,115 Total assets $ 1,459,486 $ 1,514,209 LIABILITIES Bank borrowings $ 89,900 $ 93,900 Senior unsecured notes, net of debt issue costs: 2020—$658; 2019—$812 559,482 599,488 Accrued interest 4,216 4,983 Accrued expenses and other liabilities 30,082 30,412 Total liabilities 683,680 728,783 EQUITY Stockholders’ equity: Common stock: $0.01 par value; 60,000 shares authorized; shares issued and outstanding: 2020—39,242; 2019—39,752 392 398 Capital in excess of par value 852,780 867,346 Cumulative net income 1,388,775 1,293,482 Cumulative distributions (1,474,545) (1,384,283) Total LTC Properties, Inc. stockholders’ equity 767,402 776,943 Non-controlling interests 8,404 8,483 Total equity 775,806 785,426 Total liabilities and equity $ 1,459,486 $ 1,514,209 DECEMBER 31, 2019DECEMBER 31, 2020 FINANCIAL I 23 CONSOLIDATED BALANCE SHEETS (AUDITED, AMOUNTS IN THOUSANDS, EXCEPT PER SHARE AMOUNTS)

4Q 2020 SUPPLEMENTAL REPORT (1) Gain from insurance proceeds related to a previously sold property in Texas . (2) Represents ( 4 ) and ( 5 ) below offset by ( 7 ) below . (3) Represents ( 8 ) below offset by ( 6 ) below . (4) Includes the write - off of Senior Lifestyle’s lease incentives balances ( $ 185 ) . (5) Represents the $ 23 , 029 straight - line rent receivable write - off related to Senior Lifestyle, Genesis, and another operator . See page 14 for operator disclosures . (6) Represents $ 1 , 926 write - off of straight - line rent receivable due to a lease termination . (7) Represents a gain on insurance proceeds related to roof damage at a property . (8) Represents $ 1 , 350 deferred rent repayment from an operator and ( 1 ) above . 2020 2019 2020 2019 GAAP net income available to common stockholders 17,470$ 12,449$ 94,871$ 80,135$ Add: Impairment loss from investments 3,036 5,500 3,977 5,500 Add: Depreciation and amortization 9,839 9,817 39,071 39,216 Add: Loss on unconsolidated joint ventures 138 — 758 — (Less)/Add: (Gain) Loss on sale of real estate, net (44) 4,630 (44,117) (2,106) NAREIT FFO attributable to common stockholders 30,439$ 32,396$ 94,560$ 122,745$ $0.78 $0.81 $2.41 $3.08 NAREIT FFO attributable to common stockholders 30,439$ 32,396$ 94,560$ 122,745$ Add: Non-recurring items — (2,111) (1) 22,841 (2) (1,535) (3) 30,439$ 30,285$ 117,401$ 121,210$ NAREIT FFO attributable to common stockholders 30,439$ 32,396$ 94,560$ 122,745$ Non-cash income: Less: Straight-line rental income (77) (889) (1,778) (4,487) Add: Amortization of lease incentives 109 104 611 (4) 385 Add: Other non-cash expense — — 23,029 (5) 1,926 (6) Less: Effective interest income from mortgage loans (1,506) (1,481) (6,154) (5,842) Less: Deferred income from unconsolidated joint ventures — — — (18) Net non-cash income (1,474) (2,266) 15,708 (8,036) Non-cash expense: Add: Non-cash compensation charges 1,781 1,627 7,012 6,565 Add: Non-cash interest related to earn-out liabilities — — — — Less: Capitalized interest — (167) (354) (608) Net non-cash expense 1,781 1,460 6,658 5,957 Funds available for distribution (FAD) 30,746 31,590 116,926 120,666 Less: Non-recurring income — (2,111) (1) (373) (7) (3,461) (8) Funds available for distribution (FAD), excluding non-recurring items 30,746$ 29,479$ 116,553$ 117,205$ FFO attributable to common stockholders, excluding non-recurring items THREE MONTHS ENDED TWELVE MONTHS ENDED DECEMBER 31, DECEMBER 31, NAREIT Diluted FFO attributable to common stockholders per share FINANCIAL I 24 FUNDS FROM OPERATIONS – RECONCILIATION OF FFO AND FAD (UNAUDITED, AMOUNTS IN THOUSANDS, EXCEPT PER SHARE AMOUNTS)
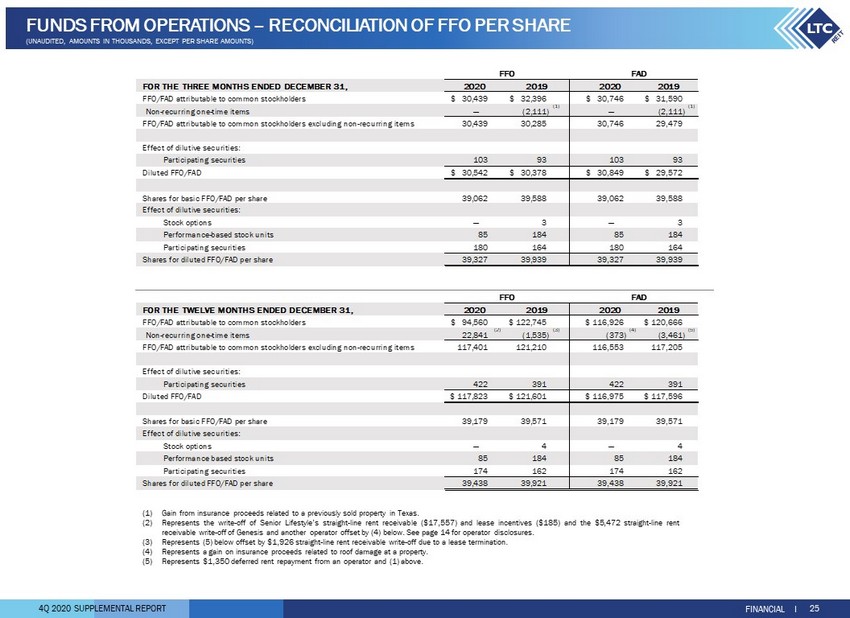
4Q 2020 SUPPLEMENTAL REPORT FOR THE THREE MONTHS ENDED DECEMBER 31, FFO/FAD attributable to common stockholders 30,439$ 32,396$ 30,746$ 31,590$ Non-recurring one-time items — (2,111) (1) — (2,111) (1) FFO/FAD attributable to common stockholders excluding non-recurring items 30,439 30,285 30,746 29,479 Effect of dilutive securities: Participating securities 103 93 103 93 Diluted FFO/FAD 30,542$ 30,378$ 30,849$ 29,572$ 39,062 39,588 39,062 39,588 Effect of dilutive securities: Stock options — 3 — 3 Performance-based stock units 85 184 85 184 Participating securities 180 164 180 164 Shares for diluted FFO/FAD per share 39,327 39,939 39,327 39,939 FOR THE TWELVE MONTHS ENDED DECEMBER 31, FFO/FAD attributable to common stockholders 94,560$ 122,745$ 116,926$ 120,666$ Non-recurring one-time items 22,841 (2) (1,535) (3) (373) (4) (3,461) (5) FFO/FAD attributable to common stockholders excluding non-recurring items 117,401 121,210 116,553 117,205 Effect of dilutive securities: Participating securities 422 391 422 391 Diluted FFO/FAD 117,823$ 121,601$ 116,975$ 117,596$ 39,179 39,571 39,179 39,571 Effect of dilutive securities: Stock options — 4 — 4 Performance based stock units 85 184 85 184 Participating securities 174 162 174 162 Shares for diluted FFO/FAD per share 39,438 39,921 39,438 39,921 Shares for basic FFO/FAD per share 2020 2019 2019 Shares for basic FFO/FAD per share FFO FAD 2020 FFO FAD 2020 2019 2020 2019 FINANCIAL I 25 FUNDS FROM OPERATIONS – RECONCILIATION OF FFO PER SHARE (UNAUDITED, AMOUNTS IN THOUSANDS, EXCEPT PER SHARE AMOUNTS) (1) Gain from insurance proceeds related to a previously sold property in Texas . (2) Represents the write - off of Senior Lifestyle’s straight - line rent receivable ( $ 17 , 557 ) and lease incentives ( $ 185 ) and the $ 5 , 472 straight - line rent receivable write - off of Genesis and another operator offset by ( 4 ) below . See page 14 for operator disclosures . (3) Represents ( 5 ) below offset by $ 1 , 926 straight - line rent receivable write - off due to a lease termination . (4) Represents a gain on insurance proceeds related to roof damage at a property . (5) Represents $ 1 , 350 deferred rent repayment from an operator and ( 1 ) above .

4Q 2020 SUPPLEMENTAL REPORT Assisted Living Communities (“ALF”) : The ALF portfolio consists of assisted living, independent living, and/or memory care properties . (See Independent Living and Memory Care) Assisted living properties are seniors housing properties serving elderly persons who require assistance with activities of daily living, but do not require the constant supervision skilled nursing properties provide . Services are usually available 24 hours a day and include personal supervision and assistance with eating, bathing, grooming and administering medication . The facilities provide a combination of housing, supportive services, personalized assistance and health care designed to respond to individual needs . Contractual Lease Rent : Rental revenue as defined by the lease agreement between us and the operator for the lease year . Earnings Before Interest, Tax, Depreciation and Amortization for Real Estate (“EBITDA re”) : As defined by the National Association of Real Estate Investment Trusts (“ NAREIT”), EBITDA re is calculated as net income (computed in accordance with GAAP) excluding (i) interest expense, (ii) income tax expense, (iii) real estate depreciation and amortization, (iv) impairment write - downs of depreciable real estate, (v) gains or losses on the sale of depreciable real estate, and (vi) adjustments for unconsolidated partnerships and joint ventures . Funds Available for Distribution (“FAD”) : FFO excluding the effects of straight - line rent, amortization of lease costs, effective interest income, deferred income from unconsolidated joint ventures, non - cash compensation charges, capitalized interest and non - cash interest charges . Funds From Operations (“FFO”) : A s defined by NAREIT, net income available to common stockholders (computed in accordance with U . S . GAAP) excluding gains or losses on the sale of real estate and impairment write - downs of depreciable real estate plus real estate depreciation and amortization, and after adjustments for unconsolidated partnerships and joint ventures . GAAP Lease Yield : GAAP rent divided by the sum of the purchase price and transaction costs . GAAP Rent : Total rent we will receive as a fixed amount over the initial term of the lease and recognized evenly over that term . GAAP rent recorded in the early years of a lease is higher than the cash rent received and during the later years of the lease, the cash rent received is higher than GAAP rent recognized . GAAP rent is commonly referred to as straight - line rental income . Gross Asset Value : The carrying amount of total assets after adding back accumulated depreciation and loan loss reserves, as reported in the company’s consolidated financial statements . Gross Investment : Original price paid for an asset plus capital improvements funded by LTC, without any depreciation deductions . Gross Investment is commonly referred to as undepreciated book value . Independent Living Communities (“ILF”) : Seniors housing properties offering a sense of community and numerous levels of service, such as laundry, housekeeping, dining options/meal plans, exercise and wellness programs, transportation, social, cultural and recreational activities, on - site security and emergency response programs . Many offer on - site conveniences like beauty/barber shops, fitness facilities, game rooms, libraries and activity centers . ILFs are also known as retirement communities or seniors apartments . Interest Income : Represents interest income from mortgage loans and other notes . Licensed Beds/Units : The number of beds and/or units that an operator is authorized to operate at seniors housing and long - term care properties . Licensed beds and/or units may differ from the number of beds and/or units in service at any given time . Memory Care Communities (“MC”) : Seniors housing properties offering specialized options for seniors with Alzheimer’s disease and other forms of dementia . These facilities offer dedicated care and specialized programming for various conditions relating to memory loss in a secured environment that is typically smaller in scale and more residential in nature than traditional assisted living facilities . These facilities have staff available 24 hours a day to respond to the unique needs of their residents . Metropolitan Statistical Areas (“MSA”) : Based on the U . S . Census Bureau, MSA is a geographic entity defined by the Office of Management and Budget (OMB) for use by Federal statistical agencies in collecting, tabulating, and publishing Federal statistics . A metro area contains a core urban area of 50 , 000 or more population . MSAs 1 to 31 have a population of 20 . 3 M – 2 . 1 M . MSAs 32 to 100 have a population of 2 . 1 M – 0 . 6 M . MSAs less than 100 have a population of 0 . 5 M – 55 K . Cities in a Micro - SA have a population of 216 K – 13 K . Cities not in a MSA has population of less than 100 K . Mezzanine : In certain circumstances, the Company strategically allocates a portion of its capital deployment toward mezzanine loans to grow relationships with operating companies that have not typically utilized sale leaseback financing as a component of their capital structure . Mezzanine financing sits between senior debt and common equity in the capital structure, and typically is used to finance development projects or value - add opportunities on existing operational properties . We seek market - based, risk - adjusted rates of return typically between 12 - 18 % with the loan term typically between four to eight years . Security for mezzanine loans can include all or a portion of the following credit enhancements ; secured second mortgage, pledge of equity interests and personal/corporate guarantees . Mezzanine loans can be recorded for GAAP purposes as either a loan or joint venture depending upon specifics of the loan terms and related credit enhancements . GLOSSARY I 26 GLOSSARY
4Q 2020 SUPPLEMENTAL REPORT Micropolitan Statistical Areas (“Micro - SA”) : Based on the U . S . Census Bureau, Micro - SA is a geographic entity defined by the Office of Management and Budget (OMB) for use by Federal statistical agencies in collecting, tabulating, and publishing Federal statistics . A micro area contains an urban core of at least 10 , 000 population . Mortgage Loan : Mortgage financing is provided on properties based on our established investment underwriting criteria and secured by a first mortgage . Subject to underwriting, additional credit enhancements may be required including, but not limited to, personal/corporate guarantees and debt service reserves . When possible, LTC attempts to negotiate a purchase option to acquire the property at a future time and lease the property back to the borrower . Net Real Estate Assets : Gross real estate investment less accumulated depreciation . Net Real Estate Asset is commonly referred to as Net Book Value (“NBV”) . Non - cash Rental Income : Straight - line rental income and amortization of lease inducement . Non - cash Compensation Charges : Vesting expense relating to stock options and restricted stock . Normalized EBITDAR Coverage : The trailing twelve month’s earnings from the operator financial statements adjusted for non - recurring, infrequent, or unusual items and before interest, taxes, depreciation, amortization, and rent divided by the operator’s contractual lease rent . Management fees are imputed at 5 % of revenues . Normalized EBITDARM Coverage : The trailing twelve month’s earnings from the operator financial statements adjusted for non - recurring, infrequent, or unusual items and before interest, taxes, depreciation, amortization, rent, and management fees divided by the operator’s contractual lease rent . Occupancy : The weighted average percentage of all beds and/or units that are occupied at a given time . The calculation uses the trailing twelve months and is based on licensed beds and/or units which may differ from the number of beds and/or units in service at any given time . Operator Financial Statements : Property level operator financial statements which are unaudited and have not been independently verified by us . Payor Source : LTC revenue by operator underlying payor source for the period presented . LTC is not a Medicaid or a Medicare recipient . Statistics represent LTC's rental revenues times operators' underlying payor source revenue percentage . Underlying payor source revenue percentage is calculated from property level operator financial statements which are unaudited and have not been independently verified by us . Private Pay : Private pay includes private insurance, HMO, VA, and other payors . Provider Relief Fund (“PRF”) : Formally known as the Public Health and Social Service Emergency Fund, the PRF was established under the Coronavirus Aid, Relief, And Economic Security Act passed on March 27 , 2020 to provide relief to hospitals and healthcare providers on the front lines of the coronavirus response . The initial allocation to the PRF was $ 100 billion, which was subsequently increased to $ 175 billion under the Paycheck Protection Program and Healthcare Enhancement Act . The Provider Relief Fund excludes, among other mechanisms of coronavirus - related support, funds from the Paycheck Protection Program (PPP), suspension of the Medicare sequestration cut, and increases to the Federal Medical Assistance Percentages (FMAP) . Purchase Price : Represents the fair value price of an asset that is exchanged in an orderly transaction between market participants at the measurement date . An orderly transaction is a transaction that assumes exposure to the market for a period prior to the measurement date to allow for marketing activities that are usual and customary for transactions involving such assets ; it is not a forced transaction (for example, a forced liquidation or distress sale) . Rental Income : Represents GAAP rent net of amortized lease inducement cost . Same Property Portfolio (“SPP”) : Same property statistics allow for the comparative evaluation of performance across a consistent population of LTC’s leased property portfolio and the Prestige Healthcare mortgage loan portfolio . Our SPP is comprised of stabilized properties occupied and operated throughout the duration of the quarter - over - quarter comparison periods presented (excluding assets sold and assets held - for - sale) . Accordingly, a property must be occupied and stabilized for a minimum of 15 months to be included in our SPP . Skilled Nursing Properties (“SNF”) : Seniors housing properties providing restorative, rehabilitative and nursing care for people not requiring the more extensive and sophisticated treatment available at acute care hospitals . Many SNFs provide ancillary services that include occupational, speech, physical, respiratory and IV therapies, as well as sub - acute care services which are paid either by the patient, the patient’s family, private health insurance, or through the federal Medicare or state Medicaid programs . Stabilized : Properties are generally considered stabilized upon the earlier of achieving certain occupancy thresholds (e . g . 80 % for SNFs and 90 % for ALFs) and, as applicable, 12 months from the date of acquisition/lease transition or, in the event of a de novo development, redevelopment, major renovations or addition, 24 months from the date the property is first placed in or returned to service, or properties acquired in lease - up . Under Development Properties (“UDP”) : Development projects to construct seniors housing properties . GLOSSARY I 27 GLOSSARY