Attached files
| file | filename |
|---|---|
| 8-K - FORM 8-K - Blue Apron Holdings, Inc. | tm217072d1_8k.htm |
Exhibit 99.1

Fourth Quarter and Full Year 2020 Results Earnings Call

Disclaimer: Forward Looking Statements and Use of Non-GAAP Information This presentation includes statements concerning Blue Apron Holdings, Inc. and its future expectations, plans and prospects that constitute "forward-looking statements" within the meaning of the Private Securities Litigation Reform Act of 1995. For this purpose, any statements contained herein that are not statements of historical fact may be deemed to be forward-looking statements. In some cases, you can identify forward-looking statements by terms such as "may," "should," "expects," "plans," “forecasts,” "anticipates," "could," "intends," "target," "projects," "contemplates," "believes," "estimates," "predicts," "potential," or "continue," or the negative of these terms or other similar expressions. Blue Apron has based these forward-looking statements largely on its current expectations and projections about future events and financial trends that it believes may affect its business, financial condition and results of operations. These forward-looking statements speak only as of the date of this presentation and are subject to a number of risks, uncertainties and assumptions including, without limitation, the company achieving its expectations with regards to its expenses and net revenue and its ability to grow adjusted EBITDA and to achieve or maintain profitability, the continued sufficiency of the company’s cash resources, the company’s need for additional financing, its ability to effectively manage expenses and cash flows, and its ability to remain in compliance with the financial and other covenants under the company’s indebtedness; its ability to sustain the increased demand resulting from the COVID-19 pandemic and the company’s growth strategy, and to retain new customers; its ability, including the timing and extent, to sufficiently manage costs and to fund investments in operations from cash from operations or additional financings in amounts necessary to continue to support the execution of the company’s growth strategy; its ability, including the timing and extent, to successfully execute the company’s growth strategy, cost-effectively attract new customers and retain existing customers, continue to expand its direct-to-consumer product offerings and continue to benefit from the implementation of operational efficiency practices; changes in consumer behaviors that could lead to declines in demand, both as the pandemic’s impact on consumer behavior tapers, particularly as a result of fewer restrictions on dining options, and as a COVID-19 vaccine becomes widely available in the United States, and/or if consumer spending habits are negatively impacted by worsening economic conditions; any material and adverse impact of the COVID-19 pandemic on the company’s operations and results, including as a result of the company’s inability to meet demand due to loss of adequate labor, whether as a result of heightened absenteeism or challenges in recruiting and retention or otherwise, prolonged closures, or series of temporary closures, of one or more fulfillment centers and supply chain or carrier interruptions or delays; its ability to attract and retain qualified employees and key personnel in sufficient numbers; its ability to effectively compete; its ability to maintain and grow the value of the company’s brand and reputation; its expectations regarding, and the stability of, its supply chain, including potential shortages or interruptions in the supply or delivery of ingredients, as a result of COVID-19 or otherwise; its ability to maintain food safety and prevent food-borne illness incidents and its susceptibility to supplier-initiated recalls; its ability to accommodate general changes in consumer tastes and preferences or in consumer spending; its ability to comply with modified or new laws and regulations applying to its business; risks resulting from its vulnerability to adverse weather conditions, natural disasters and public health crises, including pandemics; its ability to obtain and maintain intellectual property protection; and other risks more fully described in the company’s Quarterly Report on Form 10-Q for the quarter ended September 30, 2020 filed with the Securities and Exchange Commission (“SEC”) on October 29, 2020, the company’s Annual Report on Form 10-K for the year ended December 31, 2020 to be filed with the SEC, and in other filings that the company may make with the SEC in the future. The company assumes no obligation to update any forward-looking statements contained in this presentation as a result of new information, future events or otherwise.This presentation also includes adjusted EBITDA, which is a non-GAAP financial measure that is not prepared in accordance with, nor an alternative to, financial measures prepared in accordance with U.S. generally accepted accounting principles (“GAAP”). In addition, this non-GAAP financial measure is not based on any standardized methodology prescribed by GAAP and is not necessarily comparable to similarly-titled measures presented by other companies. A reconciliation of this measure to the most directly comparable GAAP measure is included in the Appendix to this presentation.Certain data in this presentation was obtained from various external sources, and neither the company nor its affiliates, advisors, or representatives make any representation as to the accuracy or completeness of that data or any commitment to update such data after the date of this presentation. Such data involve risks and uncertainties and are subject to change based on various factors.2

Fourth Quarter 2020Business Highlights

Linda Findley Kozlowski President and Chief Executive Officer4

Fourth Quarter 2020 Business Highlights● Net revenue for the fourth quarter of 2020 increased 22% year over year to $115.5 million driven, in part, by the continued execution of the company’s growth strategy, including through product innovation● Key customer metrics’ year-over-year growth continued in the fourth quarter as Average Order Value grew 6% to over $61, the highest reported level since prior to 2015; Orders per Customer rose 15% year over year to 5.3 and Average Revenue per Customer increased 22% to $327 ⁽¹⁾, ⁽²⁾, ⁽³⁾● Net loss improved $10.0 million, or 46%, year over year in the fourth quarter to $(11.9) million; adjusted EBITDA improved $6.7 million, or 80%, year over year to $(1.7) million ⁽⁴⁾● Strengthened executive team with the appointments of Randy Greben as Chief Financial Officer and Charlean Gmunder as Chief Operating Officer1 We define Average Revenue per Customer as our net revenue from our meal, wine and market products sold on our e‑commerce platforms in a given reporting period divided by the number of Customers in that period. 2 We define Orders Per Customer as the number of Orders in a given reporting period divided by the number of Customers in that period. Orders is defined as the number of paid orders by our Customers across our meal, wine and market products sold on our e-commerce platforms in any reporting period, inclusive of orders that may have eventually been refunded or credited to customers. We determine our number of Customers by counting the total number of individual customers who have paid for at least one Order from Blue Apron across our meal, wine or market products sold on our e-commerce platforms in a given reporting period. 3 We define Average Order Value as our net revenue from our meal, wine and market products sold on our e-commerce platforms in a given reporting period divided by the number of Orders in that period. 4 Adjusted EBITDA is defined as net income (loss) before interest income (expense), net, other operating expense, other income (expense), net, benefit (provision) for 5 income taxes, depreciation and amortization and share-based compensation expense. See appendix for reconciliation of net income (loss) to Adjusted EBITDA.

Business Highlights Product ● Introduced more new products in 2020 than any prior year ● Launched Blue Apron Customized, and the option to place multiple orders per week or wine orders per month ● Announced our Wellness 360 program, showcasing how home cooking can benefit holistic wellness ● Offered occasion-based boxes to help customers celebrate around food moments, including a Thanksgiving Box with Chef Edouardo Jordan and a football game-day experience with Stella Artois Operations ● Furthered progress with our operating efficiencies to overcome labor availability challenges, including increased line speed, overall labor utilization and equipment optimization ● Reopened our Arlington facility temporarily in January 2021 ● Continued leveraging of supply chain and supplier network to expand the ingredients available, and to support our new customization and premium options Marketing ● Sustained efficiency improvements in marketing spend to accelerate faster paybacks ● Stepped up investment in marketing spend in Q1 2021 to leverage improved efficiency

Fourth Quarter and Full Year 2020Financial Results

Randy Greben Chief Financial Officer

Fourth Quarter Performance Third consecutive quarter of double-digit year over year net revenue growth despite ongoing labor availability challenges resulting in capacity constraints and moderate marketing spend contributed to decrease in customersNet Revenue ($M) $115.5 Million +22% YoYMarketing ($M) 10.8% As a percentage of Net Revenue% of Net Revenue12.8% 14.8% 8.8% 9.7% 10.8%9
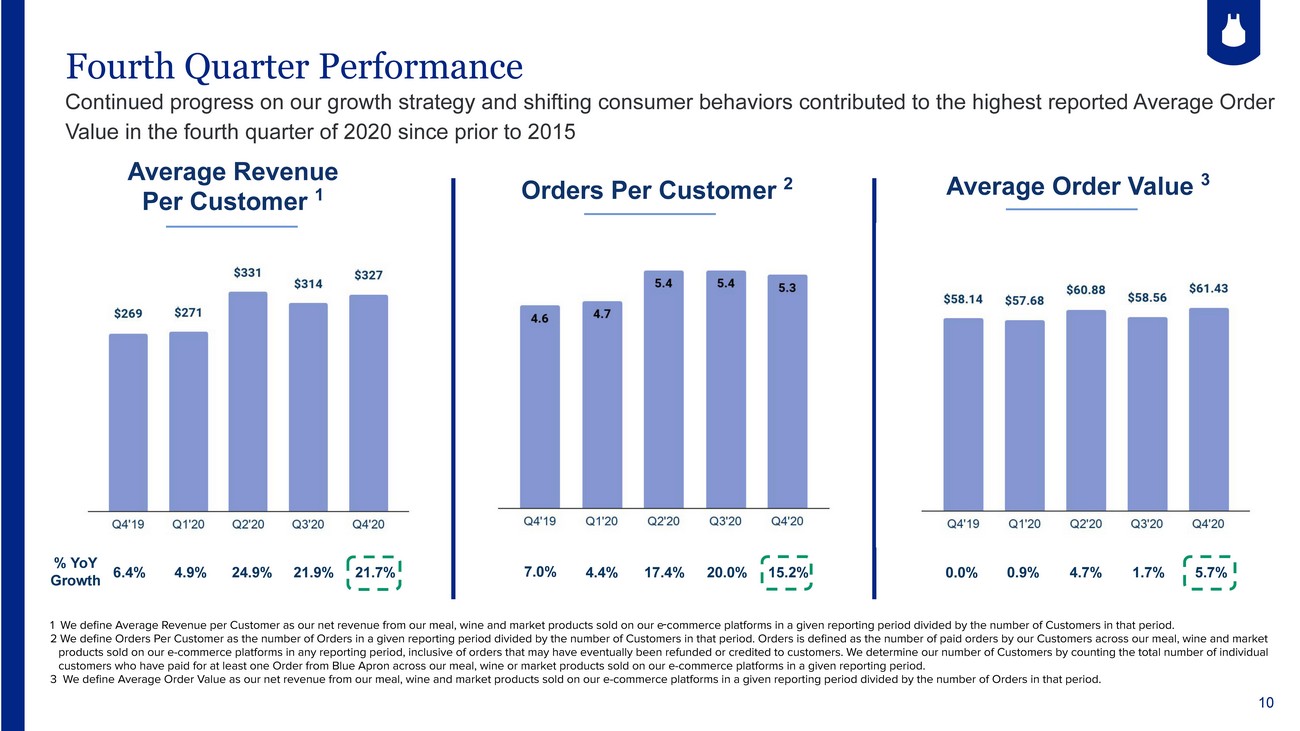
Fourth Quarter Performance Continued progress on our growth strategy and shifting consumer behaviors contributed to the highest reported Average Order Value in the fourth quarter of 2020 since prior to 2015Average Revenue Per Customer ¹Orders Per Customer ²Average Order Value ³% YoY Growth6.4% 4.9%24.9% 21.9% 21.7%7.0%4.4% 17.4% 20.0%15.2%0.0%0.9% 4.7%1.7%5.7%1 We define Average Revenue per Customer as our net revenue from our meal, wine and market products sold on our e‑commerce platforms in a given reporting period divided by the number of Customers in that period. 2 We define Orders Per Customer as the number of Orders in a given reporting period divided by the number of Customers in that period. Orders is defined as the number of paid orders by our Customers across our meal, wine and market products sold on our e-commerce platforms in any reporting period, inclusive of orders that may have eventually been refunded or credited to customers. We determine our number of Customers by counting the total number of individual customers who have paid for at least one Order from Blue Apron across our meal, wine or market products sold on our e-commerce platforms in a given reporting period. 3 We define Average Order Value as our net revenue from our meal, wine and market products sold on our e-commerce platforms in a given reporting period divided by the number of Orders in that period.10

Fourth Quarter Performance Ongoing commitment to cost discipline improved net revenue less COGS margin year over year, PTG&A increase driven by increased bonus expense across both facility and corporate personnelNet Revenue Less COGS Margin ¹ 39.4% +40 bps YoYPTG&A ($M) $36.8 Million +4.3% YoY% of Net Revenue1 Represents net revenue less cost of goods sold, excluding depreciation and amortization, as a percentage of net revenue.37.5% 33.6% 24.8% 30.0% 31.9%11

Fourth Quarter Performance Year-over-year improvement on the bottom line driven by higher net revenue as well as continued operational efficiencies and cost optimization 1 Adjusted EBITDA is defined as net income (loss) before interest income (expense), net, other operating expense, other income (expense), net, benefit (provision) for income taxes, depreciation and amortization and share-based compensation expense. See appendix for reconciliation of net income (loss) to Adjusted EBITDA.

Financial Outlook

First Quarter and Full Year 2021 OutlookTaking into account the company’s business trends, historical seasonal factors, continuing impact of the pandemic on consumer behavior, and plans to increase marketing investments¹… ● Net revenue expected to increase in the first quarter of 2021 approximately 23% - 27% year over year to approximately $125 million to $129 million, with a quarterly sequential and year over year increase in Customers● Net loss projected to be no more than $(16.0) million and Adjusted EBITDA² loss projected to be no more than $(6.0) million in the first quarter of 2021● For the full year 2021, the company expects to generate double-digit net revenue growth1 This guidance assumes that the company will not experience any significant disruptions in its operations or supply chain as a result of the COVID-19 pandemic or otherwise. In addition, because the timing of the onion recall recovery remains uncertain, we are not assuming receipt of the up to $2.0 million of credits in our first quarter outlook. 2 Adjusted EBITDA is defined as net income (loss) before interest income (expense), net, other operating expense, other income (expense), net, benefit (provision) for income taxes, depreciation and amortization and share-based compensation expense. See appendix for reconciliation of net income (loss) to Adjusted EBITDA. 14

Q&A

Blue Apron

Appendix: Adjusted EBITDA Reconciliation

Reconciliation of Quarterly Net Income (Loss) to Adjusted EBITDA Q4 2019 Q1 2020 Q2 2020 Q3 2020 Q4 2020 Q1 2021 Guidance (in millions) Net income (loss) $(22) $(20) $1 $(15) $(12) $(16) Share-based compensation 3 2 2 2 2 2 Depreciation and amortization 7 7 6 6 6 6 Other operating expense 2 3 0 1 0 0 Interest (income) expense, net 2 2 2 1 2 2 Provision (benefit) for income taxes 0 0 0 0 0 0 Adjusted EBITDA $(8) $(6) $11 $(5) $(2) $(6)

Blue Apron