Attached files
| file | filename |
|---|---|
| EX-99.1 - EX-99.1 - TANGER FACTORY OUTLET CENTERS, INC | skt8kex991december312020.htm |
| 8-K - 8-K - TANGER FACTORY OUTLET CENTERS, INC | skt-20210217.htm |
Exhibit 99.2

Tanger Factory Outlet Centers, Inc.
Supplemental Operating and Financial Data
December 31, 2020
Supplemental Operating and Financial Data for the
Quarter Ended 12/31/2020

Notice
For a more detailed discussion of the factors that affect our operating results, interested parties should review the Tanger Factory Outlet Centers, Inc. Annual Report on Form 10-K for the year ended December 31, 2019 and for fiscal year ended December 31, 2020 when available.
This Supplemental Portfolio and Financial Data is not an offer to sell or a solicitation to buy any securities of the Company. Any offers to sell or solicitations to buy any securities of the Company shall be made only by means of a prospectus.
2
Supplemental Operating and Financial Data for the
Quarter Ended 12/31/2020
Table of Contents
| Section | |||||
| Portfolio Data: | |||||
| Geographic Diversification | |||||
| Property Summary - Occupancy at End of Each Period Shown | |||||
| Portfolio Occupancy at the End of Each Period | |||||
| Outlet Center Ranking | |||||
| Top 25 Tenants Based on Percentage of Total Annualized Base Rent | |||||
Lease Expirations as of December 31, 2020 | |||||
| Capital Expenditures | |||||
| Leasing Activity | |||||
| Financial Data: | |||||
| Consolidated Balance Sheets | |||||
| Consolidated Statements of Operations | |||||
| Components of Rental Revenues | |||||
| Rental Revenues Collection Status | |||||
| Unconsolidated Joint Venture Information | |||||
| Debt Outstanding Summary | |||||
| Future Scheduled Principal Payments | |||||
| Senior Unsecured Notes Financial Covenants | |||||
| Enterprise Value, Net Debt, Liquidity, Debt Ratios and Credit Ratings | |||||
| Non-GAAP and Supplemental Measures: | |||||
| Non-GAAP Definitions | |||||
| FFO and FAD Analysis | |||||
| Portfolio NOI and Same Center NOI | |||||
| Adjusted EBITDA and EBITDAre | |||||
| Pro Rata Balance Sheet Information | |||||
| Pro Rata Statement of Operations Information | |||||
| Investor Information | |||||
3
Supplemental Operating and Financial Data for the
Quarter Ended 12/31/2020
Geographic Diversification
As of December 31, 2020
Consolidated Properties
| State | # of Centers | GLA | % of GLA | ||||||||||||||
| South Carolina | 5 | 1,604,510 | 13 | % | |||||||||||||
| New York | 2 | 1,468,668 | 12 | % | |||||||||||||
| Georgia | 3 | 1,121,579 | 9 | % | |||||||||||||
| Pennsylvania | 3 | 999,416 | 8 | % | |||||||||||||
| Texas | 2 | 823,557 | 7 | % | |||||||||||||
| Michigan | 2 | 671,560 | 6 | % | |||||||||||||
| Delaware | 1 | 557,392 | 5 | % | |||||||||||||
| Alabama | 1 | 554,649 | 5 | % | |||||||||||||
| New Jersey | 1 | 489,718 | 4 | % | |||||||||||||
| Tennessee | 1 | 447,810 | 4 | % | |||||||||||||
| North Carolina | 2 | 422,895 | 4 | % | |||||||||||||
| Ohio | 1 | 411,915 | 3 | % | |||||||||||||
| Arizona | 1 | 410,753 | 3 | % | |||||||||||||
| Florida | 1 | 351,721 | 3 | % | |||||||||||||
| Missouri | 1 | 329,861 | 3 | % | |||||||||||||
| Mississippi | 1 | 324,717 | 3 | % | |||||||||||||
| Louisiana | 1 | 321,066 | 3 | % | |||||||||||||
| Connecticut | 1 | 311,299 | 3 | % | |||||||||||||
| New Hampshire | 1 | 250,107 | 2 | % | |||||||||||||
| Total | 31 | 11,873,193 | 100 | % | |||||||||||||
| Unconsolidated Joint Venture Properties | |||||||||||||||||
| # of Centers | GLA | Ownership % | |||||||||||||||
| Charlotte, NC | 1 | 398,676 | 50.00 | % | |||||||||||||
| Ottawa, ON | 1 | 357,217 | 50.00 | % | |||||||||||||
| Columbus, OH | 1 | 355,245 | 50.00 | % | |||||||||||||
| Texas City, TX | 1 | 352,705 | 50.00 | % | |||||||||||||
| National Harbor, MD | 1 | 341,156 | 50.00 | % | |||||||||||||
| Cookstown, ON | 1 | 307,883 | 50.00 | % | |||||||||||||
| Saint-Sauveur, QC | 1 | 99,405 | 50.00 | % | |||||||||||||
| Total | 7 | 2,212,287 | |||||||||||||||
| Grand Total | 38 | 14,085,480 | |||||||||||||||
4
Supplemental Operating and Financial Data for the
Quarter Ended 12/31/2020
Property Summary - Occupancy at End of Each Period Shown
Consolidated properties
| Location | Total GLA 12/31/20 | % Occupied 12/31/20 | % Occupied 09/30/20 | % Occupied 12/31/19 | ||||||||||||||||||||||
| Deer Park, NY | 739,110 | 89 | % | 93 | % | 99 | % | |||||||||||||||||||
| Riverhead, NY | 729,558 | 89 | % | 92 | % | 97 | % | |||||||||||||||||||
| Rehoboth Beach, DE | 557,392 | 92 | % | 93 | % | 99 | % | |||||||||||||||||||
| Foley, AL | 554,649 | 89 | % | 89 | % | 94 | % | |||||||||||||||||||
| Atlantic City, NJ | 489,718 | 79 | % | 79 | % | 80 | % | |||||||||||||||||||
| San Marcos, TX | 471,816 | 91 | % | 93 | % | 96 | % | |||||||||||||||||||
| Sevierville, TN | 447,810 | 99 | % | 99 | % | 100 | % | |||||||||||||||||||
| Savannah, GA | 429,089 | 97 | % | 99 | % | 98 | % | |||||||||||||||||||
| Myrtle Beach Hwy 501, SC | 426,523 | 98 | % | 98 | % | 98 | % | |||||||||||||||||||
| Jeffersonville, OH | 411,915 | 78 | % | 80 | % | 92 | % | |||||||||||||||||||
| Glendale, AZ (Westgate) | 410,753 | 95 | % | 92 | % | 100 | % | |||||||||||||||||||
| Myrtle Beach Hwy 17, SC | 403,425 | 100 | % | 99 | % | 100 | % | |||||||||||||||||||
| Charleston, SC | 386,328 | 95 | % | 93 | % | 100 | % | |||||||||||||||||||
| Lancaster, PA | 375,857 | 98 | % | 97 | % | 95 | % | |||||||||||||||||||
| Pittsburgh, PA | 373,863 | 91 | % | 92 | % | 97 | % | |||||||||||||||||||
| Commerce, GA | 371,408 | 93 | % | 94 | % | 97 | % | |||||||||||||||||||
| Grand Rapids, MI | 357,122 | 87 | % | 89 | % | 97 | % | |||||||||||||||||||
| Fort Worth, TX | 351,741 | 98 | % | 99 | % | 100 | % | |||||||||||||||||||
| Daytona Beach, FL | 351,721 | 98 | % | 97 | % | 99 | % | |||||||||||||||||||
| Branson, MO | 329,861 | 98 | % | 100 | % | 100 | % | |||||||||||||||||||
| Southaven, MS | 324,717 | 98 | % | 97 | % | 100 | % | |||||||||||||||||||
| Locust Grove, GA | 321,082 | 96 | % | 98 | % | 100 | % | |||||||||||||||||||
| Gonzales, LA | 321,066 | 98 | % | 97 | % | 99 | % | |||||||||||||||||||
| Mebane, NC | 318,886 | 97 | % | 97 | % | 100 | % | |||||||||||||||||||
| Howell, MI | 314,438 | 76 | % | 80 | % | 94 | % | |||||||||||||||||||
| Mashantucket, CT (Foxwoods) | 311,299 | 81 | % | 88 | % | 95 | % | |||||||||||||||||||
| Tilton, NH | 250,107 | 84 | % | 87 | % | 96 | % | |||||||||||||||||||
| Hershey, PA | 249,696 | 95 | % | 100 | % | 100 | % | |||||||||||||||||||
| Hilton Head II, SC | 206,564 | 93 | % | 89 | % | 92 | % | |||||||||||||||||||
| Hilton Head I, SC | 181,670 | 95 | % | 93 | % | 100 | % | |||||||||||||||||||
| Blowing Rock, NC | 104,009 | 85 | % | 89 | % | 89 | % | |||||||||||||||||||
| Terrell, TX | N/A | N/A | N/A | 97 | % | |||||||||||||||||||||
| Total | 11,873,193 | 92 | % | 93 | % | 97 | % | |||||||||||||||||||
5
Supplemental Operating and Financial Data for the
Quarter Ended 12/31/2020
Unconsolidated joint venture properties
| Location | Total GLA 12/31/20 | % Occupied 12/31/20 | % Occupied 09/30/20 | % Occupied 12/31/19 | ||||||||||||||||||||||
| Charlotte, NC | 398,676 | 98 | % | 98 | % | 99 | % | |||||||||||||||||||
| Ottawa, ON | 357,217 | 96 | % | 96 | % | 97 | % | |||||||||||||||||||
| Columbus, OH | 355,245 | 95 | % | 97 | % | 98 | % | |||||||||||||||||||
| Texas City, TX (Galveston/Houston) | 352,705 | 93 | % | 91 | % | 98 | % | |||||||||||||||||||
| National Harbor, MD | 341,156 | 99 | % | 99 | % | 99 | % | |||||||||||||||||||
| Cookstown, ON | 307,883 | 94 | % | 92 | % | 100 | % | |||||||||||||||||||
| Saint-Sauveur, QC | 99,405 | 87 | % | 87 | % | 92 | % | |||||||||||||||||||
| Total | 2,212,287 | 96 | % | 95 | % | 98 | % | |||||||||||||||||||
6
Supplemental Operating and Financial Data for the
Quarter Ended 12/31/2020
Portfolio Occupancy at the End of Each Period (1)
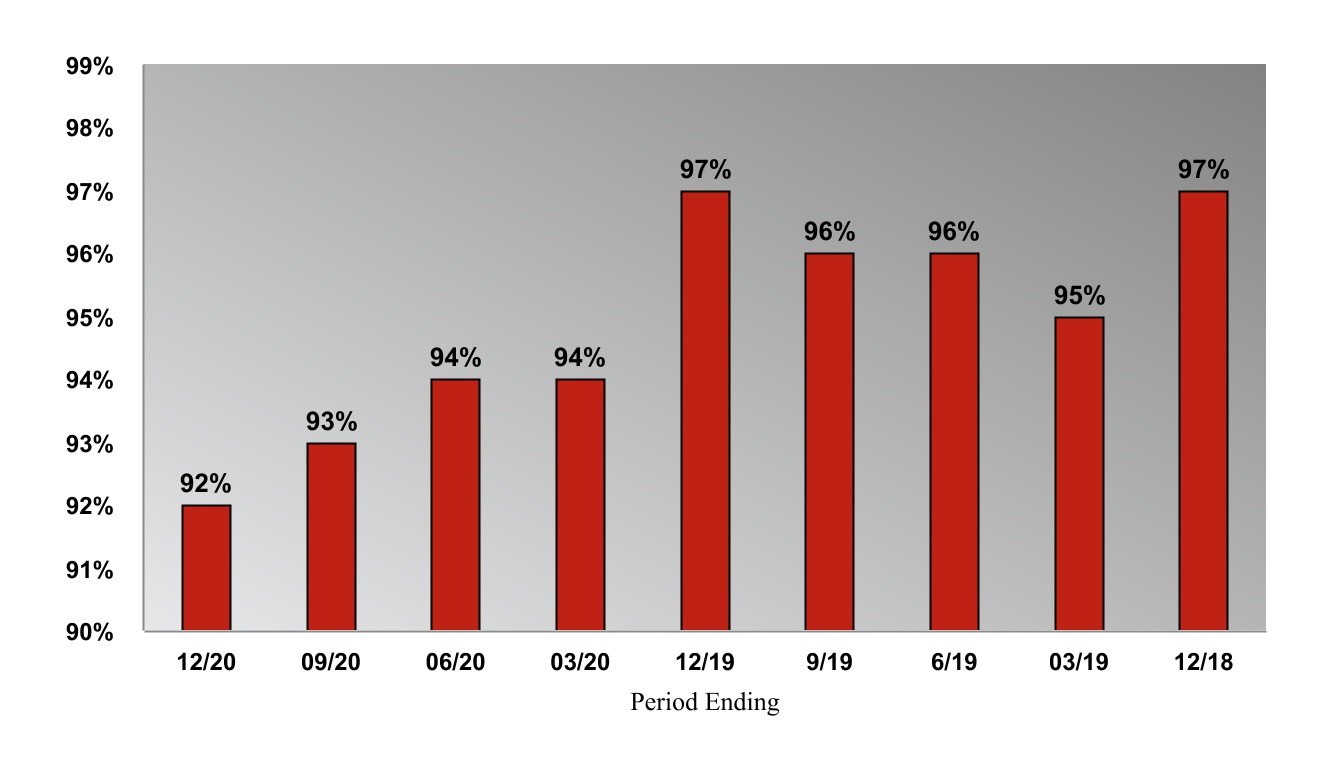
(1) Excludes unconsolidated outlet centers. See table on page 4.
7
Supplemental Operating and Financial Data for the
Quarter Ended 12/31/2020
Outlet Center Ranking as of December 31, 2020 (1)
Ranking (2) | Period End Occupancy | Sq Ft (thousands) | % of Square Feet | % of Portfolio NOI (3) | |||||||||||||||||||
| Consolidated Centers | |||||||||||||||||||||||
| Centers 1 - 5 | 92 | % | 2,649 | 22 | % | 30 | % | ||||||||||||||||
| Centers 6 - 10 | 97 | % | 1,985 | 17 | % | 23 | % | ||||||||||||||||
| Centers 11 - 15 | 94 | % | 1,496 | 13 | % | 12 | % | ||||||||||||||||
| Centers 16 - 20 | 92 | % | 1,969 | 17 | % | 15 | % | ||||||||||||||||
| Centers 21 - 25 | 90 | % | 2,064 | 17 | % | 14 | % | ||||||||||||||||
| Centers 26 - 31 | 86 | % | 1,710 | 14 | % | 6 | % | ||||||||||||||||
Ranking (2) | Cumulative Period End Occupancy | Cumulative Sq Ft (thousands) | Cumulative % of Square Feet | Cumulative % of Portfolio NOI (3) | |||||||||||||||||||
| Consolidated Centers | |||||||||||||||||||||||
| Centers 1 - 5 | 92 | % | 2,649 | 22 | % | 30 | % | ||||||||||||||||
| Centers 1 - 10 | 94 | % | 4,634 | 39 | % | 53 | % | ||||||||||||||||
| Centers 1 - 15 | 94 | % | 6,130 | 52 | % | 65 | % | ||||||||||||||||
| Centers 1 - 20 | 94 | % | 8,099 | 69 | % | 80 | % | ||||||||||||||||
| Centers 1 - 25 | 93 | % | 10,163 | 86 | % | 94 | % | ||||||||||||||||
| Centers 1 - 31 | 92 | % | 11,873 | 100 | % | 100 | % | ||||||||||||||||
Unconsolidated centers (4) | 96 | % | 1,448 | n/a | n/a | ||||||||||||||||||
Domestic centers (5) | 92 | % | 13,321 | n/a | n/a | ||||||||||||||||||
| (1) | Centers are ranked by sales per square foot for the trailing twelve months ended December 31, 2020, and sales per square foot include stores that have been occupied for a minimum of 12 months and are less than 20,000 square feet. Due to the portfolio-wide store closures experienced during the second quarter of 2020 as a result of COVID-19 mandates, sales per square foot is not separately presented herein. | ||||||||||||||||||||||
| (2) | Outlet centers included in each ranking group above are as follows (in alphabetical order): | ||||||||||||||||||||||
| Centers 1 - 5: | Deer Park, NY | Glendale, AZ (Westgate) | Locust Grove, GA | Riverhead, NY | Sevierville, TN | ||||||||||||||||||
| Centers 6 - 10: | Branson, MO | Lancaster, PA | Mebane, NC | Myrtle Beach Hwy 17, SC | Rehoboth Beach, DE | ||||||||||||||||||
| Centers 11 - 15: | Charleston, SC | Gonzales, LA | Grand Rapids, MI | Hershey, PA | Hilton Head I, SC | ||||||||||||||||||
| Centers 16 - 20: | Atlantic City, NJ | Fort Worth, TX | Pittsburgh, PA | Savannah, GA | Southaven, MS | ||||||||||||||||||
| Centers 21 - 25: | Commerce, GA | Daytona Beach, FL | Foley, AL | Howell, MI | San Marcos, TX | ||||||||||||||||||
| Centers 26 - 31: | Blowing Rock, NC | Hilton Head II, SC | Jeffersonville, OH | Mashantucket, CT (Foxwoods) | Myrtle Beach Hwy 501, SC | Tilton, NH | |||||||||||||||||
| (3) | Based on the Company’s forecast of 2021 Portfolio NOI (see non-GAAP definitions), excluding centers not yet stabilized (none). The Company’s forecast is based on management’s estimates as of December 31, 2020 and may be considered a forward-looking statement that is subject to risks and uncertainties. Actual results could differ materially from those projected due to various factors including, but not limited to, the risks associated with general economic and real estate conditions. For a more detailed discussion of the factors that affect operating results, interested parties should review the Tanger Factory Outlet Centers, Inc. Annual Report on Form 10-K for the year ended December 31, 2019 and December 31, 2020, when available. | ||||||||||||||||||||||
| (4) | Includes domestic outlet centers open 12 full calendar months (in alphabetical order): | ||||||||||||||||||||||
| Unconsolidated: | Charlotte, NC | Columbus, OH | National Harbor, MD | Texas City, TX (Galveston/Houston) | |||||||||||||||||||
| (5) | Includes consolidated portfolio and domestic unconsolidated joint ventures. | ||||||||||||||||||||||
8
Supplemental Operating and Financial Data for the
Quarter Ended 12/31/2020
Top 25 Tenants Based on Percentage of Total Annualized Base Rent
As of December 31, 2020 (1)
| Consolidated | Unconsolidated | |||||||||||||||||||||||||||||||
| Tenant | Brands | # of Stores | GLA | % of Total GLA | % of Total Annualized Base Rent (2) | # of Stores | ||||||||||||||||||||||||||
| The Gap, Inc. | Gap, Banana Republic, Janie & Jack, Old Navy | 94 | 926,819 | 7.8 | % | 6.6 | % | 19 | ||||||||||||||||||||||||
| PVH Corp. | Tommy Hilfiger, Van Heusen, Calvin Klein | 59 | 376,121 | 3.2 | % | 4.5 | % | 14 | ||||||||||||||||||||||||
| Ascena Retail Group, Inc. | LOFT, Ann Taylor, Lane Bryant, Justice | 59 | 359,893 | 3.0 | % | 3.6 | % | 8 | ||||||||||||||||||||||||
| Under Armour, Inc. | Under Armour, Under Armour Kids | 30 | 233,877 | 2.0 | % | 3.1 | % | 6 | ||||||||||||||||||||||||
| SPARC Group | Aéropostale, Brooks Brothers, Forever 21, Lucky Brands, Nautica | 61 | 361,884 | 3.0 | % | 3.1 | % | 8 | ||||||||||||||||||||||||
| American Eagle Outfitters, Inc. | American Eagle Outfitters, Aerie | 40 | 276,204 | 2.3 | % | 3.0 | % | 7 | ||||||||||||||||||||||||
| Nike, Inc. | Nike, Converse, Hurley | 35 | 404,195 | 3.4 | % | 2.9 | % | 9 | ||||||||||||||||||||||||
| Tapestry, Inc. | Coach, Kate Spade, Stuart Weitzman | 47 | 224,149 | 1.9 | % | 2.7 | % | 11 | ||||||||||||||||||||||||
| Carter’s, Inc. | Carters, OshKosh B Gosh | 48 | 211,701 | 1.8 | % | 2.3 | % | 10 | ||||||||||||||||||||||||
| Adidas AG | Adidas, Reebok | 31 | 198,425 | 1.7 | % | 2.2 | % | 11 | ||||||||||||||||||||||||
| Hanesbrands Inc. | Hanesbrands, Maidenform, Champion | 37 | 178,607 | 1.5 | % | 2.2 | % | 2 | ||||||||||||||||||||||||
| Capri Holdings Limited | Michael Kors, Michael Kors Men’s | 28 | 138,454 | 1.2 | % | 2.1 | % | 5 | ||||||||||||||||||||||||
| Signet Jewelers Limited | Kay Jewelers, Zales, Jared Vault | 48 | 108,923 | 0.9 | % | 2.1 | % | 8 | ||||||||||||||||||||||||
| Columbia Sportswear Company | Columbia Sportswear | 19 | 147,361 | 1.2 | % | 2.0 | % | 6 | ||||||||||||||||||||||||
| Skechers USA, Inc. | Skechers | 29 | 158,067 | 1.3 | % | 2.0 | % | 6 | ||||||||||||||||||||||||
| Chico’s, FAS Inc. | Chicos, White House/Black Market, Soma Intimates | 40 | 116,231 | 1.0 | % | 2.0 | % | 5 | ||||||||||||||||||||||||
| V. F. Corporation | The North Face, Vans, Timberland, Dickies | 27 | 143,207 | 1.2 | % | 1.9 | % | 2 | ||||||||||||||||||||||||
| Express Inc. | Express Factory | 24 | 168,000 | 1.4 | % | 1.8 | % | 4 | ||||||||||||||||||||||||
| Caleres Inc. | Famous Footwear, Naturalizer, Allen Edmonds | 31 | 160,018 | 1.4 | % | 1.7 | % | 10 | ||||||||||||||||||||||||
| Levi Strauss & Co. | Levi's | 28 | 116,486 | 1.0 | % | 1.6 | % | 5 | ||||||||||||||||||||||||
| L Brands, Inc. | Bath & Body Works, Victoria's Secret, Pink by Victoria's Secret | 30 | 118,516 | 1.0 | % | 1.6 | % | 7 | ||||||||||||||||||||||||
| Rack Room Shoes, Inc. | Rack Room Shoes | 22 | 129,699 | 1.1 | % | 1.6 | % | 2 | ||||||||||||||||||||||||
| Luxottica Group S.p.A. | Sunglass Hut, Oakley, Lenscrafters | 51 | 74,228 | 0.6 | % | 1.6 | % | 10 | ||||||||||||||||||||||||
| Ralph Lauren Corporation | Polo Ralph Lauren, Polo Children, Polo Ralph Lauren Big & Tall, Club Monaco | 33 | 358,736 | 3.0 | % | 1.6 | % | 6 | ||||||||||||||||||||||||
| Childrens Place | Childrens Place | 23 | 136,276 | 1.2 | % | 1.5 | % | 5 | ||||||||||||||||||||||||
| Total of Top 25 tenants | 974 | 5,826,077 | 49.1 | % | 61.3 | % | 186 | |||||||||||||||||||||||||
(1)Excludes leases that have been entered into but which tenant has not yet taken possession, temporary leases and month-to-month leases.
(2)Annualized base rent is defined as the minimum monthly payments due as of the end of the reporting period annualized, excluding periodic contractual fixed increases. Includes rents which are based on a percentage of sales in lieu of fixed contractual rents.
9
Supplemental Operating and Financial Data for the
Quarter Ended 12/31/2020
Lease Expirations as of December 31, 2020
Percentage of Total Gross Leasable Area (1)
Percentage of Total Annualized Base Rent (1)
(1) Excludes unconsolidated outlet centers. See table on page 5.
10
Supplemental Operating and Financial Data for the
Quarter Ended 12/31/2020
Capital Expenditures (in thousands)
| Year ended | ||||||||||||||
| December 31, | ||||||||||||||
| 2020 | 2019 | |||||||||||||
| Value-enhancing: | ||||||||||||||
| New center developments and expansions | $ | 2,432 | $ | 8,865 | ||||||||||
| Other | 1,074 | 1,584 | ||||||||||||
| 3,506 | 10,449 | |||||||||||||
| Recurring capital expenditures: | ||||||||||||||
| Second generation tenant allowances | 12,273 | 18,189 | ||||||||||||
| Operational capital expenditures | 9,205 | 18,549 | ||||||||||||
| Renovations | 5,505 | 2,930 | ||||||||||||
| 26,983 | 39,668 | |||||||||||||
| Total additions to rental property-accrual basis | 30,489 | 50,117 | ||||||||||||
| Conversion from accrual to cash basis | (1,923) | (2,232) | ||||||||||||
| Total additions to rental property-cash basis | $ | 28,566 | $ | 47,885 | ||||||||||
Leasing Activity
Re-tenant(1) | ||||||||||||||||||||
| Trailing twelve months ended: | # of Leases | Square Feet (in 000’s) | Average Annual Straight-line Rent (psf) | Average Tenant Allowance (psf)(2) | Average Initial Term (in years) | Net Average Annual Straight-line Rent (psf) (3) | ||||||||||||||
| 12/31/2020 | 70 | 350 | $ | 30.44 | $ | 66.43 | 6.96 | $ | 20.90 | |||||||||||
| 12/31/2019 | 113 | 460 | $ | 38.93 | $ | 43.48 | 7.89 | $ | 33.42 | |||||||||||
Renewal(1) | ||||||||||||||||||||
| Trailing twelve months ended: | # of Leases | Square Feet (in 000’s) | Average Annual Straight-line Rent (psf) | Average Tenant Allowance (psf)(2) | Average Initial Term (in years) | Net Average Annual Straight-line Rent (psf) (3) | ||||||||||||||
| 12/31/2020 | 209 | 1,132 | $ | 25.33 | $ | 1.23 | 3.79 | $ | 25.01 | |||||||||||
| 12/31/2019 | 224 | 1,064 | $ | 31.91 | $ | 0.59 | 3.54 | $ | 31.74 | |||||||||||
Total(1) | ||||||||||||||||||||
| Trailing twelve months ended: | # of Leases | Square Feet (in 000’s) | Average Annual Straight-line Rent (psf) | Average Tenant Allowance (psf)(2) | Average Initial Term (in years) | Net Average Annual Straight-line Rent (psf) (3) | ||||||||||||||
| 12/31/2020 | 279 | 1,483 | $ | 26.54 | $ | 16.64 | 4.54 | $ | 22.87 | |||||||||||
| 12/31/2019 | 337 | 1,524 | $ | 34.03 | $ | 13.54 | 4.85 | $ | 31.24 | |||||||||||
(1)Represents change in rent (base rent and common area maintenance (“CAM”)) for all leases for new stores that opened or renewals that started during the respective trailing twelve month periods within the consolidated portfolio, except for license agreements, seasonal tenants, and month-to-month leases.
(2)Includes other landlord costs.
(3)Net average straight-line base rent is calculated by dividing the average tenant allowance costs per square foot by the average initial term and subtracting this calculated number from the average straight-line base rent per year amount. The average annual straight-line base rent disclosed in the table above includes all concessions, abatements and reimbursements of rent to tenants. The average tenant allowance disclosed in the table above includes other landlord costs.
11
Supplemental Operating and Financial Data for the
Quarter Ended 12/31/2020
Leasing Activity(1)
| TTM ended | TTM ended | |||||||
| All Lease Terms | 12/31/2020 | 12/31/2019 | ||||||
| Re-tenanted Space: | ||||||||
| Number of leases | 70 | 113 | ||||||
| Gross leasable area | 350,402 | 460,170 | ||||||
| New initial rent per square foot | $ | 28.06 | $ | 35.28 | ||||
| Prior expiring rent per square foot | $ | 33.77 | $ | 36.13 | ||||
| Percent decrease | (16.9) | % | (2.4) | % | ||||
| New straight-line rent per square foot | $ | 30.44 | $ | 38.93 | ||||
| Prior straight-line rent per square foot | $ | 32.43 | $ | 35.88 | ||||
| Percent increase (decrease) | (6.1) | % | 8.5 | % | ||||
| Renewed Space: | ||||||||
| Number of leases | 209 | 224 | ||||||
| Gross leasable area | 1,132,125 | 1,064,262 | ||||||
| New initial rent per square foot | $ | 24.73 | $ | 30.98 | ||||
| Prior expiring rent per square foot | $ | 27.30 | $ | 31.22 | ||||
| Percent decrease | (9.4) | % | (0.8) | % | ||||
| New straight-line rent per square foot | $ | 25.33 | $ | 31.91 | ||||
| Prior straight-line rent per square foot | $ | 27.23 | $ | 31.93 | ||||
| Percent decrease | (7.0) | % | (0.1) | % | ||||
| Total Re-tenanted and Renewed Space: | ||||||||
| Number of leases | 279 | 337 | ||||||
| Gross leasable area | 1,482,527 | 1,524,432 | ||||||
| New initial rent per square foot | $ | 25.51 | $ | 32.28 | ||||
| Prior expiring rent per square foot | $ | 28.83 | $ | 32.70 | ||||
| Percent decrease | (11.5) | % | (1.3) | % | ||||
| New straight-line rent per square foot | $ | 26.54 | $ | 34.03 | ||||
| Prior straight-line rent per square foot | $ | 28.46 | $ | 33.12 | ||||
| Percent increase (decrease) | (6.7) | % | 2.7 | % | ||||
(1)For consolidated properties owned as of the period-end date. Represents change in rent (base rent and CAM) for all leases for new stores that opened or renewals that started during the respective trailing twelve month periods, except for license agreements, seasonal tenants, and month-to-month leases.
12
Supplemental Operating and Financial Data for the
Quarter Ended 12/31/2020
Consolidated Balance Sheets (dollars in thousands)
| December 31, | December 31, | ||||||||||
| 2020 | 2019 | ||||||||||
| Assets | |||||||||||
| Rental property: | |||||||||||
| Land | $ | 265,968 | $ | 266,537 | |||||||
| Buildings, improvements and fixtures | 2,527,404 | 2,630,357 | |||||||||
| 2,793,372 | 2,896,894 | ||||||||||
| Accumulated depreciation | (1,054,993) | (1,009,951) | |||||||||
| Total rental property, net | 1,738,379 | 1,886,943 | |||||||||
| Cash and cash equivalents | 84,832 | 16,672 | |||||||||
| Investments in unconsolidated joint ventures | 94,579 | 94,691 | |||||||||
| Deferred lease costs and other intangibles, net | 84,960 | 96,712 | |||||||||
| Operating lease right-of-use assets | 81,499 | 86,575 | |||||||||
| Prepaids and other assets | 105,282 | 103,618 | |||||||||
| Total assets | $ | 2,189,531 | $ | 2,285,211 | |||||||
| Liabilities and Equity | |||||||||||
| Liabilities | |||||||||||
| Debt: | |||||||||||
| Senior, unsecured notes, net | $ | 1,140,576 | $ | 1,138,603 | |||||||
| Unsecured term loan, net | 347,370 | 347,367 | |||||||||
| Mortgages payable, net | 79,940 | 83,803 | |||||||||
| Unsecured lines of credit | — | — | |||||||||
Total debt | 1,567,886 | 1,569,773 | |||||||||
| Accounts payable and accrued expenses | 88,253 | 79,562 | |||||||||
Operating lease liabilities (1) | 90,105 | 91,237 | |||||||||
| Other liabilities | 84,404 | 88,530 | |||||||||
| Total liabilities | 1,830,648 | 1,829,102 | |||||||||
| Commitments and contingencies | |||||||||||
| Equity | |||||||||||
| Tanger Factory Outlet Centers, Inc.: | |||||||||||
Common shares, $0.01 par value, 300,000,000 shares authorized, 93,569,801 and 92,892,260 shares issued and outstanding at December 31, 2020 and December 31, 2019, respectively | 936 | 929 | |||||||||
| Paid in capital | 787,143 | 775,035 | |||||||||
| Accumulated distributions in excess of net income | (420,104) | (317,263) | |||||||||
| Accumulated other comprehensive loss | (26,585) | (25,495) | |||||||||
| Equity attributable to Tanger Factory Outlet Centers, Inc. | 341,390 | 433,206 | |||||||||
| Equity attributable to noncontrolling interests: | |||||||||||
| Noncontrolling interests in Operating Partnership | 17,493 | 22,903 | |||||||||
| Noncontrolling interests in other consolidated partnerships | — | — | |||||||||
| Total equity | 358,883 | 456,109 | |||||||||
| Total liabilities and equity | $ | 2,189,531 | $ | 2,285,211 | |||||||
13
Supplemental Operating and Financial Data for the
Quarter Ended 12/31/2020
Consolidated Statements of Operations (in thousands, except per share data)
| Three months ended | Year ended | ||||||||||||||||||||||
| December 31, | December 31, | ||||||||||||||||||||||
| 2020 | 2019 | 2020 | 2019 | ||||||||||||||||||||
| Revenues: | |||||||||||||||||||||||
| Rental revenues | $ | 106,850 | $ | 116,557 | $ | 377,932 | $ | 463,946 | |||||||||||||||
| Management, leasing and other services | 1,574 | 1,476 | 4,936 | 5,419 | |||||||||||||||||||
| Other revenues | 2,731 | 2,459 | 7,123 | 8,983 | |||||||||||||||||||
| Total revenues | 111,155 | 120,492 | 389,991 | 478,348 | |||||||||||||||||||
| Expenses: | |||||||||||||||||||||||
| Property operating | 35,144 | 39,482 | 137,135 | 157,734 | |||||||||||||||||||
| General and administrative | 12,402 | 12,880 | 47,733 | 53,790 | |||||||||||||||||||
| Impairment charges | 21,551 | 37,610 | 67,226 | 37,610 | |||||||||||||||||||
| Depreciation and amortization | 29,177 | 30,305 | 117,143 | 123,314 | |||||||||||||||||||
| Total expenses | 98,274 | 120,277 | 369,237 | 372,448 | |||||||||||||||||||
| Other income (expense): | |||||||||||||||||||||||
| Interest expense | (15,356) | (15,034) | (63,142) | (61,672) | |||||||||||||||||||
| Gain on sale of assets | — | — | 2,324 | 43,422 | |||||||||||||||||||
| Other income (expense) | 136 | 205 | 925 | (2,761) | |||||||||||||||||||
| Total other income (expense) | (15,220) | (14,829) | (59,893) | (21,011) | |||||||||||||||||||
| Income (loss) before equity in earnings of unconsolidated joint ventures | (2,339) | (14,614) | (39,139) | 84,889 | |||||||||||||||||||
| Equity in earnings of unconsolidated joint ventures | 2,616 | 2,235 | 1,126 | 7,839 | |||||||||||||||||||
| Net income (loss) | 277 | (12,379) | (38,013) | 92,728 | |||||||||||||||||||
| Noncontrolling interests in Operating Partnership | (14) | 630 | 1,925 | (4,678) | |||||||||||||||||||
| Noncontrolling interests in other consolidated partnerships | — | — | (190) | (195) | |||||||||||||||||||
| Net income (loss) attributable to Tanger Factory Outlet Centers, Inc. | 263 | (11,749) | (36,278) | 87,855 | |||||||||||||||||||
| Allocation of earnings to participating securities | (3) | (306) | (692) | (1,336) | |||||||||||||||||||
| Net income (loss) available to common shareholders of Tanger Factory Outlet Centers, Inc. | $ | 260 | $ | (12,055) | $ | (36,970) | $ | 86,519 | |||||||||||||||
| Basic earnings per common share: | |||||||||||||||||||||||
| Net income (loss) | $ | — | $ | (0.13) | $ | (0.40) | $ | 0.93 | |||||||||||||||
| Diluted earnings per common share: | |||||||||||||||||||||||
| Net income (loss) | $ | — | $ | (0.13) | $ | (0.40) | $ | 0.93 | |||||||||||||||
14
Supplemental Operating and Financial Data for the
Quarter Ended 12/31/2020
Components of Rental Revenues (in thousands)
As a lessor, substantially all of our revenues are earned from arrangements that are within the scope of Accounting Standards Codification Topic 842 “Leases” (“ASC 842”). We utilized the practical expedient in ASU 2018-11 to account for lease and non-lease components as a single component which resulted in all of our revenues associated with leases being recorded as rental revenues on the consolidated statements of operations.
The table below provides details of the components included in rental revenues:
| Three months ended | Year ended | ||||||||||||||||||||||
| December 31, | December 31, | ||||||||||||||||||||||
| 2020 | 2019 | 2020 | 2019 | ||||||||||||||||||||
| Rental revenues: | |||||||||||||||||||||||
Base rentals | $ | 72,652 | $ | 78,051 | $ | 268,537 | $ | 309,974 | |||||||||||||||
| Percentage rentals | 2,703 | 3,631 | 5,947 | 10,627 | |||||||||||||||||||
| Tenant expense reimbursements | 31,511 | 34,515 | 114,927 | 136,256 | |||||||||||||||||||
| Lease termination fees | 4,125 | 89 | 12,125 | 1,615 | |||||||||||||||||||
| Market rent adjustments | (68) | (273) | (2,350) | (1,044) | |||||||||||||||||||
| Straight-line rent adjustments | (955) | 783 | (3,372) | 7,721 | |||||||||||||||||||
| Uncollectible tenant revenues | (3,118) | (239) | (17,882) | (1,203) | |||||||||||||||||||
| Rental revenues | $ | 106,850 | $ | 116,557 | $ | 377,932 | $ | 463,946 | |||||||||||||||
15
Supplemental Operating and Financial Data for the
Quarter Ended 12/31/2020
Rental Revenues Collection Status (in thousands)
| 4Q20 | 3Q20 | 2Q20 | ||||||||||||||||||
Rents Billed (1) | % of Billed | Rents Billed (1) | % of Billed | Rents Billed (1) | % of Billed | |||||||||||||||
Collection Status (as of January 31, 2021) | ||||||||||||||||||||
| Paid | $ | 83,281 | 95 | % | $ | 86,682 | 91 | % | $ | 61,139 | 63 | % | ||||||||
| Expected | 278 | — | % | 113 | — | % | 404 | — | % | |||||||||||
| Payment received or expected | $ | 83,559 | 95 | % | $ | 86,795 | 91 | % | $ | 61,543 | 63 | % | ||||||||
| Deferred | 507 | 1 | % | 473 | 1 | % | 9,361 | 9 | % | |||||||||||
| Under negotiation | 702 | 1 | % | 755 | 1 | % | 1,760 | 2 | % | |||||||||||
| Deferred or under negotiation | $ | 1,209 | 2 | % | $ | 1,228 | 2 | % | $ | 11,121 | 11 | % | ||||||||
| Net rents recognized before reserves & straight-line adjustments | $ | 84,768 | 97 | % | $ | 88,023 | 93 | % | $ | 72,664 | 74 | % | ||||||||
| One-time rent concessions in exchange for landlord-favorable amendments to lease structure | 1,205 | 1 | % | 2,829 | 3 | % | 13,687 | 14 | % | |||||||||||
| Bankruptcy related, primarily pre-petition rents | 821 | 1 | % | 3,015 | 3 | % | 9,290 | 10 | % | |||||||||||
| At risk due to tenant financial weakness | 1,116 | 1 | % | 934 | 1 | % | 1,867 | 2 | % | |||||||||||
| Do not expect to collect (written off) | $ | 3,142 | 3 | % | $ | 6,778 | 7 | % | $ | 24,844 | 26 | % | ||||||||
| Total rents billed | $ | 87,910 | 100 | % | $ | 94,801 | 100 | % | $ | 97,508 | 100 | % | ||||||||
| (1) Excludes variable revenue which is derived from tenant sales and lease termination fees. | ||||||||||||||||||||
| Rental Revenue Impact - 4Q 2020 | |||||
| Base rentals | $ | (2,702) | |||
| Tenant reimbursements | (828) | ||||
| Uncollectible tenant rents | 3,118 | ||||
| Total before straight-line rent adjustments | $ | (412) | |||
| Straight-line rent adjustments | 1,118 | ||||
| Total rental revenues impact | $ | 706 | |||
| Rental Revenue Impact - Combined 2Q through 4Q | |||||
| Base rentals | $ | 15,867 | |||
| Tenant reimbursements | 7,130 | ||||
| Uncollectible tenant rents | 17,043 | ||||
| Total before straight-line rent adjustments | $ | 40,040 | |||
| Straight-line rent adjustments | 7,221 | ||||
| Total rental revenues impact | $ | 47,261 | |||
16
Supplemental Operating and Financial Data for the
Quarter Ended 12/31/2020
Unconsolidated Joint Venture Information
The following table details certain information as of December 31, 2020, except for Net Operating Income (“NOI”) which is for the year ended December 31, 2020, about various unconsolidated real estate joint ventures in which we have an ownership interest
(dollars in millions):
| Joint Venture | Center Location | Tanger’s Ownership % | Square Feet | Tanger’s Share of Total Assets | Tanger’s Share of NOI | Tanger’s Share of Net Debt (1) | ||||||||||||||||||||||||||||||||
| Charlotte | Charlotte, NC | 50.0 | % | 398,676 | $ | 39.9 | $ | 5.3 | $ | 49.8 | ||||||||||||||||||||||||||||
| Columbus | Columbus, OH | 50.0 | % | 355,245 | 38.0 | 4.6 | 35.4 | |||||||||||||||||||||||||||||||
| Galveston/Houston | Texas City, TX | 50.0 | % | 352,705 | 21.9 | 3.1 | 40.0 | |||||||||||||||||||||||||||||||
| National Harbor | National Harbor, MD | 50.0 | % | 341,156 | 39.4 | 4.3 | 47.2 | |||||||||||||||||||||||||||||||
RioCan Canada (2) | Various | 50.0 | % | 764,505 | 92.2 | 4.4 | — | |||||||||||||||||||||||||||||||
| Total | 2,212,287 | $ | 231.4 | $ | 21.7 | $ | 172.4 | |||||||||||||||||||||||||||||||
(1)Net of debt origination costs and premiums.
(2)Includes a 307,883 square foot outlet center in Cookstown, Ontario; a 357,217 square foot outlet center in Ottawa, Ontario; and a 99,405 square foot outlet center in Saint-Sauveur, Quebec.
17
Supplemental Operating and Financial Data for the
Quarter Ended 12/31/2020
Debt Outstanding Summary
As of December 31, 2020
(dollars in thousands)
| Total Debt Outstanding | Our Share of Debt | Stated Interest Rate | End of Period Effective Interest Rate(1) | Maturity Date (2) | Weighted Average Years to Maturity (2) | ||||||||||||||||||||||||||||||
| Consolidated Debt: | |||||||||||||||||||||||||||||||||||
| Unsecured debt: | |||||||||||||||||||||||||||||||||||
Unsecured lines of credit(3) | $ | — | $ | — | LIBOR(4) + 1.0% | 1.3 | % | 10/28/2022 | 1.8 | ||||||||||||||||||||||||||
| 2023 Senior unsecured notes | 250,000 | 250,000 | 3.875% | 4.1 | % | 12/1/2023 | 2.9 | ||||||||||||||||||||||||||||
| 2024 Senior unsecured notes | 250,000 | 250,000 | 3.75 | % | 3.8 | % | 12/1/2024 | 3.9 | |||||||||||||||||||||||||||
| 2026 Senior unsecured notes | 350,000 | 350,000 | 3.125 | % | 3.2 | % | 9/1/2026 | 5.7 | |||||||||||||||||||||||||||
| 2027 Senior unsecured notes | 300,000 | 300,000 | 3.875 | % | 3.9 | % | 7/15/2027 | 6.5 | |||||||||||||||||||||||||||
| Unsecured term loan | 350,000 | 350,000 | LIBOR(4) + 1.0% | 2.6 | % | 4/22/2024 | 3.3 | ||||||||||||||||||||||||||||
| Net debt discounts and debt origination costs | (12,054) | (12,054) | |||||||||||||||||||||||||||||||||
| Total net unsecured debt | 1,487,946 | 1,487,946 | 3.5 | % | 4.5 | ||||||||||||||||||||||||||||||
| Secured mortgage debt: | |||||||||||||||||||||||||||||||||||
| Atlantic City, NJ | 27,343 | 27,343 | 5.14% - 7.65% | 5.1 | % | 11/15/2021 - 12/8/2026 | 4.4 | ||||||||||||||||||||||||||||
| Southaven, MS | 51,400 | 51,400 | LIBOR + 1.80% | 3.8 | % | 4/29/2023 | 2.3 | ||||||||||||||||||||||||||||
| Debt premium and debt origination costs | 1,197 | 1,197 | |||||||||||||||||||||||||||||||||
| Total net secured mortgage debt | 79,940 | 79,940 | 4.2 | % | 3.0 | ||||||||||||||||||||||||||||||
| Total consolidated debt | 1,567,886 | 1,567,886 | 3.6 | % | 4.5 | ||||||||||||||||||||||||||||||
| Unconsolidated JV debt: | |||||||||||||||||||||||||||||||||||
| Charlotte | 100,000 | 50,000 | 4.27 | % | 4.3% | 7/1/2028 | 7.5 | ||||||||||||||||||||||||||||
Columbus (5) | 71,000 | 35,500 | LIBOR + 1.85% | 2.0% | 11/28/2022 | 1.9 | |||||||||||||||||||||||||||||
| Galveston/Houston | 80,000 | 40,000 | LIBOR + 1.65% | 1.8% | 7/1/2022 | 1.5 | |||||||||||||||||||||||||||||
| National Harbor | 95,000 | 47,500 | 4.63 | % | 4.6% | 1/5/2030 | 9.0 | ||||||||||||||||||||||||||||
| Debt origination costs | (1,144) | (572) | |||||||||||||||||||||||||||||||||
| Total unconsolidated JV net debt | 344,856 | 172,428 | 3.3 | % | 5.4 | ||||||||||||||||||||||||||||||
| Total | $ | 1,912,742 | $ | 1,740,314 | 3.5 | % | 4.6 | ||||||||||||||||||||||||||||
(1)The effective interest rate includes the impact of discounts and premiums and interest rate swap agreements, as applicable. See page 20 for additional details.
(2)Includes applicable extensions available at our option.
(3)The Company has unsecured lines of credit that provide for borrowings of up to $600.0 million. The unsecured lines of credit include a $20.0 million liquidity line and a $580.0 million syndicated line. A 20 basis point facility fee is due annually on the entire committed amount of each facility. The syndicated line may be increased up to $1.2 billion through an accordion feature in certain circumstances.
(4)If LIBOR is less than 0.25% per annum, the rate will be deemed to be 0.25% for the portions of the lines of credit and bank term loan that are not fixed with an interest rate swap.
(5)In December 2020, the Columbus joint venture amended the mortgage loan to extend the maturity to November 2022, which required a reduction in principal balance from $85.0 million to $71.0 million. The amendment increased the interest rate from LIBOR + 1.65% to LIBOR + 1.85% and the mortgage loan guarantee by us was increased from $6.4 million to $11.9 million. We are providing property management, marketing and leasing services to the joint venture.
18
Supplemental Operating and Financial Data for the
Quarter Ended 12/31/2020
Summary of Our Share of Fixed and Variable Rate Debt
As of December 31, 2020
(dollars in thousands)
| Total Debt % | Our Share of Debt | End of Period Effective Interest Rate | Average Years to Maturity (1) | ||||||||||||||||||||
| Consolidated: | |||||||||||||||||||||||
Fixed (2) | 99 | % | $ | 1,556,515 | 3.6 | % | 4.5 | ||||||||||||||||
| Variable | 1 | % | 11,371 | 1.9 | % | 2.3 | |||||||||||||||||
| 100 | % | 1,567,886 | 3.6 | % | 4.5 | ||||||||||||||||||
| Unconsolidated Joint ventures: | |||||||||||||||||||||||
| Fixed | 56 | % | $ | 97,040 | 4.4 | % | 8.2 | ||||||||||||||||
| Variable | 44 | % | 75,388 | 1.9 | % | 1.7 | |||||||||||||||||
| 100 | % | 172,428 | 3.3 | % | 5.4 | ||||||||||||||||||
| Total: | |||||||||||||||||||||||
| Fixed | 95 | % | $ | 1,653,555 | 3.7 | % | 4.9 | ||||||||||||||||
| Variable | 5 | % | 86,759 | 1.9 | % | 1.7 | |||||||||||||||||
| Total share of debt | 100 | % | $ | 1,740,314 | 3.5 | % | 4.6 | ||||||||||||||||
(1)Includes applicable extensions available at our option.
(2)The effective interest rate includes interest rate swap agreements that fix the base LIBOR rate at a weighted average of 1.7% on notional amounts aggregating $390.0 million as follows:
| Effective Date | Maturity Date | Notional Amount | Bank Pay Rate | Company Fixed Pay Rate | |||||||||||||||||||||||||
| Interest rate swaps: | |||||||||||||||||||||||||||||
| April 13, 2016 | January 1, 2021 | $ | 175,000 | 1 | month LIBOR | 1.03 | % | ||||||||||||||||||||||
| March 1, 2018 | January 31, 2021 | 40,000 | 1 | month LIBOR | 2.47 | % | |||||||||||||||||||||||
| August 14, 2018 | January 1, 2021 | 150,000 | 1 | month LIBOR | 2.20 | % | |||||||||||||||||||||||
| July 1, 2019 | February 1, 2024 | 25,000 | 1 | month LIBOR | 1.75 | % | |||||||||||||||||||||||
| Total | $ | 390,000 | |||||||||||||||||||||||||||
| Forward starting interest rate swap agreements: | |||||||||||||||||||||||||||||
| January 1, 2021 | February 1, 2024 | $ | 150,000 | 1 | month LIBOR | 0.60 | % | ||||||||||||||||||||||
| January 1, 2021 | February 1, 2024 | $ | 100,000 | 1 | month LIBOR | 0.22 | % | ||||||||||||||||||||||
19
Supplemental Operating and Financial Data for the
Quarter Ended 12/31/2020
Future Scheduled Principal Payments (dollars in thousands)(1)
As of December 31, 2020
| Year | Tanger Consolidated Payments | Tanger’s Share of Unconsolidated JV Payments | Total Scheduled Payments | ||||||||||||||
| 2021 | $ | 5,793 | $ | — | $ | 5,793 | |||||||||||
| 2022 | 4,436 | 75,500 | 79,936 | ||||||||||||||
| 2023 | 306,168 | 1,031 | 307,199 | ||||||||||||||
| 2024 | 605,140 | 1,636 | 606,776 | ||||||||||||||
| 2025 | 1,501 | 1,710 | 3,211 | ||||||||||||||
| 2026 | 355,705 | 1,788 | 357,493 | ||||||||||||||
| 2027 | 300,000 | 1,869 | 301,869 | ||||||||||||||
| 2028 | — | 46,944 | 46,944 | ||||||||||||||
| 2029 | — | 984 | 984 | ||||||||||||||
| 2030 | — | 41,538 | 41,538 | ||||||||||||||
| 2031 & thereafter | — | — | — | ||||||||||||||
| $ | 1,578,743 | $ | 173,000 | $ | 1,751,743 | ||||||||||||
| Net debt discounts and debt origination costs | (10,857) | (572) | (11,429) | ||||||||||||||
| $ | 1,567,886 | $ | 172,428 | $ | 1,740,314 | ||||||||||||
(1)Includes applicable extensions available at our option.
Senior Unsecured Notes Financial Covenants (1)
As of December 31, 2020
| Required | Actual | Compliance | |||||||||||||||
| Total Consolidated Debt to Adjusted Total Assets | <60% | 46 | % | Yes | |||||||||||||
| Total Secured Debt to Adjusted Total Assets | <40% | 3 | % | Yes | |||||||||||||
| Total Unencumbered Assets to Unsecured Debt | >150% | 210 | % | Yes | |||||||||||||
| Consolidated Income Available for Debt Service to Annual Debt Service Charge | >1.5 | 3.8 | Yes | ||||||||||||||
(1)For a complete listing of all debt covenants related to the Company’s Senior Unsecured Notes, as well as definitions of the above terms, please refer to the Company’s filings with the Securities and Exchange Commission.
Unsecured Lines of Credit & Term Loan Financial Covenants (1)
As of December 31, 2020
| Required | Actual | Compliance | |||||||||||||||
Total Liabilities to Total Adjusted Asset Value (2) | <65% | 36 | % | Yes | |||||||||||||
| Secured Indebtedness to Adjusted Unencumbered Asset Value | <35% | 5 | % | Yes | |||||||||||||
| EBITDA to Fixed Charges | >1.5 | 3.4 | Yes | ||||||||||||||
Total Unsecured Indebtedness to Adjusted Unencumbered Asset Value (2) | <65% | 33 | % | Yes | |||||||||||||
| Unencumbered Interest Coverage Ratio | >1.5 | 3.8 | Yes | ||||||||||||||
(1)For a complete listing of all debt covenants related to the Company’s Unsecured Lines of Credit & Term Loan, as well as definitions of the above terms, please refer to the Company’s filings with the Securities and Exchange Commission.
(2)Leverage ratios are based on a trailing three-month period annualized at December 31, 2020.
20
Supplemental Operating and Financial Data for the
Quarter Ended 12/31/2020
Enterprise Value, Net Debt, Liquidity, Debt Ratios and Credit Ratings (in thousands, except per share data)
| December 31, | December 31, | |||||||||||||
| 2020 | 2019 | |||||||||||||
| Enterprise Value: | ||||||||||||||
| Market value: | ||||||||||||||
| Common shares outstanding | 93,570 | 92,892 | ||||||||||||
| Exchangeable operating partnership units | 4,795 | 4,911 | ||||||||||||
Total shares (1) | 98,364 | 97,803 | ||||||||||||
| Common share price | $ | 9.96 | $ | 14.73 | ||||||||||
Total market value (1) | $ | 979,710 | $ | 1,440,645 | ||||||||||
| Debt: | ||||||||||||||
| Senior, unsecured notes | $ | 1,150,000 | $ | 1,150,000 | ||||||||||
| Unsecured term loans | 350,000 | 350,000 | ||||||||||||
| Mortgages payable | 78,743 | 82,309 | ||||||||||||
| Unsecured lines of credit | — | — | ||||||||||||
| Total principal debt | 1,578,743 | 1,582,309 | ||||||||||||
| Less: Net debt discounts | (2,851) | (3,334) | ||||||||||||
| Less: Debt origination costs | (8,006) | (9,202) | ||||||||||||
| Total debt | 1,567,886 | 1,569,773 | ||||||||||||
| Total enterprise value | $ | 2,547,596 | $ | 3,010,418 | ||||||||||
| Net Debt: | ||||||||||||||
| Total debt | $ | 1,567,886 | $ | 1,569,773 | ||||||||||
| Less: Cash and cash equivalents | (84,832) | (16,672) | ||||||||||||
| Net debt | $ | 1,483,054 | $ | 1,553,101 | ||||||||||
| Liquidity: | ||||||||||||||
| Cash and cash equivalents | $ | 84,832 | $ | 16,672 | ||||||||||
Unused capacity under unsecured lines of credit (2) | 600,000 | 599,830 | ||||||||||||
| Total liquidity | $ | 684,832 | $ | 616,502 | ||||||||||
Ratios (3): | ||||||||||||||
Net debt to Adjusted EBITDA (4) | 7.1 | x | 5.5 | x | ||||||||||
Interest coverage (Adjusted EBITDA / interest expense) (4) | 3.3 | x | 4.5 | x | ||||||||||
(1)Amounts may not recalculate due to the effect of rounding.
(2)Unused capacity under the Company’s $600.0 million unsecured lines of credit is reduced by $170,000 at December 31, 2019 related to outstanding letters of credit (none at December 31, 2020).
(3)Ratios are presented for the trailing twelve-month period.
(4)Adjusted EBITDA is a non-GAAP measure. Refer to page 29 for a reconciliation of net income to Adjusted EBITDA.
| Credit Ratings and Outlook: | |||||||||||
| Moody’s Investors Services | Baa2 | Negative | |||||||||
| Standard & Poor’s Ratings Services | BBB | Negative | |||||||||
21
Supplemental Operating and Financial Data for the
Quarter Ended 12/31/2020
NON-GAAP SUPPLEMENTAL MEASURES
Beginning with the three months ended March 31, 2020, we elected to supplement our disclosure with three additional non-GAAP measures, Adjusted EBITDA, EBITDAre and Adjusted EBITDAre (each as defined below), that are commonly provided in the REIT industry. See “Adjusted EBITDA, EBITDAre and Adjusted EBITDAre” below for more information. We also now refer to Adjusted Funds from Operations (“AFFO”) as Core Funds From Operations (“Core FFO”), but there has been no change to the definition of this measure.
Funds From Operations
Funds From Operations (“FFO”) is a widely used measure of the operating performance for real estate companies that supplements net income (loss) determined in accordance with generally accepted accounting principles in the United States (“GAAP”). We determine FFO based on the definition set forth by the National Association of Real Estate Investment Trusts (“NAREIT”), of which we are a member. In December 2018, NAREIT issued “NAREIT Funds From Operations White Paper - 2018 Restatement” which clarifies, where necessary, existing guidance and consolidates alerts and policy bulletins into a single document for ease of use. NAREIT defines FFO as net income (loss) available to the Company’s common shareholders computed in accordance with GAAP, excluding (i) depreciation and amortization related to real estate, (ii) gains or losses from sales of certain real estate assets, (iii) gains and losses from change in control, (iv) impairment write-downs of certain real estate assets and investments in entities when the impairment is directly attributable to decreases in the value of depreciable real estate held by the entity and (v) after adjustments for unconsolidated partnerships and joint ventures calculated to reflect FFO on the same basis.
FFO is intended to exclude historical cost depreciation of real estate as required by GAAP which assumes that the value of real estate assets diminishes ratably over time. Historically, however, real estate values have risen or fallen with market conditions. Because FFO excludes depreciation and amortization of real estate assets, gains and losses from property dispositions and extraordinary items, it provides a performance measure that, when compared year over year, reflects the impact to operations from trends in occupancy rates, rental rates, operating costs, development activities and interest costs, providing perspective not immediately apparent from net income (loss).
We present FFO because we consider it an important supplemental measure of our operating performance. In addition, a portion of cash bonus compensation to certain members of management is based on our FFO or Core FFO, which is described in the section below. We believe it is useful for investors to have enhanced transparency into how we evaluate our performance and that of our management. In addition, FFO is frequently used by securities analysts, investors and other interested parties in the evaluation of REITs, many of which present FFO when reporting their results. FFO is also widely used by us and others in our industry to evaluate and price potential acquisition candidates. We believe that FFO payout ratio, which represents regular distributions to common shareholders and unit holders of the Operating Partnership expressed as a percentage of FFO, is useful to investors because it facilitates the comparison of dividend coverage between REITs. NAREIT has encouraged its member companies to report their FFO as a supplemental, industry-wide standard measure of REIT operating performance.
FFO has significant limitations as an analytical tool, and you should not consider it in isolation, or as a substitute for analysis of our results as reported under GAAP. Some of these limitations are:
•FFO does not reflect our cash expenditures, or future requirements, for capital expenditures or contractual commitments;
•FFO does not reflect changes in, or cash requirements for, our working capital needs;
•Although depreciation and amortization are non-cash charges, the assets being depreciated and amortized will often have to be replaced in the future, and FFO does not reflect any cash requirements for such replacements; and
•Other companies in our industry may calculate FFO differently than we do, limiting its usefulness as a comparative measure.
Because of these limitations, FFO should not be considered as a measure of discretionary cash available to us to invest in the growth of our business or our dividend paying capacity. We compensate for these limitations by relying primarily on our GAAP results and using FFO only as a supplemental measure.
Core FFO
If applicable, we present Core FFO (formerly referred to as AFFO) as a supplemental measure of our performance. We define Core FFO as FFO further adjusted to eliminate the impact of certain items that we do not consider indicative of our ongoing operating performance. These further adjustments are itemized in the table below, if applicable. You are encouraged to evaluate these adjustments and the reasons we consider them appropriate for supplemental analysis. In evaluating Core FFO you should be aware that in the future we may incur expenses that are the same as or similar to some of the adjustments in this presentation. Our presentation of Core FFO should not be construed as an inference that our future results will be unaffected by unusual or non-recurring items.
We present Core FFO because we believe it assists investors and analysts in comparing our performance across reporting periods on a consistent basis by excluding items that we do not believe are indicative of our core operating performance. In addition, we believe it is useful for investors to have enhanced transparency into how we evaluate management’s performance and the effectiveness of our business strategies. We use Core FFO when certain material, unplanned transactions occur as a factor in evaluating management’s performance and to evaluate the effectiveness of our business strategies, and may use Core FFO when determining incentive compensation.
22
Supplemental Operating and Financial Data for the
Quarter Ended 12/31/2020
Core FFO has limitations as an analytical tool. Some of these limitations are:
•Core FFO does not reflect our cash expenditures, or future requirements, for capital expenditures or contractual commitments;
•Core FFO does not reflect changes in, or cash requirements for, our working capital needs;
•Although depreciation and amortization are non-cash charges, the assets being depreciated and amortized will often have to be replaced in the future, and Core FFO does not reflect any cash requirements for such replacements;
•Core FFO does not reflect the impact of certain cash charges resulting from matters we consider not to be indicative of our ongoing operations; and
•Other companies in our industry may calculate Core FFO differently than we do, limiting its usefulness as a comparative measure.
Because of these limitations, Core FFO should not be considered in isolation or as a substitute for performance measures calculated in accordance with GAAP. We compensate for these limitations by relying primarily on our GAAP results and using Core FFO only as a supplemental measure.
Funds Available for Distribution
Funds Available for Distribution (“FAD”) is a non-GAAP financial measure that we define as FFO, excluding corporate depreciation, amortization of finance costs, amortization of net debt discount (premium), amortization of equity-based compensation, straight-line rent amounts, market rent amounts, second generation tenant allowances and lease incentives, capital improvement expenditures, and our share of the items listed above for our unconsolidated joint ventures. Investors, analysts and the Company utilize FAD as an indicator of common dividend potential. The FAD payout ratio, which represents regular distributions to common shareholders and unit holders of the Operating Partnership expressed as a percentage of FAD, facilitates the comparison of dividend coverage between REITs.
We believe that net income (loss) is the most directly comparable GAAP financial measure to FAD. FAD does not represent cash generated from operating activities in accordance with GAAP and should not be considered as an alternative to net income (loss) as an indication of our performance or to cash flows as a measure of liquidity or our ability to make distributions. Other companies in our industry may calculate FAD differently than we do, limiting its usefulness as a comparative measure.
Portfolio Net Operating Income and Same Center Net Operating Income
We present portfolio net operating income (“Portfolio NOI”) and same center net operating income (“Same Center NOI”) as supplemental measures of our operating performance. Portfolio NOI represents our property level net operating income which is defined as total operating revenues less property operating expenses and excludes termination fees and non-cash adjustments including straight-line rent, net above and below market rent amortization, impairment charges and gains or losses on the sale of assets recognized during the periods presented. We define Same Center NOI as Portfolio NOI for the properties that were operational for the entire portion of both comparable reporting periods and which were not acquired, or subject to a material expansion or non-recurring event, such as a natural disaster, during the comparable reporting periods.
We believe Portfolio NOI and Same Center NOI are non-GAAP metrics used by industry analysts, investors and management to measure the operating performance of our properties because they provide performance measures directly related to the revenues and expenses involved in owning and operating real estate assets and provide a perspective not immediately apparent from net income (loss), FFO or Core FFO. Because Same Center NOI excludes properties developed, redeveloped, acquired and sold; as well as non-cash adjustments, gains or losses on the sale of outparcels and termination rents; it highlights operating trends such as occupancy levels, rental rates and operating costs on properties that were operational for both comparable periods. Other REITs may use different methodologies for calculating Portfolio NOI and Same Center NOI, and accordingly, our Portfolio NOI and Same Center NOI may not be comparable to other REITs.
Portfolio NOI and Same Center NOI should not be considered alternatives to net income (loss) or as an indicator of our financial performance since they do not reflect the entire operations of our portfolio, nor do they reflect the impact of general and administrative expenses, acquisition-related expenses, interest expense, depreciation and amortization costs, other non-property income and losses, the level of capital expenditures and leasing costs necessary to maintain the operating performance of our properties, or trends in development and construction activities which are significant economic costs and activities that could materially impact our results from operations. Because of these limitations, Portfolio NOI and Same Center NOI should not be viewed in isolation or as a substitute for performance measures calculated in accordance with GAAP. We compensate for these limitations by relying primarily on our GAAP results and using Portfolio NOI and Same Center NOI only as supplemental measures.
23
Supplemental Operating and Financial Data for the
Quarter Ended 12/31/2020
Adjusted EBITDA, EBITDAre and Adjusted EBITDAre
We present Earnings Before Interest, Taxes, Depreciation and Amortization (“EBITDA”) as adjusted for items described below (“Adjusted EBITDA”), EBITDA for Real Estate (“EBITDAre”) and Adjusted EBITDAre, all non-GAAP measures, as supplemental measures of our operating performance. Each of these measures is defined as follows:
We define Adjusted EBITDA as net income (loss) available to the Company’s common shareholders computed in accordance with GAAP before interest expense, income taxes (if applicable), depreciation and amortization, gains and losses on sale of operating properties, joint venture properties, outparcels and other assets, gains and losses on change of control, impairment write-downs of depreciated property and of investment in unconsolidated joint ventures caused by a decrease in value of depreciated property in the affiliate, compensation related to voluntary retirement plan and executive officer retirement, gains and losses on extinguishment of debt, net and other items that we do not consider indicative of the Company's ongoing operating performance.
We determine EBITDAre based on the definition set forth by NAREIT, which is defined as net income (loss) available to the Company’s common shareholders computed in accordance with GAAP before interest expense, income taxes (if applicable), depreciation and amortization, gains and losses on sale of operating properties, gains and losses on change of control and impairment write-downs of depreciated property and of investment in unconsolidated joint ventures caused by a decrease in value of depreciated property in the affiliate and after adjustments to reflect our share of the EBITDAre of unconsolidated joint ventures.
Adjusted EBITDAre is defined as EBITDAre excluding gains and losses on extinguishment of debt, net, compensation related to voluntary retirement plan and executive officer retirement, gains and losses on sale of outparcels, and other items that that we do not consider indicative of the Company's ongoing operating performance.
We present Adjusted EBITDA, EBITDAre and Adjusted EBITDAre as we believe they are useful for investors, creditors and rating agencies as they provide additional performance measures that are independent of a Company’s existing capital structure to facilitate the evaluation and comparison of the Company’s operating performance to other REITs and provide a more consistent metric for comparing the operating performance of the Company’s real estate between periods.
Adjusted EBITDA, EBITDAre and Adjusted EBITDAre have significant limitations as analytical tools, including:
•They do not reflect our interest expense;
•They do not reflect gains or losses on sales of operating properties or impairment write-downs of depreciated property and of investment in unconsolidated joint ventures caused by a decrease in value of depreciated property in the affiliate;
•Adjusted EBITDA and Adjusted EBITDAre do not reflect gains and losses on extinguishment of debt and other items that may affect operations; and
•Other companies in our industry may calculate these measures differently than we do, limiting its usefulness as a comparative measure.
Because of these limitations, Adjusted EBITDA, EBITDAre and Adjusted EBITDAre should not be considered in isolation or as a substitute for performance measures calculated in accordance with GAAP. We compensate for these limitations by relying primarily on our GAAP results and using Adjusted EBITDA, EBITDAre and Adjusted EBITDAre only as supplemental measures.
Non-GAAP Pro Rata Balance Sheet and Income Statement Information
The pro rata balance sheet and pro rata income statement information is not, and is not intended to be, a presentation in accordance with GAAP. The pro rata balance sheet and pro rata income statement information reflect our proportionate economic ownership of each asset in our portfolio that we do not wholly own. These assets may be found in the table earlier in this report entitled, “Unconsolidated Joint Venture Information.” The amounts in the column labeled “Pro Rata Portion Unconsolidated Joint Ventures” were derived on a property-by-property basis by applying to each financial statement line item the ownership percentage interest used to arrive at our share of net income or loss during the period when applying the equity method of accounting. A similar calculation was performed for the amounts in the column labeled “Pro Rata Portion Noncontrolling interests.”
We do not control the unconsolidated joint ventures and the presentations of the assets and liabilities and revenues and expenses do not represent our legal claim to such items. The operating agreements of the unconsolidated joint ventures generally provide that partners may receive cash distributions (1) quarterly, to the extent there is available cash from operations, (2) upon a capital event, such as a refinancing or sale or (3) upon liquidation of the venture. The amount of cash each partner receives is based upon specific provisions of each operating agreement and vary depending on factors including the amount of capital contributed by each partner and whether any contributions are entitled to priority distributions. Upon liquidation of the joint venture and after all liabilities, priority distributions and initial equity contributions have been repaid, the partners generally would be entitled to any residual cash remaining based on the legal ownership percentage shown in the table found earlier in this report entitled “Unconsolidated Joint Venture Information”.
24
Supplemental Operating and Financial Data for the
Quarter Ended 12/31/2020
We provide pro rata balance sheet and income statement information because we believe it assists investors and analysts in estimating our economic interest in our unconsolidated joint ventures when read in conjunction with the Company’s reported results under GAAP. The presentation of pro rata financial information has limitations as an analytical tool. Some of these limitations include:
•The amounts shown on the individual line items were derived by applying our overall economic ownership interest percentage determined when applying the equity method of accounting and do not necessarily represent our legal claim to the assets and liabilities, or the revenues and expenses; and
•Other companies in our industry may calculate their pro rata interest differently than we do, limiting the usefulness as a comparative measure.
Because of these limitations, the pro rata balance sheet and income statement information should not be considered in isolation or as a substitute for our financial statements as reported under GAAP. We compensate for these limitations by relying primarily on our GAAP results and using the pro rata balance sheet and income statement information only supplementally.
25
Supplemental Operating and Financial Data for the
Quarter Ended 12/31/2020
Reconciliation of Net Income (Loss) to FFO and Core FFO (dollars and shares in thousands)
| Three months ended | Year ended | |||||||||||||||||||||||||
| December 31, | December 31, | |||||||||||||||||||||||||
| 2020 | 2019 | 2020 | 2019 | |||||||||||||||||||||||
| Net income (loss) | $ | 277 | $ | (12,379) | $ | (38,013) | $ | 92,728 | ||||||||||||||||||
| Adjusted for: | ||||||||||||||||||||||||||
| Depreciation and amortization of real estate assets - consolidated | 28,487 | 29,707 | 114,021 | 120,856 | ||||||||||||||||||||||
| Depreciation and amortization of real estate assets - unconsolidated joint ventures | 2,986 | 3,059 | 12,024 | 12,512 | ||||||||||||||||||||||
Impairment charges - consolidated (1) | 21,551 | 37,610 | 67,226 | 37,610 | ||||||||||||||||||||||
| Impairment charge - unconsolidated joint ventures | — | — | 3,091 | — | ||||||||||||||||||||||
| Foreign currency loss from sale of joint venture property | — | — | — | 3,641 | ||||||||||||||||||||||
| Gain on sale of assets | — | — | (2,324) | (43,422) | ||||||||||||||||||||||
| FFO | 53,301 | 57,997 | 156,025 | 223,925 | ||||||||||||||||||||||
| FFO attributable to noncontrolling interests in other consolidated partnerships | — | — | (190) | (195) | ||||||||||||||||||||||
| Allocation of earnings to participating securities | (560) | (489) | (1,713) | (1,991) | ||||||||||||||||||||||
FFO available to common shareholders (2) | $ | 52,741 | $ | 57,508 | $ | 154,122 | $ | 221,739 | ||||||||||||||||||
| As further adjusted for: | ||||||||||||||||||||||||||
Compensation related to voluntary retirement plan and executive officer retirement (3) | 573 | — | 573 | 4,371 | ||||||||||||||||||||||
| Gain on sale of outparcel - unconsolidated joint ventures | (992) | — | (992) | — | ||||||||||||||||||||||
| Impact of above adjustments to the allocation of earnings to participating securities | 5 | — | 5 | (35) | ||||||||||||||||||||||
Core FFO available to common shareholders (2) | $ | 52,327 | $ | 57,508 | $ | 153,708 | $ | 226,075 | ||||||||||||||||||
FFO available to common shareholders per share - diluted (2) | $ | 0.54 | $ | 0.59 | $ | 1.58 | $ | 2.27 | ||||||||||||||||||
Core FFO available to common shareholders per share - diluted (2) | $ | 0.54 | $ | 0.59 | $ | 1.57 | $ | 2.31 | ||||||||||||||||||
| Weighted Average Shares: | ||||||||||||||||||||||||||
| Basic weighted average common shares | 92,686 | 92,243 | 92,618 | 92,808 | ||||||||||||||||||||||
| Effect of outstanding options | 183 | — | — | — | ||||||||||||||||||||||
| Diluted weighted average common shares (for earnings per share computations) | 92,869 | 92,243 | 92,618 | 92,808 | ||||||||||||||||||||||
| Effect of outstanding options | — | — | 94 | — | ||||||||||||||||||||||
| Exchangeable operating partnership units | 4,878 | 4,949 | 4,903 | 4,958 | ||||||||||||||||||||||
Diluted weighted average common shares (for FFO per share computations) (2) | 97,747 | 97,192 | 97,615 | 97,766 | ||||||||||||||||||||||
(1)Includes $2.6 million and $4.0 million for the three months and year ended December 31, 2020, respectively, of impairment loss attributable to the right-of-use asset associated with the ground lease at the Mashantucket (Foxwoods), Connecticut outlet center.
(2)Assumes the Class A common limited partnership units of the Operating Partnership held by the noncontrolling interests are exchanged for common shares of the Company. Each Class A common limited partnership unit is exchangeable for one of the Company’s common shares, subject to certain limitations to preserve the Company’s REIT status.
(3)The 2019 amount represents the accelerated recognition of compensation cost entitled to be received by the Company’s former President and Chief Operating Officer per the terms of a transition agreement executed in connection with his retirement. The 2020 amount represents compensation cost related to a voluntary retirement plan offer which required eligible participants to give notice of acceptance by December 1, 2020 for an effective retirement date of March 31, 2021.
26
Supplemental Operating and Financial Data for the
Quarter Ended 12/31/2020
Reconciliation of FFO to FAD (dollars and shares in thousands)
| Three months ended | Year ended | |||||||||||||||||||||||||
| December 31, | December 31, | |||||||||||||||||||||||||
| 2020 | 2019 | 2020 | 2019 | |||||||||||||||||||||||
| FFO available to common shareholders | $ | 52,741 | $ | 57,508 | $ | 154,122 | $ | 221,739 | ||||||||||||||||||
| Adjusted for: | ||||||||||||||||||||||||||
| Corporate depreciation excluded above | 690 | 598 | 3,122 | 2,458 | ||||||||||||||||||||||
| Amortization of finance costs | 997 | 758 | 3,583 | 3,004 | ||||||||||||||||||||||
| Amortization of net debt discount | 123 | 115 | 482 | 448 | ||||||||||||||||||||||
| Amortization of equity-based compensation | 2,951 | 3,749 | 12,517 | 18,120 | ||||||||||||||||||||||
| Straight-line rent adjustments | 955 | (317) | 3,372 | (7,721) | ||||||||||||||||||||||
| Market rent adjustments | 161 | 365 | 2,721 | 1,432 | ||||||||||||||||||||||
| Second generation tenant allowances and lease incentives | (3,724) | (3,018) | (17,443) | (18,189) | ||||||||||||||||||||||
| Capital improvements | (2,729) | (6,800) | (14,709) | (21,478) | ||||||||||||||||||||||
| Adjustments from unconsolidated joint ventures | 371 | (408) | (108) | (1,662) | ||||||||||||||||||||||
FAD available to common shareholders (1) | $ | 52,536 | $ | 52,550 | $ | 147,659 | $ | 198,151 | ||||||||||||||||||
| Dividends per share | $ | — | $ | 0.3550 | $ | 0.7125 | $ | 1.4150 | ||||||||||||||||||
| FFO payout ratio | — | % | 60 | % | 45 | % | 62 | % | ||||||||||||||||||
| FAD payout ratio | — | % | 66 | % | 47 | % | 70 | % | ||||||||||||||||||
Diluted weighted average common shares (1) | 97,747 | 97,192 | 97,615 | 97,766 | ||||||||||||||||||||||
(1)Assumes the Class A common limited partnership units of the Operating Partnership held by the noncontrolling interests are exchanged for common shares of the Company. Each Class A common limited partnership unit is exchangeable for one of the Company’s common shares, subject to certain limitations to preserve the Company’s REIT status.
27
Supplemental Operating and Financial Data for the
Quarter Ended 12/31/2020
Reconciliation of Net Income (Loss) to Portfolio NOI and Same Center NOI for the consolidated portfolio (in thousands)
| Three months ended | Year ended | |||||||||||||||||||||||||
| December 31, | December 31, | |||||||||||||||||||||||||
| 2020 | 2019 | 2020 | 2019 | |||||||||||||||||||||||
| Net income (loss) | $ | 277 | $ | (12,379) | $ | (38,013) | $ | 92,728 | ||||||||||||||||||
| Adjusted to exclude: | ||||||||||||||||||||||||||
| Equity in earnings of unconsolidated joint ventures | (2,616) | (2,235) | (1,126) | (7,839) | ||||||||||||||||||||||
| Interest expense | 15,356 | 15,034 | 63,142 | 61,672 | ||||||||||||||||||||||
| Gain on sale of assets | — | — | (2,324) | (43,422) | ||||||||||||||||||||||
| Other (income) expense | (136) | (205) | (925) | 2,761 | ||||||||||||||||||||||
| Impairment charges | 21,551 | 37,610 | 67,226 | 37,610 | ||||||||||||||||||||||
| Depreciation and amortization | 29,177 | 30,305 | 117,143 | 123,314 | ||||||||||||||||||||||
| Other non-property expenses | 197 | 555 | 1,359 | 1,049 | ||||||||||||||||||||||
| Corporate general and administrative expenses | 12,413 | 12,852 | 48,172 | 53,881 | ||||||||||||||||||||||
Non-cash adjustments (1) | 1,138 | (409) | 6,170 | (6,237) | ||||||||||||||||||||||
| Lease termination fees | (4,125) | (89) | (12,125) | (1,615) | ||||||||||||||||||||||
| Portfolio NOI | 73,232 | 81,039 | 248,699 | 313,902 | ||||||||||||||||||||||
Non-same center NOI (2) | (331) | (382) | (728) | (5,993) | ||||||||||||||||||||||
| Same Center NOI | $ | 72,901 | $ | 80,657 | $ | 247,971 | $ | 307,909 | ||||||||||||||||||
(1)Non-cash items include straight-line rent, above and below market rent amortization, straight-line rent expense on land leases and gains or losses on outparcel sales, as applicable.
(2)Excluded from Same Center NOI:
| Outlet centers sold: | |||||
Nags Head, Ocean City, Park City, and Williamsburg | March 2019 | ||||
| Terrell | August 2020 | ||||
Same Center NOI for the consolidated portfolio (in thousands)
| Three months ended | Year ended | |||||||||||||||||||||||||||||||
| December 31, | % | December 31, | % | |||||||||||||||||||||||||||||
| 2020 | 2019 | Change | 2020 | 2019 | Change | |||||||||||||||||||||||||||
| Same Center Revenues: | ||||||||||||||||||||||||||||||||
| Rental revenues | $ | 103,415 | $ | 115,174 | -10.2 | % | $ | 369,806 | $ | 445,449 | -17.0 | % | ||||||||||||||||||||
| Other revenues | 2,766 | 2,519 | 9.8 | % | 7,682 | 9,458 | -18.8 | % | ||||||||||||||||||||||||
| Total same center revenues | 106,181 | 117,693 | -9.8 | % | 377,488 | 454,907 | -17.0 | % | ||||||||||||||||||||||||
| Same Center Expenses: | ||||||||||||||||||||||||||||||||
| Property operating | 33,266 | 37,011 | -10.1 | % | 129,480 | 146,901 | -11.9 | % | ||||||||||||||||||||||||
| General and administrative | 14 | 25 | -44.0 | % | 37 | 97 | -61.9 | % | ||||||||||||||||||||||||
| Total same center expenses | 33,280 | 37,036 | -10.1 | % | 129,517 | 146,998 | -11.9 | % | ||||||||||||||||||||||||
| Same Center NOI | $ | 72,901 | $ | 80,657 | -9.6 | % | $ | 247,971 | $ | 307,909 | -19.5 | % | ||||||||||||||||||||
28
Supplemental Operating and Financial Data for the
Quarter Ended 12/31/2020
Reconciliation of Net Income (Loss) to Adjusted EBITDA (in thousands)
| Three months ended | Year ended | |||||||||||||||||||||||||
| December 31, | December 31, | |||||||||||||||||||||||||
| 2020 | 2019 | 2020 | 2019 | |||||||||||||||||||||||
| Net income (loss) | $ | 277 | $ | (12,379) | $ | (38,013) | $ | 92,728 | ||||||||||||||||||
| Adjusted to exclude: | ||||||||||||||||||||||||||
| Interest expense | 15,356 | 15,034 | 63,142 | 61,672 | ||||||||||||||||||||||
| Depreciation and amortization | 29,177 | 30,305 | 117,143 | 123,314 | ||||||||||||||||||||||
Impairment charges - consolidated(1) | 21,551 | 37,610 | 67,226 | 37,610 | ||||||||||||||||||||||
| Impairment charge - unconsolidated joint ventures | — | — | 3,091 | — | ||||||||||||||||||||||
| Loss on sale of joint venture property, including foreign currency effect | — | — | — | 3,641 | ||||||||||||||||||||||
| Gain on sale of assets | — | — | (2,324) | (43,422) | ||||||||||||||||||||||
Compensation related to voluntary retirement plan and executive officer retirement (2) | 573 | — | 573 | 4,371 | ||||||||||||||||||||||
| Gain on sale of outparcel - unconsolidated joint ventures | (992) | — | (992) | — | ||||||||||||||||||||||
| Adjusted EBITDA | $ | 65,942 | $ | 70,570 | $ | 209,846 | $ | 279,914 | ||||||||||||||||||
Reconciliation of Net Income (Loss) to EBITDAre and Adjusted EBITDAre (in thousands)
| Three months ended | Year ended | |||||||||||||||||||||||||
| December 31, | December 31, | |||||||||||||||||||||||||
| 2020 | 2019 | 2020 | 2019 | |||||||||||||||||||||||
| Net income (loss) | $ | 277 | $ | (12,379) | $ | (38,013) | $ | 92,728 | ||||||||||||||||||
| Adjusted to exclude: | ||||||||||||||||||||||||||
| Interest expense | 15,356 | 15,034 | 63,142 | 61,672 | ||||||||||||||||||||||
| Depreciation and amortization | 29,177 | 30,305 | 117,143 | 123,314 | ||||||||||||||||||||||
Impairment charges - consolidated (1) | 21,551 | 37,610 | 67,226 | 37,610 | ||||||||||||||||||||||
| Impairment charge - unconsolidated joint ventures | — | — | 3,091 | — | ||||||||||||||||||||||
| Loss on sale of joint venture property, including foreign currency effect | — | — | — | 3,641 | ||||||||||||||||||||||
| Gain on sale of assets | — | — | (2,324) | (43,422) | ||||||||||||||||||||||
| Pro-rata share of interest expense - unconsolidated joint ventures | 1,550 | 1,952 | 6,545 | 8,117 | ||||||||||||||||||||||
Pro-rata share of depreciation and amortization - unconsolidated joint ventures | 2,985 | 3,058 | 12,024 | 12,458 | ||||||||||||||||||||||
| EBITDAre | $ | 70,896 | $ | 75,580 | $ | 228,834 | $ | 296,118 | ||||||||||||||||||
Compensation related to voluntary retirement plan and executive officer retirement (2) | 573 | — | 573 | 4,371 | ||||||||||||||||||||||
| Gain on sale of outparcel - unconsolidated joint ventures | (992) | — | (992) | — | ||||||||||||||||||||||
| Adjusted EBITDAre | $ | 70,477 | $ | 75,580 | $ | 228,415 | $ | 300,489 | ||||||||||||||||||
(1)Includes $2.6 million and $4.0 million for the three months and year ended December 31, 2020, respectively, of impairment loss attributable to the right-of-use asset associated with the ground lease at the Mashantucket (Foxwoods), Connecticut outlet center.
(2)The 2019 amount represents the accelerated recognition of compensation cost entitled to be received by the Company’s former President and Chief Operating Officer per the terms of a transition agreement executed in connection with his retirement. The 2020 amount represents compensation cost related to a voluntary retirement plan offer which required eligible participants to give notice of acceptance by December 1, 2020 for an effective retirement date of March 31, 2021.
29
Supplemental Operating and Financial Data for the
Quarter Ended 12/31/2020
Non-GAAP Pro Rata Balance Sheet Information as of December 31, 2020 (in thousands)
| Non-GAAP | |||||
Pro Rata Portion Unconsolidated Joint Ventures (1) | |||||
| Assets | |||||
| Rental property: | |||||
| Land | $ | 43,430 | |||
| Buildings, improvements and fixtures | 235,899 | ||||
| Construction in progress | 1,488 | ||||
| 280,817 | |||||
| Accumulated depreciation | (72,905) | ||||
| Total rental property, net | 207,912 | ||||
| Cash and cash equivalents | 10,736 | ||||
| Deferred lease costs and other intangibles, net | 2,425 | ||||
| Prepaids and other assets | 10,281 | ||||
| Total assets | $ | 231,354 | |||
| Liabilities and Owners’ Equity | |||||
| Liabilities | |||||
| Mortgages payable, net | $ | 172,428 | |||
| Accounts payable and accruals | 8,714 | ||||
| Total liabilities | 181,142 | ||||
| Owners’ equity | 50,212 | ||||
| Total liabilities and owners’ equity | $ | 231,354 | |||
(1)The carrying value of our investments in unconsolidated joint ventures as reported in our Consolidated Balance Sheet differs from our pro rata share of the net assets shown above due to adjustments to the book basis, including intercompany profits on sales of services that are capitalized by the unconsolidated joint ventures. The differences in basis totaled $3.6 million as of December 31, 2020 and are being amortized over the various useful lives of the related assets.
30
Supplemental Operating and Financial Data for the
Quarter Ended 12/31/2020
Non-GAAP Pro Rata Statement of Operations Information for the year ended December 31, 2020 (in thousands)
| Non-GAAP Pro Rata Portion | |||||||||||
| Noncontrolling Interests | Unconsolidated Joint Ventures | ||||||||||
| Revenues: | |||||||||||
Rental revenues | $ | — | $ | 38,041 | |||||||
| Other revenues | — | 392 | |||||||||
| Total revenues | — | 38,433 | |||||||||
| Expense: | |||||||||||
| Property operating | — | 16,526 | |||||||||
| General and administrative | — | 197 | |||||||||
| Depreciation and amortization | — | 12,024 | |||||||||
| Impairment charges | — | 3,091 | |||||||||
| Total expenses | — | 31,838 | |||||||||
| Other income (expense): | |||||||||||
| Interest expense | — | (6,545) | |||||||||
| Other income (expenses) | (190) | 1,076 | |||||||||
| Total other income (expense) | $ | (190) | $ | (5,469) | |||||||
| Net income (loss) | $ | (190) | $ | 1,126 | |||||||
The table below provides details of the components included in our share of rental revenues for the year ended December 31, 2020 (in thousands)
| Non-GAAP Pro Rata Portion | |||||||||||
| Noncontrolling Interests | Unconsolidated Joint Ventures | ||||||||||
| Rental revenues: | |||||||||||
Base rentals | $ | — | $ | 23,218 | |||||||
| Percentage rentals | — | 925 | |||||||||
| Tenant expense reimbursements | — | 15,145 | |||||||||
| Lease termination fees | — | 671 | |||||||||
| Market rent adjustments | — | (82) | |||||||||
| Straight-line rent adjustments | — | (283) | |||||||||
| Uncollectible tenant revenues | — | (1,553) | |||||||||
| Rental revenues | $ | — | $ | 38,041 | |||||||
31
Supplemental Operating and Financial Data for the
Quarter Ended 12/31/2020
Investor Information
Tanger Outlet Centers welcomes any questions or comments from shareholders, analysts, investment managers, media and prospective investors. Please address all inquiries to our Investor Relations Department.
| Tanger Factory Outlet Centers, Inc. | |||||
| Investor Relations | |||||
| Phone: | (336) 834-6892 | ||||
| Fax: | (336) 297-0931 | ||||
| e-mail: | tangerir@tangeroutlet.com | ||||
| Mail: | Tanger Factory Outlet Centers, Inc. | ||||
| 3200 Northline Avenue | |||||
| Suite 360 | |||||
| Greensboro, NC 27408 | |||||
32
Supplemental Operating and Financial Data for the
Quarter Ended 12/31/2020