Attached files
| file | filename |
|---|---|
| EX-99.1 - EX-99.1 - TransUnion | exhibit99112312020.htm |
| 8-K - 8-K - TransUnion | ck0001552033-20210216.htm |

v vv TransUnion Fourth Quarter 2020 Earnings Chris Cartwright, President and CEO Todd Cello, CFO Exhibit 99.2

© 2021 Trans Union LLC All Rights Reserved | 2 Forward-Looking Statement This presentation contains forward-looking statements within the meaning of the Private Securities Litigation Reform Act of 1995. These statements are based on the current beliefs and expectations of TransUnion’s management and are subject to significant risks and uncertainties. Actual results may differ materially from those described in the forward-looking statements. Factors that could cause TransUnion’s actual results to differ materially from those described in the forward-looking statements, including the effects of the COVID-19 pandemic and the timing of the recovery from the COVID-19 pandemic, can be found in TransUnion’s Annual Report on Form 10-K for the year ended December 31, 2020, as modified in any subsequent Quarterly Report on Form 10-Q or Current Report on Form 8-K, which are filed with the Securities and Exchange Commission and are available on TransUnion's website (www.transunion.com/tru) and on the Securities and Exchange Commission's website (www.sec.gov). TransUnion undertakes no obligation to update the forward-looking statements to reflect the impact of events or circumstances that may arise after the date of the forward-looking statements. Factors that could cause actual results to differ materially from those described in the forward-looking statements. Non-GAAP Financial Information This investor presentation includes certain non-GAAP measures that are more fully described in Exhibit 99.1, “Non-GAAP Financial Measures,” of our Current Report on Form 8-K filed on February 16, 2021. These financial measures should be reviewed in conjunction with the relevant GAAP financial measures and are not presented as alternative measures of GAAP. Other companies in our industry may define or calculate these measures differently than we do, limiting their usefulness as comparative measures. Because of these limitations, these non-GAAP financial measures should not be considered in isolation or as substitutes for performance measures calculated in accordance with GAAP. Reconciliations of these non-GAAP financial measures to their most directly comparable GAAP financial measures are presented in the tables of Exhibit 99.1 of our Current Report on Form 8-K filed on February 16, 2021.

© 2021 Trans Union LLC All Rights Reserved | 3 • Thank you to TransUnion associates for working diligently in challenging times • Racial Equity Taskforce to promote diversity and inclusion – Amplify consumer advocacy and outreach through local partnerships – Examine our data and products to promote greater financial inclusion – Formulate clear diversity commitments for new hires and promotions

© 2021 Trans Union LLC All Rights Reserved | 4 Growth investments and organizational changes 1 First quarter and full year 2021 guidance 4 Fourth quarter 2020 business trends2 Fourth quarter 2020 financial results3
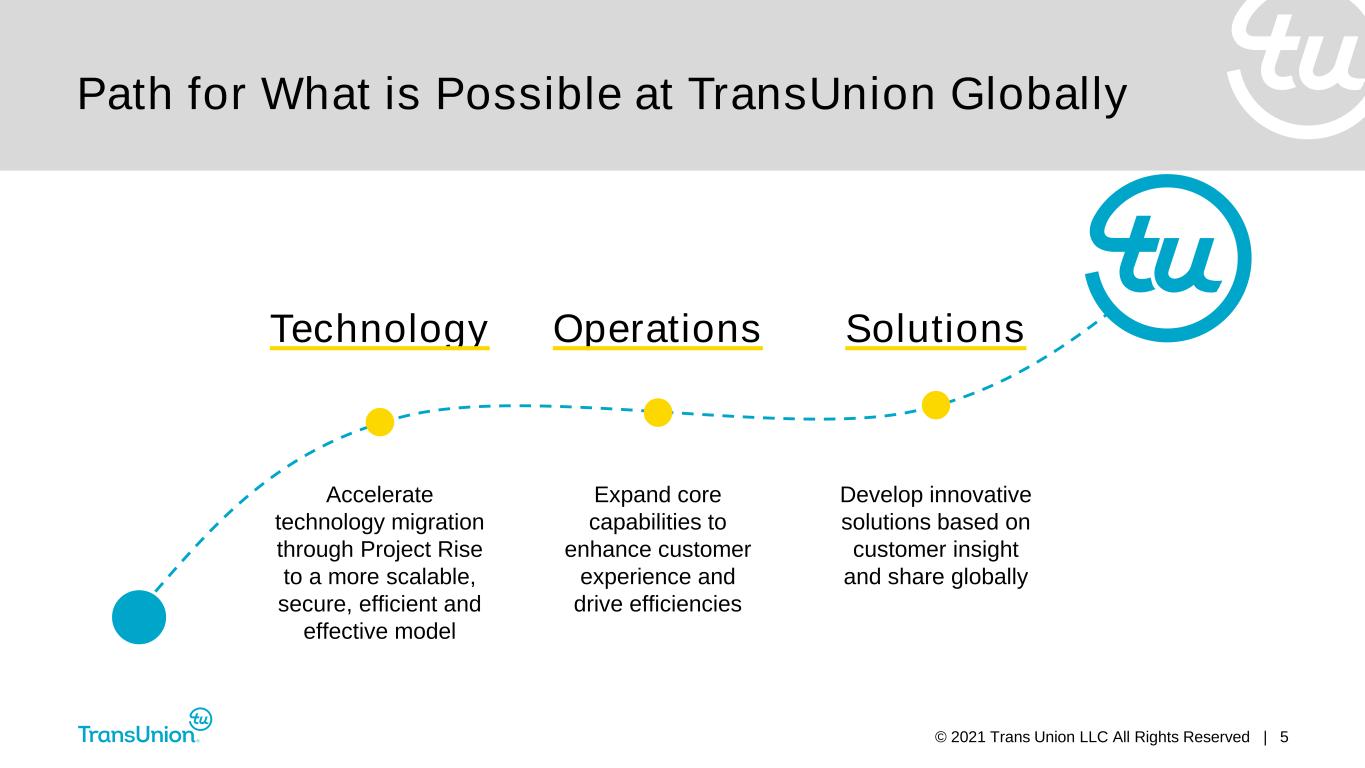
© 2021 Trans Union LLC All Rights Reserved | 5 Path for What is Possible at TransUnion Globally Technology Accelerate technology migration through Project Rise to a more scalable, secure, efficient and effective model Operations Expand core capabilities to enhance customer experience and drive efficiencies Solutions Develop innovative solutions based on customer insight and share globally

© 2021 Trans Union LLC All Rights Reserved | 6 • Streamline our application ecosystem • Implement hybrid cloud infrastructure to increase scale in computing and distribution • Utilize innovative tools to accelerate product development • Upskill technology workforce • Expect to save $20 to $30 million annually starting in 2023 Project Rise is Our Accelerated Initiative to Make TransUnion’s Technology More Scalable, Secure, Efficient and Effective
© 2021 Trans Union LLC All Rights Reserved | 7 Global Procurement: expanding procurement processes and implementing procure-to-pay system Global Capability Centers (GCC): opened centers in Chennai and Pune, India and Johannesburg, South Africa Process Optimization: implementing tools to enhance the customer experience Global Operations Allows Us to Expand Our Core Capabilities, Enhancing the Customer Experience and Driving Greater Efficiencies

© 2021 Trans Union LLC All Rights Reserved | 8 Global Solutions Will Improve Our Ability to Aggressively and Strategically Develop and Diffuse Innovation Globally Conducted extensive Fraud review • Rebranding to TruValidate SM • Repositioning into unified, comprehensive offering • Reorienting market focus Developed Digital Onboarding solution • Bundled pre-fill, ID verification, credit solutions and decisioning tools • Launched in India, South Africa, Colombia and the Philippines, creating a multi-million dollar business in less than a year

© 2021 Trans Union LLC All Rights Reserved | 9 Global Solutions Recent Partnerships Consumer-Permissioned Data Income & Employment Verification Partnered with MX, who aggregates financial information through consumer-permissioned connectivity on >45M consumers Partnered with the largest U.S. payroll provider and immediately introduced a differentiated income and employment verification solution More comprehensive view of consumers and provide an attractive complement to our innovative credit-based solutions

© 2021 Trans Union LLC All Rights Reserved | 10 Global Solutions Recent Acquisitions Cloud-based platform used to build and distribute precisely defined audience segments Allows us to help clients structure and activate their own audience intelligence Deepens our understanding of connected consumers via a household identity graph Enables audience segmentation and identity resolution Media

© 2021 Trans Union LLC All Rights Reserved | 11 Additional trend data since Q3 2020 Earnings Release U.S. Markets – Financial Services Trend Online Credit Report Unit Volumes Total U.S. Markets Financial Services Volume +15% 2019 2020 2021 (1) Volume growth/decline reflects year-over-year change for 7-day period ended February 12, 2021. Jan. Feb. Mar. Apr. May Jun. Jul. Aug. Sep. Oct. Nov. Dec. Jan. Feb. (1)

© 2021 Trans Union LLC All Rights Reserved | 12 U.S. Markets – Financial Services End-Market Trends Online Credit Report Unit Volumes (1) Volume growth/decline reflects year- over-year change for 7-day period ended February 12, 2021. Auto Card and Banking Consumer Lending Mortgage 2019 2020 2021 Additional trend data since Q3 2020 Earnings Release +14% Jan. Feb. Mar. Apr. May Jun. Jul. Aug. Sep. Oct. Nov. Dec. Jan. Feb. (1) Additional trend data since Q3 2020 Earnings Release +4% Jan. Feb. Mar. Apr. May Jun. Jul. Aug. Sep. Oct. Nov. Dec. Jan. Feb. (1) Additional trend data since Q3 2020 Earnings Release +36% Jan. Feb. Mar. Apr. May Jun. Jul. Aug. Sep. Oct. Nov. Dec. Jan. Feb. (1) Additional trend data since Q3 2020 Earnings Release +13% Jan. Feb. Mar. Apr. May Jun. Jul. Aug. Sep. Oct. Nov. Dec. Jan. Feb. (1) Participation in significant new card launch
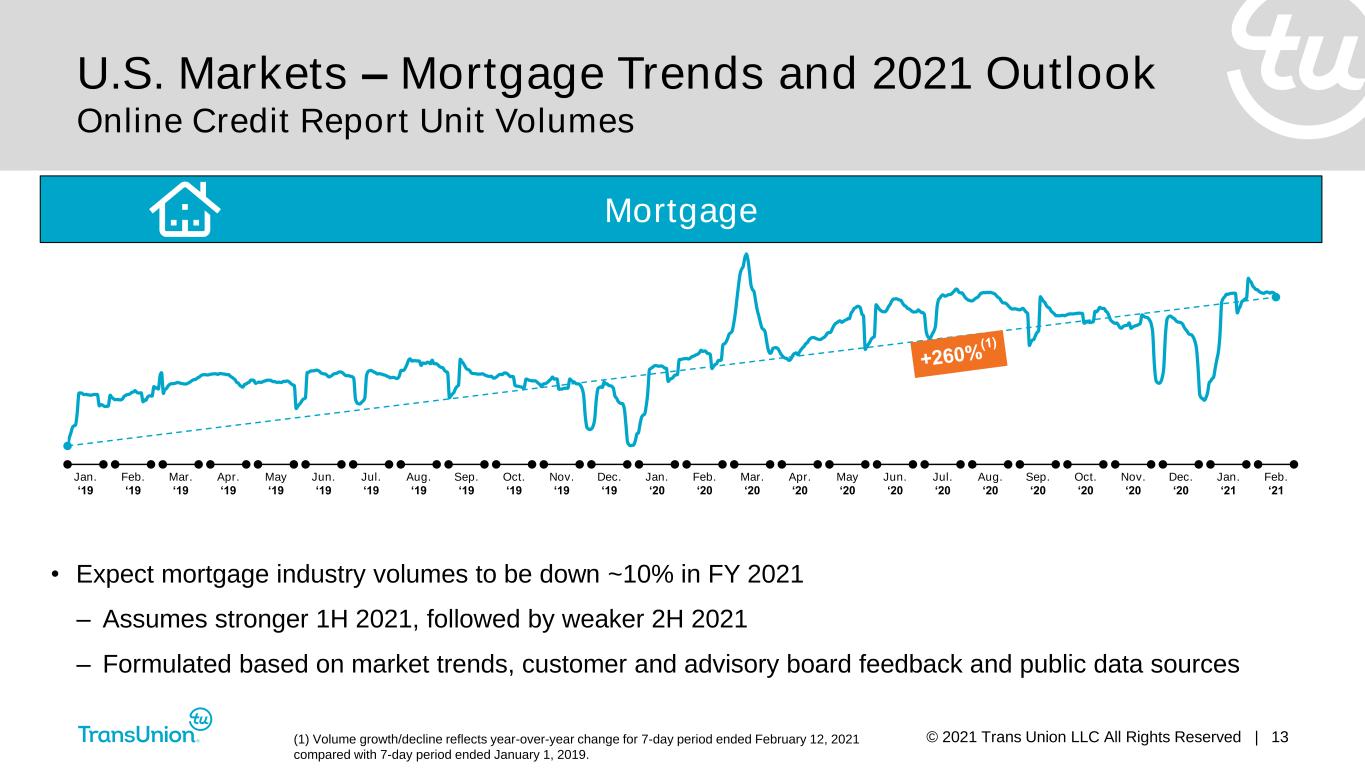
© 2021 Trans Union LLC All Rights Reserved | 13 U.S. Markets – Mortgage Trends and 2021 Outlook Online Credit Report Unit Volumes Mortgage • Expect mortgage industry volumes to be down ~10% in FY 2021 – Assumes stronger 1H 2021, followed by weaker 2H 2021 – Formulated based on market trends, customer and advisory board feedback and public data sources (1) Volume growth/decline reflects year-over-year change for 7-day period ended February 12, 2021 compared with 7-day period ended January 1, 2019. Jan. ‘19 Feb. ‘19 Mar. ‘19 Apr. ‘19 May ‘19 Jun. ‘19 Jul. ‘19 Aug. ‘19 Sep. ‘19 Oct. ‘19 Nov. ‘19 Dec. ‘19 Jan. ‘20 Feb. ‘20 Mar. ‘20 Apr. ‘20 May ‘20 Jun. ‘20 Jul. ‘20 Aug. ‘20 Sep. ‘20 Oct. ‘20 Nov. ‘20 Dec. ‘20 Jan. ‘21 Feb. ‘21

© 2021 Trans Union LLC All Rights Reserved | 14 Emerging Markets Vertical Trends Vertical Q4 2020 Performance Public Sector Significant growth as a result of innovation and new business Healthcare Improved performance in front-end offset by lower back-end volumes Insurance Continued success with innovation and portfolio diversification Tenant Screening Solid performance as leasing companies remain active Collections Delayed recovery due to collections moratoriums, forbearance programs and government stimulus Employment Screening Continued softness given high unemployment rates Media Strong performance from organic growth and new business Vertical Q4 2020 Performance Telco Solid recovery as consumers have resumed a more normal purchase cadence

© 2021 Trans Union LLC All Rights Reserved | 15 Consumers recognize value of credit and identity protection, credit monitoring and financial education tools • Direct channel delivered double-digit revenue growth behind continued successful marketing • Indirect channel remained soft as Indirect partners have continued curtailing marketing programs Consumer Interactive Trends

© 2021 Trans Union LLC All Rights Reserved | 16 International Quarterly Trends Year-over-Year Constant Currency Adj. Revenue Growth / (Decline) Note: quarterly adjusted revenue performance shown in constant currency. 10% (13%) (8%) 2% 16% (2%) 3% 2% 14% (23%) (8%) 2% 6% (22%) (5%) (1%) 4% (21%) (10%) (13%) 0% (12%) (6%) (8%) Q1 2020 Q2 2020 Q3 2020 Q4 2020 India U.K. ex. Disposition Africa Asia Pacific Latin America Canada

© 2021 Trans Union LLC All Rights Reserved | 17 International Highlights Country or Region Q4 2020 Performance U.K. Improving end markets, strength in our fraud and gaming businesses, and new business wins India Strengthening results from full economic reopening, new business wins and customer engagement programs Latin America Improving results as Colombia and Brazil grew while most other markets remained stable Africa Economic challenges persist; tailoring solutions to customers’ needs Canada Continued growth driven by portfolio diversification: Insurance and Public Sector verticals, direct-to-consumer offerings and FinTech Asia Pacific Hong Kong returned to growth due to relaunched direct-to-consumer offering, while headwinds continue in Philippines
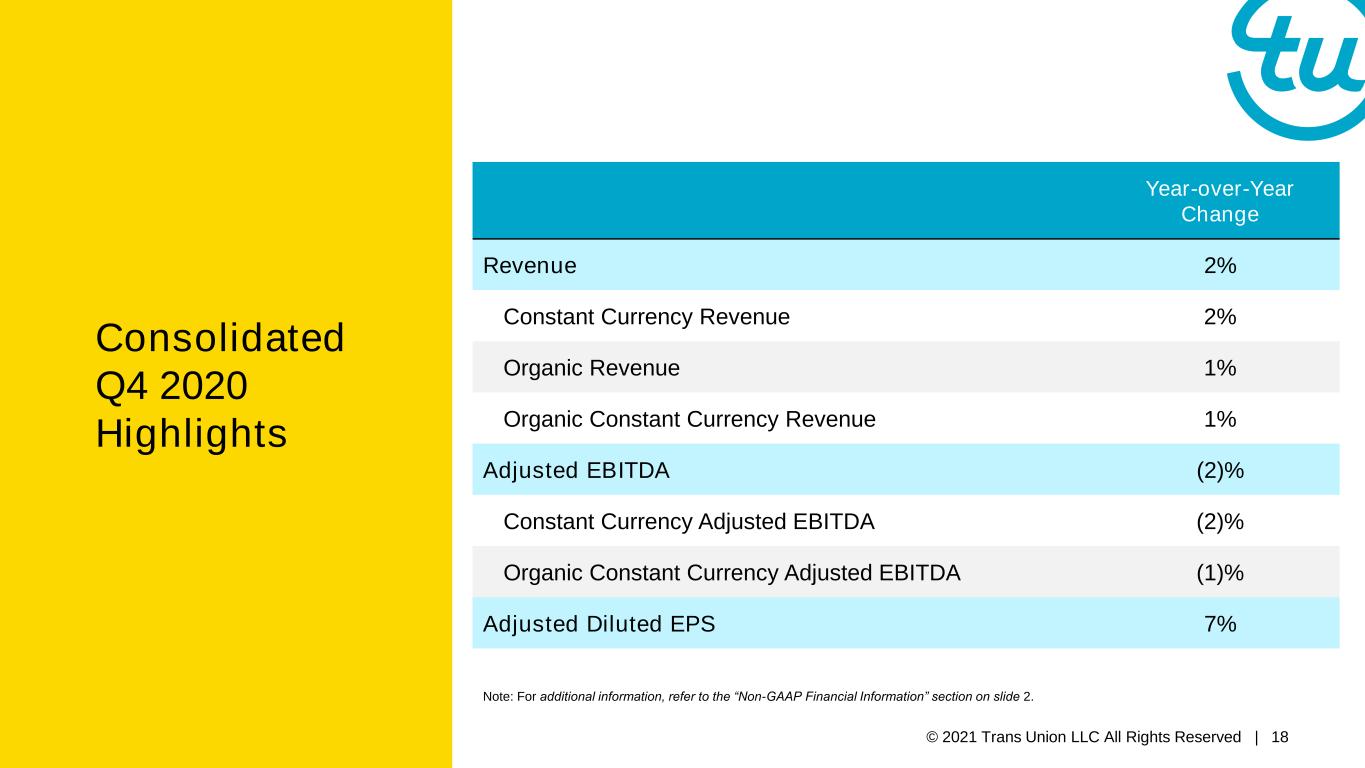
© 2021 Trans Union LLC All Rights Reserved | 18 Consolidated Q4 2020 Highlights Year-over-Year Change Revenue 2% Constant Currency Revenue 2% Organic Revenue 1% Organic Constant Currency Revenue 1% Adjusted EBITDA (2)% Constant Currency Adjusted EBITDA (2)% Organic Constant Currency Adjusted EBITDA (1)% Adjusted Diluted EPS 7% Note: For additional information, refer to the “Non-GAAP Financial Information” section on slide 2.

© 2021 Trans Union LLC All Rights Reserved | 19 Note: Rows may not foot due to rounding. For additional information, refer to the “Non-GAAP Financial Information” section on slide 2. Reported FX Impact Inorganic Impact Organic Constant Currency Revenue 4% — (1)% 3% Financial Services 7% — — 7% Emerging Verticals (0)% — (3)% (3)% Adjusted EBITDA (2)% — 1% (1)% U.S. Markets Q4 2020 Year-over-Year Financial Highlights

© 2021 Trans Union LLC All Rights Reserved | 20 Consumer Interactive Q4 2020 Year-over-Year Financial Highlights Reported FX Impact Inorganic Impact Organic Constant Currency Revenue 3% — — 3% Adjusted EBITDA (2)% — — (2)% Note: For additional information, refer to the “Non-GAAP Financial Information” section on slide 2.

© 2021 Trans Union LLC All Rights Reserved | 21 Note: Rows may not foot due to rounding. For additional information, refer to the “Non-GAAP Financial Information” section on slide 2. Reported FX Impact Inorganic Impact Organic Constant Currency Organic CC ex. Recipero Disposition Revenue (4)% +2% — (2)% (1)% Canada 4% (1)% — 2% — Latin America (12)% +10% — (1)% — U.K. 1% (3)% — (1)% 2% Africa (19)% +6% — (13)% — India (2)% +4% — 2% — Asia Pacific (6)% (2)% — (8)% — Adjusted EBITDA (6)% +2% — (4)% — International Q4 2020 Year-over-Year Financial Highlights
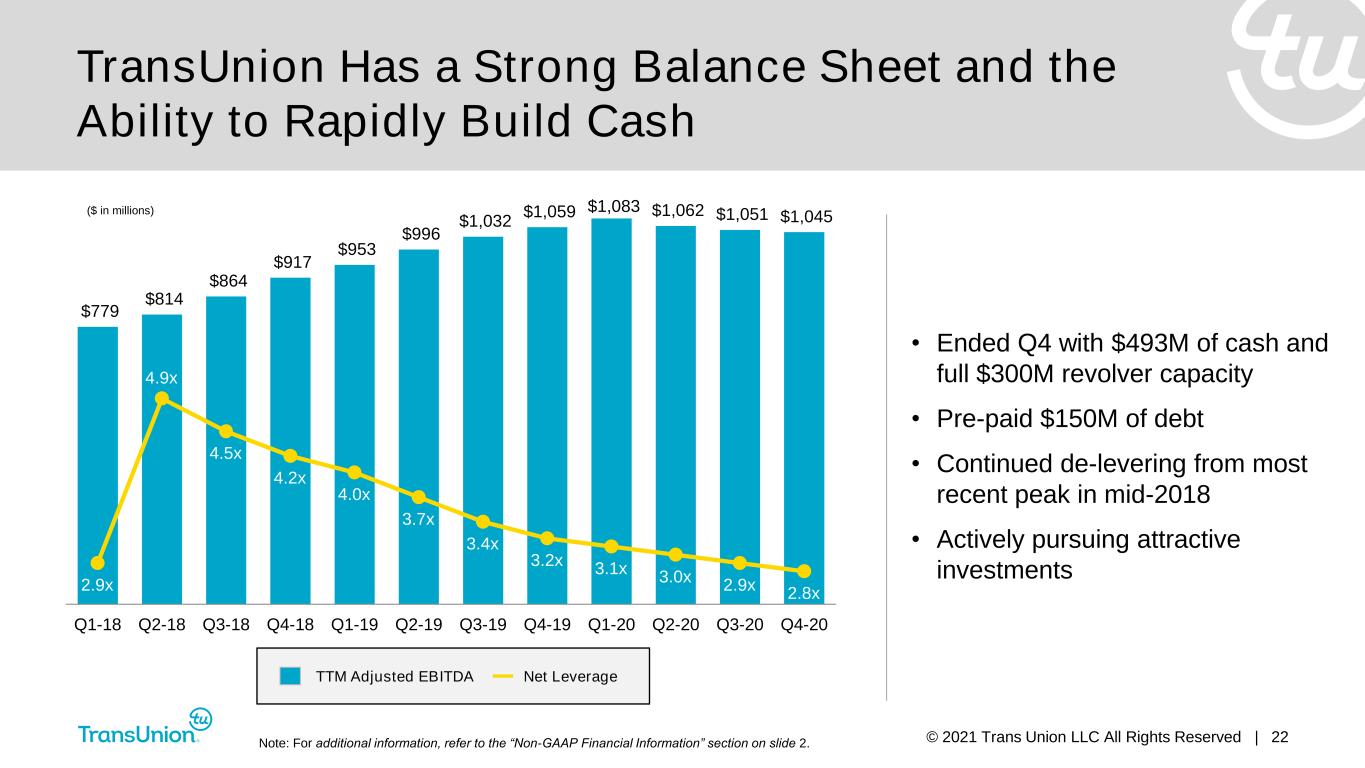
© 2021 Trans Union LLC All Rights Reserved | 22 TransUnion Has a Strong Balance Sheet and the Ability to Rapidly Build Cash TTM Adjusted EBITDA Net Leverage $779 $814 $864 $917 $953 $996 $1,032 $1,059 $1,083 $1,062 $1,051 $1,045 2.9x 4.9x 4.5x 4.2x 4.0x 3.7x 3.4x 3.2x 3.1x 3.0x 2.9x 2.8x $- $200 $400 $600 $800 $1,000 Q1-18 Q2-18 Q3-18 Q4-18 Q1-19 Q2-19 Q3-19 Q4-19 Q1-20 Q2-20 Q3-20 Q4-20 2x 3x 4x 5x 6x ($ in millions) • Ended Q4 with $493M of cash and full $300M revolver capacity • Pre-paid $150M of debt • Continued de-levering from most recent peak in mid-2018 • Actively pursuing attractive investments Note: For additional information, refer to the “Non-GAAP Financial Information” section on slide 2.
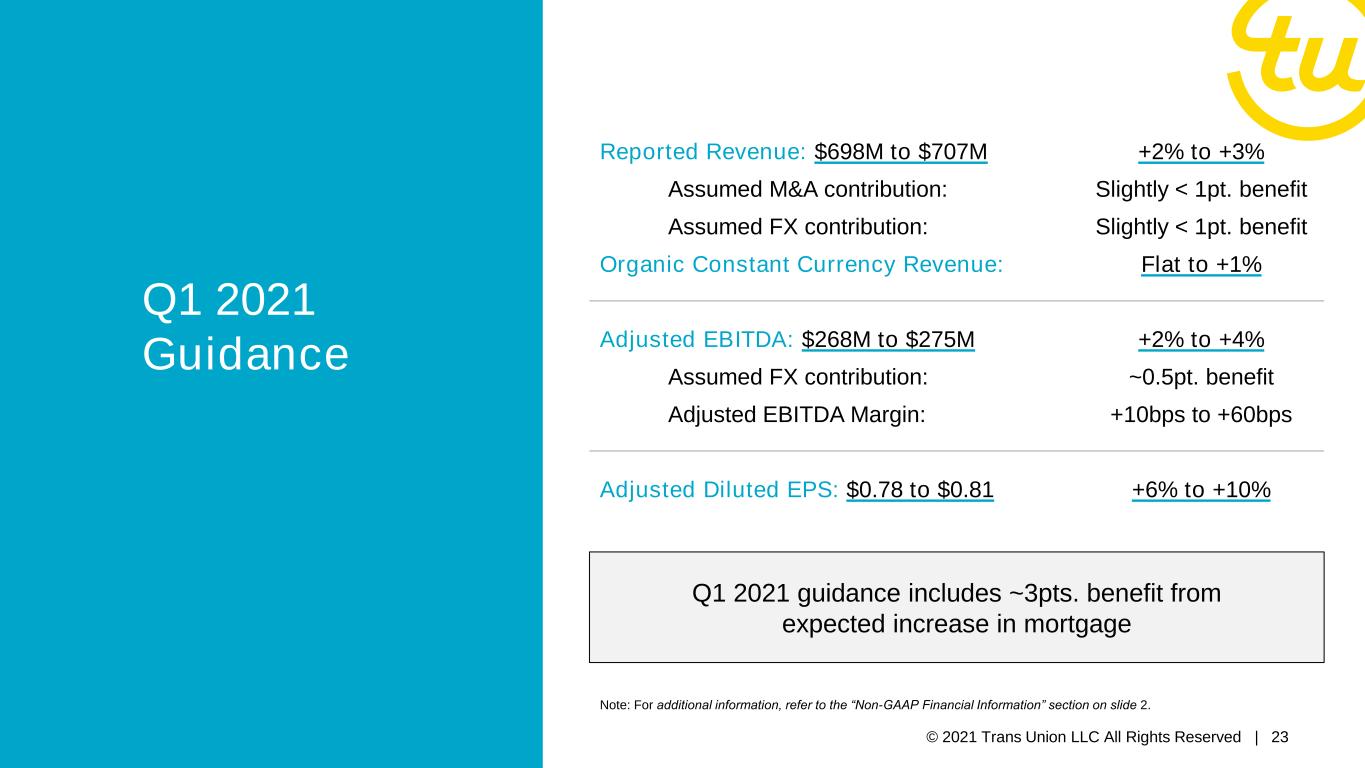
© 2021 Trans Union LLC All Rights Reserved | 23 Q1 2021 Guidance Reported Revenue: $698M to $707M +2% to +3% Assumed M&A contribution: Slightly < 1pt. benefit Assumed FX contribution: Slightly < 1pt. benefit Organic Constant Currency Revenue: Flat to +1% Adjusted EBITDA: $268M to $275M +2% to +4% Assumed FX contribution: ~0.5pt. benefit Adjusted EBITDA Margin: +10bps to +60bps Adjusted Diluted EPS: $0.78 to $0.81 +6% to +10% Q1 2021 guidance includes ~3pts. benefit from expected increase in mortgage Note: For additional information, refer to the “Non-GAAP Financial Information” section on slide 2.

© 2021 Trans Union LLC All Rights Reserved | 24 FY 2021 Revenue Guidance Note: For additional information, refer to the “Non-GAAP Financial Information” section on slide 2. Reported Revenue: $2.817B to $2.877B +4% to +6% Assumed M&A contribution: ~0.5pt. benefit Assumed FX contribution: ~1.0pt. benefit Organic Constant Currency Revenue: +2% to +4% Assumed Mortgage impact: ~2pt. headwind Organic CC Revenue ex. Mortgage: +4% to +6% • U.S. Markets up mid-single-digits [up high-single-digits excluding mortgage impact] – Financial Services flat [up mid-single-digits excluding mortgage impact] – Emerging Verticals up high-single-digits • International up high-single-digits • Consumer Interactive up slightly
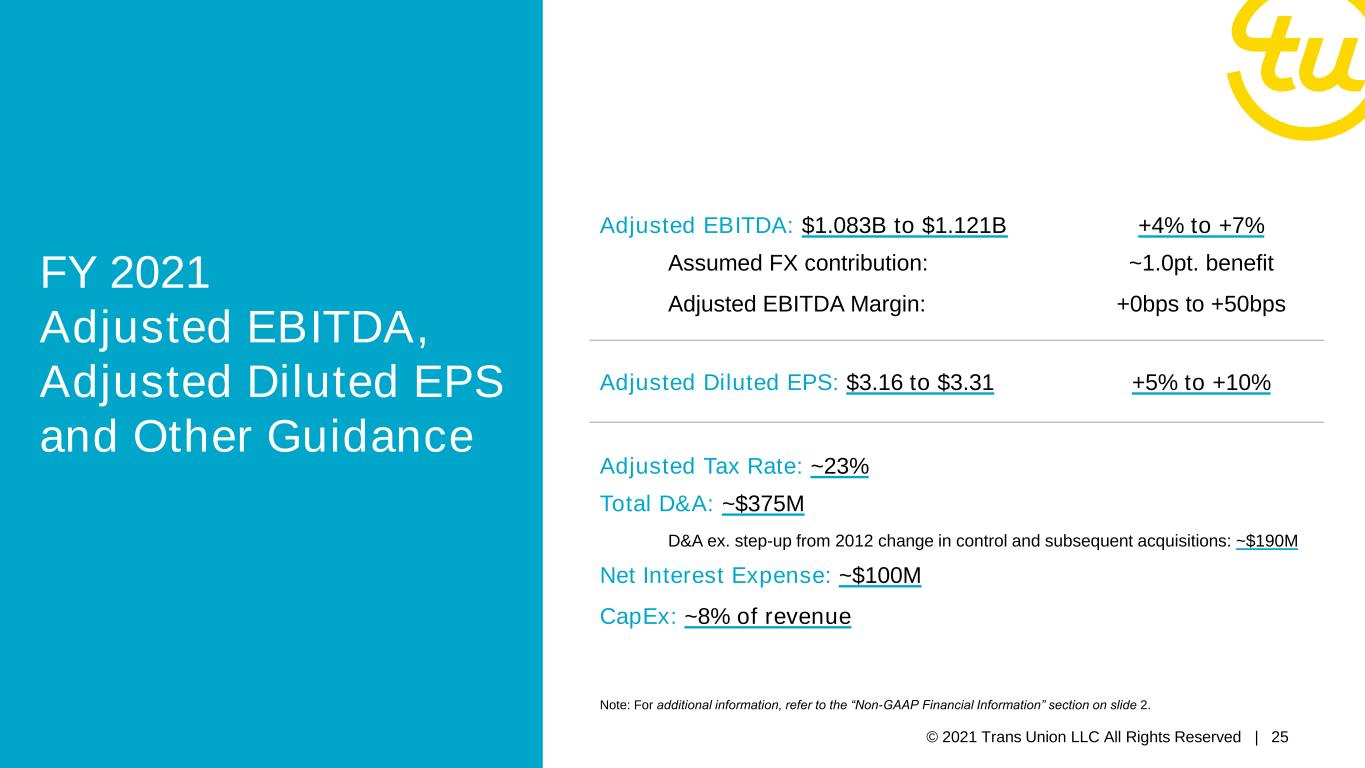
© 2021 Trans Union LLC All Rights Reserved | 25 FY 2021 Adjusted EBITDA, Adjusted Diluted EPS and Other Guidance Adjusted EBITDA: $1.083B to $1.121B +4% to +7% Assumed FX contribution: ~1.0pt. benefit Adjusted EBITDA Margin: +0bps to +50bps Adjusted Diluted EPS: $3.16 to $3.31 +5% to +10% Adjusted Tax Rate: ~23% Total D&A: ~$375M D&A ex. step-up from 2012 change in control and subsequent acquisitions: ~$190M Net Interest Expense: ~$100M CapEx: ~8% of revenue Note: For additional information, refer to the “Non-GAAP Financial Information” section on slide 2.

© 2021 Trans Union LLC All Rights Reserved | 26 • Making progress on Project Rise, Global Operations and Global Solutions • Delivering good business performance despite challenging conditions

© 2021 Trans Union LLC All Rights Reserved | 27 Q&A
