Attached files
| file | filename |
|---|---|
| EX-99.1 - EX-99.1 - Kaleyra, Inc. | d132653dex991.htm |
| 8-K - 8-K - Kaleyra, Inc. | d132653d8k.htm |
AMERICAN Copyright © Ka eyra, Inc. 2021
Exhibit 99.2
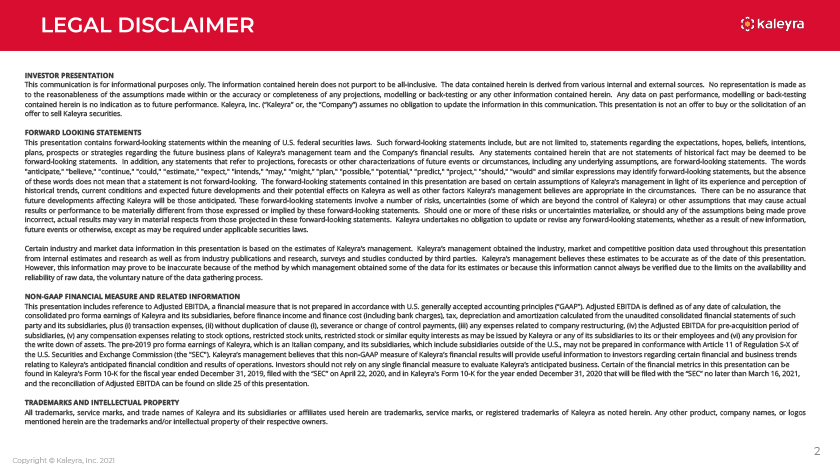
INVESTOR PRESENTATION This communication is for informationa purposes on y. The information contained herein does not purport to be a -inc usive. The data contained herein is derived from various interna and externa sources. No representation is made as to the reasonab eness of the assumptions made within or the accuracy or comp eteness of any projections, mode ing or back-testing or any other information contained herein. Any data on past performance, mode ing or back-testing contained herein is no indication as to future performance. Ka eyra, Inc. ( Ka eyra or, the Company ) assumes no ob igation to update the information in this communication. This presentation is not an offer to buy or the so icitation of an offer to se Ka eyra securities. FORWARD OOKING STATEMENTS This presentation contains forward- ooking statements within the meaning of U.S. federa securities aws. Such forward- ooking statements inc ude, but are not imited to, statements regarding the expectations, hopes, be iefs, intentions, p ans, prospects or strategies regarding the future business pans of Kaeyra’s management team and the Company’s financia resu ts. Any statements contained herein that are not statements of historica fact may be deemed to be forward- ooking statements. In addition, any statements that refer to projections, forecasts or other characterizations of future events or circumstances, inc uding any under ying assumptions, are forward- ooking statements. The words anticipate, be ieve, continue, cou d, estimate, expect, intends, may, might, p an, possib e, potentia , predict, project, shoud, wou d and simi ar expressions may identify forward- ooking statements, but the absence of these words does not mean that a statement is not forward- ooking. The forward- ooking statements contained in this presentation are based on certain assumptions of Ka eyra’s management in ight of its experience and perception of historica trends, current conditions and expected future deve opments and their potentia effects on Ka eyra as we as other factors Ka eyra’s management be ieves are appropriate in the circumstances. There can be no assurance that future deve opments affecting Ka eyra wi be those anticipated. These forward- ooking statements invo ve a number of risks, uncertainties (some of which are beyond the contro of Ka eyra) or other assumptions that may cause actua resu ts or performance to be materia y different from those expressed or imp ied by these forward- ooking statements. Shou d one or more of these risks or uncertainties materia ize, or shou d any of the assumptions being made prove incorrect, actua resu ts may vary in materia respects from those projected in these forward- ooking statements. Ka eyra undertakes no ob igation to update or revise any forward- ooking statements, whether as a resu t of new information, future events or otherwise, except as may be required under app icab e securities aws. Certain industry and market data information in this presentation is based on the estimates of Ka eyra’s management. Ka eyra’s management obtained the industry, market and competitive position data used throughout this presentation from interna estimates and research as we as from industry pub ications and research, surveys and studies conducted by third parties. Ka eyra’s management be ieves these estimates to be accurate as of the date of this presentation. However, this information may prove to be inaccurate because of the method by which management obtained some of the data for its estimates or because this information cannot a ways be verified due to the imits on the avai abi ity and re iabi ity of raw data, the vo untary nature of the data gathering process. NON-GAAP FINANCIA MEASURE AND RE ATED INFORMATION This presentation inc udes reference to Adjusted EBITDA, a financia measure that is not prepared in accordance with U.S. genera y accepted accounting princip es ( GAAP ). Adjusted EBITDA is defined as of any date of ca cu ation, the conso idated pro forma earnings of Ka eyra and its subsidiaries, before finance income and finance cost (inc uding bank charges), tax, depreciation and amortization ca cu ated from the unaudited conso idated financia statements of such party and its subsidiaries, p us (i) transaction expenses, (ii) without dup ication of c ause (i), severance or change of contro payments, (iii) any expenses re ated to company restructuring, (iv) the Adjusted EBITDA for pre-acquisition period of subsidiaries, (v) any compensation expenses re ating to stock options, restricted stock units, restricted stock or simi ar equity interests as may be issued by Ka eyra or any of its subsidiaries to its or their emp oyees and (vi) any provision for the write down of assets. The pre-2019 pro forma earnings of Ka eyra, which is an Ita ian company, and its subsidiaries, which inc ude subsidiaries outside of the U.S., may not be prepared in conformance with Artic e 11 of Regu ation S-X of the U.S. Securities and Exchange Commission (the SEC ). Ka eyra’s management be ieves that this non-GAAP measure of Ka eyra’s financia resu ts wi provide usefu information to investors regarding certain financia and business trends re ating to Ka eyra’s anticipated financia condition and resu ts of operations. Investors shou d not re y on any sing e financia measure to eva uate Ka eyra’s anticipated business. Certain of the financia metrics in this presentation can be found in Ka eyra’s Form 10-K for the fisca year ended December 31, 2019, fi ed with the SEC on Apri 22, 2020, and in Ka eyra’s Form 10-K for the year ended December 31, 2020 that wi be fi ed with the SEC no ater than March 16, 2021, and the reconci iation of Adjusted EBITDA can be found on s ide 25 of this presentation. TRADEMARKS AND INTE ECTUA PROPERTY A trademarks, service marks, and trade names of Ka eyra and its subsidiaries or affi iates used herein are trademarks, service marks, or registered trademarks of Ka eyra as noted herein. Any other product, company names, or ogos mentioned herein are the trademarks and/or inte ectua property of their respective owners. 2 Copyright © Ka eyra, Inc. 2021
We’re a Communication P atform as a Service, or , for short.

Founded in 1999 and isted on the NYSE in 2019.
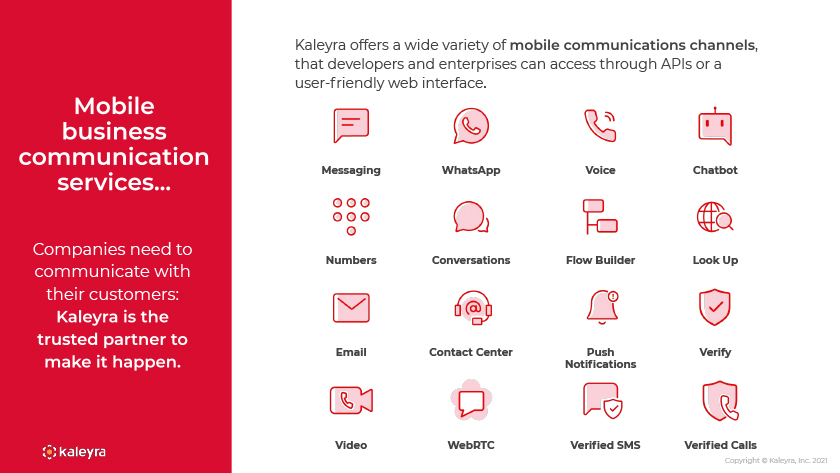
Companies need to communicate with their customers: Ka eyra offers a wide variety of , that deve opers and enterprises can access through APIs or a user-friend y web interface. Messaging WhatsApp Voice Chatbot Numbers Conversations F ow Bui der ook Up Emai Contact Center Push Verify Notifications Video WebRTC Verified SMS Verified Ca s Copyright © Ka eyra, Inc. 2021
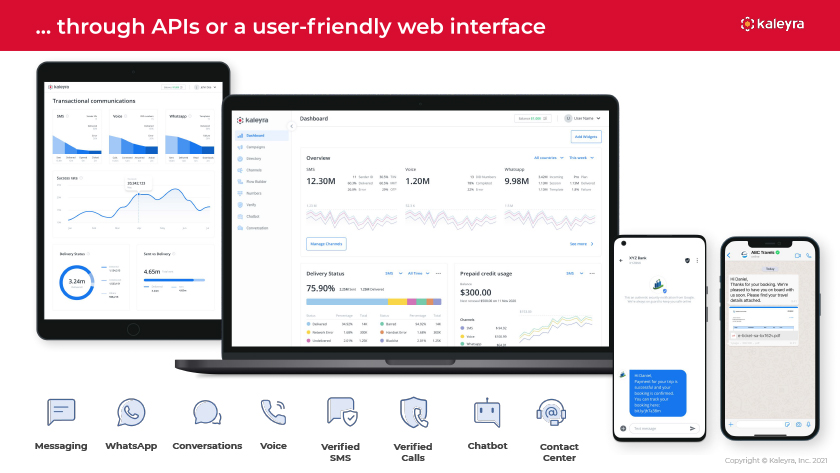
through APis or a user-friend y web interface De ve )‘Status SentV’ De ry e 4.65m T tf a..r-1s SMS Voice Whatsapp .. F owBudOer 12.30M 1.20M 9.98M .o M P ...... very SftmOfe ) De ivery Status Prepaid credit usage 75.90% $300.00 S Trave sO [)Hi Danie , Thanks oryourbook ng.We’re p easedtohaveyouonboardwith ussoon.Pk asefindyourtrave detai sa ac::hed . .. e-ticket-sa·b 16Zv.pdf G @ J. Messaging WhatsApp Conversations Voice Verified Verified Chatbot Contact SMS Ca s Center
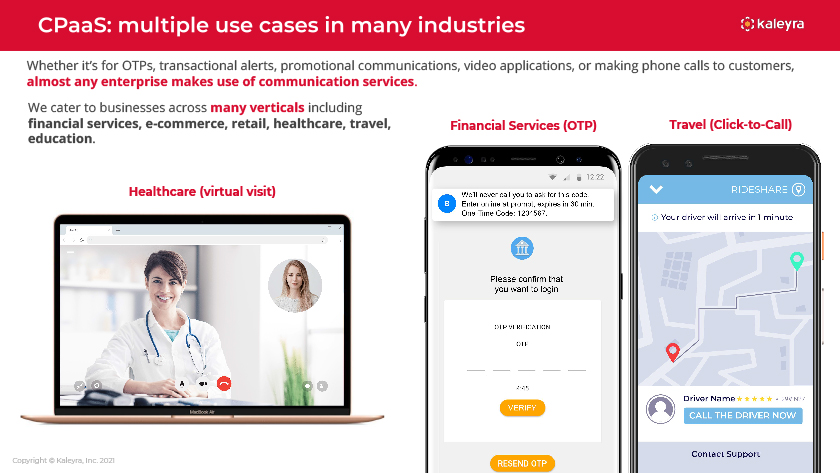
Whether it’s for OTPs, transactiona a erts, promotiona communications, video app ications, or making phone ca s to customers, a most any enterprise makes use of communication services. We cater to businesses across many vertica s inc uding financia services, e-commerce, retai , hea thcare, trave , education. Hea thcare (virtua visit) Financia Services (OTP) Trave (C ick-to-Ca )
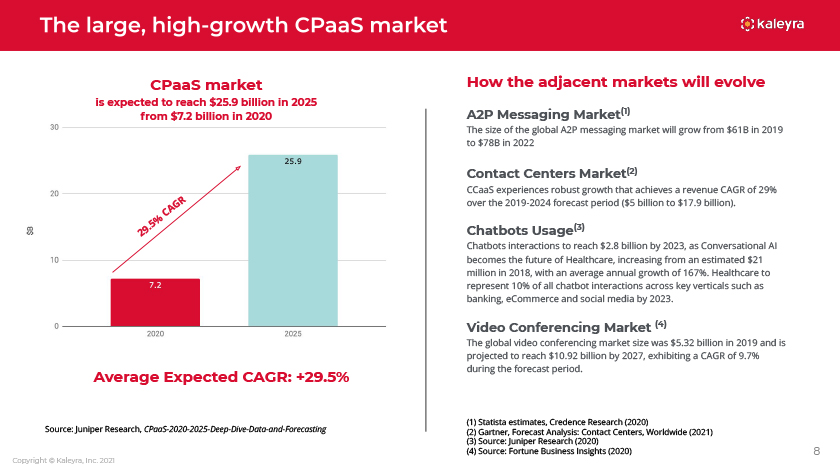
CPaaS market is expected to reach $25.9 bi ion in 2025 from $7.2 bi ion in 2020 CAGR . 5% 29 Average Expected CAGR: 29.5% Source: Juniper Research, CPaaS-2020-2025-Deep-Dive-Data-and-Forecasting Copyright © Ka eyra, Inc. 2021 How the adjacent markets wi evo ve A2P Messaging Market(1) The size of the goba A2P messaging market wi grow from $61B in 2019 to $78B in 2022 Contact Centers Market(2) CCaaS experiences robust growth that achieves a revenue CAGR of 29% over the 2019-2024 forecast period ($5 bi ion to $17.9 bi ion). Chatbots Usage(3) Chatbots interactions to reach $2.8 bi ion by 2023, as Conversationa AI becomes the future of Hea thcare, increasing from an estimated $21 mi ion in 2018, with an average annua growth of 167%. Hea thcare to represent 10% of a chatbot interactions across key vertica s such as banking, eCommerce and socia media by 2023. Video Conferencing Market (4) The g oba video conferencing market size was $5.32 bi ion in 2019 and is projected to reach $10.92 bi ion by 2027, exhibiting a CAGR of 9.7% during the forecast period. (1) Statista estimates, Credence Research (2020) (2) Gartner, Forecast Ana ysis: Contact Centers, Wor dwide (2021) (3) Source: Juniper Research (2020) (4) Source: Fortune Business Insights (2020) 8
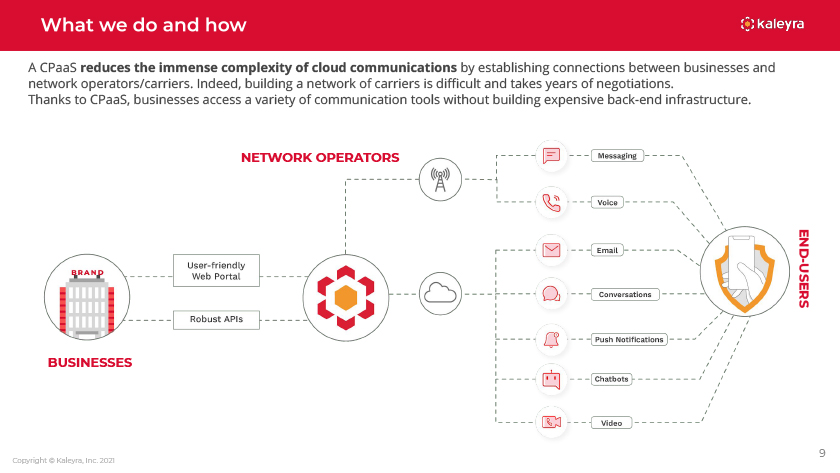
A CPaaS reduces the immense compexity of c oud communications by estab ishing connections between businesses and network operators/carriers. Indeed, building a network of carriers is difficult and takes years of negotiations. Thanks to CPaaS, businesses access a variety of communication too s without building expensive back-end infrastructure. NETWORK OPERATORS—END USERS BUSINESSES 9 Copyright © Ka eyra, Inc. 2021
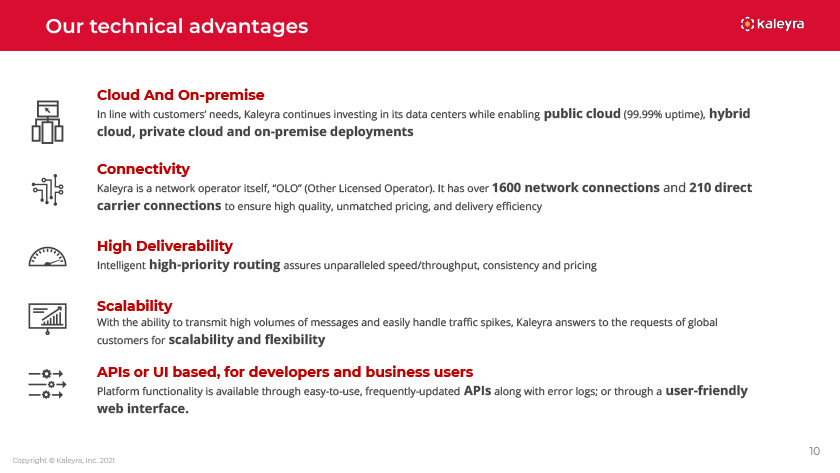
C oud And On-premise In ine with customers’ needs, Ka eyra continues investing in its data centers whi e enab ing pub ic c oud (99.99% uptime), hybrid c oud, private c oud and on-premise dep oyments Connectivity Ka eyra is a network operator itse f, O O (Other icensed Operator). It has over 1600 network connections and 210 direct carrier connections to ensure high qua ity, unmatched pricing, and de ivery efficiency High De iverabi ity Inte igent high-priority routing assures unpara e ed speed/throughput, consistency and pricing Sca abi ity With the abi ity to transmit high vo umes of messages and easi y hand e traffic spikes, Ka eyra answers to the requests of g oba customers for sca abi ity and flexibi ity APIs or UI based, for deve opers and business users P atform functiona ity is avai ab e through easy-to-use, frequent y-updated APIs a ong with error ogs; or through a user-friend y web interface. 10 Copyright © Ka eyra, Inc. 2021
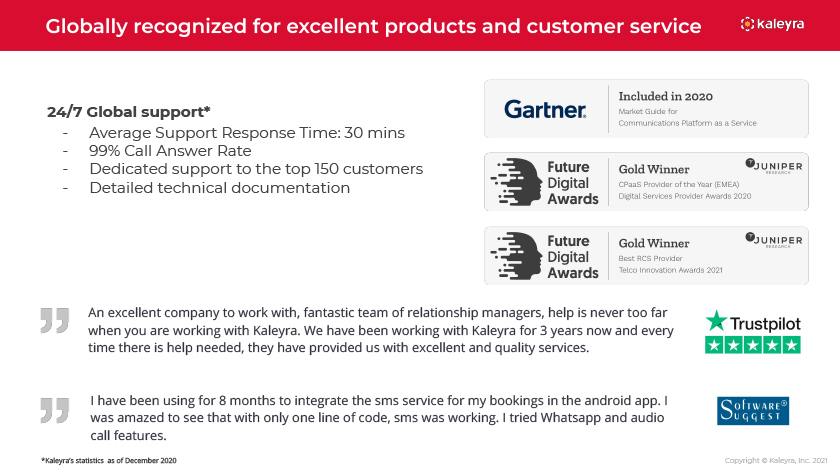
24/7 G oba support*—Average Support Response Time: 30 mins —99% Ca Answer Rate—Dedicated support to the top 150 customers—Detai ed technica documentation An exce ent company to work with, fantastic team of re ationship managers, he p is never too far when you are working with Ka eyra. We have been working with Ka eyra for 3 years now and every time there is he p needed, they have provided us with exce ent and qua ity services. I have been using for 8 months to integrate the sms service for my bookings in the android app. I was amazed to see that with on y one ine of code, sms was working. I tried Whatsapp and audio ca features. *Ka eyra’s statistics as of December 2020 Copyright © Ka eyra, Inc. 2021
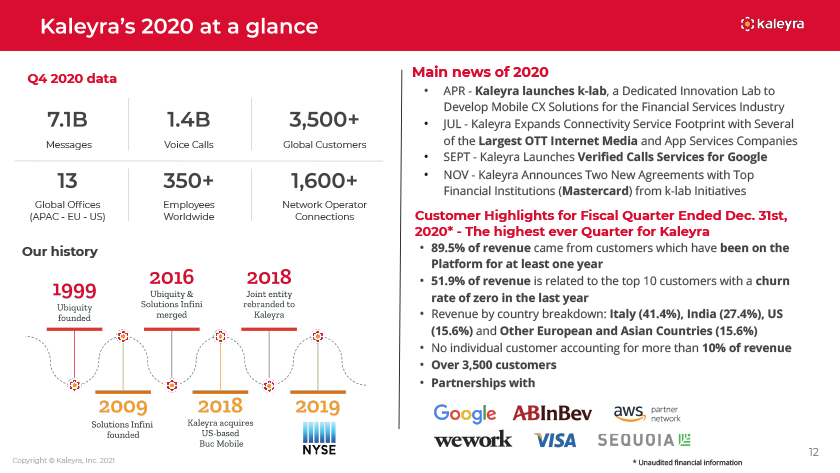
Q4 2020 data Messages Voice Ca s G oba Customers G oba Offices Emp oyees Network Operator (APAC—EU—US) Wor dwide Connections Our history Copyright © Ka eyra, Inc. 2021 Main news of 2020 APR—Ka eyra aunches k- ab, a Dedicated Innovation ab to Deve op Mobi e CX So utions for the Financia Services Industry JU —Ka eyra Expands Connectivity Service Footprint with Severa of the argest OTT Internet Media and App Services Companies SEPT—Ka eyra aunches Verified Ca s Services for Goog e NOV—Ka eyra Announces Two New Agreements with Top Financia Institutions (Mastercard) from k- ab Initiatives Customer High ights for Fisca Quarter Ended Dec. 31st, 2020*—The highest ever Quarter for Ka eyra 89.5% of revenue came from customers which have been on the P atform for at east one year 51.9% of revenue is re ated to the top 10 customers with a churn rate of zero in the ast year Revenue by country breakdown: Ita y (41.4%), India (27.4%), US (15.6%) and Other European and Asian Countries (15.6%) No individua customer accounting for more than 10% of revenue Over 3,500 customers Partnerships with 12 * Unaudited financia information

Dario Ca ogero Ashish Agarwa Giacomo Da ’Ag io Aniketh Jain Chief Executiv Chief Techno ogy Officer cia Officer Chief Revenue Officer Fi ippo Monastra Soren Schafft Nico a Junior Vitto Chief of Staff Genera Manager, Connectivity and Chief Product Officer Industry So utions 13 Copyright © Ka eyra, Inc. 2021
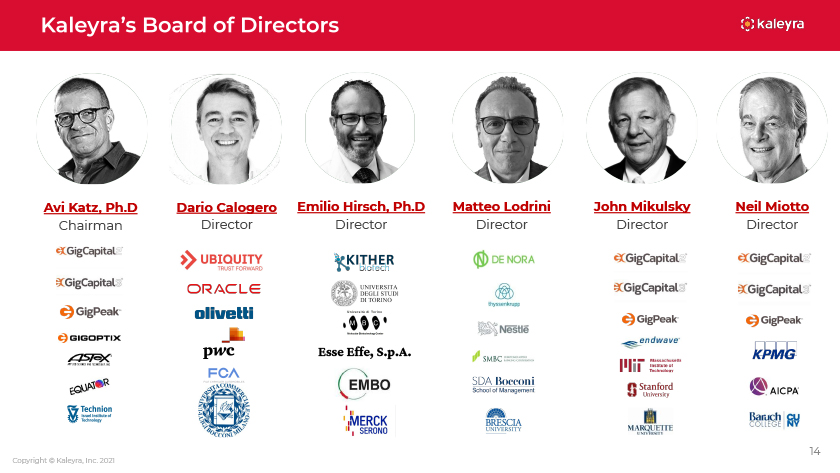
Avi Katz, Ph.D Dario Ca ogero Emi io Hirsch, Ph.D Matteo odrini John Miku sky Nei Miotto Chairman Director Director Director Director . 14 Copyright © Ka eyra, Inc. 2021
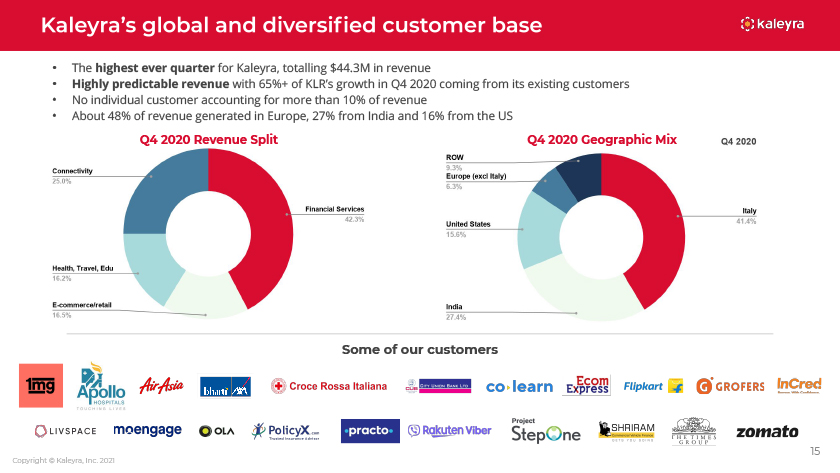
The highest ever quarter for Ka eyra, tota ing $44.3M in revenue High y predictab e revenue with 65% of K R’s growth in Q4 2020 coming from its existing customers No individua customer accounting for more than 10% of revenue About 48% of revenue generated in Europe, 27% from India and 16% from the US Q4 2020 Revenue Sp it Q4 2020 Geographic Mix Some of our customers Copyright © Ka eyra, Inc. 2021

FINANCIA OVERVIEW
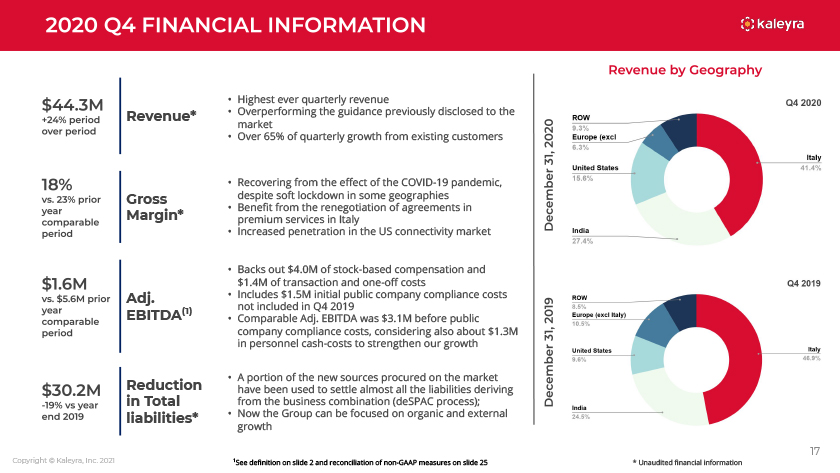
Revenue* Gross Margin* Adj. EBITDA(1) Reduction in Tota iabi ities* Highest ever quarter y revenue Overperforming the guidance previous y disc osed to the market Over 65% of quarter y growth from existing customers Recovering from the effect of the COVID-19 pandemic, despite soft ockdown in some geographies Benefit from the renegotiation of agreements in premium services in Ita y Increased penetration in the US connectivity market Backs out $4.0M of stock-based compensation and $1.4M of transaction and one-off costs Inc udes $1.5M initia pub ic company comp iance costs not inc uded in Q4 2019 Comparab e Adj. EBITDA was $3.1M before pub ic company comp iance costs, considering a so about $1.3M in personne cash-costs to strengthen our growth A portion of the new sources procured on the market have been used to sett e a most a the iabi ities deriving from the business combination (deSPAC process); Now the Group can be focused on organic and externa growth 17 * Unaudited financia information Copyright © Ka eyra, Inc. 2021 1See definition on s ide 2 and reconci iation of non-GAAP measures on s ide 25

Revenue* Gross Margin* Adj. EBITDA(1) Reduction in Tota iabi ities* Overperforming the guidance previous y disc osed to the market Over 80% of annua growth from existing customers Addition of a arge new enterprise customer Strong and consistent annua revenue growth Recovering from the effect of the COVID-19 pandemic Benefit from the renegotiation of agreements in premium services in Ita y Increased penetration in the US connectivity market Backs out $20.3M of stock-based compensation and others and $6.5M of transaction and one-off costs Inc udes $4.3M initia pub ic company comp iance costs not inc uded in YE 2019 Comparab e Adj. EBITDA was $7.5M before pub ic costs, considering a so about $6.3M in personne cash-costs to strengthen our growth A portion of the new sources procured on the market have been used to sett e a most a the iabi ities deriving from the business combination (deSPAC process); Now the Group can be focused on organic and externa growth 18 * Unaudited financia information Copyright © Ka eyra, Inc. 2021 1See definition on s ide 2 and reconci iation of non-GAAP measures on s ide 25
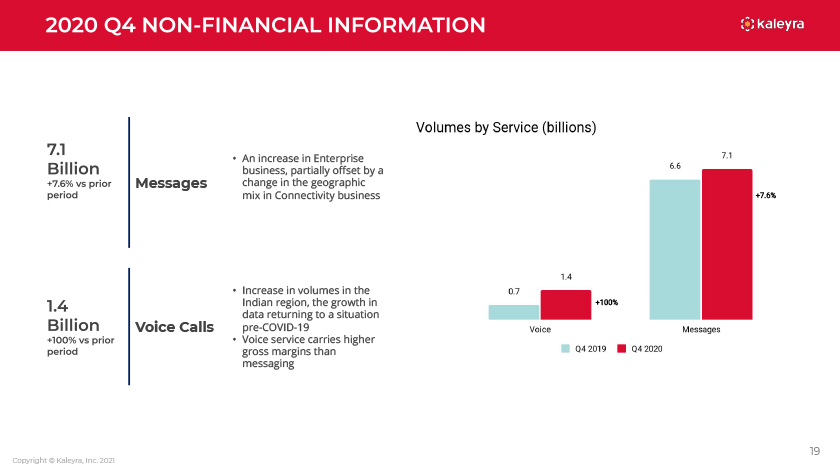
Messages Voice Ca s An increase in Enterprise business, partia y offset by a change in the geographic mix in Connectivity business Increase in vo umes in the Indian region, the growth in data returning to a situation pre-COVID-19 Voice service carries higher gross margins than messaging 7.6% 100% Copyright © Ka eyra, Inc. 2021
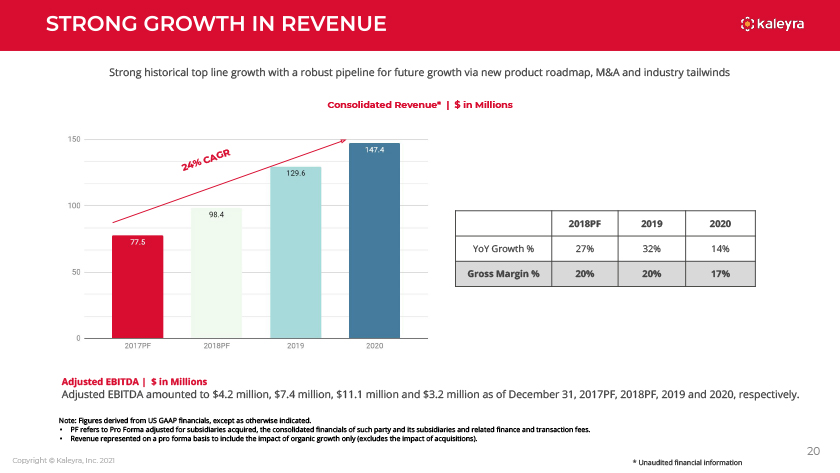
Strong historica top ine growth with a robust pipe ine for future growth via new product roadmap, M&A and industry tai winds Conso idated Revenue* | $ in Mi ions AGR % C 24 2018PF 2019 2020 YoY Growth % 27% 32% 14% Gross Margin % 20% 20% 17% Adjusted EBITDA | $ in Mi ions Adjusted EBITDA amounted to $4.2 mi ion, $7.4 mi ion, $11.1 mi ion and $3.2 mi ion as of December 31, 2017PF, 2018PF, 2019 and 2020, respective y. Note: Figures derived from US GAAP financia s, except as otherwise indicated. PF refers to Pro Forma adjusted for subsidiaries acquired, the conso idated financia s of such party and its subsidiaries and re ated finance and transaction fees. Revenue represented on a pro forma basis to inc ude the impact of organic growth on y (exc udes the impact of acquisitions). 20 Copyright © Ka eyra, Inc. 2021 * Unaudited financia information
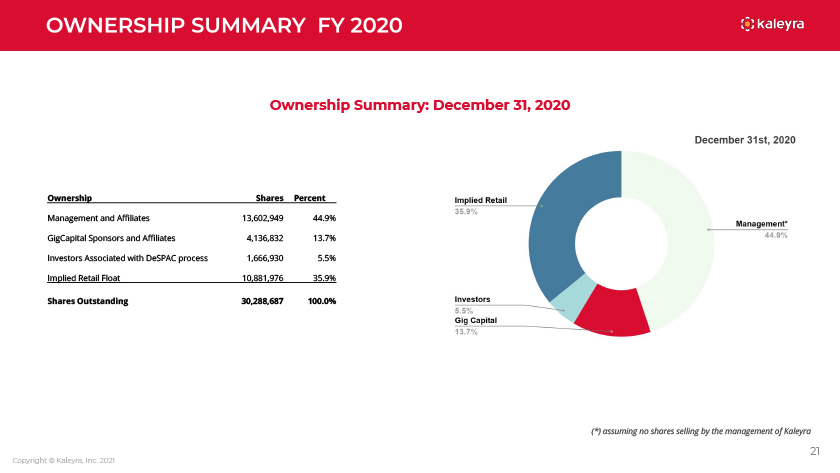
Ownership Summary: December 31, 2020 Ownership Shares Percent Management and Affi iates 13,602,949 44.9% GigCapita Sponsors and Affi iates 4,136,832 13.7% Investors Associated with DeSPAC process 1,666,930 5.5% Imp ied Retai F oat 10,881,976 35.9% Shares Outstanding 30,288,687 100.0% (*) assuming no shares se ing by the management of Ka eyra Copyright © Ka eyra, Inc. 2021
APPENDIX
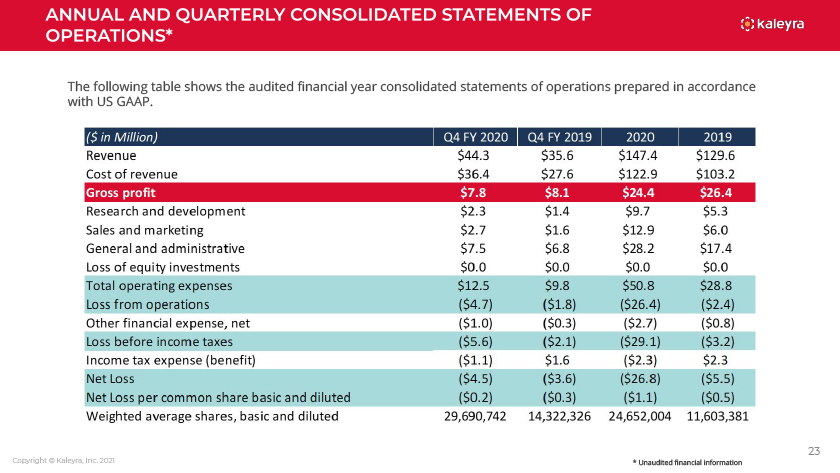
ANNUA AND QUARTER Y CONSO IDATED STATEMENTS OF OPERATIONS* The fo owing tab e shows the audited financia year conso idated statements of operations prepared in accordance with US GAAP. ($in Mi ion) Q4 FY 2020 Q4 FY 2019 2020 2019 Revenue $44.3 $35.6 $147.4 $129.6 Cost of revenue $36.4 $27.6 $122.9 $103.2 Gross profit $7.8 $8.1 $24.4 $26.4 Research and deve opment $2.3 $1.4 $9.7 $5.3 Sa es and marketing $2.7 $1.6 $12.9 $6.0 Genera and administrative $7.5 $6.8 $28.2 $17.4 oss of equity investments $0.0 $0.0 $0.0 $0.0 Tota operating expenses $12.5 $9.8 $50.8 $28.8 oss from operations ($4.7) ($1.8) ($26.4) ($2.4) Otherfinanda expens net ($1.0) ($0.3) ($2.7) ($0.8) oss before income taxes ($5.6) ($2.1) ($29.1) ($3.2) Income tax expense (benefit) ($1.1) $1.6 ($2.3) $2.3 Net oss ($4.5) ($3.6) ($26.8) ($5.5) Net oss per common share basic and di uted ($0.2) ($0.3) ($1.1) ($0.5) Weighted average shares, basic and di uted 29,690J42 14,322,326 24,652,004 11,603,381 Copyright © Ka eyra, Inc. 2021 * Unaudited financia information
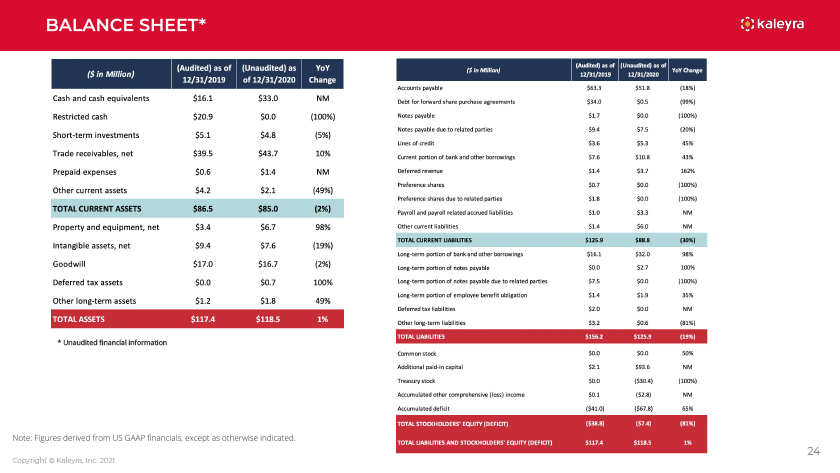
BA ANCE SHEET* ($in Mi ion) Cash and cash equiva ents $16.1 $33.0 NM Restricted cash $20.9 $0.0 {100%) Short-term investments $5.1 $4.8 (5%) Trade receivab es, net $39.5 $43.7 10% Prepaid expenses $0.6 $1.4 NM Other current assets $4.2 $2.1 (49%) TOTA CURRENT ASSETS $86.5 $85.0 (2%) Property and equipment, net $3.4 $6.7 98% Intangib e assets, net $9.4 $7.6 {19%) Goodwi $17.0 $16.7 {2%) Deferred tax asset s $0.0 $0.7 100% Other ong-term assets $1.2 $1.8 49% TOTA ASSETS $117.4 $118.5 1% * Unaudited financia information ($in Mi ion) Accounts payab e $63.3 $51.8 (18%) Debt for forward share purchase agreements $34.0 $0.5 (99%) Notes payab e $1.7 $0.0 (100%) Notes payab e due to re ated parties $9.4 $7.5 (20%) ines of credit $3.6 $5.3 45% Current portion of bank and other borrowings $7.6 $10.8 43% Deferred revenue $1.4 $3.7 162% Preference shares $0.7 $0.0 (100%) Preference shares due to re ated parties $1.8 $0.0 (100%) Payro and payro re ated accrued iabi ities $1.0 $3.3 NM Other current iabi ities $1.4 $6.0 NM TOTA CURRENT IABI ITIES $125.9 $88.8 (311%) ong-term portion of bank and other borrowings $16.1 $32.0 98% ong-term portion of notes payab e $0.0 $2.7 100% ong-term portion of notes payab e due to re ated parties $7.5 $0.0 (100%) ong-term portion of emp oyee benefit ob igation $1.4 $1.9 35% Deferred tax iabi ities $2.0 $0.0 NM Other ong-term iabi ities $3.2 $0.6 (81%) TOTA IABI ITIES $156.2 $125.9 (19%) Common stock $0.0 $0.0 50% Additiona paid-in capita $2.1 $93.6 NM Trea sury stock $0.0 ($30.4) (100%) Accumu ated other comprehensive ( oss) income $0.1 ($2.8) NM Accumu ated deficit ($41.0) ($67.8) 65% TOTA STOCKHO DERS’ EQUITY (DEFICIT) ($38.8) ($7.4) (81%) TOTA IABI ITIES AND STOCKHO DERS’ EQUITY (DEFICIT) $117.4 $118.5 1% Note: Figures derived from US GMP financia s, except as otherwise indicated. Copyright © Ka eyra, Inc. 2021
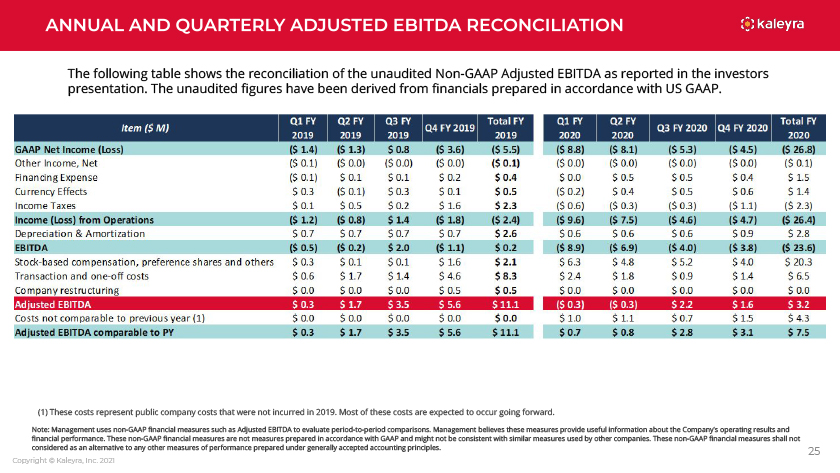
The fo owing tab e shows the reconci iation of the unaudited Non-GAAP Adjusted EBITDA as reported in the investors presentation. The unaudited figures have been derived from financia s prepared in accordance with US GAAP. (1) These costs represent pub ic company costs that were not incurred in 2019. Most of these costs are expected to occur going forward. Note: Management uses non-GAAP financia measures such as Adjusted EBITDA to eva uate period-to-period comparisons. Management be ieves these measures provide usefu information about the Company’s operating resu ts and financia performance. These non-GAAP financia measures are not measures prepared in accordance with GAAP and might not be consistent with simi ar measures used by other companies. These non-GAAP financia measures sha not considered as an a ternative to any other measures of performance prepared under genera y accepted accounting princip es. Copyright © Ka eyra, Inc. 2021
Thank You For further detai s, scan this QR code: investors@ka eyra.com Copyright © Ka eyra, Inc. 2021