Attached files
| file | filename |
|---|---|
| EX-99.3 - EX-99.3 - ECOLAB INC. | ecl-20210216xex99d3.htm |
| EX-99.1 - EX-99.1 - ECOLAB INC. | ecl-20210216xex99d1.htm |
| 8-K - 8-K - ECOLAB INC. | ecl-20210216x8k.htm |
Exhibit 99.2
| Please see Ecolab’s news release dated February 16, 2021 for additional information, including discussion on the use of certain non-GAAP financial measures. Fourth Quarter 2020 Teleconference Supplemental Data |
| Please see Ecolab’s news release dated February 16, 2021 for additional information, including discussion on the use of certain non-GAAP financial measures. . Cautionary Statement 2 Forward-Looking Information This communication contains forward looking statements as that term is defined in the Private Securities Litigation Reform Act of 1995. These forward-looking statements include, but are not limited to, statements regarding our financial and business performance and prospects, including the impact of the COVID-19 pandemic on our sales, operating results and cash flows, growth opportunities, investments in technologies, restructuring costs and savings, and forecasted financial and business results, including sales and earnings. These statements are based on the current expectations of management. There are a number of risks and uncertainties that could cause actual results to differ materially from the forward-looking statements. In particular, with respect to the pandemic, numerous factors will determine the extent of the impact on our business, including the severity of the disease, the duration of the outbreak, the distribution and efficacy of vaccines, the likelihood of a resurgence of the outbreak, actions that may be taken by governmental authorities intended to minimize the spread of the pandemic or to stimulate the economy and other unintended consequences. Additional risks and uncertainties are set forth under Item 1A of our Form 10-Q for the quarterly period ended September 30, 2020, and our other public filings with the SEC and include the effects and duration of the COVID-19 pandemic; the vitality of the markets we serve; the impact of economic factors such as the worldwide economy; our ability to execute key business initiatives; potential information technology infrastructure failures or breaches in data security; our ability to attract, retain and develop high caliber management talent to lead our business; our ability to innovate and to commercialize digital solutions; exposure to global economic, political and legal risks; difficulty in procuring raw materials or fluctuations in raw material costs; and other uncertainties or risks reported from time to time in our reports to the SEC. In light of these risks, uncertainties and factors, the forward-looking events discussed in this communication may not occur. We caution that undue reliance should not be placed on forward-looking statements, which speak only as of the date made. Ecolab does not undertake, and expressly disclaims, any duty to update any forward-looking statement, except as required by law. Non-GAAP Financial Information This communication includes Company information that does not conform to generally accepted accounting principles (GAAP). Management believes that a presentation of this information is meaningful to investors because it provides insight with respect to ongoing operating results of the Company and allows investors to better evaluate the financial results of the Company. These measures should not be viewed as an alternative to GAAP measures of performance. Furthermore, these measures may not be consistent with similar measures provided by other companies. Reconciliations of our non-GAAP measures included within this presentation are included in the “Non-GAAP Financial Measures” section of this presentation. |
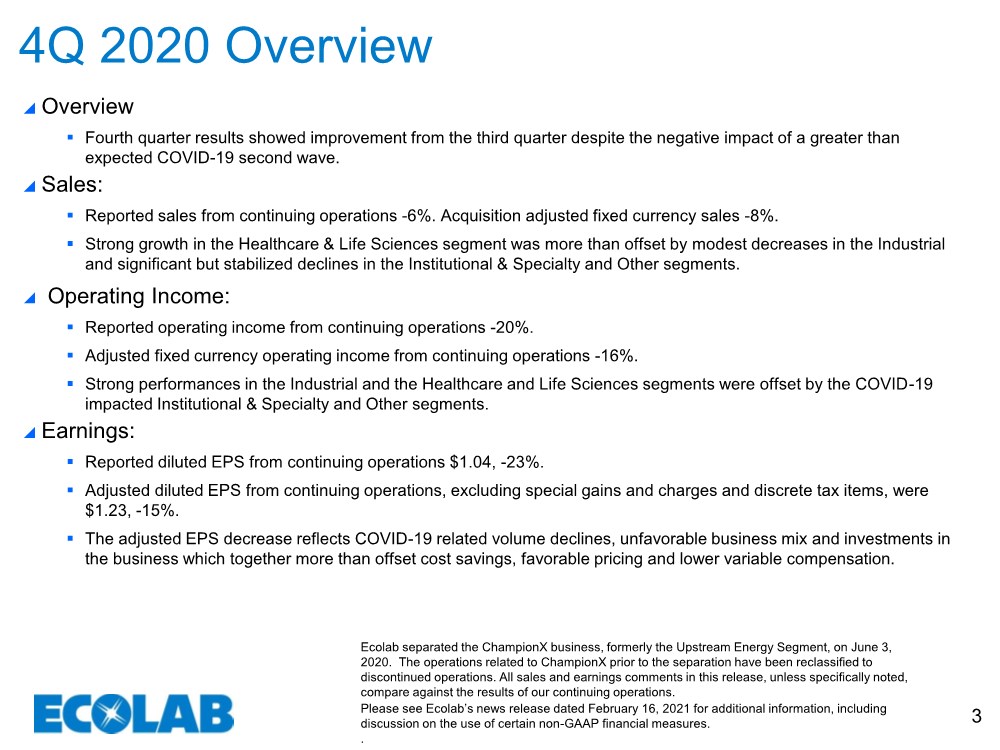
| Please see Ecolab’s news release dated February 16, 2021 for additional information, including discussion on the use of certain non-GAAP financial measures. . 3 Overview ▪ Fourth quarter results showed improvement from the third quarter despite the negative impact of a greater than expected COVID-19 second wave. Sales: ▪ Reported sales from continuing operations -6%. Acquisition adjusted fixed currency sales -8%. ▪ Strong growth in the Healthcare & Life Sciences segment was more than offset by modest decreases in the Industrial and significant but stabilized declines in the Institutional & Specialty and Other segments. Operating Income: ▪ Reported operating income from continuing operations -20%. ▪ Adjusted fixed currency operating income from continuing operations -16%. ▪ Strong performances in the Industrial and the Healthcare and Life Sciences segments were offset by the COVID-19 impacted Institutional & Specialty and Other segments. Earnings: ▪ Reported diluted EPS from continuing operations $1.04, -23%. ▪ Adjusted diluted EPS from continuing operations, excluding special gains and charges and discrete tax items, were $1.23, -15%. ▪ The adjusted EPS decrease reflects COVID-19 related volume declines, unfavorable business mix and investments in the business which together more than offset cost savings, favorable pricing and lower variable compensation. 4Q 2020 Overview Ecolab separated the ChampionX business, formerly the Upstream Energy Segment, on June 3, 2020. The operations related to ChampionX prior to the separation have been reclassified to discontinued operations. All sales and earnings comments in this release, unless specifically noted, compare against the results of our continuing operations. |
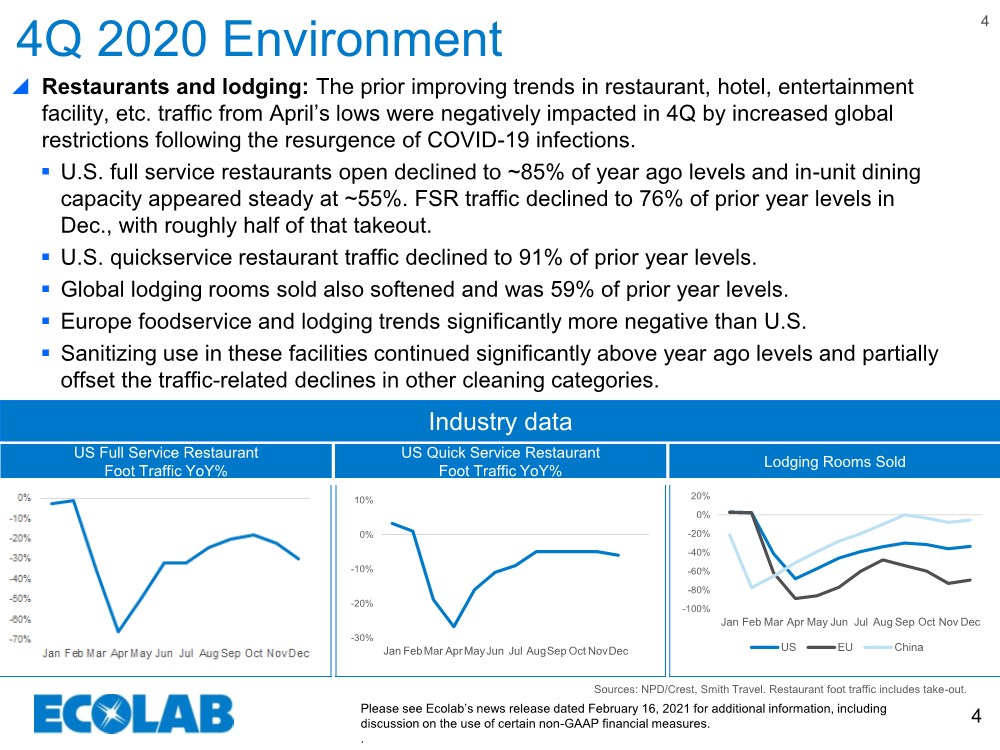
| Please see Ecolab’s news release dated February 16, 2021 for additional information, including discussion on the use of certain non-GAAP financial measures. . 4 Restaurants and lodging: The prior improving trends in restaurant, hotel, entertainment facility, etc. traffic from April’s lows were negatively impacted in 4Q by increased global restrictions following the resurgence of COVID-19 infections. ▪ U.S. full service restaurants open declined to ~85% of year ago levels and in-unit dining capacity appeared steady at ~55%. FSR traffic declined to 76% of prior year levels in Dec., with roughly half of that takeout. ▪ U.S. quickservice restaurant traffic declined to 91% of prior year levels. ▪ Global lodging rooms sold also softened and was 59% of prior year levels. ▪ Europe foodservice and lodging trends significantly more negative than U.S. ▪ Sanitizing use in these facilities continued significantly above year ago levels and partially offset the traffic-related declines in other cleaning categories. Sources: NPD/Crest, Smith Travel. Restaurant foot traffic includes take-out. US Full Service Restaurant Foot Traffic YoY% Industry data US Quick Service Restaurant Foot Traffic YoY% Lodging Rooms Sold -30% -20% -10% 0% 10% Jan FebMar AprMayJun Jul AugSep Oct NovDec -100% -80% -60% -40% -20% 0% 20% Jan Feb Mar Apr May Jun Jul Aug Sep Oct Nov Dec US EU China 4Q 2020 Environment 4 |
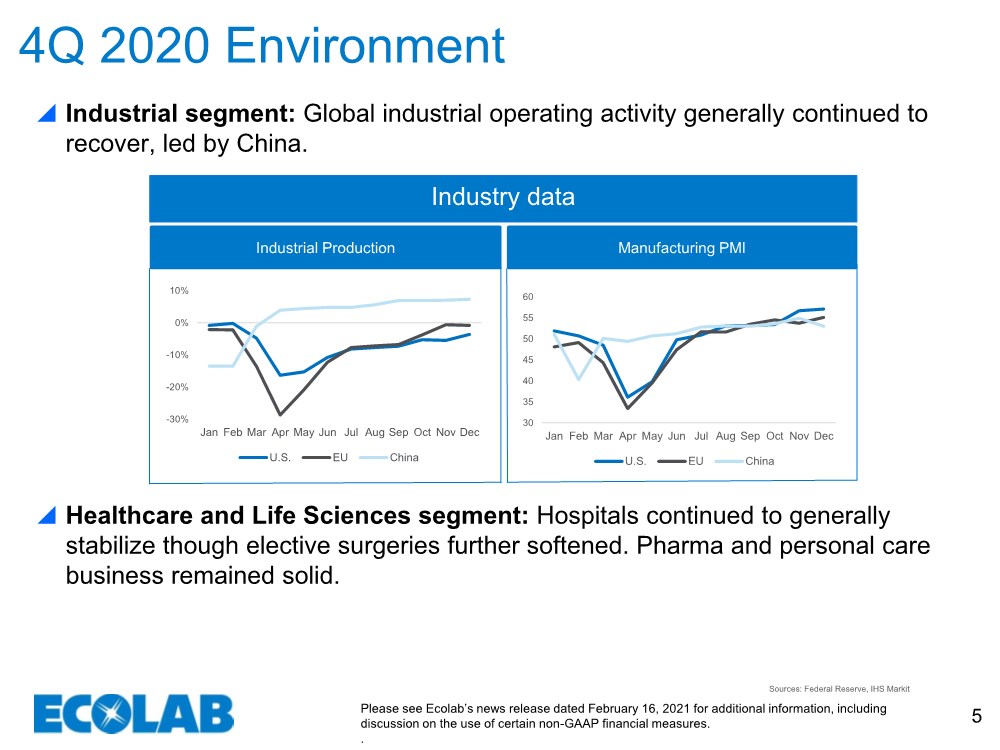
| Please see Ecolab’s news release dated February 16, 2021 for additional information, including discussion on the use of certain non-GAAP financial measures. . 5 4Q 2020 Environment Sources: Federal Reserve, IHS Markit Industrial segment: Global industrial operating activity generally continued to recover, led by China. Healthcare and Life Sciences segment: Hospitals continued to generally stabilize though elective surgeries further softened. Pharma and personal care business remained solid. Industrial Production Industry data Manufacturing PMI 30 35 40 45 50 55 60 Jan Feb Mar Apr May Jun Jul Aug Sep Oct Nov Dec U.S. EU China -30% -20% -10% 0% 10% Jan Feb Mar Apr May Jun Jul Aug Sep Oct Nov Dec U.S. EU China |
| Please see Ecolab’s news release dated February 16, 2021 for additional information, including discussion on the use of certain non-GAAP financial measures. . 6 2021 Comment The continued uncertain outlook regarding the timing and pace of global economic recovery from COVID-19’s impact does not yet present an adequate basis for us to provide either quarterly or annual earnings forecasts. We expect full year 2021 Healthcare & Life Sciences segment sales to moderately improve over the prior year’s very strong gain, with good year-on-year sales growth from our Industrial and Other segments. We look for our Institutional & Specialty segment to show a significant year-on-year increase for the full year as it recovers toward its pre-COVID peak 2019 levels. We believe COVID-19 will remain a critical economic factor throughout 2021, particularly in the early part of the year. We believe the beginning of the recovery in our global end markets will start in the second quarter with the broader expansion of the vaccine distribution, and we expect it will take until the end of the year to generally reach a new normal. However, we believe that our strengthened business will deliver full year 2021 earnings above 2019 results from continuing operations, with the first quarter year-on-year percentage decline showing modest sequential improvement from the fourth quarter and the remaining quarters of 2021 showing strong year-on-year growth. We remain focused on capitalizing on our opportunities and once again delivering superior results for our customers and shareholders in 2021 and beyond. |
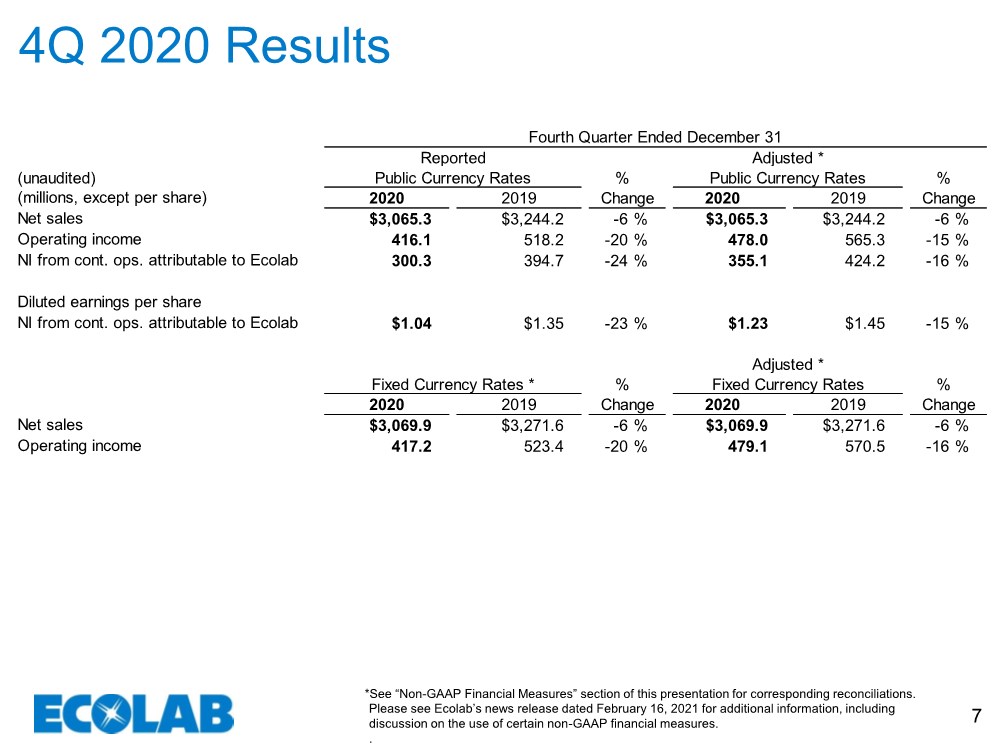
| Please see Ecolab’s news release dated February 16, 2021 for additional information, including discussion on the use of certain non-GAAP financial measures. . 7 4Q 2020 Results *See “Non-GAAP Financial Measures” section of this presentation for corresponding reconciliations. (unaudited) (millions, except per share) 2020 Net sales $3,065.3 $3,244.2 -6 % $3,065.3 $3,244.2 -6 % Operating income 416.1 518.2 -20 % 478.0 565.3 -15 % NI from cont. ops. attributable to Ecolab 300.3 394.7 -24 % 355.1 424.2 -16 % Diluted earnings per share NI from cont. ops. attributable to Ecolab $1.04 $1.35 -23 % $1.23 $1.45 -15 % 2020 Net sales $3,069.9 $3,271.6 -6 % $3,069.9 $3,271.6 -6 % Operating income 417.2 523.4 -20 % 479.1 570.5 -16 % Adjusted * Fourth Quarter Ended December 31 Reported Adjusted * Public Currency Rates % Public Currency Rates % 2020 2019 Change 2019 Change Fixed Currency Rates * % Fixed Currency Rates % 2020 2019 Change 2019 Change |
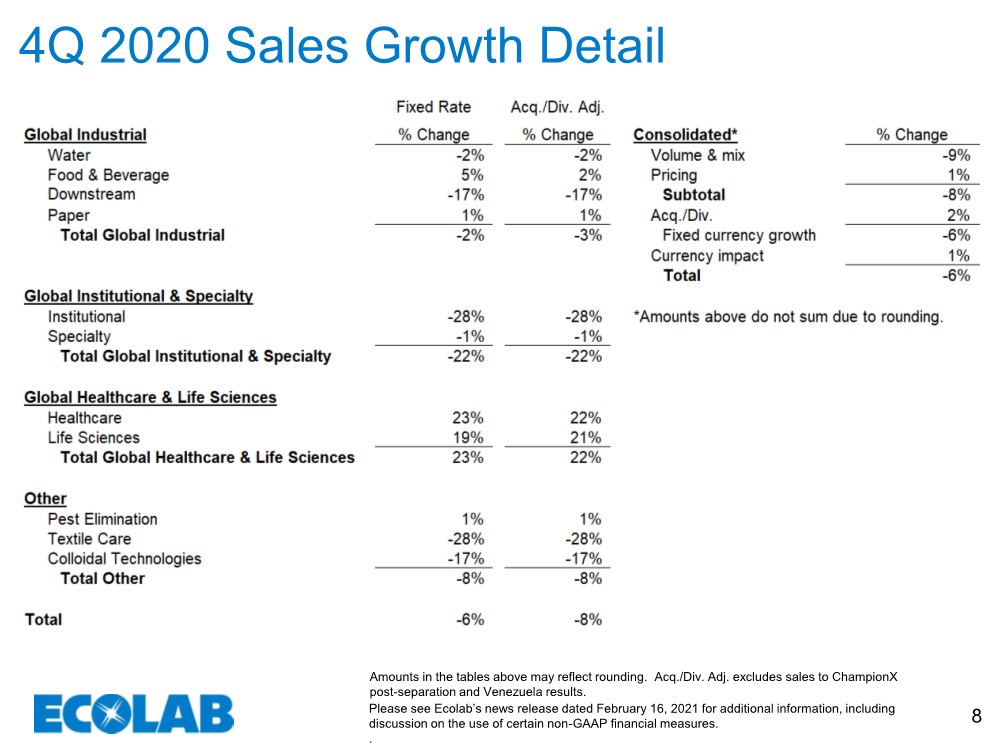
| Please see Ecolab’s news release dated February 16, 2021 for additional information, including discussion on the use of certain non-GAAP financial measures. . 8 4Q 2020 Sales Growth Detail Amounts in the tables above may reflect rounding. Acq./Div. Adj. excludes sales to ChampionX post-separation and Venezuela results. |
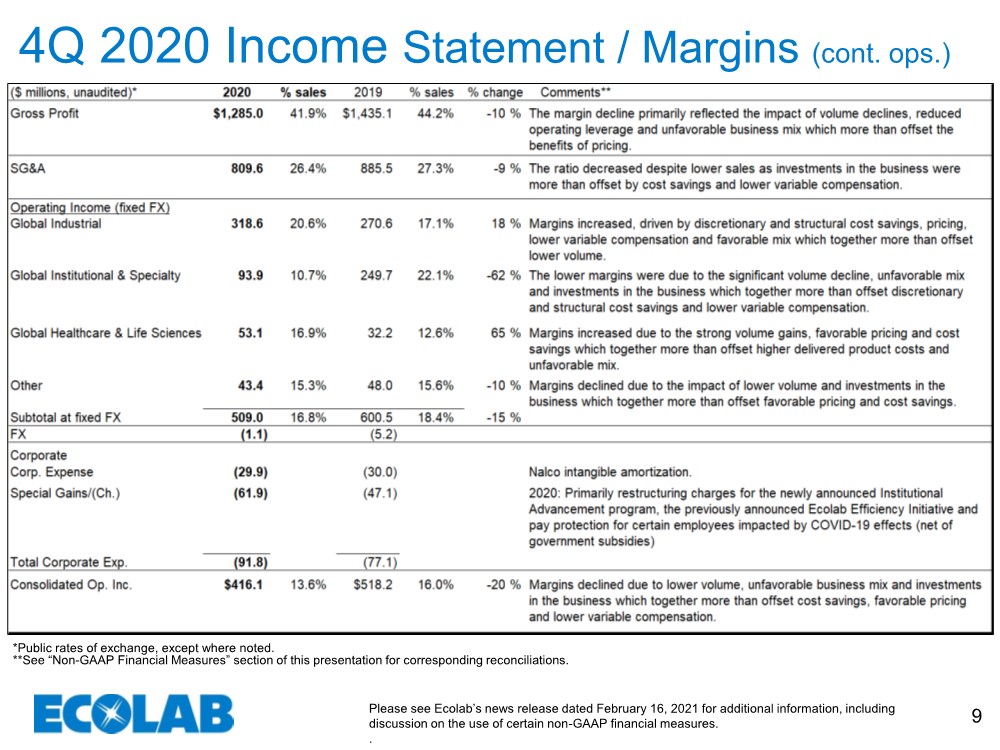
| Please see Ecolab’s news release dated February 16, 2021 for additional information, including discussion on the use of certain non-GAAP financial measures. . 9 4Q 2020 Income Statement / Margins (cont. ops.) *Public rates of exchange, except where noted. **See “Non-GAAP Financial Measures” section of this presentation for corresponding reconciliations. |
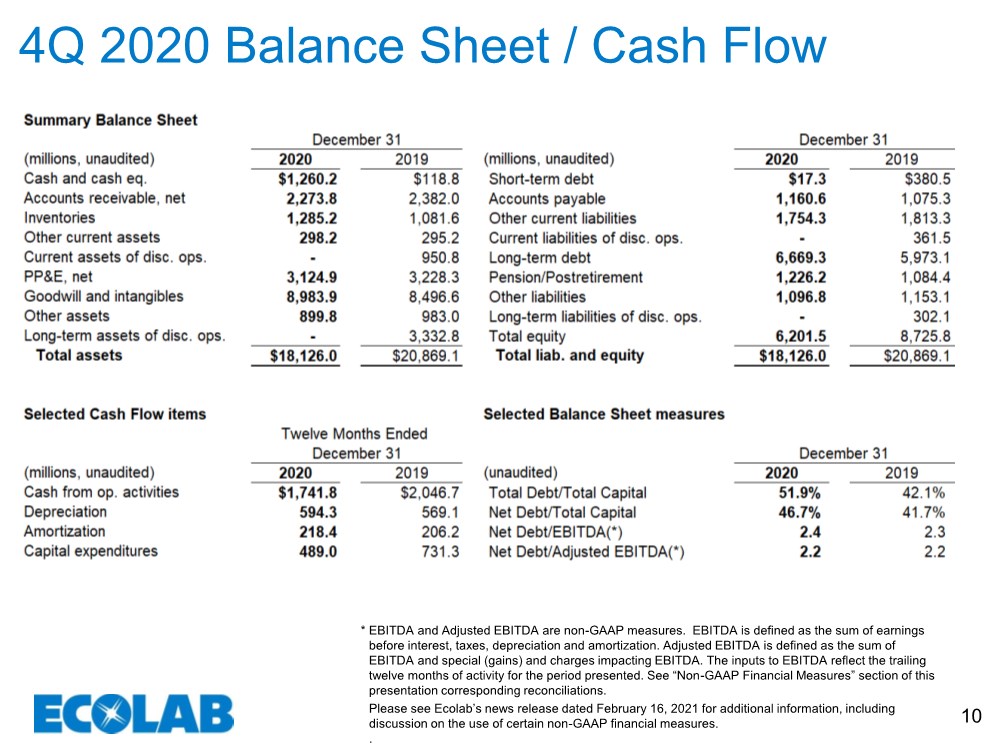
| Please see Ecolab’s news release dated February 16, 2021 for additional information, including discussion on the use of certain non-GAAP financial measures. . 10 4Q 2020 Balance Sheet / Cash Flow EBITDA and Adjusted EBITDA are non-GAAP measures. EBITDA is defined as the sum of earnings before interest, taxes, depreciation and amortization. Adjusted EBITDA is defined as the sum of EBITDA and special (gains) and charges impacting EBITDA. The inputs to EBITDA reflect the trailing twelve months of activity for the period presented. See “Non-GAAP Financial Measures” section of this presentation corresponding reconciliations. * |
| Please see Ecolab’s news release dated February 16, 2021 for additional information, including discussion on the use of certain non-GAAP financial measures. . 11 Appendix |
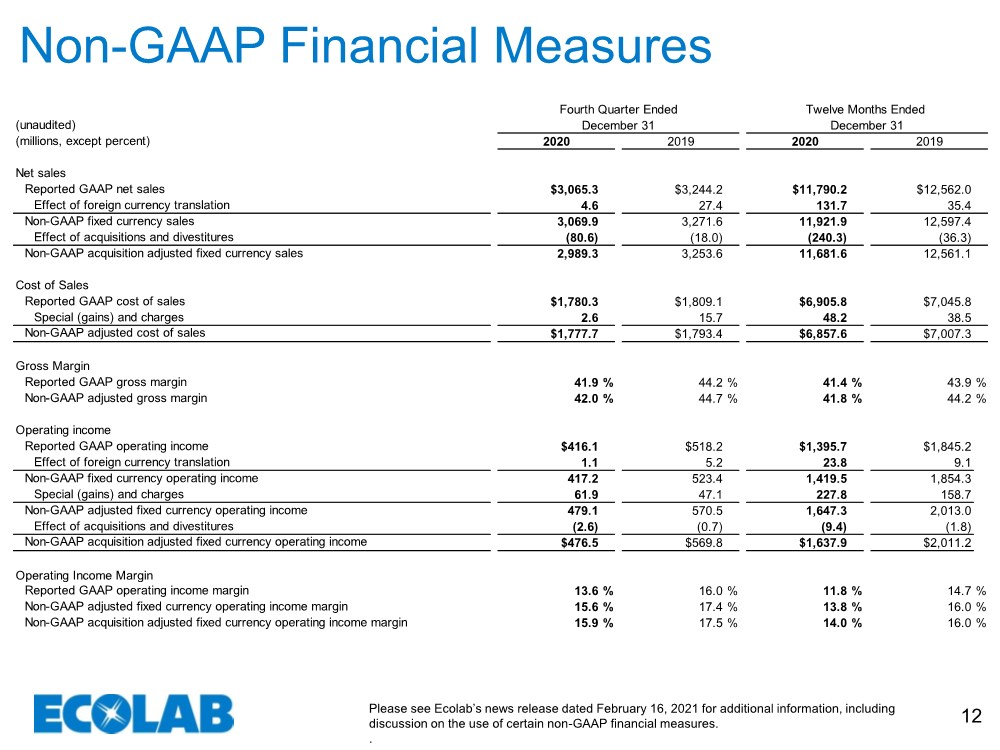
| Please see Ecolab’s news release dated February 16, 2021 for additional information, including discussion on the use of certain non-GAAP financial measures. . 12 Non-GAAP Financial Measures (unaudited) (millions, except percent) Net sales Reported GAAP net sales $3,065.3 $3,244.2 $11,790.2 $12,562.0 Effect of foreign currency translation 4.6 27.4 131.7 35.4 Non-GAAP fixed currency sales 3,069.9 3,271.6 11,921.9 12,597.4 Effect of acquisitions and divestitures (80.6) (18.0) (240.3) (36.3) Non-GAAP acquisition adjusted fixed currency sales 2,989.3 3,253.6 11,681.6 12,561.1 Cost of Sales Reported GAAP cost of sales $1,780.3 $1,809.1 $6,905.8 $7,045.8 Special (gains) and charges 2.6 15.7 48.2 38.5 Non-GAAP adjusted cost of sales $1,777.7 $1,793.4 $6,857.6 $7,007.3 Gross Margin Reported GAAP gross margin 41.9 % 44.2 % 41.4 % 43.9 % Non-GAAP adjusted gross margin 42.0 % 44.7 % 41.8 % 44.2 % Operating income Reported GAAP operating income $416.1 $518.2 $1,395.7 $1,845.2 Effect of foreign currency translation 1.1 5.2 23.8 9.1 Non-GAAP fixed currency operating income 417.2 523.4 1,419.5 1,854.3 Special (gains) and charges 61.9 47.1 227.8 158.7 Non-GAAP adjusted fixed currency operating income 479.1 570.5 1,647.3 2,013.0 Effect of acquisitions and divestitures (2.6) (0.7) (9.4) (1.8) Non-GAAP acquisition adjusted fixed currency operating income $476.5 $569.8 $1,637.9 $2,011.2 Operating Income Margin Reported GAAP operating income margin 13.6 % 16.0 % 11.8 % 14.7 % Non-GAAP adjusted fixed currency operating income margin 15.6 % 17.4 % 13.8 % 16.0 % Non-GAAP acquisition adjusted fixed currency operating income margin 15.9 % 17.5 % 14.0 % 16.0 % Fourth Quarter Ended December 31 Twelve Months Ended December 31 2020 2019 2020 2019 |
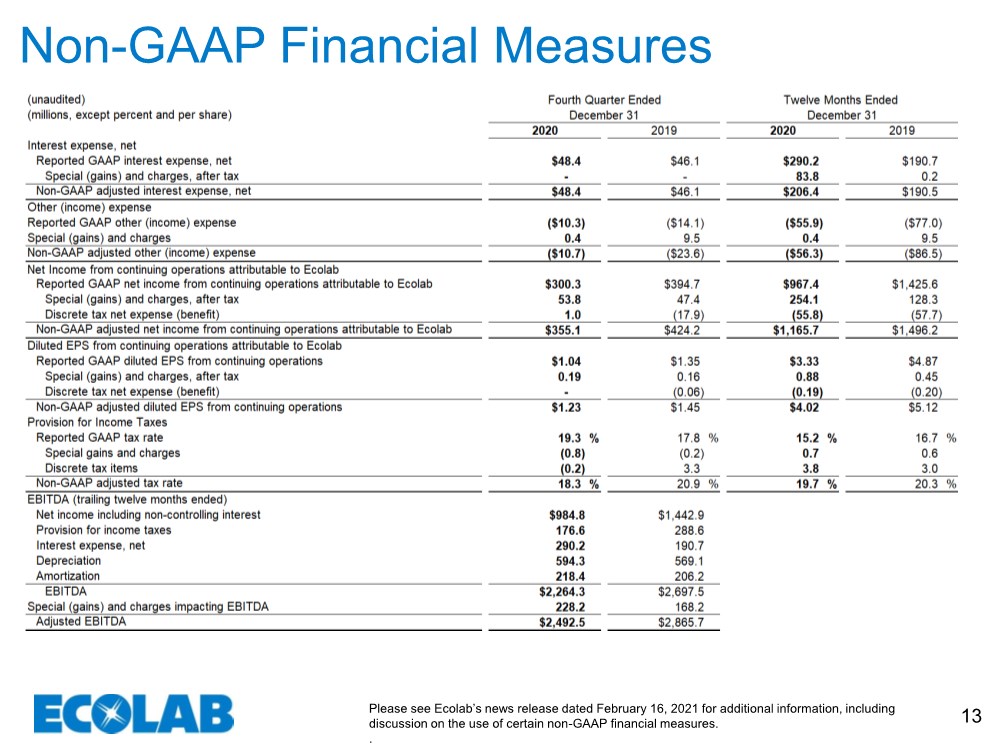
| Please see Ecolab’s news release dated February 16, 2021 for additional information, including discussion on the use of certain non-GAAP financial measures. . 13 Non-GAAP Financial Measures |
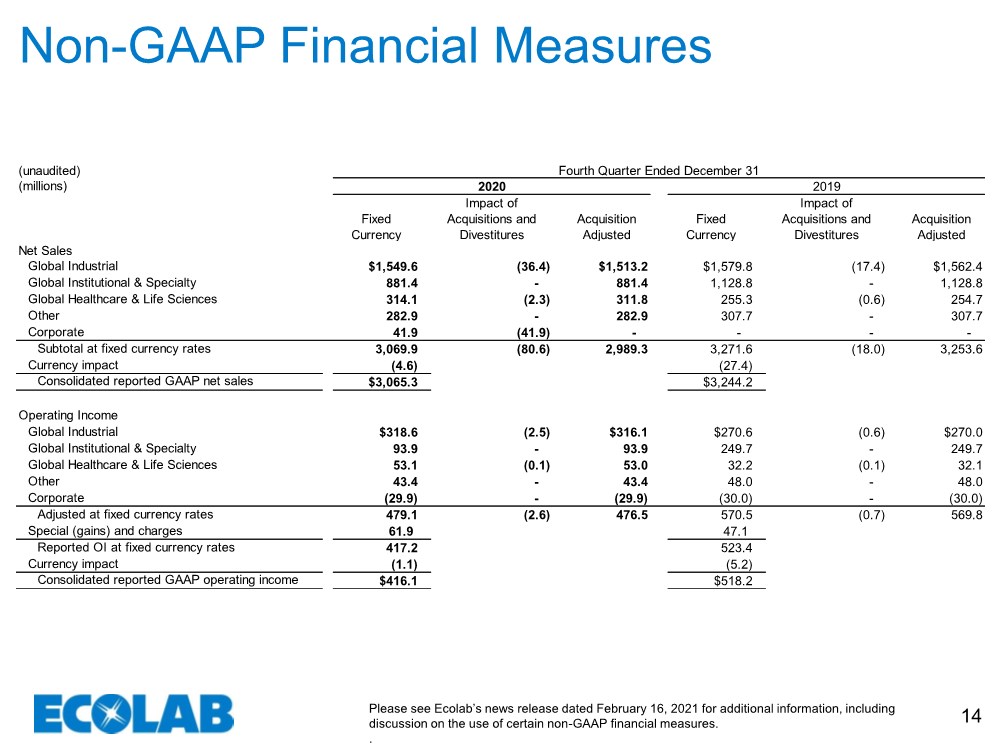
| Please see Ecolab’s news release dated February 16, 2021 for additional information, including discussion on the use of certain non-GAAP financial measures. . 14 Non-GAAP Financial Measures (unaudited) (millions) Fixed Currency Impact of Acquisitions and Divestitures Acquisition Adjusted Fixed Currency Impact of Acquisitions and Divestitures Acquisition Adjusted Net Sales Global Industrial $1,549.6 (36.4) $1,513.2 $1,579.8 (17.4) $1,562.4 Global Institutional & Specialty 881.4 - 881.4 1,128.8 - 1,128.8 Global Healthcare & Life Sciences 314.1 (2.3) 311.8 255.3 (0.6) 254.7 Other 282.9 - 282.9 307.7 - 307.7 Corporate 41.9 (41.9) - - - - Subtotal at fixed currency rates 3,069.9 (80.6) 2,989.3 3,271.6 (18.0) 3,253.6 Currency impact (4.6) (27.4) Consolidated reported GAAP net sales $3,065.3 $3,244.2 Operating Income Global Industrial $318.6 (2.5) $316.1 $270.6 (0.6) $270.0 Global Institutional & Specialty 93.9 - 93.9 249.7 - 249.7 Global Healthcare & Life Sciences 53.1 (0.1) 53.0 32.2 (0.1) 32.1 Other 43.4 - 43.4 48.0 - 48.0 Corporate (29.9) - (29.9) (30.0) - (30.0) Adjusted at fixed currency rates 479.1 (2.6) 476.5 570.5 (0.7) 569.8 Special (gains) and charges 61.9 47.1 Reported OI at fixed currency rates 417.2 523.4 Currency impact (1.1) (5.2) Consolidated reported GAAP operating income $416.1 $518.2 Fourth Quarter Ended December 31 2020 2019 |
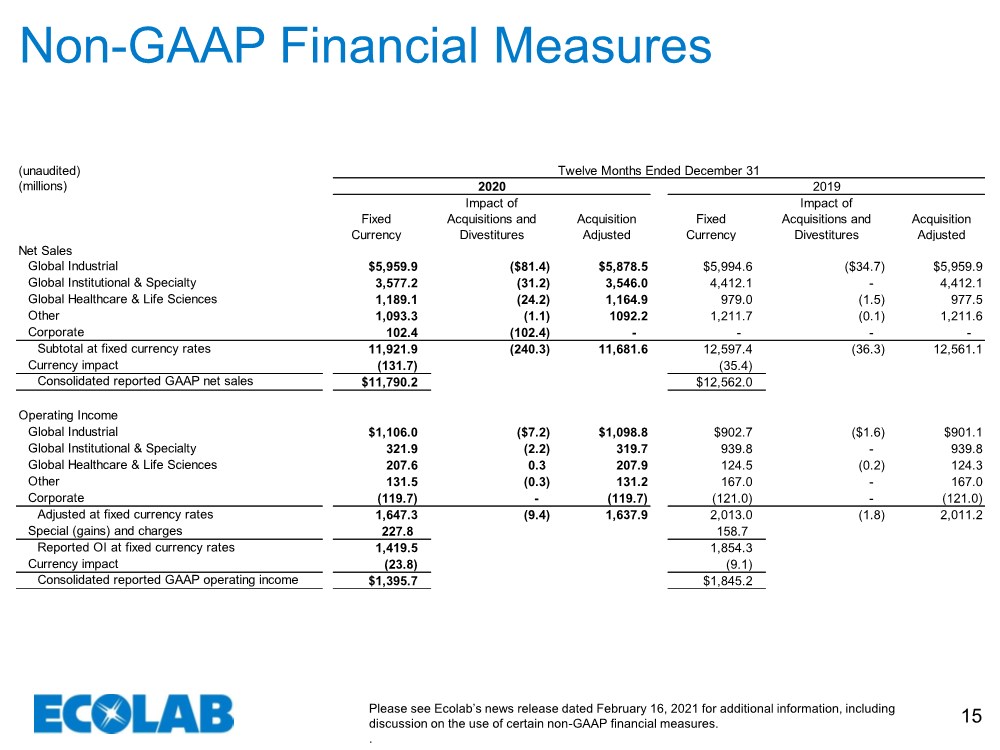
| Please see Ecolab’s news release dated February 16, 2021 for additional information, including discussion on the use of certain non-GAAP financial measures. . 15 Non-GAAP Financial Measures (unaudited) (millions) Fixed Currency Impact of Acquisitions and Divestitures Acquisition Adjusted Fixed Currency Impact of Acquisitions and Divestitures Acquisition Adjusted Net Sales Global Industrial $5,959.9 ($81.4) $5,878.5 $5,994.6 ($34.7) $5,959.9 Global Institutional & Specialty 3,577.2 (31.2) 3,546.0 4,412.1 - 4,412.1 Global Healthcare & Life Sciences 1,189.1 (24.2) 1,164.9 979.0 (1.5) 977.5 Other 1,093.3 (1.1) 1092.2 1,211.7 (0.1) 1,211.6 Corporate 102.4 (102.4) - - - - Subtotal at fixed currency rates 11,921.9 (240.3) 11,681.6 12,597.4 (36.3) 12,561.1 Currency impact (131.7) (35.4) Consolidated reported GAAP net sales $11,790.2 $12,562.0 Operating Income Global Industrial $1,106.0 ($7.2) $1,098.8 $902.7 ($1.6) $901.1 Global Institutional & Specialty 321.9 (2.2) 319.7 939.8 - 939.8 Global Healthcare & Life Sciences 207.6 0.3 207.9 124.5 (0.2) 124.3 Other 131.5 (0.3) 131.2 167.0 - 167.0 Corporate (119.7) - (119.7) (121.0) - (121.0) Adjusted at fixed currency rates 1,647.3 (9.4) 1,637.9 2,013.0 (1.8) 2,011.2 Special (gains) and charges 227.8 158.7 Reported OI at fixed currency rates 1,419.5 1,854.3 Currency impact (23.8) (9.1) Consolidated reported GAAP operating income $1,395.7 $1,845.2 Twelve Months Ended December 31 2020 2019 |