Attached files
| file | filename |
|---|---|
| EX-99.1 - EXHIBIT 99.1 - AECOM | tm216761d1_ex99-1.htm |
| 8-K - FORM 8-K - AECOM | tm216761d1_8k.htm |
Exhibit 99.2
February 2021 2021 AECOM Investor Day ARLINGTON MEMORIAL BRIDGE United States Washington D.C.'s historic Arlington Memorial Bridge reopened in December 2020 after a two - year rehabilitation. AECOM served as lead designer, delivering the project on - time and on - budget.

February 2021 Disclosures Forward - Looking Statements All statements in this communication other than statements of historical fact are “forward - looking statements” for purposes of f ederal and state securities laws, including any statements of the plans, strategies and objectives for future operations, profitability, strategic value creation, coronavirus impacts, risk profile and investment s tra tegies, any statements regarding future economic conditions or performance, and the expected financial and operational results of AECOM. Although we believe that the expectations reflected in our forward - looking statements are reasonable, actual results could differ materially from those projected or assumed in any of our forward - looking statements. Important factors that could cause our actual results, performanc e and achievements, or industry results to differ materially from estimates or projections contained in our forward - looking statements include, but are not limited to, the following: our business is cyclical and vulnerable to economic downturns and client spending reductions; impacts caused by the coronavirus and the related economic instability and market volatility, including the reaction of governments to the c oro navirus, including any prolonged period of travel, commercial or other similar restrictions, the delay in commencement, or temporary or permanent halting, of construction, infrastructure or other projects , r equirements that we remove our employees or personnel from the field for their protection, and delays or reductions in planned initiatives by our governmental or commercial clients or potential clients; l oss es under fixed - price contracts; limited control over operations run through our joint venture entities; liability for misconduct by our employees or consultants; failure to comply with laws or regulations applic abl e to our business; maintaining adequate surety and financial capacity; high leverage and potential inability to service our debt and guarantees; exposure to Brexit; exposure to political and economic risks in d iff erent countries; currency exchange rate fluctuations; retaining and recruiting key technical and management personnel; legal claims; inadequate insurance coverage; environmental law compliance and adequate nu cle ar indemnification; unexpected adjustments and cancellations related to our backlog; partners and third parties who may fail to satisfy their legal obligations; AECOM Capital real estate development pr oje cts; managing pension cost; cybersecurity issues, IT outages and data privacy; risks associated with the benefits and costs of the Management Services transaction, including the risk that the expected benefits of the Management Services transaction or any contingent purchase price will not be realized within the expected time frame, in full or at all; as well as other additional risks and factors that could cause ac tua l results to differ materially from our forward - looking statements set forth in our reports filed with the Securities and Exchange Commission. Any forward - looking statements are made as of the date hereof. We do not inte nd, and undertake no obligation, to update any forward - looking statement. Non - GAAP Financial Information This communication contains financial information calculated other than in accordance with U.S. generally accepted accounting pr inciples (“GAAP”). The Company believes that non - GAAP financial measures such as adjusted EPS, adjusted EBITDA, adjusted net/operating income, net service revenue and free cash flow provide a meanin gfu l perspective on its business results as the Company utilizes this information to evaluate and manage the business. We use adjusted EBITDA, adjusted EPS, adjusted net/operating income and adjusted tax rat e t o exclude the impact of non - operating items, such as amortization expense, taxes and non - core operating losses to aid investors in better understanding our core performance results. We use free cash flow to represent the cash generated after capital expenditures to maintain our business. We present constant currency information to help assess how our underlying businesses performed excluding the effec t o f foreign currency rate fluctuations to aid investors in better understanding our international operational performance. We present net service revenue to exclude subcontractor costs from revenue to provide inv estors with a better understanding of our operational performance. We present segment adjusted operating margin to reflect segment operating performance of our Americas and International segments, exclud ing AECOM Capital. Our non - GAAP disclosure has limitations as an analytical tool, should not be viewed as a substitute for financial information de termined in accordance with GAAP, and should not be considered in isolation or as a substitute for analysis of our results as reported under GAAP, nor is it necessarily comparable to non - GAAP performance measures that may be presented by other companies. A reconciliation of these non - GAAP measures is found in the Regulation G Information tables at the back of this communication. When we provide our long term projections for adjusted EPS and free cash flow on a forward - looking basis for fiscal year 2024, t he closest corresponding GAAP measure and a reconciliation of the differences between the non - GAAP expectation and the corresponding GAAP measure generally is not available without unreasonable effort due t o the length, high variability, complexity and low visibility associated with the non - GAAP expectation projected against the multi - year forecast which could significantly impact the GAAP measure. Page 2
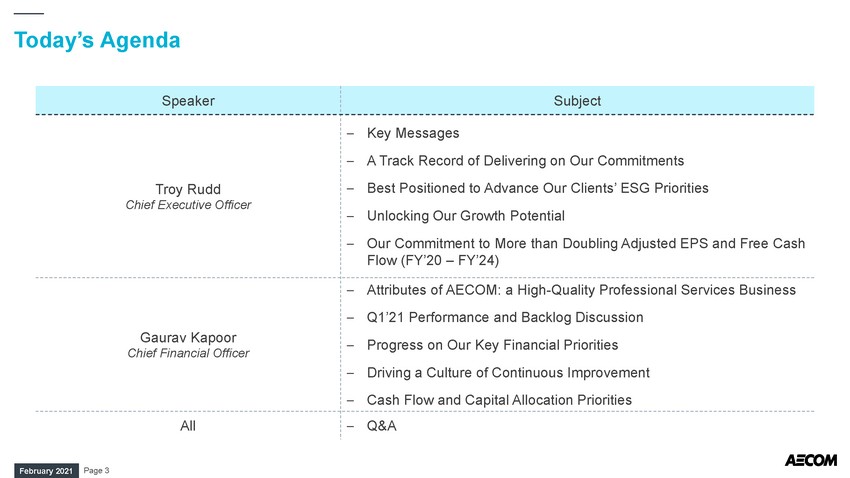
February 2021 Today’s Agenda Speaker Subject Troy Rudd Chief Executive Officer – Key Messages – A Track Record of Delivering on Our Commitments – Best Positioned to Advance Our Clients’ ESG Priorities – Unlocking Our Growth Potential – Our Commitment to More than Doubling Adjusted EPS and Free Cash Flow (FY’20 – FY’24) Gaurav Kapoor Chief Financial Officer – Attributes of AECOM: a High - Quality Professional Services Business – Q1’21 Performance and Backlog Discussion – Progress on Our Key Financial Priorities – Driving a Culture of Continuous Improvement – Cash Flow and Capital Allocation Priorities All – Q&A Page 3

February 2021 Troy Rudd Chief Executive Officer

February 2021 Key Messages for Investors Page 5 W E A RE A N I NDUSTRY - LEADING P ROFESSIONAL S ERVICES F IRM THAT D ELIVERS ON O UR F INANCIAL T ARGETS W E A RE THE L EADERS IN A DDRESSING O UR C LIENTS ’ C RITICAL ESG P RIORITIES AND I NFRASTRUCTURE I NVESTMENTS W E ARE R EADY TO D ELIVER ON O UR G ROWTH P OTENTIAL W E A RE C OMMITTING TO A CHIEVING I NDUSTRY - L EADING 15%+ S EGMENT A DJUSTED 1 O PERATING M ARGINS 2 BY FY’24 W E E XPECT TO M ORE THAN D OUBLE A DJUSTED 1 EPS AND F REE C ASH F LOW 3 FROM FY’20 – FY’24
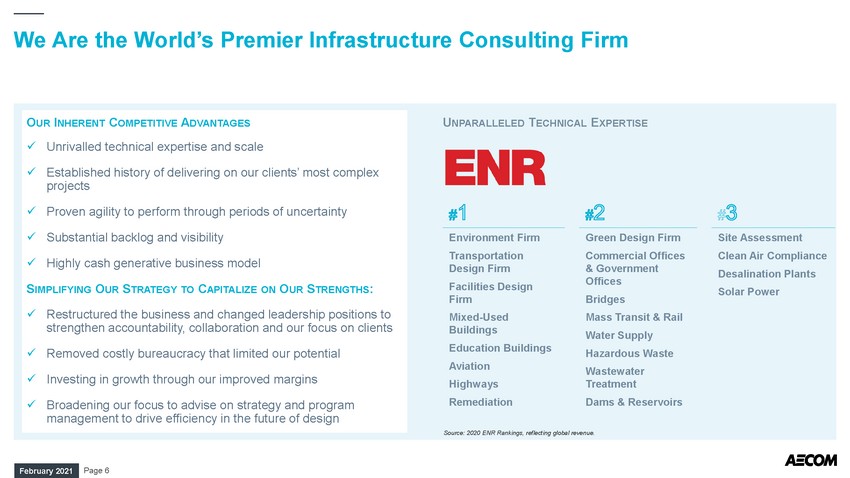
February 2021 We Are the World’s Premier Infrastructure Consulting Firm O UR I NHERENT C OMPETITIVE A DVANTAGES U NPARALLELED T ECHNICAL E XPERTISE Source: 2020 ENR Rankings, reflecting global revenue. Environment Firm Transportation Design Firm Facilities Design Firm Mixed - Used Buildings Education Buildings Aviation Highways Remediation Green Design Firm Commercial Offices & Government Offices Bridges Mass Transit & Rail Water Supply Hazardous Waste Wastewater Treatment Dams & Reservoirs Site Assessment Clean Air Compliance Desalination Plants Solar Power x Unrivalled technical expertise and scale x Established history of delivering on our clients’ most complex projects x Proven agility to perform through periods of uncertainty x Substantial backlog and visibility x Highly cash generative business model S IMPLIFYING O UR S TRATEGY TO C APITALIZE ON O UR S TRENGTHS : x Restructured the business and changed leadership positions to strengthen accountability, collaboration and our focus on clients x Removed costly bureaucracy that limited our potential x Investing in growth through our improved margins x Broadening our focus to advise on strategy and program management to drive efficiency in the future of design Page 6
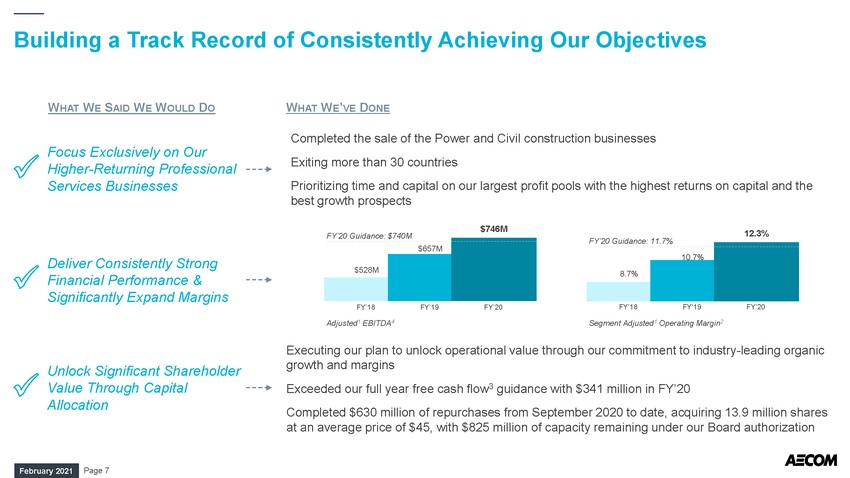
February 2021 Building a Track Record of Consistently Achieving Our Objectives Page 7 Focus Exclusively on Our Higher - Returning Professional Services Businesses Deliver Consistently Strong Financial Performance & Significantly Expand Margins Unlock Significant Shareholder Value Through Capital Allocation W HAT W E S AID W E W OULD D O W HAT W E ’ VE D ONE FY’19 FY’20 FY’18 $528 M $657 M $746 M FY’20 Guidance: $740M Adjusted 1 EBITDA 4 8.7% 10.7% 12.3% FY’19 FY’20 FY’18 FY’20 Guidance: 11.7% Segment Adjusted 1 Operating Margin 2 Completed the sale of the Power and Civil construction businesses Exiting more than 30 countries Prioritizing time and capital on our largest profit pools with the highest returns on capital and the best growth prospects Executing our plan to unlock operational value through our commitment to industry - leading organic growth and margins Exceeded our full year free cash flow 3 guidance with $341 million in FY’20 Completed $630 million of repurchases from September 2020 to date, acquiring 13.9 million shares at an average price of $45, with $825 million of capacity remaining under our Board authorization
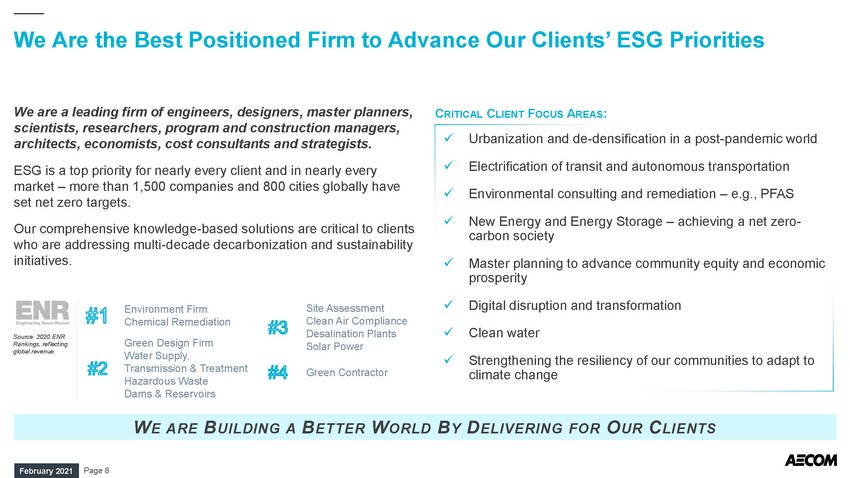
February 2021 We Are the Best Positioned Firm to Advance Our Clients’ ESG Priorities We are a leading firm of engineers, designers, master planners, scientists, researchers, program and construction managers, architects, economists, cost consultants and strategists. ESG is a top priority for nearly every client and in nearly every market – more than 1,500 companies and 800 cities globally have set net zero targets. Our comprehensive knowledge - based solutions are critical to clients who are addressing multi - decade decarbonization and sustainability initiatives. W E ARE B UILDING A B ETTER W ORLD B Y D ELIVERING FOR O UR C LIENTS Environment Firm Chemical Remediation Green Design Firm Water Supply, Transmission & Treatment Hazardous Waste Dams & Reservoirs Source: 2020 ENR Rankings, reflecting global revenue. Page 8 C RITICAL C LIENT F OCUS A REAS : x Urbanization and de - densification in a post - pandemic world x Electrification of transit and autonomous transportation x Environmental consulting and remediation – e.g., PFAS x New Energy and Energy Storage – achieving a net zero - carbon society x Master planning to advance community equity and economic prosperity x Digital disruption and transformation x Clean water x Strengthening the resiliency of our communities to adapt to climate change Site Assessment Clean Air Compliance Desalination Plants Solar Power Green Contractor

February 2021 Unlocking Our Growth Potential Page 9 Expanding our advisory role with clients to shape their plans to build a better world Growing our leading Program Management business by providing multi - disciplinary technical solutions as a competitive advantage versus single business line project managers Partnering with our clients beyond advisory and program management to deliver our core design, engineering and other professional Delivering our services more efficiently by transforming how design is performed Our scale and technical leadership position us to outgrow the industry organically. Through our Think and Act Globally strategy, we are better positioned than ever to capitalize by: x Organizing to foster collaboration and deliver the full strengths of AECOM for our clients x Bringing best practices to grow our share in our largest markets and with our top clients with the best growth opportunities x Investing in innovation deployed at scale to transform how we work and deliver for our clients x Appointing growth - oriented leaders to our largest growth opportunities O UR I NVESTMENT IN G ROWTH IS B UILT INTO O UR M ARGINS – N O M ATERIAL M&A P LANNED O UR F OCUS A REAS TO D RIVE G ROWTH AND P ROFITABILITY
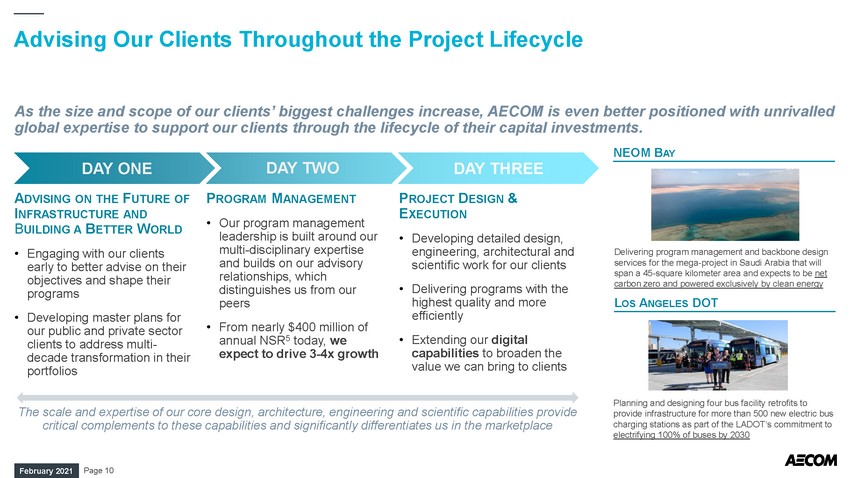
February 2021 Advising Our Clients Throughout the Project Lifecycle DAY THREE A DVISING ON THE F UTURE OF I NFRASTRUCTURE AND B UILDING A B ETTER W ORLD • Engaging with our clients early to better advise on their objectives and shape their programs • Developing master plans for our public and private sector clients to address multi - decade transformation in their portfolios P ROGRAM M ANAGEMENT • Our program management leadership is built around our multi - disciplinary expertise and builds on our advisory relationships, which distinguishes us from our peers • From nearly $400 million of annual NSR 5 today, we expect to drive 3 - 4x growth P ROJECT D ESIGN & E XECUTION • Developing detailed design, engineering, architectural and scientific work for our clients • Delivering programs with the highest quality and more efficiently • Extending our digital capabilities to broaden the value we can bring to clients DAY ONE DAY TWO Page 10 The scale and expertise of our core design, architecture, engineering and scientific capabilities provide critical complements to these capabilities and significantly differentiates us in the marketplace NEOM B AY Delivering program management and backbone design services for the mega - project in Saudi Arabia that will span a 45 - square kilometer area and expects to be net carbon zero and powered exclusively by clean energy L OS A NGELES DOT Planning and designing four bus facility retrofits to provide infrastructure for more than 500 new electric bus charging stations as part of the LADOT’s commitment to electrifying 100% of buses by 2030 As the size and scope of our clients’ biggest challenges increase, AECOM is even better positioned with unrivalled global expertise to support our clients through the lifecycle of their capital investments.

February 2021 Deploying Innovation at Scale to Change How We Deliver Page 11 The Future of Design Executing Our Workplace of the Future Strategy • With scale, we can capture, organize, and automate certain elements of the design process to improve quality, cost of production, speed of delivery, and enhance client satisfaction • Virtual working allows the increased participation of our design centers and our engineers anywhere to bring their expertise and creativity to our design • Our employees and clients increasingly desire flexible working arrangements, and we can capitalize on our investments in technology and cloud platforms • The new delivery model will be more virtual and less local – we can follow the sun to deliver for our clients • Expect to further reduce our real estate portfolio and business travel by up to one - third over the next several years O UR O PPORTUNITY Changing How We Work and Deliver to Fully Capitalize on our Inherent Advantages Our employees are increasingly open to flexible working in the future Our scores for quality and schedule have also improved over this time Our NPS scores have improved through the pandemic to all - time highs An example of digital design – concrete bridge design: globally standardizing the steps to design, our engineers define the parameters and constraints, and our script completes the design including the drawings that are tailored to the local and the client requirements.

February 2021 B IDEN P ROPOSAL P ROVIDES K EY C LIENT S UPPORT Well Aligned with Biden Priorities on Infrastructure, Water and Environment • Several of the Biden Administration’s top policy priorities are well aligned with our industry - leading capabilities and our focus on ESG – Proposed $2 trillion infrastructure and climate action plan would accelerate use of clean energy in transportation, energy and building sectors – Includes specific funding for zero emission public transit, buildings and rail systems, and clean water and coastal restoration – PFAS is anticipated to be designated as a hazardous substance by the EPA, which would accelerate demand in the estimated $160+ billion market where we lead the industry • Our U.S. state and local clients, which is our largest client sector in the Americas, are also set to benefit – The Biden Administration’s COVID relief proposal includes $350 billion of funding that would represent approximately 20% of states total tax receipts – In addition, state tax receipts and vehicle miles travelled are trending positively, which provides for additional funding certainty Page 12 Proposed State and Local Stimulus Represents Approx. 20% of States Total Tax Receipts State and Local Stimulus Support as part of Biden Proposal

February 2021 Our Culture of Continuous Improvement Drives Progress Towards Our 15%+ Margin Target by FY’24 Page 13 Advancing our Workplace of the Future strategy to drive additional efficiencies in our cost structure, further our reduce real estate footprint, and expand our digital delivery capabilities Continuing to optimize our costs through a simplified and more efficient organizational structure Increasing productivity by expanding use of our design centers and global shared service centers 8.7% 10.7% 12.3% 13.2% 15.0% ~ 11.5% 1.8% FY'18 FY'19 FY'20 FY'21E Impact of Continuous Improvement Initiatives FY'24E TTM Peer Average S EGMENT A DJUSTED 1 O PERATING M ARGIN 2 ( ON NSR 5 ) E XPECT TO A CHIEVE 15%+ M ARGINS BY FY’24, W HICH W OULD S IGNIFICANTLY L EAD OUR I NDUSTRY C ONTINUOUS I MPROVEMENT I NITIATIVES Continuing to exit underperforming or lower - returning markets and businesses to focus on our highest - returning businesses with the largest growth prospects

February 2021 $341 M $680 M+ FY'20 FY'24E Our Commitment to More than Double Our Adjusted EPS and Free Cash Flow by FY’24 Segment Adjusted 1 Operating Margins 2 Return on Invested Capital (ROIC) 6 • Through the execution of our strategy, we are confident in our ability to double our adjusted 1 EPS and free cash flow 2 by FY’24 (from FY’20) – Executing our Think and Act Globally strategy to drive growth – Benefitting from our restructuring actions to simplify our operating structure and reduce our overhead – Advancing our Workplace of the Future initiative to further consolidate real estate and create more efficient work environments – Committed to our capital allocation policy focused on shareholder returns through repurchases $2.15 $4.30 + FY'20 FY'24E Adjusted 1 EPS Page 14 E XPECT TO A CHIEVE O UR L ONG - T ERM T ARGETS BY FY’24 Free Cash Flow 3 Segment Adjusted 1 Operating Margins 2 S ETTING AN A SPIRATION FOR A P REMIER C ONSULTING F IRM

February 2021 Gaurav Kapoor Chief Financial Officer
February 2021 AECOM Is a High - Quality Professional Services Business Page 16 I NHERENT A DVANTAGES OF O UR P ROFESSIONAL S ERVICES B USINESS x High quality, public sector and blue - chip private sector client base x Highly variable cost structure x Substantial backlog position with long - term visibility to operate with certainty x Ability to grow services with minimal incremental cost, enabling high returns on invested capital x Low capital intensity allows for substantial capacity to invest in the business to drive growth and to return to shareholders O UR C ONTINUED L ONG - T ERM C OMMITMENTS : x Executing our strategy to deliver profitable growth long - term x Advancing our culture of continuous improvement to ensure we deliver our work more efficiently x Creating shareholder value with strong underlying cash flow We have a highly attractive business profile that provides us the opportunity to generate strong returns on our investments in growth. We have demonstrated our ability to perform through periods of uncertainty, enabled by the inherent advantages of our Professional Services business.

February 2021 Q1’21 Performance and Strong Backlog Supports Our Outlook Page 17 F IRST Q UARTER F ISCAL 2021 P ERFORMANCE Continued Margin Expansion Strong EBITDA Growth Double - Digit Adjusted EPS Growth 13.1% 11.7% Segment Adjusted 1 Operating Margins 2 Q1’20 Q1’21 $189 $173 Adjusted 1 EBITDA 4 (millions) Q1’20 Q1’21 $0.62 $0.46 Adjusted 1 EPS Q1’20 Q1’21 G LOBAL D ESIGN B ACKLOG (Y EAR - OVER - Y EAR G ROWTH ) x Backlog in our design business, which represents approximately 91% of our profitability, was up 9% over the prior year in the first quarter x Backlog growth in this business has accelerated over the past several quarters, reflecting our investments in business development and efforts to drive growth x Our pipeline of opportunities remains robust to support continued growth as funding comes to the market 9% 6% 2% Q1'21 Q4'20 Q3'20
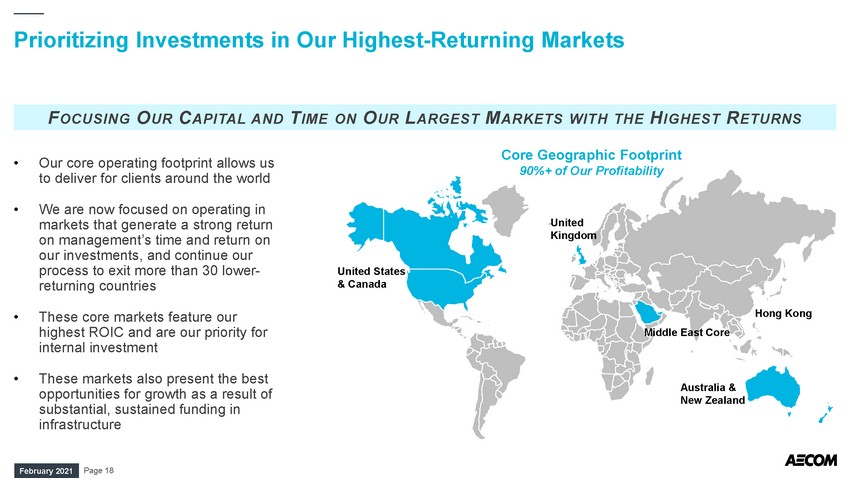
February 2021 Prioritizing Investments in Our Highest - Returning Markets United Kingdom United States & Canada Middle East Core Australia & New Zealand Core Geographic Footprint 90%+ of Our Profitability Hong Kong • Our core operating footprint allows us to deliver for clients around the world • We are now focused on operating in markets that generate a strong return on management’s time and return on our investments, and continue our process to exit more than 30 lower - returning countries • These core markets feature our highest ROIC and are our priority for internal investment • These markets also present the best opportunities for growth as a result of substantial, sustained funding in infrastructure Page 18 F OCUSING O UR C APITAL AND T IME ON O UR L ARGEST M ARKETS WITH THE H IGHEST R ETURNS

February 2021 Investing in Our Global Shared Services Centers to Drive Further Efficiency • We have nearly doubled our headcount in our best - cost global business services centers in the past year, which allows us to more efficiently deliver core administrative processes and tasks for our internal and external clients • We continue to expand our centers, including through the next phase of our Finance Transformation that is focused on automation, standardization and centralization of processes in best - cost locations • Focused on enhancing our project accounting, cash, reporting and payroll processes • Investments in shared services have had a less than one year payback • We expect these initiatives will help drive an additional at least $20 million in incremental annualized savings B UCHAREST ~100 full - time employees B ANGALORE Staffing up additional office through FY’21 M ANILA ~900 full - time employees O UR G LOBAL B USINESS S ERVICES C ENTER F OOTPRINT : C ONTINUE TO E XPAND O UR G LOBAL S HARED S ERVICES C ENTERS TO D RIVE F URTHER E FFICIENCIES Page 19

February 2021 C OMMITMENT TO R EPURCHASES U NDERSCORES O PPORTUNITY TO G ROW P ER S HARE V ALUE Highly Cash Generative Business Supports Our Capital Allocation Policy • The inherent advantages of our Professional Services business model result in strong, sustained cash flow performance – Highly variable cost structure – Strong backlog, including near - record contracted backlog that provides a solid of base of work with secured funding – Agile workforce, able to respond quickly to changing market conditions as demonstrated during the pandemic • Expect to convert 75% of our EBITDA to unlevered, attributable free cash flow 2 on a normalized basis 7 $810 ~$590 $525 ~$15 ~$80 FY'21E Adjusted EBITDA (Mid-Point) Unlevered Free Cash Flow After-tax Interest Cash from Non- Controlling Interests FY'21E Free Cash Flow (Mid-Point) ~75% Conversion Numbers in millions Page 20 162 149 Q4’20 Current (as of 2/9/21) Fully Diluted Shares Outstanding (millions)

February 2021 FY’24E K EY M ETRICS More than Doubling Our Adjusted EPS and Free Cash Flow by FY’24 A DJUSTED 1 EPS Page 21 • We are confident in our ability to more than double our adjusted 1 EPS and free cash flow by FY’24 (from FY’20) • Key elements of our plan: – Outgrowing the industry with mid - single digit or better organic growth – Driving further margin improvement through our culture of continuous improvement to deliver on our 15% margin target by FY’24 – Allocating our expected approximately $2.5 billion free cash flow from FY’21 – FY24 to share repurchases – Repurchasing stock to reduce fully diluted average share count to approximately 120 million by FY’24 $2.15 $4.30 + ~1/3 ~1/3 ~1/3 FY'20 Growth Margin Improvement Repurchases FY'24E Adjusted 1 EPS Free Cash Flow 2 C OMMITTED TO O UR C APITAL A LLOCATION P OLICY F OCUSED ON C APITAL R ETURNS TO S HAREHOLDERS THROUGH S TOCK R EPURCHASES Segment Adjusted 1 Operating Margin 4 Full Year Average Diluted Shared Count

February 2021 Appendix
February 2021 Footnotes 1 Excludes the impact of non - operating items, such as non - core operating losses and transaction - related expenses, restructuring co sts and other items. See Regulation G Information for a complete reconciliation of Non - GAAP measures. 2 Reflects segment operating performance, excluding AECOM Capital. 3 Free cash flow is defined as cash flow from operations less capital expenditures net of proceeds from equipment disposals. 4 Net income before interest expense, tax expense, depreciation and amortization. 5 Revenue, net of subcontractor and other direct costs. See Regulation G Information for a complete reconciliation of Non - GAAP me asures. 6 Return on invested capital, or ROIC, is calculated as the sum of adjusted net income as presented in the Company’s Regulation G Information and interest expense, net of interest income, divided by average quarterly invested capital as defined as the sum of attributable shareholder’s equity and to tal debt, less cash and cash equivalents. 7 Unlevered free cash flow is derived by adding back after - tax adjusted interest expense at a 25% tax rate and is after distributi ons to non - controlling interests. Normalized unlevered free cash flow excludes unusual events, such as transformational restructuring and other factors that may impact fr ee cash flow. Page 23

February 2021 As a Professional Services Business, AECOM Is Poised to Thrive Focused on our core higher - returning and lower - risk businesses Leader in key transportation, water and environment markets and ideally positioned advise clients on their ESG priorities Strengthened financial profile with transformed balance sheet and returning capital to shareholders Capitalizing on market leading positions, substantial backlog and ongoing continuous improvement initiatives to drive long - term profitable growth Attractive Exposure to Key End Markets Balanced Geographic Exposure Diverse Funding Sources Broad Technical Expertise Lower - Risk Business Model U.S. Asia Pacific EMEA Canada Cost - Plus Design Fixed - Price Design Construction Management Private State & Local Governments Non - U.S. Governments Federal U.S. Government Transportation Facilities Environment / Water New Energy 35% 34% 28% 3% 52% 39% 9% 44% 24% 23% 9% 54% 21% 20% 5% All numbers are presented as a percentage of TTM NSR 5 (as of Q1’21) 41% 17% 14% 10% 18% Engineers Program Managers Consultants / Planners Scientists Design, Digital & Other Page 24

February 2021 Regulation G Information Reconciliation of Revenue to Revenue, Net of Subcontractor and Other Direct Costs (NSR) Three Months Ended December 31, 2019 September 30, 2020 December 31, 2020 Americas Revenue $ 2,452.0 $ 2,732.3 $ 2,557.3 Less: subcontractor and other direct costs 1,546.4 1,803.2 1,694.3 Revenue, net of subcontractor and other direct costs $ 905.6 $ 929.1 $ 863.0 International Revenue $ 783.1 $ 831.1 $ 755.6 Less: subcontractor and other direct costs 149.5 201.4 142.6 Revenue, net of subcontractor and other direct costs $ 633.6 $ 629.7 $ 613.0 Segment Performance (excludes ACAP) Revenue $ 3,235.1 $ 3,563.4 $ 3,312.9 Less: subcontractor and other direct costs 1,695.9 2,004.6 1,836.9 Revenue, net of subcontractor and other direct costs $ 1,539.2 $ 1,558.8 $ 1,476.0 Consolidated Revenue $ 3,235.6 $ 3,569.0 $ 3,313.2 Less: subcontractor and other direct costs 1,695.9 2,004.6 1,836.9 Revenue, net of subcontractor and other direct costs $ 1,539.7 $ 1,564.4 $ 1,476.3 Reconciliation of Segment Income from Operations to Adjusted Income from Operations Americas Segment: Income from operations $ 145.8 $ 152.6 $ 146.4 Amortization of intangible assets 4.7 4.4 4.3 Adjusted income from operations $ 150.5 $ 157.0 $ 150.7 International Segment: Income from operations $ 28.7 $ 39.7 $ 42.1 Noncore operating losses & transaction related expenses (0.1) — — Amortization of intangible assets 1.4 1.4 1.0 Adjusted income from operations $ 30.0 $ 41.1 $ 43.1 Segment Performance (excludes ACAP): Income from operations $ 174.5 $ 192.3 $ 188.5 Noncore operating losses & transaction related expenses (0.1) — — Amortization of intangible assets 6.1 5.8 5.3 Adjusted income from operations $ 180.5 $ 198.1 $ 193.8 Page 25 Reconciliation of Net Income (Loss) Attributable to AECOM from Continuing Operations to EBITDA to Adjusted EBITDA and to Adjusted Income from Operations Net income (loss) attributable to AECOM from continuing operations $ 30.9 $ (0.1) $ 83.4 Income tax expense 15.9 15.5 25.6 Depreciation and amortization 41.1 51.6 39.4 Interest income (2) (3.4) (0.8) (1.3) Interest expense 40.3 47.5 30.7 Amortized bank fees included in interest expense (2.0) (1.6) (1.8) EBITDA $ 122.8 $ 112.1 $ 176.0 Noncore operating losses & transaction related expenses 5.6 — — Restructuring costs 45.0 91.9 13.0 Adjusted EBITDA $ 173.4 $ 204.0 $ 189.0 Other income (4.0) (1.5) (3.9) Depreciation (1) (33.1) (37.6) (32.4) Interest income (2) 3.4 0.8 1.3 Noncontrolling interests in income of consolidated subsidiaries, net of tax 4.0 4.0 5.4 Amortization of intangible assets included in NCI, net of tax 0.1 0.2 0.1 Adjusted income from operations $ 143.8 $ 169.9 $ 159.5 (1) Excludes depreciation from discontinued operations, noncore operating losses, and accelerated depreciation of project management tool. (2) Included in other income. Reconciliation of Net Cash (Used in) Provided by Operating Activities to Free Cash Flow Three Months Ended December 31, 2019 September 30, 2020 December 31, 2020 Net cash (used in) provided by operating activities $ (206.9) $ 649.3 $ 7.1 Capital expenditures, net (31.1) (30.0) (21.3) Free cash flow $ (238.0) $ 619.3 $ (14.2)
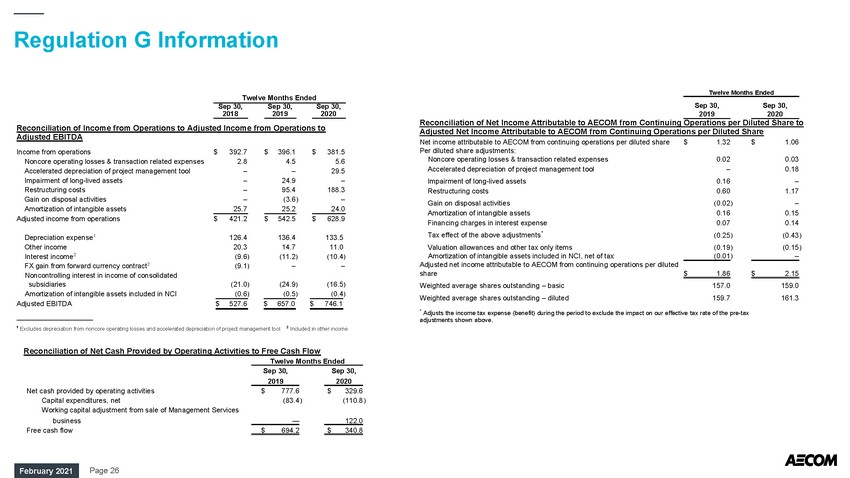
February 2021 Regulation G Information Page 26 Twelve Months Ended Sep 30, 2018 Sep 30, 2019 Sep 30, 2020 Reconciliation of Income from Operations to Adjusted Income from Operations to Adjusted EBITDA Income from operations $ 392.7 $ 396.1 $ 381.5 Noncore operating losses & transaction related expenses 2.8 4.5 5.6 Accelerated depreciation of project management tool – – 29.5 Impairment of long-lived assets – 24.9 – Restructuring costs – 95.4 188.3 Gain on disposal activities – (3.6 ) – Amortization of intangible assets 25.7 25.2 24.0 Adjusted income from operations $ 421.2 $ 542.5 $ 628.9 Depreciation expense 1 126.4 136.4 133.5 Other income 20.3 14.7 11.0 Interest income 2 (9.6 ) (11.2 ) (10.4 ) FX gain from forward currency contract 2 (9.1 ) – – Noncontrolling interest in income of consolidated subsidiaries (21.0 ) (24.9 ) (16.5 ) Amortization of intangible assets included in NCI (0.6 ) (0.5 ) (0.4 ) Adjusted EBITDA $ 527.6 $ 657.0 $ 746.1 1 Excludes depreciation from noncore operating losses and accelerated depreciation of project management tool 2 Included in other income Twelve Months Ended Sep 30, 2019 Sep 30, 2020 Reconciliation of Net Income Attributable to AECOM from Continuing Operations per Diluted Share to Adjusted Net Income Attributable to AECOM from Continuing Operations per Diluted Share Net income attributable to AECOM from continuing operations per diluted share $ 1.32 $ 1.06 Per diluted share adjustments: Noncore operating losses & transaction related expenses 0.02 0.03 Accelerated depreciation of project management tool – 0.18 Impairment of long - lived assets 0.16 – Restructuring costs 0.60 1.17 Gain on disposal activities (0.02 ) – Amortization of intangible assets 0.16 0.15 Financing charges in interest expense 0.07 0.14 Tax effect of the above adjustments * (0.25 ) (0.43 ) Valuation allowances and other tax only items (0.19 ) (0.15 ) Amortization of intangible assets included in NCI, net of tax (0.01 ) – Adjusted net income attributable to AECOM from continuing operations per diluted share $ 1.86 $ 2.15 Weighted average shares outstanding – basic 157.0 159.0 Weighted average shares outstanding – diluted 159.7 161.3 * Adjusts the income tax expense (benefit) during the period to exclude the impact on our effective tax rate of the pre - tax adjustments shown above. Reconciliation of Net Cash Provided by Operating Activities to Free Cash Flow Twelve Months Ended Sep 30, 2019 Sep 30, 2020 Net cash provided by operating activities $ 777.6 $ 329.6 Capital expenditures, net (83.4 ) (110.8 ) Working capital adjustment from sale of Management Services business — 122.0 Free cash flow $ 694.2 $ 340.8

February 2021 Regulation G Information FY21 GAAP EPS Guidance based on Adjusted EPS Guidance (all figures approximate) Fiscal Year End 2021 GAAP EPS Guidance $2.30 to $2.50 Adjusted EPS excludes: Amortization of intangible assets $0.13 Amortization of deferred financing fees $0.03 Restructuring $0.26 Tax effect of the above items ($0.12) Adjusted EPS Guidance $2.60 to $2.80 FY21 GAAP Net Income Attributable to AECOM from Continuing Operations Guidance based on Adjusted EBITDA Guidance (in millions, all figures approximate) Fiscal Year End 2021 GAAP net income attributable to AECOM from continuing operations guidance $346 to $376 Adjusted net income attributable to AECOM from continuing operations excludes: Amortization of intangible assets $20 Amortization of deferred financing fees $5 Restructuring* $40 Tax effect of the above items ($19) Adjusted net income attributable to AECOM from continuing operations $392 to $422 Adjusted EBITDA excludes: Adjusted interest expense, net $109 Depreciation $132 Income tax expense, including tax effect of above items $157 to $167 Adjusted EBITDA Guidance $790 to $830 *Calculated based on the mid-point of AECOM’s fiscal year 2021 guidance. FY21 GAAP Interest Expense Guidance based on Adjusted Interest Expense Guidance (in millions, all figures approximate) Fiscal Year End 2021 GAAP Interest Expense Guidance $118 Financing charges in interest expense ($5) Interest income ($4) Adjusted Interest Expense Guidance $109 Note: Variances within tables are due to rounding. Reconciliation of FY21 Operating Cash Flow Guidance to Free Cash Flow Guidance (in millions, all figures approximate) Fiscal Year End 2021 Operating Cash Flow Guidance $535 to $735 Capital expenditures, net of proceeds from equipment disposals ($110) Free Cash Flow Guidance $425 to $625 Page 27
February 2021