Attached files
| file | filename |
|---|---|
| EX-32.2 - EX-32.2 - JFrog Ltd | d98623dex322.htm |
| EX-32.1 - EX-32.1 - JFrog Ltd | d98623dex321.htm |
| EX-31.2 - EX-31.2 - JFrog Ltd | d98623dex312.htm |
| EX-31.1 - EX-31.1 - JFrog Ltd | d98623dex311.htm |
| EX-23.1 - EX-23.1 - JFrog Ltd | d98623dex231.htm |
| EX-21.1 - EX-21.1 - JFrog Ltd | d98623dex211.htm |
| EX-4.2 - EX-4.2 - JFrog Ltd | d98623dex42.htm |
Table of Contents
UNITED STATES
SECURITIES AND EXCHANGE COMMISSION
Washington, D.C. 20549
FORM 10-K
(Mark One)
| ☒ | ANNUAL REPORT PURSUANT TO SECTION 13 OR 15(d) OF THE SECURITIES EXCHANGE ACT OF 1934 |
For the fiscal year ended December 31, 2020
or
| ☐ | TRANSITION REPORT PURSUANT TO SECTION 13 OR 15(d) OF THE SECURITIES EXCHANGE ACT OF 1934 |
For the transition period from to
Commission file number: 001-39492
JFrog Ltd.
(Exact name of registrant as specified in its charter)
| Israel | 98-0680649 | |
| (State or other jurisdiction of incorporation or organization) |
(I.R.S. Employer Identification Number) |
270 E. Caribbean Drive
Sunnyvale, California 94089
(Address of principal executive offices and zip code)
(408) 329-1540
(Registrant’s telephone number, including area code)
Securities registered pursuant to Section 12(b) of the Act:
|
| ||||
| Title of Each Class | Trading Symbol | Name of Each Exchange on Which Registered | ||
| Ordinary Shares, NIS 0.01 par value |
FROG | The Nasdaq Global Select Market | ||
|
| ||||
|
| ||||
Indicate by check mark if the registrant is a well-known seasoned issuer, as defined in Rule 405 of the Securities Act. Yes ☐ No ☒
Indicate by check mark if the registrant is not required to file reports pursuant to Section 13 or Section 15 (d) of the Act. Yes ☐ No ☒
Indicate by check mark whether the registrant (1) has filed all reports required to be filed by Section 13 or 15(d) of the Securities Exchange Act of 1934 during the preceding 12 months (or for such shorter period that the registrant was required to file such reports), and (2) has been subject to such filing requirements for the past 90 days. Yes ☒ No ☐
Indicate by check mark whether the registrant has submitted electronically every Interactive Data File required to be submitted pursuant to Rule 405 of Regulation S-T (§232.405 of this chapter) during the preceding 12 months (or for such shorter period that the registrant was required to submit such files). Yes ☒ No ☐
Indicate by check mark whether the registrant is a large accelerated filer, an accelerated filer, a non-accelerated filer, a smaller reporting company, or an emerging growth company. See the definitions of “large accelerated filer,” “accelerated filer,” “smaller reporting company,” and “emerging growth company” in Rule 12b-2 of the Exchange Act.
| Large accelerated filer | ☐ | Accelerated filer | ☐ | |||
| Non-accelerated filer | ☒ | Smaller reporting company | ☐ | |||
| Emerging growth company | ☒ | |||||
If an emerging growth company, indicate by check mark if the registrant has elected not to use the extended transition period for complying with any new or revised financial accounting standards provided pursuant to Section 13(a) of the Exchange Act. ☐
Indicate by check mark whether the registrant has filed a report on and attestation to its management’s assessment of the effectiveness of its internal control over financial reporting under Section 404(b) of the Sarbanes-Oxley Act (15 U.S.C. 7262(b)) by the registered public accounting firm that prepared or issued its audit report. ☐
Indicate by check mark whether the registrant is a shell company (as defined in Rule 12b-2 of the Act). Yes ☐ No ☒
The aggregate market value of the Ordinary Shares held by non-affiliates of the registrant, based on the closing price of the shares of Ordinary Shares on September 18, 2020 as reported by the Nasdaq Global Select Market on such date was approximately $861.8 million. The registrant has elected to use September 18, 2020, which was the closing date of its initial public offering of Ordinary Shares, as the calculation date because on June 30, 2020 (the last business day of the registrant’s most recently completed second fiscal quarter), the registrant was a privately held company. Shares of the registrant’s Ordinary Shares held by each executive officer and director and by each other person who may be deemed to be an affiliate of the registrant have been excluded from this computation. This calculation does not reflect a determination that certain persons are affiliates of the registrant for any other purpose
As of January 31, 2021, the registrant had 92,164,971 Ordinary Shares, NIS 0.01 par value per share, outstanding.
DOCUMENTS INCORPORATED BY REFERENCE
Portions of the registrant’s definitive Proxy Statement relating to the 2021 Annual Meeting of Shareholders are incorporated herein by reference in Part III of this Annual Report on Form 10-K to the extent stated herein. Such Proxy Statement will be filed with the Securities and Exchange Commission within 120 days of the registrant’s fiscal year ended December 31, 2020.
Table of Contents
2
Table of Contents
SPECIAL NOTE REGARDING FORWARD-LOOKING STATEMENTS
This Annual Report on Form 10-K contains forward-looking statements within the meaning of Section 27A of the Securities Act of 1933, as amended (the “Securities Act”), and Section 21E of the Securities Exchange Act of 1934, as amended (the “Exchange Act”), which statements involve substantial risks and uncertainties. Forward-looking statements generally relate to future events or our future financial or operating performance. In some cases, you can identify forward-looking statements because they contain words such as “may,” “will,” “should,” “expects,” “plans,” “anticipates,” “could,” “intends,” “target,” “projects,” “contemplates,” “believes,” “estimates,” “predicts,” “potential,” or “continue,” or the negative of these words, or other similar terms or expressions that concern our expectations, strategy, plans, or intentions.
Forward-looking statements contained in this Annual Report on Form 10-K include, but are not limited to, statements about:
| • | our future financial performance, including our expectations regarding our revenue, cost of revenue, gross profit, operating expenses, operating cash flow and free cash flow, and our ability to achieve, and maintain, future profitability; |
| • | market acceptance of our products; |
| • | anticipated trends, growth rates and challenges in our business and in the markets in which we operate; |
| • | the effects of increased competition in our markets and our ability to compete effectively; |
| • | our ability to maintain and expand our customer base, including by attracting new customers; |
| • | our ability to successfully expand in our existing markets and into new markets; |
| • | our ability to maintain the security and availability of our software; |
| • | our ability to maintain or increase our net dollar retention rate; |
| • | our ability to develop new products, or enhancements to our existing products, and bring them to market in a timely manner; |
| • | our business model and our ability to effectively manage our growth and associated investments; |
| • | beliefs and objectives for future operations, including regarding our market opportunity; |
| • | our relationships with third parties, including our technology partners and cloud providers; |
| • | our ability to maintain, protect, and enhance our intellectual property rights; |
| • | our ability to successfully defend litigation brought against us; |
| • | the attraction and retention of qualified employees and key personnel; |
| • | sufficiency of cash to meet cash needs for at least the next 12 months; |
| • | our ability to comply with laws and regulations that currently apply or become applicable to our business in Israel, the United States and internationally; |
| • | our expectations about the impact of natural disasters, public health epidemics, such as the coronavirus, protests or riots on our business, results of operations and financial condition; and |
| • | the future trading prices of our Ordinary Shares. |
You should not rely upon forward-looking statements as predictions of future events. We have based the forward-looking statements contained in this Annual Report on Form 10-K primarily on our current expectations and projections about future events and trends that we believe may affect our business, financial condition, results of operations, and prospects. The outcome of the events described in these forward-looking statements is
3
Table of Contents
subject to risks, uncertainties, and other factors described in the section titled “Risk Factors” and elsewhere in this Annual Report on Form 10-K. Readers are urged to carefully review and consider the various disclosures made in this Annual Report on Form 10-K and in other documents we file from time to time with the Securities and Exchange Commission (SEC) that disclose risks and uncertainties that may affect our business. Moreover, we operate in a very competitive and rapidly changing environment. New risks and uncertainties emerge from time to time, and it is not possible for us to predict all risks and uncertainties that could have an impact on the forward-looking statements contained in this Annual Report on Form 10-K. We cannot assure you that the results, events, and circumstances reflected in the forward-looking statements will be achieved or occur, and actual results, events, or circumstances could differ materially from those described in the forward-looking statements.
The forward-looking statements made in this Annual Report on Form 10-K relate only to events as of the date on which the statements are made. We undertake no obligation to update any forward-looking statements made in this Annual Report on Form 10-K to reflect events or circumstances after the date of this Annual Report on Form 10-K or to reflect new information or the occurrence of unanticipated events, except as required by law. We may not actually achieve the plans, intentions, or expectations disclosed in our forward-looking statements, and you should not place undue reliance on our forward-looking statements. Our forward-looking statements do not reflect the potential impact of any future acquisitions, mergers, dispositions, joint ventures, or investments we may make.
In addition, statements that “we believe” and similar statements reflect our beliefs and opinions on the relevant subject. These statements are based upon information available to us as of the date of this Annual Report on Form 10-K, and while we believe such information forms a reasonable basis for such statements, such information may be limited or incomplete, and our statements should not be read to indicate that we have conducted an exhaustive inquiry into, or review of, all potentially available relevant information. These statements are inherently uncertain and investors are cautioned not to unduly rely upon these statements.
4
Table of Contents
PART I
Overview
JFrog’s vision is to power a world of continuously updated, version-less software—we call this Liquid Software.
We provide an end-to-end, hybrid, universal DevOps Platform to achieve Continuous Software Release Management, or CSRM. Our leading CSRM platform enables organizations to continuously deliver software updates across any system. Our platform is the critical bridge between software development and deployment of that software, paving the way for the modern DevOps paradigm. We enable organizations to build and release software faster and more securely while empowering developers to be more efficient. As of December 31, 2020, approximately 6,050 organizations have adopted JFrog, embarking on their journey towards Liquid Software.
Digital transformation has become an imperative for all organizations, and as such, organizations of all types and sizes are increasingly dependent upon software to better engage with their customers, partners, and employees. As a result, the continuous and reliable release of new software has become mission critical. An organization’s failure to keep software current or react to problems with timely software updates can not only cost lost revenue and reputation, but also threaten human safety and lives. The increased pace and volume of new software and updates have made releasing software in monolithic, discrete versions (e.g., v1.0, v2.0, v3.0) too slow to adequately address dynamic customer demands. We believe the end state of digital transformation is a non-stop, always-on, secure, continuous delivery of value to users, enabled by a world of version-less software.
DevOps enables the software innovation that is driving digital transformation. The need for organizations to better serve their customers, partners, and employees through software is driving the demand for constant innovation of the software build and release workflow. As the pace and variety of software creation have increased, the domains of software “developers” and IT “operators” have converged. Since our inception, we have embraced the culture and methodologies of modern software development and delivered a platform that connects developers and operators, thus providing the foundation for DevOps. DevOps has since become the approach modern digital organizations take to software development and operations, shortening, automating, and improving the software build and release workflow.
While many software development technologies today address aspects of a particular segment of DevOps, CSRM, enabled by JFrog, provides the common ground for software developers and IT operators, making it integral to the DevOps workflow. Software as it is written by a developer, in source code, cannot be deployed in a runtime environment. In order for software to run in production, source code is transformed into executable binary files that can be understood by and run on a server or device. Organizations need tools that can turn source code into binary files, store and manage these binaries, and then create software packages, or combinations of one or more binary files, that can be released and deployed to runtime environments. Our platform is designed to manage and deploy all types of software packages within an organization, making it the system of record for an organization’s software, and is often called the “database of DevOps.”
We had $598.1 million of cash, cash equivalents, and short-term investments as of December 31, 2020. We generated revenue of $150.8 million and $104.7 million for the years ended December 31, 2020 and 2019, respectively, representing a growth rate of 44%. Our net loss was $9.4 million and $5.4 million for the years ended December 31, 2020 and 2019, respectively. We generated operating cash flow of $29.5 million and $10.0 million for the years ended December 31, 2020 and 2019, respectively. Our free cash flow was $25.9 million and $8.2 million for the years ended December 31, 2020 and 2019, respectively.
Software and the Business Environment
The volume and importance of software is exploding. Organizations in all industries and of all sizes have turned to software to facilitate interactions with their customers, manage day-to-day operations, gain actionable
5
Table of Contents
business insights, secure their digital environments, and drive digital transformation. As a result, software’s role has changed from a functional tool to a cornerstone of our daily lives, and from a simple means of driving insight and efficiency to a significant source of competitive advantage.
The continuous and reliable release of new software is therefore mission critical, where delay or failure can be disruptive to our daily lives and costly to business. If drivers and riders are not running the same version of a ride-hailing company’s software and fail to connect, even for the briefest of moments, those riders can easily turn to a competitor. If an out-of-date piece of a financial institution’s software stack allows a security breach, the organization can suffer enormous reputational harm and be liable for damages. If an airplane’s software is not current, passengers’ lives may be put in danger.
In order to address growing customer expectations, organizations have dramatically reduced the time between releasing new features and functions and resolving security vulnerabilities, from years to months or even days. Updating a feature of a software application, rather than releasing a new version of the entire application, ensures that current software is brought to market faster, allowing organizations to be more responsive to their customers’ needs, and makes software updates less disruptive to the user experience. To keep software current in today’s environment, software updates need to be released incrementally, and with increased frequency.
The proliferation of open source software, availability of newer and more efficient software development technologies, and the increasing interconnectedness of software enable organizations to produce software at an increasing rate. Meanwhile, the adoption of new architectures, platforms, and technologies, such as microservices, containers, and hybrid and multi-cloud environments, creates significant complications in managing the software release cycle. Organizations’ existing approaches to their software release cycles address each step of the cycle separately, creating silos and bottlenecks around critical steps, such as building, testing, securing, and delivering software. The combination of these new technologies and legacy approaches has placed significant strain on the traditional software build and release workflow.
The DevOps Workflow
DevOps enables the software innovation that is driving digital transformation. As the domains of software developers and IT operators have converged. DevOps has emerged as a discipline that integrates software development and operations, shortening, automating, and improving the software build and release workflow. DevOps is a combination of new technologies, methodologies, and culture that powers a continuous, fast, and secure software release cycle.
The DevOps workflow spans the lifecycle of software, from the planning, coding, building, and testing of software by developers, to the releasing, deploying, operating, and monitoring of that software by operators. DevOps increasingly includes the process of managing security earlier in the software release cycle, known as DevSecOps, which helps to remove silos and bottlenecks. While many software development technologies today address aspects of a particular segment of DevOps, CSRM, enabled by JFrog, provides the common ground for software developers and IT operators, making it integral to the DevOps workflow.
CSRM and the Importance of Packages
Organizations’ need for a continuous, fast, and secure software release cycle has particularly elevated the importance of the core DevOps workflow: building, testing, releasing, and deploying software. This bridge, spanning from the development side to the operations side, is mission critical, yet exceedingly difficult to build and manage at the scale and speed that organizations require. We refer to this key portion of the DevOps workflow as CSRM.
Software as it is written by a developer, in source code, cannot be deployed in a runtime environment. In order for software to run in production, source code is transformed into executable binary files that can be
6
Table of Contents
understood by and run on a server or device. Organizations need tools that can turn source code into binary files, store and manage these binaries, and then create software packages, or combinations of one or more binary files, that can be released and deployed to runtime environments. Our platform is designed to manage and deploy all types of software packages within an organization, making it the system of record for an organization’s software.
In today’s business environment the volume and variety of packages that need to be managed and stored by organizations are rapidly increasing. Packages are increasingly created by both humans and machines as software build and release workflows are automated, and can also be imported from external sources, such as open source libraries and repositories. The increasingly large volumes and complexity of packages within organizations’ software development ecosystems require a new, systematic, and automated approach to the management of packages. Code repositories, which store and manage source code, are helpful and important developer tools, but cannot efficiently take software that was written by developers and deploy it in runtime environments because they are not purpose-built to manage and cache binary files. Tracking and managing software at the package level enables organizations to make incremental updates to software, eliminating the need for software versions. Package management allows software release management to be continuous, and capable of handling the volume, variety, and velocity of software required today.
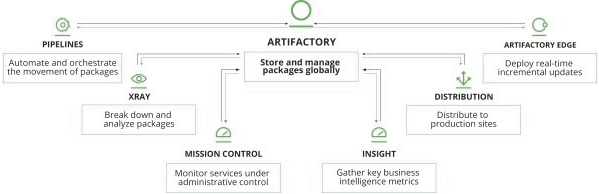
Our Platform
We built the world’s first universal package repository, JFrog Artifactory, to fundamentally transform the way that the software release cycle is managed. Our package-based approach to releasing software enabled the category of CSRM, allowing software releases to be continuous and software to always be current.
We enable organizations to store all package types in a common repository where they can be edited, tracked, and managed. Our unified platform connects all of the software release processes involved in building and releasing software, enabling CSRM. We empower our customers to shorten their software release cycles and enable the continuous flow of current, up-to-date software from any source to any destination. Our platform is designed to be agnostic to the programming languages, source code repositories, and development technologies that our customers use, and the type of production environments to which they deploy.
Our fully integrated suite of products allows our customers to compile software from source code repositories, manage the dependencies among components within software packages, move packages to a universal repository, ingest packages from third parties, including open source libraries, scan for vulnerabilities through various stages, distribute to endpoints, and deploy in production, all through a single user access point.
Since our initial launch of JFrog Artifactory, we have consistently innovated and added new products to expand the capabilities of our platform. Today, our platform comprises the full workflow for releasing software.
7
Table of Contents
Products
JFrog Artifactory
At the center of our platform is JFrog Artifactory, the first universal package repository. It allows teams and organizations to store, update, and manage their software packages at any scale. JFrog Artifactory ensures that all software packages being deployed are the most current by automatically caching dependencies between packages and package versions, including from external sources. JFrog Artifactory supports the major package technologies and can be seamlessly deployed in public clouds on-premise, private cloud, and hybrid environments. As a result, JFrog Artifactory serves as the “single source of truth” for an entire organization’s packages, ensuring consistency and enabling trust and automation in the software release cycle.
With JFrog Artifactory at its center, our platform is a cohesive, integrated, end-to-end solution comprised of the following additional products that encompass the complete software release cycle:
| • | JFrog Pipelines. JFrog Pipelines is our Continuous Integration/Continuous Delivery tool, responsible for automating and orchestrating the movement of software packages through our platform. This includes the creation, compilation, and management of packages throughout the DevOps workflow. JFrog Pipelines also provides end-to-end visibility and control over the software release cycle, ensuring that various repositories, testing tools, and deployment tools are seamlessly coordinated. |
| • | JFrog Xray. JFrog Xray continuously scans JFrog Artifactory to secure all packages stored in it. JFrog Xray is able to break down and understand software packages at a binary level, utilizing the metadata stored in JFrog Artifactory to accurately uncover potential vulnerabilities, policy violations, and compliance issues. This enables better DevSecOps, allowing organizations to achieve both control and trust earlier in their software release cycles by automating security workflows. |
| • | JFrog Distribution. JFrog Distribution provides reliable, scalable, and secure software package distribution with enterprise-grade performance. It uses proprietary technology to reliably and optimally distribute packages to multiple locations and update them as new release versions are produced. JFrog Distribution offers native support for the major package technologies, allowing smooth integrations between an organization’s deployment tools and the runtime environment, and enabling seamless software releases. |
| • | JFrog Artifactory Edge. JFrog Artifactory Edge is a specialized, read-only version of JFrog Artifactory, co-located close to the runtime environment. JFrog Artifactory Edge sits downstream from JFrog Distribution, providing reliable deployment of packages at the actual locations where updates are executed. Designed to work with JFrog Distribution, JFrog Artifactory Edge utilizes and leverages metadata from JFrog Artifactory to facilitate the transfer of only the incremental changes in software packages from their previous versions, rather than entire applications, enabling efficient, real-time updates to edge instances. |
| • | JFrog Mission Control. JFrog Mission Control is our platform control panel, providing a high-level view of all the moving pieces of an organization’s CSRM workflow. JFrog Mission Control allows users to configure and view services under administrative control, whether across any public cloud, on-premise, private cloud, or hybrid environment, or at geographically dispersed development sites. |
| • | JFrog Insight. JFrog Insight is our universal DevOps intelligence tool. JFrog Insight integrates with our other products to provide customers with powerful BI and analytics capabilities. JFrog Insight processes and collects key metrics, correlates them across diverse systems, and provides actionable insights to development managers, operations teams, and compliance officers across an organization. |
Benefits to Our Customers
| • | End-to-end, unified platform. We provide a central, unified platform for our customers’ software release needs with our universal package management solution, JFrog Artifactory, at its core and a portfolio of adjacent products including build integration, workflow automation, security, and |
8
Table of Contents
| deployment. We designed our products to integrate with each other natively, with a unified user interface. This allows organizations to effectively and efficiently manage the full software release cycle through a single user access point. |
| • | A “blessed” repository for the organization. We designed JFrog Artifactory to be the only package repository that an organization needs. By securely storing, monitoring, and distributing packages created inside and outside an organization, we provide a single, trusted local repository that any user within an organization can rely on, serving as the system of record for all of the software in an organization. This is commonly referred to as a blessed repository. JFrog Artifactory automatically caches updated packages from both external and internal repositories, ensuring that an organization always has the latest, validated packages available. |
| • | Acceleration through automation. Our platform accelerates the software release cycle by enabling the automation of workflows across teams and providing tight coordination between development and operations groups, removing silos within organizations’ software release processes. We seamlessly integrate with source code repositories to push software updates and to manage software package flows between all software release gates seamlessly and continuously, offering a uniquely efficient way to orchestrate software release from build to deploy. |
| • | Hybrid and multi-cloud deployment. We empower organizations to release software that is execution-ready across any number of different production environments. Our platform supports public cloud, on-premise, private cloud, and hybrid deployments, helping organizations avoid vendor lock-in and allowing software developers and IT operators across an organization to use our products in any environment. Our unique model offers the same product in the cloud and on-premise, so users can work in any environment with an identical user experience. |
| • | Scalable across the organization. Our proprietary technology for package management allows our platform to seamlessly scale across even the largest of customers and deployments. Our platform supports a wide variety of enterprise-scale storage capabilities and also accommodates spikes in usage without compromised performance. JFrog Artifactory supports High Availability cluster configuration, in which redundant components are created to maximize network uptime, and can therefore seamlessly serve nearly any number of concurrent users, build servers, and interactions. |
| • | Trusted and secure. We enable organizations to analyze packages for vulnerabilities, license compliance, and quality issues in near real-time. JFrog Xray, our fully integrated security solution, enables continuous automation of security policies. Our platform embeds security into the DevOps workflow, allowing organizations to have speed and control in the software release cycle. All packages on our platform are fully traceable, ensuring the accuracy and reliability of software applications. To enhance application quality while minimizing risk, our security controls offer customizable governance policies to specific packages and complete auditing capabilities and business impact analysis. |
Benefits to Software Developers and IT Operators
| • | Easy and automated package management. Through our JFrog Artifactory package management solution, software developers and IT operators are able to automatically fetch software packages from public and private repositories, ensure that packages are consistent across their organizations’ instances of JFrog Artifactory, scan for vulnerabilities with JFrog Xray, and manage dependencies among packages. JFrog Artifactory stores packages and uses their metadata in a manner similar to a relational database, enabling software developers and IT operators to manage package versions, organize and track dependencies, and perform replication across geographically distributed sites. |
| • | Integrated across the development ecosystem. We believe in user freedom of choice and provide software developers and IT operators with technology that seamlessly integrates with their ecosystems. Our out-of-the-box integrations with third-party technologies offer software developers and IT operators the freedom to choose their tool stacks, allowing them to minimize disruptions, increase |
9
Table of Contents
| productivity and innovation, and avoid vendor lock-in. Our solution includes user-friendly APIs that organizations can use to integrate our products and third-party technologies in a reliable and high-performance manner. |
| • | Universal and extensible. Our platform natively supports the major package technologies, including package libraries, continuous integration tools, container registries, and testing and deployment tools, and has been designed to quickly and seamlessly add support for new package technologies as they arise. JFrog Artifactory’s ability to search for, manage, and cache packages from different sources enables software developers and IT operators to execute faster and take advantage of innovation throughout the broader software development ecosystem. As an organization’s development environment changes, our products automatically adjust, with little to no downtime or the need for complex migrations. |
Business Model
We have a bottom-up, community-focused approach to driving increased usage of our products, in which we focus on demonstrating the value that our products can provide to software developers and IT operators before their respective organizations become customers. We strive to make software developers and IT operators more efficient, effective, and productive, and create champions of JFrog in the process. Our efficient go-to-market strategy, multi-tiered structure for both self-managed subscriptions and software-as-a-service (“SaaS”) subscriptions, which are managed by JFrog in the public cloud, and technology partnership ecosystem have allowed us to grow rapidly and efficiently.
| • | Efficient go-to-market strategy. |
| • | Make software developers and IT operators successful. Our consistent product innovation, thought leadership in CSRM, and knowledge sharing with software developer and IT operator communities engender trust that fuels increased usage of our products. We enable our users to stand out for the value they deliver to their organizations, making others within their organizations want to adopt our products to emulate their success. |
| • | Enable user freedom of choice. We are agnostic to the types of technologies a software developer or IT operator may choose to use, which is a philosophy that we believe provides us with a competitive advantage. Our platform is designed to quickly and seamlessly add support for new package technologies as they arise. |
| • | Align pricing with value provided. Our free trials, freemium offerings, and open source software options provide low-friction entry points for software developers and IT operators. Customers often upgrade to paid and higher-tiered subscriptions as they increase their usage of our products. |
| • | Provide best-in-class support. Our customer support personnel provide extensive engineering-level support directly to software developers and IT operators, ensuring those individuals who use our products most are set up to succeed. Our customer support team is differentiated by the number of team members who have engineering backgrounds, which allows our customers to have consistent access to individuals with intimate technical knowledge of our products and of the different technologies and protocols with which they integrate. Our technical support offerings primarily include issue diagnosis and root cause identification, as well as bug isolation and software fix delivery. |
| • | Multiple tiers of subscriptions. Our subscription structure is aligned with the way we have built our product platform, with JFrog Artifactory at the core of each subscription and a portfolio of adjacent products and services that differ by subscription tier. Our pricing model aligns the value we deliver with our customers’ needs as they scale. |
| • | Technology partnership ecosystem. Our extensive integrations with technologies across the software development ecosystem power significant extensibility of our platform and offer our customers the |
10
Table of Contents
| ability to use external software development technologies of their choice on our platform, driving increased customer affinity and product stickiness. |
Multi-Tiered Subscription Offerings
We offer our products to customers through a multi-tiered subscription structure. Our current paid subscription tiers include JFrog Pro, JFrog Pro Team, JFrog Pro X, JFrog Enterprise, and JFrog Enterprise Plus.
| • | JFrog Pro. JFrog Pro provides access to the universal version of JFrog Artifactory and ongoing updates, upgrades, and bug fixes. |
| • | JFrog Pro X. JFrog Pro X provides the same features as JFrog Pro with the addition of JFrog Xray and SLA support. |
| • | JFrog Pro Team. JFrog Pro Team provides cloud subscribers with JFrog Artifactory, security scanning with JFrog Xray and CI/CD tools with JFrog Pipelines. |
| • | JFrog Enterprise. JFrog Enterprise provides the same features as JFrog Pro with the addition of High Availability cluster configuration, multi-site replication, and JFrog Mission Control, enabling larger enterprise-scale deployments, and SLA support. Additionally, customers have the option to add a High Availability version of JFrog Xray to the JFrog Enterprise subscription. SaaS subscriptions of JFrog Enterprise also include CI/CD tooling with JFrog Pipelines. |
| • | JFrog Enterprise Plus. JFrog Enterprise Plus provides the same features as JFrog Enterprise, including JFrog Xray with HA, with the addition of JFrog Pipelines, JFrog Insight, JFrog Distribution, and JFrog Artifactory Edge. JFrog Enterprise Plus is our full platform subscription option, delivering our entire suite of products and functionality. |
We have an unwavering commitment to the software developer and IT operator communities, and show this commitment by offering varying forms of free access to our products in addition to the paid subscriptions described above. This free access takes the form of free trials, freemium offerings, and open source software, and helps generate demand for our paid offerings within the software developer and IT operator communities.
| • | Free Trials. We offer time-limited free trials of our platform that allow prospective customers to test the full functionality of a JFrog subscription within their environments or through our SaaS offering for a limited period. At the end of this trial period, these prospective customers either have to pay for a subscription or lose access. |
| • | Freemium. Our freemium offerings allow software developers and IT operators to explore JFrog Platform functionality before upgrading to subscriptions that add additional capabilities. Users can access significant functionality of the JFrog Platform via a free, usage-capped cloud tier available on all major cloud providers. Community free services include a limited version of Artifactory as well as a community center (Conan) for C/C++ developers. |
| • | Open Source. Our open source offering is a limited functionality version of JFrog Artifactory that only supports Java-based packages, and does not support organization-wide adoption by DevOps teams. |
Growth Strategies
We intend to pursue the following growth strategies:
| • | Extend our technology leadership. We will continue to invest in building new capabilities and extending our platform to bring the power of CSRM to a broader range of use cases, including increased security solutions for DevSecOps and enabling DevOps solutions for devices on the edge. Additionally, we believe acquiring new technologies to complement our organic innovation efforts will help us rapidly adapt to address the evolving needs of the market and drive increased value for our customers. |
11
Table of Contents
| • | Expand within our existing customer base. We have demonstrated a differentiated ability to retain customers, expand existing customer usage, and cross-sell a broader set of products and features within an organization. Our net dollar retention rate (“ARR”) of 133% as of December 31, 2020 highlights the increasing value of our products to our customer base. To date, we have not deployed a significant outbound sales force, relying primarily on our self-service and inbound sales model. Moving forward, we are building a small, high-touch strategic sales team to identify new use cases and drive expansion and standardization on JFrog within our largest customers. |
| • | Acquire new customers. Our free trial subscription options, freemium product offerings, and open source version of JFrog Artifactory increase software developer and IT operator familiarity with our products, and allow for low-friction product adoption. Additionally, we have steadily grown our international presence since inception and intend to continue to expand internationally as DevOps practices are increasingly adopted around the world. |
| • | Expand and develop our technology partnership ecosystem. We have designed our platform to work with the major package technologies and be deployed in any environment, allowing our technology partners to better serve their customers. We also intend to cultivate and leverage channel partners to grow our market presence and drive greater sales efficiency. |
Customers
As of December 31, 2020, we had a global customer base of approximately 6,050 organizations across all industries and sizes, including approximately 78% of Fortune 100 organizations.
As of December 31, 2019, 234 of our customers had ARR of $100,000 or more, increasing to 352 customers as of December 31, 2020, accounting for 45% and 51% of our ARR, respectively. We had 7 customers with ARR of at least $1.0 million as of December 31, 2019, increasing to 10 customers with ARR of at least $1.0 million as of December 31, 2020. For the year ended December 31, 2020, our 10 largest customers represented approximately 8% of our total revenue and no single customer accounted for more than 2% of our total revenue. For the year ended December 31, 2020, approximately 36% of our revenue was generated from customers outside of the United States. All references to our customers included in this Annual Report refer to paying customers.
Technology
Our proprietary technology, fueled by our optimized database architecture, enables best-in-class reliability, scalability, and performance.
Our technology includes the following key attributes:
| • | Universal package management. The core of our platform, JFrog Artifactory, stores packages and manages the metadata from the major package technologies, including Debian, Docker, Go, Helm, Kubernetes, Maven, NPM, NuGet, Python, and RPM, in a manner similar to a relational database, wherein it can manage package versions, organize and track dependencies, and perform replication across geographically distributed repositories. Our platform is designed to quickly and seamlessly add support for new package technologies as they arise. |
| • | Localizing public repositories. JFrog Artifactory automatically queries third-party repositories, and allows organizations to exert choice and governance in the packages they cache. We help customers minimize dependency on the availability and reliability of online resources by allowing them to control packages within the confines of their organizations, enabling them to better maintain control and security via the blacklisting or whitelisting of certain components. |
| • | Rich metadata. Every package in JFrog Artifactory is stored and referenced using metadata, including dependencies, author, and date modified. We utilize our proprietary technology to store and index |
12
Table of Contents
| metadata, allowing it to be queried for multiple uses such as package promotion, tagging, security, and more, which enables automation. This metadata can be generated from many sources, such as users, third-parties, and packages themselves. |
| • | Checksum-based storage. A checksum is a sequence of numbers and letters that serves as a “digital fingerprint.” Each package has a unique checksum that is stored as a file and referenced by JFrog Artifactory. When it is necessary to replicate or copy files, JFrog Artifactory’s proprietary checksum-based storage optimizes the process by de-duplicating the storage process and directly creating new references to the existing checksum file. This approach significantly reduces the amount of data needed within JFrog Artifactory or when copying packages to remote sites or replicating repositories, making it substantially faster than traditional approaches. |
| • | High Availability. Our High Availability configuration allows multiple JFrog product nodes to be deployed as a redundant cluster to reduce reliance on any single node. Our products support a High Availability configuration with a cluster of two or more active/active nodes, ensuring that there can be no single-point-of-failure. If any specific node goes down, a system will continue to operate through the remaining, redundant nodes with little to no downtime or degradation of performance of the system as a whole. Further, the High Availability configuration means that our products can accommodate larger load bursts with horizontal server scalability, so that organizations can meet increasing load requirements. Importantly, our High Availability configuration allows customers to update our products with the latest versions with little to no downtime, as each node is updated one at a time. |
| • | Hierarchical graph of software packages. By tracking against a database of known vulnerabilities, our platform provides continuous security and analysis of packages in the development environment. We provide continuous protection by recursively scanning components down to their binary file levels on a regular basis. Integration with major package technologies allows us to provide critical insights early in the development phase, making it less likely for vulnerable components to reach production. |
| • | Enterprise-class security and compliance. Organizations can use our platform to help manage the integrity of software being deployed by digitally signing packages and binary files. Groups, API tokens, users, and other characteristics can all be managed from various points within multiple data centers, alongside real-time access replication. We define access policies at the full repository or single package level consistent with industry practice and widely accepted protocols. |
| • | Easy user plugins. User plugins allow customers to extend the functionality of our products. For virtually any action performed in a development environment, customers can write a user plugin that effectively extends the JFrog Artifactory REST API, providing a simple way to add functionality, including scheduling tasks, managing security and authentication, license compliance, open source governance, package resolution and deployment, build integration, promotion logic, maintenance, and clean up. Additionally, our open source plugins can be changed, debugged, and redeployed by users in near real-time. |
Marketing and Sales
Marketing
We have a bottom-up, community-focused approach to marketing that prioritizes increasing the effectiveness of software developers and IT operators. We empower software developers and IT operators to release software faster and more securely, and in the process create champions of our products who naturally demonstrate the value of JFrog to their broader organizations. These communities can easily engage with our products through free trials, freemium offerings, and open source software before deciding to use them on a paid basis. We believe this approach gives us a competitive advantage, as software developer and IT operator communities have become integral in spreading awareness of our brand, expanding use cases, and overall organizational adoption of our platform. As a result, the value we bring to software developers and IT operators organically drives demand, as increased awareness, knowledge sharing, and adoption leads to greater exposure to the other features and products in our user interface.
13
Table of Contents
Recently, we introduced field marketing to support our strategic sales team to provide an account-based approach to drive expansion on JFrog within our largest customers. Additionally, we engage with prospective customers through user-centered events, including swampUP, our annual user conference, hands-on training events, and co-marketing activities with technology partners and large cloud platforms.
Sales
We employ a self-service and inbound sales model, which makes it easy for customers to try, adopt, and use our products, creating a highly efficient sales motion. Our customers can start with an open source version of JFrog Artifactory, freemium product offerings, or free trial subscription options, or land directly with one of our paid subscription tiers. Our open source, freemium, and free trial options provide low-friction entry points for customers, who often upgrade to paid and higher-tiered subscriptions as they increase their usage of our products through the identification of new use cases, the need for additional functionality, or the adoption of our products by new teams or in new geographies. Once a user has decided to use our products beyond what is available in open source or freemium versions, or at the end of a free trial, they can upgrade to one of our paid subscriptions, which are priced based on number of servers or usage to align the value we deliver with our customers’ needs as they scale.
Our customer success teams are focused on enabling organizations to realize the full benefits of our platform by helping them advance their CSRM practices and promoting the adoption of additional products and more advanced functionality of our platform. To date, we have not deployed a significant outbound sales force, relying primarily on our self-service and inbound sales model. Recently, we have begun building a high-touch strategic sales team to identify new use cases and drive expansion and standardization on JFrog within our largest customers.
Competition
The worldwide DevOps market is rapidly evolving. We compete on the basis of a number of factors, including:
| • | ability to provide an end-to-end, unified platform for the CSRM workflow; |
| • | breadth of technologies we support; |
| • | breadth of technology integrations; |
| • | total cost of ownership; |
| • | extensibility across organizations, including software developers, IT operators, and IT managers; |
| • | ability to enable collaboration between software developers and IT operators; |
| • | ability to deploy our products in any combination of cloud, multi-cloud or on-premise environments; |
| • | performance, security, scalability, and reliability; |
| • | quality of customer experience and satisfaction; |
| • | quality of customer support; |
| • | ease of implementation and use; and |
| • | brand recognition and reputation. |
Our products are available for both self-managed and SaaS deployments. While we believe we compete successfully on the above factors, particularly with regards to the comprehensive nature of our solutions, we do experience competition in each of these categories with different vendors:
| • | With respect to self-managed deployments, diversified software companies, such as IBM, Inc. (Red Hat), Pivotal Software, Inc., and VMware, Inc., and developer-focused software companies, such as GitLab Inc. and Sonatype, Inc., have offerings that compete with certain of our products. |
14
Table of Contents
| • | With respect to SaaS deployments, cloud providers, such as Alphabet Inc. (GCP), Amazon.com, Inc. (AWS), and Microsoft Corporation (Azure DevOps including GitHub), have offerings that compete with certain of our products. |
Additionally, we compete with home-grown, start-up, and open source technologies across the categories described above. Many of our competitors have greater financial, technical, and other resources, greater brand recognition, larger sales forces and marketing budgets, broader distribution networks, more diverse product and services offerings, and larger and more mature intellectual property portfolios. They may be able to leverage these resources to gain business in a manner that discourages customers from purchasing our offerings. Furthermore, we expect that our industry will continue to attract new companies, including smaller emerging companies, which could introduce new offerings. We may also expand into new markets and encounter additional competitors in such markets.
Research and Development
Our research and development organization is responsible for the design, development, testing, and delivery of new technologies, features, and integrations of our platform, as well as the continued improvement and iteration of our existing products. Our most significant investments in research and development are to drive core technology innovation and bring new products to market. Research and development employees are located primarily in our Israel and India offices.
Our research and development team consists of our architects, software engineers, security experts, DevOps engineers, product management, quality assurance, and data collection teams. We intend to continue to invest in our research and development capabilities to extend our platform and products.
Intellectual Property
Our success depends in part on our ability to protect our intellectual property. We rely on a combination of copyrights and trade secret laws, confidentiality procedures, employment agreements, license agreements, invention assignment agreements, trademarks, and patents to establish and protect our intellectual property rights, including our proprietary technology, software, know-how, and brand.
As of December 31, 2020, we had 12 U.S. patent applications including one pending U.S. provisional patents. We cannot assure you whether any of our patent applications will result in the issuance of a patent or whether the examination process will require us to narrow our claims. Any of our patents issued in the future may be contested, circumvented, found unenforceable or invalidated, and we may not be able to prevent third parties from infringing them. In addition, we have international operations and intend to continue to expand these operations, and effective patent, copyright, trademark, and trade secret protection may not be available or may be limited in foreign countries.
Although we rely on intellectual property rights, including trade secrets, patents, copyrights, and trademarks, as well as contractual protections to establish and protect our proprietary rights, we believe that factors such as the technological and creative skills of our personnel, creation of new modules, features and functionality, and frequent enhancements to our platform are more essential to establishing and maintaining our technology leadership position.
We control access to, and use of, our proprietary technology and other confidential information through the use of internal and external controls, including contractual protections with employees, contractors, customers, and partners, and our software is protected by U.S. and international copyright and trade secret laws. We require our employees, consultants, and other third parties to enter into confidentiality and proprietary rights agreements and control access to software, documentation, and other proprietary information. Our policy is to require employees and independent contractors to sign agreements assigning to us any inventions, trade secrets, works of
15
Table of Contents
authorship, developments, and other processes generated by them on our behalf and agreeing to protect our confidential information. In addition, we generally enter into confidentiality agreements with our customers and partners. See the section titled “Risk Factors” for a more comprehensive description of risks related to our intellectual property.
Government Regulations
Our business activities are subject to various federal, state, local and international laws, rules and regulations. For example, we are subject to numerous laws, directives, and regulations regarding privacy, data protection, and data security and the collection, storing, sharing, use, processing, transfer, disclosure, and protection of personal information and other data. In addition, in some cases, our software is subject to export control laws and regulations, including the Export Administration Regulations administered by the U.S. Department of Commerce, and our activities may be subject to certain trade and economic sanctions. Any failure or perceived failure to comply with laws and regulations that currently apply or become applicable to our business in Israel, the United States and internationally could have an adverse effect on our business and results of operations. Compliance with these laws, rules and regulations has not had, and is not expected to have, a material effect on our capital expenditures, results of operations and competitive position as compared to prior periods. For additional information about government regulation applicable to our business, see Part I, Item 1A, “Risk Factors” in this Annual Report on Form 10-K.
Employees and Human Capital
Our human capital resources objectives include, as applicable, identifying, recruiting, retaining, incentivizing and integrating our existing and new employees and consultants. In addition to competitive base salaries and cash compensation, the principal purposes of our share incentive plans are to attract, retain and reward personnel through the granting of share-based compensation awards, in order to increase shareholder value and the success of our company by motivating such individuals to perform to the best of their abilities and achieve our objectives. In addition to traditional employee benefits, we have implemented a number of innovative initiatives to support the well-being of our employee base.
As of December 31, 2020, we had a total of approximately 700 employees operating across six countries, including approximately 350 employees located in Israel and approximately 230 employees located in the United States. We recognize that everyone deserves respect and equal treatment, regardless of gender, race, ethnicity, age, disability, sexual orientation, gender identity, cultural background or religious belief and we strive to emphasize this equality as part of our core values to provide our employees a diverse, equitable, and inclusive work environment. None of our employees are represented by labor unions or, except for certain of our employees in France and Spain, covered by collective bargaining agreements.
Corporate Information
We were incorporated under the laws of the State of Israel on April 28, 2008. We are registered with the Registrar of Companies under the number 514130491. Our main place of business in the United States is located at 270 E. Caribbean Drive, Sunnyvale, California 94089. Our telephone number at this address is (408) 329-1540. Our registered office is located at 3 HaMahshev Street, Netanya, 4250465, Israel. Our telephone number at this address is + 972 (9)-894-1444. Our agent for service of process in the United States is JFrog, Inc.
Our website address is www.jfrog.com. Information contained on, or that can be accessed through, our website does not constitute part of this Annual Report on Form 10-K and inclusions of our website address in this Annual Report on Form 10-K are inactive textual references only.
“JFrog,” our logo, and our other registered or common law trademarks, service marks or trade names appearing in this Annual Report on Form 10-K are the property of JFrog Ltd. Other trademarks and trade names referred to in this Annual Report on Form 10-K are the property of their respective owners.
16
Table of Contents
Available Information
The Company announces material information to the public about the Company, its products, and other matters through a variety of means, including filings with the Securities and Exchange Commission, press releases, public conference calls and webcasts, the Company’s website (jfrog.com), its investor relations website (investors.jfrog.com), as well as social media, including its blog (jfrog.com/blog) and its Twitter account (@jfrog) in order to achieve broad, non-exclusionary distribution of information to the public and for complying with its disclosure obligations under Regulation FD. Therefore, the Company encourages investors, the media, and others interested in the Company to review the information it makes public.
Investing in our ordinary shares involves a high degree of risk. A description of the risks and uncertainties associated with our business and ownership of our ordinary shares is set forth below. You should carefully consider the risks and uncertainties described below, together with all of the other information contained in this Annual Report on Form 10-K, including the section titled “Management’s Discussion and Analysis of Financial Condition and Result of Operations” and our audited consolidated financial statements and the related notes thereto, before making a decision to invest in our ordinary shares. The risks and uncertainties described below are not the only ones we face. Our business, results of operations, financial condition, or prospects could also be harmed by risks and uncertainties that are not presently known to us or that we currently believe are not material. If any of the risks actually occur, our business, results of operations, financial condition, and prospects could be materially and adversely affected. In that event, the market price of our ordinary shares could decline and you could lose all or part of your investment.
Summary of Risk Factors
Investing in our ordinary shares involves a high degree of risk because our business is subject to numerous risks and uncertainties, including those outside of our control that could cause our actual results to be harmed, including, but not limited to, risks regarding the following:
| • | Our business and operations have experienced rapid growth, and if we do not appropriately manage future growth, if any, or are unable to improve our systems, processes, and controls, our business, financial condition, results of operations, and prospects will be adversely affected; |
| • | Our recent rapid growth may not be indicative of our future growth, and we may not be able to sustain our revenue growth rate in the future. Our rapid growth also makes it difficult to evaluate our future prospects and may increase the risk that we will not be successful. |
| • | We have a history of losses and may not be able to achieve profitability on a consistent basis. If we cannot achieve profitability, our business, financial condition, and results of operations may suffer. |
| • | The markets for our products are new, unproven, and evolving and may develop more slowly or differently than we expect. Our future success depends on the growth and expansion of these markets and our ability to adapt and respond effectively to evolving markets. |
| • | Our results of operations are likely to fluctuate from quarter to quarter, which could adversely affect the trading price of our ordinary shares. |
| • | If we are not able to keep pace with technological and competitive developments or fail to integrate our products with a variety of technologies that are developed by others, our products may become less marketable, less competitive, or obsolete, and our results of operations may be adversely affected. |
| • | The market for our products is nascent and highly fragmented, and we may not be able to compete successfully against current and future competitors, some of whom have greater financial, technical, and other resources than we do. If we do not compete successfully our business, financial condition, and results of operations could be harmed. |
17
Table of Contents
| • | JFrog Artifactory is at the core of our business and any decline in demand for JFrog Artifactory occasioned by malfunction, inferior performance, increased competition or otherwise, will impact our business, results of operations, and financial condition. |
| • | The recent global coronavirus outbreak could harm our business and results of operations. |
Risks Related to Our Business and Industry
Our business and operations have experienced rapid growth, and if we do not appropriately manage future growth, if any, or are unable to improve our systems, processes and controls, our business, financial condition, results of operations, and prospects will be adversely affected.
We have experienced rapid growth and increased demand for our products. Our total number of customers has grown to approximately 6,050 organizations as of December 31, 2020 from approximately 5,600 organizations as of December 31, 2019. Our employee headcount has also increased significantly, and we expect to continue to grow our headcount over the next year. The growth and expansion of our business places a continuous significant strain on our management, operational, and financial resources. In addition, as customers adopt our products for an increasing number of use cases, we have had to support more complex commercial relationships. We must continue to improve and expand our information technology and financial infrastructure, our security and compliance requirements, our operating and administrative systems, and our relationships with various partners and other third parties, and our ability to manage headcount and processes in an efficient manner to manage our growth effectively.
We may not be able to sustain the pace of improvements to our products successfully or implement systems, processes, and controls in an efficient or timely manner or in a manner that does not negatively affect our results of operations. Our failure to improve our systems, processes, and controls, or their failure to operate in the intended manner, may result in our inability to manage the growth of our business and to forecast our revenue, expenses, and earnings accurately, or to prevent losses.
As we expand our business and continue operating as a public company, we may find it difficult to maintain our corporate culture while managing our employee growth. Any failure to manage our anticipated growth and related organizational changes in a manner that preserves our culture could negatively impact future growth and achievement of our business objectives. Additionally, our productivity and the quality of our products may be adversely affected if we do not integrate and train our new employees quickly and effectively. Failure to manage any future growth effectively could result in increased costs, negatively affect our customers’ satisfaction with our products and harm our results of operations.
Our recent growth may not be indicative of our future growth, and we may not be able to sustain our revenue growth rate in the future. Our growth also makes it difficult to evaluate our future prospects and may increase the risk that we will not be successful.
Our total revenues for the years ended December 31, 2020, 2019 and 2018 were $150.8 million, $104.7 million and $63.5 million, respectively, representing a growth rate of 44% and 65% for the years ended December 31, 2020 and 2019, respectively. You should not rely on the revenue growth of any prior quarterly or annual period as an indication of our future performance. Even if our revenue continues to increase, we expect our revenue growth rate to decline in future periods. For example, we have experienced slowed growth during the COVID-19 pandemic. Many factors may contribute to declines in our growth rate, including greater market penetration, increased competition, slowing demand for our platform, a failure by us to continue capitalizing on growth opportunities, the maturation of our business, and global economic downturn, among others. If our growth rate declines, investors’ perceptions of our business and the market price of our ordinary shares could be adversely affected.
In addition, our rapid growth may make it difficult to evaluate our future prospects. Our ability to forecast our future results of operations is subject to a number of uncertainties, including our ability to effectively plan for
18
Table of Contents
and model future growth. We have encountered in the past, and may encounter in the future, risks and uncertainties frequently experienced by growing companies in rapidly changing industries. If we fail to achieve the necessary level of efficiency in our organization as it grows, or if we are not able to accurately forecast future growth, our business would be harmed. Moreover, if the assumptions that we use to plan our business are incorrect or change in reaction to changes in our market, or we are unable to maintain consistent revenue or revenue growth, our share price could be volatile, and it may be difficult to achieve and maintain profitability.
We have a history of losses and may not be able to achieve profitability on a consistent basis. If we cannot achieve profitability, our business, financial condition, and results of operations may suffer.
Although we have achieved positive operating cash flow and free cash flow, we have incurred losses in all years since our incorporation. We incurred a net loss of $9.4 million, $5.4 million and $26.0 million in the years ended December 31, 2020, 2019 and 2018, respectively. As a result, we had an accumulated deficit of $74.8 million as of December 31, 2020. We anticipate that our operating expenses will increase substantially in the foreseeable future as we continue to enhance our products, broaden our customer base, expand our sales and marketing activities, including building a small, high-touch strategic sales team and customer success team, expanding our operations, hiring additional employees, and continuing to develop our technology. These efforts may prove more expensive than we currently anticipate, and we may not succeed in increasing our revenue sufficiently, or at all, to offset these higher expenses. Revenue growth may slow or revenue may decline for a number of possible reasons, including slowing demand for our products or increasing competition. Any failure to increase our revenue as we grow our business could prevent us from achieving profitability or maintaining positive operating cash flow and free cash flow at all or on a consistent basis, which would cause our business, financial condition, and results of operations to suffer.
The markets for our products are new, unproven, and evolving and may develop more slowly or differently than we expect. Our future success depends on the growth and expansion of these markets and our ability to adapt and respond effectively to evolving markets.
The markets for our products are relatively new, rapidly evolving, and unproven. Accordingly, it is difficult to predict customer adoption and renewals and demand for our platform and our products, the entry of competitive products, the success of existing competitive products, or the future growth rate, expansion, longevity, and the size of the DevOps and software release management software markets. The expansion of and our ability to penetrate, these new and evolving markets depends on a number of factors, including: the cost, performance, and perceived value associated with DevOps technologies, as well as the ability of DevOps workflows to improve critical steps in the lifecycle of software, including managing software security. If we or other software and SaaS providers experience security incidents, loss of customer data, or disruptions in delivery or service, the market for these applications as a whole, including our platform and products may be negatively affected. If DevOps and software release management software do not continue to achieve market acceptance, or there is a reduction in demand caused by decreased customer acceptance, technological challenges, weakening economic conditions, privacy, data protection and data security concerns, governmental regulation, competing technologies and products, or decreases in information technology spending or otherwise, the market for our platform and products might not continue to develop or might develop more slowly than we expect, which could adversely affect our business, financial condition, and results of operations.
Our results of operations are likely to fluctuate from quarter to quarter, which could adversely affect the trading price of our ordinary shares.
Our results of operations, including our revenue, cost of revenue, gross margin, operating expenses, cash flow, and deferred revenue, have fluctuated from quarter to quarter in the past and may continue to vary significantly in the future so that period-to-period comparisons of our results of operations may not be meaningful. Accordingly, our financial results in any one quarter should not be relied upon as indicative of future performance. Our quarterly financial results may fluctuate as a result of a variety of factors, many of which are
19
Table of Contents
outside of our control, may be difficult to predict, and may or may not fully reflect the underlying performance of our business. Factors that may cause fluctuations in our quarterly financial results include:
| • | our ability to attract and retain new customers; |
| • | the loss of existing customers; |
| • | renewals and timing of renewals; |
| • | customer usage of our products; |
| • | customer satisfaction with our products and platform capabilities and customer support; |
| • | our ability to expand sales within our existing customers; |
| • | mergers and acquisitions that might affect our customer base including the consolidation of affiliates’ multiple paid business accounts into a single paid business account; |
| • | mix of our revenue; |
| • | our ability to gain new partners and retain existing partners; |
| • | our ability to convert users of free trials, freemium offerings, and open source version of JFrog Artifactory into subscribing customers; |
| • | increases or decreases in the number of elements of our subscriptions or pricing changes upon any renewals of customer agreements; |
| • | fluctuations in share-based compensation expense; |
| • | decisions by potential customers to purchase alternative solutions; |
| • | decisions by potential customers to develop in-house DevOps technologies as alternatives to our products; |
| • | the amount and timing of operating expenses related to the maintenance and expansion of our business and operations, including investments in research and development, sales and marketing, and general and administrative resources; |
| • | network outages; |
| • | actual or perceived breaches of, or failures relating to, privacy, data protection, or data security; |
| • | the timing of expenses related to the development or acquisition of technologies or businesses and potential future charges for impairment of goodwill from acquired companies; |
| • | general economic, industry, and market conditions; |
| • | the impact of the coronavirus pandemic or other global health crises on our business and general economic conditions; |
| • | the impact of political uncertainty or unrest; |
| • | changes in our pricing policies or those of our competitors; |
| • | fluctuations in the growth rate of the overall market that our products address; |
| • | the budgeting cycles and purchasing practices of customers; |
| • | the business strengths or weakness of our customers; |
| • | our ability to collect timely on invoices or receivables; |
| • | the cost and potential outcomes of future litigation or other disputes; |
| • | future accounting pronouncements or changes in our accounting policies; |
20
Table of Contents
| • | our overall effective tax rate, including impacts caused by any reorganization in our corporate tax structure and any new legislation or regulatory developments; |
| • | our ability to successfully expand our business in the U.S. and internationally; |
| • | fluctuations in the mix of our revenue between self-managed subscriptions and SaaS subscriptions; |
| • | fluctuations in foreign currency exchange rates; and |
| • | the timing and success of new products introduced by us or our competitors or any other change in the competitive dynamics of our industry, including consolidation among competitors, customers or partners. |
The impact of one or more of the foregoing or other factors may cause our results of operations to vary significantly. Such fluctuations could cause us to fail to meet the expectations of investors or securities analysts, which could cause the trading price of our ordinary shares to fall substantially, and we could face costly lawsuits, including securities class action suits.
If we are not able to keep pace with technological and competitive developments or fail to integrate our products with a variety of technologies that are developed by others, our products may become less marketable, less competitive, or obsolete, and our results of operations may be adversely affected.
In order to provide value for our customers, we must offer products that allow our customers to compile software from source code repositories, manage the dependencies among components within software packages, move packages to a universal repository, ingest packages from third parties, including open source libraries, scan for vulnerabilities through various stages, distribute to endpoints, and deploy in production, all through a single user access point. The success of any new product introductions depends on a number of factors including, but not limited to, timely and successful product development, market acceptance, our ability to manage the risks associated with new product releases, the effective management of development and other spending in connection with anticipated demand for new products, and the availability of newly developed products. We have in the past experienced bugs, errors, or other defects or deficiencies in new products and product updates and delays in releasing new products, deployment options, and product enhancements and may have similar experiences in the future. As a result, some of our customers may either defer purchasing our products until the next upgrade is released or switch to a competitor if we are not able to keep up with technological developments.
To keep pace with technological and competitive developments we have in the past invested, and may continue to invest, in the acquisition of complementary businesses, technologies, services, products, and other assets that expand the products that we can offer our customers. We may make these investments without being certain that they will result in products or enhancements that will be accepted by existing or prospective customers or that will achieve market acceptance. If we are unable to successfully enhance our existing products to meet evolving customer requirements, increase adoption and use cases of our products, develop new products, quickly resolve security vulnerabilities, or if our efforts to increase the use cases of our products are more expensive than we expect, then our business, results of operations and financial condition would be adversely affected.
In addition, our success depends on our ability to integrate our products with a variety of third-party technologies. Our technology partnership ecosystem powers significant extensibility of our products and offers our customers the ability to use external tools of their choice with our products and to deploy our products in their preferred environments and successfully support new package technologies as they arise. Further, our SaaS products must be compatible with the major cloud service providers in order to support local hosting of our JFrog-managed products in geographies chosen by our customers. We also benefit from access to public and private vulnerability databases.
Changes in our relationship with any provider, the instability or vulnerability of any third-party technology, or the inability of our products to successfully integrate with third-party technology may adversely affect our
21
Table of Contents
business and results of operations. Any losses or shifts in the market position of these providers in general, in relation to one another or to new competitors or new technologies, could lead to losses in our relationships or customers, or to our need to identify and develop integrations with new third-party technologies. Such changes could consume substantial resources and may not be effective. Further, any expansion into new geographies may require us to integrate our products with new third-party technology and invest in developing new relationships with providers. If we are unable to respond to changes in a cost-effective manner, our products may become less marketable, less competitive, or obsolete and our results of operations may be negatively impacted.
A limited-functionality version of JFrog Artifactory is licensed under an open source license, which could negatively affect our ability to monetize our products and protect our intellectual property rights.
We make a limited-functionality version of JFrog Artifactory that only supports Java-based packages, and also lacks other features required for organization-wide adoption by DevOps teams, available under an open source license, the Affero General Public License version 3.0 (“AGPL”). The AGPL grants licensees broad freedom to view, use, copy, modify, and redistribute the source code of this limited version of JFrog Artifactory. Anyone can download a free copy of this limited version of JFrog Artifactory from the Internet, and we neither know who all of our AGPL licensees are, nor have visibility into how JFrog Artifactory is being used by licensees, so our ability to detect violations of the open source license is extremely limited.
The AGPL has a “copyleft” requirement that further distribution of AGPL-licensed software and modifications or adaptations to that software be made available pursuant to the AGPL as well. This leads some commercial enterprises to consider AGPL-licensed software to be unsuitable for commercial use. However, the AGPL would not prevent a commercial licensee from taking this open source version of JFrog Artifactory under AGPL and using it for internal purposes for free. AGPL also would not prevent a commercial licensee from taking this open source version of JFrog Artifactory under AGPL and using it to compete in our markets by providing it for free.
This competition can develop without the degree of overhead and lead time required by traditional proprietary software companies, due to the permissions allowed under AGPL. It is also possible for competitors to develop their own software based on our open source version of JFrog Artifactory. Although this software would also need to be made available for free under the AGPL, it could reduce the demand for our products and put pricing pressure on our subscriptions. We cannot guarantee that we will be able to compete successfully against current and future competitors, some of which may have greater resources than we have, or that competitive pressure or the availability of new open source software will not result in price reductions, reduced operating margins, and loss of market share, any one of which could harm our business, financial condition, results of operations, and cash flows.
The market for our products is nascent and highly fragmented, and we may not be able to compete successfully against current and future competitors, some of whom have greater financial, technical, and other resources than we do. If we do not compete successfully our business, financial condition, and results of operations could be harmed.
Our platform consists of multiple products and we compete in each product category as well as the entire platform level. The market for our products is highly fragmented, quickly evolving, and subject to rapid changes in technology. We believe that our ability to compete successfully depends upon many factors both within and beyond our control, including the following:
| • | ability to provide an end-to-end, unified platform solution for the CSRM workflow; |
| • | breadth of technologies we support; |
| • | breadth of technology integrations; |
| • | total cost of ownership; |
22
Table of Contents
| • | extensibility across organizations, including software developers, IT operators, and IT managers; |
| • | ability to enable collaboration between software developers and IT operators; |
| • | ability to deploy our products in any combination of cloud, multi-cloud or on-premise environments; |
| • | performance, security, scalability, and reliability; |
| • | quality of customer experience and satisfaction; |
| • | quality of customer support; |
| • | ease of implementation and use; and |
| • | brand recognition and reputation. |
Our products are available for both self-managed and SaaS deployments. While we believe we compete successfully on the above factors, particularly with regards to the comprehensive nature of our solutions, we do experience competition in each of these categories with different vendors:
| • | With respect to self-managed deployments, diversified software companies, such as IBM, Inc. (Red Hat), Pivotal Software, Inc., and VMware, Inc., and developer-focused software companies, such as GitLab Inc. and Sonatype, Inc., have offerings that compete with certain of our products. |
| • | With respect to SaaS deployments, cloud providers, such as Alphabet Inc. (GCP), Amazon.com, Inc. (AWS), and Microsoft Corporation (Azure DevOps including GitHub), have offerings that compete with certain of our products. |
Additionally, we compete with home-grown, start-up, and open source technologies across the categories described above. Many of our competitors have greater financial, technical, and other resources, greater brand recognition, larger sales forces and marketing budgets, broader distribution networks, more diverse product and services offerings, and larger and more mature intellectual property portfolios. They may be able to leverage these resources to gain business in a manner that discourages customers from purchasing our offerings. Furthermore, we expect that our industry will continue to attract new companies, including smaller emerging companies, which could introduce new offerings. We may also expand into new markets and encounter additional competitors in such markets.
JFrog Artifactory is at the core of our business and any decline in demand for JFrog Artifactory occasioned by malfunction, inferior performance, increased competition or otherwise, will impact our business, results of operations and financial condition.
Our subscription structure is aligned with the way we have built our platform, and JFrog Artifactory is at the core of our business and all subscriptions. Accordingly, market acceptance of JFrog Artifactory is critical to our success. If demand for JFrog Artifactory declines, the demand for our other products will also decline. Demand for JFrog Artifactory is affected by a number of factors, many of which are beyond our control, such as continued market acceptance of JFrog Artifactory and products by customers for existing and new use cases, the timing of development and release of new features, functionality, and lower cost alternatives introduced by our competitors, technological changes and developments within the markets we serve, and growth or contraction in our addressable markets. If we are unable to continue to meet customer demand, if our products fail to compete with the products of our competitors, if we fail to achieve more widespread market acceptance of JFrog Artifactory, or if our products fail to meet statutory, regulatory, contractual, or other applicable requirements, then our business, results of operations, and financial condition would be harmed.
23
Table of Contents
If we are unable to increase sales of our subscriptions to new customers, sell additional subscriptions to our existing customers, or expand the value of our existing customers’ subscriptions, our future revenue and results of operations will be harmed.
Our future success depends on our ability to sell our subscriptions to new customers and to expand within our existing customers by selling paid subscriptions to our existing users and expanding the value and number of existing customers’ subscriptions within the organization. Our ability to sell new subscriptions depends on a number of factors, including the prices of our products, the functionality of our products, the prices of products offered by our competitors, and the budgets of our customers. We serve customer needs with multiple tiers of subscriptions that differ based on product depth and functionality. We also offer a limited free trial of our platform and limited freemium versions of some of our products. To the extent that users of our free trial and freemium versions do not become, or lead others not to become, paying customers, we will not realize the intended benefits of these strategies, our expenses may increase as a result of associated hosting costs, and our ability to grow our business may be harmed.
We also offer an open source version of JFrog Artifactory. Our open source version is intended to increase visibility and familiarity of our platform among the developer communities. We invest in developers and developer communities through multiple channels, including the introduction of new open source projects, as well as through our annual developer conference, swampUP, and other community-centered events. There is no guarantee that such events will translate into new customers, or that freemium and open source users will convert to paying subscribers.
In addition, a significant aspect of our sales and marketing focus is to expand deployments within existing customers. The rate at which our customers purchase additional subscriptions and expand the value of existing subscriptions depends on a number of factors, including customers’ level of satisfaction with our products, the nature and size of the deployments, the desire to address additional use cases, and the perceived need for additional features, as well as general economic conditions. If our customers do not recognize the potential of our products, our business would be materially and adversely affected.
Seasonality may cause fluctuations in our sales and results of operations.
Historically, we have experienced seasonality in customer bookings, as we typically enter into a higher percentage of subscription agreements with new customers and renewals with existing customers in the fourth quarter of the year. We believe that this results from the procurement, budgeting, and deployment cycles of many of our customers, particularly our enterprise customers. We expect that this seasonality will continue to affect our bookings, deferred revenue, and our results of operations in the future and might become more pronounced as we continue to target larger enterprise customers.
In addition, we have historically experienced seasonality in usage patterns by users of our SaaS subscriptions. We typically experience reduced usage by our customers during holiday periods, particularly at the end of the fourth quarter. As revenue from our SaaS subscriptions is recognized based upon usage, the changes in usage patterns may negatively affect revenues from our SaaS subscriptions and our results of operations.
If our existing customers do not renew their subscriptions, it could have an adverse effect on our business and results of operations.
We expect to derive a significant portion of our revenue from renewals of existing subscriptions. Our customers have no contractual obligation to renew their subscriptions after the completion of their subscription term. Our self-managed subscriptions are offered on an annual and multi-year basis, and SaaS subscriptions are offered on an annual basis, with the exception of certain SaaS subscriptions, which are also offered on a monthly basis. For our JFrog-managed products, we also offer subscriptions for committed usage amounts. Our customers’ renewals may decline or fluctuate as a result of a number of factors, including their satisfaction with
24
Table of Contents
our products and our customer support, the frequency and severity of product outages, our product uptime or latency, the pricing of our, or competing, products, additional new features and capabilities that we offer, new integrations, and updates to our products as a result of updates by technology partners. If our customers renew their subscriptions, they may renew for shorter subscription terms or on other terms that are less economically beneficial to us. Furthermore, our self-managed products are sold with perpetual licenses and we depend on the deployment of material updates to such products to drive renewals. If we do not provide material updates to these products, customers may not renew their existing subscriptions and may continue to use our products under the original license instead. We may not accurately predict future renewal trends. If our customers do not renew their subscriptions, or renew on less favorable terms, our revenue may grow more slowly than expected or decline.
We recognize a significant portion of revenue from subscriptions over the term of the relevant subscription period, and as a result, downturns or upturns in sales are not immediately reflected in full in our results of operations.
We recognize a significant portion of our subscription revenue over the term of the relevant subscription period. As a result, much of the subscription revenue we report each fiscal quarter is the recognition of deferred revenue from subscription contracts entered into during previous fiscal quarters. Consequently, a decline in new or renewed subscriptions in any one fiscal quarter will not be fully or immediately reflected in revenue in that fiscal quarter and will negatively affect our revenue in future fiscal quarters. Accordingly, the effect of significant downturns in new or renewed sales of our subscriptions is not reflected in full in our results of operations until future periods.
A real or perceived defect, security vulnerability, error, or performance failure in our software could cause us to lose revenue, damage our reputation, and expose us to liability.
Our products are inherently complex and, despite extensive testing and quality control, have in the past and may in the future contain defects or errors, especially when first introduced, or not perform as contemplated. These defects, security vulnerabilities, errors, or performance failures could cause damage to our reputation, loss of customers or revenue, order cancellations, service terminations, or lack of market acceptance of our software. As the use of our products, including products that were recently acquired or developed, expands to more sensitive, secure, or mission critical uses by our customers, we may be subject to increased scrutiny, potential reputational risk, or potential liability should our software fail to perform as contemplated in such deployments. We have in the past and may in the future need to issue corrective releases of our software to fix these defects, errors or performance failures, which could require us to allocate significant research and development and customer support resources to address these problems.
Any limitation of liability provisions that may be contained in our customer, user, third-party vendor, service provider, and partner agreements may not be enforceable or adequate or effective as a result of existing or future applicable law or unfavorable judicial decisions, and they may not function to limit our liability arising from regulatory enforcement. The sale and support of our products entail the risk of liability claims, which could be substantial in light of the use of our products in enterprise-wide environments. In addition, our insurance against this liability may not be adequate to cover a potential claim and potentially may be subject to exclusions, or that the insurer will deny coverage as to any future claim or exclude from our coverage such claims in policy renewals. The denial of our claims by our insurer or the successful assertion of claims by others against us that exceed available insurance coverage, or the occurrence of changes in our insurance policies, including premium increases or the imposition of large deductible or co-insurance requirements, could have a material adverse effect on our business, including our financial condition, results of operations and reputation.
Incorrect implementation or use of, or our customers’ failure to update, our software could result in customer dissatisfaction and negatively affect our business, operations, financial results, and growth prospects.
Our products are often operated in large scale, complex IT environments. Our customers and some partners require training and experience in the proper use of and the benefits that can be derived from our products to
25
Table of Contents
maximize their potential. If users of our products do not implement, use, or update our products correctly or as intended, then inadequate performance and/or security vulnerabilities may result. Because our customers rely on our software to manage a wide range of operations, the incorrect implementation, use of, or our customers’ failure to update, our software or our failure to train customers on how to use our software productively may result in customer dissatisfaction, and negative publicity and may adversely affect our reputation and brand. Our failure to effectively provide training and implementation services to our customers could result in lost opportunities for follow-on sales to these customers and decrease subscriptions by new customers, which would adversely affect our business and growth prospects.
Interruptions or performance problems associated with our technology and infrastructure, and our reliance on technologies from third parties, may adversely affect our business operations and financial results.
We outsource substantially all of the infrastructure relating to our cloud products to third-party cloud providers chosen by our customers. Customers of our SaaS offerings need to be able to access our platform at any time, without interruption or degradation of performance, and we provide them with service-level commitments with respect to uptime. Third-party cloud providers run their own platforms that we access, and we are, therefore, vulnerable to their service interruptions and any changes in their product offerings. Any limitation on the capacity of our third-party hosting services could impede our ability to onboard new customers or expand the usage of our existing customers, which could adversely affect our business, financial condition, and results of operations. In addition, any incident affecting our third-party hosting services’ infrastructure that may be caused by cyber-attacks, natural disasters, fire, flood, severe storm, earthquake, power loss, telecommunications failures, terrorist or other attacks, protests or riots, and other similar events beyond our control could negatively affect our cloud-based and multi-cloud hybrid products. It is also possible that our customers and regulators would seek to hold us accountable for any breach of security affecting a third-party cloud provider’s infrastructure and we may incur significant liability in investigating such an incident and responding to any claims, investigations, or proceedings made or initiated by those customers, regulators, and other third parties. We may not be able to recover a material portion of such liabilities from any of our third-party cloud providers. It may also become increasingly difficult to maintain and improve our performance, especially during peak usage times, as our software becomes more complex and the usage of our software increases. Moreover, our insurance may not be adequate to cover such liability and may be subject to exclusions. Any of the above circumstances or events may harm our business, results of operations, and financial condition.
In addition, our website and internal technology infrastructure may experience performance issues due to a variety of factors, including infrastructure changes, human or software errors, website or third-party hosting disruptions, capacity constraints, technical failures, natural disasters, or fraud or security attacks. Our use and distribution of open source software may increase this risk. If our website is unavailable or our users are unable to download our products or order subscriptions or services within a reasonable amount of time or at all, our business could be harmed. We expect to continue to make significant investments to maintain and improve website performance and to enable rapid releases of new features and applications for our products. To the extent that we do not effectively upgrade our systems as needed and continually develop our technology to accommodate actual and anticipated changes in technology, our business and results of operations may be harmed.
In the event that our service agreements with our third-party hosting services are terminated, or there is a lapse of service, elimination of services or features that we utilize, interruption of internet service provider connectivity or damage to such facilities, we could experience interruptions in access to our platform as well as significant delays and additional expense in arranging or creating new facilities and services and/or re-architecting our cloud solution for deployment on a different cloud infrastructure service provider, which could adversely affect our business, financial condition, and results of operations.
We also rely on cloud technologies from third parties in order to operate critical functions of our business, including financial management services, relationship management services, and lead generation management
26
Table of Contents
services. If these services become unavailable due to extended outages or interruptions or because they are no longer available on commercially reasonable terms or prices, our expenses could increase, our ability to manage our finances could be interrupted, our processes for managing sales of our products and supporting our customers could be impaired, and our ability to generate and manage sales leads could be weakened until equivalent services, if available, are identified, obtained, and implemented, any of which could harm our business and results of operations.
We typically provide service-level commitments under our subscription agreements. If we fail to meet these contractual commitments, we could be obligated to provide credits for future service or face subscription termination with refunds of prepaid amounts, which would lower our revenue and harm our business, financial condition, and results of operations.
Our subscription agreements typically contain service-level commitments. If we are unable to meet the stated service-level commitments, including failure to meet the uptime and response time requirements under our customer subscription agreements, we may be contractually obligated to provide these customers with service credits which could significantly affect our revenue in the periods in which the failure occurs and the credits are applied. We could also face subscription terminations and a reduction in renewals, which could significantly affect both our current and future revenue. We offer multiple tiers of subscriptions to our products and as such our service-level commitments will increase if more customers choose subscriptions of JFrog Pro X, JFrog Enterprise, and JFrog Enterprise Plus. Any service-level failures could also damage our reputation, which could also adversely affect our business, financial condition and results of operations.
We depend on our executive officers and other key employees, and the loss of one or more of these employees or an inability to attract and retain highly skilled employees could harm our business.
Our future success depends, in part, on our ability to continue to attract and retain highly skilled personnel. The loss of the services of any of our key personnel, the inability to attract or retain qualified personnel, or delays in hiring required personnel, particularly in engineering and sales, may seriously harm our business, financial condition, and results of operations. Although we have entered into employment offer letters with our key personnel, the employment of employees in the United States is for no specific duration and constitutes at-will employment. We are also substantially dependent on the continued service of our existing engineering personnel because of the complexity of our products.
Our future performance also depends on the continued services and continuing contributions of our senior management to execute on our business plan and to identify and pursue new opportunities and product innovations. The loss of services of senior management could significantly delay or prevent the achievement of our development and strategic objectives, which could adversely affect our business, financial condition, and results of operations.
Additionally, the industry in which we operate is generally characterized by significant competition for skilled personnel as well as high employee attrition. There is currently a high demand for experienced DevOps professionals and we may not be successful in attracting, integrating or retaining qualified personnel to fulfill our current or future needs. Also, to the extent we hire personnel from competitors, we may be subject to allegations that they have been improperly solicited, that they have divulged proprietary or other confidential information, or that their former employers own their inventions or other work product.
To execute our growth plan, we must attract and retain highly qualified personnel. Competition for these employees is intense, specifically for engineers for research and development and support positions who are experienced in DevOps, and such competition often results in increasing wages, especially in Israel, where most of our research and development positions are located, and in the San Francisco Bay Area, where we have a significant presence. Therefore, we may not be successful in attracting and retaining qualified personnel. We have from time to time in the past experienced, and we expect to continue to experience, difficulty in hiring and
27
Table of Contents
retaining highly skilled employees with appropriate qualifications. Our recent hires and planned hires may not become as productive as we expect, and we may be unable to hire, integrate or retain sufficient numbers of qualified individuals. Many of the companies with which we compete for experienced personnel have greater resources than we have and due to our profile and market position, such competitors actively seek to hire skilled personnel away from us, even if such employee has entered into a non-compete agreement. Israeli labor courts have required employers seeking to enforce non-compete undertakings of a former employee to demonstrate that the competitive activities of the former employee will harm one of a limited number of material interests of the employer that have been recognized by the courts, such as the protection of a company’s trade secrets or other intellectual property. We may not be able to make such a demonstration.
In addition, in making employment decisions, particularly in the internet and high-technology industries, job candidates often consider the value of the equity they are to receive in connection with their employment. Employees may be more likely to leave us if the shares they own or the shares underlying their equity incentive awards have significantly appreciated or significantly reduced in value. Many of our employees may receive significant proceeds from sales of our equity in the public markets, which may reduce their motivation to continue to work for us and could lead to employee attrition. If we fail to attract new personnel, or fail to retain and motivate our current personnel, our business and growth prospects could be harmed.
If we are not able to maintain and enhance our brand, especially among developers and IT operators, our business and results of operations may be adversely affected.
We believe that developing and maintaining widespread awareness of our brand, especially with developers and IT operators, is critical to achieving widespread acceptance of our software and attracting new users and customers. Brand promotion activities may not generate user or customer awareness or increase revenue, and even if they do, any increase in revenue may not offset the expenses we incur in building our brand. If we fail to successfully promote and maintain our brand, we may fail to attract or retain users and customers necessary to realize a sufficient return on our brand-building efforts, or to achieve the widespread brand awareness that is critical for broad customer adoption of our products.
Our corporate culture has contributed to our success, and if we cannot maintain this culture as we grow, we could lose the innovation, creativity, and entrepreneurial spirit we have worked to foster, which could harm our business.
We believe that our culture has been and will continue to be a key contributor to our success. We expect to continue to hire aggressively as we expand. If we do not continue to maintain our corporate culture as we grow, we may be unable to foster the innovation, creativity, and entrepreneurial spirit we believe we need to support our growth. If our existing employees receive proceeds from our sale of ordinary shares as previously described in these risk factors, it could lead to disparities of wealth among our employees that could adversely affect relations among employees and our culture in general. Our substantial anticipated headcount growth and our continued operation as a public company may result in a change to our corporate culture, which could harm our business.
Our ability to achieve customer renewals and increase sales of our products is highly dependent on the quality of our customer support, and our failure to offer high quality support would have an adverse effect on our business, reputation, and results of operations.
Our customers depend on our customer support to resolve issues and realize the full benefits relating to our products. If we do not succeed in helping our customers quickly resolve post-deployment issues or provide effective ongoing support and education on our products, our ability to sell additional subscriptions to, or renew subscriptions with, existing customers or expand the value of existing customers’ subscriptions would be adversely affected and our reputation with potential customers could be damaged. Many larger enterprise customers have more complex IT environments and require higher levels of support than smaller customers. If we fail to meet the requirements of these enterprise customers, it may be more difficult to grow sales with them.
28
Table of Contents
Additionally, it can take several months to recruit, hire, and train qualified engineering-level customer support employees. We may not be able to hire such resources fast enough to keep up with demand, particularly if the sales of our products exceed our internal forecasts. To the extent that we are unsuccessful in hiring, training, and retaining adequate support resources, our ability to provide adequate and timely support to our customers, and our customers’ satisfaction with our products, will be adversely affected. Our failure to provide and maintain high-quality support services would have an adverse effect on our business, reputation, and results of operations.
We currently primarily rely on an inbound sales model that may not continue to be as successful as we anticipate, and the absence of a large, direct, traditional sales function may impede the growth of our business.
We currently primarily rely on an inbound sales model that may not continue to be as successful as we anticipate, and the absence of a large, direct, traditional sales function may impede our future growth. We have begun building a small, high-touch strategic sales team to identify new use cases and drive expansion and standardization on JFrog within our largest customers. There is no guarantee however that this high-touch strategic sales team will be successful. Moreover, we are not able to predict whether the deployment of our high-touch strategic sales team may adversely affect our inbound sales model. If our efforts to sell subscriptions to new customers and to expand deployments with existing customers are not successful, our total revenue and revenue growth rate may decline and our business will suffer.
Further, as we continue to scale our business, a more traditional sales infrastructure could assist in reaching larger enterprise customers and growing our revenue. Identifying, recruiting, and training such a qualified sales force would require significant time, expense and attention and would significantly impact our business model. We believe that there is significant competition for sales personnel, including sales representatives, sales managers, and sales engineers, with the skills and technical knowledge that we require. Our ability to achieve revenue growth will depend, in large part, on our success in recruiting, training, and retaining sufficient numbers of sales personnel to support our growth. New hires require significant training and may take significant time before they achieve full productivity.
In addition, expanding our sales infrastructure would considerably change our cost structure and results of operations, and we may have to reduce other expenses, such as our research and development expenses, in order to accommodate a corresponding increase in marketing and sales expenses, and maintain positive operating cash flow and free cash flow. Moreover, recent hires and planned hires may not become productive as quickly as we expect, and we may be unable to hire or retain sufficient numbers of qualified individuals in the markets where we do business or plan to do business. In addition, particularly if we continue to grow rapidly, a large percentage of our sales force will have relatively little experience working with us, our subscriptions and our business model. If our lack of a large, direct enterprise sales force limits us from reaching larger enterprise customers and growing our revenue and we are unable to hire, develop, and retain talented sales personnel in the future, our revenue growth and results of operations may be harmed.
The sales prices of our products may fluctuate or decline, which may reduce our revenue and gross profit and adversely affect our financial results.
The sales prices for our products may fluctuate or decline for a variety of reasons, including competitive pricing pressures, discounts, anticipation of the introduction of new products, or promotional programs. Competition continues to increase in the market segments in which we participate, and we expect competition to further increase in the future, thereby leading to increased pricing pressures. Larger competitors with more diverse offerings may reduce the price of offerings that compete with ours or may bundle them with other offerings and provide for free. Additionally, currency fluctuations in certain countries and regions may negatively impact actual prices that customers and partners are willing to pay in those countries and regions. Any decrease in the sales prices for our products, without a corresponding decrease in costs or increase in volume,
29
Table of Contents
would adversely affect our revenue and gross profit. Revenue and gross profit would also be adversely affected by a shift in mix of our subscriptions from self-managed to our SaaS offerings, which have a lower gross margin. We cannot assure you that we will be able to maintain our prices and gross profits at levels that will allow us to achieve and maintain profitability.
Further, we have in the past, and expect in the future, to need to change our pricing model from time to time. While we do and will attempt to set prices based on our prior experiences and customer feedback, our assessments may not be accurate, and we could be underpricing or overpricing our products. In addition, if our subscriptions change, then we may need to revise our pricing strategies. Any such changes to our pricing strategies or our ability to efficiently price our offerings could adversely affect our business, results of operations and financial condition. Pricing pressures and decisions could result in reduced sales, reduced margins, losses or the failure of our products to achieve or maintain more widespread market acceptance, any of which could negatively impact our overall business, results of operations and financial condition.
We expect our revenue mix to vary over time, which could harm our gross margin and results of operations.
We expect our revenue mix to vary over time due to a number of factors, including the mix of our subscriptions for self-managed and our SaaS offerings. Due to the differing revenue recognition policies applicable to our self-managed and SaaS subscriptions, shifts in our business mix from quarter to quarter could produce substantial variation in revenue recognized. Further, our gross margins and results of operations could be harmed by changes in revenue mix and costs, together with numerous other factors, including entry into new markets or growth in lower margin markets; entry into markets with different pricing and cost structures; pricing discounts; and increased price competition. Any one of these factors or the cumulative effects of certain of these factors may result in significant fluctuations in our gross margin and results of operations. This variability and unpredictability could result in our failure to meet internal expectations or those of securities analysts or investors for a particular period. If we fail to meet or exceed such expectations for these or any other reasons, the market price of our ordinary shares could decline.
The length of our sales cycle can be unpredictable, particularly with respect to sales to large customers, and our sales efforts may require considerable time and expense.
Our results of operations may fluctuate, in part, because of the length and variability of the sales cycle of our subscriptions and the difficulty in making short-term adjustments to our operating expenses. Our results of operations depend in part on sales to new large customers and increasing sales to existing customers. The length of our sales cycle, from initial contact from a prospective customer to contractually committing to our paid subscriptions can vary substantially from customer to customer based on deal complexity as well as whether a sale is made directly by us. It is difficult to predict exactly when, or even if, we will make a sale to a potential customer or if we can increase sales to our existing customers. As a result, large individual sales have, in some cases, occurred in quarters subsequent to those we anticipated, or have not occurred at all. Because a substantial proportion of our expenses are relatively fixed in the short term, our results of operations will suffer if revenue falls below our expectations in a particular quarter, which could cause the price of our ordinary shares to decline.
Our relatively limited operating history makes it difficult to evaluate our current business and prospects and may increase the risks associated with your investment.
We were founded in 2008. Our relatively limited operating history makes it difficult to evaluate our current business and our future prospects, including our ability to plan for and model future growth. We have encountered and will continue to encounter risks and difficulties frequently experienced by rapidly growing companies in constantly evolving industries. If we do not address these risks successfully, our business and results of operations will be adversely affected, and the market price of our ordinary shares could decline.
Further, we have limited historical financial data and we operate in a rapidly evolving market. As such, any predictions about our future revenue and expenses may not be as accurate as they would be if we had a longer operating history or operated in a more predictable market.
30
Table of Contents
We rely on traditional web search engines to direct traffic to our website. If our website fails to rank prominently in unpaid search results, traffic to our website could decline and our business would be adversely affected.
Our success depends in part on our ability to attract users through unpaid Internet search results on traditional web search engines such as Google. The number of users we attract to our website from search engines is due in large part to how and where our website ranks in unpaid search results. These rankings can be affected by a number of factors, many of which are not in our direct control, and they may change frequently. For example, a search engine may change its ranking algorithms, methodologies or design layouts. As a result, links to our website may not be prominent enough to drive traffic to our website, and we may not know how or otherwise be in a position to influence the results. Any reduction in the number of users directed to our website could reduce our revenue or require us to increase our customer acquisition expenditures.
Unfavorable conditions in our industry or the global economy or reductions in information technology spending could limit our ability to grow our business and negatively affect our results of operations.
Our results of operations may vary based on the impact of changes in our industry or the global economy on us or our customers. Current or future economic uncertainties or downturns could adversely affect our business and results of operations. Negative conditions in the general economy both in the United States and abroad, including conditions resulting from changes in gross domestic product growth, financial, and credit market fluctuations, political turmoil, natural catastrophes, the coronavirus pandemic, warfare, protests and riots, and terrorist attacks on the United States, Europe, the Asia Pacific region, or elsewhere, could cause a decrease in business investments by our customers and potential customers, including spending on information technology, and negatively affect the growth of our business. To the extent our products are perceived by customers and potential customers as discretionary, our revenue may be disproportionately affected by delays or reductions in general information technology spending. Also, customers may choose to develop in-house software as an alternative to using our products. Moreover, competitors may respond to market conditions by lowering prices. We cannot predict the timing, strength or duration of any economic slowdown, instability or recovery, generally or within any particular industry. If the economic conditions of the general economy or markets in which we operate do not improve, or worsen from present levels, our business, results of operations, and financial condition could be adversely affected.
We have acquired, and may acquire, other businesses which could require significant management attention, disrupt our business, dilute shareholder value, and adversely affect our results of operations.
As part of our business strategy, we may acquire or make investments in complementary companies, products or technologies. We have in the past acquired, and expect in the future to acquire, businesses that we believe will complement or augment our existing business. For example, in February 2019 we acquired 100% of the shares of Shippable Inc., a privately held cloud-based continuous integration and delivery platform. The identification of suitable acquisition candidates is difficult, and we may not be able to complete such acquisitions on favorable terms, if at all. If we do complete future acquisitions, we may not ultimately strengthen our competitive position or achieve our goals and business strategy, we may be subject to claims or liabilities assumed from an acquired company, product, or technology, and any acquisitions we complete could be viewed negatively by our customers, investors, and securities analysts. In addition, if we are unsuccessful at integrating future acquisitions, or the technologies associated with such acquisitions, into our company, the revenue and results of operations of the combined company could be adversely affected. Any integration process may require significant time and resources, which may disrupt our ongoing business and divert management’s attention, and we may not be able to manage the integration process successfully.
We may have to pay cash, incur debt, or issue equity or equity-linked securities to pay for any future acquisitions, each of which could adversely affect our financial condition or the market price of our ordinary shares. The sale of equity or issuance of equity-linked debt to finance any future acquisitions could result in
31
Table of Contents
dilution to our shareholders. The incurrence of indebtedness would result in increased fixed obligations and could also include covenants or other restrictions that would impede our ability to manage our operations. The occurrence of any of these risks could harm our business, results of operations, and financial condition.
Our failure to raise additional capital or generate the significant capital necessary to expand our operations and invest in new products could reduce our ability to compete and could harm our business.
Historically, we have funded our operations and capital expenditures primarily through equity issuances and cash generated from our operations. Although we currently anticipate that our existing cash and cash equivalents and operating cash flow will be sufficient to meet our cash needs for the next twelve months, we may require additional financing. We evaluate financing opportunities from time to time, and our ability to obtain financing will depend, among other things, on our development efforts, business plans, operating performance, and condition of the capital markets at the time we seek financing. We cannot assure you that additional financing will be available to us on favorable terms when required, or at all. If we raise additional funds through the issuance of equity or equity-linked or debt securities, those securities may have rights, preferences or privileges senior to the rights of our ordinary shares, and our shareholders may experience dilution.
If we need additional capital and cannot raise it on acceptable terms, we may not be able to, among other things:
| • | develop or enhance our products; |
| • | continue to expand our research and development and sales and marketing organizations; |
| • | acquire complementary technologies, products or businesses; |
| • | expand operations in the United States or internationally; |
| • | hire, train, and retain employees; or |
| • | respond to competitive pressures or unanticipated working capital requirements. |
Our failure to have sufficient capital to do any of these things could harm our business, financial condition, and results of operations.
A minor portion of our revenue is generated by sales to government entities, which are subject to a number of challenges and risks.
Sales to government entities are subject to a number of risks. Selling to government entities can be highly competitive, expensive, and time-consuming, often requiring significant upfront time and expense without any assurance that these efforts will generate a sale. Government certification requirements for products like ours may change, thereby restricting our ability to sell into the U.S. federal government, U.S. state governments, or non-U.S. government sectors until we have attained such revised certification or certifications. Government demand and payment for our products may be affected by public sector budgetary cycles and funding authorizations, with funding reductions or delays adversely affecting public sector demand for our products. Additionally, any actual or perceived privacy, data protection, or data security incident, or even any perceived defect with regard to our practices or measures in these areas, may negatively impact public sector demand for our products.
Additionally, we rely on certain partners to provide technical support services to certain of our government entity customers to resolve any issues relating to our products. If our partners do not effectively assist our government entity customers in deploying our products, succeed in helping our government entity customers quickly resolve post-deployment issues, or provide effective ongoing support, our ability to sell additional products to new and existing government entity customers would be adversely affected and our reputation could be damaged.
32
Table of Contents
Government entities may have statutory, contractual, or other legal rights to terminate contracts with us for convenience or due to a default, and any such termination may adversely affect our future results of operations. Governments routinely investigate and audit government contractors’ administrative processes, and any unfavorable audit could result in the government refusing to continue buying our subscriptions, a reduction of revenue, or fines or civil or criminal liability if the audit uncovers improper or illegal activities, which could adversely affect our results of operations in a material way.
Risks Related to our Intellectual Property
Failure to protect our proprietary technology and intellectual property rights could substantially harm our business and results of operations.
Our success depends to a significant degree on our ability to protect our proprietary technology, methodologies, know-how, and brand. We rely on a combination of trademarks, copyrights, patents, contractual restrictions, and other intellectual property laws and confidentiality procedures to establish and protect our proprietary rights. However, we make certain products, including a limited-functionality version of JFrog Artifactory, available under open source licenses, contribute other source code to open source projects under open source licenses, and release internal software projects under open source licenses, and anticipate doing so in the future. Because the source code for the open source version of JFrog Artifactory and any other software we contribute to open source projects or distribute under open source licenses is publicly available, our ability to monetize and protect our intellectual property rights with respect to such source code may be limited or, in some cases, lost entirely. Our competitors could access such source code and use it to create software and service offerings that compete with ours.
Further, the steps we take to protect our intellectual property rights may be inadequate. We will not be able to protect our intellectual property rights if we are unable to enforce our rights or if we do not detect unauthorized use of our intellectual property rights. If we fail to protect our intellectual property rights adequately, our competitors may gain access to our proprietary technology and our business may be harmed. In addition, defending our intellectual property rights might entail significant expense. Any patents, trademarks, or other intellectual property rights that we have or may obtain may be challenged by others or invalidated through administrative process or litigation. As of December 31, 2020, we had 12 U.S. patent applications including one pending U.S. provisional patent. There can be no assurance that our patent applications will result in issued patents. Even if we continue to seek patent protection in the future, we may be unable to obtain further patent protection for our technology. In addition, any patents issued in the future may not provide us with competitive advantages, or may be successfully challenged by third parties. Furthermore, legal standards relating to the validity, enforceability, and scope of protection of intellectual property rights are uncertain.
Despite our precautions, it may be possible for unauthorized third parties to copy our products and use information that we regard as proprietary to create offerings that compete with ours. Effective patent, trademark, copyright, and trade secret protection may not be available to us in every country in which our products are available. We may be unable to prevent third parties from acquiring domain names or trademarks that are similar to, infringe upon, or diminish the value of our trademarks and other proprietary rights. The laws of some countries may not be as protective of intellectual property rights as those in the United States, and mechanisms for enforcement of intellectual property rights may be inadequate. As we continue to expand our international activities, our exposure to unauthorized copying and use of our products and proprietary information will likely increase. Accordingly, despite our efforts, we may be unable to prevent third parties from infringing upon or misappropriating our intellectual property.
We enter into confidential, non-compete, proprietary, and inventions assignment agreements with our employees and consultants and enter into confidentiality agreements with other parties. No assurance can be given that these agreements will be effective in controlling access to and distribution of our proprietary information, especially in certain states and countries, including Israel, that are less willing to enforce such
33
Table of Contents
agreements. Further, these agreements may not prevent our competitors from independently developing technologies that are substantially equivalent or superior to our products.
In order to protect our intellectual property rights, we may be required to spend significant resources to monitor and protect our intellectual property rights. Litigation may be necessary in the future to enforce our intellectual property rights and to protect our trade secrets. Litigation brought to protect and enforce our intellectual property rights could be costly, time-consuming, and distracting to management, and could result in the impairment or loss of portions of our intellectual property. Further, our efforts to enforce our intellectual property rights may be met with defenses, counterclaims, and countersuits attacking the validity and enforceability of our intellectual property rights. Our inability to protect our proprietary technology against unauthorized copying or use, as well as any costly litigation or diversion of our management’s attention and resources, could delay further sales or the implementation of our products, impair the functionality of our products, delay introductions of new products, result in our substituting inferior or more costly technologies into our products, or injure our reputation.
We could incur substantial costs as a result of any claim of infringement, misappropriation or violation of another party’s intellectual property rights.
In recent years, there has been significant litigation involving patents and other intellectual property rights in the software industry. We do not currently have a large patent portfolio, which could prevent us from deterring patent infringement claims through our own patent portfolio, and our competitors and others may now and in the future have significantly larger and more mature patent portfolios than we have. We could incur substantial costs in prosecuting or defending any intellectual property litigation. If we sue to enforce our rights or are sued by a third party that claims that our products infringe, misappropriate or violate their rights, the litigation could be expensive and could divert our management resources.
Any intellectual property litigation to which we might become a party, or for which we are required to provide indemnification, may require us to do one or more of the following:
| • | cease selling or using products that incorporate or cover the intellectual property rights that we allegedly infringe, misappropriate or violate; |
| • | make substantial payments for legal fees, settlement payments or other costs or damages; |
| • | obtain a license, which may not be available on reasonable terms or at all, to sell or use the relevant technology; or |
| • | redesign the allegedly infringing products to avoid infringement, misappropriation or violation, which could be costly, time-consuming or impossible. |
If we are required to make substantial payments or undertake any of the other actions noted above as a result of any intellectual property infringement, misappropriation or violation claims against us or any obligation to indemnify our customers for such claims, such payments or actions could harm our business.
We may become subject to claims for remuneration or royalties for assigned service invention rights by our employees, which could result in litigation and would adversely affect our business.
A significant portion of our intellectual property has been developed by our employees in the course of their employment for us. Under the Israeli Patents Law, 5727-1967 (the “Patents Law”), inventions conceived by an employee in the course and as a result of or arising from his or her employment with a company are regarded as “service inventions,” which belong to the employer, absent a specific agreement between the employee and employer giving the employee service invention rights. The Patents Law also provides that if there is no such agreement between an employer and an employee, the Israeli Compensation and Royalties Committee (the “Committee”), a body constituted under the Patents Law, shall determine whether the employee is entitled to
34
Table of Contents
remuneration for his or her inventions. Case law clarifies that the right to receive consideration for “service inventions” can be waived by the employee and that in certain circumstances, such waiver does not necessarily have to be explicit. The Committee will examine, on a case-by-case basis, the general contractual framework between the parties, applying interpretation rules of the general Israeli contract laws. Further, the Committee has not yet determined one specific formula for calculating this remuneration, but rather uses the criteria specified in the Patents Law. Although we generally enter into assignment-of-invention agreements with our employees pursuant to which such individuals assign to us all rights to any inventions created in the scope of their employment or engagement with us, we may face claims demanding remuneration in consideration for assigned inventions. As a consequence of such claims, we could be required to pay additional remuneration or royalties to our current and former employees, or be forced to litigate such claims, which could negatively affect our business.
Indemnity provisions in various agreements potentially expose us to substantial liability for intellectual property infringement, misappropriation, violation, and other losses.
Our agreements with customers and other third parties may include indemnification provisions under which we agree to indemnify them for losses suffered or incurred as a result of claims of intellectual property infringement, misappropriation or violation, damages caused by us to property or persons, or other liabilities relating to or arising from our software, services or other contractual obligations. Large indemnity payments could harm our business, results of operations, and financial condition. Pursuant to certain agreements we do not have a cap on our liability and any payments under such agreements would harm our business, results of operations, and financial condition. Although we normally contractually limit our liability with respect to such indemnity obligations, we may still incur substantial liability related to them. Any dispute with a customer with respect to such obligations could have adverse effects on our relationship with that customer and other existing customers and new customers and harm our business and results of operations.
Our use of open source software could negatively affect our ability to sell our products and subject us to possible litigation.
Our paid products incorporate open source software, and we expect to continue to incorporate open source software in our paid products in the future. Few of the licenses applicable to open source software have been interpreted by courts, and there is a risk that these licenses could be construed in a manner that could impose unanticipated conditions or restrictions on our ability to commercialize our paid products. Moreover, we cannot assure you that we have not used additional open source software in our software in a manner that is inconsistent with the terms of the applicable license or our current policies and procedures. If we fail to comply with these licenses, we may be subject to certain requirements, including requirements that we offer additional portions of our solutions for no cost, that we make available additional source code for modifications or derivative works we create based upon, incorporating or using the open source software, and that we license such modifications or derivative works under the terms of applicable open source licenses. If an author or other third party that distributes such open source software were to allege that we had not complied with the conditions of one or more of these licenses, we could be required to incur significant legal expenses defending against such allegations and could be subject to significant damages, enjoined from the sale of our products that contained the open source software and required to comply with onerous conditions or restrictions on these products, which could disrupt the distribution and sale of these products. In addition, there have been claims challenging the ownership rights in open source software against companies that incorporate open source software into their products, and the licensors of such open source software provide no warranties or indemnities with respect to such claims. In any of these events, we and our customers could be required to seek licenses from third parties in order to continue offering our products, and to re-engineer our products or discontinue the sale of our products in the event re-engineering cannot be accomplished on a timely basis. We and our customers may also be subject to suits by parties claiming infringement, misappropriation or violation due to the reliance by our solutions on certain open source software, and such litigation could be costly for us to defend or subject us to an injunction. Some open source projects provided on an “as-is” basis have known vulnerabilities and architectural instabilities which, if
35
Table of Contents
not properly addressed, could negatively affect the performance of our product. Any of the foregoing could require us to devote additional research and development resources to re-engineer our solutions, could result in customer dissatisfaction, and may adversely affect our business, results of operations, and financial condition.
Risks Related to Privacy, Data Protection and Cyber security We are subject to stringent and changing laws, regulations, standards, and contractual obligations related to privacy, data protection, and data security. Our actual or perceived failure to comply with such obligations could harm our business.
We receive, collect, store, process, transfer, and use personal information and other data relating to users of our products, our employees and contractors, and other persons. We have legal and contractual obligations regarding the protection of confidentiality and appropriate use of certain data, including personal information. We are subject to numerous federal, state, local, and international laws, directives, and regulations regarding privacy, data protection, and data security and the collection, storing, sharing, use, processing, transfer, disclosure, and protection of personal information and other data, the scope of which are changing, subject to differing interpretations, and may be inconsistent among jurisdictions or conflict with other legal and regulatory requirements. We are also subject to certain contractual obligations to third parties related to privacy, data protection and data security. We strive to comply with our applicable policies and applicable laws, regulations, contractual obligations, and other legal obligations relating to privacy, data protection, and data security to the extent possible. However, the regulatory framework for privacy, data protection and data security worldwide is, and is likely to remain for the foreseeable future, uncertain and complex, and it is possible that these or other actual or alleged obligations may be interpreted and applied in a manner that we do not anticipate or that is inconsistent from one jurisdiction to another and may conflict with other legal obligations or our practices. Further, any significant change to applicable laws, regulations or industry practices regarding the collection, use, retention, security or disclosure of data, or their interpretation, or any changes regarding the manner in which the consent of users or other data subjects for the collection, use, retention or disclosure of such data must be obtained, could increase our costs and require us to modify our services and features, possibly in a material manner, which we may be unable to complete, and may limit our ability to store and process user data or develop new services and features.
If we were found in violation of any applicable laws or regulations relating to privacy, data protection, or security, our business may be materially and adversely affected and we would likely have to change our business practices and potentially the services and features available through our platform. In addition, these laws and regulations could impose significant costs on us and could constrain our ability to use and process data in manners that may be commercially desirable. In addition, if a breach of data security were to occur or to be alleged to have occurred, if any violation of laws and regulations relating to privacy, data protection or data security were to be alleged, or if we had any actual or alleged defect in our safeguards or practices relating to privacy, data protection, or data security, our solutions may be perceived as less desirable and our business, prospects, financial condition, and results of operations could be materially and adversely affected.
We also expect that there will continue to be new laws, regulations, and industry standards concerning privacy, data protection, and information security proposed and enacted in various jurisdictions. For example, the data protection landscape in the European Union (“EU”) is currently evolving, resulting in possible significant operational costs for internal compliance and risks to our business. The EU adopted the General Data Protection Regulation (“GDPR”), which became effective in May 2018, and contains numerous requirements and changes from previously existing EU laws, including more robust obligations on data processors and heavier documentation requirements for data protection compliance programs by companies. Among other requirements, the GDPR regulates the transfer of personal data subject to the GDPR to third countries that have not been found to provide adequate protection to such personal data, including the United States. Failure to comply with the GDPR could result in penalties for noncompliance (including possible fines of up to the greater of €20 million and 4% of our global annual turnover for the preceding financial year for the most serious violations, as well as the right to compensation for financial or non-financial damages claimed by individuals under Article 82 of the GDPR).
36
Table of Contents
In addition to the GDPR, the European Commission has another draft regulation in the approval process that focuses on a person’s right to conduct a private life. The proposed legislation, known as the Regulation of Privacy and Electronic Communications (“ePrivacy Regulation”), would replace the current ePrivacy Directive. Originally planned to be adopted and implemented at the same time as the GDPR, the ePrivacy Regulation is still being negotiated.
Various United States privacy laws are potentially relevant to our business, including the Federal Trade Commission Act, Controlling the Assault of Non-Solicited Pornography and Marketing Act, and the Telephone Consumer Protection Act. Any actual or perceived failure to comply with these laws could result in a costly investigation or litigation resulting in potentially significant liability, loss of trust by our users, and a material and adverse impact on our reputation and business.
Additionally, in June 2018, California passed the California Consumer Privacy Act (“CCPA”), which provides new data privacy rights for California consumers and new operational requirements for covered companies. Specifically, the CCPA provides that covered companies must provide new disclosures to California consumers and afford such consumers new data privacy rights that include the right to request a copy from a covered company of the personal information collected about them, the right to request deletion of such personal information, and the right to request to opt-out of certain sales of such personal information. The CCPA became operative on January 1, 2020. The California Attorney General can enforce the CCPA, including seeking an injunction and civil penalties for violations. The CCPA also provide a private right of action for certain data breaches that is expected to increase data breach litigation. The CCPA may require us to modify our data practices and policies and to incur substantial costs and expenses in an effort to comply. A new privacy law, the California Privacy Rights Act (“CPRA”), recently was recently approved by California voters in the November 3, 2020 election. The CPRA creates obligations relating to consumer data beginning on January 1, 2022, with implementing regulations expected on or before July 1, 2022, and enforcement beginning July 1, 2023.The CPRA will significantly modify the CCPA, potentially resulting in further uncertainty and requiring us to incur additional costs and expenses in an effort to comply. More generally, some observers have noted the CCPA could mark the beginning of a trend toward more stringent privacy legislation in the United States, which could increase our potential liability and adversely affect our business. Further in March 2017, the United Kingdom (“U.K.”) formally notified the European Council of its intention to leave the EU pursuant to Article 50 of the Treaty on European Union (“Brexit”). The U.K. ceased to be an EU Member State on January 31, 2020, but enacted legislation substantially implementing the GDPR, and the European Commission and the United Kingdom government announced a EU-UK Trade Cooperation Agreement on December 24, 2020, providing for a temporary free flow of personal data between the EU and the United Kingdom, but it remains unclear how U.K. data protection laws or regulations will develop in the medium to longer term and how data transfers to and from the U.K. will be regulated. Some countries also are considering or have enacted legislation requiring local storage and processing of data that could increase the cost and complexity of delivering our services.
In addition, failure to comply with the Israeli Privacy Protection Law 5741-1981, and its regulations as well as the guidelines of the Israeli Privacy Protection Authority, may expose us to administrative fines, civil claims (including class actions) and in certain cases criminal liability. Current pending legislation may result in a change of the current enforcement measures and sanctions.
Any failure or perceived failure by us to comply with our posted privacy policies, our privacy-related obligations to users or other third parties, or any other legal obligations or regulatory requirements relating to privacy, data protection, or data security, may result in governmental investigations or enforcement actions, litigation, claims, or public statements against us by consumer advocacy groups or others and could result in significant liability, cause our users to lose trust in us, and otherwise materially and adversely affect our reputation and business. Furthermore, the costs of compliance with, and other burdens imposed by, the laws, regulations, other obligations, and policies that are applicable to the businesses of our users may limit the adoption and use of, and reduce the overall demand for, our platform. Additionally, if third parties we work with violate applicable laws, regulations or contractual obligations, such violations may put our users’ data at risk,
37
Table of Contents
could result in governmental investigations or enforcement actions, fines, litigation, claims, or public statements against us by consumer advocacy groups or others and could result in significant liability, cause our users to lose trust in us, and otherwise materially and adversely affect our reputation and business. Further, public scrutiny of, or complaints about, technology companies or their data handling or data protection practices, even if unrelated to our business, industry or operations, may lead to increased scrutiny of technology companies, including us, and may cause government agencies to enact additional regulatory requirements, or to modify their enforcement or investigation activities, which may increase our costs and risks.
Risks Related to Foreign Operations
Our international operations and expansion expose us to risk.
Our primary research and development operations are located in Israel. As of December 31, 2020, we had customers located in over 90 countries, and our strategy is to continue to expand internationally. In addition, as a result of our strategy of leveraging a distributed workforce. As of December 31, 2020, we had employees located in six countries. Our current international operations involve, and future initiatives will involve, a variety of risks, including:
| • | unexpected changes in practices, tariffs, export quotas, custom duties, trade disputes, tax laws and treaties, particularly due to economic tensions and trade negotiations or other trade restrictions; |
| • | different labor regulations, especially in the European Union, where labor laws are generally more advantageous to employees as compared to the United States, including differing hourly wages and overtime regulations in these locations; |
| • | exposure to many stringent and potentially inconsistent laws and regulations relating to privacy, data protection, and information security, particularly in the European Union; |
| • | changes in a specific country’s or region’s political or economic conditions; |
| • | risks resulting from the recent outbreak of the novel coronavirus, including uncertainty regarding how the U.S. or foreign governments will act with respect to the pandemic; |
| • | risks resulting from changes in currency exchange rates; |
| • | challenges inherent to efficiently managing an increased number of employees over large geographic distances, including the need to implement appropriate systems, policies, benefits and compliance programs; |
| • | risks relating to the implementation of exchange controls, including restrictions promulgated by the OFAC, and other similar trade protection regulations and measures in the United States or in other jurisdictions; |
| • | reduced ability to timely collect amounts owed to us by our customers in countries where our recourse may be more limited; |
| • | slower than anticipated availability and adoption of cloud and hybrid infrastructures by international businesses; |
| • | limitations on our ability to reinvest earnings from operations derived from one country to fund the capital needs of our operations in other countries; |
| • | potential changes in laws, regulations, and costs affecting our U.K operations and personnel due to Brexit; |
| • | limited or unfavorable intellectual property protection; and |
| • | exposure to liabilities under anti-corruption and anti-money laundering laws, including the U.S. Foreign Corrupt Practices Act of 1977, as amended, and similar applicable laws and regulations in other jurisdictions. |
If we are unable to address these difficulties and challenges or other problems encountered in connection with our international operations and expansion, we might incur unanticipated liabilities or we might otherwise suffer harm to our business generally.
38
Table of Contents
If we are not successful in sustaining and expanding our international business, we may incur additional losses and our revenue growth could be harmed.
Our future results depend, in part, on our ability to sustain and expand our penetration of the international markets in which we currently operate and to expand into additional international markets. Our ability to expand internationally will depend upon our ability to deliver functionality and foreign language translations that reflect the needs of the international clients that we target. Our ability to expand internationally involves various risks, including the need to invest significant resources in such expansion, and the possibility that returns on such investments will not be achieved in the near future or at all in these less familiar competitive environments. We may also choose to conduct our international business through other partnerships. If we are unable to identify partners or negotiate favorable terms, our international growth may be limited. In addition, we have incurred and may continue to incur significant expenses in advance of generating material revenue as we attempt to establish our presence in particular international markets.
Legal, political, and economic uncertainty surrounding the exit of the United Kingdom from the EU may be a source of instability to international markets, create significant currency fluctuations, adversely affect our operations in the United Kingdom and pose additional risks to our business, financial condition, and results of operations.
In connection with Brexit, the United Kingdom ceased to be an EU Member State on January 31, 2020, but maintained access to the EU single market and to the global trade deals negotiated by the EU on behalf of its members for a transition period that ended on December 31, 2020. The ongoing uncertainty with the United Kingdom’s government and Parliament on the status of Brexit has negatively impacted the United Kingdom’s economy, and will likely continue to have a negative impact until the United Kingdom and EU reach a definitive resolution on the outstanding trade and legal matters. Any additional impact of Brexit will depend on the terms of such resolution. Even if the United Kingdom maintains access to the EU single market and trade deals following the transition period, Brexit could result in further economic downturn globally. If the United Kingdom ultimately loses access to the EU single market and trade deals, significant market and economic disruption would likely occur, our customer experience, service quality, and international operations would likely be negatively impacted, and the demand for our services could be depressed.
Additionally, we may face new regulations regarding trade, aviation, tax, security, and employees, among others, in the United Kingdom. Compliance with such regulations could be costly, negatively impacting our business, results of operations, and financial condition. Brexit could also adversely affect European and worldwide economic and market conditions and could contribute to instability in global financial and foreign exchange markets, including volatility in the value of the euro and the British pound.
We are subject to various governmental export control, trade sanctions, and import laws and regulations that could impair our ability to compete in international markets or subject us to liability if we violate these controls.
In some cases, our software is subject to export control laws and regulations, including the Export Administration Regulations administered by the U.S. Department of Commerce, and our activities may be subject to trade and economic sanctions, including those administered by the United States Department of the Treasury’s Office of Foreign Assets Control (“OFAC”) (collectively, “Trade Controls”). As such, a license may be required to export or re-export our products, or provide related services, to certain countries and end-users, and for certain end-uses. Further, our products incorporating encryption functionality may be subject to special controls applying to encryption items and/or certain reporting requirements.
We have procedures in place designed to ensure our compliance with Trade Controls. We are currently working to enhance these procedures, with which failure to comply could subject us to both civil and criminal penalties, including substantial fines, possible incarceration of responsible individuals for willful violations,
39
Table of Contents
possible loss of our export or import privileges, and reputational harm. Further, the process for obtaining necessary licenses may be time-consuming or unsuccessful, potentially causing delays in sales or losses of sales opportunities. Trade Controls are complex and dynamic regimes, and monitoring and ensuring compliance can be challenging, particularly given that our products are widely distributed throughout the world and are available for download without registration. Although we have no knowledge that our activities have resulted in violations of Trade Controls, any failure by us or our partners to comply with applicable laws and regulations would have negative consequences for us, including reputational harm, government investigations, and penalties.
In addition, various countries regulate the import of certain encryption technology, including through import permit and license requirements, and have enacted laws that could limit our ability to distribute our products or could limit our end-customers’ ability to implement our products in those countries. Changes in our products or changes in export and import regulations in such countries may create delays in the introduction of our products into international markets, prevent our end-customers with international operations from deploying our products globally or, in some cases, prevent or delay the export or import of our products to certain countries, governments, or persons altogether. Any change in export or import laws or regulations, economic sanctions or related legislation, shift in the enforcement or scope of existing export, import or sanctions laws or regulations, or change in the countries, governments, persons, or technologies targeted by such export, import or sanctions laws or regulations, could result in decreased use of our products by, or in our decreased ability to export or sell our products to, existing or potential end-customers with international operations. Any decreased use of our products or limitation on our ability to export to or sell our products in international markets could adversely affect our business, financial condition, and results of operations.
Failure to comply with anti-bribery, anti-corruption, anti-money laundering laws, and similar laws, could subject us to penalties and other adverse consequences.
We are subject to the U.S. Foreign Corrupt Practices Act of 1977, as amended (the “FCPA”), the U.S. domestic bribery statute contained in 18 U.S.C. § 201, the U.S. Travel Act, the USA PATRIOT Act, the United Kingdom Bribery Act 2010, the Proceeds of Crime Act 2002, Chapter 9 (sub-chapter 5) of the Israeli Penal Law, 1977, the Israeli Prohibition on Money Laundering Law–2000 and possibly other anti-bribery and anti-money laundering laws in countries outside of the United States in which we conduct our activities. Anti-corruption and anti-bribery laws have been enforced aggressively in recent years and are interpreted broadly to generally prohibit companies, their employees, agents, representatives, business partners, and third-party intermediaries from authorizing, offering, or providing, directly or indirectly, improper payments or benefits to recipients in the public or private sector.
We sometimes leverage third parties to sell our products and conduct our business abroad. We, our employees, agents, representatives, business partners, and third-party intermediaries may have direct or indirect interactions with officials and employees of government agencies or state-owned or affiliated entities and may be held liable for the corrupt or other illegal activities of these employees, agents, representatives, business partners, or third-party intermediaries, even if we do not explicitly authorize such activities. We cannot assure you that all of our employees and agents will not take actions in violation of applicable law, for which we may be ultimately held responsible. As we increase our international sales and business, our risks under these laws may increase.
These laws also require that we keep accurate books and records and maintain internal controls and compliance procedures designed to prevent any such actions. While we have policies and procedures to address compliance with such laws, we cannot assure you that none of our employees, agents, representatives, business partners or third-party intermediaries will take actions in violation of our policies and applicable law, for which we may be ultimately held responsible.
Any allegations or violation of the FCPA or other applicable anti-bribery, anti-corruption laws, and anti-money laundering laws could result in whistleblower complaints, sanctions, settlements, prosecution, enforcement actions, fines, damages, adverse media coverage, investigations, loss of export privileges, severe
40
Table of Contents
criminal or civil sanctions, or suspension or debarment from U.S. government contracts, all of which may have an adverse effect on our reputation, business, results of operations, and prospects. Responding to any investigation or action will likely result in a materially significant diversion of management’s attention and resources and significant defense costs and other professional fees. In addition, the U.S. government may seek to hold us liable for successor liability for FCPA violations committed by companies in which we invest or that we acquire. As a general matter, investigations, enforcement actions and sanctions could harm our reputation, business, results of operations, and financial condition.
We are exposed to fluctuations in currency exchange rates, which could negatively affect our financial condition and results of operations.
Our functional currency is the U.S. dollar and our revenue and expenses are primarily denominated in U.S. dollars. However, a significant portion of our headcount related expenses, consisting principally of salaries and related personnel expenses as well as leases and certain other operating expenses, are denominated in NIS. This foreign currency exposure gives rise to market risk associated with exchange rate movements of the U.S. dollar against the NIS. Furthermore, we anticipate that a material portion of our expenses will continue to be denominated in NIS. We currently utilize foreign currency contracts, with financial institutions to protect against foreign exchange risks, mainly the exposure to changes in the exchange rate of the NIS against the U.S. dollar that are associated with future cash flows denominated in NIS.
In addition, increased international sales in the future may result in greater foreign currency denominated sales, increasing our foreign currency risk. Moreover, operating expenses incurred outside the United States and denominated in foreign currencies are increasing and are subject to fluctuations due to changes in foreign currency exchange rates. If we are not able to successfully hedge against the risks associated with currency fluctuations, our financial condition and results of operations could be adversely affected. To date, we have entered into hedging transactions in an effort to reduce our exposure to foreign currency exchange risk. While we may decide to continue to enter into hedging transactions in the future, the availability and effectiveness of these hedging transactions may be limited and we may not be able to successfully hedge our exposure, which could adversely affect our financial condition and results of operations. In addition, a material portion of our leases are denominated in currencies other than the U.S. Dollar, mainly in NIS. In accordance with the new lease accounting standard, which became effective on January 1, 2021, the associated lease liabilities will be remeasured using the current exchange rate in the future reporting periods, which may result in material foreign exchange gains or losses. See Note 2, “Summary of Significant Accounting Policies” in the notes to the consolidated financial statements in this Annual Report on Form 10-K for more details.
Risks Related to Taxation
Unanticipated changes in effective tax rates or adverse outcomes resulting from examination of our income or other tax returns could expose us to greater than anticipated tax liabilities.
The tax laws applicable to our business, including the laws of Israel, the United States, and other jurisdictions, are subject to interpretation and certain jurisdictions may aggressively interpret their laws in an effort to raise additional tax revenue. The tax authorities of the jurisdictions in which we operate may challenge our methodologies for valuing developed technology or intercompany arrangements or our revenue recognition policies, which could increase our worldwide effective tax rate and harm our financial position and results of operations. It is possible that tax authorities may disagree with certain positions we have taken and any adverse outcome of such a review or audit could have a negative effect on our financial position and results of operations. Further, the determination of our worldwide provision for income taxes and other tax liabilities requires significant judgment by management, and there are transactions where the ultimate tax determination is uncertain. Although we believe that our estimates are reasonable, the ultimate tax outcome may differ from the amounts recorded in our consolidated financial statements and may materially affect our financial results in the period or periods for which such determination is made.
41
Table of Contents
In addition, we typically invoice customers for the full contract amount at the time of entering into a contract, but recognize revenue over the term of the subscription period. Applicable tax authorities may challenge our tax reporting position and may accelerate our tax obligation based on cash received, which may materially affect our financial results.
Our corporate structure and intercompany arrangements are subject to the tax laws of various jurisdictions, and we could be obligated to pay additional taxes, which would harm our results of operations.
Based on our current corporate structure, we are subject to taxation in several jurisdictions around the world with increasingly complex tax laws, the application of which can be uncertain. The amount of taxes we pay in these jurisdictions could increase substantially as a result of changes in the applicable tax principles, including increased tax rates, new tax laws or revised interpretations of existing tax laws and precedents. The authorities in these jurisdictions could review our tax returns or require us to file tax returns in jurisdictions in which we are not currently filing, and could impose additional tax, interest, and penalties. These authorities could also claim that various withholding requirements apply to us or our subsidiaries, assert that benefits of tax treaties are not available to us or our subsidiaries, or challenge our methodologies for valuing developed technology or intercompany arrangements, including our transfer pricing. The relevant tax authorities may determine that the manner in which we operate our business does not achieve the intended tax consequences. If such a disagreement was to occur, and our position was not sustained, we could be required to pay additional taxes, interest, and penalties. Any increase in the amount of taxes we pay or that are imposed on us could increase our worldwide effective tax rate and harm our business and results of operations.
The tax benefits that are available to us require us to continue to meet various conditions and may be terminated or reduced in the future, which could increase our costs and taxes.
We are eligible for certain tax benefits provided to a “Preferred Technology Enterprise” under the Israeli Law for the Encouragement of Capital Investments, 1959, referred to as the Investment Law. In order to remain eligible for the tax benefits for a “Preferred Technology Enterprise” we must continue to meet certain conditions stipulated in the Investment Law and its regulations, as amended. If these tax benefits are reduced, cancelled or discontinued, our Israeli taxable income from the Preferred Technology Enterprise would be subject to regular Israeli corporate tax rates. Additionally, if we increase our activities outside of Israel through acquisitions, for example, our expanded activities might not be eligible for inclusion in future Israeli tax benefit programs.
We could be required to collect additional sales, use, value added, digital services or other similar taxes or be subject to other liabilities that may increase the costs our clients would have to pay for our products and adversely affect our results of operations.
We collect sales, value added and other similar taxes in a number of jurisdictions. One or more U.S. states or countries may seek to impose incremental or new sales, use, value added, digital services, or other tax collection obligations on us. Further, an increasing number of U.S. states have considered or adopted laws that attempt to impose tax collection obligations on out-of-state companies. Additionally, the Supreme Court of the United States ruled in South Dakota v. Wayfair, Inc. et al, or Wayfair, that online sellers can be required to collect sales and use tax despite not having a physical presence in the state of the customer. In response to Wayfair, or otherwise, U.S. states or local governments may adopt, or begin to enforce, laws requiring us to calculate, collect, and remit taxes on sales in their jurisdictions. A successful assertion by one or more U.S. states requiring us to collect taxes where we presently do not do so, or to collect more taxes in a jurisdiction in which we currently do collect some taxes, could result in substantial liabilities, including taxes on past sales, as well as interest and penalties. Furthermore, certain jurisdictions, such as the United Kingdom and France, have recently introduced a digital services tax, which is generally a tax on gross revenue generated from users or customers located in in those jurisdictions, and other jurisdictions have enacted or are considering enacting similar laws. A successful assertion by a U.S. state or local government, or other country or jurisdiction that we should have been or should be collecting additional sales, use, value added, digital services or other similar taxes could, among
42
Table of Contents
other things, result in substantial tax payments, create significant administrative burdens for us, discourage potential customers from subscribing to our platform due to the incremental cost of any such sales or other related taxes, or otherwise harm our business.
Our ability to use our net operating loss carryforwards to offset future taxable income may be subject to certain limitations.
As of December 31, 2020, we had net operating loss carryforwards of $18.0 million in Israel, U.S. federal net operating loss carryforwards of $8.0 million and U.S. state net operating loss carryforwards of $22.5 million, which may be utilized against future income taxes. Limitations imposed by the applicable jurisdictions on our ability to utilize net operating loss carryforwards, including with respect to the net operating loss carryforwards of companies that we have acquired or may acquire in the future, could cause income taxes to be paid earlier than would be paid if such limitations were not in effect and could cause such net operating loss carryforwards to expire unused, in each case reducing or eliminating the benefit of such net operating loss carryforwards. Furthermore, we may not be able to generate sufficient taxable income to utilize our net operating loss carryforwards before they expire. If any of these events occur, we may not derive some or all of the expected benefits from our net operating loss carryforwards.
Risks Related to Our Ordinary Shares
The market price for our ordinary shares may be volatile or may decline regardless of our operating performance.
The market price of our ordinary shares may be highly volatile and may fluctuate or decline substantially as a result of a variety of factors, many of which are beyond our control, including:
| • | actual or anticipated changes or fluctuations in our results of operations; |
| • | the financial projections we may provide to the public, any changes in these projections or our failure to meet these projections; |
| • | announcements by us or our competitors of new offerings or new or terminated significant contracts, commercial relationships or capital commitments; |
| • | industry or financial analyst or investor reaction to our press releases, other public announcements, and filings with the SEC; |
| • | rumors and market speculation involving us or other companies in our industry; |
| • | sales or expected future sales of our ordinary shares; |
| • | investor perceptions of us and the industries in which we operate; |
| • | price and volume fluctuations in the overall stock market from time to time; |
| • | changes in operating performance and stock market valuations of other technology companies generally, or those in our industry in particular; |
| • | failure of industry or financial analysts to maintain coverage of us, changes in financial estimates by any analysts who follow our company, or our failure to meet these estimates or the expectations of investors; |
| • | actual or anticipated developments in our business or our competitors’ businesses or the competitive landscape generally; |
| • | litigation involving us, our industry or both, or investigations by regulators into our operations or those of our competitors; |
| • | developments or disputes concerning our intellectual property rights or our solutions, or third-party proprietary rights; |
| • | announced or completed acquisitions of businesses or technologies by us or our competitors; |
| • | actual or perceived breaches of, or failures relating to, privacy, data protection or data security; |
43
Table of Contents
| • | new laws or regulations or new interpretations of existing laws or regulations applicable to our business; |
| • | any major changes in our management or our board of directors; |
| • | general economic conditions and slow or negative growth of our markets; and |
| • | other events or factors, including those resulting from war, incidents of terrorism or responses to these events. |
The concentration of our share ownership with insiders will likely limit your ability to influence corporate matters, including the ability to influence the outcome of director elections and other matters requiring shareholder approval.
Our executive officers, directors, current 5% or greater shareholders and affiliated entities together beneficially owned approximately 64% of our ordinary shares outstanding as of December 31, 2020. As a result, these shareholders, acting together, will have control over most matters that require approval by our shareholders, including matters such as adoption of the financial statements, declarations of dividends, the appointment and dismissal of directors, capital increases, amendment to our articles of associations, and approval of significant corporate transactions. Corporate action might be taken even if other shareholders oppose them. This concentration of ownership might also have the effect of delaying or preventing a change of control of us that other shareholders may view as beneficial.
In addition, three of our non-executive directors are affiliated with holders of greater than 5% of our ordinary shares.
Sales of substantial amounts of our ordinary shares in the public markets, or the perception that they might occur, could reduce the price that our ordinary shares might otherwise attain.
Sales of a substantial number of ordinary shares in the public market, particularly sales by our directors, executive officers, and significant shareholders, or the perception that these sales could occur, could adversely affect the market price of our ordinary shares and may make it more difficult for you to sell your ordinary shares at a time and price that you deem appropriate.
All of our directors and officers and the holders of approximately 88% of our ordinary shares and share options outstanding prior to the IPO are subject to lock-up agreements that restrict their ability to transfer shares of our capital shares for 180 days from the date of our final prospectus, as filed with the SEC in connection with our pursuant to Rule 424(b)(4) under the Securities Act (File No. 333-248271) on September 16, 2020, or the Prospectus, subject to certain exceptions; provided that such restricted period ended with respect to 25% of the shares subject to each lock-up agreement on November 25, 2020, in accordance with the terns of the lock-up agreements. In addition, with respect to shares not released as a result of such early release, if the 180th day after the date of the Prospectus occurs within five trading days of a regular quarterly trading black-out period under our insider trading policy, the lock-up period will expire on the sixth trading day immediately preceding the commencement of such trading black-out period. Morgan Stanley & Co. LLC and J.P. Morgan Securities LLC may, in their sole discretion, permit our shareholders who are subject to these lock-up agreements to sell shares prior to the expiration of the lock-up agreements, subject to applicable notice requirements. If not earlier released, all of the ordinary shares subject to these lock-up agreements will become eligible for sale upon expiration of the 180-day lock-up period, except for any shares held by our affiliates as defined in Rule 144 under the Securities Act. Certain holders of our securities representing approximately 12% of our ordinary shares and share options outstanding prior to the IPO, who are primarily former employees, have not entered into lock-up agreements with the underwriters and, therefore, are not subject to the restrictions described above. These holders are subject to market standoff agreements with us, and we will not waive any of the restrictions of such market standoff agreements during the period ending 180 days after the date of the Prospectus without the prior written consent of Morgan Stanley & Co. LLC and J.P. Morgan Securities LLC on behalf of the underwriters. These market standoff agreements do not allow for any early releases or black-out period related releases described above. However, the market standoff agreements do not prohibit these holders from pledging or hedging activities with respect to our securities.
44
Table of Contents
In addition, holders of an aggregate of approximately 75,527,532 ordinary shares, based on shares outstanding as of December 31, 2020, are entitled to rights with respect to registration of these shares under the Securities Act pursuant to our amended and restated investors’ rights agreement. If these holders of our ordinary shares, by exercising their registration rights, sell a large number of shares, they could adversely affect the market price for our ordinary shares. We have also registered the offer and sale of all ordinary shares that we may issue under our equity compensation plan.
The issuance of additional shares in connection with financings, acquisitions, investments, our share incentive plans or otherwise will dilute all other shareholders.
Our amended and restated articles of association authorize us to issue up to 500 million ordinary shares and up to 50 million preference shares with such rights and preferences as included in our articles of association. Subject to compliance with applicable rules and regulations, we may issue ordinary shares or securities convertible into ordinary shares from time to time in connection with a financing, acquisition, investment, our share incentive plans or otherwise. Any such issuance could result in substantial dilution to our existing shareholders unless pre-emptive rights exist and cause the market price of our ordinary shares to decline.
Provisions of Israeli law and our amended and restated articles of association may delay, prevent or make undesirable an acquisition of all or a significant portion of our shares or assets.
Certain provisions of Israeli law and our articles of association could have the effect of delaying or preventing a change in control and may make it more difficult for a third party to acquire us or for our shareholders to elect different individuals to our board of directors, even if doing so would be beneficial to our shareholders, and may limit the price that investors may be willing to pay in the future for our ordinary shares. For example, Israeli corporate law regulates mergers and requires that a tender offer be effected when certain thresholds of percentage ownership of voting power in a company are exceeded (subject to certain conditions). Further, Israeli tax considerations may make potential transactions undesirable to us or to some of our shareholders whose country of residence does not have a tax treaty with Israel granting tax relief to such shareholders from Israeli tax.
Furthermore, under the Encouragement of Research, Development and Technological Innovation in the Industry Law, 5744-1984, and the regulations, guidelines, rules, procedures, and benefit tracks thereunder, collectively, the Innovation Law, to which we are subject due to our receipt of grants from the Israeli National Authority for Technological Innovation, or the Israeli Innovation Authority (the “IIA”), a recipient of IIA grants such as our company must report to the IIA regarding any change in the holding of means of control of our company which transforms any non-Israeli citizen or resident into an “interested party,” as defined in the Israeli Securities Law, and such non-Israeli citizen or resident shall execute an undertaking in favor of IIA, in a form prescribed by IIA.
Our amended and restated Articles of Association provide that the federal district courts of the United States of America will be the exclusive forum for resolving any complaint asserting a cause of action arising under the Securities Act, which could limit our shareholders’ ability to choose the judicial forum for disputes with us or our directors, shareholders, officers, or other employees.
Section 22 of the Securities Act creates concurrent jurisdiction for U.S. federal and state courts over all such Securities Act actions. Accordingly, both U.S. state and federal courts have jurisdiction to entertain such claims. To prevent having to litigate claims in multiple jurisdictions and the threat of inconsistent or contrary rulings by different courts, among other considerations, our amended and restated Articles of Association provide that, unless we consent in writing to the selection of an alternative forum, the federal district courts of the United States of America shall be the exclusive forum for the resolution of any complaint asserting a cause of action arising under the Securities Act. This exclusive forum provision will not apply to suits brought to enforce any liability or duty created by the Exchange Act. Any person or entity purchasing or otherwise acquiring any interest in any of our securities shall be deemed to have notice of and consented to the foregoing provision of our amended and restated Articles of Association.
45
Table of Contents
Although we believe this exclusive forum provision benefits us by providing increased consistency in the application of U.S. federal securities laws in the types of lawsuits to which they apply, the exclusive forum provision may limit a shareholder’s ability to bring a claim in a judicial forum of its choosing for disputes with us or any of our directors, shareholders, officers, or other employees, which may discourage lawsuits with respect to such claims against us and our current and former directors, shareholders, officers, or other employees. Our shareholders will not be deemed to have waived our compliance with the U.S. federal securities laws and the rules and regulations thereunder as a result of our exclusive forum provision. Further, in the event a court finds the exclusive forum provision contained in our amended and restated Articles of Association to be unenforceable or inapplicable in an action, we may incur additional costs associated with resolving such action in other jurisdictions, which could harm our results of operations.
U.S. Holders of our ordinary shares may suffer adverse tax consequences if we are characterized as a passive foreign investment company.
A non-U.S. corporation will generally be considered a passive foreign investment company (“PFIC”) for U.S. federal income tax purposes, in any taxable year if either (1) at least 75% of its gross income for such year is passive income (the “PFIC income test”) or (2) at least 50% of its average quarterly assets during such year is attributable to assets that produce or are held for the production of passive income (the “PFIC asset test”). For purposes of the PFIC asset test, the value of our assets will generally be determined by reference to the fair market value of our assets, including goodwill and other unbooked intangibles. Based on our past and current projections of our income and assets, we do not believe we were a PFIC for the taxable year ending December 31, 2020, and do not expect to be a PFIC for the current taxable year or for the foreseeable future. Nevertheless, a separate factual determination as to whether we are or have become a PFIC must be made each year (after the close of such year). Since our projections may differ from our actual business results and our market capitalization and value of our assets may fluctuate, we cannot assure you that we will not be or become a PFIC in the current taxable year or any future taxable year. If we are a PFIC for any taxable year during which a U.S. Holder (as defined in “Taxation and Government Programs—U.S. Federal Income Taxation” in the Prospectus) holds our ordinary shares, the U.S. Holder may be subject to adverse tax consequences. Each U.S. Holder is strongly urged to consult its own tax advisor regarding the application of these rules and the availability of any potential elections.
If a U.S. person is treated as owning at least 10% of our shares, such person may be subject to adverse U.S. federal income tax consequences.
If a U.S. person is treated as owning (directly, indirectly, or constructively) at least 10% of the value or voting power of our shares, such person may be treated as a “United States shareholder” with respect to each “controlled foreign corporation” in our group (if any). Because our group includes one or more U.S. subsidiaries, certain of our non-U.S. subsidiaries could be treated as controlled foreign corporations (regardless of whether or not we are treated as a controlled foreign corporation). A United States shareholder of a controlled foreign corporation may be required to report annually and include in its U.S. taxable income its pro rata share of “Subpart F income,” “global intangible low-taxed income,” and investments in U.S. property by controlled foreign corporations, regardless of whether we make any distributions. Failure to comply with such reporting requirements could result in adverse tax effects for United States shareholders and potentially significant monetary penalties. An individual that is a United States shareholder with respect to a controlled foreign corporation generally would not be allowed certain tax deductions or foreign tax credits that would be allowed to a U.S. shareholder that is a U.S. corporation. We cannot provide any assurances that we will assist investors in determining whether any of our non-U.S. subsidiaries is treated as a controlled foreign corporation or furnish to any United States shareholders information that may be necessary to comply with the aforementioned obligations. A United States shareholder should consult its advisors regarding the potential application of these rules to an investment in our ordinary shares.
46
Table of Contents
We do not intend to pay dividends in the foreseeable future. As a result, your ability to achieve a return on your investment will depend on appreciation in the price of our ordinary shares.
We have never declared or paid any cash dividends on our shares. We currently intend to retain all available funds and any future earnings for use in the operation of our business and do not anticipate paying any dividends on our ordinary shares in the foreseeable future. Consequently, investors who purchase our ordinary shares may be unable to realize a gain on their investment except by selling sell such shares after price appreciation, which may never occur.
Our board of directors has sole discretion whether to pay dividends. If our board of directors decides to pay dividends, the form, frequency, and amount will depend upon our future, operations and earnings, capital requirements and surplus, general financial condition, contractual restrictions and other factors that our directors may deem relevant. The Israeli Companies Law, 5759-1999 (the “Companies Law”) imposes restrictions on our ability to declare and pay dividends. Payment of dividends may also be subject to Israeli withholding taxes.
Risks Related to Our Incorporation and Location in Israel
Conditions in Israel could materially and adversely affect our business.
Many of our employees, including certain management members operate from our offices that are located in Netanya and Tel Aviv, Israel. In addition, a number of our officers and directors are residents of Israel. Accordingly, political, economic, and military conditions in Israel and the surrounding region may directly affect our business and operations. In recent years, Israel has been engaged in sporadic armed conflicts with Hamas, an Islamist terrorist group that controls the Gaza Strip, with Hezbollah, an Islamist terrorist group that controls large portions of southern Lebanon, and with Iranian-backed military forces in Syria. In addition, Iran has threatened to attack Israel and may be developing nuclear weapons. Some of these hostilities were accompanied by missiles being fired from the Gaza Strip against civilian targets in various parts of Israel, including areas in which our employees and some of our consultants are located, and negatively affected business conditions in Israel. Any hostilities involving Israel or the interruption or curtailment of trade between Israel and its trading partners could adversely affect our operations and results of operations.
Our commercial insurance does not cover losses that may occur as a result of events associated with war and terrorism. Although the Israeli government currently covers the reinstatement value of direct damages that are caused by terrorist attacks or acts of war, we cannot assure you that this government coverage will be maintained or that it will sufficiently cover our potential damages. Any losses or damages incurred by us could have a material adverse effect on our business. Any armed conflicts or political instability in the region would likely negatively affect business conditions and could harm our results of operations.
Further, in the past, the State of Israel and Israeli companies have been subjected to economic boycotts. Several countries still restrict business with the State of Israel and with Israeli companies. These restrictive laws and policies may have an adverse impact on our results of operations, financial condition or the expansion of our business. A campaign of boycotts, divestment, and sanctions has been undertaken against Israel, which could also adversely affect our business. Actual or perceived political instability in Israel or any negative changes in the political environment, may individually or in the aggregate adversely affect the Israeli economy and, in turn, the Group’s business, financial condition, results of operations, and prospects.
In addition, many Israeli citizens are obligated to perform several weeks of annual military reserve duty each year until they reach the age of 40 (or older, for reservists who are military officers or who have certain occupations) and, in the event of a military conflict, may be called to active duty. In response to increases in terrorist activity, there have been periods of significant call-ups of military reservists. It is possible that there will be military reserve duty call-ups in the future. Our operations could be disrupted by such call-ups, which may include the call-up of members of our management. Such disruption could materially adversely affect our business, prospects, financial condition, and results of operations.
47
Table of Contents
It should also be noted that on Israel’s domestic front there is currently a level of unprecedented political instability. The Israeli government has been in a transitionary phase since December of 2018, when the Israeli Parliament, or the Knesset, first resolved to dissolve itself and call for new general elections. In 2019, Israel held general elections twice – in April and September – and a third general election was held on March 2, 2020. The Knesset, for reasons related to this extended political transition, has failed to pass a budget for the year 2020, and certain government ministries, which may be critical to the operation of our business, are without necessary resources and may not receive sufficient funding moving forward. During December 2020, the government was unable to pass a budget by the applicable deadline, triggering a snap election expected to take place during March 2021, lurching the country back into a protracted political crisis. These circumstances may have an adverse effect on our operations in Israel.
It may be difficult to enforce a U.S. judgment against us, our officers and directors in Israel or the United States, or to assert U.S. securities laws claims in Israel or serve process on our officers and directors.
Not all of our directors or officers are residents of the United States. Most of our assets and those of our non-U.S. directors and officers are located outside the United States. Service of process upon us or our non-U.S. resident directors and officers may be difficult to obtain within the United States. We have been informed by our legal counsel in Israel, that it may be difficult to assert claims under U.S. securities laws in original actions instituted in Israel or obtain a judgment based on the civil liability provisions of U.S. federal securities laws. Israeli courts may refuse to hear a claim based on an alleged violation of U.S. securities laws against us or our non-U.S. officers or directors reasoning that Israeli is not the most appropriate forum to hear such a claim. In addition, even if an Israeli court agrees to hear a claim, it may determine that Israeli law and not U.S. law is applicable to the claim. If U.S. law is found to be applicable, the content of applicable U.S. law must be proved as a fact by expert witnesses which can be a time-consuming and costly process. Certain matters of procedure may also be governed by Israeli law. There is little binding case law in Israel addressing the matters described above. Israeli courts might not enforce judgments rendered outside Israel, which may make it difficult to collect on judgments rendered against us or our non-U.S. officers and directors.
Moreover, among other reasons, including but not limited to, fraud or absence of due process, or the existence of a judgment which is at variance with another judgment that was given in the same matter if a suit in the same matter between the same parties was pending before a court or tribunal in Israel, an Israeli court will not enforce a foreign judgment if it was given in a state whose laws do not provide for the enforcement of judgments of Israeli courts (subject to exceptional cases), or if its enforcement is likely to prejudice the sovereignty or security of the State of Israel.
Your rights and responsibilities as our shareholder will be governed by Israeli law, which may differ in some respects from the rights and responsibilities of shareholders of U.S. corporations.
We are incorporated under Israeli law. The rights and responsibilities of holders of our ordinary shares are governed by our amended and restated articles of association and the Companies Law. These rights and responsibilities differ in some respects from the rights and responsibilities of shareholders in typical U.S. corporations. In particular, pursuant to the Companies Law each shareholder of an Israeli company has to act in good faith and in a customary manner in exercising his or her rights and fulfilling his or her obligations toward the company and other shareholders and to refrain from abusing his or her power in the company, including, among other things, in voting at the general meeting of shareholders, on amendments to a company’s articles of association, increases in a company’s authorized share capital, mergers, and certain transactions requiring shareholders’ approval under the Companies Law. In addition, a controlling shareholder of an Israeli company or a shareholder who knows that it possesses the power to determine the outcome of a shareholder vote or who has the power to appoint or prevent the appointment of a director or officer in the company, or has other powers toward the company has a duty of fairness toward the company. However, Israeli law does not define the substance of this duty of fairness. There is little case law available to assist in understanding the implications of these provisions that govern shareholder behavior.
48
Table of Contents
We have received Israeli government grants for certain of our research and development activities. The terms of these grants may require us to satisfy specified conditions in order to develop and transfer technologies supported by such grants outside of Israel. In addition, in some circumstances, we may be required to pay penalties in addition to repaying the grants.
Our research and development efforts were financed, in part, through grants from the IIA. From our inception through 2015, we conducted projects with the IIA’s support and received grants totaling $1.2 million from the IIA and repaid to the IIA $1.3 million (the entire amount of the grants and accrued interest).
The United Kingdom’s Financial Conduct Authority, which regulates the London Interbank Offered Rate (“LIBOR”), announced in July 2017 that it will no longer persuade or require banks to submit rates for LIBOR after 2021. The grants received from the IIA bear an annual interest rate based on the 12-month LIBOR. Accordingly, there is considerable uncertainty regarding the publication of LIBOR beyond 2021. While it is not currently possible to determine precisely whether, or to what extent, the withdrawal and replacement of LIBOR would affect us, the implementation of alternative benchmark rates to LIBOR may increase our financial liabilities to the IIA.
The Innovation Law requires, inter alia, that the products developed as part of the programs under which the grants were given be manufactured in Israel and restricts the ability to transfer know-how funded by IIA outside of Israel. Transfer of IIA-funded know-how outside of Israel requires prior approval and is subject to payment of a redemption fee to the IIA calculated according to a formula provided under the Innovation Law. A transfer for the purpose of the Innovation Law is generally interpreted very broadly and includes, inter alia, any actual sale of the IIA-funded know-how, any license to develop the IIA-funded know-how or the products resulting from such IIA-funded know-how or any other transaction, which, in essence, constitutes a transfer of IIA-funded know-how. We cannot be certain that any approval of the IIA will be obtained on terms that are acceptable to us, or at all. We may not receive the required approvals should we wish to transfer IIA-funded know-how and/or development outside of Israel in the future.
Transfer of IIA know-how created, in whole or in part, in connection with an IIA-funded project, to a third party outside Israel requires prior approval and is subject to payment to the IIA of a redemption fee calculated according to a formula provided under the Innovation Law. Subject to prior approval of the IIA, we may transfer the IIA-funded know-how to another Israeli company. If the IIA-funded know-how is transferred to another Israeli entity, the transfer would still require IIA approval but will not be subject to the payment of the redemption fee. In such case, the acquiring company would have to assume all of the applicable restrictions and obligations towards the IIA (including the restrictions on the transfer of know-how and manufacturing capacity, to the extent applicable, outside of Israel) as a condition to IIA approval.
General Risk Factors
Our management team has limited experience managing a public company, and the requirements of being a public company may strain our resources, divert management’s attention, and affect our ability to attract and retain qualified board members.
As a public company listed in the United States, we incur and will continue to incur significant additional legal, accounting, and other expenses. In addition, changing laws, regulations, and standards relating to corporate governance and public disclosure, including regulations implemented by the SEC and Nasdaq, may increase legal and financial compliance costs, and make some activities more time consuming. These laws, regulations and standards are subject to varying interpretations, and as a result, their application in practice may evolve over time as new guidance is provided by regulatory and governing bodies.
Most members of our management team have no experience managing a publicly traded company, interacting with public company investors, and complying with the increasingly complex laws pertaining to public companies. Our management team may not successfully or efficiently manage our operation as a public
49
Table of Contents
company that is subject to significant regulatory oversight and reporting obligations under the federal securities laws and the continuous scrutiny of securities analysts and investors. We intend to invest resources to comply with evolving laws, regulations, and standards, and these new obligations and constituents will require significant attention from our senior management and could divert their attention away from the day-to-day management of our business. If, notwithstanding our efforts, we fail to comply with new laws, regulations, and standards, regulatory authorities may initiate legal proceedings against us and our business, results of operations, and financial condition may be harmed.
Failure to comply with these rules might also make it more difficult for us to obtain certain types of insurance, including director and officer liability insurance, and we might be forced to accept reduced policy limits and coverage or incur substantially higher costs to obtain the same or similar coverage. The impact of these events would also make it more difficult for us to attract and retain qualified persons to serve on our board of directors, on committees of our board of directors or as members of senior management.
We are an “emerging growth company” and we cannot be certain if the reduced disclosure requirements applicable to emerging growth companies will make our ordinary shares less attractive to investors.
For so long as we remain an “emerging growth company” as defined in the JOBS Act, we may take advantage of certain exemptions from various requirements that are applicable to public companies that are not “emerging growth companies,” including, but not limited to, not being required to comply with the auditor attestation requirements of Section 404 of the Sarbanes-Oxley Act, reduced disclosure obligations regarding executive compensation in our periodic reports and proxy statements, and exemptions from the requirements of holding a nonbinding advisory vote on executive compensation and shareholder approval of any golden parachute payments not previously approved. We may take advantage of these exemptions until we are no longer an emerging growth company. We would cease to be an emerging growth company upon the earliest to occur of: (i) the first fiscal year following the fifth anniversary of our initial public offering; (ii) the first fiscal year after our annual gross revenue is $1.07 billion or more; (iii) the date on which we have, during the previous three-year period, issued more than $1.0 billion in non-convertible debt securities; or (iv) as of the end of any fiscal year after the first anniversary of our initial public offering in which the market value of our ordinary shares held by non-affiliates exceeded $700.0 million as of the end of the second quarter of that fiscal year. We cannot predict if investors will find our ordinary shares less attractive because we may rely on these exemptions. If some investors find our ordinary shares less attractive as a result, there may be a less active trading market for our ordinary shares and our share price may be more volatile.
If we fail to maintain an effective system of disclosure controls and internal control over financial reporting, our ability to produce timely and accurate financial statements or comply with applicable regulations could be impaired.
As a public company, we are subject to the reporting requirements of the Exchange Act, the Sarbanes-Oxley Act, and the rules and regulations of the applicable listing standards of Nasdaq. We are required, pursuant to Section 404 of the Sarbanes-Oxley Act to furnish a report by management on, among other things, the effectiveness of our internal control over financial reporting. This assessment will need to include disclosure of any material weaknesses identified by our management in our internal control over financial reporting. In addition, in our first annual report required to be filed with the SEC following the date we are no longer an “emerging growth company,” our independent registered public accounting firm will be required to attest to the effectiveness of our internal control over financial reporting.
We are in the process of designing, implementing, and testing the internal control over financial reporting required to comply with the requirements under Section 404 of the Sarbanes-Oxley Act. For example, we have implemented additional policies and procedures associated with the financial statement close process. We are in the process of implementing a system to supplement our core accounting system as part of our control environment. We expect the requirements of these rules and regulations will increase our legal, accounting,
50
Table of Contents
financial compliance and audit costs, make some activities more difficult, time-consuming and costly, and increase demand on our personnel, systems and resources, particularly after we are no longer an “emerging growth company.”
In addition, our current controls and any new controls that we develop may become inadequate because of changes in the conditions in our business, including increased complexity resulting from our international expansion. Further, weaknesses in our disclosure controls or our internal control over financial reporting may be discovered in the future. Any failure to develop or maintain effective controls, or any difficulties encountered in their implementation or improvement, could harm our results of operations or cause us to fail to meet our reporting obligations and may result in a restatement of our financial statements for prior periods. Any failure to implement and maintain effective internal control over financial reporting could also adversely affect the results of periodic management evaluations and annual independent registered public accounting firm attestation reports regarding the effectiveness of our internal control over financial reporting that we will eventually be required to include in our periodic reports that will be filed with the SEC. Ineffective disclosure controls and procedures and internal control over financial reporting could also cause investors to lose confidence in our reported financial and other information, which would likely adversely affect the market price of our common stock. In addition, if we are unable to continue to meet these requirements, we may not be able to remain listed on the Nasdaq.
The recent global coronavirus outbreak could harm our business and results of operations.
In December 2019, a novel coronavirus disease (“COVID-19”) was reported in China, in January 2020, the World Health Organization (“WHO”) declared it a Public Health Emergency of International Concern, and in March 2020 the WHO declared it a pandemic. This contagious disease outbreak has continued to spread across the globe and is impacting worldwide economic activity and financial markets. In light of the uncertain and rapidly evolving situation relating to the spread of COVID-19, as well as government mandates, we took precautionary measures intended to minimize the risk of the virus to our employees, our customers, our partners and the communities in which we operate, which could negatively impact our business. In March 2020, we temporarily closed all of our offices, and enabled our entire work force to work remotely, and most of our work force continues to work remotely. Since the second quarter of 2020, we intermittently reopened our offices in Israel. In the second half of 2020, we reopened our offices in India, the U.S. and France to partial capacity, as permitted by local governmental restrictions. These changes remain in effect as of the date we file this Annual Report on Form 10-K and could extend into future quarters. We also suspended and continue to suspend all travel worldwide for our employees for non-essential business. It is possible that widespread remote work arrangements may have a negative impact on our operations, the execution of our business plans, the productivity and availability of key personnel and other employees necessary to conduct our business, or otherwise cause operational failures due to changes in our normal business practices necessitated by the pandemic and related governmental actions. While we have a distributed workforce and our employees are accustomed to working remotely or working with other remote employees, our workforce was not trained to be fully remote. Our employees historically have travelled frequently to establish and maintain relationships with one another, as well as our customers, partners, and investors. Although we continue to monitor the situation and may adjust our current policies as more information and public health guidance become available, temporarily suspending travel and suspending doing business in person may negatively affect our customer success efforts, sales and marketing efforts, challenge our ability to enter into customer contracts in a timely manner, slow down our recruiting efforts, or create operational or other challenges, any of which could harm our business and results of operations. For example, as a result of COVID-19 we have experienced and expect to continue to experience an increase in the average length of sales cycles to onboard new customers, delays in new projects, and requests by some customers for extension of payment obligations, all of which adversely affect and could materially adversely impact our business, results of operations, and overall financial condition in future periods.
In addition, COVID-19 has disrupted and may continue to disrupt the operations of our customers and technology partners for an indefinite period of time, including as a result of travel restrictions and/or business shutdowns, all of which could negatively impact our business and results of operations. More generally, the
51
Table of Contents
COVID-19 outbreak has adversely affected economies and financial markets globally, leading to an economic downturn, which could decrease technology spending and adversely affect demand for our products and harm our business and results of operations. It is possible that continued widespread remote work arrangements may have a negative impact on our operations, the execution of our business plans, the productivity and availability of key personnel and other employees necessary to conduct our business, and on third-party service providers who perform critical services for us, or otherwise cause operational failures due to changes in our normal business practices necessitated by the outbreak and related governmental actions. If a natural disaster, power outage, connectivity issue, or other event occurred that impacted our employees’ ability to work remotely, it may be difficult or, in certain cases, impossible, for us to continue our business for a substantial period of time. The increase in remote working may also result in privacy, data protection, data security, and fraud risks, and our understanding of applicable legal and regulatory requirements, as well as the latest guidance from regulatory authorities in connection with the COVID-19 pandemic, may be subject to legal or regulatory challenge, particularly as regulatory guidance evolves in response to future developments. In response to COVID-19 we launched our FrogCare program that provides free software development and DevOps tools to accelerate delivery for research organizations in the fight against COVID-19.
It is not possible at this time to estimate the long-term impact that COVID-19 could have on our business, as the impact will depend on future developments, which are highly uncertain and cannot be predicted.
If industry or financial analysts do not publish research or reports about our business, or if they issue inaccurate or unfavorable research regarding our ordinary shares, our share price and trading volume could decline.
The trading market for our ordinary shares is influenced by the research and reports that industry or financial analysts publish about us or our business. We do not control these analysts, or the content and opinions included in their reports. As a new public company, we may be slow to attract research coverage and the analysts who publish information about our ordinary shares will have had relatively little experience with our company, which could affect their ability to accurately forecast our results and make it more likely that we fail to meet their estimates. In the event we obtain industry or financial analyst coverage, if any of the analysts who cover us issues an inaccurate or unfavorable opinion regarding our company, our share price would likely decline. In addition, the share prices of many companies in the technology industry have declined significantly after those companies have failed to meet, or significantly exceed, the financial guidance publicly announced by the companies or the expectations of analysts. If our financial results fail to meet, or significantly exceed, our announced guidance or the expectations of analysts or public investors, analysts could downgrade our ordinary shares or publish unfavorable research about us. If one or more of these analysts cease coverage of our company or fail to publish reports on us regularly, our visibility in the financial markets could decrease, which in turn could cause our share price or trading volume to decline.
If our estimates or judgments relating to our critical accounting policies are based on assumptions that change or prove to be incorrect, our results of operations could fall below expectations of securities analysts and investors, resulting in a decline in the trading price of our ordinary shares.
The preparation of financial statements in conformity with GAAP requires management to make estimates and assumptions that affect the amounts reported in the consolidated financial statements and accompanying notes. We base our estimates on historical experience and on various other assumptions that we believe to be reasonable under the circumstances, the results of which form the basis for making judgments about the carrying values of assets, liabilities, equity, revenue, and expenses that are not readily apparent from other sources. Our results of operations may be adversely affected if our assumptions change or if actual circumstances differ from those in our assumptions, which could cause our results of operations to fall below our publicly announced guidance or the expectations of securities analysts and investors, resulting in a decline in the market price of our ordinary shares. Significant items subject to such estimates and assumptions include, but are not limited to, the allocation of a transaction price among various performance obligations, the estimated customer life on deferred
52
Table of Contents
contract acquisition costs, the allowance for doubtful accounts, the fair value of financial assets and liabilities, including accounting and fair value of derivatives, the fair value of acquired intangible assets and goodwill, the useful lives of acquired intangible assets and property and equipment, share-based compensation including the determination of the fair value of our ordinary shares, and the valuation of deferred tax assets and uncertain tax positions.
We are exposed to credit risk and fluctuations in the market values of our investment portfolio.
Given the global nature of our business we have diversified U.S. and non-U.S. investments. Credit ratings and pricing of our investments can be negatively affected by liquidity, credit deterioration, financial results, economic risk, political risk, sovereign risk, or other factors. As a result, the value and liquidity of our investments may fluctuate substantially. Therefore, although we have not realized any significant losses on our investments, future fluctuations in their value could result in a significant realized loss.
Catastrophic events, or man-made problems such as terrorism, may disrupt our business.
A significant natural disaster, such as an earthquake, fire, flood, or significant power outage could have an adverse impact on our business, results of operations, and financial condition. We have a number of our employees and executive officers located in the San Francisco Bay Area, a region known for seismic activity and increasingly, wildfires. In the event our or our partners abilities are hindered by any of the events discussed above, sales could be delayed, resulting in missed financial targets for a particular quarter. In addition, acts of terrorism, pandemics, such as the outbreak of the novel coronavirus or another public health crisis, protests, riots and other geo-political unrest could cause disruptions in our business or the business of our partners, customers, or the economy as a whole. Any disruption in the business of our partners or customers that affects sales in a given fiscal quarter could have a significant adverse impact on our quarterly results for that and future quarters. All of the aforementioned risks may be further increased if our disaster recovery plans prove to be inadequate.
Our business could be negatively impacted by changes in the United States political environment.
Any policy changes as a result of the new presidential administration could significantly impact our business as well as the markets in which we compete. Specific legislative and regulatory proposals discussed during election campaigns and more recently that might materially impact us include, but are not limited to, changes to trade agreements, immigration policy, import and export regulations, tariffs and customs duties, federal and state tax laws and regulations, public company reporting requirements, and antitrust enforcement. Further, an extended federal government shutdown resulting from failing to pass budget appropriations, adopt continuing funding resolutions, or raise the debt ceiling, and other budgetary decisions limiting or delaying deferral government spending, may negatively impact U.S. or global economic conditions, including corporate and consumer spending, and liquidity of capital markets. To the extent changes in the political environment have a negative impact on us or on our markets, our business, results of operation and financial condition could be materially and adversely affected in the future.
Item 1B. Unresolved Staff Comments
None.
We are co-headquartered in Sunnyvale, California and in Netanya, Israel. We lease approximately 49,000 square feet of office space in Sunnyvale under leases expiring through 2026, and approximately 39,000 square feet of office space in Netanya under a lease expiring in 2022, with an option to extend the lease for an additional year.
53
Table of Contents
We lease all of our facilities and do not own any real property. We believe that our facilities are adequate for our current needs and anticipate that suitable additional space will be readily available to accommodate any foreseeable expansion of our operations.
In the ordinary course of business, the Company may be subject from time to time to various proceedings, lawsuits, disputes, or claims. The Company investigates these claims as they arise. Although claims are inherently unpredictable, the Company is currently not aware of any matters that, if determined adversely to the Company, would individually or taken together, have a material adverse effect on its business, financial position, results of operations, or cash flows.
Item 4. Mine Safety Disclosures
Not applicable.
54
Table of Contents
PART II
Item 5. Market for Registrant’s Common Equity, Related Shareholder Matters and Issuer Purchases of Equity Securities
Market Information for Our Ordinary Shares
Our Ordinary Shares has been listed on the Nasdaq Global Select Market (Nasdaq) under the symbol “FROG” since September 16, 2020. Prior to that date, there was no public trading market for our Ordinary Shares.
Holders of Record
As of January 31, 2021, we had 201 holders of record of our Ordinary Shares. The actual number of holders is greater than this number of record holders and includes holders who are beneficial owners but whose shares are held in street name by brokers and other nominees.
Dividend Policy
We have never declared nor paid any cash dividends on our shares. We currently intend to retain any future earnings and do not expect to pay any dividends in the foreseeable future. Any future determination to declare cash dividends will be made at the discretion of our Board of Directors, subject to applicable laws, and will depend on a number of factors, including our financial condition, results of operations, capital requirements, contractual restrictions, general business conditions, and other factors that our Board of Directors may deem relevant.
Securities Authorized for Issuance Under Equity Compensation Plans
The information required by this item with respect to our equity compensation plans is incorporated by reference to our Proxy Statement for the 2021 Annual Meeting of Shareholders to be filed with the Securities and Exchange Commission within 120 days of the fiscal year ended December 31, 2020.
Share Performance Graph
This performance graph shall not be deemed “soliciting material” or to be “filed” with the Securities and Exchange Commission, or the SEC, for purposes of Section 18 of the Exchange Act, or otherwise subject to the liabilities under that Section, and shall not be deemed to be incorporated by reference into any of our filings under the Securities Act.
55
Table of Contents
The graph below compares the cumulative total stockholder return on our ordinary share from September 16, 2020 (the date our ordinary share commenced trading on the Nasdaq) through December 31, 2020 with the cumulative total return on the S&P 500 Index and the S&P 500 Information Technology Index. All values assume a $100 initial investment and data for the S&P 500 Composite Index and the S&P Information Technology Index assume reinvestment of dividends. The comparisons are based on historical data and are not indicative of, nor intended to forecast, the future performance of our ordinary share.
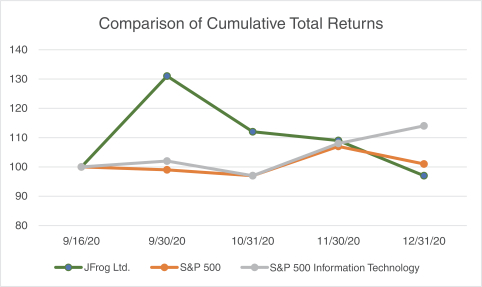
Unregistered Sales of Equity Securities
From January 1, 2020 through September 16, 2020 (the date of the filing of our registration statement on Form S-8), we granted to our directors, officers, employees, consultants and other service providers options to purchase an aggregate of 2,908,755 Ordinary Shares at exercise prices ranging from $15.12 to $35.00 per share under our 2011 Israeli Share Option Plan (the “2011 Plan”), and an award of restricted share units covering 667,595 Ordinary Shares pursuant to a stand-alone restricted share unit award agreement (the “CEO RSU Award”).
From January 1, 2020 through September 16, 2020 (the date of the filing of our registration statement on Form S-8), we issued and sold to our directors, officers, employees, consultants and other service providers an aggregate of 1,023,870 Ordinary Shares upon the exercise of options issued under our 2011 Plan at a weighted-average exercise price of $1.51 per share, for an aggregate exercise price of $1.5 million, and 138,400 Ordinary Shares subject to the CEO RSU Award.
In February 2020 and August 2020, we issued an aggregate of 152,515 ordinary shares in connection with our acquisition of a privately-held company and as consideration to individuals and entities who were former service providers and/or shareholders of such company.
None of the foregoing transactions involved any underwriters, underwriting discounts or commissions, or any public offering. We believe the offers, sales, and issuances of the above securities were exempt from registration under the Securities Act (or Regulation D or Regulation S promulgated thereunder) by virtue of Section 4(a)(2) of the Securities Act because the issuance of securities to the recipients did not involve a public offering, or in reliance on Rule 701 because the transactions were pursuant to compensatory benefit plans or contracts relating to compensation as provided under such rule. The recipients of the securities in each of these transactions represented their intentions to acquire the securities for investment only and not with a view to or for
56
Table of Contents
sale in connection with any distribution thereof, and appropriate legends were placed upon the certificates issued in these transactions. All recipients had adequate access, through their relationships with us, to information about us. The sales of these securities were made without any general solicitation or advertising.
Issuer Purchases of Equity Securities
None.
Use of Proceeds
On September 18, 2020, we completed our initial public offering, or IPO, in which we sold 9,735,232 shares of our Ordinary Shares at an offering price of $44.00 per share, including 1,735,232 shares pursuant to the exercise in full of the underwriters’ option to purchase additional shares, and certain selling stockholders sold 3,568,218 shares of our Ordinary Shares at an offering price of $44.00 per share. We received net proceeds of $393.2 million, after deducting underwriting discounts and commissions of $30.0 million and other issuance costs of $5.1 million. All of the Ordinary Shares issued and sold in our IPO were registered under the Securities Act pursuant to a registration statement on Form S-1 (File No. 333-248271), which was declared effective by the SEC on September 15, 2020. The representatives of the underwriters of our IPO were Morgan Stanley & Co. LLC, J.P. Morgan Securities LLC, and BofA Securities, Inc.
No offering expenses were paid directly or indirectly to any of our directors or officers (or their associates) or persons owning 10% or more of any class of our equity securities or to any other affiliates. As of December 31, 2020, substantially all of expenses incurred in connection with our IPO had been paid.
There has been no material change in the planned use of proceeds from our IPO from those disclosed in our final prospectus, as filed with the SEC in connection with our pursuant to Rule 424(b)(4) under the Securities Act (File No. 333-248271) on September 16, 2020.
57
Table of Contents
Item 6. Selected Financial and Other Data
We have derived the selected Consolidated Statements of Operations data for the years ended December 31, 2020, 2019 and 2018 and the Balance Sheet data as of December 31, 2020 and 2019 from our audited consolidated financial statements included elsewhere in this Annual Report on Form 10-K. Our historical results are not necessarily indicative of the results that may be expected in the future. The following selected consolidated financial and other data should be read in conjunction with Item 7, “Management’s Discussion and Analysis of Financial Condition and Results of Operations”, and our consolidated financial statements and the related notes appearing in Item 8, “Financial Statements and Supplementary Data”, of this Annual Report on Form 10-K to fully understand factors that may affect the comparability of the information presented below.
| Year Ended December 31, | ||||||||||||
| 2020 | 2019 | 2018 | ||||||||||
|
|
|
|||||||||||
| (in thousands, except share and per share data) | ||||||||||||
| Revenue: |
||||||||||||
| Subscription—self-managed and SaaS |
$ | 137,978 | $ | 94,606 | $ | 56,054 | ||||||
| License—self-managed |
12,849 | 10,110 | 7,478 | |||||||||
|
|
|
|
|
|
|
|||||||
| Total subscription revenue |
150,827 | 104,716 | 63,532 | |||||||||
| Cost of revenue: |
||||||||||||
| Subscription—self-managed and SaaS(1) |
27,619 | 19,201 | 10,393 | |||||||||
| License—self-managed(2) |
832 | 834 | 318 | |||||||||
|
|
|
|
|
|
|
|||||||
| Total cost of revenue—subscription |
28,451 | 20,035 | 10,711 | |||||||||
|
|
|
|
|
|
|
|||||||
| Gross profit |
122,376 | 84,681 | 52,821 | |||||||||
|
|
|
|
|
|
|
|||||||
| Operating expenses: |
||||||||||||
| Research and development(1)(3) |
41,113 | 29,730 | 25,861 | |||||||||
| Sales and marketing(1)(2)(3) |
60,936 | 44,088 | 34,972 | |||||||||
| General and administrative(1)(3) |
34,519 | 17,800 | 18,843 | |||||||||
|
|
|
|
|
|
|
|||||||
| Total operating expenses |
136,568 | 91,618 | 79,676 | |||||||||
|
|
|
|
|
|
|
|||||||
| Operating loss |
(14,192 | ) | (6,937 | ) | (26,855 | ) | ||||||
| Interest and other income, net |
2,045 | 3,171 | 1,310 | |||||||||
|
|
|
|
|
|
|
|||||||
| Loss before income taxes |
(12,147 | ) | (3,766 | ) | (25,545 | ) | ||||||
| Income tax expense (benefit) |
(2,742 | ) | 1,628 | 470 | ||||||||
|
|
|
|
|
|
|
|||||||
| Net loss |
$ | (9,405 | ) | $ | (5,394 | ) | $ | (26,015 | ) | |||
|
|
|
|
|
|
|
|||||||
| Net loss per share attributable to ordinary shareholders, basic and diluted |
$ | (0.20 | ) | $ | (0.20 | ) | $ | (1.00 | ) | |||
|
|
|
|
|
|
|
|||||||
| Weighted-average shares used in computing net loss per share attributable to ordinary shareholders, basic and diluted |
46,488,225 | 27,130,209 | 26,102,551 | |||||||||
|
|
|
|
|
|
|
|||||||
| (1) | Includes share-based compensation expense as follows: |
| Year Ended December 31, | ||||||||||||
| 2020 | 2019 | 2018 | ||||||||||
|
|
|
|||||||||||
| (in thousands) | ||||||||||||
| Cost of revenue: subscription–self-managed and SaaS |
$ | 1,129 | $ | 536 | $ | 358 | ||||||
| Research and development |
3,903 | 3,642 | 9,876 | |||||||||
| Sales and marketing |
4,882 | 3,089 | 6,650 | |||||||||
| General and administrative |
13,938 | 2,103 | 3,283 | |||||||||
|
|
|
|
|
|
|
|||||||
| Total share-based compensation expense |
$ | 23,852 | $ | 9,370 | $ | 20,167 | ||||||
|
|
|
|
|
|
|
|||||||
58
Table of Contents
| (2) | Includes amortization expense of acquired intangible assets as follows: |
| Year Ended December 31, | ||||||||||||
| 2020 | 2019 | 2018 | ||||||||||
|
|
|
|||||||||||
| (in thousands) | ||||||||||||
| Cost of revenue: license—self-managed |
$ | 832 | $ | 834 | $ | 318 | ||||||
| Sales and marketing |
729 | 695 | 107 | |||||||||
|
|
|
|
|
|
|
|||||||
| Total amortization expense of acquired intangible assets |
$ | 1,561 | $ | 1,529 | $ | 425 | ||||||
|
|
|
|
|
|
|
|||||||
| (3) | Includes acquisition-related costs as follows: |
| Year Ended December 31, | ||||||||||||
| 2020 | 2019 | 2018 | ||||||||||
|
|
|
|||||||||||
| (in thousands) | ||||||||||||
| Research and development |
$ | 1,403 | $ | 1,223 | $ | 96 | ||||||
| Sales and marketing |
367 | 420 | 207 | |||||||||
| General and administrative |
— | 342 | 468 | |||||||||
|
|
|
|
|
|
|
|||||||
| Total acquisition-related costs |
$ | 1,770 | $ | 1,985 | $ | 771 | ||||||
|
|
|
|
|
|
|
|||||||
| December 31, | ||||||||||||
| 2020 | 2019 | 2018 | ||||||||||
|
|
|
|||||||||||
| Selected Consolidated Balance Sheets Data | (in thousands) | |||||||||||
| Cash, cash equivalents, and short-term investments |
$ | 598,056 | $ | 166,481 | $ | 177,878 | ||||||
| Working capital |
$ | 529,861 | $ | 112,928 | $ | 140,622 | ||||||
| Total assets |
$ | 689,231 | $ | 238,040 | $ | 217,103 | ||||||
| Deferred revenue, current and noncurrent |
$ | 102,837 | $ | 82,305 | $ | 70,170 | ||||||
| Convertible preferred shares |
$ | — | $ | 175,844 | $ | 175,844 | ||||||
| Accumulated deficit |
$ | (74,789 | ) | $ | (65,384 | ) | $ | (59,990 | ) | |||
| Total shareholders’ equity (deficit) |
$ | 553,894 | $ | (33,434 | ) | $ | (38,677 | ) | ||||
59
Table of Contents
Item 7. Management’s Discussion and Analysis of Financial Condition and Results of Operations
The following discussion and analysis of our financial condition and results of operations should be read in conjunction with our consolidated financial statements and the related notes included elsewhere in this Annual Report on Form 10-K. You should review the section titled “Special Note Regarding Forward-Looking Statements” above in this Annual Report on Form 10-K for a discussion of forward-looking statements and important factors that could cause actual results to differ materially from the results described in or implied by the forward-looking statements contained in the following discussion and analysis. Factors that could cause or contribute to such differences include, but are not limited to, those identified below, and those discussed in the section titled “Risk Factors” in this Annual Report on Form 10-K. Our historical results are not necessarily indicative of the results that may be expected for any period in the future.
Overview
JFrog’s vision is to power a world of continuously updated, version-less software—we call this Liquid Software.
We provide an end-to-end, hybrid, universal DevOps Platform to achieve Continuous Software Release Management, or CSRM. Our leading CSRM platform enables organizations to continuously deliver software updates across any system. Our platform is the critical bridge between software development and deployment of that software, paving the way for the modern DevOps paradigm. We enable organizations to build and release software faster and more securely while empowering developers to be more efficient. As of December 31, 2020, we had a global customer base of approximately 6,050 organizations across all industries and sizes, including approximately 78% of Fortune 100 organizations, increasing from approximately 5,600 organizations as of December 31, 2019. All of the top 10 technology organizations, 8 of the top 10 financial services organizations, 9 of the top 10 retail organizations, all of the top 10 healthcare organizations, and 7 of the top 9 telecommunications organizations in the Fortune 500 have adopted JFrog, embarking on their journey towards Liquid Software. For the year ended December 31, 2020, our 10 largest customers represented approximately 8% of our total revenue and no single customer accounted for more than 2% of our total revenue. For the year ended December 31, 2020, 36% of our revenue was generated from customers outside of the United States.
We have designed our subscription structure and go-to-market strategy to align our growth with the success of our customers. Our business model benefits from our ability to serve the needs of all customers, from individual software developers and IT operators to the largest organizations, in a value-oriented manner.
We generate revenue from the sale of subscriptions to customers. All of our subscription tiers are available for self-managed deployments, where our customers deploy and manage our products across their public cloud, on-premise, private cloud, or hybrid environments, as well as JFrog-managed public cloud deployments, which we refer to as our SaaS subscriptions. Due to ease of use, none of our subscriptions require the use of professional services. For the year ended December 31, 2020, 22% of our revenue came from SaaS subscriptions, compared to 18% for the year ended December 31, 2019.
Our self-managed subscriptions are offered on an annual and multi-year basis, and our SaaS subscriptions are offered on an annual and on a monthly basis. For the year ended December 31, 2020, approximately 87% of our revenue came from subscriptions that provide our customers with access to multiple products, compared to approximately 85% for the year ended December 31, 2019. For the year ended December 31, 2020, approximately 20% of our revenue came from Enterprise Plus subscription, compared to approximately 10% for the year ended December 31, 2019. The growth in revenue from our Enterprise Plus subscription, which was first launched in 2018 for self-managed deployments and during 2020 for SaaS deployments, demonstrates the increased demand for our end-to-end solutions for customers’ entire CSRM workflows.
We have an unwavering commitment to the software developer and IT operator communities, and show this commitment by offering varying forms of free access to our products in addition to the paid subscriptions
60
Table of Contents
described above. This free access takes the form of free trials, freemium offerings, and open source software, and helps generate demand for our paid offerings within the software developer and IT operator communities.
We had 598.1 million of cash, cash equivalents, and short-term investments as of December 31, 2020. We generated revenue of $150.8 million, $104.7 million, and $63.5 million for the years ended December 31, 2020, 2019, and 2018, respectively, representing period-over-period growth rate of 44% and 65% for years ended December 31, 2020 and 2019, respectively. Our net loss was $9.4 million, $5.4 million, and $26.0 million for the years ended December 31, 2020, 2019, and 2018, respectively. We generated operating cash flow of $29.5 million, $10.0 million, and $8.6 million for the years ended December 31, 2020, 2019, and 2018, respectively.
Recent Developments
The COVID-19 pandemic has resulted in travel restrictions, prohibitions of non-essential activities, disruption and shutdown of certain businesses, and greater uncertainty in global financial markets. Such conditions are creating disruption in global supply chains, increasing rates of unemployment, and adversely impacting many industries. The outbreak could have a continued adverse impact on economic and market conditions and trigger a global economic slowdown.
As of the date of this Annual Report on Form 10-K, the full impact of the COVID-19 pandemic on the global economy and the extent to which the COVID-19 pandemic may impact our financial condition or results of operations remain uncertain. Furthermore, because of our subscription-based business model, the effect of the COVID-19 pandemic may not be fully reflected in our results of operations and overall financial condition until future periods, if at all.
We have experienced slowed growth during the COVID-19 pandemic. We expect to experience slowed growth and decline in new customer orders for our platform and lower demand from our existing customers for upgrades within our platform, primarily due to changes in customer spend patterns and IT budgets. We have experienced and expect to continue to experience an increase in the average length of sales cycles and delays in new projects, all of which have adversely affected and could materially adversely impact our business, results of operations, and overall financial condition in future periods. The extent and continued impact of the COVID-19 pandemic on our operational and financial condition will depend on certain developments, including: the duration and spread of the outbreak; government responses to the pandemic; its impact on the health and welfare of our employees and their families; its impact on our customers and our sales cycles; its impact on customer, industry, or technology-based community events; delays in onboarding new employees; and effects on our partners, some of which are uncertain, difficult to predict, and not within our control. General economic conditions and disruptions in global markets due to the COVID-19 pandemic and other global events may also affect our future performance.
In response to the COVID-19 pandemic, in the first quarter of 2020, we temporarily closed all of our offices, enabled our entire work force to work remotely and implemented travel restrictions for non-essential business. Since the second quarter of 2020, we intermittently reopened our offices in Israel. In the second half of 2020, we reopened our offices in India, the U.S. and France to partial capacity, as permitted by local governmental restrictions. The impact, if any, of these and any additional operational changes we may implement are uncertain. The changes we have implemented to date have not affected and are not expected to materially affect our ability to maintain operations, including financial reporting systems, internal control over financial reporting, and disclosure controls and procedures.
See the section titled “Risk Factors” for further discussion of the possible impact of the COVID-19 pandemic on our business.
61
Table of Contents
Factors Affecting Our Performance
We believe that our future performance will depend on many factors, including the following:
Extending Our Technology Leadership
We intend to continue to enhance our platform by developing new products and expanding the functionality of existing products to maintain our technology leadership. Since our initial launch of JFrog Artifactory, we have released several additional products that together create a unified platform for CSRM.
We invest heavily in integrating our products with the major package technologies so that our products can be easily adopted in any development environment. We believe that these integrations increase the value of our platform to our customers, as they provide freedom of choice for software developers and IT operators and help avoid vendor lock-in. We intend to expend additional resources in the future to continue introducing new products, features, and functionality.
Expanding Usage by Existing Customers
We believe that there is a significant opportunity for growth with many of our existing customers. Many customers purchase our products through self-service channels and often materially expand their usage over time. Increased engagement with our products provides our support and customer success teams opportunities to work directly with customers and introduce them to additional products and features, as well as drive usage of our products across large teams and more broadly across organizations. In order for us to continue to expand usage within our existing customers we will need to maintain engineering-level customer support, and continue to introduce new products and features that are responsive to our customers’ needs.
We quantify our expansion across existing customers through our net dollar retention rate. Our net dollar retention rate compares our annual recurring revenue (“ARR”) from the same set of customers across comparable periods. We define ARR as the annualized revenue run-rate of subscription agreements from all customers as of the last month of the quarter. The ARR includes monthly subscription customers so long as we generate revenue from these customers. We annualize our monthly subscriptions by taking the revenue we would contractually expect to receive from such customers in a given month and multiplying it by 12. We calculate net dollar retention rate by first identifying customers (the “Base Customers”), which were customers in the last month of a particular quarter (the “Base Quarter”). We then calculate the contracted ARR from these Base Customers in the last month of the same quarter of the subsequent year (the “Comparison Quarter”). This calculation captures upsells, contraction, and attrition since the Base Quarter. We then divide total Comparison Quarter ARR by total Base Quarter ARR for Base Customers. Our net dollar retention rate in a particular quarter is obtained by averaging the result from that particular quarter with the corresponding results from each of the prior three quarters. Our net dollar retention rate may fluctuate as a result of a number of factors, including the level of penetration within our customer base, expansion of products and features, and our ability to retain our customers. As of December 31, 2020 and 2019, our net dollar retention rate was 133% and 142%, respectively.
We focus on growing the number of large customers as a measure of our ability to scale with our customers and attract larger organizations to adopt our products. As of December 31, 2019, 234 of our customers had ARR of $100,000 or more, increasing to 352 customers as of December 31, 2020. We had 7 customers with ARR of at least $1.0 million as of December 31, 2019, increasing to 10 customers with ARR of at least $1.0 million as of December 31, 2020.
Acquiring New Customers
We believe there is a significant opportunity to grow the number of customers that use our platform. As of December 31, 2020, approximately 27% of the Forbes Global 2000 were JFrog customers. Our results of
62
Table of Contents
operations and growth prospects will depend in part on our ability to attract new customers. To date, we have relied on our self-service and inbound sales model to attract new customers. Prospective customers can evaluate and adopt our products through our free trials, freemium offerings, and open source software options. The costs associated with providing these free trials, freemium offerings, and open source software options are included in sales and marketing. While we believe we have a significant market opportunity that our platform addresses, we will need to continue to invest in customer support, sales and marketing, and research and development in order to address this opportunity.
Additionally, we believe our products address the software release needs of customers worldwide, and we see international expansion as a major opportunity. We have been operating and selling our products in international markets since our inception. While we believe global demand for our products will continue to increase as international market awareness of our brand grows, our ability to conduct our operations internationally will require considerable management attention and resources and is subject to the particular challenges of supporting a rapidly growing business in an environment of multiple languages, cultures, customs, legal and regulatory systems, alternative dispute systems, and commercial markets.
Non-GAAP Financial Measures
In addition to our results determined in accordance with GAAP, we believe that free cash flow, a non-GAAP financial measure, is useful in evaluating the performance of our business.
Free Cash Flow
Free cash flow is a non-GAAP financial measure that we calculate as net cash provided by operating activities less purchases of property and equipment. We believe this is a useful indicator of liquidity that provides information to management and investors about the amount of cash generated from our core operations that, after the purchases of property and equipment, can be used for strategic initiatives, including investing in our business, making strategic acquisitions, and strengthening our balance sheet. Free cash flow has limitations as an analytical tool, and it should not be considered in isolation or as a substitute for analysis of other GAAP financial measures, such as net cash provided by operating activities. Some of the limitations of free cash flow are that this metric does not reflect our future contractual commitments and may be calculated differently by other companies in our industry, limiting its usefulness as a comparative measure. We expect our free cash flow to fluctuate in future periods as we invest in our business to support our plans for growth.
The following table summarizes our cash flows for the periods presented and provides a reconciliation of net cash from operating activities, the most directly comparable financial measure calculated in accordance with GAAP, to free cash flow, a non-GAAP financial measure, for each of the periods presented:
| Year Ended December 31, | ||||||||||||
| 2020 | 2019 | 2018 | ||||||||||
|
|
|
|||||||||||
| (in thousands) | ||||||||||||
| Net cash provided by operating activities |
$ | 29,458 | $ | 10,004 | $ | 8,562 | ||||||
| Less: purchases of property and equipment |
(3,522 | ) | (1,803 | ) | (2,075 | ) | ||||||
|
|
|
|
|
|
|
|||||||
| Free cash flow |
$ | 25,936 | $ | 8,201 | $ | 6,487 | ||||||
|
|
|
|
|
|
|
|||||||
| Net cash used in investing activities |
$ | (311,796 | ) | $ | (149,585 | ) | $ | (3,075 | ) | |||
|
|
|
|
|
|
|
|||||||
| Net cash provided by financing activities |
$ | 406,134 | $ | 736 | $ | 114,477 | ||||||
|
|
|
|
|
|
|
|||||||
63
Table of Contents
Components of Results of Operations
Revenue
Our revenues are comprised of revenue from self-managed subscriptions and SaaS subscriptions. Subscriptions to our self-managed software include license, support, and upgrades and updates on a when-and-if-available basis. Our SaaS subscriptions provide access to our latest managed version of our product hosted in a public cloud.
Subscription—Self-Managed and SaaS
Subscription—self-managed and SaaS revenue is generated from the sale of subscriptions for our self-managed software products and revenue from our SaaS subscriptions. For subscriptions to our self-managed software products, revenue is recognized ratably over the subscription term. For our SaaS subscriptions, revenue is recognized based on usage as the usage occurs over the contract period.
License—Self-Managed
The license component of our self-managed subscriptions reflects the revenue recognized by providing customers with access to proprietary software features. License revenue is recognized upfront when the software license is made available to our customer.
Cost of Revenue
Subscription—Self-Managed and SaaS
Cost of subscription—self-managed and SaaS revenue primarily consists of expenses related to providing support to our customers and cloud-related costs, such as hosting and managing costs. These costs primarily consist of personnel-related expenses of our services and customer support personnel, share-based compensation expenses, public cloud infrastructure costs, depreciation of property and equipment, and allocated overhead. We expect our cost of subscription and SaaS revenue to increase in absolute dollars as our subscription and SaaS revenue increases.
License—Self-Managed
Cost of license self-managed revenue consists of amortization associated with acquired intangible assets.
Operating Expenses
Research and Development
Research and development costs primarily consist of personnel-related expenses, share-based compensation expenses, associated with our engineering personnel responsible for the design, development, and testing of our products, cost of development environments and tools, and allocated overhead. We expect that our research and development expenses will continue to increase as we increase our research and development headcount to further strengthen and enhance our products and invest in the development of our software.
Sales and Marketing
Sales and marketing expenses primarily consist of personnel-related expenses, share-based compensation expenses, sales commissions directly associated with our sales and marketing organizations, public cloud infrastructure costs associated with our free trials, freemium offerings, and open source software options, and costs associated with marketing programs and user events. Marketing programs include advertising, promotional events, and brand-building activities. We plan to increase our investment in sales and marketing over the foreseeable future, as we continue to hire additional personnel and invest in sales and marketing programs.
64
Table of Contents
General and Administrative
General and administrative expenses primarily consist of personnel-related expenses, share-based compensation expenses, associated primarily with our finance, legal, human resources and other operational and administrative functions, professional fees for external legal, accounting and other consulting services, directors and officer’s insurance expenses, and allocated overhead. We expect to increase the size of our general and administrative function to support the growth of our business. As a result, we expect our general and administrative expenses to increase for the foreseeable future.
Interest and Other Income, Net
Interest and other income, net primarily consists of income earned on our cash equivalents and short-term investments. Interest and other income, net also includes foreign exchange gains and losses.
Income Tax Expense
Income tax expense consists primarily of income taxes related to the U.S. and other foreign jurisdictions in which we conduct business. We maintain a full valuation allowance on certain deferred tax assets in Israel as we have concluded that it is not more likely than not that the deferred tax assets will be realized. Our effective tax rate is affected by tax rates in foreign jurisdictions and the relative amounts of income we earn in those jurisdictions, as well as non-deductible expenses, such as share-based compensation, and changes in our valuation allowance.
Results of Operations
The following tables set forth selected consolidated statements of operations data and such data as a percentage of total revenue for each of the periods indicated:
| Year Ended December 31, | ||||||||||||
| 2020 | 2019 | 2018 | ||||||||||
|
|
|
|||||||||||
| (in thousands) | ||||||||||||
| Revenue: |
||||||||||||
| Subscription—self-managed and SaaS |
$ | 137,978 | $ | 94,606 | $ | 56,054 | ||||||
| License—self-managed |
12,849 | 10,110 | 7,478 | |||||||||
|
|
|
|
|
|
|
|||||||
| Total subscription revenue |
150,827 | 104,716 | 63,532 | |||||||||
| Cost of revenue: |
||||||||||||
| Subscription—self-managed and SaaS(1) |
27,619 | 19,201 | 10,393 | |||||||||
| License—self-managed(2) |
832 | 834 | 318 | |||||||||
|
|
|
|
|
|
|
|||||||
| Total cost of revenue—subscription |
28,451 | 20,035 | 10,711 | |||||||||
|
|
|
|
|
|
|
|||||||
| Gross profit |
122,376 | 84,681 | 52,821 | |||||||||
|
|
|
|
|
|
|
|||||||
| Operating expenses: |
||||||||||||
| Research and development(1)(3) |
41,113 | 29,730 | 25,861 | |||||||||
| Sales and marketing(1)(2)(3) |
60,936 | 44,088 | 34,972 | |||||||||
| General and administrative(1)(3) |
34,519 | 17,800 | 18,843 | |||||||||
|
|
|
|
|
|
|
|||||||
| Total operating expenses |
136,568 | 91,618 | 79,676 | |||||||||
|
|
|
|
|
|
|
|||||||
| Operating loss |
(14,192 | ) | (6,937 | ) | (26,855 | ) | ||||||
| Interest and other income, net |
2,045 | 3,171 | 1,310 | |||||||||
|
|
|
|
|
|
|
|||||||
| Loss before income taxes |
(12,147 | ) | (3,766 | ) | (25,545 | ) | ||||||
| Income tax expense (benefit) |
(2,742 | ) | 1,628 | 470 | ||||||||
|
|
|
|
|
|
|
|||||||
| Net loss |
$ | (9,405 | ) | $ | (5,394 | ) | $ | (26,015 | ) | |||
|
|
|
|
|
|
|
|||||||
65
Table of Contents
| (1) | Includes share-based compensation expense as follows: |
| Year Ended December 31, | ||||||||||||
| 2020 | 2019 | 2018 | ||||||||||
|
|
|
|||||||||||
| (in thousands) | ||||||||||||
| Cost of revenue: subscription–self-managed and SaaS |
$ | 1,129 | $ | 536 | $ | 358 | ||||||
| Research and development |
3,903 | 3,642 | 9,876 | |||||||||
| Sales and marketing |
4,882 | 3,089 | 6,650 | |||||||||
| General and administrative |
13,938 | 2,103 | 3,283 | |||||||||
|
|
|
|
|
|
|
|||||||
| Total share-based compensation expense |
$ | 23,852 | $ | 9,370 | $ | 20,167 | ||||||
|
|
|
|
|
|
|
|||||||
| (2) | Includes amortization expense of acquired intangible assets as follows: |
| Year Ended December 31, | ||||||||||||
| 2020 | 2019 | 2018 | ||||||||||
|
|
|
|||||||||||
| (in thousands) | ||||||||||||
| Cost of revenue: license—self-managed |
$ | 832 | $ | 834 | $ | 318 | ||||||
| Sales and marketing |
729 | 695 | 107 | |||||||||
|
|
|
|
|
|
|
|||||||
| Total amortization expense of acquired intangible assets |
$ | 1,561 | $ | 1,529 | $ | 425 | ||||||
|
|
|
|
|
|
|
|||||||
| (3) | Includes acquisition-related costs as follows: |
| Year Ended December 31, | ||||||||||||
| 2020 | 2019 | 2018 | ||||||||||
|
|
|
|||||||||||
| (in thousands) | ||||||||||||
| Research and development |
$ | 1,403 | $ | 1,223 | $ | 96 | ||||||
| Sales and marketing |
367 | 420 | 207 | |||||||||
| General and administrative |
— | 342 | 468 | |||||||||
|
|
|
|
|
|
|
|||||||
| Total acquisition-related costs |
$ | 1,770 | $ | 1,985 | $ | 771 | ||||||
|
|
|
|
|
|
|
|||||||
| Year Ended December 31, | ||||||||||||
| 2020 | 2019 | 2018 | ||||||||||
|
|
||||||||||||
| (as a percentage of revenue) | ||||||||||||
| Revenue: |
||||||||||||
| Subscription—self-managed and SaaS |
91 | % | 90 | % | 88 | % | ||||||
| License—self-managed |
9 | 10 | 12 | |||||||||
|
|
|
|
|
|
|
|||||||
| Total subscription revenue |
100 | 100 | 100 | |||||||||
| Cost of revenue: |
||||||||||||
| Subscription—self-managed and SaaS |
18 | 18 | 16 | |||||||||
| License—self-managed |
1 | 1 | 1 | |||||||||
|
|
|
|
|
|
|
|||||||
| Total cost of revenue—subscription |
19 | 19 | 17 | |||||||||
|
|
|
|
|
|
|
|||||||
| Gross profit |
81 | 81 | 83 | |||||||||
|
|
|
|
|
|
|
|||||||
| Operating expenses: |
||||||||||||
| Research and development |
27 | 29 | 41 | |||||||||
| Sales and marketing |
40 | 42 | 55 | |||||||||
| General and administrative |
23 | 17 | 29 | |||||||||
|
|
|
|
|
|
|
|||||||
| Total operating expenses |
90 | 88 | 125 | |||||||||
|
|
|
|
|
|
|
|||||||
| Operating loss |
(9 | ) | (7 | ) | (42 | ) | ||||||
| Interest and other income, net |
1 | 3 | 2 | |||||||||
|
|
|
|
|
|
|
|||||||
| Loss before income taxes |
(8 | ) | (4 | ) | (40 | ) | ||||||
| Income tax expense (benefit) |
(2 | ) | 1 | 1 | ||||||||
|
|
|
|
|
|
|
|||||||
| Net loss |
(6 | )% | (5 | )% | (41 | )% | ||||||
|
|
|
|
|
|
|
|||||||
66
Table of Contents
Comparison of the Years Ended December 31, 2020 and 2019
Revenue
| Year Ended December 31, | ||||||||||||||||
| 2020 | 2019 | $ Change | % Change | |||||||||||||
|
|
|
|||||||||||||||
| (in thousands) | ||||||||||||||||
| Subscription—self-managed and SaaS |
$ | 137,978 | $ | 94,606 | $ | 43,372 | 46 | % | ||||||||
| License—self-managed |
12,849 | 10,110 | 2,739 | 27 | ||||||||||||
|
|
|
|
|
|
|
|
|
|||||||||
| Total subscription revenue |
$ | 150,827 | $ | 104,716 | $ | 46,111 | 44 | % | ||||||||
|
|
|
|
|
|
|
|
|
|||||||||
Total subscription revenue increased $46.1 million, or 44%, for the year ended December 31, 2020 compared to the year ended December 31, 2019. Approximately $39.6 million of the increase in revenue was attributable to the growth from existing customers, and the remaining increase in revenue was attributable to new customers.
Cost of Revenue and Gross Margin
| Year Ended December 31, | ||||||||||||||||
| 2020 | 2019 | $ Change | % Change | |||||||||||||
|
|
|
|||||||||||||||
| (in thousands) | ||||||||||||||||
| Subscription—self-managed and SaaS |
$ | 27,619 | $ | 19,201 | $ | 8,418 | 44 | % | ||||||||
| License—self-managed |
832 | 834 | (2 | ) | (0 | ) | ||||||||||
|
|
|
|
|
|
|
|
|
|||||||||
| Total cost of revenue—subscription |
$ | 28,451 | $ | 20,035 | $ | 8,416 | 42 | % | ||||||||
|
|
|
|
|
|
|
|
|
|||||||||
| Gross margin |
81 | % | 81 | % | ||||||||||||
Total cost of subscription revenue increased $8.4 million, or 42%, for the year ended December 31, 2020 compared to the year ended December 31, 2019. This increase was primarily attributable to an increase of $2.9 million in cloud-related costs, such as hosting and managing costs, driven by increased revenue from SaaS subscriptions, an increase of $2.6 million in personnel-related expenses as a result of increased headcount, an increase of $0.8 million related to costs of access to vulnerability databases, and an increase of $0.6 million in share-based compensation expense as discussed in the section titled “Share-based Compensation Expense” below.
Our gross margin for subscription revenue remained unchanged for the year ended December 31, 2020 as compared to the year ended December 31, 2019.
Operating Expenses
Research and Development
| Year Ended December 31, | ||||||||||||||||
| 2020 | 2019 | $ Change | % Change | |||||||||||||
|
|
|
|||||||||||||||
| (in thousands) | ||||||||||||||||
| Research and development |
$ | 41,113 | $ | 29,730 | $ | 11,383 | 38 | % | ||||||||
Research and development expense increased $11.4 million, or 38%, for the year ended December 31, 2020 compared to the year ended December 31, 2019, primarily due to an increase of $6.6 million in personnel-related expenses as a result of increased headcount and an increase of $2.5 million in cloud-related costs incurred in product development.
67
Table of Contents
Sales and Marketing
| Year Ended December 31, | ||||||||||||||||
| 2020 | 2019 | $ Change | % Change | |||||||||||||
|
|
|
|||||||||||||||
| (in thousands) | ||||||||||||||||
| Sales and marketing |
$ | 60,936 | $ | 44,088 | $ | 16,848 | 38 | % | ||||||||
Sales and marketing expense increased $16.8 million, or 38%, for the year ended December 31, 2020 compared to the year ended December 31, 2019. The increase was primarily attributable to an increase of $9.1 million in personnel-related expenses primarily as a result of increased headcount, an increase of $3.9 million in hosting costs related to our freemium offerings, trials, and community centers, an increase of $1.8 million in share-based compensation expense, as discussed in the section titled “Share-based Compensation Expense” below, and an increase of $1.3 million in commissions expense related to the amortization of deferred contract acquisition costs, driven by an increase in total sales. These increases were partially offset by a decrease of $1.0 million in travel costs due to COVID-19 travel restrictions and a decrease of $0.9 million in marketing programs and user events.
General and Administrative
| Year Ended December 31, | ||||||||||||||||
| 2020 | 2019 | $ Change | % Change | |||||||||||||
|
|
|
|||||||||||||||
| (in thousands) | ||||||||||||||||
| General and administrative |
$ | 34,519 | $ | 17,800 | $ | 16,719 | 94 | % | ||||||||
General and administrative expense increased $16.7 million, or 94%, for the year ended December 31, 2020 compared to the year ended December 31, 2019. The increase was primarily attributable to an increase of $11.8 million in share-based compensation expense, as discussed in the section titled “Share-based Compensation Expense” below, an increase of $1.7 million in personnel-related expenses as a result of increased headcount, an increase of $1.3 million in officer and director insurance premium, and an increase of $1.2 million in professional fees for recruiting, legal, accounting, and other consulting services.
Share-based Compensation Expense
| Year Ended December 31, | ||||||||||||||||
| 2020 | 2019 | $ Change | % Change | |||||||||||||
|
|
|
|||||||||||||||
| (in thousands) | ||||||||||||||||
| Cost of revenue: subscription–self-managed and SaaS |
$ | 1,129 | $ | 536 | $ | 593 | 111 | % | ||||||||
| Research and development |
3,903 | 3,642 | 261 | 7 | ||||||||||||
| Sales and marketing |
4,882 | 3,089 | 1,793 | 58 | ||||||||||||
| General and administrative |
13,938 | 2,103 | 11,835 | 563 | ||||||||||||
|
|
|
|
|
|
|
|
|
|||||||||
| Total share-based compensation expense |
$ | 23,852 | $ | 9,370 | $ | 14,482 | 155 | % | ||||||||
|
|
|
|
|
|
|
|
|
|||||||||
Share-based compensation expenses increased $14.5 million, or 155%, for the year ended December 31, 2020 compared to the year ended December 31, 2019. The increase was primarily due to $11.4 million in share-based compensation expense recognized during the year ended December 31, 2020, related to RSUs granted to our chief executive officer in August 2020. See Note 11 to our consolidated financial statements in this Annual Report on Form 10-K for more information regarding these RSUs. The increase was partially offset by compensation expense of $3.3 million incurred as a result of a secondary transaction during the year ended December 31, 2019.The remaining increase in share-based compensation expense was attributable to grants to new and existing employees.
68
Table of Contents
Interest and Other Income, Net
| Year Ended December 31, | ||||||||||||||||
| 2020 | 2019 | $ Change | % Change | |||||||||||||
|
|
|
|||||||||||||||
| (in thousands) | ||||||||||||||||
| Interest and other income, net |
$ | 2,045 | $ | 3,171 | $ | (1,126 | ) | (36 | )% | |||||||
Interest and other income, net decreased by $1.1 million, or 36%, for the year ended December 31, 2020 compared to the year ended December 31, 2019, primarily due to lower interest income on deposit and investment balances as a result of lower interest rates during the period.
Income Tax Expense (Benefit)
| Year Ended December 31, | ||||||||||||||||
| 2020 | 2019 | $ Change | % Change | |||||||||||||
|
|
|
|||||||||||||||
| (in thousands) | ||||||||||||||||
| Income tax expense (benefit) |
$ | (2,742 | ) | $ | 1,628 | $ | (4,370 | ) | (268 | )% | ||||||
| Effective income tax rate |
23 | % | (43 | )% | ||||||||||||
We recorded an income tax benefit of $2.7 million and income tax expense of $1.6 million for the years ended December 31, 2020 and 2019, respectively. This change was primarily due to $3.4 million income tax benefit in the U.S. as a result of higher loss before income tax from our operations. Our effective tax rate was 23% and (43)% of our loss before income taxes for the years ended December 31, 2020 and 2019, respectively. Our effective tax rate is affected primarily by tax rates in foreign jurisdictions and the relative amounts of income we earn in those jurisdictions, as well as non-deductible expenses, such as share-based compensation, and changes in our valuation allowance.
For discussion on comparison of the years ended December 31, 2019 and 2018, see the section titled “Results of Operations” disclosed in the section titled “Management’s Discussion and Analysis of Financial Condition and Results of Operations” of our Prospectus, which was filed with the SEC on September 16, 2020 and hereby incorporated by reference herein and considered part of this Annual Report on Form 10-K only to the extent referenced.
69
Table of Contents
Quarterly Results of Operations
The following tables set forth our unaudited quarterly consolidated statements of operations data for each of the quarters indicated, as well as the percentage that each line item represents of our total revenue for each quarter presented. The information for each quarter has been prepared on a basis consistent with our audited consolidated financial statements included in this Annual Report on Form 10-K, and reflect, in the opinion of management, all adjustments of a normal, recurring nature that are necessary for a fair statement of the financial information contained in those financial statements. Our historical results are not necessarily indicative of the results that may be expected in the future. The following quarterly financial data should be read in conjunction with our consolidated financial statements included elsewhere in this Annual Report on Form 10-K.
| Three Months Ended | ||||||||||||||||||||||||||||||||
| March 31, 2019 |
June 30, 2019 |
September 30, 2019 |
December 31, 2019 |
March 31, 2020 |
June 30, 2020 |
September 30, 2020 |
December 31, 2020 |
|||||||||||||||||||||||||
|
|
||||||||||||||||||||||||||||||||
| (in thousands) | ||||||||||||||||||||||||||||||||
| Revenue: |
||||||||||||||||||||||||||||||||
| Subscription—self-managed and SaaS |
$ | 19,413 | $ | 22,267 | $ | 25,070 | $ | 27,856 | $ | 30,297 | $ | 33,161 | $ | 35,714 | $ | 38,806 | ||||||||||||||||
| License—self-managed |
1,800 | 2,635 | 2,774 | 2,901 | 2,524 | 3,270 | 3,172 | 3,883 | ||||||||||||||||||||||||
|
|
|
|
|
|
|
|
|
|
|
|
|
|
|
|
|
|||||||||||||||||
| Total subscription revenue |
21,213 | 24,902 | 27,844 | 30,757 | 32,821 | 36,431 | 38,886 | 42,689 | ||||||||||||||||||||||||
| Cost of revenue: |
||||||||||||||||||||||||||||||||
| Subscription—self-managed and SaaS(1) |
3,746 | 4,465 | 5,109 | 5,881 | 6,190 | 6,475 | 7,047 | 7,907 | ||||||||||||||||||||||||
| License—self-managed(2) |
123 | 239 | 240 | 232 | 214 | 214 | 214 | 190 | ||||||||||||||||||||||||
|
|
|
|
|
|
|
|
|
|
|
|
|
|
|
|
|
|||||||||||||||||
| Total cost of revenue—subscription |
3,869 | 4,704 | 5,349 | 6,113 | 6,404 | 6,689 | 7,261 | 8,097 | ||||||||||||||||||||||||
|
|
|
|
|
|
|
|
|
|
|
|
|
|
|
|
|
|||||||||||||||||
| Gross profit |
17,344 | 20,198 | 22,495 | 24,644 | 26,417 | 29,742 | 31,625 | 34,592 | ||||||||||||||||||||||||
|
|
|
|
|
|
|
|
|
|
|
|
|
|
|
|
|
|||||||||||||||||
| Operating expenses: |
||||||||||||||||||||||||||||||||
| Research and development(1)(3) |
5,847 | 7,252 | 8,665 | 7,966 | 9,295 | 9,776 | 10,381 | 11,661 | ||||||||||||||||||||||||
| Sales and marketing(1)(2)(3) |
9,147 | 10,595 | 12,042 | 12,304 | 14,023 | 13,882 | 14,839 | 18,192 | ||||||||||||||||||||||||
| General and administrative(1)(3) |
4,106 | 3,777 | 5,108 | 4,809 | 5,198 | 4,746 | 11,804 | 12,771 | ||||||||||||||||||||||||
|
|
|
|
|
|
|
|
|
|
|
|
|
|
|
|
|
|||||||||||||||||
| Total operating expenses |
19,100 | 21,624 | 25,815 | 25,079 | 28,516 | 28,404 | 37,024 | 42,624 | ||||||||||||||||||||||||
|
|
|
|
|
|
|
|
|
|
|
|
|
|
|
|
|
|||||||||||||||||
| Operating income (loss) |
(1,756 | ) | (1,426 | ) | (3,320 | ) | (435 | ) | (2,099 | ) | 1,338 | (5,399 | ) | (8,032 | ) | |||||||||||||||||
| Interest and other income, net |
921 | 901 | 635 | 714 | 564 | 574 | 384 | 523 | ||||||||||||||||||||||||
|
|
|
|
|
|
|
|
|
|
|
|
|
|
|
|
|
|||||||||||||||||
| Income (loss) before income taxes |
(835 | ) | (525 | ) | (2,685 | ) | 279 | (1,535 | ) | 1,912 | (5,015 | ) | (7,509 | ) | ||||||||||||||||||
| Income tax expense (benefit) |
312 | 397 | 429 | 490 | 590 | 213 | 250 | (3,795 | ) | |||||||||||||||||||||||
|
|
|
|
|
|
|
|
|
|
|
|
|
|
|
|
|
|||||||||||||||||
| Net income (loss) |
$ | (1,147 | ) | $ | (922 | ) | $ | (3,114 | ) | $ | (211 | ) | $ | (2,125 | ) | $ | 1,699 | $ | (5,265 | ) | $ | (3,714 | ) | |||||||||
|
|
|
|
|
|
|
|
|
|
|
|
|
|
|
|
|
|||||||||||||||||
70
Table of Contents
(1) Includes share-based compensation expense as follows:
| Three Months Ended | ||||||||||||||||||||||||||||||||
| March 31, 2019 |
June 30, 2019 |
September 30, 2019 |
December 31, 2019 |
March 31, 2020 |
June 30, 2020 |
September 30, 2020 |
December 31, 2020 |
|||||||||||||||||||||||||
|
|
||||||||||||||||||||||||||||||||
| (in thousands) | ||||||||||||||||||||||||||||||||
| Cost of revenue: subscription–self-managed and SaaS |
$ | 85 | $ | 112 | $ | 225 | $ | 114 | $ | 140 | $ | 199 | $ | 327 | $ | 463 | ||||||||||||||||
| Research and development |
310 | 717 | 1,863 | 752 | 766 | 930 | 1,086 | 1,121 | ||||||||||||||||||||||||
| Sales and marketing |
377 | 435 | 1,665 | 612 | 673 | 1,097 | 1,263 | 1,849 | ||||||||||||||||||||||||
| General and administrative |
304 | 306 | 1,142 | 351 | 377 | 557 | 6,984 | 6,020 | ||||||||||||||||||||||||
|
|
|
|
|
|
|
|
|
|
|
|
|
|
|
|
|
|||||||||||||||||
| Total share-based compensation expense |
$ | 1,076 | $ | 1,570 | $ | 4,895 | $ | 1,829 | $ | 1,956 | $ | 2,783 | $ | 9,660 | $ | 9,453 | ||||||||||||||||
|
|
|
|
|
|
|
|
|
|
|
|
|
|
|
|
|
|||||||||||||||||
(2) Includes amortization expense of acquired intangible assets as follows:
| Three Months Ended | ||||||||||||||||||||||||||||||||
| March 31, 2019 |
June 30, 2019 |
September 30, 2019 |
December 31, 2019 |
March 31, 2020 |
June 30, 2020 |
September 30, 2020 |
December 31, 2020 |
|||||||||||||||||||||||||
|
|
||||||||||||||||||||||||||||||||
| (in thousands) | ||||||||||||||||||||||||||||||||
| Cost of revenue: license–self-managed |
$ | 123 | $ | 239 | $ | 240 | $ | 232 | $ | 214 | $ | 214 | $ | 214 | $ | 190 | ||||||||||||||||
| Sales and marketing |
132 | 199 | 182 | 182 | 182 | 182 | 183 | 182 | ||||||||||||||||||||||||
|
|
|
|
|
|
|
|
|
|
|
|
|
|
|
|
|
|||||||||||||||||
| Total amortization expense of acquired intangible assets |
$ | 255 | $ | 438 | $ | 422 | $ | 414 | $ | 396 | $ | 396 | $ | 397 | $ | 372 | ||||||||||||||||
|
|
|
|
|
|
|
|
|
|
|
|
|
|
|
|
|
|||||||||||||||||
(3) Includes acquisition-related costs as follows:
| Three Months Ended | ||||||||||||||||||||||||||||||||
| March 31, 2019 |
June 30, 2019 |
September 30, 2019 |
December 31, 2019 |
March 31, 2020 |
June 30, 2020 |
September 30, 2020 |
December 31, 2020 |
|||||||||||||||||||||||||
|
|
||||||||||||||||||||||||||||||||
| (in thousands) | ||||||||||||||||||||||||||||||||
| Research and development |
$ | 184 | $ | 349 | $ | 345 | $ | 345 | $ | 347 | $ | 352 | $ | 352 | $ | 352 | ||||||||||||||||
| Sales and marketing |
67 | 113 | 111 | 129 | 114 | 114 | 114 | 25 | ||||||||||||||||||||||||
| General and administrative |
313 | 29 | — | — | — | — | — | — | ||||||||||||||||||||||||
|
|
|
|
|
|
|
|
|
|
|
|
|
|
|
|
|
|||||||||||||||||
| Total acquisition-related costs |
$ | 564 | $ | 491 | $ | 456 | $ | 474 | $ | 461 | $ | 466 | $ | 466 | $ | 377 | ||||||||||||||||
|
|
|
|
|
|
|
|
|
|
|
|
|
|
|
|
|
|||||||||||||||||
71
Table of Contents
| Three Months Ended | ||||||||||||||||||||||||||||||||
| March 31, 2019 |
June 30, 2019 |
September 30, 2019 |
December 31, 2019 |
March 31, 2020 |
June 30, 2020 |
September 30, 2020 |
December 31, 2020 |
|||||||||||||||||||||||||
|
|
||||||||||||||||||||||||||||||||
| (as a percentage of revenue) | ||||||||||||||||||||||||||||||||
| Revenue: |
||||||||||||||||||||||||||||||||
| Subscription—self-managed and SaaS |
92 | % | 89 | % | 90 | % | 91 | % | 92 | % | 91 | % | 92 | % | 91 | % | ||||||||||||||||
| License—self-managed |
8 | 11 | 10 | 9 | 8 | 9 | 8 | 9 | ||||||||||||||||||||||||
|
|
|
|
|
|
|
|
|
|
|
|
|
|
|
|
|
|||||||||||||||||
| Total subscription revenue |
100 | 100 | 100 | 100 | 100 | 100 | 100 | 100 | ||||||||||||||||||||||||
| Cost of revenue: |
||||||||||||||||||||||||||||||||
| Subscription—self-managed and SaaS(1) |
17 | 18 | 18 | 19 | 19 | 17 | 18 | 19 | ||||||||||||||||||||||||
| License—self-managed(2) |
1 | 1 | 1 | 1 | 1 | 1 | 1 | 0 | ||||||||||||||||||||||||
|
|
|
|
|
|
|
|
|
|
|
|
|
|
|
|
|
|||||||||||||||||
| Total cost of revenue—subscription |
18 | 19 | 19 | 20 | 20 | 18 | 19 | 19 | ||||||||||||||||||||||||
|
|
|
|
|
|
|
|
|
|
|
|
|
|
|
|
|
|||||||||||||||||
| Gross profit |
82 | 81 | 81 | 80 | 80 | 82 | 81 | 81 | ||||||||||||||||||||||||
|
|
|
|
|
|
|
|
|
|
|
|
|
|
|
|
|
|||||||||||||||||
| Operating expenses: |
||||||||||||||||||||||||||||||||
| Research and development(1)(3) |
28 | 29 | 32 | 25 | 28 | 27 | 27 | 27 | ||||||||||||||||||||||||
| Sales and marketing(1)(2)(3) |
43 | 43 | 43 | 40 | 42 | 38 | 38 | 43 | ||||||||||||||||||||||||
| General and administrative(1)(3) |
19 | 15 | 18 | 16 | 16 | 13 | 30 | 30 | ||||||||||||||||||||||||
|
|
|
|
|
|
|
|
|
|
|
|
|
|
|
|
|
|||||||||||||||||
| Total operating expenses |
90 | 87 | 93 | 81 | 86 | 78 | 95 | 100 | ||||||||||||||||||||||||
|
|
|
|
|
|
|
|
|
|
|
|
|
|
|
|
|
|||||||||||||||||
| Operating income (loss) |
(8 | ) | (6 | ) | (12 | ) | (1 | ) | (6 | ) | 4 | (14 | ) | (19 | ) | |||||||||||||||||
| Interest and other income, net |
4 | 4 | 2 | 2 | 1 | 1 | 1 | 1 | ||||||||||||||||||||||||
|
|
|
|
|
|
|
|
|
|
|
|
|
|
|
|
|
|||||||||||||||||
| Income (loss) before income taxes |
(4 | ) | (2 | ) | (10 | ) | 1 | (5 | ) | 5 | (13 | ) | (18 | ) | ||||||||||||||||||
| Income tax expense (benefit) |
1 | 2 | 1 | 2 | 1 | 0 | 1 | (9 | ) | |||||||||||||||||||||||
|
|
|
|
|
|
|
|
|
|
|
|
|
|
|
|
|
|||||||||||||||||
| Net income (loss) |
(5 | )% | (4 | )% | (11 | )% | (1 | )% | (6 | )% | 5 | % | (14 | )% | (9 | )% | ||||||||||||||||
|
|
|
|
|
|
|
|
|
|
|
|
|
|
|
|
|
|||||||||||||||||
Quarterly Revenue Trends
Our total subscription revenue increased sequentially in the periods presented due to the growth from our existing customers and an increase in the number of new customers. As we generally invoice in advance for subscription agreements of at least one year in duration but recognize a majority of the revenue ratably over the term of those agreements, a substantial portion of the revenue that we report in each period is attributable to the recognition of deferred revenue relating to sales we received during previous periods. Consequently, increases or decreases in renewals, customer expansion, or new sales in a period typically will not be fully reflected in our total subscription revenue for that period and will positively or negatively affect our revenue in future periods.
Quarterly Cost of Revenue and Gross Margin Trends
Our total cost of revenue increased sequentially in the periods presented, primarily due to expanded adoption of our SaaS subscriptions by existing and new customers, which resulted in increased hosting and managing costs, as well as growth in personnel costs as we continue to grow our support team. Our quarterly gross margins were relatively unchanged in the periods presented.
Quarterly Operating Expenses Trends
Operating expenses have generally increased in each sequential quarter presented above primarily due to the increased headcount and associated personnel-related costs, share-based compensation, infrastructure and related
72
Table of Contents
costs to support our growth. We intend to continue to make significant investments in research and development as we add features and enhance our platform. We also intend to invest in our sales and marketing organization to drive future revenue growth.
Quarterly Interest and Other Income, Net Trends
Our quarterly interest and other income, net in general was lower in 2020 compared to 2019, primarily due to lower interest income received on existing cash and investment balances as a result of lower interest rates during the periods.
Liquidity and Capital Resources
Since our inception, we have financed our operations primarily through sales of equity securities and cash generated from operations. In September 2020, we completed our IPO of 9,735,232 ordinary shares at an offering price of $44.00 per share, including 1,735,232 shares pursuant to the exercise in full of the underwriters’ option to purchase additional shares, which resulted in net proceeds of $393.2 million, after deducting underwriting discounts and commissions and other issuance costs of $35.1 million. Our principal uses of cash in recent periods have been funding our operations, investing in capital expenditures, and various business and asset acquisitions.
As of December 31, 2020, our principal sources of liquidity were cash, cash equivalents, and short-term investments of $598.1 million, which were held for working capital purposes. Cash and cash equivalents consist of cash in banks, bank deposits, money market funds, and other highly liquid investments. Short-term investments generally consist of bank deposits, certificates of deposit, commercial paper, corporate debt securities, municipal securities, and government and agency debt. We believe our existing cash, cash equivalents, and short-term investments, together with cash provided by operations, will be sufficient to meet our needs for at least the next 12 months. Our future capital requirements will depend on many factors including our revenue growth rate, subscription renewal activity, billing frequency, the timing, and extent of spending to support further sales and marketing and research and development efforts, the continuing market acceptance of our products and services, as well as expenses associated with our international expansion, the timing, and extent of additional capital expenditures to invest in existing and new office spaces. We may in the future enter into arrangements to acquire or invest in complementary businesses, services, and technologies, including intellectual property rights. We may be required to seek additional equity or debt financing. In the event that additional financing is required from outside sources, we may not be able to raise it on terms acceptable to us or at all. If we are unable to raise additional capital when desired, our business, results of operations, and financial condition would be materially and adversely affected.
The following table summarizes our cash flows for the periods presented:
| Year Ended December 31, | ||||||||||||
| 2020 | 2019 | 2018 | ||||||||||
|
|
|
|||||||||||
| (in thousands) | ||||||||||||
| Net cash provided by operating activities |
$ | 29,458 | $ | 10,004 | $ | 8,562 | ||||||
| Net cash used in investing activities |
$ | (311,796 | ) | $ | (149,585 | ) | $ | (3,075 | ) | |||
| Net cash provided by financing activities |
$ | 406,134 | $ | 736 | $ | 114,477 | ||||||
Operating Activities
Net cash provided by operating activities of $29.5 million for the year ended December 31, 2020 was primarily related to our net loss of $9.4 million, adjusted for non-cash charges of $29.4 million and net cash inflows of $9.4 million provided by changes in our operating assets and liabilities. Non-cash charges primarily consisted of share-based compensation of $23.9 million and depreciation and amortization of $3.7 million. The main drivers of net cash inflows were derived from the changes in operating assets and liabilities and were
73
Table of Contents
related to an increase in deferred revenue of $20.5 million due to increases in sales, and an increase in accounts payable, accrued expenses and other liabilities of $10.4 million, partially offset by an increase in accounts receivable of $12.3 million due to timing of collections, and an increase in prepaid expenses and other assets of $7.0 million.
Net cash provided by operating activities of $10.0 million for the year ended December 31, 2019 was primarily related to our net loss of $5.4 million, adjusted for non-cash charges of $11.8 million and net cash inflows of $3.6 million provided by changes in our operating assets and liabilities. Non-cash charges primarily consisted of share-based compensation of $9.4 million and depreciation and amortization of $2.8 million. The main drivers of net cash inflows were derived from the changes in operating assets and liabilities and were related to an increase in deferred revenue of $12.1 million due to increases in sales, and an increase in accounts payable, accrued expenses and other liabilities of $2.9 million, partially offset by an increase in accounts receivable of $4.9 million due to timing of collections, an increase in prepaid expenses and other assets of $4.1 million, and net additions to deferred contract acquisition costs of $2.4 million.
Investing Activities
Net cash used in investing activities of $311.8 million for the year ended December 31, 2020 was due to net purchases of short-term investments of $308.3 million and capital expenditures of $3.5 million.
Net cash used in investing activities of $149.6 million for the year ended December 31, 2019 was related to net purchases of short-term investments of $126.9 million, net cash paid for business combination of $20.9 million, and capital expenditures of $1.8 million.
Financing Activities
Net cash provided by financing activities of $406.1 million for the year ended December 31, 2020 was primarily due to net proceeds from our IPO of $393.5 million after deducting underwriting discounts and commissions and other issuance costs, and proceeds of $9.2 million from employee equity transactions to be remitted to tax authorities.
Net cash provided by financing activities of $0.7 million for the year ended December 31, 2019 was primarily related to proceeds from exercise of share options of $1.2 million, partially offset by payments related to a prior year asset acquisition of $0.3 million and payments of deferred offering costs of $0.2 million.
For discussion on operating, investing, and financing activities of the year ended December 31, 2018, see the section titled “Liquidity and Capital Resources” disclosed in the section titled “Management’s Discussion and Analysis of Financial Condition and Results of Operations” of our Prospectus, which was filed with the SEC on September 16, 2020 and hereby incorporated by reference herein and considered part of this Annual Report on Form 10-K only to the extent referenced.
Commitments and Contractual Obligations
The following table summarizes our non-cancellable contractual obligations as of December 31, 2020:
| Payments Due by Period | ||||||||||||||||||||
| Total | Less Than 1 Year |
1-3 Years | 3-5 Years | Thereafter | ||||||||||||||||
|
|
|
|||||||||||||||||||
| (in thousands) | ||||||||||||||||||||
| Operating lease obligations |
$ | 25,634 | $ | 5,475 | $ | 11,360 | $ | 7,996 | $ | 803 | ||||||||||
| Purchase obligations |
82,365 | 14,530 | 26,835 | 41,000 | — | |||||||||||||||
|
|
|
|
|
|
|
|
|
|
|
|||||||||||
| Total contractual obligations |
$ | 107,999 | $ | 20,005 | $ | 38,195 | $ | 48,996 | $ | 803 | ||||||||||
|
|
|
|
|
|
|
|
|
|
|
|||||||||||
74
Table of Contents
The contractual commitment amounts in the table above are associated with agreements that are enforceable and legally binding. Obligations under contracts that we can cancel without a significant penalty are not included in the table above.
Off-Balance Sheet Arrangements
Through December 31, 2020, we did not have any relationships with unconsolidated organizations or financial partnerships, such as structured finance or special purpose entities that would have been established for the purpose of facilitating off-balance sheet arrangements or other contractually narrow or limited purposes.
Critical Accounting Policies and Estimates
Our consolidated financial statements are prepared in accordance with GAAP. The preparation of these consolidated financial statements requires us to make estimates and assumptions that affect the reported amounts of assets, liabilities, revenue and expenses, as well as related disclosures. We evaluate our estimates and assumptions on an ongoing basis. Our estimates are based on historical experience and various other assumptions that we believe to be reasonable under the circumstances.
Additionally, the COVID-19 pandemic has created, and may continue to create, significant uncertainty in macroeconomic conditions, and the extent of its impact on our operational and financial performance will depend on certain developments, including the duration and spread of the outbreak and the impact on our customers and sales cycles. We considered the impact of COVID-19 on our estimates and assumptions and determined that there were no material adverse impacts on the consolidated financial statements for the period ended December 31, 2020. As events continue to evolve and additional information becomes available, our estimates and assumptions may change materially in future periods. The critical accounting policies and estimates, assumptions and judgments that we believe have the most significant impact on our consolidated financial statements are described below.
Revenue Recognition
Our revenues are comprised of revenue from self-managed subscriptions and SaaS subscriptions. Our self-managed subscriptions are offered on an annual and multi-year basis, and SaaS subscriptions are offered on an annual basis, with the exception of certain SaaS subscriptions, which are also offered on a monthly basis. Our annual and multi-year subscriptions are typically invoiced and collected at the time of entering into the contract for the full contract amount. Our monthly SaaS subscriptions are typically billed in arrears. For SaaS subscriptions with a minimum usage commitment, we typically invoice and collect the commitment amount at the time of entering into the contract, with any usage in excess of the committed contracted amount billed monthly in arrears.
Subscriptions to our self-managed software include license, support, and upgrades and updates, on a when-and-if-available basis. Our SaaS subscriptions provide access to our latest managed version of our product, which is hosted in a public cloud.
Revenue is recognized when a customer obtains control of promised goods or services are delivered. The amount of revenue recognized reflects the consideration that we expect to receive in exchange for these goods or services. To achieve the core principle of this standard, we applied the following five steps:
1. Identification of the contract, or contracts, with the customer
We determine that we have a contract with a customer when each party’s rights regarding the products or services to be transferred can be identified, the payment terms for the services can be identified, we have determined the customer has the ability and intent to pay, and the contract has commercial substance. At contract inception, we evaluate whether two or more contracts should be combined and accounted for as a single contract and whether the combined or single contract includes more than one performance obligation.
75
Table of Contents
2. Identification of the performance obligations in the contract
Performance obligations promised in a contract are identified based on the products and services that will be transferred to the customer that are both capable of being distinct, whereby the customer can benefit from the products or services either on their own or together with other resources that are readily available from third parties or from us, and are distinct in the context of the contract, whereby the transfer of the products and services is separately identifiable from other promises in the contract.
For self-managed subscriptions, our performance obligations include license for proprietary features of software, support, and upgrades and updates to the software on a when-and-if-available basis. The license provides standalone functionality to the customer and is therefore deemed a distinct performance obligation. Performance obligations related to support as well as upgrades and updates to the software on a when-and-if-available basis generally have a consistent continuous pattern of transfer to a customer during the contract period.
For SaaS subscriptions, we provide access to our cloud-hosted software, without providing the customer with the right to take possession of our software, which we consider to be a single performance obligation.
3. Determination of the transaction price
The transaction price is determined based on the consideration to which we expect to be entitled in exchange for transferring products or delivery of services to the customer. Payment terms and conditions vary by contract type, although terms generally include a requirement to pay within 30 days. In instances where the timing of revenue recognition differs from the timing of invoicing, we have determined our contracts generally do not include a significant financing component. The primary purpose of our invoicing terms is to provide customers with simplified and predictable ways of purchasing our products and services, not to receive financing from our customers or to provide customers with financing. We have applied the practical expedient in Accounting Standards Codification (“ASC”) Topic 606, Revenue from Contracts with Customers (“ASC 606”) and did not evaluate payment terms of one year or less for the existence of a significant financing component. Revenue is recognized net of any taxes collected from customers which are subsequently remitted to governmental entities (for example, sales tax and other indirect taxes). We do not offer right of refund in our contracts.
4. Allocation of the transaction price to the performance obligations in the contract
If the contract contains a single performance obligation, the entire transaction price is allocated to the single performance obligation. For contracts that contain multiple performance obligations, we allocate the transaction price for each contract to each performance obligation based on the relative standalone selling price (“SSP”) for each performance obligation. We use judgment in determining the SSP for our products and services. We typically assess the SSP for our products and services on a periodic basis or when facts and circumstances change. To determine SSP, we maximize the use of observable standalone sales and observable data, where available. In instances where performance obligations do not have observable standalone sales, we utilize available information that may include market conditions, pricing strategies, the economic life of the software, and other observable inputs or uses the expected cost-plus margin approach to estimate the price we would charge if the products and services were sold separately.
5. Recognition of the revenue when, or as, a performance obligation is satisfied
Revenue is recognized at the time the related performance obligation is satisfied by transferring the promised product or delivery of service to the customer. Revenue is recognized in an amount that reflects the consideration that we expect to receive in exchange for those products or services. For self-managed subscriptions, the revenue related to the license for proprietary features is recognized upfront, when the license is delivered. This revenue is presented in our consolidated statements of operations as license–self-managed. The
76
Table of Contents
revenue related to support, and upgrades and updates, are recognized ratably over the contract period and is included in our consolidated statements of operations as subscription–self-managed and SaaS. For SaaS subscriptions, revenue is recognized based on usage as the usage occurs over the contract period and is included in our consolidated statements of operations as subscription–self-managed and SaaS.
Contract Balances
Contract assets consist of unbilled accounts receivable, which occur when a right to consideration for our performance under the customer contract occurs before invoicing to the customer. The amount of unbilled accounts receivable included within accounts receivable, net on the consolidated balance sheets was immaterial for the periods presented. Contract liabilities consist of deferred revenue. Revenue is deferred when we invoice in advance of performance under a contract. The current portion of the deferred revenue balance is recognized as revenue during the 12-month period after the balance sheet date. The noncurrent portion of the deferred revenue balance is recognized as revenue following the 12-month period after the balance sheet date.
Cost to Obtain a Contract
We capitalize sales commissions and associated payroll taxes paid to sales personnel that are incremental to the acquisition of customer contracts. These costs are recorded as deferred contract acquisition costs on the consolidated balance sheets. We determine whether costs should be deferred based on our sales compensation plans and if the commissions are incremental and would not have occurred absent the customer contract.
Sales commissions for the renewal of a contract are not considered commensurate with the sales commissions paid for the acquisition of the initial contract given a substantive difference in commission rates in proportion to their respective contract values. Sales commissions paid for the renewal of a contract to sales personnel are amortized over the contractual term of the renewals. Sales commissions paid upon the initial acquisition of a customer contract for sales personnel are amortized over an estimated period of benefit of four years. We determine the period of benefit for sales commissions paid for the acquisition of the initial customer contract by taking into consideration the estimated customer life and the technological life of our software and other factors.
Amortization of sales commissions are consistent with the pattern of revenue recognition of each performance obligation and are included in sales and marketing expense in the consolidated statements of operations. We have applied the practical expedient in ASC 606 to expense costs as incurred for costs to obtain a contract with a customer when the amortization period would have been one year or less. We periodically review these deferred contract acquisition costs to determine whether events or changes in circumstances have occurred that could impact the period of benefit.
Share-Based Compensation
Share-based compensation expense related to share-based awards is recognized based on the fair value of the awards granted and recognized as an expense on a straight-line basis over the requisite service period for share options, RSUs and performance-based RSUs. The fair value of each option award is estimated on the grant date using the Black-Scholes option pricing model. The fair value of each RSU award is based on the fair value of the underlying ordinary shares on the grant date. The assumptions used to determine the fair value of the share awards represent management’s best estimates. These estimates involve inherent uncertainties and the application of management’s judgment. The compensation expense associated with performance-based RSUs is adjusted based on the probability in achieving performance targets. Forfeitures are accounted for as they occur instead of estimating the number of awards expected to be forfeited.
Our use of the Black-Scholes option-pricing model requires the input of highly subjective assumptions. If factors change and different assumptions are used, our share-based compensation expense could be materially different in the future.
77
Table of Contents
These assumptions and estimates were determined as follows:
| • | Fair Value of Ordinary Shares. Prior to the IPO, the fair value was determined by our board of directors, with input from management and valuation reports prepared by third-party valuation specialists. After the IPO, the fair value of each ordinary share was based on the closing price of our publicly traded ordinary shares as reported on the date of the grant. |
| • | Risk-Free Interest Rate. The risk-free rate for the expected term of the options is based on the Black-Scholes option-pricing model on the yields of U.S. Treasury securities with maturities appropriate for the expected term of employee share option awards. |
| • | Expected Term. The expected term represents the period that options are expected to be outstanding. For option grants that are considered to be “plain vanilla,” we determine the expected term using the simplified method. The simplified method deems the term to be the average of the time-to-vesting and the contractual life of the options. |
| • | Expected Volatility. As we have a short trading history for our ordinary shares, the expected volatility is derived from the average historical share volatilities of several unrelated public companies within our industry that we consider to be comparable to our own business over a period equivalent to the option’s expected term. |
| • | Expected Dividend Yield. We have never declared or paid any cash dividends and does not presently plan to pay cash dividends in the foreseeable future. As a result, an expected dividend yield of zero percent was used. |
The Black-Scholes assumptions used in evaluating our awards are as follows:
| Year Ended December 31, | ||||||
| 2020 | 2019 | 2018 | ||||
|
| ||||||
| Expected term (years) |
6.1 - 6.5 | 6.5 | 5.0 - 6.5 | |||
| Expected volatility |
65.0% - 80.0% | 60.0% - 65.0% | 60.0% - 64.0% | |||
| Risk-free interest rate |
0.3% - 1.7% | 1.7% - 2.6% | 2.6% - 3.0% | |||
| Expected dividend yield |
0.0% | 0.0% | 0.0% | |||
We will continue to use judgment in evaluating the assumptions related to our share-based compensation on a prospective basis. As we continue to accumulate additional data related to our ordinary shares, we may refine our estimation process, which could materially impact our future share-based compensation expense.
Ordinary Shares Valuations
Prior to our IPO, the fair value of the ordinary shares underlying our equity awards was determined by our board of directors, after considering contemporaneous third-party valuations and input from management. The valuations of our ordinary shares were determined in accordance with the guidelines outlined in the American Institute of Certified Public Accountants Practice Aid, Valuation of Privately-Held-Company Equity Securities Issued as Compensation. In the absence of a public trading market, our board of directors, with input from management, exercised significant judgment and considered various objective and subjective factors to determine the fair value of our ordinary shares as of the date of each option grant, including the following factors:
| • | the nature and history of our business; |
| • | the general economic conditions and our industry outlook; |
| • | our book value and overall financial condition; |
| • | our earning capacity; |
78
Table of Contents
| • | our dividend history; |
| • | the existence of goodwill or other intangible value within our business; |
| • | prior interest sales and the size of the interests being valued; and |
| • | the market price of companies engaged in the same or a similar line of our business having their equity securities actively traded in a free and open market, either on an exchange or over-the-counter. |
In valuing our ordinary shares, absent an arm’s-length current/recent round of financing, the fair value of our business, or equity value, was determined using both the income approach and market approach. The income approach estimates value based on the expectation of future cash flows that the company will generate. These future cash flows are discounted to their present values using a discount rate based on the capital rates of return for comparable publicly traded companies and is adjusted to reflect the risks inherent in the company’s cash flows relative to those inherent in the companies utilized in the discount rate calculation. The market approach estimates value based on a comparison of the company to comparable public companies in a similar line of business. From the comparable companies, a representative market value multiple is determined and then applied to the company’s financial results to estimate the value of the subject company.
The resulting equity value was then allocated to each share class using an Option Pricing Model (“OPM”). The OPM allocates the overall company value to the various share classes based on differences in liquidation preferences, participation rights, dividend policy, and conversion rights, using a series of call options. The OPM is appropriate to use when the range of possible future outcomes is difficult to predict. Beginning in September 2019, we utilized a probability-weighted expected return method (“PWERM”) to allocate value among the various share classes. The PWERM involves the estimation of the value of our company under multiple future potential outcomes and estimates the probability of each potential outcome. The per-share value of our ordinary shares as determined through the PWERM was ultimately based upon probability-weighted per share values resulting from the various future scenarios, which include an initial public offering or continued operation as a private company. After the ordinary share value was determined, a discount for lack of marketability (“DLOM”) was applied to arrive at the fair value of the ordinary shares on a non-marketable basis. A DLOM is applied in order to reflect the lack of a recognized market for a closely held interest and the fact that a non-controlling equity interest may not be readily transferable. A market participant purchasing this share would recognize this illiquidity associated with the shares, which would reduce the overall fair market value.
In addition, we also considered any secondary transactions involving our capital shares. In our evaluation of those transactions, we considered the facts and circumstances of each transaction to determine the extent to which they represented a fair value exchange. Factors considered include transaction volume, proximity to other transactions as well as the valuation date, frequency of similar transactions, whether the transactions occurred between willing and unrelated parties, and whether the transactions involved parties with sufficient access to our financial information from which to make an informed decision on price.
In some cases, we considered the amount of time between the valuation date and the grant date to determine whether to use the latest ordinary share valuation determined pursuant to the method described above or a straight-line calculation between two valuation dates. This determination included an evaluation of whether the subsequent valuation indicated that any significant change in valuation had occurred between the previous valuation and the grant date.
Subsequent to the closing of our IPO, the fair value of our ordinary shares is based on the closing price of our ordinary shares as reported on the date of the respective grant.
JOBS Act Accounting Election
We are an emerging growth company, as defined in the JOBS Act, and, for so long as we continue to be an emerging growth company, we may take advantage of certain exemptions from various reporting requirements
79
Table of Contents
that are applicable to other public companies that are not emerging growth companies including, but not limited to, not being required to comply with the auditor attestation requirements of Section 404 of the Sarbanes-Oxley Act, reduced disclosure obligations regarding executive compensation in our periodic reports and proxy statements, and exemptions from the requirements of holding a nonbinding advisory vote on executive compensation and shareholder approval of any golden parachute payments not previously approved. In addition, pursuant to Section 107 of the JOBS Act, as an emerging growth company, we have elected to take advantage of the extended transition period for complying with new or revised accounting standards until those standards would otherwise apply to private companies. If we cease to be an emerging growth company, we will no longer be able to take advantage of these exemptions or the extended transition period for complying with new or revised accounting standards.
Recent Accounting Pronouncements
See the section titled “Summary of Significant Accounting Policies” in Note 2 of the notes to our consolidated financial statements included in Part II, Item 8 of this Form 10-K.
80
Table of Contents
Item 7A. QUANTITATIVE AND QUALITATIVE DISCLOSURES ABOUT MARKET RISK
We have operations in the United States and internationally, and we are exposed to market risk in the ordinary course of our business.
Foreign Currency Exchange Risk
Our revenue and expenses are primarily denominated in U.S. dollars. Our functional currency is the U.S. dollar. Substantially all of our sales are denominated in U.S. dollars, and therefore our revenue is not subject to significant foreign currency risk. However, a significant portion of our operating costs in Israel, consisting principally of salaries and related personnel expenses, and operating lease and facility expenses are denominated in NIS. This foreign currency exposure gives rise to market risk associated with exchange rate movements of the U.S. dollar against the NIS. Furthermore, we anticipate that a material portion of our expenses will continue to be denominated in NIS.
To reduce the impact of foreign exchange risks associated with forecasted future cash flows and certain existing assets and liabilities and the volatility in our consolidated statements of operations, we have established a hedging program. Foreign currency contracts are generally utilized in this hedging program. Our foreign currency contracts are generally short-term in duration. We do not enter into derivative instruments for trading or speculative purposes. We account for our derivative instruments as either assets or liabilities and carry them at fair value in the consolidated balance sheets. The accounting for changes in the fair value of the derivative depends on the intended use of the derivative and the resulting designation. Our hedging program reduces but does not eliminate the impact of currency exchange rate movements. The effect of a hypothetical 10% change in foreign currency exchange rates applicable to our business, after considering cash flow hedges, would have had an impact on our results of operations of $5.0 million, $4.6 million, and $3.9 million for the years ended December 31, 2020, 2019, and 2018, respectively.
Our derivatives expose us to credit risk to the extent that the counterparties may be unable to meet the terms of the agreement. We seek to mitigate such risk by limiting our counterparties to major financial institutions and by spreading the risk across a number of major financial institutions. However, failure of one or more of these financial institutions is possible and could result in incurred losses.
As of December 31, 2020, our cash, cash equivalents, restricted cash, and short-term investments were primarily denominated in U.S. dollars. A 10% increase or decrease in current exchange rates would not materially affect our cash, cash equivalents, restricted cash, and short-term investment balances as of December 31, 2020.
Interest Rate Risk
As of December 31, 2020, we had cash and cash equivalents of $164.5 million, and short-term investments of $433.6 million. Cash and cash equivalents consist of cash in banks, bank deposits, and money market funds. Short-term investments generally consist of bank deposits, certificates of deposit, commercial paper, corporate debt securities, municipal securities, and government and agency debt. Our cash, cash equivalents, and short-term investments are held for working capital purposes. Such interest-earning instruments carry a degree of interest rate risk. The primary objectives of our investment activities are the preservation of capital, the fulfillment of liquidity needs and the fiduciary control of cash. We do not enter into investments for trading or speculative purposes. Due to the short-term nature of these instruments, a hypothetical 10% change in interest rates during any of the periods presented would not have had a material impact on our historical consolidated financial statements for the years ended December 31, 2020, 2019, and 2018.
81
Table of Contents
Item 8. Financial Statements and Supplementary Data
JFROG LTD.
INDEX TO CONSOLIDATED FINANCIAL STATEMENTS
| Page | ||||
| 83 | ||||
| 84 | ||||
| 85 | ||||
| 86 | ||||
| Consolidated Statements of Convertible Preferred Shares and Shareholders’ Equity (Deficit) |
87 | |||
| 88 | ||||
| 89 | ||||
82
Table of Contents
Kost Forer Gabbay & Kasierer
144 Menachem Begin Road, Building A
Tel-Aviv 6492102, Israel

|
Tel: +972-3-6232525 Fax: +972-3-5622555 ey.com |

REPORT OF INDEPENDENT REGISTERED PUBLIC ACCOUNTING FIRM
To the Shareholders and Board of Directors of JFROG LTD.
Opinion on the Financial Statements
We have audited the accompanying consolidated balance sheets of JFrog Ltd. (the “Company”) as of December 31, 2020 and 2019 and the related consolidated statements of operations, comprehensive loss, changes in convertible preferred shares and shareholders’ equity (deficit) and cash flows for each of the three years in the period ended December 31, 2020, and the related notes (collectively referred to as the “consolidated financial statements”). In our opinion, the consolidated financial statements present fairly, in all material respects, the financial position of the Company at December 31, 2020 and 2019, and the results of its operations and its cash flows for each of the three years in the period ended December 31, 2020, in conformity with U.S. generally accepted accounting principles.
Basis for Opinion
These financial statements are the responsibility of the Company’s management. Our responsibility is to express an opinion on the Company’s financial statements based on our audit. We are a public accounting firm registered with the Public Company Accounting Oversight Board (United States) (“PCAOB”) and are required to be independent with respect to the Company in accordance with the U.S. federal securities laws and the applicable rules and regulations of the Securities and Exchange Commission and the PCAOB.
We conducted our audit in accordance with the standards of the PCAOB. Those standards require that we plan and perform the audit to obtain reasonable assurance about whether the financial statements are free of material misstatement, whether due to error or fraud. The Company is not required to have, nor were we engaged to perform, an audit of its internal control over financial reporting. As part of our audit we are required to obtain an understanding of internal control over financial reporting but not for the purpose of expressing an opinion on the effectiveness of the Company’s internal control over financial reporting. Accordingly, we express no such opinion.
Our audit included performing procedures to assess the risks of material misstatement of the financial statements, whether due to error or fraud, and performing procedures that respond to those risks. Such procedures included examining, on a test basis, evidence regarding the amounts and disclosures in the financial statements. Our audit also included evaluating the accounting principles used and significant estimates made by management, as well as evaluating the overall presentation of the financial statements. We believe that our audit provides a reasonable basis for our opinion.
| /s/ KOST FORER GABBAY & KASIERER |
| A Member of EY Global |
We have served as the Company’s auditor since 2010.
Tel-Aviv, Israel
February 12, 2021
83
Table of Contents
JFROG LTD.
(in thousands, except share and per share data)
| As of December 31, | ||||||||
| 2020 | 2019 | |||||||
|
|
|
|||||||
| Assets |
||||||||
| Current assets: |
||||||||
| Cash and cash equivalents |
$ | 164,461 | $ | 39,150 | ||||
| Short-term investments |
433,595 | 127,331 | ||||||
| Accounts receivable, net |
37,048 | 24,736 | ||||||
| Deferred contract acquisition costs |
3,247 | 2,348 | ||||||
| Prepaid expenses and other current assets |
14,210 | 5,364 | ||||||
|
|
|
|
|
|||||
| Total current assets |
652,561 | 198,929 | ||||||
| Property and equipment, net |
4,963 | 3,532 | ||||||
| Deferred contract acquisition costs, noncurrent |
4,949 | 3,641 | ||||||
| Intangible assets, net |
4,047 | 5,608 | ||||||
| Goodwill |
17,320 | 17,320 | ||||||
| Other assets, noncurrent |
5,391 | 9,010 | ||||||
|
|
|
|
|
|||||
| Total assets |
$ | 689,231 | $ | 238,040 | ||||
|
|
|
|
|
|||||
| Liabilities, Convertible Preferred Shares and Shareholders’ Equity (Deficit) |
||||||||
| Current liabilities: |
||||||||
| Accounts payable |
$ | 9,911 | $ | 4,990 | ||||
| Accrued expenses and other current liabilities |
21,039 | 8,335 | ||||||
| Deferred revenue |
91,750 | 72,676 | ||||||
|
|
|
|
|
|||||
| Total current liabilities |
122,700 | 86,001 | ||||||
| Deferred revenue, noncurrent |
11,087 | 9,629 | ||||||
| Other liabilities, noncurrent |
1,550 | — | ||||||
|
|
|
|
|
|||||
| Total liabilities |
135,337 | 95,630 | ||||||
| Commitments and contingencies (Note 10) |
||||||||
| Convertible preferred shares, NIS 0.01 par value per share, 0 and 52,063,647 shares authorized as of December 31, 2020 and 2019, respectively; 0 and 52,063,647 issued and outstanding as of December 31, 2020 and 2019, respectively |
— | 175,844 | ||||||
| Shareholders’ equity (deficit): |
||||||||
| Preferred shares, NIS 0.01 par value per share; 50,000,000 and 0 shares authorized as of December 31, 2020 and 2019, respectively; 0 issued and outstanding as of December 31, 2020 and 2019 |
— | — | ||||||
| Ordinary shares, NIS 0.01 par value per share, 500,000,000 and 101,314,353 shares authorized as of December 31, 2020 and 2019, respectively; 92,112,447 and 27,930,741 shares issued and outstanding as of December 31, 2020 and 2019, respectively |
257 | 80 | ||||||
| Additional paid-in capital |
628,054 | 31,835 | ||||||
| Accumulated other comprehensive income |
372 | 35 | ||||||
| Accumulated deficit |
(74,789 | ) | (65,384 | ) | ||||
|
|
|
|
|
|||||
| Total shareholders’ equity (deficit) |
553,894 | (33,434 | ) | |||||
|
|
|
|
|
|||||
| Total liabilities, convertible preferred shares and shareholders’ equity (deficit) |
$ | 689,231 | $ | 238,040 | ||||
|
|
|
|
|
|||||
The accompanying notes are an integral part of these consolidated financial statements.
84
Table of Contents
JFROG LTD.
CONSOLIDATED STATEMENTS OF OPERATIONS
(in thousands, except share and per share data)
| Year Ended December 31, | ||||||||||||
| 2020 | 2019 | 2018 | ||||||||||
|
|
|
|||||||||||
| Revenue: |
||||||||||||
| Subscription—self-managed and SaaS |
$ | 137,978 | $ | 94,606 | $ | 56,054 | ||||||
| License—self-managed |
12,849 | 10,110 | 7,478 | |||||||||
|
|
|
|
|
|
|
|||||||
| Total subscription revenue |
150,827 | 104,716 | 63,532 | |||||||||
| Cost of revenue: |
||||||||||||
| Subscription—self-managed and SaaS |
27,619 | 19,201 | 10,393 | |||||||||
| License—self-managed |
832 | 834 | 318 | |||||||||
|
|
|
|
|
|
|
|||||||
| Total cost of revenue—subscription |
28,451 | 20,035 | 10,711 | |||||||||
|
|
|
|
|
|
|
|||||||
| Gross profit |
122,376 | 84,681 | 52,821 | |||||||||
|
|
|
|
|
|
|
|||||||
| Operating expenses: |
||||||||||||
| Research and development |
41,113 | 29,730 | 25,861 | |||||||||
| Sales and marketing |
60,936 | 44,088 | 34,972 | |||||||||
| General and administrative |
34,519 | 17,800 | 18,843 | |||||||||
|
|
|
|
|
|
|
|||||||
| Total operating expenses |
136,568 | 91,618 | 79,676 | |||||||||
|
|
|
|
|
|
|
|||||||
| Operating loss |
(14,192 | ) | (6,937 | ) | (26,855 | ) | ||||||
| Interest and other income, net |
2,045 | 3,171 | 1,310 | |||||||||
|
|
|
|
|
|
|
|||||||
| Loss before income taxes |
(12,147 | ) | (3,766 | ) | (25,545 | ) | ||||||
| Income tax expense (benefit) |
(2,742 | ) | 1,628 | 470 | ||||||||
|
|
|
|
|
|
|
|||||||
| Net loss |
$ | (9,405 | ) | $ | (5,394 | ) | $ | (26,015 | ) | |||
|
|
|
|
|
|
|
|||||||
| Net loss per share attributable to ordinary shareholders, basic and diluted |
$ | (0.20 | ) | $ | (0.20 | ) | $ | (1.00 | ) | |||
|
|
|
|
|
|
|
|||||||
| Weighted-average shares used in computing net loss per share attributable to ordinary shareholders, basic and diluted |
46,488,225 | 27,130,209 | 26,102,551 | |||||||||
|
|
|
|
|
|
|
|||||||
The accompanying notes are an integral part of these consolidated financial statements.
85
Table of Contents
JFROG LTD.
CONSOLIDATED STATEMENTS OF COMPREHENSIVE LOSS
(in thousands)
| Year Ended December 31, | ||||||||||||
| 2020 | 2019 | 2018 | ||||||||||
|
|
|
|||||||||||
| Net loss |
$ | (9,405 | ) | $ | (5,394 | ) | $ | (26,015 | ) | |||
| Other comprehensive income, net of tax: |
||||||||||||
| Unrealized gain (loss) on available-for-sale marketable securities, net |
(104 | ) | 35 | — | ||||||||
| Unrealized gain on derivative instruments, net |
441 | — | — | |||||||||
|
|
|
|
|
|
|
|||||||
| Other comprehensive income |
337 | 35 | — | |||||||||
|
|
|
|
|
|
|
|||||||
| Comprehensive loss |
$ | (9,068 | ) | $ | (5,359 | ) | $ | (26,015 | ) | |||
|
|
|
|
|
|
|
|||||||
The accompanying notes are an integral part of these consolidated financial statements.
86
Table of Contents
JFROG LTD.
CONSOLIDATED STATEMENTS OF CONVERTIBLE PREFERRED SHARES AND SHAREHOLDERS’ EQUITY (DEFICIT)
(in thousands, except share data)
| Convertible Preferred Shares |
Ordinary Shares | Additional Paid-in Capital |
Accumulated Other Comprehensive Income |
Accumulated Deficit |
Total Shareholders’ Equity (Deficit) |
|||||||||||||||||||||||||||
| Shares | Amount | Shares | Amount | |||||||||||||||||||||||||||||
|
|
|
|||||||||||||||||||||||||||||||
| Balance as of January 1, 2018 (as reported) |
42,363,375 | $ | 61,390 | 25,733,520 | $ | 74 | $ | 802 | $ | — | $ | (38,892 | ) | $ | (38,016 | ) | ||||||||||||||||
| Effect of adoption of ASC 606 |
— | — | — | — | — | — | 4,917 | 4,917 | ||||||||||||||||||||||||
|
|
|
|
|
|
|
|
|
|
|
|
|
|
|
|
|
|||||||||||||||||
| Balance as of January 1, 2018 (as adjusted) |
42,363,375 | 61,390 | 25,733,520 | 74 | 802 | — | (33,975 | ) | (33,099 | ) | ||||||||||||||||||||||
| Issuance of Series D convertible preferred shares, net of issuance costs of $187 |
9,700,272 | 114,454 | — | — | — | — | — | — | ||||||||||||||||||||||||
| Issuance of ordinary shares upon exercise of share options |
— | — | 660,130 | 2 | 268 | — | — | 270 | ||||||||||||||||||||||||
| Share-based compensation expense |
— | — | — | — | 20,167 | — | — | 20,167 | ||||||||||||||||||||||||
| Net loss |
— | — | — | — | — | — | (26,015 | ) | (26,015 | ) | ||||||||||||||||||||||
|
|
|
|
|
|
|
|
|
|
|
|
|
|
|
|
|
|||||||||||||||||
| Balance as of December 31, 2018 |
52,063,647 | 175,844 | 26,393,650 | 76 | 21,237 | — | (59,990 | ) | (38,677 | ) | ||||||||||||||||||||||
| Issuance of ordinary shares upon exercise of share options |
— | — | 1,535,603 | 4 | 1,217 | — | — | 1,221 | ||||||||||||||||||||||||
| Issuance of ordinary shares related to business combination |
— | — | 1,488 | (* | ) | 11 | — | — | 11 | |||||||||||||||||||||||
| Share-based compensation expense |
— | — | — | — | 9,370 | — | — | 9,370 | ||||||||||||||||||||||||
| Other comprehensive income, net of tax |
— | — | — | — | — | 35 | — | 35 | ||||||||||||||||||||||||
| Net loss |
— | — | — | — | — | — | (5,394 | ) | (5,394 | ) | ||||||||||||||||||||||
|
|
|
|
|
|
|
|
|
|
|
|
|
|
|
|
|
|||||||||||||||||
| Balance as of December 31, 2019 |
52,063,647 | 175,844 | 27,930,741 | 80 | 31,835 | 35 | (65,384 | ) | (33,434 | ) | ||||||||||||||||||||||
| Conversion of convertible preferred shares to ordinary shares upon initial public offering |
(52,063,647 | ) | (175,844 | ) | 52,063,647 | 142 | 175,702 | — | — | 175,844 | ||||||||||||||||||||||
| Issuance of ordinary shares upon initial public offering, net of underwriting discounts and commissions and other issuance costs |
— | — | 9,735,232 | 29 | 393,204 | — | — | 393,233 | ||||||||||||||||||||||||
| Issuance of ordinary shares upon vesting of restricted share units |
— | — | 138,400 | (* | ) | (* | ) | — | — | (* | ) | |||||||||||||||||||||
| Issuance of ordinary shares upon exercise of share options |
— | — | 2,091,912 | 6 | 3,461 | — | — | 3,467 | ||||||||||||||||||||||||
| Issuance of ordinary shares related to business combination |
— | — | 152,515 | (* | ) | (* | ) | — | — | (* | ) | |||||||||||||||||||||
| Share-based compensation expense |
— | — | — | — | 23,852 | — | — | 23,852 | ||||||||||||||||||||||||
| Other comprehensive income, net of tax |
— | — | — | — | — | 337 | — | 337 | ||||||||||||||||||||||||
| Net loss |
— | — | — | — | — | — | (9,405 | ) | (9,405 | ) | ||||||||||||||||||||||
|
|
|
|
|
|
|
|
|
|
|
|
|
|
|
|
|
|||||||||||||||||
| Balance as of December 31, 2020 |
— | $ | — | 92,112,447 | $ | 257 | $ | 628,054 | $ | 372 | $ | (74,789 | ) | $ | 553,894 | |||||||||||||||||
|
|
|
|
|
|
|
|
|
|
|
|
|
|
|
|
|
|||||||||||||||||
(*) Amount less than $1.
The accompanying notes are an integral part of these consolidated financial statements.
87
Table of Contents
JFROG LTD.
CONSOLIDATED STATEMENTS OF CASH FLOWS
(in thousands)
| Year Ended December 31, | ||||||||||||
| 2020 | 2019 | 2018 | ||||||||||
|
|
|
|||||||||||
| Cash flows from operating activities: |
||||||||||||
| Net loss |
$ | (9,405 | ) | $ | (5,394 | ) | $ | (26,015 | ) | |||
| Adjustments to reconcile net loss to net cash provided by operating activities: |
||||||||||||
| Depreciation and amortization |
3,660 | 2,810 | 1,120 | |||||||||
| Share-based compensation expense |
23,852 | 9,370 | 20,167 | |||||||||
| Net amortization of premium or discount on investments |
1,905 | (374 | ) | — | ||||||||
| Changes in operating assets and liabilities: |
||||||||||||
| Accounts receivable |
(12,312 | ) | (4,927 | ) | (6,956 | ) | ||||||
| Prepaid expenses and other assets |
(6,997 | ) | (4,117 | ) | (3,583 | ) | ||||||
| Deferred contract acquisition costs |
(2,207 | ) | (2,399 | ) | (2,102 | ) | ||||||
| Accounts payable |
4,921 | 1,792 | 1,483 | |||||||||
| Accrued expenses and other liabilities |
5,509 | 1,108 | 402 | |||||||||
| Deferred revenue |
20,532 | 12,135 | 24,046 | |||||||||
|
|
|
|
|
|
|
|||||||
| Net cash provided by operating activities |
29,458 | 10,004 | 8,562 | |||||||||
|
|
|
|
|
|
|
|||||||
| Cash flows from investing activities: |
||||||||||||
| Purchases of short-term investments |
(450,734 | ) | (203,479 | ) | — | |||||||
| Maturities of short-term investments |
137,827 | 47,397 | — | |||||||||
| Sales of short-term investments |
4,633 | 29,160 | — | |||||||||
| Purchases of property and equipment |
(3,522 | ) | (1,803 | ) | (2,075 | ) | ||||||
| Purchase of intangible asset |
— | — | (1,000 | ) | ||||||||
| Payments related to business combination, net of cash acquired |
— | (20,860 | ) | — | ||||||||
|
|
|
|
|
|
|
|||||||
| Net cash used in investing activities |
(311,796 | ) | (149,585 | ) | (3,075 | ) | ||||||
|
|
|
|
|
|
|
|||||||
| Cash flows from financing activities: |
||||||||||||
| Proceeds from initial public offering, net of underwriting discounts and commissions and other issuance costs |
393,481 | (192 | ) | — | ||||||||
| Proceeds from issuance of convertible preferred shares, net of issuance costs |
— | — | 114,454 | |||||||||
| Proceeds from exercise of share options |
3,467 | 1,221 | 270 | |||||||||
| Proceeds from employee equity transactions to be remitted to tax authorities |
9,186 | — | — | |||||||||
| Payments related to prior year business or asset acquisition |
— | (293 | ) | (247 | ) | |||||||
|
|
|
|
|
|
|
|||||||
| Net cash provided by financing activities |
406,134 | 736 | 114,477 | |||||||||
|
|
|
|
|
|
|
|||||||
| Net increase (decrease) in cash, cash equivalents, and restricted cash |
123,796 | (138,845 | ) | 119,964 | ||||||||
| Cash, cash equivalents, and restricted cash—beginning of period |
40,943 | 179,788 | 59,824 | |||||||||
|
|
|
|
|
|
|
|||||||
| Cash, cash equivalents, and restricted cash—end of period |
$ | 164,739 | $ | 40,943 | $ | 179,788 | ||||||
|
|
|
|
|
|
|
|||||||
| Supplemental disclosures of cash flow information: |
||||||||||||
| Income tax payments (refunds) |
$ | (238 | ) | $ | 2,073 | $ | 2,966 | |||||
|
|
|
|
|
|
|
|||||||
| Supplemental disclosures of noncash investing and financing activities: |
||||||||||||
| Purchases of property and equipment during the period included in accounts payable |
$ | 276 | $ | 268 | $ | 404 | ||||||
|
|
|
|
|
|
|
|||||||
| Purchase of intangible asset during the period included in accrued expenses |
$ | — | $ | — | $ | 586 | ||||||
|
|
|
|
|
|
|
|||||||
| Fair value of ordinary shares issued as consideration for business combination |
$ | — | $ | 11 | $ | — | ||||||
|
|
|
|
|
|
|
|||||||
| Deferred offering costs incurred during the period included in accounts payable and accrued expenses |
$ | — | $ | 344 | $ | — | ||||||
|
|
|
|
|
|
|
|||||||
| Reconciliation of cash, cash equivalents, and restricted cash within the Consolidated Balance Sheets to the amounts shown in the Consolidated Statements of Cash Flows above: |
||||||||||||
| Cash and cash equivalents |
$ | 164,461 | $ | 39,150 | $ | 177,878 | ||||||
| Restricted cash included in prepaid expenses and other current assets |
14 | 14 | 296 | |||||||||
| Restricted cash included in other assets, noncurrent |
264 | 1,779 | 1,614 | |||||||||
|
|
|
|
|
|
|
|||||||
| Total cash, cash equivalents, and restricted cash |
$ | 164,739 | $ | 40,943 | $ | 179,788 | ||||||
|
|
|
|
|
|
|
|||||||
The accompanying notes are an integral part of these consolidated financial statements.
88
Table of Contents
| 1. | Organization and Description of Business |
Description of Business
JFrog Ltd. (together with its subsidiaries, “JFrog”, or the “Company”) was incorporated under the laws of the State of Israel in 2008. JFrog provides an end-to-end, hybrid, universal DevOps Platform for Continuous Software Release Management enabling organizations to continuously deliver software updates across any system. JFrog’s platform is the critical bridge between software development and deployment of that software, paving the way for the modern DevOps paradigm. The Company enables organizations to build and release software faster and more securely while empowering developers to be more efficient. The Company’s solutions are designed to run on-premise, in public or private clouds, or in hybrid environments.
Initial Public Offering
On September 18, 2020, the Company completed its initial public offering (“IPO”), in which the Company issued and sold 9,735,232 shares of its ordinary shares at an offering price of $44.00 per share, including 1,735,232 ordinary shares pursuant to the exercise in full of the underwriters’ option to purchase additional shares. The Company received net proceeds of $393.2 million after deducting underwriting discounts and commissions of $30.0 million, and other issuance costs of $5.1 million.
Immediately prior to the closing of the IPO, all convertible preferred shares then outstanding automatically converted into 52,063,647 ordinary shares. In addition, 138,400 restricted share units (“RSUs”), which were granted to the Company’s chief executive officer (“CEO”) in August 2020, vested. For more details related to these RSUs, see Note 11, Convertible Preferred Shares, Shareholders’ Equity (Deficit) and Equity Incentive Plans — Restricted Share Units.
Prior to the IPO, deferred offering costs, which consist primarily of accounting, legal and other fees related to the Company’s IPO, were capitalized within other assets, noncurrent in the Consolidated Balance Sheets. Upon the consummation of the IPO, $5.4 million of deferred offering costs were reclassified into shareholders’ equity as an offset against IPO proceeds. The Company capitalized $0.5 million of deferred offering costs within other assets, noncurrent in the Consolidated Balance Sheet as of December 31, 2019.
| 2. | Summary of Significant Accounting Policies |
Basis of Presentation
The accompanying consolidated financial statements have been prepared in accordance with accounting principles generally accepted in the United States of America (“GAAP”) and include the accounts of JFrog Ltd. and its wholly owned subsidiaries. All intercompany balances and transactions have been eliminated in consolidation.
Issuance of Bonus Shares
On July 31, 2018, the Company’s board of directors and shareholders approved the amendment and restatement of the Company’s articles of association (“AoA”) to effect a five-for-one share split of the Company’s ordinary shares and convertible preferred shares (collectively, the “Capital Shares”) in the form of bonus shares. Accordingly, (i) for each one share of outstanding Capital Shares, four additional shares of Capital Shares of the same class and series, as applicable, were issued and distributed to the holder thereof; (ii) the number of shares of ordinary shares issuable upon the exercise of each outstanding option to purchase ordinary shares was proportionately increased by four additional ordinary shares; (iii) the exercise price of each outstanding option to purchase ordinary shares was proportionately adjusted; (iv) the authorized number of each class and series of Capital Shares was increased in order to reflect the said issuance of bonus shares; and (v) the par value of each class of Capital Shares was not adjusted as result of this issuance of bonus shares. All the share numbers, share prices, and exercise prices have been adjusted retroactively within these consolidated financial statements to reflect the issuance of the bonus shares.
89
Table of Contents
Use of Estimates
The preparation of consolidated financial statements in conformity with GAAP requires management to make estimates and assumptions that affect the reported amounts of assets and liabilities and disclosure of contingent assets and liabilities at the date of the consolidated financial statements and the reported amounts of revenue and expenses during the reporting periods and accompanying notes. Significant items subject to such estimates and assumptions include, but are not limited to, the allocation of transaction price among various performance obligations, the estimated customer life on deferred contract acquisition costs, the allowance for doubtful accounts, the fair value of financial assets and liabilities including accounting and fair value of derivatives, the fair value of acquired intangible assets and goodwill, the useful lives of acquired intangible assets and property and equipment, share-based compensation including the determination of the fair value of the Company’s share-based awards, and the valuation of deferred tax assets and uncertain tax positions. The Company bases these estimates on historical and anticipated results, trends and various other assumptions that it believes are reasonable under the circumstances, including assumptions as to future events. Actual results could differ from those estimates.
The novel coronavirus (“COVID-19”) pandemic has created, and may continue to create, significant uncertainty in macroeconomic conditions, and the extent of its impact on the Company’s operational and financial performance will depend on certain developments, including the duration and spread of the outbreak and the impact on the Company’s customers and its sales cycles. The Company considered the impact of COVID-19 on the estimates and assumptions and determined that there were no material adverse impacts on the consolidated financial statements for the period ended December 31, 2020. As events continue to evolve and additional information becomes available, the Company’s estimates and assumptions may change materially in future periods.
Foreign Currency
The functional currency of the Company is the U.S. dollar. Accordingly, foreign currency assets and liabilities are remeasured into U.S. dollars at the end-of-period exchange rates except for non-monetary assets and liabilities, which are measured at historical exchange rates. Revenue and expenses are remeasured each day at the exchange rate in effect on the day the transaction occurred. Foreign currency transaction gains and losses have been immaterial in the periods presented.
Concentration of Risks
Financial instruments that potentially subject the Company to a concentration of credit risk consist of cash and cash equivalents, restricted cash, short-term investments, accounts receivable, and derivative instruments. The Company maintains its cash, cash equivalents, restricted cash, and short-term investments with high-quality financial institutions mainly in the U.S. and Israel, the composition and maturities of which are regularly monitored by the Company. The Company’s derivatives expose it to credit risk to the extent that the counterparties may be unable to meet the terms of the agreement. The Company seeks to mitigate such risk by limiting its counterparties to major financial institutions and by spreading the risk across a number of major financial institutions. In addition, the potential risk of loss with any one counterparty resulting from this type of credit risk is monitored on an ongoing basis. The Company grants credit to its customers in the normal course of business.
As of December 31, 2020 and 2019, no single customer represented 10% or more of accounts receivable. No single customer accounted for more than 10% of total revenue for the periods presented.
Cash, Cash Equivalents, and Restricted Cash
Cash and cash equivalents consist of cash in banks and highly liquid investments with an original maturity of three months or less at the date of purchase. The Company maintains certain cash amounts restricted as to its withdrawal or use. The Company’s restricted cash primarily consists of a money market fund and security deposits collateralizing the Company’s operating leases.
90
Table of Contents
Short-Term Investments
Short-term investments consist of bank deposits and marketable securities. The Company classifies its marketable securities as available-for-sale at the time of purchase and reevaluates such classification at each balance sheet date. The Company may sell these securities at any time for use in current operations even if they have not yet reached maturity. As a result, the Company classifies its marketable securities, including those with maturities beyond 12 months, as current assets in the Consolidated Balance Sheets. The Company carries these securities at fair value and records unrealized gains and losses, net of taxes, in accumulated other comprehensive income, which is reflected as a component of shareholders’ equity (deficit). The Company periodically evaluates its marketable securities to assess whether those with unrealized loss positions are other-than-temporarily impaired. If the cost of an individual security exceeds its fair value, the Company evaluates, among other factors, general market conditions, the duration and extent to which the fair value is less than the cost basis, and the Company’s intent and ability to hold the security. If the Company believes that a decline in fair value is determined to be other-than-temporary, the Company writes down the security to fair value. Realized gains and losses and declines in fair value judged to be other than temporary on available-for-sale marketable securities are reported in interest and other income, net in the Consolidated Statements of Operations.
Fair Value Measurements
Fair value is defined as the exchange price that would be received from the sale of an asset or paid to transfer a liability in the principal or most advantageous market for the asset or liability in an orderly transaction between market participants on the measurement date. The Company measures financial assets and liabilities at fair value at each reporting period using a fair value hierarchy which requires the Company to maximize the use of observable inputs and minimize the use of unobservable inputs when measuring fair value. A financial instrument’s classification within the fair value hierarchy is based upon the lowest level of input that is significant to the fair value measurement. Three levels of inputs may be used to measure fair value:
Level 1 – Quoted prices in active markets for identical assets or liabilities.
Level 2 – Inputs other than Level 1 that are observable, either directly or indirectly, such as quoted prices for similar assets or liabilities; quoted prices in markets that are not active; or other inputs that are observable or can be corroborated by observable market data for substantially the full term of the assets or liabilities.
Level 3 – Unobservable inputs that are supported by little or no market activity and that are significant to the fair value of the assets or liabilities.
Financial instruments consist of cash equivalents, restricted cash, short-term investments, accounts receivables, derivative financial instruments, accounts payables, and accrued liabilities. Cash equivalents, short-term investments, derivative financial instruments, and restricted money market funds are stated at fair value on a recurring basis. Restricted security deposits, accounts receivable, accounts payable, and accrued liabilities are stated at their carrying value, which approximates fair value due to the short time to the expected receipt or payment date.
Accounts Receivable, Net
Accounts receivable are recorded at the invoiced amount and amounts for which revenue has been recognized but not invoiced, net of allowance for doubtful accounts. The allowance for doubtful accounts is based on the Company’s assessment of the collectability of accounts. The Company regularly reviews the adequacy of the allowance for doubtful accounts based on a combination of factors, including an assessment of the current customer’s aging balance, the nature and size of the customer, the financial condition of the customer, and the amount of any receivables in dispute. Accounts receivable deemed uncollectable are charged against the allowance for doubtful accounts when identified. The allowance of doubtful accounts was not material for the periods presented.
91
Table of Contents
Derivative Financial Instruments
The Company enters into foreign currency forward and option contracts with financial institutions to protect against foreign exchange risks, mainly the exposure to changes in the exchange rate of the New Israeli Shekel (“NIS”) against the U.S. dollar that are associated with forecasted future cash flows and certain existing assets and liabilities for up to twelve months. The Company’s primary objective in entering into these contracts is to reduce the volatility of earnings and cash flows associated with changes in foreign currency exchange rates. The Company does not use derivative instruments for trading or speculative purposes.
The Company accounts for its derivative instruments as either assets or liabilities and carries them at fair value. The accounting for changes in the fair value of a derivative depends on the intended use of the derivative and the resulting designation. Derivative instruments that hedge the exposure to variability in expected future cash flows that are designated as cash flow hedges, are recorded as either prepaid expenses and other current assets or accrued expenses and other current liabilities in the Consolidated Balance Sheets. The Company records changes in the fair value of these derivatives in accumulated other comprehensive income in the Consolidated Balance Sheets, until the forecasted transaction occurs. Upon occurrence, the Company reclassifies the related gain or loss on the derivative to the same financial statement line item in the Consolidated Statements of Operations to which the derivative relates. Derivative instruments that hedge the exposure to variability in the fair value of assets or liabilities that are not currently designated as hedges for financial reporting purposes, are recorded as either prepaid expenses and other current assets or accrued expenses and other current liabilities in the Consolidated Balance Sheets. The Company records changes in the fair value of these derivatives in interest and other income, net in the Consolidated Statements of Operations.
Contract Balances
Contract assets consist of unbilled accounts receivable, which occur when a right to consideration for the Company’s performance under the customer contract occurs before invoicing to the customer. The amount of unbilled accounts receivable included within accounts receivable, net on the Consolidated Balance Sheets was immaterial for the periods presented.
Contract liabilities consist of deferred revenue. Revenue is deferred when the Company invoices in advance of performance under a contract. The current portion of the deferred revenue balance is recognized as revenue during the 12-month period after the balance sheet date. The noncurrent portion of the deferred revenue balance is recognized as revenue following the 12-month period after the balance sheet date.
Cost to Obtain a Contract
The Company capitalizes sales commissions and associated payroll taxes paid to sales personnel that are incremental to the acquisition of customer contracts. These costs are recorded as deferred contract acquisition costs on the Consolidated Balance Sheets. The Company determines whether costs should be deferred based on its sales compensation plans and if the commissions are incremental and would not have occurred absent the customer contract.
Sales commissions for the renewal of a contract are not considered commensurate with the sales commissions paid for the acquisition of the initial contract given a substantive difference in commission rates in proportion to their respective contract values. Sales commissions paid for the renewal of a contract to sales personnel are amortized over the contractual term of the renewals. Sales commissions paid upon the initial acquisition of a customer contract for sales personnel are amortized over an estimated period of benefit of four years. The Company determines the period of benefit for sales commissions paid for the acquisition of the initial customer contract by taking into consideration the estimated customer life and the technological life of the Company’s software and other factors.
92
Table of Contents
Amortization of sales commissions are consistent with the pattern of revenue recognition of each performance obligation and are included in sales and marketing expense in the Consolidated Statements of Operations. The Company has applied the practical expedient in Accounting Standard Codification (“ASC”) 606, Revenue from Contracts with Customers (“ASC 606”) to expense costs as incurred for costs to obtain a contract with a customer when the amortization period would have been one year or less.
The Company periodically reviews these deferred contract acquisition costs to determine whether events or changes in circumstances have occurred that could impact the period of benefit. There were no impairment losses recorded during the periods presented.
Property and Equipment, Net
Property and equipment are stated at cost net of accumulated depreciation. Depreciation is calculated using the straight-line method over the estimated useful lives of the respective assets. Expenditures for maintenance and repairs are expensed as incurred.
The estimated useful lives of the Company’s property and equipment are as follows:
| Computer and software |
3 years | |
| Furniture and office equipment |
3 –7 years | |
| Leasehold improvements |
Shorter of remaining lease term or estimated useful life |
Capitalized Software Costs
Software development costs for software to be sold, leased, or otherwise marketed are expensed as incurred until the establishment of technological feasibility, at which time those costs are capitalized until the product is available for general release to customers and amortized over the estimated life of the product. Technological feasibility is established when all planning, designing, coding and testing necessary to meet the product’s design specifications have been completed. Once technological feasibility is established, costs are capitalized until the product is made available for general release to the Company’s customers. Maintenance costs are expensed as incurred. To date, costs have not been capitalized as the general release process is essentially completed concurrently with the establishment of technological feasibility.
Costs related to software acquired, developed, or modified solely to meet the Company’s internal requirements, with no substantive plans to market such software at the time of development are capitalized. Costs incurred during the preliminary planning and evaluation stage of the project and during the post implementation operational stage are expensed as incurred. Costs incurred during the application development stage of the project are capitalized. Maintenance costs are expensed as incurred. The amount of qualifying costs for capitalization incurred was immaterial for the periods presented.
Leases
Leases are reviewed and classified as either capital or operating leases at their inception. In certain lease agreements, the Company may receive renewals or expansion options, rent holidays, and other incentives. For operating leases, the Company recognizes lease costs on a straight-line basis once control of the space is achieved, without regard to deferred payment terms such as rent holidays that defer the commencement date of required payments. Additionally, incentives received are treated as a reduction of costs over the term of the agreement.
93
Table of Contents
Business and Asset Acquisitions
When the Company acquires a business, the purchase price is allocated to the tangible and identifiable intangible assets, net of liabilities assumed. Any residual purchase price is recorded as goodwill. The allocation of the purchase price requires management to make significant estimates in determining the fair values of assets acquired and liabilities assumed, especially with respect to intangible assets. These estimates can include, but are not limited to, the cash flows that an asset is expected to generate in the future, the appropriate weighted-average cost of capital and the cost savings expected to be derived from acquiring an asset. These estimates are inherently uncertain and unpredictable. During the measurement period, which may be up to one year from the acquisition date, adjustments to the fair value of these tangible and intangible assets acquired and liabilities assumed may be recorded, with the corresponding offset to goodwill. Upon the conclusion of the measurement period or final determination of the fair value of assets acquired or liabilities assumed, whichever comes first, any subsequent adjustments are recorded to the Company’s Consolidated Statements of Operations.
The Company accounts for a transaction as an asset acquisition when substantially all of the fair value of the gross assets acquired is concentrated in a single identifiable asset or group of similar identifiable assets, or otherwise does not meet the definition of a business. Asset acquisition-related costs are capitalized as part of the asset or assets acquired.
Goodwill and Intangible Assets
Goodwill is not amortized but rather tested for impairment at least annually in the fourth quarter, or more frequently if events or changes in circumstances indicate that goodwill may be impaired. Goodwill represents the excess of the purchase price over the fair value of net assets acquired in a business combination and is allocated to reporting units expected to benefit from the business combination. The Company has determined that it has one operating segment and one reporting unit. Goodwill impairment is recognized when the quantitative assessment results in the carrying value exceeding the fair value, in which case an impairment charge is recorded to the extent the carrying value exceeds the fair value. There were no impairment charges to goodwill during the periods presented.
Intangible assets are amortized on a straight-line basis over the estimated useful life of the respective asset. Each period the Company evaluates the estimated remaining useful lives of its intangible assets and whether events or changes in circumstances warrant a revision to the remaining period of amortization.
The estimated useful lives of the Company’s intangible assets are as follows:
| Developed technology |
3 –6 years | |
| Customer relationships |
6 years | |
| Other intangible assets |
3 years |
Impairment of Long-Lived Assets
The Company evaluates the recoverability of long-lived assets, including property and equipment and intangible assets for possible impairment whenever events or circumstances indicate that the carrying amount of such assets may not be fully recoverable. Such events and changes may include significant changes in performance relative to expected operating results, significant changes in asset use, significant negative industry or economic trends, and changes in the Company’s business strategy. Recoverability of these assets is measured by a comparison of the carrying amounts to the future undiscounted cash flows the assets are expected to generate. If such review indicates that the carrying amount of long-lived assets is not recoverable, the carrying amount of such assets is reduced to fair value. There were no impairment charges to long-lived assets during the periods presented.
94
Table of Contents
Revenue Recognition
The Company’s revenues are comprised of revenue from self-managed subscriptions and SaaS subscriptions. Subscriptions to the Company’s self-managed software include license, support, and upgrades and updates on a when-and-if-available basis. The Company’s SaaS subscriptions provide access to the Company’s latest managed version of its product hosted in a public cloud. The Company’s self-managed subscriptions are offered on an annual and multi-year basis, and SaaS subscriptions are offered on an annual basis, with the exception of certain SaaS subscriptions, which are also offered on a monthly basis. The Company’s annual and multi-year subscriptions are typically invoiced and collected at the time of entering into the contract for the full contract amount. The Company’s monthly SaaS subscriptions are typically billed in arrears. For SaaS subscriptions with a minimum usage commitment, the Company typically invoices and collects the commitment amount at the time of entering into the contract, with any usage in excess of the committed contracted amount billed monthly in arrears.
Revenue is recognized when a customer obtains control of promised goods or services are delivered. The amount of revenue recognized reflects the consideration that the Company expects to receive in exchange for these goods or services. To achieve the core principle of this standard, the Company applied the following five steps:
1. Identification of the contract, or contracts, with the customer
The Company determines that it has a contract with a customer when each party’s rights regarding the products or services to be transferred can be identified, the payment terms for the services can be identified, the Company has determined the customer has the ability and intent to pay, and the contract has commercial substance. At contract inception, the Company evaluates whether two or more contracts should be combined and accounted for as a single contract and whether the combined or single contract includes more than one performance obligation.
2. Identification of the performance obligations in the contract
Performance obligations promised in a contract are identified based on the products and services that will be transferred to the customer that are both capable of being distinct, whereby the customer can benefit from the products or services either on their own or together with other resources that are readily available from third parties or from the Company, and are distinct in the context of the contract, whereby the transfer of the products and services is separately identifiable from other promises in the contract.
For self-managed subscriptions, the Company’s performance obligations include license for proprietary features of software, support, and upgrades and updates to the software on a when-and-if-available basis. The license provides standalone functionality to the customer and is therefore deemed a distinct performance obligation. Performance obligations related to support as well as upgrades and updates to the software on a when-and-if-available basis generally have a consistent continuous pattern of transfer to a customer during the contract period.
For SaaS subscriptions, the Company provides access to its cloud-hosted software, without providing the customer with the right to take possession of its software, which the Company considers to be a single performance obligation.
3. Determination of the transaction price
The transaction price is determined based on the consideration to which the Company expects to be entitled in exchange for transferring products or delivery of services to the customer. Payment terms and conditions vary by contract type, although terms generally include a requirement to pay within 30 days. In instances where the
95
Table of Contents
timing of revenue recognition differs from the timing of invoicing, the Company has determined its contracts generally do not include a significant financing component. The primary purpose of the Company’s invoicing terms is to provide customers with simplified and predictable ways of purchasing its products and services, not to receive financing from its customers or to provide customers with financing. The Company applied the practical expedient in ASC 606 and did not evaluate payment terms of one year or less for the existence of a significant financing component. Revenue is recognized net of any taxes collected from customers which are subsequently remitted to governmental entities (for example, sales tax and other indirect taxes). The Company does not offer right of refund in its contracts.
4. Allocation of the transaction price to the performance obligations in the contract
If the contract contains a single performance obligation, the entire transaction price is allocated to the single performance obligation. For contracts that contain multiple performance obligations, the Company allocates the transaction price for each contract to each performance obligation based on the relative standalone selling price (“SSP”) for each performance obligation. The Company uses judgment in determining the SSP for its products and services. The Company typically assesses the SSP for its products and services on a periodic basis or when facts and circumstances change. To determine SSP, the Company maximizes the use of observable standalone sales and observable data, where available. In instances where performance obligations do not have observable standalone sales, the Company utilizes available information that may include market conditions, pricing strategies, the economic life of the software, and other observable inputs or uses the expected cost-plus margin approach to estimate the price the Company would charge if the products and services were sold separately.
5. Recognition of the revenue when, or as, a performance obligation is satisfied
Revenue is recognized at the time the related performance obligation is satisfied by transferring the promised product or delivery of service to the customer. Revenue is recognized in an amount that reflects the consideration that the Company expects to receive in exchange for those products or services. For self-managed subscriptions, the revenue related to the license for proprietary features is recognized upfront, when the license is delivered. This revenue is presented in the Company’s Consolidated Statements of Operations as license–self-managed. The revenue related to support, and upgrades and updates, are recognized ratably over the contract period and is included in the Company’s Consolidated Statements of Operations as subscription–self-managed and SaaS. For SaaS subscriptions, revenue is recognized based on usage as the usage occurs over the contract period and is included in the Company’s Consolidated Statements of Operations as subscription–self-managed and SaaS.
Cost of Revenue
Cost of revenue primarily consists of expenses related to providing support to the Company’s customers, cloud-related costs, such as hosting and managing costs, the amortization of acquired intangible assets, and allocated overhead. Overhead is allocated to cost of revenue based on applicable headcount.
Research and Development
Research and development costs include personnel-related expenses associated with the Company’s engineering personnel responsible for the design, development and testing of its products, cost of development environments and tools, and allocated overhead. Research and development costs are expensed as incurred.
Advertising Costs
Advertising costs are expensed as incurred and include direct marketing, events, public relations, sales collateral materials and partner programs. Advertising costs amounted to $2.7 million, $1.1 million, and $0.6 million for the years ended December 31, 2020, 2019, and 2018, respectively, and are included in sales and marketing expense in the Consolidated Statements of Operations.
96
Table of Contents
Share-Based Compensation
Share-based compensation expense related to share-based awards is recognized based on the fair value of the awards granted and recognized as an expense on a straight-line basis over the requisite service period for share options, RSUs and performance-based RSUs. The fair value of each option award is estimated on the grant date using the Black-Scholes option pricing model. The Black-Scholes option pricing model requires the input of highly subjective assumptions, including the fair value of the underlying ordinary shares, the expected term of the award, the expected volatility of the price of the Company’s ordinary shares, risk-free interest rates, and the expected dividend yield of ordinary shares. The fair value of each RSU award is based on the fair value of the underlying ordinary shares on the grant date. The assumptions used to determine the fair value of the share awards represent management’s best estimates. These estimates involve inherent uncertainties and the application of management’s judgment. The compensation expense associated with performance-based RSUs is adjusted based on the probability in achieving performance targets. Forfeitures are accounted for as they occur instead of estimating the number of awards expected to be forfeited.
Income Taxes
The Company is subject to income taxes in Israel, the U.S., and other foreign jurisdictions. These foreign jurisdictions may have different statutory rates than in Israel. Income taxes are accounted in accordance with ASC 740, Income Taxes (“ASC 740”). Deferred tax assets and liabilities are recognized for the future tax consequences attributable to differences between the financial statements carrying amounts of existing assets and liabilities and their respective tax basis and operating loss and tax credit carryforwards. Deferred tax assets and liabilities are measured using enacted tax rates expected to apply to taxable income in the years in which those temporary differences are expected to be recovered or settled. The financial effect of changes in tax laws or rates is accounted for in the period of enactment. Valuation allowances are provided when necessary to reduce deferred tax assets to the amount expected to be realized.
The Company recognizes income tax benefits from uncertain tax positions only if it believes that it is more likely than not that the tax position will be sustained upon examination by the taxing authorities based on the technical merits of the position. The tax benefits recognized in the financial statements from such uncertain tax positions are then measured based on the largest benefit that is more likely than not to be realized upon the ultimate settlement. Although the Company believes that it has adequately reserved for its uncertain tax positions (including net interest and penalties), it can provide no assurance that the final tax outcome of these matters will not be materially different. The Company makes adjustments to these reserves when facts and circumstances change, such as the closing of a tax audit or the refinement of an estimate. To the extent that the final tax outcome of these matters is different from the amounts recorded, such differences will affect the income tax expense in the period in which such determination is made.
Net Loss Per Share Attributable to Ordinary Shareholders
The Company computes net loss per share using the two-class method required for participating securities. The two-class method requires income available to ordinary shareholders for the period to be allocated between ordinary shares and participating securities based upon their respective rights to receive dividends as if all income for the period had been distributed. The Company considers its convertible preferred shares to be participating securities as the holders of the convertible preferred shares would be entitled to dividends that would be distributed to the holders of ordinary shares, on a pro-rata basis assuming conversion of all convertible preferred shares into ordinary shares. These participating securities do not contractually require the holders of such shares to participate in the Company’s losses. As such, net loss for the periods presented was not allocated to the Company’s participating securities.
The Company’s basic net loss per share is calculated by dividing net loss attributable to ordinary shareholders by the weighted-average number of shares of ordinary shares outstanding for the period, without consideration of potentially dilutive securities. The diluted net loss per share is calculated by giving effect to all
97
Table of Contents
potentially dilutive securities outstanding for the period using the treasury share method or the if-converted method based on the nature of such securities. Diluted net loss per share is the same as basic net loss per share in periods when the effects of potentially dilutive shares of ordinary shares are anti-dilutive.
Segment Information
The Company operates in one operating and reportable segment. Operating segments are defined as components of an enterprise about which separate financial information is evaluated regularly by the chief operating decision maker, who is the Company’s CEO, in deciding how to allocate resources and assessing performance. The Company’s chief operating decision maker allocates resources and assesses performance based upon discrete financial information at the consolidated level.
Revenue by geographical region can be found in the revenue recognition disclosures in Note 3 below. The following table presents the Company’s property and equipment, net of depreciation and amortization, by geographic region:
| December 31, | ||||||||
| 2020 | 2019 | |||||||
|
|
|
|||||||
| (in thousands) | ||||||||
| United States |
$ | 1,437 | $ | 1,544 | ||||
| Israel |
3,018 | 1,500 | ||||||
| Rest of world |
508 | 488 | ||||||
|
|
|
|
|
|||||
| Total property and equipment, net |
$ | 4,963 | $ | 3,532 | ||||
|
|
|
|
|
|||||
Recently Adopted Accounting Pronouncements
As an “emerging growth company,” the Jumpstart Our Business Startups Act (“JOBS Act”) allows the Company to delay adoption of new or revised accounting pronouncements applicable to public companies until such pronouncements are made applicable to private companies. The Company has elected to use this extended transition period under the JOBS Act. The adoption dates discussed below reflect this election.
In August 2017, the FASB issued ASU 2017-12, Derivatives and Hedging (Topic 815): Targeted Improvements to Accounting for Hedging Activities, which simplifies the designation and measurement requirements of hedge accounting in certain situations and allows companies to better align their hedge accounting with their risk management activities. The guidance also eases certain hedge effectiveness assessment requirements, expands the eligibility of hedging strategies that may qualify for hedge accounting and modifies certain presentation and disclosure requirements. The guidance will be effective beginning January 1, 2021, and interim periods in fiscal years beginning January 1, 2022. Early adoption is permitted. The Company early adopted the guidance as of January 1, 2020, and the adoption did not have a material impact on its consolidated financial statements.
Recently Issued Accounting Pronouncements
In February 2016, the FASB issued ASU No. 2016-02, Leases, which would require lessees to put all leases on their balance sheets, whether operating or financing, while continuing to recognize the expenses on their income statements in a manner similar to current practice. The guidance states that a lessee would recognize a lease liability for the obligation to make lease payments and a right-to-use asset for the right to use the underlying asset for the lease term. In June 2020, the FASB issued ASU 2020-05, Revenue from Contracts with Customers (Topic 606) and Leases (Topic 842): Effective Dates for Certain Entities, which defers the effective date of ASU 2016-02 for non-public entities to fiscal years beginning after December 15, 2021, and interim periods within fiscal years beginning after December 15, 2022. The guidance will be effective for the Company beginning January 1, 2022, and interim periods in fiscal years beginning January 1, 2023.
98
Table of Contents
The Company plans to early adopt the guidance starting January 1, 2021 using a modified retrospective transition approach, which applies the provisions of the new guidance at the effective date without adjusting the comparative periods presented. The Company expects to elect certain practical expedients permitted under the transition guidance within the new guidance, which allows it to carry forward the historical accounting relating to lease identification and classification for existing leases upon adoption. The Company also expects to elect to keep leases with an initial term of 12 months or less off its Consolidated Balance Sheets. The Company expects to elect not to separate lease and non-lease components for all classes of underlying assets. While the adoption remains in progress, the Company expects that the adoption will result in the recognition of operating lease right of use assets and operating lease liabilities that were not previously recognized, which will increase total assets and liabilities on its Consolidated Balance Sheets. In addition, a material portion of the Company’s leases are denominated in currencies other than the U.S. Dollar, mainly in NIS. As a result, the associated lease liabilities will be remeasured using the current exchange rate in the future reporting periods, which may result in material foreign exchange gains or losses. The Company does not expect the adoption of Topic 842 to have a material impact to its Consolidated Statements of Operations or Cash Flows.
In June 2016, the FASB issued ASU No. 2016-13, Financial Instruments – Credit Losses (Topic 326): Measurement of Credit Losses on Financial Instruments, which replaces the existing incurred loss impairment model with an expected credit loss model and requires a financial asset measured at amortized cost to be presented at the net amount expected to be collected. The guidance will be effective for the Company beginning January 1, 2023, and interim periods therein. Early adoption is permitted. The Company is currently evaluating the effect that ASU 2016-13 will have on its consolidated financial statements and related disclosures.
In August 2018, the FASB issued ASU No. 2018-15, Intangibles-Goodwill and Other-Internal-Use Software (Subtopic 350-40): Customer’s Accounting for Implementation Costs Incurred in a Cloud Computing Arrangement That Is a Service Contract, which aligns the requirements for capitalizing implementation costs incurred in a hosting arrangement that is a service contract with the requirements for capitalizing implementation costs incurred to develop or obtain internal-use software. The new standard requires capitalized costs to be amortized on a straight-line basis generally over the term of the arrangement, and the financial statement presentation for these capitalized costs would be the same as that of the fees related to the hosting arrangements. The guidance will be effective for the Company beginning January 1, 2021, and interim periods in fiscal years beginning January 1, 2022. Early adoption is permitted. The Company is currently evaluating the effect that ASU 2018-15 will have on its consolidated financial statements and related disclosures.
In December 2019, the FASB issued ASU No. 2019-12, Income Taxes (Topic 740): Simplifying the Accounting for Income Taxes, which simplifies the accounting for income taxes by removing a variety of exceptions within the framework of ASC 740. These exceptions include the exception to the incremental approach for intraperiod tax allocation in the event of a loss from continuing operations and income or a gain from other items (such as other comprehensive income), and the exception to using general methodology for the interim period tax accounting for year-to-date losses that exceed anticipated losses. The guidance will be effective for the Company beginning January 1, 2022, and interim periods in fiscal years beginning January 1, 2023. Early adoption is permitted. The Company is currently evaluating the effect that ASU 2019-12 will have on its consolidated financial statements and related disclosures.
99
Table of Contents
| 3. | Revenue Recognition |
Disaggregation of Revenue
The following table presents revenue by category:
| Year Ended December 31, | ||||||||||||||||||||||||
| 2020 | 2019 | 2018 | ||||||||||||||||||||||
| Amount | Percentage of Revenue |
Amount | Percentage of Revenue |
Amount | Percentage of Revenue |
|||||||||||||||||||
|
|
||||||||||||||||||||||||
| (in thousands, except percentages) | ||||||||||||||||||||||||
| Self-managed subscription |
$ | 118,207 | 78 | % | $ | 85,596 | 82 | % | $ | 53,858 | 85 | % | ||||||||||||
|
|
|
|
|
|
|
|
|
|
|
|
|
|||||||||||||
| Subscription |
105,358 | 70 | 75,486 | 72 | 46,380 | 73 | ||||||||||||||||||
| License |
12,849 | 8 | 10,110 | 10 | 7,478 | 12 | ||||||||||||||||||
| SaaS |
32,620 | 22 | 19,120 | 18 | 9,674 | 15 | ||||||||||||||||||
|
|
|
|
|
|
|
|
|
|
|
|
|
|||||||||||||
| Total subscription revenue |
$ | 150,827 | 100 | % | $ | 104,716 | 100 | % | $ | 63,532 | 100 | % | ||||||||||||
|
|
|
|
|
|
|
|
|
|
|
|
|
|||||||||||||
The following table summarizes revenue by region based on the shipping address of customers:
| Year Ended December 31, | ||||||||||||||||||||||||
| 2020 | 2019 | 2018 | ||||||||||||||||||||||
| Amount | Percentage of Revenue |
Amount | Percentage of Revenue |
Amount | Percentage of Revenue |
|||||||||||||||||||
|
|
||||||||||||||||||||||||
| (in thousands, except percentages) | ||||||||||||||||||||||||
| United States |
$ | 96,786 | 64 | % | $ | 64,951 | 62 | % | $ | 40,374 | 63 | % | ||||||||||||
| Israel |
2,837 | 2 | 1,927 | 2 | 1,140 | 2 | ||||||||||||||||||
| Rest of world |
51,204 | 34 | 37,838 | 36 | 22,018 | 35 | ||||||||||||||||||
|
|
|
|
|
|
|
|
|
|
|
|
|
|||||||||||||
| Total subscription revenue |
$ | 150,827 | 100 | % | $ | 104,716 | 100 | % | $ | 63,532 | 100 | % | ||||||||||||
|
|
|
|
|
|
|
|
|
|
|
|
|
|||||||||||||
Deferred Revenue
Of the $82.3 million, $70.2 million, and $46.1 million of deferred revenue recorded as of January 1, 2020, 2019, and 2018, respectively, the Company recognized $73.3 million, $51.9 million, and $30.9 million as revenue during the years ended December 31, 2020, 2019, and 2018, respectively.
Remaining Performance Obligation
The Company’s remaining performance obligations are comprised of product and services revenue not yet delivered. As of December 31, 2020, the aggregate amount of the transaction price allocated to remaining performance obligations was $107.9 million, which consists of both billed consideration in the amount of $102.8 million and unbilled consideration in the amount of $5.1 million that the Company expects to recognize as revenue. As of December 31, 2020, the Company expects to recognize 86% of its remaining performance obligations as revenue in the year ending December 31, 2021, and the remainder thereafter.
100
Table of Contents
Cost to Obtain a Contract
The following table represents a rollforward of deferred contract acquisition costs:
| Year Ended December 31, | ||||||||||||
| 2020 | 2019 | 2018 | ||||||||||
|
|
|
|||||||||||
| (in thousands) | ||||||||||||
| Beginning balance |
$ | 5,989 | $ | 3,590 | $ | 1,488 | ||||||
| Additions to deferred contract acquisition costs |
5,186 | 4,212 | 2,947 | |||||||||
| Amortization of deferred contract acquisition costs |
(2,979 | ) | (1,813 | ) | (845 | ) | ||||||
|
|
|
|
|
|
|
|||||||
| Ending balance |
$ | 8,196 | $ | 5,989 | $ | 3,590 | ||||||
|
|
|
|
|
|
|
|||||||
| Deferred contract acquisition costs (to be recognized in next 12 months) |
$ | 3,247 | $ | 2,348 | $ | 1,299 | ||||||
| Deferred contract acquisition costs, noncurrent |
4,949 | 3,641 | 2,291 | |||||||||
|
|
|
|
|
|
|
|||||||
| Total deferred contract acquisition costs |
$ | 8,196 | $ | 5,989 | $ | 3,590 | ||||||
|
|
|
|
|
|
|
|||||||
| 4. | Short-Term Investments |
Short-term investments consisted of the following:
| December 31, 2020 | ||||||||||||||||
| Amortized Cost |
Gross Unrealized Gains |
Gross Unrealized Losses |
Estimated Fair Value |
|||||||||||||
|
|
|
|||||||||||||||
| (in thousands) | ||||||||||||||||
| Bank deposits |
$ | 133,386 | $ | — | $ | — | $ | 133,386 | ||||||||
|
|
|
|
|
|
|
|
|
|||||||||
| Certificates of deposit |
10,802 | 20 | (1 | ) | 10,821 | |||||||||||
| Commercial paper |
34,150 | 3 | (2 | ) | 34,151 | |||||||||||
| Corporate debt securities |
128,694 | 11 | (82 | ) | 128,623 | |||||||||||
| Municipal securities |
54,238 | 7 | (12 | ) | 54,233 | |||||||||||
| Government and agency debt |
72,394 | 5 | (18 | ) | 72,381 | |||||||||||
|
|
|
|
|
|
|
|
|
|||||||||
| Marketable securities |
300,278 | 46 | (115 | ) | 300,209 | |||||||||||
|
|
|
|
|
|
|
|
|
|||||||||
| Total short-term investments |
$ | 433,664 | $ | 46 | (115 | ) | $ | 433,595 | ||||||||
|
|
|
|
|
|
|
|
|
|||||||||
| December 31, 2019 | ||||||||||||||||
| Amortized Cost |
Gross Unrealized Gains |
Gross Unrealized Losses |
Estimated Fair Value |
|||||||||||||
|
|
|
|||||||||||||||
| (in thousands) | ||||||||||||||||
| Bank deposits |
$ | 26,722 | $ | — | $ | — | $ | 26,722 | ||||||||
|
|
|
|
|
|
|
|
|
|||||||||
| Certificates of deposit |
5,267 | 3 | — | 5,270 | ||||||||||||
| Commercial paper |
4,762 | — | (3 | ) | 4,759 | |||||||||||
| Corporate debt securities |
59,832 | 20 | (16 | ) | 59,836 | |||||||||||
| Municipal securities |
483 | — | — | 483 | ||||||||||||
| Government and agency debt |
30,230 | 32 | (1 | ) | 30,261 | |||||||||||
|
|
|
|
|
|
|
|
|
|||||||||
| Marketable securities |
100,574 | 55 | (20 | ) | 100,609 | |||||||||||
|
|
|
|
|
|
|
|
|
|||||||||
| Total short-term investments |
$ | 127,296 | $ | 55 | $ | (20 | ) | $ | 127,331 | |||||||
|
|
|
|
|
|
|
|
|
|||||||||
101
Table of Contents
Based on the available evidence, the Company concluded that the gross unrealized losses on the marketable securities as of December 31, 2020 and 2019 are temporary in nature. See Note 12, Accumulated Other Comprehensive Income, for the realized gains or losses from available-for-sale marketable securities that were reclassified out of accumulated other comprehensive income during the periods presented. As of December 31, 2020, the contractual maturities of the Company’s marketable securities were all less than one year.
| 5. | Fair Value Measurements |
The following table presents information about the Company’s financial instruments that are measured at fair value on a recurring basis:
| December 31, 2020 | ||||||||||||||||
| Fair Value | Level 1 | Level 2 | Level 3 | |||||||||||||
|
|
||||||||||||||||
| (in thousands) | ||||||||||||||||
| Financial Assets: |
||||||||||||||||
| Money market funds |
$ | 111,080 | $ | 111,080 | $ | — | $ | — | ||||||||
| Certificates of deposit |
274 | — | 274 | — | ||||||||||||
|
|
|
|
|
|
|
|
|
|||||||||
| Cash equivalents |
111,354 | 111,080 | 274 | — | ||||||||||||
|
|
|
|
|
|
|
|
|
|||||||||
| Bank deposits |
133,386 | — | 133,386 | — | ||||||||||||
| Certificates of deposit |
10,821 | — | 10,821 | — | ||||||||||||
| Commercial paper |
34,151 | — | 34,151 | — | ||||||||||||
| Corporate debt securities |
128,623 | — | 128,623 | — | ||||||||||||
| Municipal securities |
54,233 | — | 54,233 | — | ||||||||||||
| Government and agency debt |
72,381 | — | 72,381 | — | ||||||||||||
|
|
|
|
|
|
|
|
|
|||||||||
| Short-term investments |
433,595 | — | 433,595 | — | ||||||||||||
|
|
|
|
|
|
|
|
|
|||||||||
| Foreign currency contracts designated as hedging instruments included in prepaid expenses and other current assets |
468 | — | 468 | — | ||||||||||||
| Foreign currency contracts not designated as hedging instruments included in prepaid expenses and other current assets |
2 | — | 2 | — | ||||||||||||
|
|
|
|
|
|
|
|
|
|||||||||
| Total financial assets |
$ | 545,419 | $ | 111,080 | $ | 434,339 | $ | — | ||||||||
|
|
|
|
|
|
|
|
|
|||||||||
| Financial Liabilities: |
||||||||||||||||
| Foreign currency contracts designated as hedging instruments included in accrued expenses and other current liabilities |
$ | 16 | $ | — | $ | 16 | $ | — | ||||||||
|
|
|
|
|
|
|
|
|
|||||||||
| Total financial liabilities |
$ | 16 | $ | — | $ | 16 | $ | — | ||||||||
|
|
|
|
|
|
|
|
|
|||||||||
102
Table of Contents
| December 31, 2019 | ||||||||||||||||
| Fair Value | Level 1 | Level 2 | Level 3 | |||||||||||||
|
|
||||||||||||||||
| (in thousands) | ||||||||||||||||
| Financial Assets: |
||||||||||||||||
| Money market funds |
$ | 8,763 | $ | 8,763 | $ | — | $ | — | ||||||||
| Bank deposits |
6,010 | — | 6,010 | — | ||||||||||||
| Corporate debt securities |
2,459 | — | 2,459 | — | ||||||||||||
|
|
|
|
|
|
|
|
|
|||||||||
| Cash equivalents |
17,232 | 8,763 | 8,469 | — | ||||||||||||
|
|
|
|
|
|
|
|
|
|||||||||
| Bank deposits |
26,722 | — | 26,722 | — | ||||||||||||
| Certificates of deposit |
5,270 | — | 5,270 | — | ||||||||||||
| Commercial paper |
4,759 | — | 4,759 | — | ||||||||||||
| Corporate debt securities |
59,836 | — | 59,836 | — | ||||||||||||
| Municipal securities |
483 | — | 483 | — | ||||||||||||
| Government and agency debt |
30,261 | — | 30,261 | — | ||||||||||||
|
|
|
|
|
|
|
|
|
|||||||||
| Short-term investments |
127,331 | — | 127,331 | — | ||||||||||||
|
|
|
|
|
|
|
|
|
|||||||||
| Restricted money market fund included in other assets, noncurrent |
1,500 | 1,500 | — | — | ||||||||||||
|
|
|
|
|
|
|
|
|
|||||||||
| Total financial assets |
$ | 146,063 | $ | 10,263 | $ | 135,800 | $ | — | ||||||||
|
|
|
|
|
|
|
|
|
|||||||||
| Financial Liabilities: |
||||||||||||||||
| Foreign currency contracts included in accrued expenses and other current liabilities |
$ | 69 | $ | — | $ | 69 | $ | — | ||||||||
|
|
|
|
|
|
|
|
|
|||||||||
| Total financial liabilities |
$ | 69 | $ | — | $ | 69 | $ | — | ||||||||
|
|
|
|
|
|
|
|
|
|||||||||
The Company classifies its money market funds within Level 1 of the fair value hierarchy because they are valued based on quoted market prices in active markets. The Company classifies its bank deposits, certificates of deposit, commercial paper, corporate debt securities, municipal securities, government and agency debt, and derivative financial instruments within Level 2 because they are valued using inputs other than quoted prices which are directly or indirectly observable in the market, including readily-available pricing sources for the identical underlying security which may not be actively traded.
| 6. | Derivative Financial Instruments and Hedging |
Notional Amount of Foreign Currency Contracts
The gross notional amounts of the Company’s foreign currency contracts are NIS denominated. The notional amounts of outstanding foreign currency contracts in U.S. dollar as of the periods presented were as follows:
| December 31, | ||||||||
| 2020 | 2019 | |||||||
|
|
|
|||||||
| (in thousands) | ||||||||
| Derivatives Designated as Hedging Instruments: |
||||||||
| Foreign currency contracts |
$ | 10,264 | $ | — | ||||
| Derivatives Not Designated as Hedging Instruments: |
||||||||
| Foreign currency contracts |
1,230 | 9,672 | ||||||
|
|
|
|
|
|||||
| Total derivative instruments |
$ | 11,494 | $ | 9,672 | ||||
|
|
|
|
|
|||||
103
Table of Contents
Effect of Foreign Currency Contracts on the Consolidated Statements of Operations
The effect of foreign currency contracts on the Consolidated Statements of Operations during the periods presented were as follows:
| Derivatives Designated as Hedging Instruments |
Derivatives Not Designated as Hedging Instruments |
|||||||||||||||||||||||
| Year Ended December 31, | Year Ended December 31, | |||||||||||||||||||||||
| 2020 | 2019 | 2018 | 2020 | 2019 | 2018 | |||||||||||||||||||
|
|
||||||||||||||||||||||||
| Statement of Operations Location: | (in thousands) | |||||||||||||||||||||||
| Cost of revenue: subscription–self-managed and SaaS |
$ | 68 | $ | — | $ | — | $ | — | $ | — | $ | — | ||||||||||||
| Research and development |
426 | — | — | — | — | — | ||||||||||||||||||
| Sales and marketing |
141 | — | — | — | — | — | ||||||||||||||||||
| General and administrative |
163 | — | — | — | — | — | ||||||||||||||||||
| Interest and other income, net |
— | — | — | 62 | 137 | 369 | ||||||||||||||||||
|
|
|
|
|
|
|
|
|
|
|
|
|
|||||||||||||
| Total gains recognized in earnings |
$ | 798 | $ | — | $ | — | $ | 62 | $ | 137 | $ | 369 | ||||||||||||
|
|
|
|
|
|
|
|
|
|
|
|
|
|||||||||||||
Effect of Foreign Currency Contracts on Accumulated Other Comprehensive Income
The following table represents the net unrealized gains of foreign currency contracts designated as hedging instruments, net of tax, that were recorded in accumulated other comprehensive income as of December 31, 2020, and their effect on other comprehensive income for the year ended December 31, 2020:
| Year Ended December 31, 2020 |
||||
| (in thousands) | ||||
| Balance as of December 31, 2019 |
$ | — | ||
| Amount of net gains recorded in other comprehensive income |
1,239 | |||
| Amount of net gains reclassified from other comprehensive income to earnings |
(798 | ) | ||
|
|
|
|||
| Balance as of December 31, 2020 |
$ | 441 | ||
|
|
|
|||
There were no foreign currency contracts designated as hedging instruments for the years ended December 31, 2019 and 2018. As of December 31, 2020, net deferred gains totaled $0.4 million and are expected to be recognized as operating expenses in the same financial statement line item in the Consolidated Statements of Operations to which the derivative relates over the next twelve months. See Note 12, Accumulated Other Comprehensive Income, for the amounts recorded in each financial statement line item during the periods presented.
| 7. | Consolidated Balance Sheet Components |
Property and Equipment, Net
Property and equipment, net consisted of the following:
| December 31, | ||||||||
| 2020 | 2019 | |||||||
|
|
|
|||||||
| (in thousands) | ||||||||
| Computer and software |
$ | 4,079 | $ | 3,107 | ||||
| Furniture and office equipment |
1,495 | 1,097 | ||||||
| Leasehold improvements |
3,761 | 2,234 | ||||||
|
|
|
|
|
|||||
| Property and equipment, gross |
9,335 | 6,438 | ||||||
| Less: accumulated depreciation and amortization |
(4,372 | ) | (2,906 | ) | ||||
|
|
|
|
|
|||||
| Property and equipment, net |
$ | 4,963 | $ | 3,532 | ||||
|
|
|
|
|
|||||
104
Table of Contents
Depreciation and amortization expense were $2.1 million, $1.3 million, and $0.7 million for the years ended December 31, 2020, 2019, and 2018, respectively.
Accrued Expenses and Other Current Liabilities
Accrued expenses and other current liabilities consisted of the following:
| December 31, | ||||||||
| 2020 | 2019 | |||||||
|
|
|
|||||||
| (in thousands) | ||||||||
| Accrued compensation and benefits |
$ | 8,799 | $ | 5,333 | ||||
| Withholding tax from employee equity transactions to be remitted to tax authorities |
9,186 | — | ||||||
| Accrued expenses |
3,054 | 3,002 | ||||||
|
|
|
|
|
|||||
| Accrued expenses and other current liabilities |
$ | 21,039 | $ | 8,335 | ||||
|
|
|
|
|
|||||
| 8. | Business Combination |
In February 2019, the Company acquired 100% of the share capital of Shippable Inc. (“Shippable”), a privately held company in the United States. Shippable is a cloud-based continuous integration and delivery platform that developers use to compile code and deliver app and microservices updates. The acquisition has been accounted for as a business combination and the Company has included the financial results of Shippable in the consolidated financial statements from the date of the acquisition. The effects on the Company’s consolidated total revenue and net loss were immaterial. As a result, pro forma results of operations for this acquisition have not been presented.
The total purchase price was $21.2 million, comprised of $20.9 million in cash paid, net of $0.3 million of cash acquired, and issuance of 1,488 ordinary shares, paid and issued upon closing of the transaction. In addition, there are contingent considerations that are not included within the total purchase price, comprising of total aggregate cash payments of $4.1 million and the issuance of 308,080 shares of the Company’s ordinary shares, subject to the attainment of certain employee retention and performance targets, and are recognized over three years as acquisition-related costs and share-based compensation expense, respectively. The Company recognized $1.4 million and $1.1 million in acquisition-related costs and $0.7 million and $1.1 million in share-based compensation expense related to these contingent considerations for the years ended December 31, 2020 and 2019, respectively. As of December 31, 2020, the unrecognized share-based compensation cost related to the issuable ordinary shares was $0.5 million.
The following table summarizes the components of the Shippable purchase price and the allocation of the purchase price at fair value:
| Amount | ||||
| (in thousands) | ||||
| Cash paid, net of cash acquired |
$ | 20,860 | ||
| Ordinary shares |
11 | |||
|
|
|
|||
| Total purchase consideration |
$ | 20,871 | ||
|
|
|
|||
| Deferred tax assets |
$ | 1,323 | ||
| Intangible assets |
4,000 | |||
| Goodwill |
15,691 | |||
| Net liabilities acquired |
(143 | ) | ||
|
|
|
|||
| Total purchase consideration |
$ | 20,871 | ||
|
|
|
|||
105
Table of Contents
The following table sets forth the components of identifiable intangible assets acquired and their estimated useful lives as of the date of acquisition:
| Fair Value | Useful Life | |||||||
| (in thousands) | (in years) | |||||||
| Developed technology |
$ | 2,800 | 6.0 | |||||
| Customer relationships |
1,200 | 6.0 | ||||||
|
|
|
|||||||
| Total identifiable intangible assets |
$ | 4,000 | ||||||
|
|
|
|||||||
Goodwill of $15.7 million, none of which is deductible for tax purposes, was recorded in connection with the Shippable acquisition, and was primarily attributed to synergies arising from the acquisition and the value of the acquired workforce.
The Company incurred transaction costs in connection with the Shippable acquisition of $0.3 million. These transaction costs were included in general and administrative expenses in the Consolidated Statements of Operations.
| 9. | Goodwill and Intangible Assets, Net |
Goodwill
The following table represents the changes to goodwill:
| Carrying Amount |
||||
| (in thousands) | ||||
| Balance as of December 31, 2018 |
$ | 1,629 | ||
| Addition from acquisition |
15,691 | |||
|
|
|
|||
| Balance as of December 31, 2019 and 2020 |
$ | 17,320 | ||
|
|
|
|||
There was no goodwill activity during the year ended December 31, 2020.
Intangible Assets, Net
Intangible assets consisted of the following as of December 31, 2020:
| Gross Fair Value |
Accumulated Amortization |
Net Book Value |
Weighted- Average Remaining Useful Life |
|||||||||||||
| (in thousands) | (in years) | |||||||||||||||
| Developed technology |
$ | 4,856 | $ | (2,064 | ) | $ | 2,792 | 3.7 | ||||||||
| Customer relationships |
1,200 | (367 | ) | 833 | 4.2 | |||||||||||
| Other intangible assets |
1,586 | (1,164 | ) | 422 | 0.8 | |||||||||||
|
|
|
|
|
|
|
|||||||||||
| Total |
$ | 7,642 | $ | (3,595 | ) | $ | 4,047 | |||||||||
|
|
|
|
|
|
|
|||||||||||
106
Table of Contents
Intangible assets consisted of the following as of December 31, 2019:
| Gross Fair Value |
Accumulated Amortization |
Net Book Value |
Weighted- Average Remaining Useful Life |
|||||||||||||
| (in thousands) | (in years) | |||||||||||||||
| Developed technology |
$ | 4,856 | $ | (1,231 | ) | $ | 3,625 | 4.7 | ||||||||
| Customer relationships |
1,200 | (167 | ) | 1,033 | 5.2 | |||||||||||
| Other intangible assets |
1,586 | (636 | ) | 950 | 1.8 | |||||||||||
|
|
|
|
|
|
|
|||||||||||
| Total |
$ | 7,642 | $ | (2,034 | ) | $ | 5,608 | |||||||||
|
|
|
|
|
|
|
|||||||||||
Amortization expenses for intangible assets were $1.6 million, $1.5 million, and $0.4 million for the years ended December 31, 2020, 2019, and 2018, respectively. Amortization of developed technology is included in cost of revenue: license—self-managed and amortization of customer relationships and other intangible assets are included in sales and marketing expense in the consolidated statements of operations.
The expected future amortization expenses by year related to the intangible assets as of December 31, 2020 are as follows:
| December 31, 2020 |
||||
| (in thousands) |
||||
| Year Ending December 31, |
||||
| 2021 |
$ | 1,382 | ||
| 2022 |
961 | |||
| 2023 |
887 | |||
| 2024 |
667 | |||
| 2025 |
150 | |||
|
|
|
|||
| Total |
$ | 4,047 | ||
|
|
|
|||
| 10. | Commitments and Contingencies |
Operating Leases
The Company leases its office facilities under non-cancelable agreements that expire at various dates through July 2026. Lease expenses during the years ended December 31, 2020, 2019, and 2018 were $4.2 million, $3.1 million, and $2.6 million, respectively. The minimum lease payments under operating leases as of December 31, 2020 were as follows:
| December 31, 2020 |
||||
| (in thousands) |
||||
| Year Ending December 31, |
||||
| 2021 |
$ | 5,475 | ||
| 2022 |
5,931 | |||
| 2023 |
5,429 | |||
| 2024 |
4,607 | |||
| 2025 |
3,389 | |||
| Thereafter |
803 | |||
|
|
|
|||
| Total |
$ | 25,634 | ||
|
|
|
|||
107
Table of Contents
Non-cancelable Purchase Obligations
In the normal course of business, the Company enters into non-cancelable purchase commitments with various parties for mainly hosting services, as well as software products and services. As of December 31, 2020, the Company had outstanding non-cancelable purchase obligations with a term of 12 months or longer as follows:
| December 31, 2020 |
||||
| (in thousands) |
||||
| Year Ending December 31, |
||||
| 2021 |
$ | 14,530 | ||
| 2022 |
14,755 | |||
| 2023 |
12,080 | |||
| 2024 |
10,000 | |||
| 2025 |
31,000 | |||
|
|
|
|||
| Total |
$ | 82,365 | ||
|
|
|
|||
Indemnifications and Contingencies
The Company enters into indemnification provisions under certain agreements with other parties in the ordinary course of business. In its customer agreements, the Company has agreed to indemnify, defend and hold harmless the indemnified party for third party claims and related losses suffered or incurred by the indemnified party from actual or threatened third-party intellectual property infringement claims. For certain large or strategic customers, the Company has agreed to indemnify, defend and hold harmless the indemnified party for non-compliance with certain additional representations and warranties made by the Company.
Grants from Israeli Innovation Authority
Between the years 2009 and 2015, the Company received grants from the Israeli Innovation Authority (“IIA”), in a total amount of $1.2 million for certain research and development costs. The grants are subject to repayment in the form of royalties on sales of products developed with the IIA funding. The Company repaid the grants in full in 2017.
As any grant recipient, the Company is subject to the provisions of the Israeli Law for the Encouragement of Research, Development and Technological Innovation in the Industry and the regulations and guidelines thereunder (the “Innovation Law”). Pursuant to the Innovation Law, there are restrictions related to transferring intellectual property outside of Israel. Such transfer requires the IIA’s approval. The approval may be subject to a maximum additional payment amount of five times the amount received. The Company recently received an approval from the IIA to perform a limited development of IIA funded know-how outside of Israel, subject to the terms specified in the IIA approval, including that all of its core R&D activities will remain in Israel.
Legal Proceedings
In the ordinary course of business, the Company may be subject from time to time to various proceedings, lawsuits, disputes, or claims. The Company investigates these claims as they arise. Although claims are inherently unpredictable, the Company is currently not aware of any matters that, if determined adversely to the Company, would individually or taken together, have a material adverse effect on its business, financial position, results of operations, or cash flows.
108
Table of Contents
| 11. | Convertible Preferred Shares, Shareholders’ Equity (Deficit) and Equity Incentive Plans |
Convertible Preferred Shares
Upon completion of the IPO, all convertible preferred shares outstanding, totaling 52,063,647 shares, were automatically converted into an equivalent number of ordinary shares on a one-to-one basis and their carrying value of $175.8 million was reclassified into shareholders’ equity.
Preferred and Ordinary Shares
In connection with the IPO, the Company’s amended and restated AoA became effective, which authorized the issuance of 50,000,000 preferred shares and 500,000,000 ordinary shares, each with a par value of NIS 0.01. All ordinary shares will have identical voting and other rights in all respects. The Company’s amended and restated AoA does not require shareholder approval of a dividend distribution and provides that dividend distributions may be determined by the Company’s board of directors. To date, no dividends have been declared.
The Company has the following ordinary shares reserved for future issuance:
| December 31, | ||||||||
| 2020 | 2019 | |||||||
|
|
|
|||||||
| Conversion of convertible preferred shares |
— | 52,063,647 | ||||||
| Outstanding share options |
13,075,489 | 13,201,986 | ||||||
| Outstanding RSUs |
818,945 | — | ||||||
| Issuable ordinary shares related to business combination |
149,472 | 308,080 | ||||||
| Shares available for future issuance under the 2011 Plan |
— | 1,119,471 | ||||||
| Shares available for future issuance under the 2020 Plan |
9,964,306 | — | ||||||
| Shares available for future issuance under the ESPP |
2,100,000 | — | ||||||
|
|
|
|
|
|||||
| Total ordinary shares reserved |
26,108,212 | 66,693,184 | ||||||
|
|
|
|
|
|||||
Equity Incentive Plans
In 2011, the Company adopted the 2011 Israeli Share Option Plan (“2011 Plan”), under which the Company may grant various forms of equity incentive compensation at the discretion of the board of directors, including share options. The awards have varying terms, but generally vest over five years. Share options expire 10 years after the date of grant. The Company issues new ordinary shares upon exercise of share options. Immediately prior to the IPO, 20,605,700 ordinary shares were reserved for grants of awards under the 2011 Plan and the remaining number of ordinary shares available for future issuance was 1,000,821. In connection with the IPO, the remaining number of ordinary shares available for future issuance under the 2011 Plan became available for issuance for a corresponding number of ordinary shares under the 2020 Equity Incentive Plan (“2020 Plan”).
In September 2020, immediately prior to the IPO, the Company adopted the 2020 Plan. Following the effectiveness of the 2020 Plan, the Company will no longer grant any awards under the 2011 Plan, though previously granted options under the 2011 Plan remain outstanding and governed by the 2011 Plan. The 2020 Plan provides for the grant of share options, ordinary shares, restricted shares, restricted share units and other share-based awards. The maximum number of ordinary shares available for issuance under the 2020 Plan is equal to the sum of (i) 9,100,000 ordinary shares plus, (ii) any shares subject to the pool authorized by the Company’s board of directors under the 2011 Plan which remain free and unallocated as of the effective date, and (iii) any shares subject to awards granted under the 2011 Plan that, on or after the effective date, expire, or are cancelled, terminated, forfeited or settled in cash in lieu of issuance of shares, for any reason, without having been
109
Table of Contents
exercised, with the maximum number of shares to be added to the 2020 Plan pursuant to the 2011 Plan equal to 15,309,367 shares. In addition, the number of shares available for issuance under the Company’s 2020 Plan also includes an annual increase on January 1 of each year beginning on January 1, 2021 and ending on and including January 1, 2030, in an amount equal to the least of (i) 9,100,000 ordinary shares, (ii) five percent (5%) of the total number of ordinary shares outstanding as of the last day of the immediately preceding calendar year on a fully diluted basis, or (iii) such number of shares determined by the Company’s board of directors. The contractual term for each award granted under the 2020 Plan will be 10 years.
A summary of share option activity under the Company’s equity incentive plans and related information is as follows:
| Options Outstanding | ||||||||||||||||
| Outstanding Share Options |
Weighted- Average Exercise Price |
Weighted- Average Remaining Contractual Life (Years) |
Aggregate Intrinsic Value |
|||||||||||||
|
|
||||||||||||||||
| (in thousands, except share, life and per share data) | ||||||||||||||||
| Balance as of December 31, 2019 |
13,201,986 | $ | 2.71 | 6.9 | $ | 163,876 | ||||||||||
| Granted |
2,908,755 | $ | 20.13 | |||||||||||||
| Exercised |
(2,091,912 | ) | $ | 1.66 | $ | 96,030 | ||||||||||
| Forfeited |
(943,340 | ) | $ | 6.13 | ||||||||||||
|
|
|
|||||||||||||||
| Balance as of December 31, 2020 |
13,075,489 | $ | 6.50 | 6.8 | $ | 736,478 | ||||||||||
|
|
|
|||||||||||||||
| Exercisable as of December 31, 2020 |
5,886,606 | $ | 1.50 | 4.9 | $ | 361,053 | ||||||||||
|
|
|
|||||||||||||||
The weighted-average grant date fair value of options granted during the years ended December 31, 2020, 2019, and 2018 was $16.05, $6.89, and $4.58, respectively. The total intrinsic value of options exercised during the years ended December 31, 2019 and 2018 was $14.0 million and $2.2 million, respectively. As of December 31, 2020, unrecognized share-based compensation cost related to unvested share options was $56.0 million, which is expected to be recognized over a weighted-average period of 3.2 years.
The Black-Scholes assumptions used to value the employee options at the grant dates are as follows:
| Year Ended December 31, | ||||||
| 2020 | 2019 | 2018 | ||||
|
| ||||||
| Expected term (years) |
6.1 – 6.5 | 6.5 | 5.0 - 6.5 | |||
| Expected volatility |
65.0% - 80.0% | 60.0% - 65.0% | 60.0% - 64.0% | |||
| Risk-free interest rate |
0.3% - 1.7% | 1.7% - 2.6% | 2.6% - 3.0% | |||
| Expected dividend yield |
0.0% | 0.0% | 0.0% | |||
These assumptions and estimates were determined as follows:
| • | Fair Value of Ordinary Shares. Prior to the IPO, the fair value was determined by the Company’s board of directors, with input from management and valuation reports prepared by third-party valuation specialists. After the IPO, the fair value of each ordinary share was based on the closing price of the Company’s publicly traded ordinary shares as reported on the date of the grant. |
| • | Risk-Free Interest Rate. The risk-free rate for the expected term of the options is based on the Black-Scholes option-pricing model on the yields of U.S. Treasury securities with maturities appropriate for the expected term of employee share option awards. |
| • | Expected Term. The expected term represents the period that options are expected to be outstanding. For option grants that are considered to be “plain vanilla,” the Company determines the expected term using the simplified method. The simplified method deems the term to be the average of the time-to-vesting and the contractual life of the options. |
110
Table of Contents
| • | Expected Volatility. As the Company has a short trading history for its ordinary shares, the expected volatility is derived from the average historical share volatilities of several unrelated public companies within the Company’s industry that the Company considers to be comparable to its own business over a period equivalent to the option’s expected term. |
| • | Expected Dividend Yield. The Company has never declared or paid any cash dividends and does not presently plan to pay cash dividends in the foreseeable future. As a result, an expected dividend yield of zero percent was used. |
Restricted Share Units
In August 2020, the Company granted an award of 667,595 RSUs to the Company’s CEO. The RSUs vest on the satisfaction of both a service-based and a performance-based condition. The RSUs shall vest and be settled in ordinary shares as follows: (i) an aggregate of 138,400 RSUs shall vest immediately prior to an IPO, and (ii) 529,195 RSUs shall vest upon the first annual anniversary of the IPO, provided, in each case, that the CEO remains continuously engaged with the Company or its Affiliates throughout each such vesting date.
A summary of RSU activity, including activity under the Company’s equity incentive plan, and related information is as follows:
| RSUs | ||||||||
| Unvested RSUs | Weighted- Grant Date Fair |
|||||||
|
|
||||||||
| Unvested as of December 31, 2019 |
— | $ | — | |||||
| Granted |
957,345 | $ | 47.01 | |||||
| Vested |
(138,400 | ) | $ | 38.90 | ||||
|
|
|
|||||||
| Unvested as of December 31, 2020 |
818,945 | $ | 48.38 | |||||
|
|
|
|||||||
The total fair value of RSUs, as of their respective vesting dates, was $6.1 million during the year ended December 31, 2020. As of December 31, 2020, unrecognized share-based compensation expense related to outstanding unvested RSUs was $33.2 million, which is expected to be recognized over a weighted-average period of 2.4 years.
Employee Share Purchase Plan
In August 2020, the Company adopted the 2020 Employee Share Purchase Plan (“ESPP”), which became effective in connection with the IPO. A total of 2,100,000 ordinary shares are available for sale under the ESPP. The number of ordinary shares available for sale under the ESPP also includes an annual increase on the first day of each fiscal year beginning with 2021, equal to the least of (i) 2,100,000 ordinary shares, (ii) one percent (1%) of the total number of ordinary shares outstanding as of the last day of the immediately preceding calendar year on a fully diluted basis, or (iii) such other amount as may be determined by the Company.
Generally, all of the Company’s employees are eligible to participate if they are employed by the Company. However, an employee may not be granted rights to purchase the Company’s ordinary shares under the ESPP if such employee (i) immediately after the grant would own capital shares or hold outstanding share options to purchase such shares possessing 5% or more of the total combined voting power or value of all classes of capital shares of the Company; or (ii) holds rights to purchase ordinary shares under all employee share purchase plans of the Company that accrue at a rate that exceeds $25,000 worth of the Company’s ordinary shares for each calendar year in which such rights are outstanding at any time.
111
Table of Contents
The Company’s ESPP permits participants to purchase the Company’s ordinary shares through contributions in the form of payroll deductions or otherwise to the extent permitted by the Company, of up to 15% of their eligible compensation (as defined in the ESPP). Amounts contributed and accumulated by the participant will be used to purchase the Company’s ordinary shares at the end of each offering period. A participant may purchase a maximum of 1,250 of the Company’s ordinary shares during an offering period. The purchase price of the shares will be 85% of the lower of the fair market value of the Company’s ordinary shares on the first trading day of the offering period or on the exercise date. Participants may end their participation at any time during an offering period and will be paid their accrued contributions that have not yet been used to purchase shares of the Company’s ordinary shares. Participation ends automatically upon termination of employment with the Company.
The Company’s ESPP provides for consecutive six-month offering periods. The offering periods are scheduled to start on the first trading day on or after March 1 and September 1 of each year, with the first offering period commencing on March 1, 2021, and will end on the last trading day of the offering period.
Third-Party Share Transactions
In May and September 2018, the Company recorded $2.1 million and $15.6 million, respectively, of share-based compensation expense associated with two secondary share purchase transactions during the year ended December 31, 2018. The secondary share purchase transactions were executed among certain of the Company’s founders, employees, consultants, and shareholders. The September 2018 secondary share purchase transaction was consummated concurrently with the issuance of the Company’s Series D convertible preferred shares. The Company assessed the impact of these transactions as holders of economic interest in the Company acquired shares from the Company’s employees and founders at a price in excess of fair value of such shares. Accordingly, the Company recognized such excess value as share-based compensation expense. In September 2018, the Company paid a special bonus of $4.2 million to Mr. Ben Haim, its Co-Founder, Chief Executive Officer and Director, to compensate him for certain tax liabilities he incurred in connection with the secondary sale.
In July 2019, the Company recorded $3.3 million of share-based compensation expense associated with a secondary share purchase transaction which was executed among certain of the Company’s employees, consultants, and shareholders. The Company assessed the impact of this transaction as holders of economic interest in the Company acquired shares from the Company’s employees at a price in excess of fair value of such shares. Accordingly, the Company recognized such excess value as share-based compensation expense.
Share-Based Compensation
The share-based compensation expense by line item in the accompanying Consolidated Statements of Operations is summarized as follows:
| Year Ended December 31, | ||||||||||||
| 2020 | 2019 | 2018 | ||||||||||
|
|
|
|||||||||||
| (in thousands) | ||||||||||||
| Cost of revenue: subscription–self-managed and SaaS |
$ | 1,129 | $ | 536 | $ | 358 | ||||||
| Research and development |
3,903 | 3,642 | 9,876 | |||||||||
| Sales and marketing |
4,882 | 3,089 | 6,650 | |||||||||
| General and administrative |
13,938 | 2,103 | 3,283 | |||||||||
|
|
|
|
|
|
|
|||||||
| Total share-based compensation expense |
$ | 23,852 | $ | 9,370 | $ | 20,167 | ||||||
|
|
|
|
|
|
|
|||||||
112
Table of Contents
| 12. | Accumulated Other Comprehensive Income |
The following table summarizes the changes in accumulated other comprehensive income by component, net of tax, during the periods presented:
| Net Unrealized Gains (losses) on Available-for-Sale Marketable Securities |
Net Unrealized Gains on Derivatives Designated as Hedging Instruments |
Total | ||||||||||
| (in thousands) | ||||||||||||
| Balance as of December 31, 2018 |
$ | — | $ | — | $ | — | ||||||
| Other comprehensive income before reclassifications |
38 | — | 38 | |||||||||
| Net realized gains reclassified from accumulated other comprehensive income |
(3 | ) | — | (3 | ) | |||||||
|
|
|
|
|
|
|
|||||||
| Other comprehensive income |
35 | — | 35 | |||||||||
|
|
|
|
|
|
|
|||||||
| Balance as of December 31, 2019 |
35 | — | 35 | |||||||||
|
|
|
|
|
|
|
|||||||
| Other comprehensive income (loss) before reclassifications |
(115 | ) | 1,239 | 1,124 | ||||||||
| Net realized losses (gain) reclassified from accumulated other comprehensive income |
11 | (798 | ) | (787 | ) | |||||||
|
|
|
|
|
|
|
|||||||
| Other comprehensive income (loss) |
(104 | ) | 441 | 337 | ||||||||
|
|
|
|
|
|
|
|||||||
| Balance as of December 31, 2020 |
$ | (69 | ) | $ | 441 | $ | 372 | |||||
|
|
|
|
|
|
|
|||||||
| 13. | Income Taxes |
Ordinary taxable income in Israel is subject to a corporate tax rate of 23%.
The Company applies various benefits allotted to it under the revised Investment Law as per Amendment 73, which includes a number of changes to the Investment Law regimes through regulations that have come into effect from January 1, 2017. Applicable benefits under the new regime include:
| • | Introduction of a benefit regime for “Preferred Technology Enterprises” (“PTE”), granting a 12% tax rate in central Israel on income deriving from Benefited Intangible Assets, subject to a number of conditions being fulfilled, including a minimal amount or ratio of annual R&D expenditure and R&D employees, as well as having at least 25% of annual income derived from exports to large markets. PTE is defined as an enterprise which meets the aforementioned conditions and for which total consolidated revenues of its parent company and all subsidiaries are less than NIS 10 billion. |
| • | A 12% capital gains tax rate on the sale of a preferred intangible asset to a foreign affiliated enterprise, provided that the asset was initially purchased from a foreign resident at an amount of NIS 200 million or more. |
| • | A withholding tax rate of 20% for dividends paid from PTE income (with an exemption from such withholding tax applying to dividends paid to an Israeli company) may be reduced to 4% on dividends paid to a foreign resident company, subject to certain conditions regarding percentage of foreign ownership of the distributing entity. |
The Company adopted the PTE status since 2017 and believes it is eligible for its tax benefits.
113
Table of Contents
The Company’s subsidiaries are separately taxed under the domestic tax laws of the jurisdiction of incorporation of each entity.
The components of the net loss before income taxes were as follows:
| Year Ended December 31, | ||||||||||||
| 2020 | 2019 | 2018 | ||||||||||
|
|
|
|||||||||||
| (in thousands) | ||||||||||||
| Israel |
$ | 2,949 | $ | (6,380 | ) | $ | (26,883 | ) | ||||
| Foreign |
(15,096 | ) | 2,614 | 1,338 | ||||||||
|
|
|
|
|
|
|
|||||||
| Total |
$ | (12,147 | ) | $ | (3,766 | ) | $ | (25,545 | ) | |||
|
|
|
|
|
|
|
|||||||
Income tax expense (benefit) was as follows:
| Year Ended December 31, | ||||||||||||
| 2020 | 2019 | 2018 | ||||||||||
|
|
|
|||||||||||
| (in thousands) | ||||||||||||
| Current: |
||||||||||||
| Israel |
$ | 369 | $ | — | $ | — | ||||||
| Foreign |
(3,695 | ) | 1,522 | 1,356 | ||||||||
|
|
|
|
|
|
|
|||||||
| Total current income tax expense (benefit) |
(3,326 | ) | 1,522 | 1,356 | ||||||||
|
|
|
|
|
|
|
|||||||
| Deferred: |
||||||||||||
| Israel |
— | — | — | |||||||||
| Foreign |
584 | 106 | (886 | ) | ||||||||
|
|
|
|
|
|
|
|||||||
| Total deferred income tax expense (benefit) |
584 | 106 | (886 | ) | ||||||||
|
|
|
|
|
|
|
|||||||
| Income tax expense (benefit) |
$ | (2,742 | ) | $ | 1,628 | $ | 470 | |||||
|
|
|
|
|
|
|
|||||||
A reconciliation of the Company’s statutory income tax rate to effective income tax rate is as follows:
| Year Ended December 31, | ||||||||||||
| 2020 | 2019 | 2018 | ||||||||||
|
|
||||||||||||
| Theoretical income tax benefit |
23 | % | 23 | % | 23 | % | ||||||
| PTE |
2 | (15 | ) | (11 | ) | |||||||
| Foreign tax rate differentials |
12 | 2 | 1 | |||||||||
| Share-based compensation |
(6 | ) | (26 | ) | (9 | ) | ||||||
| Change in valuation allowance |
4 | (3 | ) | (5 | ) | |||||||
| Unrecognized tax benefits |
(15 | ) | (7 | ) | (0 | ) | ||||||
| Acquisition costs |
(4 | ) | (11 | ) | — | |||||||
| Other |
7 | (6 | ) | (1 | ) | |||||||
|
|
|
|
|
|
|
|||||||
| Total |
23 | % | (43 | )% | (2 | )% | ||||||
|
|
|
|
|
|
|
|||||||
Deferred income taxes reflect the net tax effects of temporary differences between the carrying amounts of assets and liabilities for financial reporting purposes and the amounts used for income tax purposes.
114
Table of Contents
The following table presents the significant components of the Company’s deferred tax assets and liabilities:
| December 31, | ||||||||
| 2020 | 2019 | |||||||
|
|
|
|||||||
| (in thousands) | ||||||||
| Deferred tax assets: |
||||||||
| Net operating loss carryforwards |
$ | 5,221 | $ | 3,955 | ||||
| Research and development expenses |
1,464 | 1,412 | ||||||
| Accruals and reserves |
412 | 625 | ||||||
| Share-based compensation |
1,130 | 287 | ||||||
| Deferred revenue |
1,403 | 3,007 | ||||||
| Issuance costs |
2,810 | — | ||||||
| Property and equipment |
14 | — | ||||||
|
|
|
|
|
|||||
| Gross deferred tax assets |
12,454 | 9,286 | ||||||
| Valuation allowance |
(7,854 | ) | (4,533 | ) | ||||
|
|
|
|
|
|||||
| Total deferred tax assets |
4,600 | 4,753 | ||||||
|
|
|
|
|
|||||
| Deferred tax liabilities: |
||||||||
| Intangible assets |
(211 | ) | (242 | ) | ||||
| Deferred contract acquisition costs |
(1,581 | ) | (1,067 | ) | ||||
| Property and equipment |
— | (52 | ) | |||||
|
|
|
|
|
|||||
| Gross deferred tax liabilities |
(1,792 | ) | (1,361 | ) | ||||
|
|
|
|
|
|||||
| Net deferred taxes |
$ | 2,808 | $ | 3,392 | ||||
|
|
|
|
|
|||||
A valuation allowance is provided when it is more likely than not that the deferred tax assets will not be realized. The Company has established a valuation allowance to offset certain deferred tax assets at December 31, 2020 and 2019 due to the uncertainty of realizing future tax benefits from its net operating loss carryforwards and other deferred tax assets. The net change in the total valuation allowance for the years ended December 31, 2020, 2019, and 2018 was an increase of $3.3 million, $0.1 million and $1.2 million, respectively.
As of December 31, 2020, the Company had $18.0 million in net operating loss carryforwards in Israel, which can be carried forward indefinitely.
As of December 31, 2020, the U.S. subsidiary had $8.0 million of federal and $22.5 million of state net operating loss carryforwards available to offset future taxable income. If not utilized, federal and the state net operating loss carryforwards will expire in varying amounts between the years ended 2034 and 2036. The 2017 Tax Cuts and Jobs Act (“TCJA”) limited the use of federal net operating loss carryforwards to 80% of taxable income in any one tax period and provided an unlimited carryforward period for those NOLs, applicable to net operating loss carryforwards generated in years beginning after December 31, 2017. However, as a result of the Coronavirus Aid, Relief, and Economic Security Act (“CARES Act”), corporate taxpayers may now use federal net operating loss carryforwards to fully offset taxable income in the 2018, 2019, and 2020 tax years. Furthermore, as part of the CARES Act, the US subsidiary was able to carryback losses generated the year ended on December 31, 2020 to offset taxable income for the prior five years.
The U.S. subsidiary’s utilization of its federal net operating losses is subject to an annual limitation due to a “change in ownership,” as defined in Section 382 of the Code. The annual limitation may result in the expiration of net operating losses before utilization.
As of December 31, 2020, certain foreign subsidiaries of the Company had undistributed earnings, which were designated as indefinitely reinvested. If these earnings were re-patriated to Israel, it would be subject
115
Table of Contents
to income taxes and to an adjustment for foreign tax credits and foreign withholding taxes. Determination of the amount of unrecognized deferred tax liability related to these earnings is not practicable.
A reconciliation of the beginning and ending balance of total unrecognized tax positions is as follows:
| Unrecognized Tax Benefits |
||||
| (in thousands) | ||||
| Balance – January 1, 2018 |
$ | 525 | ||
| Increases related to current years’ tax positions |
6 | |||
|
|
|
|||
| Balance – December 31, 2018 |
531 | |||
| Increases related to prior years’ tax positions |
69 | |||
| Increases related to current years’ tax positions |
293 | |||
| Decreases due to lapses of statutes of limitations |
(91 | ) | ||
|
|
|
|||
| Balance – December 31, 2019 |
802 | |||
| Increases related to prior years’ tax positions |
637 | |||
| Increases related to current years’ tax positions |
1,368 | |||
| Decreases due to lapses of statutes of limitations |
(69 | ) | ||
|
|
|
|||
| Balance – December 31, 2020 |
$ | 2,738 | ||
|
|
|
|||
As of December 31, 2020, the total amount of gross unrecognized tax benefits was $2.7 million, of which $1.9 million, if recognized, would favorably impact the Company’s effective tax rate. The remaining amount would be offset by the reversal of related deferred tax assets which are subject to a full valuation allowance.
The Company recognizes interest and penalties related to uncertain tax positions in income tax expense. As of December 31, 2020 and 2019, the Company has accumulated $0.1 million in both interest and penalties related to uncertain tax positions.
The Company has net operating losses from prior tax periods which may be subjected to examination in future periods. As of December 31, 2020, the Company’s tax years until December 31, 2014 are subject to the statute of limitation in Israel. As of that date, the U.S. subsidiary’s federal and state tax years until December 31, 2016 are subject to the statute of limitations. In addition, the U.S. federal tax returns were settled through 2018 except for any adjustments which might be made as a result of the carryback of net operating losses As of December 31, 2020, the Company is under examination of its income tax returns by the Israeli Tax Authorities for the years from 2015 through 2018. The Company does not believe the resolution of the examination will have a material impact on the Company’s consolidated financial statements. The Company currently does not expect uncertain tax positions to change significantly over the next 12 months, except in the case of settlements with tax authorities, the likelihood and timing of which is difficult to estimate.
| 14. | Employee Benefit Plans |
The Company has a defined-contribution plan in the U.S. intended to qualify under Section 401 of the Internal Revenue Code (the “401(k) Plan”). The 401(k) Plan covers substantially all employees who meet minimum age and service requirements and allows participants to defer a portion of their annual compensation on a pre-tax basis. Prior to January 1, 2020, the Company matched 100% of participating employee contributions to the plan up to 3% of the employee’s eligible compensation. Beginning January 1, 2020, the Company matches 50% of participating employee contributions to the plan up to 6% of the employee’s eligible compensation. During the years ended December 31, 2020, 2019, and 2018, the Company recorded $0.8 million, $0.6 million and $0.3 million, respectively, of expenses related to the 401(k) plan.
116
Table of Contents
Israeli Severance Pay
Pursuant to Israel’s Severance Pay Law, Israeli employees are entitled to severance pay equal to one month’s salary for each year of employment, or a portion thereof. The Company has elected to include its employees in Israel under Section 14 of the Severance Pay Law, under which these employees are entitled only to monthly deposits made in their name with insurance companies, at a rate of 8.33% of their monthly salary. These payments release the Company from any future obligation under the Israeli Severance Pay Law to make severance payments in respect of those employees; therefore, any liability for severance pay due to these employees, and the deposits under Section 14 are not recorded as an asset in the Consolidated Balance Sheets. During the years ended December 31, 2020, 2019, and 2018, the Company recorded $2.2 million, $1.6 million, and $1.1 million, respectively, in severance expenses related to these employees.
| 15. | Net Loss Per Share Attributable to Ordinary Shareholders |
The following table sets forth the computation of basic and diluted net loss per share attributable to ordinary shareholders for the periods presented:
| Year Ended December 31, | ||||||||||||
| 2020 | 2019 | 2018 | ||||||||||
|
|
|
|||||||||||
| (in thousands, except share and per share data) | ||||||||||||
| Numerator: |
||||||||||||
| Net loss |
$ | (9,405 | ) | $ | (5,394 | ) | $ | (26,015 | ) | |||
|
|
|
|
|
|
|
|||||||
| Denominator: |
||||||||||||
| Weighted-average shares used in computing net loss per share attributable to ordinary shareholders, basic and diluted |
46,488,225 | 27,130,209 | 26,102,551 | |||||||||
|
|
|
|
|
|
|
|||||||
| Net loss per share attributable to ordinary shareholders, basic and diluted |
$ | (0.20 | ) | $ | (0.20 | ) | $ | (1.00 | ) | |||
|
|
|
|
|
|
|
|||||||
The potential shares of ordinary shares that were excluded from the computation of diluted net loss per share attributable to ordinary shareholders for the periods presented because including them would have been anti-dilutive are as follows:
| Year Ended December 31, | ||||||||||||
| 2020 | 2019 | 2018 | ||||||||||
|
|
|
|||||||||||
| Convertible preferred shares |
37,127,355 | 52,063,647 | 45,180,440 | |||||||||
| Outstanding share options |
13,650,862 | 13,146,117 | 11,714,028 | |||||||||
| Unvested RSUs |
209,090 | — | — | |||||||||
| Issuable ordinary shares related to business combination |
199,498 | 259,125 | — | |||||||||
|
|
|
|
|
|
|
|||||||
| Total |
51,186,805 | 65,468,889 | 56,894,468 | |||||||||
|
|
|
|
|
|
|
|||||||
| 16. | Related Party Transactions |
For a description of related party transactions, see Note 11, Convertible Preferred Shares, Shareholders’ Equity (Deficit) and Equity Incentive Plans—Third-Party Share Transactions.
Item 9. Changes in and Disagreements with Accountants on Accounting and Financial Disclosure
None.
117
Table of Contents
Item 9A. Controls and Procedures
Evaluation of Disclosure Controls and Procedures
Our disclosure controls and procedures are designed to ensure that information we are required to disclose in reports that we file or submit under the Exchange Act is recorded, processed, summarized, and reported within the time periods specified in SEC rules and forms, and that such information is accumulated and communicated to our management, including our Chief Executive Officer and Chief Financial Officer, as appropriate, to allow timely decisions regarding required disclosure.
Our management, with the participation and supervision of our Chief Executive Officer and our Chief Financial Officer, have evaluated the effectiveness of our disclosure controls and procedures (as defined in Rules 13a-15(e) and 15d-15(e) under the Exchange Act) as of the end of the period covered by this Annual Report on Form 10-K. Based on such evaluation, our Chief Executive Officer and Chief Financial Officer have concluded that as of such date, our disclosure controls and procedures were, in design and operation, effective at a reasonable assurance level.
Management’s Report on Internal Control over Financial Reporting
This Annual Report on Form 10-K does not include a report of management’s assessment regarding internal control over financial reporting or an attestation report of our independent registered public accounting firm as permitted in this transition period under the rules of the SEC for newly public companies.
Changes in Internal Controls Over Financial Reporting
There were no changes in our internal control over financial reporting identified in connection with the evaluation required by Rule 13a-15(d) and 15d-15(d) of the Exchange Act that occurred during the period covered by this Annual Report on Form 10-K that have materially affected, or are reasonably likely to materially affect, our internal control over financial reporting.
Inherent Limitations on the Effectiveness of Controls
The effectiveness of any system of internal control over financial reporting, including ours, is subject to inherent limitations, including the exercise of judgment in designing, implementing, operating, and evaluating the controls and procedures, and the inability to eliminate misconduct completely. Accordingly, in designing and evaluating the disclosure controls and procedures, management recognizes that any system of internal control over financial reporting, including ours, no matter how well designed and operated, can only provide reasonable, not absolute, assurance of achieving the desired control objectives. In addition, the design of disclosure controls and procedures must reflect the fact that there are resource constraints and that management is required to apply its judgment in evaluating the benefits of possible controls and procedures relative to their costs. Moreover, projections of any evaluation of effectiveness to future periods are subject to the risk that controls may become inadequate because of changes in conditions, or that the degree of compliance with the policies or procedures may deteriorate. We intend to continue to monitor and upgrade our internal controls as necessary or appropriate for our business but cannot assure you that such improvements will be sufficient to provide us with effective internal control over financial reporting.
None.
118
Table of Contents
PART III
Item 10. Directors, Executive Officers and Corporate Governance
The information required by this item will be set forth in our definitive proxy statement to be filed with the Securities and Exchange Commission not later than 120 days after the end of our fiscal year ended December 31, 2020 in connection with our 2021 annual meeting of shareholders (the Proxy Statement), and is incorporated herein by reference.
Code of Conduct
Our Board of Directors has adopted a Code of Business Conduct and Ethics that applies to all officers, directors, and employees, which is available on our website at https://investors.jfrog.com/ under “Governance.” We intend to satisfy the disclosure requirement under Item 5.05 of Form 8-K regarding amendments to, or waiver from, a provision of our Code of Business Conduct and Ethics by posting such information on the website address and location specified above.
Item 11. Executive Compensation
The information required by this item will be set forth in the Proxy Statement and is incorporated herein by reference.
Item 12. Security Ownership of Certain Beneficial Owners and Management and Related Shareholder Matters
The information required by this item will be set forth in the Proxy Statement and is incorporated herein by reference.
Item 13. Certain Relationships and Related Transactions, and Director Independence
The information required by this item will be set forth in the Proxy Statement and is incorporated herein by reference.
Item 14. Principal Accounting Fees and Services
The information required by this item will be set forth in the Proxy Statement and is incorporated herein by reference.
PART IV
Item 15. Exhibits and Financial Statement Schedules
(a) The following documents are filed as part of this report:
| 1. | Financial Statements |
See Index to Consolidated Financial Statements in Item 8 herein.
| 2. | Financial Statement Schedules |
Schedules not listed above have been omitted because they are not required, not applicable, or the required information is otherwise included.
| 3. | Exhibits |
The exhibits listed below are filed as part of this Annual Report on Form 10-K or are incorporated herein by reference, in each case as indicated below.
119
Table of Contents
EXHIBIT INDEX
120
Table of Contents
| 101 INS | XBRL Instance Document | |
| 101 SCH | XBRL Taxonomy Extension Schema Document. | |
| 101 CAL | XBRL Taxonomy Extension Calculation Linkbase Document. | |
| 101 DEF | Taxonomy Extension Definition Linkbase Document. | |
| 101 LAB | XBRL Taxonomy Extension Label Linkbase Document. | |
| 101 PRE | XBRL Taxonomy Extension Presentation Linkbase Document. |
+ Indicates management contract or compensatory plan.
* The certifications furnished in Exhibits 32.1 and 32.2 hereto are deemed to accompany this Annual Report on Form 10-K and will not be deemed “filed” for purposes of Section 18 or the Securities Exchange Act of 1934, as amended, except to the extent that the registrant specifically incorporates it by reference.
None.
121
Table of Contents
SIGNATURES
Pursuant to the requirements of the Securities Exchange Act of 1934, the registrant has duly caused this report to be signed on its behalf by the undersigned thereunto duly authorized.
| Date: February 12, 2021 | By: | /s/ Shlomi Ben Haim | ||||
| Name: Shlomi Ben Haim | ||||||
| Title: Chief Executive Officer | ||||||
| (Principal Executive Officer) |
POWER OF ATTORNEY
Know all persons by these presents, that each person who signature appears below constitutes and appoints Shlomi Ben Haim and Jacob Shulman, and each of them, as his or her true and lawful attorney in fact and agents, with full power of substitution and resubstituting, for him or her and in his or her name, place and stead, in any and all capacities, to sign any and all amendments to this Annual Report on Form 10-K, and to file the same, with all exhibits thereto, and other documents in connection therewith, with the Securities and Exchange Commission, granting unto said attorneys-in-fact and agents, and each of them, full power and authority to do and perform each and every act and thing requisite and necessary to be done in connection therewith, as fully to all intents and purposes as he or she might or could do in person, hereby ratifying and confirming that all said attorneys-in-fact and agents, or any of them or their or his or her substitute or substitutes, may lawfully do or cause to be done by virtue hereof.
Pursuant to the requirements of the Securities Act of 1934, as amended, this Annual Report on Form 10-K has been signed by the following persons on behalf of the Registrant and in the capacities and on the dates indicated.
| Signature |
Title |
Date | ||
| /s/ Shlomi Ben Haim Shlomi Ben Haim |
Chief Executive Officer and Director (Principal Executive Officer) |
February 12, 2021 | ||
| /s/ Jacob Shulman Jacob Shulman |
Chief Financial Officer (Principal Financial and Principal Accounting Officer) |
February 12, 2021 | ||
| /s/ Yoav Landman Yoav Landman |
Director |
February 12, 2021 | ||
| /s/ Jeff Horing Jeff Horing |
Director |
February 12, 2021 | ||
| /s/ Yossi Sela Yossi Sela |
Director |
February 12, 2021 | ||
| /s/ Jessica Neal Jessica Neal |
Director |
February 12, 2021 | ||
| /s/ Frederic Simon Frederic Simon |
Director |
February 12, 2021 | ||
| /s/ Elisa Steele Elisa Steele |
Director |
February 12, 2021 | ||
| /s/ Andy Vitus Andy Vitus |
Director |
February 12, 2021 | ||
| /s/ Barry Zwarenstein Barry Zwarenstein |
Director |
February 12, 2021 | ||
122
Table of Contents
AUTHORIZED REPRESENTATIVE IN THE UNITED STATES
Pursuant to the requirements of the Securities Act of 1934, this registration statement has been signed by the undersigned as the duly authorized representative in the United States of the Registrant in Sunnyvale, California, on February 12, 2021.
| JFrog, Inc. | ||
| By: | /s/ Shlomi Ben Haim | |
| Shlomi Ben Haim | ||
| Chief Executive Officer and Secretary | ||
123