Attached files
| file | filename |
|---|---|
| EX-99.1 - EX-99.1 - VEECO INSTRUMENTS INC | veco-20210211xex99d1.htm |
| 8-K - 8-K - VEECO INSTRUMENTS INC | veco-20210211x8k.htm |
Exhibit 99.2
| Veeco (Nasdaq: VECO) February 11, 2021 Q4 2020 Financial Results Conference Call |

| Q4 2020 Financial Results Conference Call | All Rights Reserved. ©2021 Safe Harbor 2 This presentation contains “forward-looking statements”, within the meaning of the safe harbor provisions of the U.S. Private Securities Litigation Reform Act of 1995, as amended, that are based on management’s expectations, estimates, projections and assumptions. Words such as “expects,” “anticipates,” “plans,” “believes,” “scheduled,” “estimates” and variations of these words and similar expressions are intended to identify forward-looking statements. Forward-looking statements include, but are not limited to, those regarding anticipated growth and trends in our businesses and markets, industry outlooks and demand drivers, our investment and growth strategies, our development of new products and technologies, our business outlook for current and future periods, the impact of the COVID-19 pandemic, our ongoing transformation initiative and the effects thereof on our operations and financial results; and other statements that are not historical facts. These statements and their underlying assumptions are subject to risks and uncertainties and are not guarantees of future performance. Factors that could cause actual results to differ materially from those expressed or implied by such statements include, without limitation: the level of demand for our products; global economic and industry conditions; the effects of regional or global health epidemics, including the effects of the COVID-19 pandemic on the Company’s operations and on those of our customers and suppliers; global trade issues, including the ongoing trade disputes between the U.S. and China, and changes in trade and export license policies; our dependency on third-party suppliers and outsourcing partners; the timing of customer orders; our ability to develop, deliver and support new products and technologies; our ability to expand our current markets, increase market share and develop new markets; the concentrated nature of our customer base; our ability to obtain and protect intellectual property rights in key technologies; our ability to achieve the objectives of operational and strategic initiatives and attract, motivate and retain key employees; the variability of results among products and end-markets, and our ability to accurately forecast future results, market conditions, and customer requirements; the impact of our indebtedness, including our convertible senior notes and our capped call transactions; and other risks and uncertainties described in our SEC filings on Forms 10-K, 10-Q and 8-K, and from time-to-time in our other SEC reports. All forward-looking statements speak only to management’s expectations, estimates, projections and assumptions as of the date of this presentation. The Company does not undertake any obligation to update or publicly revise any forward-looking statements to reflect events, circumstances or changes in expectations after the date of this presentation. |

| CEO Overview William J. Miller, Ph.D. |

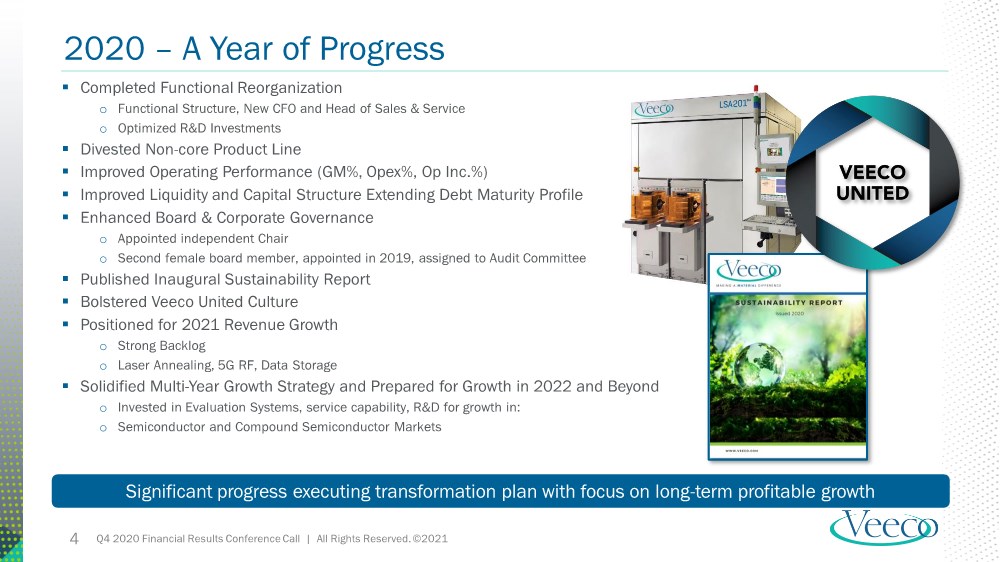
| Q4 2020 Financial Results Conference Call | All Rights Reserved. ©2021 2020 – A Year of Progress 4 ▪ Completed Functional Reorganization o Functional Structure, New CFO and Head of Sales & Service o Optimized R&D Investments ▪ Divested Non-core Product Line ▪ Improved Operating Performance (GM%, Opex%, Op Inc.%) ▪ Improved Liquidity and Capital Structure Extending Debt Maturity Profile ▪ Enhanced Board & Corporate Governance o Appointed independent Chair o Second female board member, appointed in 2019, assigned to Audit Committee ▪ Published Inaugural Sustainability Report ▪ Bolstered Veeco United Culture ▪ Positioned for 2021 Revenue Growth o Strong Backlog o Laser Annealing, 5G RF, Data Storage ▪ Solidified Multi-Year Growth Strategy and Prepared for Growth in 2022 and Beyond o Invested in Evaluation Systems, service capability, R&D for growth in: o Semiconductor and Compound Semiconductor Markets Significant progress executing transformation plan with focus on long-term profitable growth |
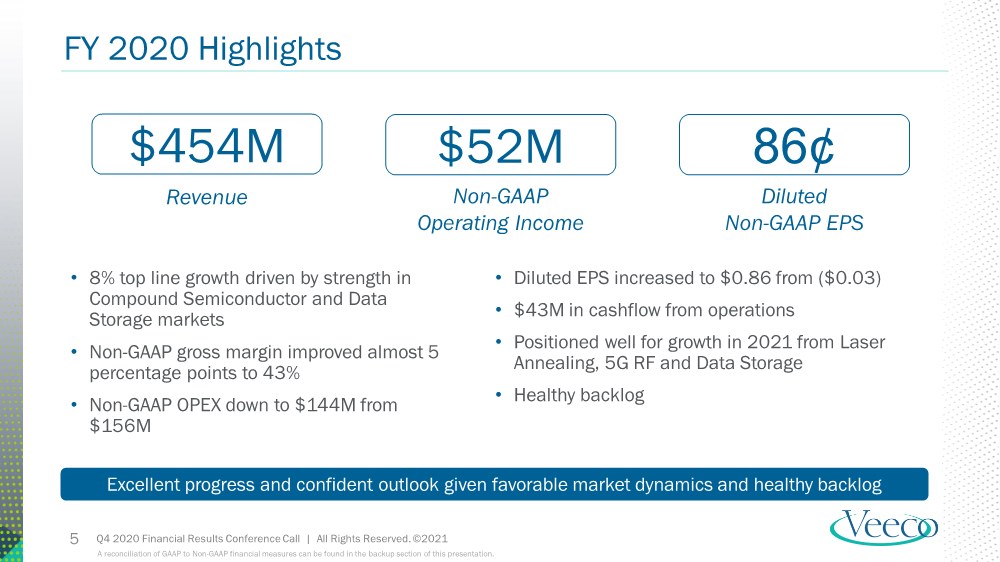
| Q4 2020 Financial Results Conference Call | All Rights Reserved. ©2021 • 8% top line growth driven by strength in Compound Semiconductor and Data Storage markets • Non-GAAP gross margin improved almost 5 percentage points to 43% • Non-GAAP OPEX down to $144M from $156M • Diluted EPS increased to $0.86 from ($0.03) • $43M in cashflow from operations • Positioned well for growth in 2021 from Laser Annealing, 5G RF and Data Storage • Healthy backlog Excellent progress and confident outlook given favorable market dynamics and healthy backlog 5 FY 2020 Highlights Revenue Non-GAAP Operating Income Diluted Non-GAAP EPS $454M $52M 86¢ A reconciliation of GAAP to Non-GAAP financial measures can be found in the backup section of this presentation. |
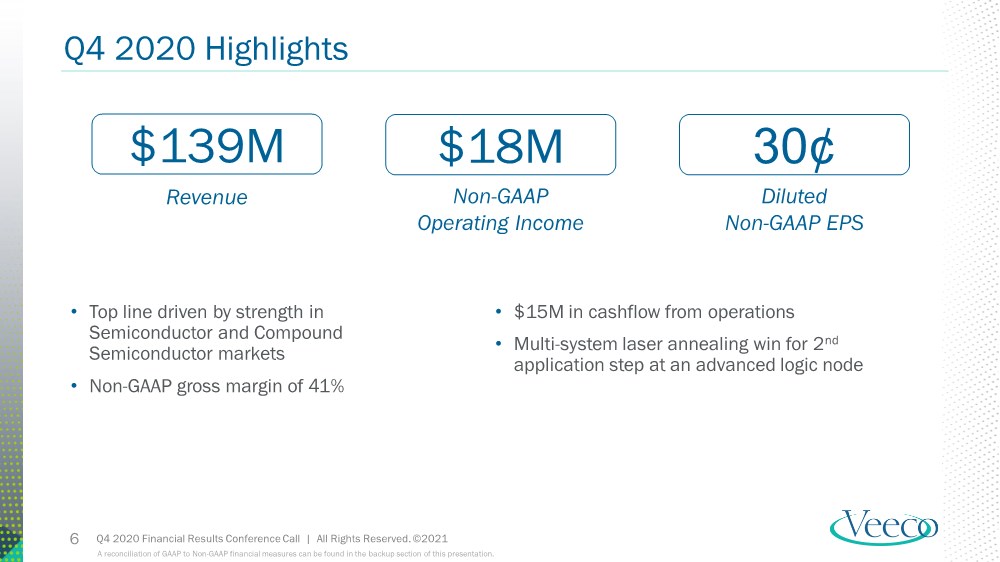
| Q4 2020 Financial Results Conference Call | All Rights Reserved. ©2021 • Top line driven by strength in Semiconductor and Compound Semiconductor markets • Non-GAAP gross margin of 41% • $15M in cashflow from operations • Multi-system laser annealing win for 2nd application step at an advanced logic node 6 Q4 2020 Highlights Revenue Non-GAAP Operating Income Diluted Non-GAAP EPS $139M $18M 30¢ A reconciliation of GAAP to Non-GAAP financial measures can be found in the backup section of this presentation. |
| CFO Financial Review John P. Kiernan |

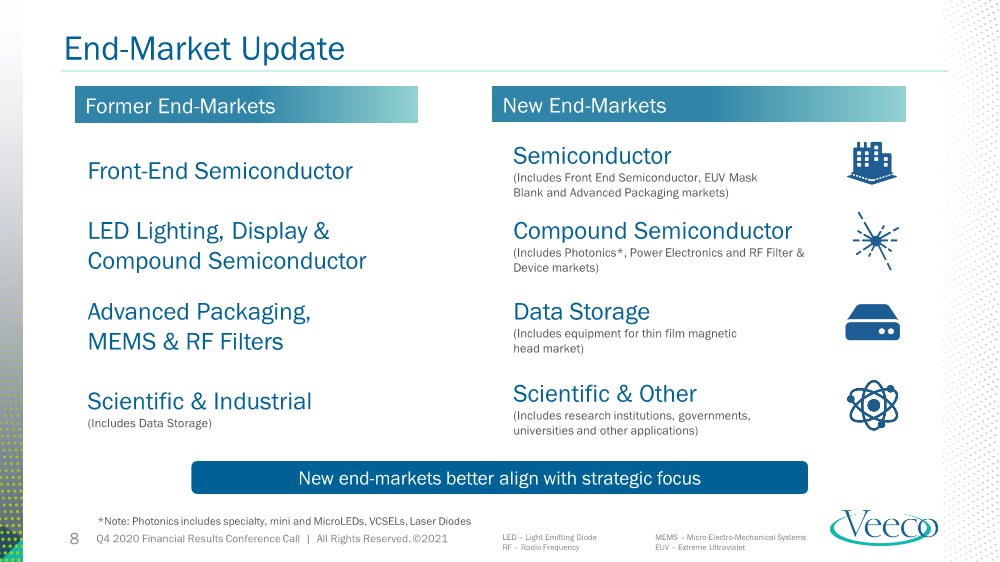
| Q4 2020 Financial Results Conference Call | All Rights Reserved. ©2021 8 End-Market Update Front-End Semiconductor Scientific & Industrial (Includes Data Storage) LED Lighting, Display & Compound Semiconductor Advanced Packaging, MEMS & RF Filters Semiconductor (Includes Front End Semiconductor, EUV Mask Blank and Advanced Packaging markets) Scientific & Other (Includes research institutions, governments, universities and other applications) Compound Semiconductor (Includes Photonics*, Power Electronics and RF Filter & Device markets) Data Storage (Includes equipment for thin film magnetic head market) New End-Markets Former End-Markets New end-markets better align with strategic focus *Note: Photonics includes specialty, mini and MicroLEDs, VCSELs, Laser Diodes LED – Light Emitting Diode RF – Radio Frequency MEMS – Micro-Electro-Mechanical Systems EUV – Extreme Ultraviolet |
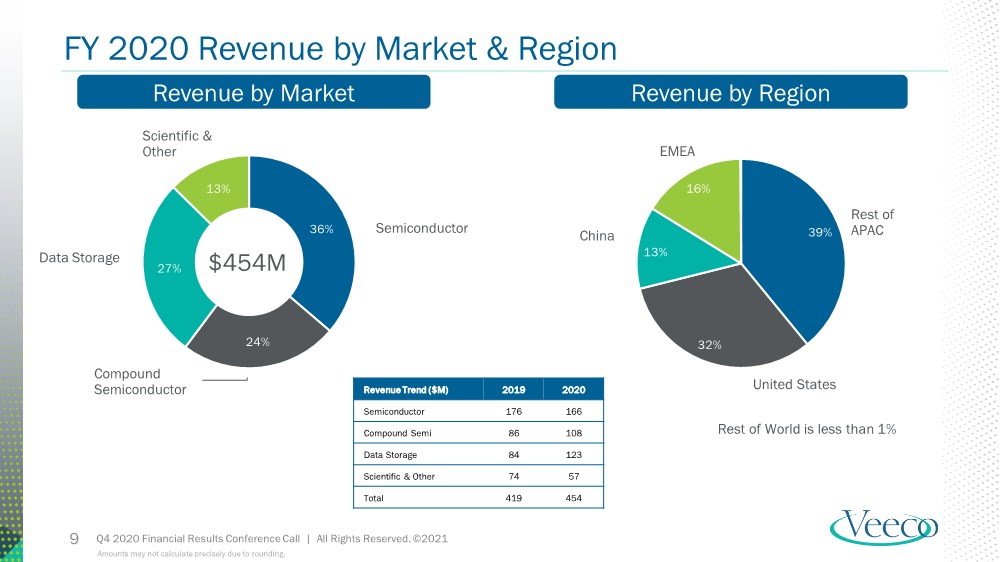
| Q4 2020 Financial Results Conference Call | All Rights Reserved. ©2021 9 FY 2020 Revenue by Market & Region 36% 24% 27% 13% Revenue by Market Revenue by Region Scientific & Other Semiconductor Compound Semiconductor Data Storage 39% 32% 13% 16% EMEA China United States Rest of APAC $454M Rest of World is less than 1% Amounts may not calculate precisely due to rounding. Revenue Trend ($M) 2019 2020 Semiconductor 176 166 Compound Semi 86 108 Data Storage 84 123 Scientific & Other 74 57 Total 419 454 |
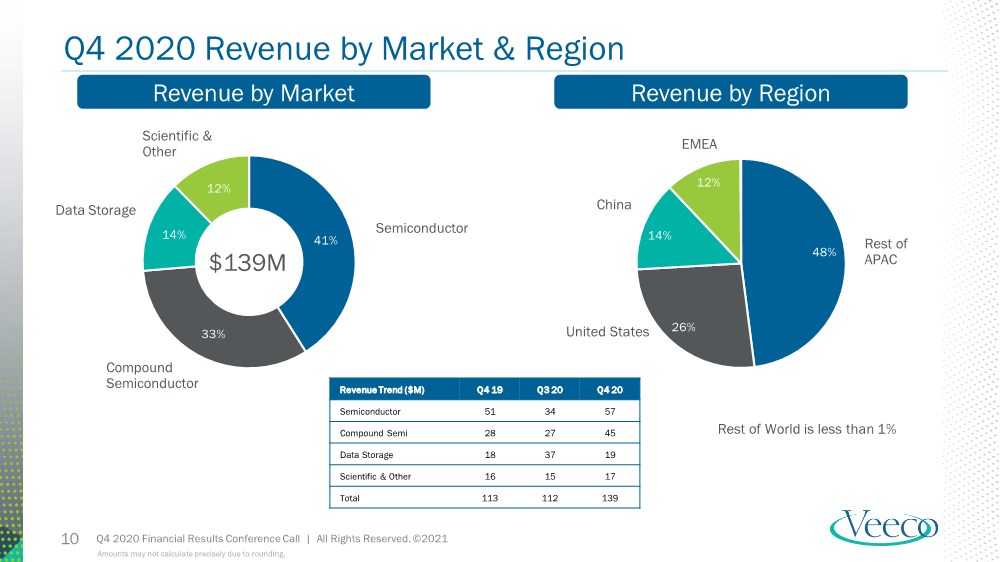
| Q4 2020 Financial Results Conference Call | All Rights Reserved. ©2021 10 Q4 2020 Revenue by Market & Region 41% 33% 14% 12% Revenue by Market Revenue by Region Scientific & Other Semiconductor Compound Semiconductor Data Storage 48% 26% 14% 12% EMEA China United States Rest of APAC $139M Amounts may not calculate precisely due to rounding. Revenue Trend ($M) Q4 19 Q3 20 Q4 20 Semiconductor 51 34 57 Compound Semi 28 27 45 Data Storage 18 37 19 Scientific & Other 16 15 17 Total 113 112 139 Rest of World is less than 1% |
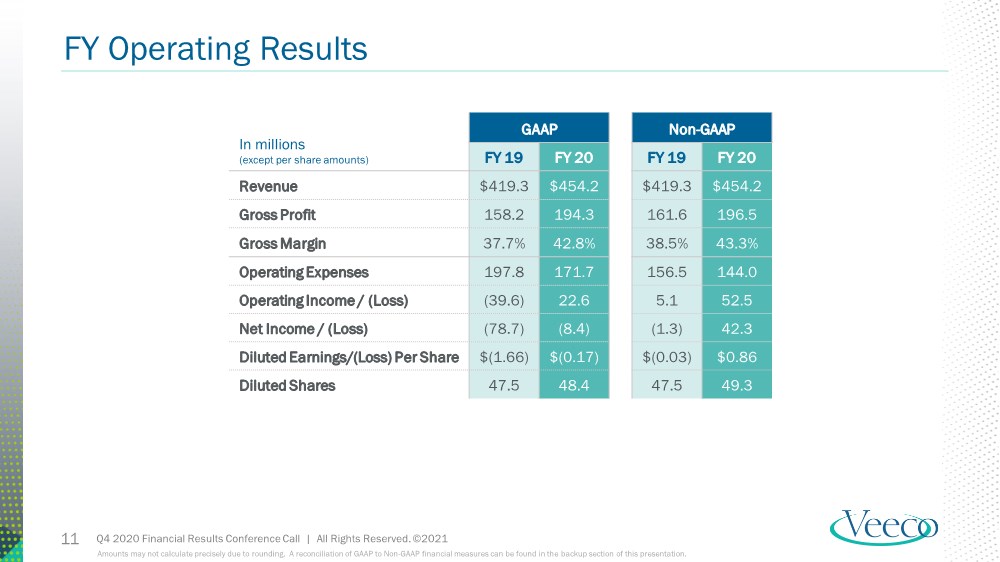
| Q4 2020 Financial Results Conference Call | All Rights Reserved. ©2021 FY Operating Results 11 In millions (except per share amounts) GAAP Non-GAAP FY 19 FY 20 FY 19 FY 20 Revenue $419.3 $454.2 $419.3 $454.2 Gross Profit 158.2 194.3 161.6 196.5 Gross Margin 37.7% 42.8% 38.5% 43.3% Operating Expenses 197.8 171.7 156.5 144.0 Operating Income / (Loss) (39.6) 22.6 5.1 52.5 Net Income / (Loss) (78.7) (8.4) (1.3) 42.3 Diluted Earnings/(Loss) Per Share $(1.66) $(0.17) $(0.03) $0.86 Diluted Shares 47.5 48.4 47.5 49.3 Amounts may not calculate precisely due to rounding. A reconciliation of GAAP to Non-GAAP financial measures can be found in the backup section of this presentation. |
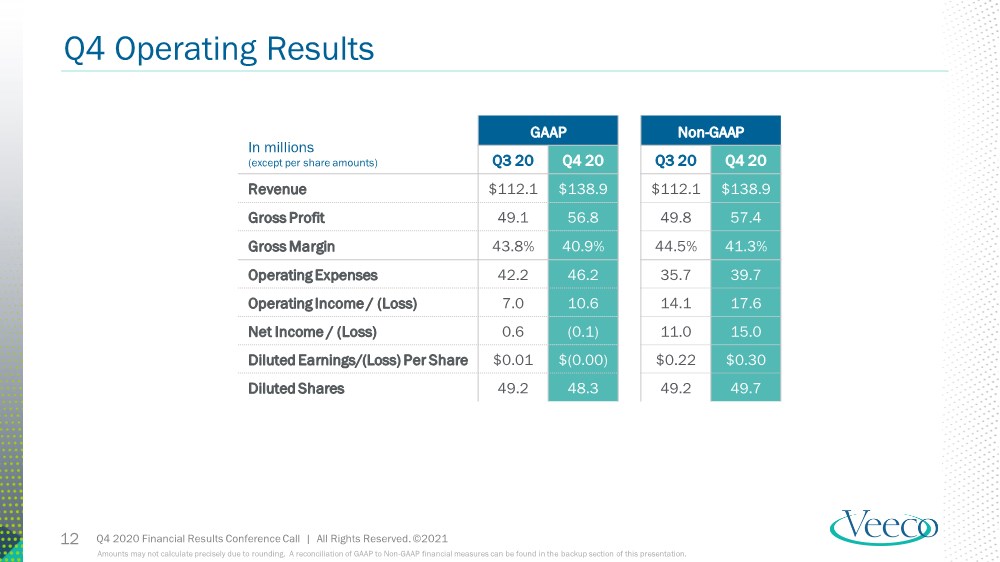
| Q4 2020 Financial Results Conference Call | All Rights Reserved. ©2021 Q4 Operating Results 12 In millions (except per share amounts) GAAP Non-GAAP Q3 20 Q4 20 Q3 20 Q4 20 Revenue $112.1 $138.9 $112.1 $138.9 Gross Profit 49.1 56.8 49.8 57.4 Gross Margin 43.8% 40.9% 44.5% 41.3% Operating Expenses 42.2 46.2 35.7 39.7 Operating Income / (Loss) 7.0 10.6 14.1 17.6 Net Income / (Loss) 0.6 (0.1) 11.0 15.0 Diluted Earnings/(Loss) Per Share $0.01 $(0.00) $0.22 $0.30 Diluted Shares 49.2 48.3 49.2 49.7 Amounts may not calculate precisely due to rounding. A reconciliation of GAAP to Non-GAAP financial measures can be found in the backup section of this presentation. |
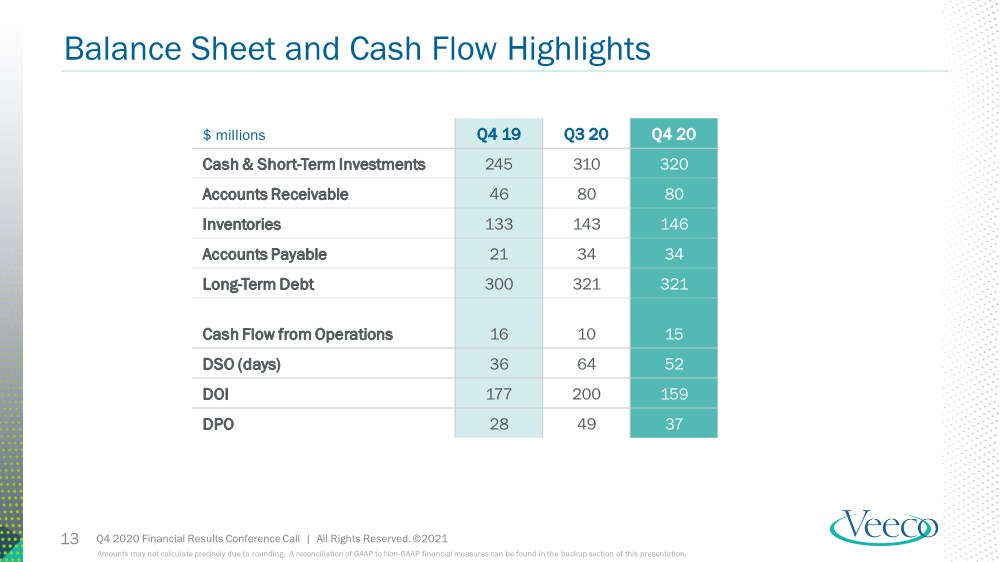
| Q4 2020 Financial Results Conference Call | All Rights Reserved. ©2021 Balance Sheet and Cash Flow Highlights 13 $ millions Q4 19 Q3 20 Q4 20 Cash & Short-Term Investments 245 310 320 Accounts Receivable 46 80 80 Inventories 133 143 146 Accounts Payable 21 34 34 Long-Term Debt 300 321 321 Cash Flow from Operations 16 10 15 DSO (days) 36 64 52 DOI 177 200 159 DPO 28 49 37 Amounts may not calculate precisely due to rounding. A reconciliation of GAAP to Non-GAAP financial measures can be found in the backup section of this presentation. |
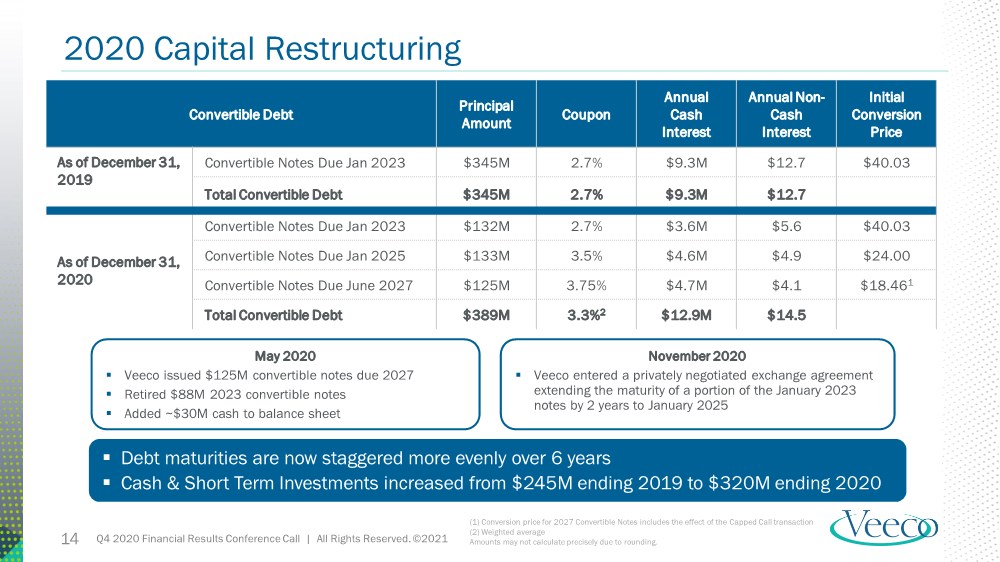
| Q4 2020 Financial Results Conference Call | All Rights Reserved. ©2021 2020 Capital Restructuring 14 Convertible Debt Principal Amount Coupon Annual Cash Interest Annual Non- Cash Interest Initial Conversion Price As of December 31, 2019 Convertible Notes Due Jan 2023 $345M 2.7% $9.3M $12.7 $40.03 Total Convertible Debt $345M 2.7% $9.3M $12.7 As of December 31, 2020 Convertible Notes Due Jan 2023 $132M 2.7% $3.6M $5.6 $40.03 Convertible Notes Due Jan 2025 $133M 3.5% $4.6M $4.9 $24.00 Convertible Notes Due June 2027 $125M 3.75% $4.7M $4.1 $18.461 Total Convertible Debt $389M 3.3%2 $12.9M $14.5 (1) Conversion price for 2027 Convertible Notes includes the effect of the Capped Call transaction (2) Weighted average Amounts may not calculate precisely due to rounding. May 2020 ▪ Veeco issued $125M convertible notes due 2027 ▪ Retired $88M 2023 convertible notes ▪ Added ~$30M cash to balance sheet November 2020 ▪ Veeco entered a privately negotiated exchange agreement extending the maturity of a portion of the January 2023 notes by 2 years to January 2025 ▪ Debt maturities are now staggered more evenly over 6 years ▪ Cash & Short Term Investments increased from $245M ending 2019 to $320M ending 2020 |
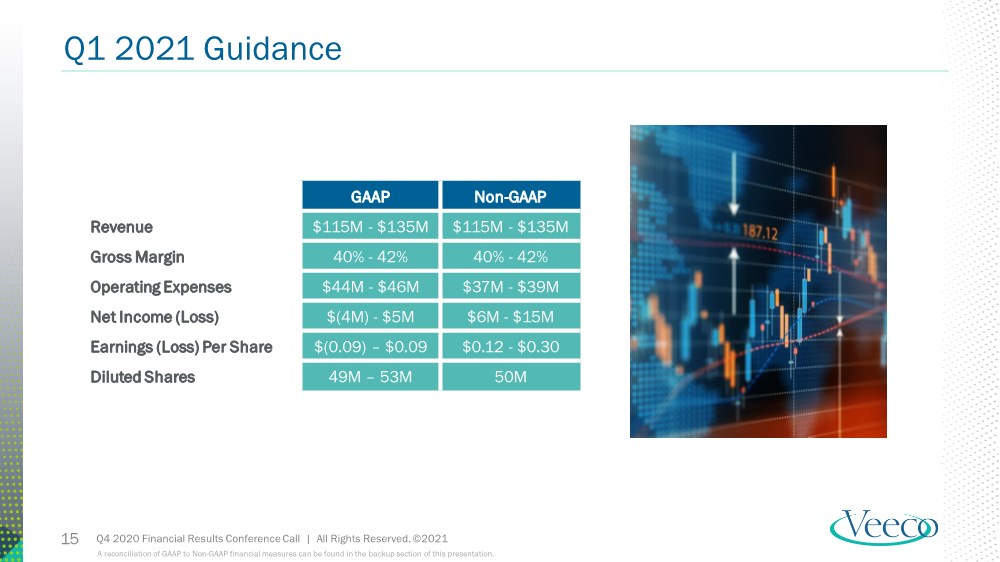
| Q4 2020 Financial Results Conference Call | All Rights Reserved. ©2021 Q1 2021 Guidance 15 GAAP Non-GAAP Revenue $115M - $135M $115M - $135M Gross Margin 40% - 42% 40% - 42% Operating Expenses $44M - $46M $37M - $39M Net Income (Loss) $(4M) - $5M $6M - $15M Earnings (Loss) Per Share $(0.09) – $0.09 $0.12 - $0.30 Diluted Shares 49M – 53M 50M A reconciliation of GAAP to Non-GAAP financial measures can be found in the backup section of this presentation. |
| CEO Market Update William J. Miller, Ph.D. |

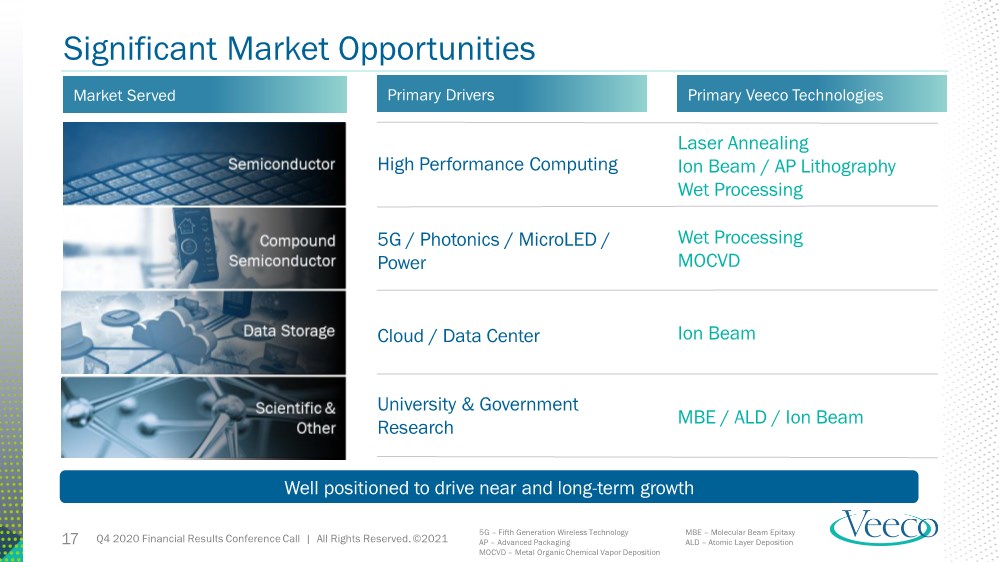
| Q4 2020 Financial Results Conference Call | All Rights Reserved. ©2021 17 Significant Market Opportunities High Performance Computing University & Government Research 5G / Photonics / MicroLED / Power Cloud / Data Center 5G – Fifth Generation Wireless Technology AP – Advanced Packaging MOCVD – Metal Organic Chemical Vapor Deposition MBE – Molecular Beam Epitaxy ALD – Atomic Layer Deposition Semiconductor Scientific & Other Compound Semiconductor Data Storage Ion Beam Laser Annealing Ion Beam / AP Lithography Wet Processing Wet Processing MOCVD MBE / ALD / Ion Beam Market Served Primary Drivers Primary Veeco Technologies Well positioned to drive near and long-term growth |
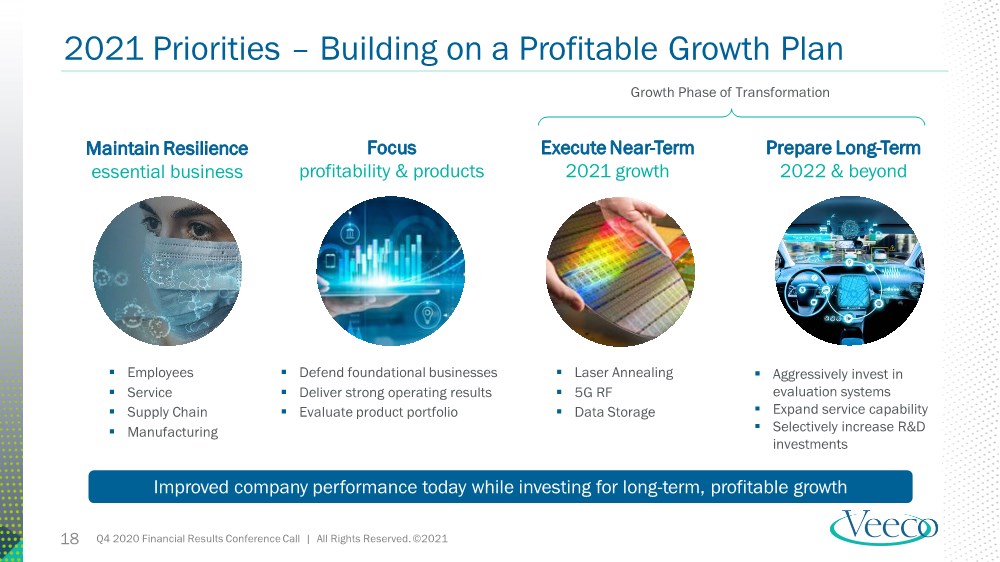
| Q4 2020 Financial Results Conference Call | All Rights Reserved. ©2021 Execute Near-Term 2021 growth Prepare Long-Term 2022 & beyond Focus profitability & products Maintain Resilience essential business ▪ Laser Annealing ▪ 5G RF ▪ Data Storage ▪ Employees ▪ Service ▪ Supply Chain ▪ Manufacturing ▪ Aggressively invest in evaluation systems ▪ Expand service capability ▪ Selectively increase R&D investments ▪ Defend foundational businesses ▪ Deliver strong operating results ▪ Evaluate product portfolio Improved company performance today while investing for long-term, profitable growth 18 2021 Priorities – Building on a Profitable Growth Plan Growth Phase of Transformation |
| Q&A |

| Backup & Reconciliation Tables |

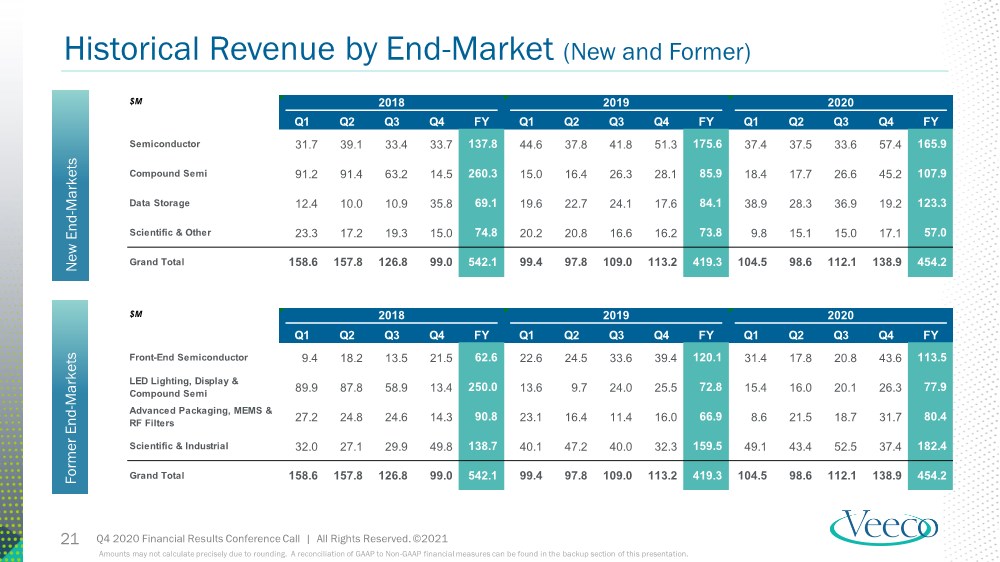
| Q4 2020 Financial Results Conference Call | All Rights Reserved. ©2021 Historical Revenue by End-Market (New and Former) 21 Amounts may not calculate precisely due to rounding. A reconciliation of GAAP to Non-GAAP financial measures can be found in the backup section of this presentation. Former End - Market s New End - Markets $M Q1 Q2 Q3 Q4 FY Q1 Q2 Q3 Q4 FY Q1 Q2 Q3 Q4 FY Front-End Semiconductor 9.4 18.2 13.5 21.5 62.6 22.6 24.5 33.6 39.4 120.1 31.4 17.8 20.8 43.6 113.5 LED Lighting, Display & Compound Semi 89.9 87.8 58.9 13.4 250.0 13.6 9.7 24.0 25.5 72.8 15.4 16.0 20.1 26.3 77.9 Advanced Packaging, MEMS & RF Filters 27.2 24.8 24.6 14.3 90.8 23.1 16.4 11.4 16.0 66.9 8.6 21.5 18.7 31.7 80.4 Scientific & Industrial 32.0 27.1 29.9 49.8 138.7 40.1 47.2 40.0 32.3 159.5 49.1 43.4 52.5 37.4 182.4 Grand Total 158.6 157.8 126.8 99.0 542.1 99.4 97.8 109.0 113.2 419.3 104.5 98.6 112.1 138.9 454.2 2020 2018 2019 $M Q1 Q2 Q3 Q4 FY Q1 Q2 Q3 Q4 FY Q1 Q2 Q3 Q4 FY Semiconductor 31.7 39.1 33.4 33.7 137.8 44.6 37.8 41.8 51.3 175.6 37.4 37.5 33.6 57.4 165.9 Compound Semi 91.2 91.4 63.2 14.5 260.3 15.0 16.4 26.3 28.1 85.9 18.4 17.7 26.6 45.2 107.9 Data Storage 12.4 10.0 10.9 35.8 69.1 19.6 22.7 24.1 17.6 84.1 38.9 28.3 36.9 19.2 123.3 Scientific & Other 23.3 17.2 19.3 15.0 74.8 20.2 20.8 16.6 16.2 73.8 9.8 15.1 15.0 17.1 57.0 Grand Total 158.6 157.8 126.8 99.0 542.1 99.4 97.8 109.0 113.2 419.3 104.5 98.6 112.1 138.9 454.2 2020 2018 2019 |
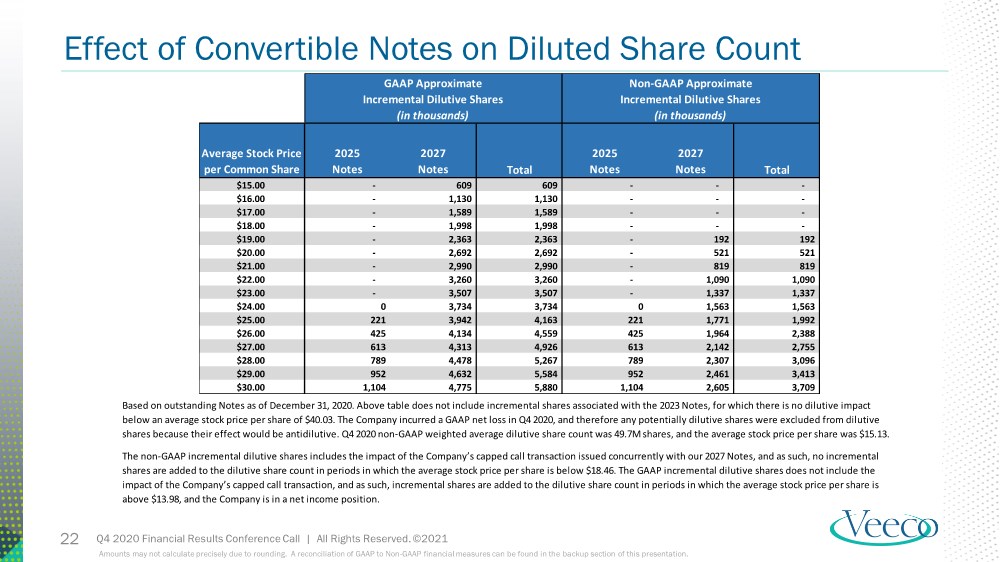
| Q4 2020 Financial Results Conference Call | All Rights Reserved. ©2021 22 Effect of Convertible Notes on Diluted Share Count Average Stock Price per Common Share 2025 Notes 2027 Notes Total 2025 Notes 2027 Notes Total $15.00 - 609 609 - - - $16.00 - 1,130 1,130 - - - $17.00 - 1,589 1,589 - - - $18.00 - 1,998 1,998 - - - $19.00 - 2,363 2,363 - 192 192 $20.00 - 2,692 2,692 - 521 521 $21.00 - 2,990 2,990 - 819 819 $22.00 - 3,260 3,260 - 1,090 1,090 $23.00 - 3,507 3,507 - 1,337 1,337 $24.00 0 3,734 3,734 0 1,563 1,563 $25.00 221 3,942 4,163 221 1,771 1,992 $26.00 425 4,134 4,559 425 1,964 2,388 $27.00 613 4,313 4,926 613 2,142 2,755 $28.00 789 4,478 5,267 789 2,307 3,096 $29.00 952 4,632 5,584 952 2,461 3,413 $30.00 1,104 4,775 5,880 1,104 2,605 3,709 GAAP Approximate Incremental Dilutive Shares (in thousands) Non-GAAP Approximate Incremental Dilutive Shares (in thousands) Based on outstanding Notes as of December 31, 2020. Above table does not include incremental shares associated with the 2023 Notes, for which there is no dilutive impact below an average stock price per share of $40.03. The Company incurred a GAAP net loss in Q4 2020, and therefore any potentially dilutive shares were excluded from dilutive shares because their effect would be antidilutive. Q4 2020 non-GAAP weighted average dilutive share count was 49.7M shares, and the average stock price per share was $15.13. The non-GAAP incremental dilutive shares includes the impact of the Company’s capped call transaction issued concurrently with our 2027 Notes, and as such, no incremental shares are added to the dilutive share count in periods in which the average stock price per share is below $18.46. The GAAP incremental dilutive shares does not include the impact of the Company’s capped call transaction, and as such, incremental shares are added to the dilutive share count in periods in which the average stock price per share is above $13.98, and the Company is in a net income position. Amounts may not calculate precisely due to rounding. A reconciliation of GAAP to Non-GAAP financial measures can be found in the backup section of this presentation. |
| Q4 2020 Financial Results Conference Call | All Rights Reserved. ©2021 Note on Reconciliation Tables 23 These tables include financial measures adjusted for the impact of certain items; these financial measures are therefore not calculated in accordance with U.S. generally accepted accounting principles (“GAAP”). These Non-GAAP financial measures exclude items such as: share-based compensation expense; charges relating to restructuring initiatives; non-cash asset impairments; certain other non-operating gains and losses; and acquisition-related items such as transaction costs, non-cash amortization of acquired intangible assets, incremental transaction-related compensation, and certain integration costs. These Non-GAAP financial measures may be different from Non-GAAP financial measures used by other companies. Non-GAAP financial measures should not be considered a substitute for, or superior to, measures of financial performance prepared in accordance with GAAP. By excluding these items, Non-GAAP financial measures are intended to facilitate meaningful comparisons to historical operating results, competitors' operating results, and estimates made by securities analysts. Management is evaluated on key performance metrics including Non-GAAP Operating Income, which is used to determine management incentive compensation as well as to forecast future periods. These Non-GAAP financial measures may be useful to investors in allowing for greater transparency of supplemental information used by management in its financial and operational decision-making. In addition, similar Non-GAAP financial measures have historically been reported to investors; the inclusion of comparable numbers provides consistency in financial reporting. Investors are encouraged to review the reconciliation of the Non-GAAP financial measures used in this news release to their most directly comparable GAAP financial measures. |
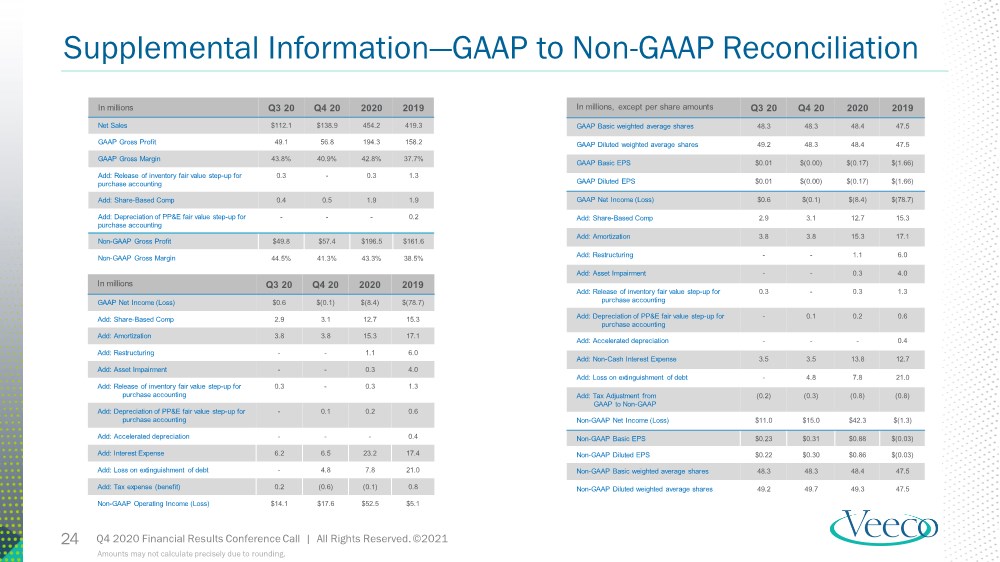
| Q4 2020 Financial Results Conference Call | All Rights Reserved. ©2021 24 Supplemental Information—GAAP to Non-GAAP Reconciliation Amounts may not calculate precisely due to rounding. In millions Q3 20 Q4 20 2020 2019 Net Sales $112.1 $138.9 454.2 419.3 GAAP Gross Profit 49.1 56.8 194.3 158.2 GAAP Gross Margin 43.8% 40.9% 42.8% 37.7% Add: Release of inventory fair value step-up for purchase accounting 0.3 - 0.3 1.3 Add: Share-Based Comp 0.4 0.5 1.9 1.9 Add: Depreciation of PP&E fair value step-up for purchase accounting --- 0.2 Non-GAAP Gross Profit $49.8 $57.4 $196.5 $161.6 Non-GAAP Gross Margin 44.5% 41.3% 43.3% 38.5% In millions Q3 20 Q4 20 2020 2019 GAAP Net Income (Loss) $0.6 $(0.1) $(8.4) $(78.7) Add: Share-Based Comp 2.9 3.1 12.7 15.3 Add: Amortization 3.8 3.8 15.3 17.1 Add: Restructuring -- 1.1 6.0 Add: Asset Impairment -- 0.3 4.0 Add: Release of inventory fair value step-up for purchase accounting 0.3 - 0.3 1.3 Add: Depreciation of PP&E fair value step-up for purchase accounting - 0.1 0.2 0.6 Add: Accelerated depreciation --- 0.4 Add: Interest Expense 6.2 6.5 23.2 17.4 Add: Loss on extinguishment of debt - 4.8 7.8 21.0 Add: Tax expense (benefit) 0.2 (0.6) (0.1) 0.8 Non-GAAP Operating Income (Loss) $14.1 $17.6 $52.5 $5.1 In millions, except per share amounts Q3 20 Q4 20 2020 2019 GAAP Basic weighted average shares 48.3 48.3 48.4 47.5 GAAP Diluted weighted average shares 49.2 48.3 48.4 47.5 GAAP Basic EPS $0.01 $(0.00) $(0.17) $(1.66) GAAP Diluted EPS $0.01 $(0.00) $(0.17) $(1.66) GAAP Net Income (Loss) $0.6 $(0.1) $(8.4) $(78.7) Add: Share-Based Comp 2.9 3.1 12.7 15.3 Add: Amortization 3.8 3.8 15.3 17.1 Add: Restructuring -- 1.1 6.0 Add: Asset Impairment -- 0.3 4.0 Add: Release of inventory fair value step-up for purchase accounting 0.3 - 0.3 1.3 Add: Depreciation of PP&E fair value step-up for purchase accounting - 0.1 0.2 0.6 Add: Accelerated depreciation --- 0.4 Add: Non-Cash Interest Expense 3.5 3.5 13.8 12.7 Add: Loss on extinguishment of debt - 4.8 7.8 21.0 Add: Tax Adjustment from GAAP to Non-GAAP (0.2) (0.3) (0.8) (0.8) Non-GAAP Net Income (Loss) $11.0 $15.0 $42.3 $(1.3) Non-GAAP Basic EPS $0.23 $0.31 $0.88 $(0.03) Non-GAAP Diluted EPS $0.22 $0.30 $0.86 $(0.03) Non-GAAP Basic weighted average shares 48.3 48.3 48.4 47.5 Non-GAAP Diluted weighted average shares 49.2 49.7 49.3 47.5 |
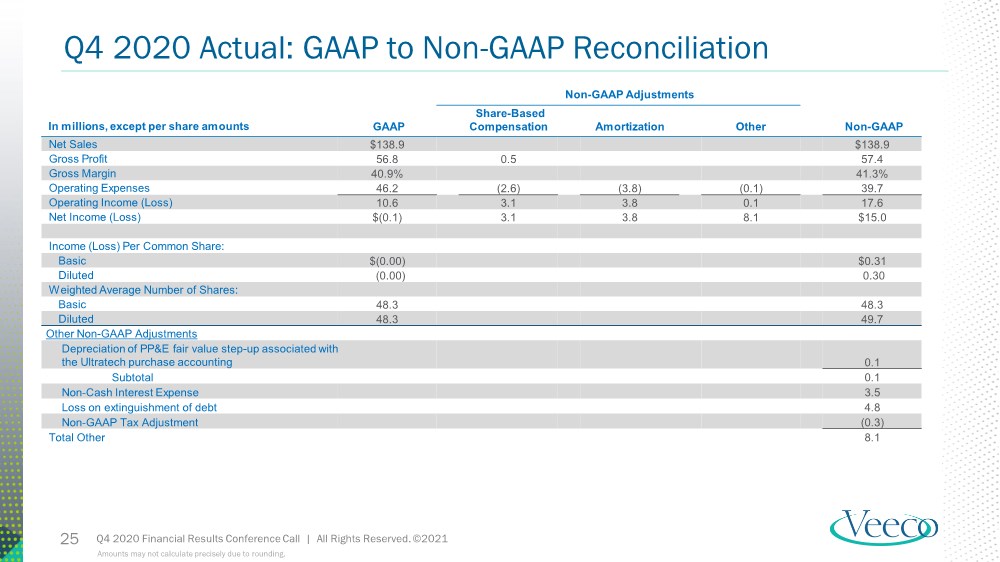
| Q4 2020 Financial Results Conference Call | All Rights Reserved. ©2021 25 Q4 2020 Actual: GAAP to Non-GAAP Reconciliation Amounts may not calculate precisely due to rounding. Non-GAAP Adjustments In millions, except per share amounts GAAP Share-Based Compensation Amortization Other Non-GAAP Net Sales $138.9 $138.9 Gross Profit 56.8 0.5 57.4 Gross Margin 40.9% 41.3% Operating Expenses 46.2 (2.6) (3.8) (0.1) 39.7 Operating Income (Loss) 10.6 3.1 3.8 0.1 17.6 Net Income (Loss) $(0.1) 3.1 3.8 8.1 $15.0 Income (Loss) Per Common Share: Basic $(0.00) $0.31 Diluted (0.00) 0.30 Weighted Average Number of Shares: Basic 48.3 48.3 Diluted 48.3 49.7 Other Non-GAAP Adjustments Depreciation of PP&E fair value step-up associated with the Ultratech purchase accounting 0.1 Subtotal 0.1 Non-Cash Interest Expense 3.5 Loss on extinguishment of debt 4.8 Non-GAAP Tax Adjustment (0.3) Total Other 8.1 |
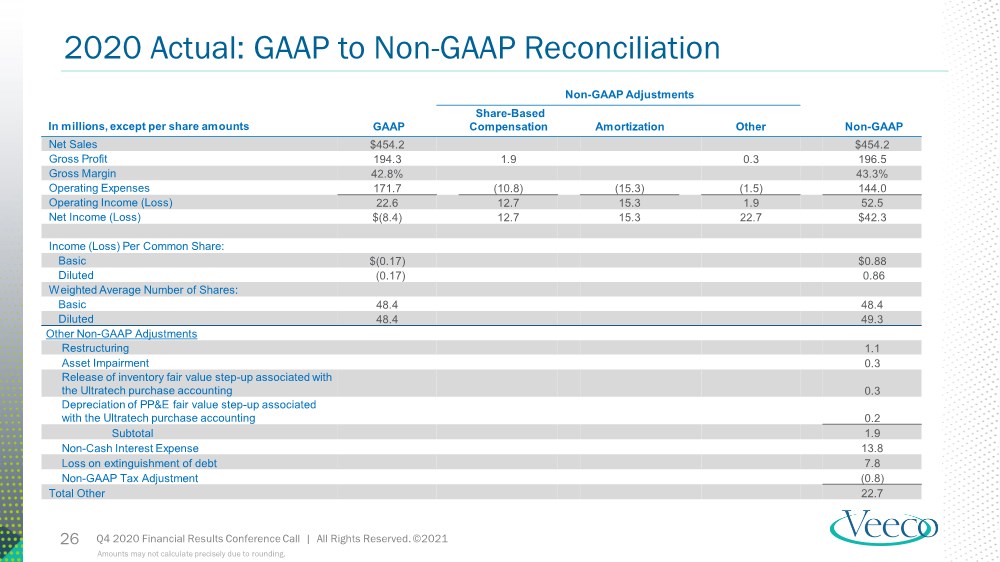
| Q4 2020 Financial Results Conference Call | All Rights Reserved. ©2021 26 2020 Actual: GAAP to Non-GAAP Reconciliation Amounts may not calculate precisely due to rounding. Non-GAAP Adjustments In millions, except per share amounts GAAP Share-Based Compensation Amortization Other Non-GAAP Net Sales $454.2 $454.2 Gross Profit 194.3 1.9 0.3 196.5 Gross Margin 42.8% 43.3% Operating Expenses 171.7 (10.8) (15.3) (1.5) 144.0 Operating Income (Loss) 22.6 12.7 15.3 1.9 52.5 Net Income (Loss) $(8.4) 12.7 15.3 22.7 $42.3 Income (Loss) Per Common Share: Basic $(0.17) $0.88 Diluted (0.17) 0.86 Weighted Average Number of Shares: Basic 48.4 48.4 Diluted 48.4 49.3 Other Non-GAAP Adjustments Restructuring 1.1 Asset Impairment 0.3 Release of inventory fair value step-up associated with the Ultratech purchase accounting 0.3 Depreciation of PP&E fair value step-up associated with the Ultratech purchase accounting 0.2 Subtotal 1.9 Non-Cash Interest Expense 13.8 Loss on extinguishment of debt 7.8 Non-GAAP Tax Adjustment (0.8) Total Other 22.7 |
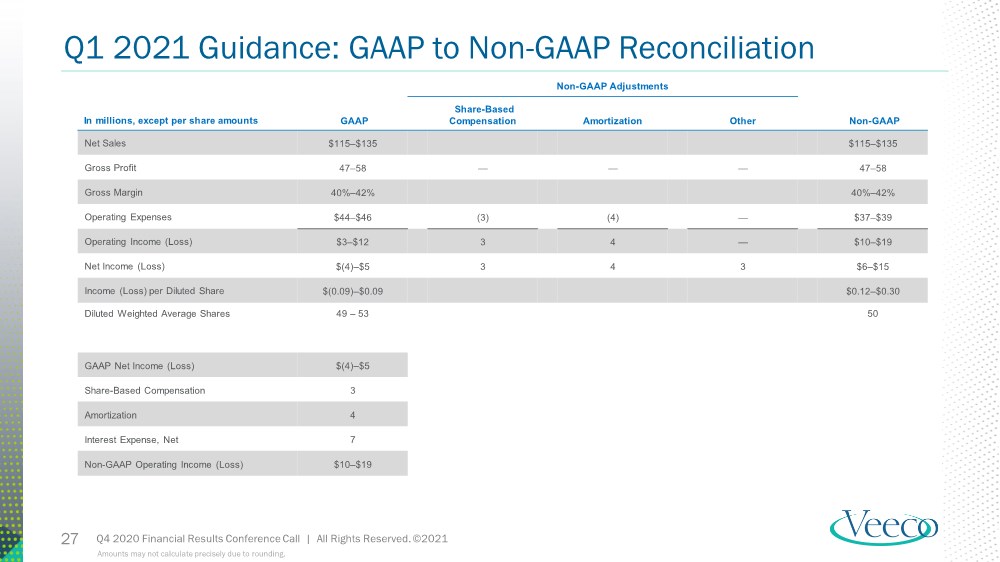
| Q4 2020 Financial Results Conference Call | All Rights Reserved. ©2021 27 Q1 2021 Guidance: GAAP to Non-GAAP Reconciliation Amounts may not calculate precisely due to rounding. Non-GAAP Adjustments In millions, except per share amounts GAAP Share-Based Compensation Amortization Other Non-GAAP Net Sales $115–$135 $115–$135 Gross Profit 47–58 ——— 47–58 Gross Margin 40%–42% 40%–42% Operating Expenses $44–$46 (3) (4) — $37–$39 Operating Income (Loss) $3–$12 3 4 — $10–$19 Net Income (Loss) $(4)–$5 3 4 3 $6–$15 Income (Loss) per Diluted Share $(0.09)–$0.09 $0.12–$0.30 Diluted Weighted Average Shares 49 – 53 50 GAAP Net Income (Loss) $(4)–$5 Share-Based Compensation 3 Amortization 4 Interest Expense, Net 7 Non-GAAP Operating Income (Loss) $10–$19 |
| Thank You |