Attached files
| file | filename |
|---|---|
| 8-K - 8-K - FEDERAL REALTY INVESTMENT TRUST | frt-20210211.htm |
| FEDERAL REALTY INVESTMENT TRUST | |||||||||||
| SUPPLEMENTAL INFORMATION | |||||||||||
| December 31, 2020 | |||||||||||
| TABLE OF CONTENTS | |||||||||||
| 1 | Fourth Quarter and Full Year 2020 Earnings Press Release | ||||||||||
| 2 | Financial Highlights | ||||||||||
| Consolidated Income Statements | |||||||||||
| Consolidated Balance Sheets | |||||||||||
| Funds From Operations / Dividend Information | |||||||||||
| Other Supplemental Information | |||||||||||
| COVID-19 Related Impacts | |||||||||||
| Components of Rental Income | |||||||||||
| Comparable Property Information | |||||||||||
| Market Data | |||||||||||
| 3 | Summary of Debt | ||||||||||
| Summary of Outstanding Debt | |||||||||||
| Summary of Debt Maturities | |||||||||||
| 4 | Summary of Redevelopment Opportunities | ||||||||||
| 5 | Assembly Row, Pike & Rose, and Santana Row | ||||||||||
| 6 | Future Redevelopment Opportunities | ||||||||||
| 7 | Significant Property Acquisitions, Dispositions, and Other Transactions | ||||||||||
| 8 | Real Estate Status Report | ||||||||||
| 9 | Retail Leasing Summary | ||||||||||
| 10 | Lease Expirations | ||||||||||
| 11 | Portfolio Leased Statistics | ||||||||||
| 12 | Summary of Top 25 Tenants | ||||||||||
| 13 | Tenant Diversification by Category | ||||||||||
| 14 | Glossary of Terms | ||||||||||
| 909 Rose Avenue, Suite 200 | |||||||||||
| North Bethesda, Maryland 20852-8688 | |||||||||||
| 301/998-8100 | |||||||||||
1
Safe Harbor Language
Certain matters discussed within this Supplemental Information may be deemed to be forward-looking statements within the meaning of the federal securities laws. Although Federal Realty believes the expectations reflected in the forward-looking statements are based on reasonable assumptions, it can give no assurance that its expectations will be attained. These factors include, but are not limited to, the risk factors described in our Annual Report on Form 10-K filed on February 11, 2021, and include the following:
•risks that our tenants will not pay rent, may vacate early or may file for bankruptcy or that we may be unable to renew leases or re-let space at favorable rents as leases expire;
•risks that we may not be able to proceed with or obtain necessary approvals for any redevelopment or renovation project, and that completion of anticipated or ongoing property redevelopment or renovation projects that we do pursue may cost more, take more time to complete or fail to perform as expected;
•risk that we are investing a significant amount in ground-up development projects that may be dependent on third parties to deliver critical aspects of certain projects, requires spending a substantial amount upfront in infrastructure, and assumes receipt of public funding which has been committed but not entirely funded;
•risks normally associated with the real estate industry, including risks that occupancy levels at our properties and the amount of rent that we receive from our properties may be lower than expected, that new acquisitions may fail to perform as expected, that competition for acquisitions could result in increased prices for acquisitions, that costs associated with the periodic maintenance and repair or renovation of space, insurance and other operations may increase, that environmental issues may develop at our properties and result in unanticipated costs, and, because real estate is illiquid, that we may not be able to sell properties when appropriate;
•risks that our growth will be limited if we cannot obtain additional capital;
•risks of financing on terms which are acceptable to us, our ability to meet existing financial covenants and the limitations imposed on our operations by those covenants, and the possibility of increases in interest rates that would result in increased interest expense;
•risks related to our status as a real estate investment trust, commonly referred to as a REIT, for federal income tax purposes, such as the existence of complex tax regulations relating to our status as a REIT, the effect of future changes in REIT requirements as a result of new legislation, and the adverse consequences of the failure to qualify as a REIT; and
•risks related to natural disasters, climate change and public health crises (such as the outbreak and worldwide spread of COVID-19), and the measures that international, federal, state and local governments, agencies, law enforcement and/or health authorities implement to address them, my precipitate or materially exacerbate one or more the above-mentioned risks, and my significantly disrupt or prevent us from operating our business in the ordinary course for an extended period.
Given these uncertainties, readers are cautioned not to place undue reliance on any forward-looking statements that we make, including those in this Supplemental Information. Except as required by law, we make no promise to update any of the forward-looking statements as a result of new information, future events, or otherwise. You should review the risks contained in our Annual Report on Form 10-K, filed with the Securities and Exchange Commission on February 11, 2021.
2
| NEWS RELEASE | www.federalrealty.com | ||||
FOR IMMEDIATE RELEASE | |||||
| Inquiries: | |||||
| Leah Andress Brady | |||||
| Investor Relations Senior Manager | |||||
| 301.998.8265 | |||||
| lbrady@federalrealty.com | |||||
Federal Realty Investment Trust Announces Operating Results for the Year and Quarter Ended
December 31, 2020
NORTH BETHESDA, Md. (February 11, 2021) - Federal Realty Investment Trust (NYSE:FRT) today reported operating results for its year and quarter ended December 31, 2020. For the year ended December 31, 2020 and 2019, net income available for common shareholders was $1.62 per diluted share and $4.61 per diluted share, respectively. For the three months ended December 31, 2020 and 2019, net income available for common shareholders was $1.22 per diluted share and $1.92 per diluted share, respectively.
Key Highlights of the full year and quarter include:
•Signed leases for 449,783 square feet of comparable space in the fourth quarter at an average rent of $32.16 psf and achieved cash basis rollover growth on those comparable spaces of 1%.
•Sold three properties for combined gross proceeds of $170 million in the fourth quarter.
•Executed inaugural green offering, $400.0 million aggregate principal amount of 1.250% notes at an effective yield of 1.379%, maturing February 15, 2026.
•Ended the quarter with $798 million of cash on hand, $1.0 billion of availability on its revolving credit facility and no public bonds maturing until 2023.
•Generated funds from operations available for common shareholders (FFO) per diluted share of $4.38 for the year ($4.52 excluding the $11.2 million early extinguishment of debt charge) compared to $6.17 in 2019 ($6.33 excluding the $11.9 million charge related to the buyout of the Kmart lease at Assembly). For the fourth quarter, generated FFO per diluted share of $0.99 ($1.14 excluding the early extinguishment of debt charge) compared to $1.58 for the fourth quarter 2019.
“While COVID certainly weighed on our quarterly and yearly results, the sheer volume of leasing and other transactions that we executed at the end of last year along with the continuing strong leasing demand for our real
3
estate as evidenced by the many substantive discussions we’re having with prospective tenants today set us up extremely well for a post COVID recovery as vaccinations are delivered to a large segment of the population,” said Donald C. Wood, President and Chief Executive Officer. “We believe that Federal’s high-quality open-air shopping centers and mixed-use communities located in the first-tier suburbs of major metropolitan markets are the center of the bulls eye in terms of tenant desirability.”
Financial Results
For the full year 2020, Federal Realty reported net income available for common shareholders of $123.7 million and earnings per diluted share of $1.62, which includes the $50.7 million net impairment charge relating to The Shops at Sunset Place and the $11.2 million early extinguishment of debt charge. This compares to net income available for common shareholders of $345.8 million and earnings per diluted share of $4.61 for the full year 2019. Net income available for common shareholders was $92.7 million and earnings per diluted share was $1.22 for the fourth quarter 2020 which includes the $11.2 million early extinguishment of debt charge versus $145.3 million and $1.92, respectively, for the fourth quarter 2019.
For the full year 2020, Federal Realty generated funds from operations available for common shareholders (FFO) of $333.8 million, or $4.38 per diluted share ($4.52 excluding the $11.2 million early extinguishment of debt charge). This compares to FFO of $465.8 million, or $6.17 per diluted share ($6.33 excluding the $11.9 million charge related to the buyout of the Kmart lease at Assembly) for the full year 2019. For the fourth quarter 2020, FFO was $75.1 million, or $0.99 per diluted share ($1.14 excluding the early extinguishment of debt charge), compared to $120.0 million, or $1.58 per diluted share for the fourth quarter 2019.
The year-over-year decreases in net income and FFO were attributable to the impacts of the COVID-19 pandemic with the primary driver being collectibility related impacts totaling $106.6 million, or $1.40 per share, which included a $12.7 million impact to straight-line rent for the full year 2020. For the fourth quarter 2020, collectibility related impacts totaled $18.9 million, or $0.25 per share, which included a $1.6 million impact to straight-line rent.
FFO is a non-GAAP supplemental earnings measure which the Trust considers meaningful in measuring its operating performance. A reconciliation of FFO to net income is attached to this press release.
Portfolio Results
The portfolio was 92.2% leased as of December 31, 2020, and the comparable portfolio was 92.1% leased.
For the year 2020, Federal Realty signed 336 leases for 1.8 million square feet of retail space. On a comparable space basis (i.e., spaces for which there was a former tenant), Federal Realty leased 1.7 million square feet at an average rent of $31.53 per square foot compared to the average contractual rent of $30.76 per square foot for the last year of the prior leases, representing a cash basis rollover growth on those comparable spaces of 3%, 12% on a straight-line basis.
4
During the fourth quarter 2020, Federal Realty signed 103 leases for 468,901 square feet of retail space. On a comparable space basis (i.e., spaces for which there was a former tenant), Federal Realty leased 449,783 square feet at an average rent of $32.16 per square foot compared to the average contractual rent of $31.95 per square foot for the last year of the prior leases, representing a cash basis rollover growth on those comparable spaces of 1%, 11% on a straight-line basis.
COVID-19 Operational Update
All 101 properties remain open and operating. Approximately 98% of our retail tenants based on annualized base rent are open and operating as of January 31, 2021. Annualized base rent reflects the aggregate, annualized in-place contractual (defined as rents billed on a cash basis without taking the impact of rent abatements into account) minimum rent for all occupied commercial spaces.
As of January 31, 2021, the Company has collected approximately 89% of total fourth quarter 2020 billed recurring rents.
With $798 million of cash and cash equivalents as of December 31, 2020, Federal Realty has approximately $1.8 billion of liquidity in cash and undrawn availability under its $1.0 billion revolving credit facility.
Additional information on the impact of the COVID-19 pandemic on the Company’s business to date is available in a presentation posted on the Investor section of Federal Realty’s website.
Regular Quarterly Dividends
Federal Realty’s Board of Trustees declared a regular quarterly cash dividend of $1.06 per common share, resulting in an indicated annual rate of $4.24 per common share. The regular common dividend will be payable on April 15, 2021, to common shareholders of record as of March 16, 2021.
Federal Realty’s Board of Trustees also declared a quarterly cash dividend on its Class C depositary shares, each representing 1/1000 of a 5.000% Series C Cumulative Preferred Share of Beneficial Interest, of $0.3125 per depositary share. All dividends on the depositary shares will be payable on April 15, 2021, to shareholders of record as of March 16, 2021.
Summary of Other Quarterly Activities and Recent Developments
February 11, 2021 – Federal Realty announced the promotion of Jeffrey S. Berkes to President and Chief Operating Officer. In this newly created role, Mr. Berkes will have direct responsibility for overseeing and directing all of Federal’s day-to-day property operating functions, including leasing, development and asset management, on both the East and West Coasts.
December 2020 – Federal Realty sold three non-strategic assets, The Shops at Sunset Place, Eastgate Crossing and Sam’s Park & Shop, for combined gross proceeds of $170 million.
5
October 13, 2020 – Federal Realty closed on its inaugural issuance of green bonds, $400.0 million aggregate principal amount of 1.250% notes at an effective yield of 1.379%, maturing February 15, 2026. The company intends to allocate an amount equal to the net proceeds from this offering to the financing and refinancing of recently completed and future eligible green projects.
Conference Call Information
Federal Realty’s management team will present an in-depth discussion of Federal Realty’s operating performance on its fourth quarter 2020 earnings conference call, which is scheduled for Thursday, February 11, 2021 at 5:00 PM ET. To participate, please call 877.407.9208 five to ten minutes prior to the call start time and use the passcode 13714444 (required). The teleconference can also be accessed via a live webcast at www.federalrealty.com in the Investors section. A replay of the webcast will be available on Federal Realty’s website at www.federalrealty.com. A telephonic replay of the conference call will also be available through February 25, 2021 by dialing 844.512.2921; Passcode: 13714444.
About Federal Realty
Federal Realty is a recognized leader in the ownership, operation and redevelopment of high-quality retail-based properties located primarily in major coastal markets from Washington, D.C. to Boston as well as San Francisco and Los Angeles. Founded in 1962, Federal Realty’s mission is to deliver long term, sustainable growth through investing in densely populated, affluent communities where retail demand exceeds supply. Its expertise includes creating urban, mixed-use neighborhoods like Santana Row in San Jose, California, Pike & Rose in North Bethesda, Maryland and Assembly Row in Somerville, Massachusetts. These unique and vibrant environments that combine shopping, dining, living and working provide a destination experience valued by their respective communities. Federal Realty's 101 properties include approximately 2,800 tenants, in 23 million square feet, and approximately 2,900 residential units.
Federal Realty has increased its quarterly dividends to its shareholders for 53 consecutive years, the longest record in the REIT industry. Federal Realty is an S&P 500 index member and its shares are traded on the NYSE under the symbol FRT. For additional information about Federal Realty and its properties, visit www.federalrealty.com.
Safe Harbor Language
Certain matters discussed within this Press Release may be deemed to be forward-looking statements within the meaning of the federal securities laws. Although Federal Realty believes the expectations reflected in the forward-looking statements are based on reasonable assumptions, it can give no assurance that its expectations will be attained. These factors include, but are not limited to, the risk factors described in our Annual Report on Form 10-K filed on February 11, 2021, and include the following:
•risks that our tenants will not pay rent, may vacate early or may file for bankruptcy or that we may be unable to renew leases or re-let space at favorable rents as leases expire;
•risks that we may not be able to proceed with or obtain necessary approvals for any redevelopment or renovation project, and that completion of anticipated or ongoing property redevelopment or renovation projects that we do pursue may cost more, take more time to complete or fail to perform as expected;
•risk that we are investing a significant amount in ground-up development projects that may be dependent on third parties to deliver critical aspects of certain projects, requires spending a substantial amount upfront in infrastructure, and assumes receipt of public funding which has been committed but not entirely funded;
•risks normally associated with the real estate industry, including risks that occupancy levels at our properties and the amount of rent that we receive from our properties may be lower than expected, that new acquisitions may fail to perform as expected, that competition for
6
acquisitions could result in increased prices for acquisitions, that costs associated with the periodic maintenance and repair or renovation of space, insurance and other operations may increase, that environmental issues may develop at our properties and result in unanticipated costs, and, because real estate is illiquid, that we may not be able to sell properties when appropriate;
•risks that our growth will be limited if we cannot obtain additional capital;
•risks of financing on terms which are acceptable to us, our ability to meet existing financial covenants and the limitations imposed on our operations by those covenants, and the possibility of increases in interest rates that would result in increased interest expense;
•risks related to our status as a real estate investment trust, commonly referred to as a REIT, for federal income tax purposes, such as the existence of complex tax regulations relating to our status as a REIT, the effect of future changes in REIT requirements as a result of new legislation, and the adverse consequences of the failure to qualify as a REIT; and
•risks related to natural disasters, climate change and public health crises (such as the outbreak and worldwide spread of COVID-19), and the measures that international, federal, state and local governments, agencies, law enforcement and/or health authorities implement to address them, my precipitate or materially exacerbate one or more the above-mentioned risks, and my significantly disrupt or prevent us from operating our business in the ordinary course for an extended period.
Given these uncertainties, readers are cautioned not to place undue reliance on any forward-looking statements that we make, including those in this Press Release. Except as required by law, we make no promise to update any of the forward-looking statements as a result of new information, future events or otherwise. You should review the risks contained in our Annual Report on Form 10-K, filed with the Securities and Exchange Commission on February 11, 2021.
7
| Federal Realty Investment Trust | ||||||||||||||||||||||||||
| Consolidated Income Statements | ||||||||||||||||||||||||||
| December 31, 2020 | ||||||||||||||||||||||||||
| Three Months Ended | Year Ended | |||||||||||||||||||||||||
| December 31, | December 31, | |||||||||||||||||||||||||
| 2020 | 2019 | 2020 | 2019 | |||||||||||||||||||||||
| (in thousands, except per share data) | ||||||||||||||||||||||||||
| REVENUE | ||||||||||||||||||||||||||
| Rental income | $ | 218,484 | $ | 238,303 | $ | 832,171 | $ | 932,738 | ||||||||||||||||||
| Mortgage interest income | 1,029 | 846 | 3,323 | 3,050 | ||||||||||||||||||||||
| Total revenue | 219,513 | 239,149 | 835,494 | 935,788 | ||||||||||||||||||||||
| EXPENSES | ||||||||||||||||||||||||||
| Rental expenses | 48,359 | 47,649 | 170,920 | 187,831 | ||||||||||||||||||||||
| Real estate taxes | 29,059 | 29,044 | 119,242 | 110,927 | ||||||||||||||||||||||
| General and administrative | 12,307 | 10,707 | 41,680 | 42,754 | ||||||||||||||||||||||
| Depreciation and amortization | 64,424 | 61,431 | 255,027 | 239,758 | ||||||||||||||||||||||
| Total operating expenses | 154,149 | 148,831 | 586,869 | 581,270 | ||||||||||||||||||||||
| Impairment charge | — | — | (57,218) | — | ||||||||||||||||||||||
| Gain on sale of real estate, net of tax | 86,435 | 85,903 | 98,117 | 116,393 | ||||||||||||||||||||||
| OPERATING INCOME | 151,799 | 176,221 | 289,524 | 470,911 | ||||||||||||||||||||||
| OTHER INCOME/(EXPENSE) | ||||||||||||||||||||||||||
| Other interest income | 539 | 511 | 1,894 | 1,266 | ||||||||||||||||||||||
| Interest expense | (37,543) | (27,056) | (136,289) | (109,623) | ||||||||||||||||||||||
| Early extinguishment of debt | (11,179) | — | (11,179) | — | ||||||||||||||||||||||
| Loss from partnerships | (1,405) | (710) | (8,062) | (2,012) | ||||||||||||||||||||||
| NET INCOME | 102,211 | 148,966 | 135,888 | 360,542 | ||||||||||||||||||||||
| Net income attributable to noncontrolling interests | (7,486) | (1,611) | (4,182) | (6,676) | ||||||||||||||||||||||
| NET INCOME ATTRIBUTABLE TO THE TRUST | 94,725 | 147,355 | 131,706 | 353,866 | ||||||||||||||||||||||
| Dividends on preferred shares | (2,011) | (2,011) | (8,042) | (8,042) | ||||||||||||||||||||||
| NET INCOME AVAILABLE FOR COMMON SHAREHOLDERS | $ | 92,714 | $ | 145,344 | $ | 123,664 | $ | 345,824 | ||||||||||||||||||
| EARNINGS PER COMMON SHARE, BASIC AND DILUTED | ||||||||||||||||||||||||||
| Net income available for common shareholders | $ | 1.22 | $ | 1.92 | $ | 1.62 | $ | 4.61 | ||||||||||||||||||
| Weighted average number of common shares, basic | 75,898 | 75,305 | 75,515 | 74,766 | ||||||||||||||||||||||
8
| Federal Realty Investment Trust | |||||||||||
| Consolidated Balance Sheets | |||||||||||
| December 31, 2020 | |||||||||||
| December 31, | |||||||||||
| 2020 | 2019 | ||||||||||
| (in thousands, except share and | |||||||||||
| per share data) | |||||||||||
| ASSETS | |||||||||||
| Real estate, at cost | |||||||||||
| Operating (including $1,703,202 and $1,676,866 of consolidated variable interest entities, respectively) | $ | 7,771,981 | $ | 7,535,983 | |||||||
| Construction-in-progress (including $44,896 and $102,583 of consolidated variable interest entities, respectively) | 810,889 | 760,420 | |||||||||
| Assets held for sale | — | 1,729 | |||||||||
| 8,582,870 | 8,298,132 | ||||||||||
| Less accumulated depreciation and amortization (including $335,735 and $296,165 of consolidated variable interest entities, respectively) | (2,357,692) | (2,215,413) | |||||||||
| Net real estate | 6,225,178 | 6,082,719 | |||||||||
| Cash and cash equivalents | 798,329 | 127,432 | |||||||||
| Accounts and notes receivable | 159,780 | 152,572 | |||||||||
| Mortgage notes receivable, net | 39,892 | 30,429 | |||||||||
| Investment in partnerships | 22,128 | 28,604 | |||||||||
| Operating lease right of use assets | 92,248 | 93,774 | |||||||||
| Finance lease right of use assets | 51,116 | 52,402 | |||||||||
| Prepaid expenses and other assets | 218,953 | 227,060 | |||||||||
| TOTAL ASSETS | $ | 7,607,624 | $ | 6,794,992 | |||||||
| LIABILITIES AND SHAREHOLDERS’ EQUITY | |||||||||||
| Liabilities | |||||||||||
| Mortgages payable, net (including $413,681 and $469,184 of consolidated variable interest entities, respectively) | $ | 484,111 | $ | 545,679 | |||||||
| Notes payable | 402,776 | 3,781 | |||||||||
| Senior notes and debentures | 3,404,488 | 2,807,134 | |||||||||
| Accounts payable and other expenses | 228,641 | 255,503 | |||||||||
| Dividends payable | 83,839 | 81,676 | |||||||||
| Security deposits payable | 20,388 | 21,701 | |||||||||
| Operating lease liabilities | 72,441 | 73,628 | |||||||||
| Finance lease liabilities | 72,049 | 72,062 | |||||||||
| Other liabilities and deferred credits | 152,424 | 157,938 | |||||||||
| Total liabilities | 4,921,157 | 4,019,102 | |||||||||
| Commitments and contingencies | |||||||||||
| Redeemable noncontrolling interests | 137,720 | 139,758 | |||||||||
| Shareholders’ equity | |||||||||||
| Preferred shares, authorized 15,000,000 shares, $.01 par: | |||||||||||
| 5.0% Series C Cumulative Redeemable Preferred Shares, (stated at liquidation preference $25,000 per share), 6,000 shares issued and outstanding | 150,000 | 150,000 | |||||||||
| 5.417% Series 1 Cumulative Convertible Preferred Shares, (stated at liquidation preference $25 per share), 399,896 shares issued and outstanding | 9,997 | 9,997 | |||||||||
| Common shares of beneficial interest, $.01 par, 100,000,000 shares authorized, 76,727,394 and 75,540,804 shares issued and outstanding, respectively | 771 | 759 | |||||||||
| Additional paid-in capital | 3,297,305 | 3,166,522 | |||||||||
| Accumulated dividends in excess of net income | (988,272) | (791,124) | |||||||||
| Accumulated other comprehensive loss | (5,644) | (813) | |||||||||
| Total shareholders’ equity of the Trust | 2,464,157 | 2,535,341 | |||||||||
| Noncontrolling interests | 84,590 | 100,791 | |||||||||
| Total shareholders’ equity | 2,548,747 | 2,636,132 | |||||||||
| TOTAL LIABILITIES AND SHAREHOLDERS’ EQUITY | $ | 7,607,624 | $ | 6,794,992 | |||||||
9
| Federal Realty Investment Trust | ||||||||||||||||||||||||||
| Funds From Operations / Dividend Information | ||||||||||||||||||||||||||
| December 31, 2020 | ||||||||||||||||||||||||||
| Three Months Ended | Year Ended | |||||||||||||||||||||||||
| December 31, | December 31, | |||||||||||||||||||||||||
| 2020 | 2019 | 2020 | 2019 | |||||||||||||||||||||||
| (in thousands, except per share data) | ||||||||||||||||||||||||||
| Funds from Operations available for common shareholders (FFO) (1) | ||||||||||||||||||||||||||
| Net income | $ | 102,211 | $ | 148,966 | $ | 135,888 | $ | 360,542 | ||||||||||||||||||
| Net income attributable to noncontrolling interests | (7,486) | (1,611) | (4,182) | (6,676) | ||||||||||||||||||||||
| Gain on sale of real estate, net of tax | (80,240) | (85,903) | (91,922) | (116,393) | ||||||||||||||||||||||
| Impairment charge, net (2) | — | — | 50,728 | — | ||||||||||||||||||||||
| Depreciation and amortization of real estate assets | 57,972 | 54,886 | 228,850 | 215,139 | ||||||||||||||||||||||
| Amortization of initial direct costs of leases | 4,853 | 5,194 | 20,415 | 19,359 | ||||||||||||||||||||||
| Funds from operations | 77,310 | 121,532 | 339,777 | 471,971 | ||||||||||||||||||||||
| Dividends on preferred shares (3) | (2,011) | (1,875) | (8,042) | (7,500) | ||||||||||||||||||||||
| Income attributable to operating partnership units (4) | — | 655 | 3,151 | 2,703 | ||||||||||||||||||||||
| Income attributable to unvested shares | (247) | (351) | (1,037) | (1,355) | ||||||||||||||||||||||
| FFO (5) | $ | 75,052 | $ | 119,961 | $ | 333,849 | $ | 465,819 | ||||||||||||||||||
| Weighted average number of common shares, diluted (3)(4) | 75,898 | 76,024 | 76,261 | 75,514 | ||||||||||||||||||||||
| FFO per diluted share (5) | $ | 0.99 | $ | 1.58 | $ | 4.38 | $ | 6.17 | ||||||||||||||||||
| Dividends and Payout Ratios | ||||||||||||||||||||||||||
| Regular common dividends declared | $ | 81,322 | $ | 79,316 | $ | 320,302 | $ | 310,973 | ||||||||||||||||||
| Dividend payout ratio as a percentage of FFO | 108 | % | 66 | % | 96 | % | 67 | % | ||||||||||||||||||
Notes:
1)See Glossary of Terms.
2)Impairment charge relates to The Shops at Sunset Place and was recorded during the quarter ended September 30, 2020. Amount is net of the allocation to noncontrolling interests.
3)For the three months and year ended December 31, 2019, dividends on our Series 1 preferred stock were not deducted in the calculation of FFO available to common shareholders, as the related shares were dilutive and included in "weighted average common shares, diluted."
4)For the three months ended December 31, 2020, income attributable to operating partnership units is not added back in the calculation of FFO available to common shareholders, as the related shares are not dilutive and are not included in "weighted average common shares, diluted" for this period. For the year ended December 31, 2020 and the three months and year ended December 31, 2019, the weighted average common shares used to compute FFO per diluted common share include operating partnership units that were excluded from the computation of diluted EPS. Conversion of these operating partnership units is dilutive in the computation of FFO per diluted share but anti-dilutive for the computation of dilutive EPS for these periods.
5)FFO available for common shareholders for the year ended December 31, 2020 includes a $11.2 million charge related to early extinguishment of debt, and for the year ended December 31, 2019 includes an $11.9 million charge related to the buyout of the Kmart lease at Assembly Row Marketplace. If these charges were excluded, our FFO, FFO per diluted share, and dividend payout ratio as a percentage of FFO at each respective year end would have been:
| Three Months Ended | Year Ended | |||||||||||||||||||
| December 31, | December 31, | |||||||||||||||||||
| 2020 | 2020 | 2019 | ||||||||||||||||||
| (in thousands, except per share data) | ||||||||||||||||||||
| FFO | $ | 87,002 | $ | 344,994 | $ | 477,696 | ||||||||||||||
| FFO per diluted share | $ | 1.14 | $ | 4.52 | $ | 6.33 | ||||||||||||||
| Dividend payout ratio as a percentage of FFO | 93 | % | 93 | % | 65 | % | ||||||||||||||
10
| Federal Realty Investment Trust | ||||||||||||||||||||||||||
| Other Supplemental Information | ||||||||||||||||||||||||||
| December 31, 2020 | ||||||||||||||||||||||||||
| Three Months Ended | Year Ended | |||||||||||||||||||||||||
| December 31, | December 31, | |||||||||||||||||||||||||
| 2020 | 2019 | 2020 | 2019 | |||||||||||||||||||||||
| (in thousands, except per share data) | ||||||||||||||||||||||||||
| Summary of Capital Expenditures | ||||||||||||||||||||||||||
| Non-maintenance capital expenditures | ||||||||||||||||||||||||||
| Development, redevelopment and expansions | $ | 95,636 | $ | 89,241 | $ | 413,432 | $ | 361,290 | ||||||||||||||||||
| Tenant improvements and incentives | 15,182 | 19,256 | 52,844 | 59,477 | ||||||||||||||||||||||
| Total non-maintenance capital expenditures | 110,818 | 108,497 | 466,276 | 420,767 | ||||||||||||||||||||||
| Maintenance capital expenditures | 5,524 | 12,549 | 14,297 | 23,650 | ||||||||||||||||||||||
| Total capital expenditures | $ | 116,342 | $ | 121,046 | $ | 480,573 | $ | 444,417 | ||||||||||||||||||
| Noncontrolling Interests Supplemental Information (1) | ||||||||||||||||||||||||||
| Property operating income (2) | $ | 2,740 | $ | 2,961 | $ | 9,874 | $ | 12,152 | ||||||||||||||||||
| Gain on sale of real estate, net | 6,195 | — | 6,195 | — | ||||||||||||||||||||||
| Impairment charge | — | — | (6,490) | — | ||||||||||||||||||||||
| Depreciation and amortization | (1,539) | (1,467) | (6,027) | (5,944) | ||||||||||||||||||||||
| Interest expense | (699) | (538) | (2,521) | (2,235) | ||||||||||||||||||||||
| Net income | $ | 6,697 | $ | 956 | $ | 1,031 | $ | 3,973 | ||||||||||||||||||
Notes:
1)Amounts reflect the components of "net income attributable to noncontrolling interests," but excludes "income attributable to operating partnership units."
2)See Glossary of Terms.
11
| Federal Realty Investment Trust | ||||||||||||||||||||||||||
| COVID-19 Related Impacts | ||||||||||||||||||||||||||
| December 31, 2020 | ||||||||||||||||||||||||||
The following provides supplemental information regarding our collectibility related impacts resulting from COVID-19 for the three months ended December 31, 2020. The primary drivers of our collectibility impacts in the quarter are from tenants who we account for on a cash basis or converted to a cash basis of accounting during the quarter, as we did not receive full contractual rent payments, as well as COVID-19 related rent abatements. We change a tenant to a cash basis of accounting when we determine collection of substantially all lease payments during the lease term is not considered probable; revenue is then limited to the lesser of revenue recognized under accrual accounting or cash received. Our full revenue recognition policy with respect to leases can be found in Note 2 of our Annual Report on Form 10-K.
Collectibility Impacts for the Quarter Ended December 31, 2020
| Type | Accounts Receivable Impact | Straight-Line Rent Receivable Impact | Total | ||||||||||||||
| (in thousands) | |||||||||||||||||
| Tenants recognized on a cash basis prior to Q4 2020 (1) | $ | 10,347 | $ | — | $ | 10,347 | |||||||||||
| Changes in our collectibility assumptions in Q4 2020 and COVID-19 related disputes/abatements (2) | 7,047 | 1,551 | 8,598 | ||||||||||||||
| Total collectibility impact | $ | 17,394 | $ | 1,551 | $ | 18,945 | |||||||||||
Notes:
1)Approximately 85% of this impact is from restaurants, fitness, and entertainment tenants.
2)This balance reflects rent abatements granted as a result of COVID-19, as well as changes in assumptions of collectibility primarily due to the impacts of COVID-19. Approximately 55% of the impact is due to tenants where we do not believe it is probable we will collect the remaining contractual lease payments.
Other Information on Cash Basis Tenants
| As of December 31, 2020 | |||||||||||
| Total | % Recognized on a Cash Basis | ||||||||||
| Active commercial tenant leases | 2,785 | 35 | % | ||||||||
| Annualized base rent from commercial tenants (in millions) (3) | $ | 630 | 27 | % | |||||||
Components of Accounts Receivable, net
| As of December 31, 2020 | As of September 30, 2020 | As of June 30, 2020 | As of March 31, 2020 | ||||||||||||||||||||
| (in thousands) | |||||||||||||||||||||||
| Billed accounts receivable, net | $ | 32,571 | $ | 26,706 | $ | 37,149 | $ | 11,774 | |||||||||||||||
| Straight-line rent receivable, net | 103,291 | 102,867 | 100,673 | 104,440 | |||||||||||||||||||
| Other receivables | 23,918 | 35,309 | 29,819 | 37,029 | |||||||||||||||||||
| Total accounts receivable, net | $ | 159,780 | $ | 164,882 | $ | 167,641 | $ | 153,243 | |||||||||||||||
Rent Deferrals and Rent Abatements
| Contractual rent deferred (in millions) (4) | $ | 36 | |||
| Percent of deferred rent agreed to be repaid by December 31, 2021 | 85 | % | |||
| Contractual rent abated (in millions) (5) | $ | 37 | |||
Notes:
3)See Glossary of Terms.
4)Total contractual rent for April through December 2020 that has been deferred pursuant to modification agreements signed through January 31, 2021. Accrual basis tenants comprise approximately 61% of the deferred rent for the year ended December 31, 2020 for executed agreements in place as of January 31, 2021.
5)Total contractual rent for April through December 2020 that has been abated pursuant to modification agreements signed through January 31, 2021.
12
| Federal Realty Investment Trust | ||||||||||||||||||||||||||
| Components of Rental Income (1) | ||||||||||||||||||||||||||
| December 31, 2020 | ||||||||||||||||||||||||||
| Three Months Ended | Year Ended | |||||||||||||||||||||||||
| December 31, | December 31, | |||||||||||||||||||||||||
| 2020 | 2019 | 2020 | 2019 | |||||||||||||||||||||||
| (in thousands) | ||||||||||||||||||||||||||
| Minimum rents (2) | ||||||||||||||||||||||||||
| Commercial | $ | 158,618 | $ | 158,822 | $ | 627,557 | $ | 630,225 | ||||||||||||||||||
| Residential | 19,535 | 20,248 | 80,659 | 78,849 | ||||||||||||||||||||||
| Cost reimbursements | 46,139 | 46,351 | 175,977 | 174,936 | ||||||||||||||||||||||
| Percentage rents | 1,492 | 2,641 | 5,501 | 9,322 | ||||||||||||||||||||||
| Other | 10,094 | 11,437 | 36,336 | 43,885 | ||||||||||||||||||||||
| Collectibility related impact | $ | (17,394) | $ | (1,196) | $ | (93,859) | $ | (4,479) | ||||||||||||||||||
| Total rental income | $ | 218,484 | $ | 238,303 | $ | 832,171 | $ | 932,738 | ||||||||||||||||||
Notes:
1)All income from tenant leases is reported as a single line item called "rental income." We have provided the above supplemental information with a breakout of the contractual components of the rental income line, however, these breakouts are provided for informational purposes only and should be considered a non-GAAP presentation.
2)Minimum rents for the three months and year ended December 31, 2020 includes a $1.6 million and $12.7 million charge, respectively, for the write-off of straight-line receivables related to the impacts of the COVID-19 pandemic (see details on page 12). In total, minimum rents include the following:
| Three Months Ended | Year Ended | ||||||||||||||||||||||
| December 31, | December 31, | ||||||||||||||||||||||
| 2020 | 2019 | 2020 | 2019 | ||||||||||||||||||||
| (in millions) | |||||||||||||||||||||||
| Straight-line rents | $ | 1.7 | $ | 1.7 | $ | 4.5 | $ | 7.6 | |||||||||||||||
| Amortization of in-place leases | $ | 1.2 | $ | 1.2 | $ | 4.3 | $ | 6.4 | |||||||||||||||
13
| Federal Realty Investment Trust | |||||||||||||||||||||||||||||
| Comparable Property Information | |||||||||||||||||||||||||||||
| December 31, 2020 | |||||||||||||||||||||||||||||
| The following information is being provided for “Comparable Properties.” Comparable Properties represents our consolidated property portfolio other than those properties that distort comparability between periods in two primary categories: (1) assets that were not owned for the full quarter in both periods presented and (2) assets currently under development or being repositioned for significant redevelopment and investment. The assets excluded from Comparable Properties in Q4 include: Assembly Row - Phase 2 Retail and Phase 3, Cocowalk, The Commons at Darien, Pike & Rose Phase 2 Retail and Phase 3, 700 Santana Row, Freedom Plaza, a portion of Graham Park Plaza, and all properties acquired or disposed of from Q4 2019 to Q4 2020. Comparable Property property operating income ("Comparable Property POI") is a non-GAAP measure used by management in evaluating the operating performance of our properties period over period. However, given the impacts of COVID-19, management believes this metric is less relevant in the current environment, and is not necessarily indicative of results. The amounts shown below for the years ended December 31, 2020 and 2019 reflect the summation of our reported quarterly results during 2020. | |||||||||||||||||||||||||||||
| Reconciliation of GAAP operating income to Comparable Property POI | |||||||||||||||||||||||||||||
| Three Months Ended | Year Ended | ||||||||||||||||||||||||||||
| December 31, | December 31, | ||||||||||||||||||||||||||||
| 2020 | 2019 | 2020 | 2019 | ||||||||||||||||||||||||||
| (in thousands) | (in thousands) | ||||||||||||||||||||||||||||
| Operating Income | $ | 151,799 | $ | 176,221 | $ | 289,524 | $ | 470,911 | |||||||||||||||||||||
| Add: | |||||||||||||||||||||||||||||
| Depreciation and amortization | 64,424 | 61,431 | 255,027 | 239,758 | |||||||||||||||||||||||||
| General and administrative | 12,307 | 10,707 | 41,680 | 42,754 | |||||||||||||||||||||||||
| Impairment charge | — | — | 57,218 | — | |||||||||||||||||||||||||
| Gain on sale of real estate, net of tax | (86,435) | (85,903) | (98,117) | (116,393) | |||||||||||||||||||||||||
| Property operating income (POI) | 142,095 | 162,456 | 545,332 | 637,030 | |||||||||||||||||||||||||
| Less: Non-comparable POI - acquisitions/dispositions | (5,105) | (4,261) | (15,275) | (11,744) | |||||||||||||||||||||||||
| Less: Non-comparable POI - redevelopment, development & other | (7,835) | (4,873) | (23,504) | (10,191) | |||||||||||||||||||||||||
| Comparable Property POI | $ | 129,155 | $ | 153,322 | $ | 506,553 | $ | 615,095 | |||||||||||||||||||||
| Additional information regarding the components of Comparable Property POI | |||||||||||||||||||||||||||||
| Three Months Ended | Year Ended | ||||||||||||||||||||||||||||
| December 31, | December 31, | ||||||||||||||||||||||||||||
| 2020 | 2019 | % Change | 2020 | 2019 | % Change | ||||||||||||||||||||||||
| (in thousands) | (in thousands) | ||||||||||||||||||||||||||||
| Rental income | $ | 198,027 | $ | 223,855 | $ | 766,293 | $ | 880,282 | |||||||||||||||||||||
| Rental expenses | (43,015) | (43,523) | (151,690) | (160,878) | |||||||||||||||||||||||||
| Real estate taxes | (25,857) | (27,010) | (108,050) | (104,309) | |||||||||||||||||||||||||
| (68,872) | (70,533) | (259,740) | (265,187) | ||||||||||||||||||||||||||
| Comparable Property POI | $ | 129,155 | $ | 153,322 | (15.8) | % | $ | 506,553 | $ | 615,095 | (17.6) | % | |||||||||||||||||
| Comparable Property - Summary of Capital Expenditures (1) | |||||||||||||||||||||||||||||
| Three Months Ended | Year Ended | ||||||||||||||||||||||||||||
| December 31, | December 31, | ||||||||||||||||||||||||||||
| 2020 | 2019 | 2020 | 2019 | ||||||||||||||||||||||||||
| (in thousands) | (in thousands) | ||||||||||||||||||||||||||||
| Redevelopment and tenant improvements and incentives | $ | 27,773 | $ | 41,209 | $ | 118,884 | $ | 119,703 | |||||||||||||||||||||
| Maintenance capital expenditures | 5,257 | 12,263 | 13,661 | 22,649 | |||||||||||||||||||||||||
| $ | 33,030 | $ | 53,472 | $ | 132,545 | $ | 142,352 | ||||||||||||||||||||||
| Comparable Property - Occupancy Statistics (2) | |||||||||||||||||||||||||||||
| At December 31, | |||||||||||||||||||||||||||||
| 2020 | 2019 | ||||||||||||||||||||||||||||
| GLA - comparable commercial properties | 22,118,000 | 22,151,000 | |||||||||||||||||||||||||||
| Leased % - comparable commercial properties | 92.1 | % | 95.1 | % | |||||||||||||||||||||||||
| Occupancy % - comparable commercial properties | 90.1 | % | 93.4 | % | |||||||||||||||||||||||||
Notes:
1)See page 11 for "Summary of Capital Expenditures" for our entire portfolio.
2)See page 30 for entire portfolio occupancy statistics.
14
| Federal Realty Investment Trust | |||||||||||||||||
| Market Data | |||||||||||||||||
| December 31, 2020 | |||||||||||||||||
| December 31, | |||||||||||||||||
| 2020 | 2019 | ||||||||||||||||
| (in thousands, except per share data) | |||||||||||||||||
| Market Data | |||||||||||||||||
| Common shares outstanding and operating partnership units (1) | 77,472 | 76,150 | |||||||||||||||
| Market price per common share | $ | 85.12 | $ | 128.73 | |||||||||||||
| Common equity market capitalization including operating partnership units | $ | 6,594,417 | $ | 9,802,790 | |||||||||||||
| Series C preferred shares outstanding | 6 | 6 | |||||||||||||||
| Liquidation price per Series C preferred share | $ | 25,000.00 | $ | 25,000.00 | |||||||||||||
| Series C preferred equity market capitalization | $ | 150,000 | $ | 150,000 | |||||||||||||
| Series 1 preferred shares outstanding (2) | 400 | 400 | |||||||||||||||
| Liquidation price per Series 1 preferred share | $ | 25.00 | $ | 25.00 | |||||||||||||
| Series 1 preferred equity market capitalization | $ | 10,000 | $ | 10,000 | |||||||||||||
| Equity market capitalization | $ | 6,754,417 | $ | 9,962,790 | |||||||||||||
| Total debt | 4,291,375 | 3,356,594 | |||||||||||||||
| Less: cash and cash equivalents | (798,329) | (127,432) | |||||||||||||||
| Total net debt (3) | $ | 3,493,046 | $ | 3,229,162 | |||||||||||||
| Total market capitalization | $ | 10,247,463 | $ | 13,191,952 | |||||||||||||
| Total net debt to market capitalization at market price per common share | 34 | % | 24 | % | |||||||||||||
| Total net debt to market capitalization at constant common share price of $128.73 | 26 | % | 24 | % | |||||||||||||
Notes:
1)Amounts include 744,617 and 609,584 operating partnership units outstanding at December 31, 2020 and 2019, respectively.
2)These shares, issued March 8, 2007, are unregistered.
3)Total net debt includes mortgages payable, notes payable, senior notes and debentures, net of premiums/discounts and debt issuance costs and net of cash and cash equivalents from our consolidated balance sheet.
15
| Federal Realty Investment Trust | |||||||||||||||||||||||||||||||||||
| Summary of Outstanding Debt | |||||||||||||||||||||||||||||||||||
| December 31, 2020 | |||||||||||||||||||||||||||||||||||
| As of December 31, 2020 | |||||||||||||||||||||||||||||||||||
| Stated maturity date | Stated interest rate | Balance | Weighted average effective rate (8) | ||||||||||||||||||||||||||||||||
| (in thousands) | |||||||||||||||||||||||||||||||||||
| Mortgages payable (1) | |||||||||||||||||||||||||||||||||||
| Secured fixed rate | |||||||||||||||||||||||||||||||||||
| Sylmar Towne Center (2) | 6/6/2021 | 5.39% | $ | 16,236 | |||||||||||||||||||||||||||||||
| Plaza Del Sol | 12/1/2021 | 5.23% | 8,041 | ||||||||||||||||||||||||||||||||
| THE AVENUE at White Marsh | 1/1/2022 | 3.35% | 52,705 | ||||||||||||||||||||||||||||||||
| Montrose Crossing | 1/10/2022 | 4.20% | 65,596 | ||||||||||||||||||||||||||||||||
| Azalea | 11/1/2025 | 3.73% | 40,000 | ||||||||||||||||||||||||||||||||
| Bell Gardens | 8/1/2026 | 4.06% | 12,408 | ||||||||||||||||||||||||||||||||
| Plaza El Segundo | 6/5/2027 | 3.83% | 125,000 | ||||||||||||||||||||||||||||||||
| The Grove at Shrewsbury (East) | 9/1/2027 | 3.77% | 43,600 | ||||||||||||||||||||||||||||||||
| Brook 35 | 7/1/2029 | 4.65% | 11,500 | ||||||||||||||||||||||||||||||||
| Hoboken (24 Buildings) (3) | 12/15/2029 | LIBOR + 1.95% | 56,450 | ||||||||||||||||||||||||||||||||
| Various Hoboken (14 Buildings) | Various through 2029 | Various (4) | 32,705 | ||||||||||||||||||||||||||||||||
| Chelsea | 1/15/2031 | 5.36% | 5,234 | ||||||||||||||||||||||||||||||||
| Hoboken (1 Building) (5) | 7/1/2042 | 3.75% | 16,560 | ||||||||||||||||||||||||||||||||
| Subtotal | 486,035 | ||||||||||||||||||||||||||||||||||
| Net unamortized premium and debt issuance costs | (1,924) | ||||||||||||||||||||||||||||||||||
| Total mortgages payable, net | 484,111 | 3.97 | % | ||||||||||||||||||||||||||||||||
| Notes payable | |||||||||||||||||||||||||||||||||||
| Term loan | 5/6/2021 | LIBOR + 1.35% | 400,000 | ||||||||||||||||||||||||||||||||
| Revolving credit facility (6) | 1/19/2024 | LIBOR + 0.775% | — | ||||||||||||||||||||||||||||||||
| Various | Various through 2028 | 11.31% | 3,270 | ||||||||||||||||||||||||||||||||
| Subtotal | 403,270 | ||||||||||||||||||||||||||||||||||
| Net unamortized debt issuance costs | (494) | ||||||||||||||||||||||||||||||||||
| Total notes payable, net | 402,776 | 2.00 | % | (9) | |||||||||||||||||||||||||||||||
| Senior notes and debentures | |||||||||||||||||||||||||||||||||||
| Unsecured fixed rate | |||||||||||||||||||||||||||||||||||
| 2.75% notes | 6/1/2023 | 2.75% | 275,000 | ||||||||||||||||||||||||||||||||
| 3.95% notes | 1/15/2024 | 3.95% | 600,000 | ||||||||||||||||||||||||||||||||
| 1.25% notes | 2/15/2026 | 1.25% | 400,000 | ||||||||||||||||||||||||||||||||
| 7.48% debentures | 8/15/2026 | 7.48% | 29,200 | ||||||||||||||||||||||||||||||||
| 3.25% notes | 7/15/2027 | 3.25% | 475,000 | ||||||||||||||||||||||||||||||||
| 6.82% medium term notes | 8/1/2027 | 6.82% | 40,000 | ||||||||||||||||||||||||||||||||
| 3.20% notes | 6/15/2029 | 3.20% | 400,000 | ||||||||||||||||||||||||||||||||
| 3.50% notes | 6/1/2030 | 3.50% | 400,000 | ||||||||||||||||||||||||||||||||
| 4.50% notes | 12/1/2044 | 4.50% | 550,000 | ||||||||||||||||||||||||||||||||
| 3.625% notes | 8/1/2046 | 3.63% | 250,000 | ||||||||||||||||||||||||||||||||
| Subtotal | 3,419,200 | ||||||||||||||||||||||||||||||||||
| Net unamortized discount and debt issuance costs | (14,712) | ||||||||||||||||||||||||||||||||||
| Total senior notes and debentures, net | 3,404,488 | 3.48 | % | ||||||||||||||||||||||||||||||||
| Total debt, net | $ | 4,291,375 | (7) | ||||||||||||||||||||||||||||||||
| Total fixed rate debt, net | $ | 3,891,815 | 91 | % | 3.54 | % | |||||||||||||||||||||||||||||
| Total variable rate debt, net | 399,560 | 9 | % | 1.92 | % | (9) | |||||||||||||||||||||||||||||
| Total debt, net | $ | 4,291,375 | 100 | % | 3.39 | % | (9) | ||||||||||||||||||||||||||||
16
| Three Months Ended | Year Ended | ||||||||||||||||||||||
| December 31, | December 31, | ||||||||||||||||||||||
| 2020 | 2019 | 2020 | 2019 | ||||||||||||||||||||
| Operational Statistics | |||||||||||||||||||||||
| Excluding early extinguishment of debt: | |||||||||||||||||||||||
| Ratio of EBITDAre to combined fixed charges and preferred share dividends (10) | 2.76x | 4.17x | 2.90x | 4.16x | |||||||||||||||||||
| Including early extinguishment of debt: | |||||||||||||||||||||||
| Ratio of EBITDAre to combined fixed charges and preferred share dividends (10) (11) | 2.23x | 4.17x | 2.72x | 4.16x | |||||||||||||||||||
Notes:
1)Mortgages payable does not include our share of debt on our unconsolidated real estate partnerships. At December 31, 2020, our share of unconsolidated debt was approximately $53.3 million, of which $25.2 million was repaid on January 4, 2021 when we acquired our partner's 20% interest in our joint venture arrangement related to the Pike & Rose hotel. See page 22 for additional information on this transaction. At December 31, 2020, our noncontrolling interests' share of mortgages payable was $47.8 million.
2)This mortgage loan was repaid prior to its original maturity date on February 5, 2021, at par.
3)We have two interest rate swap agreements that fix the interest rate on the mortgage loan at 3.67%.
4)The interest rates on these mortgages range from 3.91% to 5.00%.
5)This mortgage loan has a fixed interest rate, however, the rate resets every five years until maturity. The current interest rate is fixed until July 1, 2022 and the loan is prepayable at par anytime after this date.
6)During the three months ended December 31, 2020, there were no borrowings on our revolving credit facility.
7)The weighted average remaining term on our mortgages payable, notes payable, and senior notes and debentures, is 9 years.
8)The weighted average effective interest rate includes the amortization of any debt issuance costs and discounts and premiums if applicable, except as described in Note 9.
9)The weighted average effective interest rate excludes $0.6 million in quarterly financing fees and debt fee amortization on our revolving credit facility.
10)Fixed charges consist of interest on borrowed funds (including capitalized interest), amortization of debt discount/premium and debt costs, and the portion of rent expense representing an interest factor. EBITDAre is reconciled to net income in the Glossary of Terms.
11)The ratio of EBITDAre to combined fixed charges and preferred share dividends for the year ended December 31, 2019 includes the $11.9 million charge related to the buyout of the Kmart lease at Assembly Square Marketplace. Excluding the $11.9 million charge related to the buyout of the Kmart lease at Assembly Square Marketplace in 2019, our ratio of EBITDAre to combined fixed charges and preferred share dividends would have been 4.24x.
17
| Federal Realty Investment Trust | ||||||||||||||||||||||||||||||||||||||
| Summary of Debt Maturities | ||||||||||||||||||||||||||||||||||||||
| December 31, 2020 | ||||||||||||||||||||||||||||||||||||||
| Year | Scheduled Amortization | Maturities | Total | Percent of Debt Maturing | Cumulative Percent of Debt Maturing | Weighted Average Rate (3) | ||||||||||||||||||||||||||||||||
| (in thousands) | ||||||||||||||||||||||||||||||||||||||
| 2021 | $ | 4,856 | $ | 423,921 | (1) | $ | 428,777 | 9.9 | % | 9.9 | % | 2.1 | % | |||||||||||||||||||||||||
| 2022 | 4,134 | 116,323 | 120,457 | 2.8 | % | 12.7 | % | 3.9 | % | |||||||||||||||||||||||||||||
| 2023 | 4,314 | 275,000 | 279,314 | 6.5 | % | 19.2 | % | 3.0 | % | |||||||||||||||||||||||||||||
| 2024 | 4,344 | 600,000 | 604,344 | 14.0 | % | 33.2 | % | 3.7 | % | (4) | ||||||||||||||||||||||||||||
| 2025 | 4,068 | 44,298 | 48,366 | 1.1 | % | 34.3 | % | 3.9 | % | |||||||||||||||||||||||||||||
| 2026 | 3,465 | 452,450 | 455,915 | 10.6 | % | 44.9 | % | 2.0 | % | |||||||||||||||||||||||||||||
| 2027 | 3,048 | 690,570 | 693,618 | 16.1 | % | 61.0 | % | 3.8 | % | |||||||||||||||||||||||||||||
| 2028 | 2,934 | — | 2,934 | 0.1 | % | 61.1 | % | 6.7 | % | |||||||||||||||||||||||||||||
| 2029 | 2,770 | 458,099 | 460,869 | 10.7 | % | 71.8 | % | 3.3 | % | |||||||||||||||||||||||||||||
| 2030 | 1,141 | 400,000 | 401,141 | 9.3 | % | 81.1 | % | 3.8 | % | |||||||||||||||||||||||||||||
| Thereafter | 6,871 | 805,899 | 812,770 | 18.9 | % | 100.0 | % | 4.2 | % | |||||||||||||||||||||||||||||
| Total | $ | 41,945 | $ | 4,266,560 | $ | 4,308,505 | (2) | 100.0 | % | |||||||||||||||||||||||||||||
Notes:
1)On May 6, 2020, we entered into a $400.0 million unsecured term loan, which matures on May 6, 2021. We have the option to extend the loan maturity one year to May 6, 2022.
2)The total debt maturities differs from the total reported on the consolidated balance sheet due to the unamortized net premium/discount and debt issuance costs on certain mortgage loans, note payable, and senior notes as of December 31, 2020.
3)The weighted average rate reflects the weighted average interest rate on debt maturing in the respective year.
4)The weighted average rate excludes $0.6 million in quarterly financing fees and debt fee amortization on our revolving credit facility, which had no balance outstanding at December 31, 2020. Our $1.0 billion revolving credit facility matures on January 19, 2024, plus two six month extensions at our option.
18
| Federal Realty Investment Trust | ||||||||||||||||||||
| Summary of Redevelopment Opportunities | ||||||||||||||||||||
| December 31, 2020 | ||||||||||||||||||||
| The following redevelopment opportunities have received or will shortly receive all necessary approvals to proceed and are actively being worked on by the Trust (1) | ||||||||||||||||||||
| Impacts of COVID-19 Pandemic: | ||||||||||||||||||||
| Information provided below reflects management’s best estimate based on current available information, however the completion of construction, final costs, return on investment, and timing of stabilization may be impacted by COVID-19. | ||||||||||||||||||||
| Projected | Projected | Cost to | Anticipated | |||||||||||||||||
| Property | Location | Opportunity | ROI (2) | Cost (1) | Date | Stabilization (3) | ||||||||||||||
| (in millions) | (in millions) | |||||||||||||||||||
| Project Stabilized in 2020 | ||||||||||||||||||||
| Wildwood | Bethesda, MD | 4,900 square foot south end building expansion and site improvements | 7 | % | $5 | $5 | Stabilized | |||||||||||||
| Total Project Stabilized in 2020 (3) (4) | 7 | % | $5 | $5 | ||||||||||||||||
| Active Redevelopment Projects | ||||||||||||||||||||
| The Commons at Darien | Darien, CT | Demolition of a 45,000 square foot anchor space to construct 75,000 square feet of new retail space, 122 rental apartments, and 720 parking spaces | 6 | % | $110 - $120 | $27 | 2023 | |||||||||||||
| Cocowalk | Coconut Grove, FL | Entire shopping center redevelopment to include: demolition of three story east wing of the property and construction of a 106,000 square foot 5-story office/retail building with 24,000 square feet of retail; complete renovation of the west wing. | 6 | % | $93 - $97 | $73 | 2021 | |||||||||||||
| Freedom Plaza (5) | Los Angeles, CA | Development of a new 113,000 square foot single-story grocery anchored neighborhood shopping center | 7 | % | $38 - $42 | $33 | 2021 | |||||||||||||
| Bala Cynwyd | Bala Cynwyd, PA | New 87 unit residential apartment building to be constructed on underutilized land behind our existing shopping center | 6 | % | $22 | $22 | 2021 | |||||||||||||
| 7021 Hollywood Blvd | Los Angeles, CA | Renovation of the center and three vacant spaces to accommodate a new 39,000 square foot anchor tenant | 9 | % | $19 | $15 | 2021 | |||||||||||||
| Melville Mall | Huntington, NY | Development of a new 15,000 square foot pad site consisting of two multi-tenant retail buildings | 8 | % | $11 | $9 | 2021 | |||||||||||||
| Lawrence Park | Broomall, PA | Full shopping center redevelopment to include expansion of Main Line Health into vacant lower level space, creation of 17,800 square feet of small shop space converted from vacated anchor space, and a façade renovation for the entire center | 8 | % | $10 | $5 | 2021 | |||||||||||||
| Flourtown | Flourtown, PA | Development of a new 4,550 square foot two-tenant pad building | 7 | % | $3 | $0 | 2021 | |||||||||||||
| Sylmar Towne Center | Sylmar, CA | Development of a new 3,800 square foot two-tenant pad building | 6 | % | $3 | $2 | 2021 | |||||||||||||
| Lawrence Park | Broomall, PA | New 2,000 square foot bank pad building | 8 | % | $2 | $0 | 2022 | |||||||||||||
| Total Active Redevelopment projects (4) | 6 | % | $311 - $329 | $186 | ||||||||||||||||
Notes:
(1) There is no guarantee that the Trust will ultimately complete any or all of these opportunities, that the Projected Return on Investment (ROI) or Projected Costs will be the amounts shown or that stabilization will occur as anticipated. The projected ROI and Projected Cost are management's best estimate based on current information and may change over time.
(2) Projected ROI for redevelopment projects generally reflects only the deal specific cash, unleveraged incremental Property Operating Income (POI) generated by the redevelopment and is calculated as Incremental POI divided by incremental cost. Incremental POI is the POI generated by the redevelopment after deducting rent being paid or management's estimate of rent to be paid for the redevelopment space and any other space taken out of service to accommodate the redevelopment. Projected ROI for redevelopment projects does NOT include peripheral impacts, such as the impact on future lease rollovers at the property or the impact on the long-term value of the property.
(3) Stabilization is generally the year in which 90% physical occupancy of the redeveloped space is achieved. Economic stabilization may occur at a later point in time.
(4) All subtotals and totals reflect cost weighted-average ROIs.
(5) Project formerly known as Jordan Downs Plaza. Cost to date and projected cost are net of the proceeds we will receive from our New Market Tax Credit structure. See Note 3 of our December 31, 2019 Form 10-K for additional information. Stabilization has been impacted by the COVID-19 pandemic.
19
| Federal Realty Investment Trust | ||||||||||||||||||||||||||
| Assembly Row, Pike & Rose, and Santana Row | ||||||||||||||||||||||||||
| December 31, 2020 | ||||||||||||||||||||||||||
| Impacts of COVID-19 Pandemic: | ||||||||||||||||||||||||||
| Information provided below reflects management’s best estimate based on current available information, however the completion of construction, final costs, return on investment, and timing of stabilization may be impacted by COVID-19. | ||||||||||||||||||||||||||
| Projected | Total | Costs to | ||||||||||||||||||||||||
| Property (1) | Opportunity | ROI (2) | Cost (3) | Date | Expected Opening Timeframe | |||||||||||||||||||||
| (in millions) | (in millions) | |||||||||||||||||||||||||
Assembly Row, Somerville, MA | ||||||||||||||||||||||||||
| Phase III | - 277,000 SF of office | 6% | $465 - 485 | $350 | 150,000 square feet of office space pre-leased | |||||||||||||||||||||
| - 500 residential units | Opening projected to begin in 2021 | |||||||||||||||||||||||||
| - 56,000 SF of retail | ||||||||||||||||||||||||||
| Future Phases | - 1.5M SF of commercial | TBD | TBD | |||||||||||||||||||||||
| - 329 residential units | ||||||||||||||||||||||||||
Pike & Rose, North Bethesda, MD | ||||||||||||||||||||||||||
| Phase III | - 212,000 SF of office | 6-7% | $128 - 135 | $102 | (4) | Openings began in Q3 2020 | ||||||||||||||||||||
| - 7,000 SF of retail | ||||||||||||||||||||||||||
| Future Phases | - 740,000 SF of commercial | TBD | TBD | |||||||||||||||||||||||
| - 741 residential units | ||||||||||||||||||||||||||
Santana Row, San Jose, CA | ||||||||||||||||||||||||||
| 700 Santana Row | - 301,000 SF of office | 8% | $212 | $202 | Office delivered in Q1 2020 | |||||||||||||||||||||
| - 20,000 SF of retail & 1,300 parking spaces | 11,000 square feet of retail has opened | |||||||||||||||||||||||||
| - Redevelopment of Santana Row Park including the installation of a new retail pavilion | Project stabilized | |||||||||||||||||||||||||
| Santana West | - 376,000 SF of office | 6-7% | $250 - 270 | $121 | Openings projected to begin in 2022 | |||||||||||||||||||||
| - 1,750 parking spaces | ||||||||||||||||||||||||||
| Future Phases | - 321,000 SF of commercial | TBD | TBD | |||||||||||||||||||||||
| - 395 residential units | ||||||||||||||||||||||||||
| - 604,000 SF of commercial across from Santana Row | ||||||||||||||||||||||||||
Notes:
| (1) | Anticipated opening dates, total cost, and projected return on investment (ROI) are subject to adjustment as a result of factors inherent in the development process, some of which may not be under the direct control of the Company. Refer to the Company's filings with the Securities and Exchange Commission on Form 10-K and Form 10-Q for other risk factors. | ||||
| (2) | Projected ROI for development projects reflects the unleveraged Property Operating Income (POI) generated by the development and is calculated as POI divided by cost. | ||||
| (3) | Projected costs for Assembly Row and Pike & Rose include an allocation of infrastructure costs for the entire project. Phase I of Santana West includes an allocation of infrastructure for the Santana West site. | ||||
| (4) | Federal Realty Investment Trust is leasing 45,000 square feet of office space at a market rent in Pike & Rose Phase III, which delivered in August 2020. Revenue related to this rent will be eliminated in the consolidated financial statements. | ||||
20
| Federal Realty Investment Trust | ||||||||||||||||||||
| Future Redevelopment Opportunities | ||||||||||||||||||||
| December 31, 2020 | ||||||||||||||||||||
| We have identified the following potential opportunities to create future shareholder value. Executing these opportunities could be subject to government approvals, tenant consents, market conditions, etc. Work on many of these new opportunities is in its preliminary stages and may not ultimately come to fruition. This list will change from time to time as we identify hurdles that cannot be overcome in the near term, and focus on those opportunities that are most likely to lead to the creation of shareholder value over time. | ||||||||||||||||||||
| Pad Site Opportunities - Opportunities to add both single tenant and multi-tenant stand alone pad buildings at existing retail properties. Many of these opportunities are "by right" and construction is awaiting appropriate retailer demand. | ||||||||||||||||||||
| Escondido Promenade | Escondido, CA | Mercer Mall | Lawrenceville, NJ | |||||||||||||||||
| Federal Plaza | Rockville, MD | Pan Am | Fairfax, VA | |||||||||||||||||
| Fresh Meadows | Queens, NY | Sylmar Towne Center | Sylmar, CA | |||||||||||||||||
| Property Expansion or Conversion - Opportunities at successful retail properties to convert previously underutilized land into new GLA and to convert other existing uses into more productive uses for the property. | ||||||||||||||||||||
| Barracks Road | Charlottesville, VA | Huntington | Huntington, NY | |||||||||||||||||
| Bethesda Row | Bethesda, MD | Plaza El Segundo | El Segundo, CA | |||||||||||||||||
| Dedham Plaza | Dedham, MA | Riverpoint Center | Chicago, IL | |||||||||||||||||
| Fourth Street | Berkeley, CA | Third Street Promenade | Santa Monica, CA | |||||||||||||||||
| Fairfax Junction | Fairfax, VA | Wildwood | Bethesda, MD | |||||||||||||||||
| Fresh Meadows | Queens, NY | Willow Grove | Willow Grove, PA | |||||||||||||||||
| Hastings Ranch Plaza | Pasadena, CA | |||||||||||||||||||
| Residential Opportunities - Opportunity to add residential units to existing retail and mixed-use properties. | ||||||||||||||||||||
| Barracks Road | Charlottesville, VA | Graham Park Plaza | Falls Church, VA | |||||||||||||||||
| Bala Cynwyd | Bala Cynwyd, PA | Village at Shirlington | Arlington, VA | |||||||||||||||||
| Longer Term Mixed-Use Opportunities | ||||||||||||||||||||
| Assembly Row (1) | Somerville, MA | Pike & Rose (2) | North Bethesda, MD | |||||||||||||||||
| Bala Cynwyd | Bala Cynwyd, PA | Santana Row (3) | San Jose, CA | |||||||||||||||||
| Pike 7 Plaza | Vienna, VA | Santana Row - Santana West (3) | San Jose, CA | |||||||||||||||||
| Notes: | ||||||||||||||||||||
| (1) | Assembly Row | Remaining entitlements after Phase II include approximately 1.5 million square feet of commercial-use buildings and 329 residential units. | ||||||||||||||||||
| (2) | Pike & Rose | Remaining entitlements after Phase II include approximately 740,000 square feet of commercial-use buildings, and 741 residential units. | ||||||||||||||||||
| (3) | Santana Row | Remaining entitlements include approximately 321,000 square feet of commercial space and 395 residential units, as well as approximately 604,000 square feet of commercial space on land we control across from Santana Row. | ||||||||||||||||||
21
| Federal Realty Investment Trust | |||||||||||||||||||||||||||||||||||
| Significant Property Acquisitions, Dispositions, and Other Transactions | |||||||||||||||||||||||||||||||||||
| December 31, 2020 | |||||||||||||||||||||||||||||||||||
2020 Significant Acquisitions
| Date | Property | City/State | GLA | Purchase Price | Principal Tenants | |||||||||||||||
| (in square feet) | (in millions) | |||||||||||||||||||
| January 10, 2020 | Westfair Shopping Center | Fairfax, Virginia | 49,000 | $ | 22.3 | Guitar Center | (1) | |||||||||||||
| February 12, 2020 | Hoboken (2 buildings) | Hoboken, New Jersey | 12,000 | $ | 14.3 | (2) | ||||||||||||||
(1) This acquisition was funded by 163,322 downREIT operating partnership units. This property is adjacent to, and will be operated as, part of our Fairfax Junction property.
(2) This acquisition is in addition to the 37 buildings previously acquired, and was completed through the joint venture that was founded in 2019, for which we own a 90% interest. The purchase price includes the assumption of $8.9 million of mortgage debt. These buildings include 6 residential units in addition to the commercial GLA listed above.
2020 Significant Dispositions
| Date | Property | City/State | GLA | Sales Price | |||||||||||||
| (in square feet) | (in millions) | ||||||||||||||||
| April 21, 2020 | Colorado Blvd (1 building) | Pasadena, California | 20,000 | $ | 16.1 | (3) | |||||||||||
| December 17, 2020 | Sam's Park & Shop | Washington, DC | 51,000 | $ | 39.0 | ||||||||||||
| December 28, 2020 | Eastgate Crossing | Chapel Hill, North Carolina | 158,000 | $ | 65.5 | ||||||||||||
| December 31, 2020 | The Shops at Sunset Place | Miami, Florida | 516,000 | $ | 65.5 | ||||||||||||
(3) This building included 12 residential units in addition to the commercial GLA listed above.
2020 and 2021 Other Transactions
| Date | Type | Property | City/State | Purchase Price | |||||||||||||
| (in millions) | |||||||||||||||||
| September 18, 2020 | Acquisition of mortgage loans | N/A | Rockville, Maryland | $ | 9.6 | ||||||||||||
| December 17, 2020 | Acquisition of partner interest | Plaza El Segundo | El Segundo, California | $ | 7.3 | (4) | |||||||||||
| January 4, 2021 | Acquisition of partner interest | Pike & Rose (hotel) | North Bethesda, Maryland | $ | 2.3 | (5) | |||||||||||
(4) As a result of this transaction, our ownership in this partnership is now 78.2%.
(5) The acquisition of our partner's 20% interest included the repayment of the $31.5 million mortgage loan. As a result of the transaction, we gained control of the hotel portion of this property, and effective January 4, 2021, we have consolidated this asset.
22
| Federal Realty Investment Trust | |||||||||||||||||||||||||||||||||||||||||
| Real Estate Status Report | |||||||||||||||||||||||||||||||||||||||||
| December 31, 2020 | |||||||||||||||||||||||||||||||||||||||||
| Property Name | MSA Description | Real Estate at Cost (1) | Mortgage/Finance Lease Liabilities (2) | Acreage | GLA (3) | % Leased (3) | % Occupied (3) | Average Rent PSF (4) | Residential Units | Grocery Anchor GLA | Grocery Anchor | Other Retail Tenants | |||||||||||||||||||||||||||||
| (in thousands) | (in thousands) | ||||||||||||||||||||||||||||||||||||||||
| Washington Metropolitan Area | |||||||||||||||||||||||||||||||||||||||||
| Barcroft Plaza | Washington-Arlington-Alexandria, DC-VA-MD-WV | $ | 49,455 | 10 | 113,000 | 92 | % | 92 | % | $27.15 | 46,000 | Harris Teeter | |||||||||||||||||||||||||||||
| Bethesda Row | Washington-Arlington-Alexandria, DC-VA-MD-WV | 244,352 | 17 | 529,000 | 96 | % | 93 | % | 55.08 | 180 | 40,000 | Giant Food | Apple / Equinox / Anthropologie / Multiple Restaurants | ||||||||||||||||||||||||||||
| Congressional Plaza | (5) | Washington-Arlington-Alexandria, DC-VA-MD-WV | 105,822 | 21 | 323,000 | 85 | % | 83 | % | 43.15 | 194 | 25,000 | The Fresh Market | Buy Buy Baby / Ulta / Barnes & Noble | |||||||||||||||||||||||||||
| Courthouse Center | Washington-Arlington-Alexandria, DC-VA-MD-WV | 7,064 | 2 | 37,000 | 81 | % | 81 | % | 21.61 | ||||||||||||||||||||||||||||||||
| Fairfax Junction | (6) | Washington-Arlington-Alexandria, DC-VA-MD-WV | 41,168 | 11 | 124,000 | 99 | % | 99 | % | 25.75 | 23,000 | Aldi | CVS / Planet Fitness | ||||||||||||||||||||||||||||
| Falls Plaza/Falls Plaza-East | Washington-Arlington-Alexandria, DC-VA-MD-WV | 16,112 | 10 | 144,000 | 92 | % | 91 | % | 36.66 | 51,000 | Giant Food | CVS / Staples | |||||||||||||||||||||||||||||
| Federal Plaza | Washington-Arlington-Alexandria, DC-VA-MD-WV | 70,846 | 18 | 249,000 | 96 | % | 92 | % | 39.02 | 14,000 | Trader Joe's | TJ Maxx / Micro Center / Ross Dress For Less | |||||||||||||||||||||||||||||
| Friendship Center | Washington-Arlington-Alexandria, DC-VA-MD-WV | 38,218 | 1 | 119,000 | 100 | % | 100 | % | 30.41 | Marshalls / Nordstrom Rack / DSW / Maggiano's | |||||||||||||||||||||||||||||||
| Gaithersburg Square | Washington-Arlington-Alexandria, DC-VA-MD-WV | 29,669 | 16 | 208,000 | 87 | % | 87 | % | 30.13 | Ross Dress For Less / Ashley Furniture HomeStore / CVS | |||||||||||||||||||||||||||||||
| Graham Park Plaza | Washington-Arlington-Alexandria, DC-VA-MD-WV | 36,652 | 19 | 132,000 | 86 | % | 86 | % | 38.42 | 58,000 | Giant Food | ||||||||||||||||||||||||||||||
| Idylwood Plaza | Washington-Arlington-Alexandria, DC-VA-MD-WV | 17,423 | 7 | 73,000 | 100 | % | 100 | % | 51.66 | 30,000 | Whole Foods | ||||||||||||||||||||||||||||||
| Laurel | Washington-Arlington-Alexandria, DC-VA-MD-WV | 60,645 | 26 | 360,000 | 95 | % | 89 | % | 22.90 | 61,000 | Giant Food | Marshalls / L.A. Fitness | |||||||||||||||||||||||||||||
| Leesburg Plaza | Washington-Arlington-Alexandria, DC-VA-MD-WV | 37,322 | 26 | 236,000 | 83 | % | 83 | % | 23.40 | 55,000 | Giant Food | Petsmart / Office Depot | |||||||||||||||||||||||||||||
| Montrose Crossing | Washington-Arlington-Alexandria, DC-VA-MD-WV | 164,982 | 65,596 | 36 | 368,000 | 93 | % | 85 | % | 32.99 | 73,000 | Giant Food | Marshalls / Home Depot Design Center / Old Navy / Bob's Discount Furniture | ||||||||||||||||||||||||||||
| Mount Vernon/South Valley/7770 Richmond Hwy | (6) | Washington-Arlington-Alexandria, DC-VA-MD-WV | 86,966 | 29 | 564,000 | 96 | % | 96 | % | 19.23 | 62,000 | Shoppers Food Warehouse | TJ Maxx / Home Depot / Bed, Bath & Beyond / Results Fitness | ||||||||||||||||||||||||||||
| Old Keene Mill | Washington-Arlington-Alexandria, DC-VA-MD-WV | 13,061 | 10 | 91,000 | 95 | % | 95 | % | 36.34 | 24,000 | Whole Foods | Walgreens / Planet Fitness | |||||||||||||||||||||||||||||
| Pan Am | Washington-Arlington-Alexandria, DC-VA-MD-WV | 30,047 | 25 | 228,000 | 98 | % | 98 | % | 27.75 | 65,000 | Safeway | Micro Center / CVS / Michaels | |||||||||||||||||||||||||||||
| Pentagon Row | Washington-Arlington-Alexandria, DC-VA-MD-WV | 107,177 | 14 | 297,000 | 94 | % | 93 | % | 37.47 | 45,000 | Harris Teeter | TJ Maxx / Bed, Bath & Beyond / DSW | |||||||||||||||||||||||||||||
| Pike & Rose | (7) | Washington-Arlington-Alexandria, DC-VA-MD-WV | 650,469 | 24 | 525,000 | 96 | % | 96 | % | 37.78 | 765 | iPic Theater / Porsche / Uniqlo / REI / Pinstripes / Multiple Restaurants | |||||||||||||||||||||||||||||
| Pike 7 Plaza | Washington-Arlington-Alexandria, DC-VA-MD-WV | 49,544 | 13 | 172,000 | 91 | % | 91 | % | 49.62 | TJ Maxx / DSW / Crunch Fitness / Staples | |||||||||||||||||||||||||||||||
| Plaza del Mercado | Washington-Arlington-Alexandria, DC-VA-MD-WV | 46,895 | 10 | 116,000 | 97 | % | 97 | % | 32.04 | 18,000 | Aldi | CVS / L.A. Fitness | |||||||||||||||||||||||||||||
| Quince Orchard | Washington-Arlington-Alexandria, DC-VA-MD-WV | 41,104 | 16 | 268,000 | 96 | % | 95 | % | 25.15 | 19,000 | Aldi | HomeGoods / L.A. Fitness / Staples | |||||||||||||||||||||||||||||
| Rockville Town Square | (8) | Washington-Arlington-Alexandria, DC-VA-MD-WV | 49,839 | 4,392 | 12 | 187,000 | 75 | % | 75 | % | 28.65 | 25,000 | Dawson's Market | CVS / Gold's Gym / Multiple Restaurants | |||||||||||||||||||||||||||
| Rollingwood Apartments | Washington-Arlington-Alexandria, DC-VA-MD-WV | 11,603 | 14 | N/A | 95 | % | 95 | % | N/A | 282 | |||||||||||||||||||||||||||||||
23
| Federal Realty Investment Trust | |||||||||||||||||||||||||||||||||||||||||
| Real Estate Status Report | |||||||||||||||||||||||||||||||||||||||||
| December 31, 2020 | |||||||||||||||||||||||||||||||||||||||||
| Property Name | MSA Description | Real Estate at Cost (1) | Mortgage/Finance Lease Liabilities (2) | Acreage | GLA (3) | % Leased (3) | % Occupied (3) | Average Rent PSF (4) | Residential Units | Grocery Anchor GLA | Grocery Anchor | Other Retail Tenants | |||||||||||||||||||||||||||||
| (in thousands) | (in thousands) | ||||||||||||||||||||||||||||||||||||||||
| Tower Shopping Center | Washington-Arlington-Alexandria, DC-VA-MD-WV | 22,726 | 12 | 111,000 | 88 | % | 88 | % | 26.11 | 26,000 | L.A. Mart | Talbots / Total Wine & More | |||||||||||||||||||||||||||||
| Tyson's Station | Washington-Arlington-Alexandria, DC-VA-MD-WV | 5,732 | 5 | 50,000 | 90 | % | 86 | % | 47.97 | 11,000 | Trader Joe's | ||||||||||||||||||||||||||||||
| Village at Shirlington | (8) | Washington-Arlington-Alexandria, DC-VA-MD-WV | 69,950 | 6,833 | 16 | 262,000 | 88 | % | 87 | % | 39.92 | 28,000 | Harris Teeter | AMC / Carlyle Grand Café | |||||||||||||||||||||||||||
| Wildwood Shopping Center | Washington-Arlington-Alexandria, DC-VA-MD-WV | 27,443 | 12 | 88,000 | 98 | % | 98 | % | 102.39 | 20,000 | Balducci's | CVS / Flower Child | |||||||||||||||||||||||||||||
| Total Washington Metropolitan Area | 2,132,286 | 432 | 5,974,000 | 93 | % | 91 | % | 35.26 | |||||||||||||||||||||||||||||||||
| California | |||||||||||||||||||||||||||||||||||||||||
| Azalea | (5) | Los Angeles-Long Beach-Anaheim, CA | 107,329 | 40,000 | 22 | 223,000 | 99 | % | 99 | % | 29.15 | Marshalls / Ross Dress for Less / Ulta / Michaels | |||||||||||||||||||||||||||||
| Bell Gardens | (5) | Los Angeles-Long Beach-Anaheim, CA | 111,024 | 12,408 | 32 | 330,000 | 92 | % | 92 | % | 22.77 | 67,000 | Food 4 Less | Marshalls / Ross Dress for Less / Bob's Discount Furniture | |||||||||||||||||||||||||||
| Colorado Blvd | Los Angeles-Long Beach-Anaheim, CA | 13,284 | 1 | 42,000 | 100 | % | 100 | % | 55.34 | Banana Republic / True Foods Kitchen | |||||||||||||||||||||||||||||||
| Crow Canyon Commons | San Francisco-Oakland-Hayward, CA | 90,731 | 22 | 243,000 | 98 | % | 87 | % | 29.89 | 32,000 | Sprouts | Total Wine & More / Rite Aid | |||||||||||||||||||||||||||||
| East Bay Bridge | San Francisco-Oakland-Hayward, CA | 179,227 | 32 | 440,000 | 99 | % | 99 | % | 19.04 | 59,000 | Pak-N-Save | Home Depot / Target / Nordstrom Rack | |||||||||||||||||||||||||||||
| Escondido Promenade | (5) | San Diego-Carlsbad, CA | 53,573 | 18 | 298,000 | 94 | % | 90 | % | 28.44 | TJ Maxx / Dick’s Sporting Goods / Ross Dress For Less / Bob's Discount Furniture | ||||||||||||||||||||||||||||||
| Fourth Street | (5) | San Francisco-Oakland-Hayward, CA | 26,972 | 3 | 71,000 | 78 | % | 72 | % | 31.61 | CB2 | ||||||||||||||||||||||||||||||
| Freedom Plaza (formerly known as Jordan Downs Plaza) | (5) (7) | Los Angeles-Long Beach-Anaheim, CA | 40,497 | 9 | 100,000 | 100 | % | 100 | % | 29.54 | 31,000 | Smart & Final | Nike / Blink Fitness / Ross Dress For Less | ||||||||||||||||||||||||||||
| Hastings Ranch Plaza | Los Angeles-Long Beach-Anaheim, CA | 25,266 | 15 | 273,000 | 100 | % | 99 | % | 7.88 | Marshalls / HomeGoods / CVS / Sears | |||||||||||||||||||||||||||||||
| Hollywood Blvd | Los Angeles-Long Beach-Anaheim, CA | 61,379 | 3 | 181,000 | 86 | % | 86 | % | 35.64 | Target / Marshalls / L.A. Fitness | |||||||||||||||||||||||||||||||
| Kings Court | (6) | San Jose-Sunnyvale-Santa Clara, CA | 11,608 | 8 | 81,000 | 100 | % | 100 | % | 40.93 | 31,000 | Lunardi's | CVS | ||||||||||||||||||||||||||||
| Old Town Center | San Jose-Sunnyvale-Santa Clara, CA | 37,869 | 8 | 98,000 | 84 | % | 82 | % | 43.07 | Anthropologie / Banana Republic / Gap | |||||||||||||||||||||||||||||||
| Olivo at Mission Hills | (5) | Los Angeles-Long Beach-Anaheim, CA | 81,283 | 12 | 155,000 | 94 | % | 92 | % | 31.13 | Target / 24 Hour Fitness / Ross Dress For Less | ||||||||||||||||||||||||||||||
| Plaza Del Sol | (5) | Los Angeles-Long Beach-Anaheim, CA | 17,910 | 8,041 | 4 | 48,000 | 96 | % | 96 | % | 24.01 | Marshalls | |||||||||||||||||||||||||||||
| Plaza El Segundo / The Point | (5) | Los Angeles-Long Beach-Anaheim, CA | 296,886 | 125,000 | 50 | 500,000 | 91 | % | 87 | % | 46.02 | 66,000 | Whole Foods | Nordstrom Rack / HomeGoods / Dick's Sporting Goods / Multiple Restaurants | |||||||||||||||||||||||||||
| San Antonio Center | (6) | San Jose-Sunnyvale-Santa Clara, CA | 46,576 | 22 | 211,000 | 100 | % | 92 | % | 15.71 | 11,000 | Trader Joe's | Walmart / 24 Hour Fitness | ||||||||||||||||||||||||||||
| Santana Row | San Jose-Sunnyvale-Santa Clara, CA | 1,151,098 | 45 | 1,197,000 | 96 | % | 95 | % | 53.60 | 662 | Crate & Barrel / H&M / Best Buy / Multiple Restaurants | ||||||||||||||||||||||||||||||
| Sylmar Towne Center | (5) | Los Angeles-Long Beach-Anaheim, CA | 45,660 | 16,236 | 12 | 148,000 | 93 | % | 88 | % | 16.11 | 43,000 | Food 4 Less | CVS | |||||||||||||||||||||||||||
| Third Street Promenade | Los Angeles-Long Beach-Anaheim, CA | 79,021 | 2 | 209,000 | 65 | % | 65 | % | 85.20 | adidas / Old Navy / J. Crew | |||||||||||||||||||||||||||||||
24
| Federal Realty Investment Trust | |||||||||||||||||||||||||||||||||||||||||
| Real Estate Status Report | |||||||||||||||||||||||||||||||||||||||||
| December 31, 2020 | |||||||||||||||||||||||||||||||||||||||||
| Property Name | MSA Description | Real Estate at Cost (1) | Mortgage/Finance Lease Liabilities (2) | Acreage | GLA (3) | % Leased (3) | % Occupied (3) | Average Rent PSF (4) | Residential Units | Grocery Anchor GLA | Grocery Anchor | Other Retail Tenants | |||||||||||||||||||||||||||||
| (in thousands) | (in thousands) | ||||||||||||||||||||||||||||||||||||||||
| Westgate Center | San Jose-Sunnyvale-Santa Clara, CA | 157,454 | 44 | 648,000 | 97 | % | 97 | % | 19.78 | Target / Nordstrom Rack / Nike Factory / TJ Maxx | |||||||||||||||||||||||||||||||
| Total California | 2,634,647 | 364 | 5,496,000 | 94 | % | 92 | % | 34.06 | |||||||||||||||||||||||||||||||||
| NY Metro/New Jersey | |||||||||||||||||||||||||||||||||||||||||
| Brick Plaza | New York-Newark-Jersey City, NY-NJ-PA | 102,848 | 46 | 408,000 | 91 | % | 79 | % | 22.83 | 14,000 | Trader Joe's | AMC / HomeGoods / Ulta / L.A. Fitness | |||||||||||||||||||||||||||||
| Brook 35 | (5) (6) | New York-Newark-Jersey City, NY-NJ-PA | 48,586 | 11,500 | 11 | 99,000 | 89 | % | 89 | % | 38.59 | Banana Republic / Gap / Williams-Sonoma | |||||||||||||||||||||||||||||
| Fresh Meadows | New York-Newark-Jersey City, NY-NJ-PA | 93,753 | 17 | 409,000 | 95 | % | 94 | % | 36.04 | 15,000 | Island of Gold | AMC / Kohl's / Michaels | |||||||||||||||||||||||||||||
| Georgetowne Shopping Center | New York-Newark-Jersey City, NY-NJ-PA | 83,257 | 9 | 147,000 | 88 | % | 88 | % | 40.34 | 43,000 | Foodway | Five Below / IHOP | |||||||||||||||||||||||||||||
| Greenlawn Plaza | New York-Newark-Jersey City, NY-NJ-PA | 32,272 | 13 | 102,000 | 94 | % | 94 | % | 18.97 | 46,000 | Greenlawn Farms | Tuesday Morning / Planet Fitness | |||||||||||||||||||||||||||||
| Greenwich Avenue | Bridgeport-Stamford-Norwalk, CT | 23,748 | 1 | 35,000 | 100 | % | 100 | % | 96.19 | Saks Fifth Avenue | |||||||||||||||||||||||||||||||
| Hauppauge | New York-Newark-Jersey City, NY-NJ-PA | 29,882 | 15 | 133,000 | 74 | % | 74 | % | 34.78 | 61,000 | Shop Rite | ||||||||||||||||||||||||||||||
| Hoboken | (5) (10) | New York-Newark-Jersey City, NY-NJ-PA | 215,841 | 105,715 | 3 | 171,000 | 92 | % | 91 | % | 55.76 | 129 | CVS / New York Sports Club / Sephora / Multiple Restaurants | ||||||||||||||||||||||||||||
| Huntington | New York-Newark-Jersey City, NY-NJ-PA | 47,806 | 21 | 266,000 | 90 | % | 73 | % | 23.74 | Nordstrom Rack / Buy Buy Baby / Michaels / Ulta | |||||||||||||||||||||||||||||||
| Huntington Square | New York-Newark-Jersey City, NY-NJ-PA | 13,612 | 18 | 74,000 | 83 | % | 83 | % | 29.63 | Barnes & Noble | |||||||||||||||||||||||||||||||
| Melville Mall | New York-Newark-Jersey City, NY-NJ-PA | 103,665 | 21 | 243,000 | 100 | % | 100 | % | 27.30 | 53,000 | Uncle Giuseppe's Marketplace | Marshalls / Dick's Sporting Goods / Field & Stream / Macy's Backstage | |||||||||||||||||||||||||||||
| Mercer Mall | (8) | Trenton, NJ | 128,305 | 55,300 | 50 | 551,000 | 87 | % | 87 | % | 26.13 | 75,000 | Shop Rite | Ross Dress For Less / Nordstrom Rack / Bed, Bath & Beyond / REI | |||||||||||||||||||||||||||
| The Commons at Darien | Bridgeport-Stamford-Norwalk, CT | 75,928 | 9 | 58,000 | 89 | % | 89 | % | 35.70 | 2 | Equinox / Walgreens | ||||||||||||||||||||||||||||||
| The Grove at Shrewsbury | (5) (6) | New York-Newark-Jersey City, NY-NJ-PA | 127,133 | 43,600 | 21 | 192,000 | 95 | % | 95 | % | 48.35 | Lululemon / Anthropologie / Pottery Barn / Williams-Sonoma | |||||||||||||||||||||||||||||
| Troy | New York-Newark-Jersey City, NY-NJ-PA | 41,019 | 19 | 211,000 | 100 | % | 99 | % | 23.21 | Target / L.A. Fitness / Michaels | |||||||||||||||||||||||||||||||
| Total NY Metro/New Jersey | 1,167,655 | 274 | 3,099,000 | 91 | % | 88 | % | 32.32 | |||||||||||||||||||||||||||||||||
| Philadelphia Metropolitan Area | |||||||||||||||||||||||||||||||||||||||||
| Andorra | Philadelphia-Camden-Wilmington, PA-NJ-DE-MD | 30,926 | 22 | 270,000 | 88 | % | 79 | % | 14.34 | 24,000 | Acme Markets | Kohl's / L.A. Fitness | |||||||||||||||||||||||||||||
| Bala Cynwyd | Philadelphia-Camden-Wilmington, PA-NJ-DE-MD | 64,478 | 23 | 294,000 | 97 | % | 97 | % | 25.72 | 87 | 45,000 | Acme Markets | Lord & Taylor / Michaels / L.A. Fitness | ||||||||||||||||||||||||||||
| Ellisburg | Philadelphia-Camden-Wilmington, PA-NJ-DE-MD | 34,209 | 28 | 261,000 | 79 | % | 78 | % | 17.93 | 47,000 | Whole Foods | Buy Buy Baby | |||||||||||||||||||||||||||||
| Flourtown | Philadelphia-Camden-Wilmington, PA-NJ-DE-MD | 16,933 | 24 | 156,000 | 98 | % | 98 | % | 23.61 | 75,000 | Giant Food | Movie Tavern | |||||||||||||||||||||||||||||
| Langhorne Square | Philadelphia-Camden-Wilmington, PA-NJ-DE-MD | 22,662 | 21 | 223,000 | 94 | % | 91 | % | 16.69 | 55,000 | Redner's Warehouse Markets | Marshalls / Planet Fitness | |||||||||||||||||||||||||||||
25
| Federal Realty Investment Trust | |||||||||||||||||||||||||||||||||||||||||
| Real Estate Status Report | |||||||||||||||||||||||||||||||||||||||||
| December 31, 2020 | |||||||||||||||||||||||||||||||||||||||||
| Property Name | MSA Description | Real Estate at Cost (1) | Mortgage/Finance Lease Liabilities (2) | Acreage | GLA (3) | % Leased (3) | % Occupied (3) | Average Rent PSF (4) | Residential Units | Grocery Anchor GLA | Grocery Anchor | Other Retail Tenants | |||||||||||||||||||||||||||||
| (in thousands) | (in thousands) | ||||||||||||||||||||||||||||||||||||||||
| Lawrence Park | Philadelphia-Camden-Wilmington, PA-NJ-DE-MD | 41,197 | 29 | 363,000 | 98 | % | 85 | % | 22.81 | 53,000 | Acme Markets | TJ Maxx / HomeGoods / Barnes & Noble | |||||||||||||||||||||||||||||
| Northeast | Philadelphia-Camden-Wilmington, PA-NJ-DE-MD | 33,636 | 15 | 227,000 | 82 | % | 82 | % | 18.82 | Marshalls / Ulta / Skechers / Crunch Fitness | |||||||||||||||||||||||||||||||
| Town Center of New Britain | Philadelphia-Camden-Wilmington, PA-NJ-DE-MD | 16,582 | 17 | 125,000 | 84 | % | 84 | % | 9.18 | 36,000 | Giant Food | Rite Aid / Dollar Tree | |||||||||||||||||||||||||||||
| Willow Grove | Philadelphia-Camden-Wilmington, PA-NJ-DE-MD | 29,273 | 13 | 183,000 | 78 | % | 78 | % | 18.44 | Marshalls / HomeGoods / Barnes & Noble | |||||||||||||||||||||||||||||||
| Wynnewood | Philadelphia-Camden-Wilmington, PA-NJ-DE-MD | 42,636 | 14 | 249,000 | 93 | % | 93 | % | 28.81 | 9 | 98,000 | Giant Food | Bed, Bath & Beyond / Old Navy / DSW | ||||||||||||||||||||||||||||
| Total Philadelphia Metropolitan Area | 332,532 | 206 | 2,351,000 | 90 | % | 87 | % | 20.60 | |||||||||||||||||||||||||||||||||
| New England | |||||||||||||||||||||||||||||||||||||||||
| Assembly Row / Assembly Square Marketplace | (7) | Boston-Cambridge-Newton, MA-NH | 960,329 | 65 | 824,000 | 95 | % | 94 | % | 32.45 | 447 | 18,000 | Trader Joe's | TJ Maxx / AMC / LEGOLAND Discovery Center / Multiple Restaurants | |||||||||||||||||||||||||||
| Campus Plaza | Boston-Cambridge-Newton, MA-NH | 30,448 | 15 | 114,000 | 96 | % | 96 | % | 17.21 | 46,000 | Roche Bros. | Burlington | |||||||||||||||||||||||||||||
| Chelsea Commons | Boston-Cambridge-Newton, MA-NH | 30,565 | 5,234 | 37 | 222,000 | 93 | % | 93 | % | 12.92 | Home Depot / Planet Fitness | ||||||||||||||||||||||||||||||
| Dedham Plaza | Boston-Cambridge-Newton, MA-NH | 47,143 | 19 | 245,000 | 90 | % | 88 | % | 16.56 | 80,000 | Star Market | Planet Fitness | |||||||||||||||||||||||||||||
| Linden Square | Boston-Cambridge-Newton, MA-NH | 150,356 | 19 | 220,000 | 90 | % | 89 | % | 50.21 | 7 | 50,000 | Roche Bros. | CVS | ||||||||||||||||||||||||||||
| North Dartmouth | Providence-Warwick, RI-MA | 9,369 | 28 | 48,000 | 100 | % | 100 | % | 15.31 | 48,000 | Stop & Shop | ||||||||||||||||||||||||||||||
| Queen Anne Plaza | Boston-Cambridge-Newton, MA-NH | 18,430 | 17 | 149,000 | 95 | % | 95 | % | 19.36 | 50,000 | Big Y Foods | TJ Maxx / HomeGoods | |||||||||||||||||||||||||||||
| Saugus Plaza | Boston-Cambridge-Newton, MA-NH | 17,254 | 15 | 166,000 | 100 | % | 100 | % | 17.22 | 55,000 | Super Stop & Shop | Floor & Décor | |||||||||||||||||||||||||||||
| Total New England | 1,263,894 | 215 | 1,988,000 | 94 | % | 94 | % | 26.62 | |||||||||||||||||||||||||||||||||
| Baltimore | |||||||||||||||||||||||||||||||||||||||||
| Governor Plaza | Baltimore-Columbia-Towson, MD | 26,245 | 24 | 242,000 | 79 | % | 79 | % | 21.26 | 16,500 | Aldi | Dick's Sporting Goods | |||||||||||||||||||||||||||||
| Perring Plaza | Baltimore-Columbia-Towson, MD | 31,898 | 29 | 397,000 | 87 | % | 87 | % | 15.50 | 58,000 | Shoppers Food Warehouse | Home Depot / Micro Center / Burlington | |||||||||||||||||||||||||||||
| THE AVENUE at White Marsh | (6) | Baltimore-Columbia-Towson, MD | 122,453 | 52,705 | 35 | 315,000 | 85 | % | 84 | % | 26.16 | AMC / Ulta / Old Navy / Barnes & Noble | |||||||||||||||||||||||||||||
| The Shoppes at Nottingham Square | Baltimore-Columbia-Towson, MD | 18,344 | 4 | 32,000 | 96 | % | 96 | % | 50.44 | ||||||||||||||||||||||||||||||||
| Towson Residential (Flats @ 703) | Baltimore-Columbia-Towson, MD | 22,391 | 1 | 4,000 | 100 | % | 100 | % | 82.83 | 105 | |||||||||||||||||||||||||||||||
| White Marsh Plaza | Baltimore-Columbia-Towson, MD | 26,388 | 7 | 79,000 | 94 | % | 94 | % | 21.88 | 54,000 | Giant Food | ||||||||||||||||||||||||||||||
| White Marsh Other | Baltimore-Columbia-Towson, MD | 31,715 | 18 | 70,000 | 97 | % | 97 | % | 32.33 | ||||||||||||||||||||||||||||||||
| Total Baltimore | 279,434 | 118 | 1,139,000 | 86 | % | 86 | % | 22.52 | |||||||||||||||||||||||||||||||||
26
| Federal Realty Investment Trust | |||||||||||||||||||||||||||||||||||||||||
| Real Estate Status Report | |||||||||||||||||||||||||||||||||||||||||
| December 31, 2020 | |||||||||||||||||||||||||||||||||||||||||
| Property Name | MSA Description | Real Estate at Cost (1) | Mortgage/Finance Lease Liabilities (2) | Acreage | GLA (3) | % Leased (3) | % Occupied (3) | Average Rent PSF (4) | Residential Units | Grocery Anchor GLA | Grocery Anchor | Other Retail Tenants | |||||||||||||||||||||||||||||
| (in thousands) | (in thousands) | ||||||||||||||||||||||||||||||||||||||||
| South Florida | |||||||||||||||||||||||||||||||||||||||||
| Cocowalk | (5) (9) | Miami-Fort Lauderdale-West Palm Beach, FL | 180,033 | 3 | 187,000 | 87 | % | 72 | % | 38.99 | Cinepolis Theaters / Youfit Health Club / Planta Restaurant | ||||||||||||||||||||||||||||||
| Del Mar Village | Miami-Fort Lauderdale-West Palm Beach, FL | 73,763 | 17 | 187,000 | 88 | % | 88 | % | 20.56 | 44,000 | Winn Dixie | CVS / L.A. Fitness | |||||||||||||||||||||||||||||
| Tower Shops | Miami-Fort Lauderdale-West Palm Beach, FL | 98,264 | 67 | 425,000 | 95 | % | 92 | % | 25.40 | 12,000 | Trader Joe's | TJ Maxx / Ross Dress For Less / Best Buy / Ulta | |||||||||||||||||||||||||||||
| Total South Florida | 352,060 | 87 | 799,000 | 91 | % | 87 | % | 26.87 | |||||||||||||||||||||||||||||||||
| Chicago | |||||||||||||||||||||||||||||||||||||||||
| Crossroads | Chicago-Naperville-Elgin, IL-IN-WI | 35,895 | 14 | 168,000 | 92 | % | 92 | % | 23.37 | L.A. Fitness / Ulta / Binny's / Ferguson's Bath, Kitchen & Lighting Gallery | |||||||||||||||||||||||||||||||
| Finley Square | Chicago-Naperville-Elgin, IL-IN-WI | 41,399 | 21 | 280,000 | 91 | % | 91 | % | 16.54 | Bed, Bath & Beyond / Buy Buy Baby / Michaels / Portillo's | |||||||||||||||||||||||||||||||
| Garden Market | Chicago-Naperville-Elgin, IL-IN-WI | 14,876 | 11 | 139,000 | 99 | % | 99 | % | 14.34 | 63,000 | Mariano's Fresh Market | Walgreens | |||||||||||||||||||||||||||||
| Riverpoint Center | Chicago-Naperville-Elgin, IL-IN-WI | 121,924 | 17 | 211,000 | 92 | % | 92 | % | 21.50 | 86,000 | Jewel Osco | Marshalls / Old Navy | |||||||||||||||||||||||||||||
| Total Chicago | 214,094 | 63 | 798,000 | 93 | % | 93 | % | 18.85 | |||||||||||||||||||||||||||||||||
| Other | |||||||||||||||||||||||||||||||||||||||||
| Barracks Road | Charlottesville, VA | 69,596 | 40 | 497,000 | 90 | % | 89 | % | 26.65 | 99,000 | Harris Teeter / Kroger | Anthropologie / Nike / Bed, Bath & Beyond / Old Navy | |||||||||||||||||||||||||||||
| Bristol Plaza | Hartford-West Hartford-East Hartford, CT | 32,045 | 22 | 264,000 | 82 | % | 73 | % | 14.49 | 74,000 | Stop & Shop | TJ Maxx | |||||||||||||||||||||||||||||
| Gratiot Plaza | Detroit-Warren-Dearborn, MI | 20,089 | 20 | 215,000 | 100 | % | 100 | % | 12.80 | 69,000 | Kroger | Bed, Bath & Beyond / Best Buy / DSW | |||||||||||||||||||||||||||||
| Lancaster | (8) | Lancaster, PA | 12,961 | 5,524 | 11 | 126,000 | 81 | % | 80 | % | 19.86 | 75,000 | Giant Food | ||||||||||||||||||||||||||||
| 29th Place | Charlottesville, VA | 38,662 | 3,625 | 15 | 168,000 | 92 | % | 92 | % | 18.01 | HomeGoods / DSW / Staples | ||||||||||||||||||||||||||||||
| Willow Lawn | Richmond, VA | 104,774 | 37 | 464,000 | 95 | % | 95 | % | 20.49 | 66,000 | Kroger | Old Navy / Ross Dress For Less / Gold's Gym / Dick's Sporting Goods | |||||||||||||||||||||||||||||
| Total Other | 278,127 | 145 | 1,734,000 | 91 | % | 89 | % | 20.16 | |||||||||||||||||||||||||||||||||
| Grand Total | $ | 8,654,729 | $561,709 | 1,904 | 23,378,000 | 92 | % | 90 | % | $ | 29.86 | 2,869 | |||||||||||||||||||||||||||||
| Notes: | |||||
| (1) | Includes "Finance lease right of use assets." | ||||
| (2) | The mortgage or finance lease liabilities differ from the total reported on the consolidated balance sheet due to the unamortized discount, premium, and/or debt issuance costs on certain mortgages payable. | ||||
| (3) | Represents the GLA and the percentage leased and percentage occupied of the commercial portion of the property. Some of our properties include office space which is included in this square footage. Excludes newly created redevelopment square footage not yet in service, as well as residential and hotel square footage. | ||||
| (4) | Calculated as the aggregate, annualized in-place contractual (defined as cash basis excluding rent abatements) minimum rent for all occupied spaces divided by the aggregate GLA of all occupied spaces. | ||||
| (5) | The Trust has a controlling financial interest in this property. | ||||
| (6) | All or a portion of the property is owned in a "downREIT" partnership, of which a wholly owned subsidiary of the Trust is the sole general partner, with third party partners holding operating partnership units. | ||||
| (7) | Portion of property is currently under development. See further discussion in the Assembly Row and Pike & Rose schedules and Summary of Redevelopment Opportunities for Freedom Plaza. | ||||
| (8) | All or a portion of the property is subject to finance lease liabilities. | ||||
| (9) | This property includes interests in five buildings in addition to our initial acquisition. | ||||
| (10) | This property includes 39 buildings primarily along Washington Street and 14th Street in Hoboken, New Jersey. | ||||
27
| Federal Realty Investment Trust | ||||||||||||||||||||||||||||||||||||||||||||||||||||||||||||||||||||
| Retail Leasing Summary (1) | ||||||||||||||||||||||||||||||||||||||||||||||||||||||||||||||||||||
| December 31, 2020 | ||||||||||||||||||||||||||||||||||||||||||||||||||||||||||||||||||||
| Total Lease Summary - Comparable (2) | ||||||||||||||||||||||||||||||||||||||||||||||||||||||||||||||||||||
| Quarter | Number of Leases Signed | % of Comparable Leases Signed | GLA Signed | Contractual Rent (3) Per Sq. Ft. | Prior Rent (4) Per Sq. Ft. | Annual Increase in Rent | Cash Basis % Increase Over Prior Rent | Straight-lined Basis % Increase Over Prior Rent | Weighted Average Lease Term (5) | Tenant Improvements & Incentives (6) | Tenant Improvements & Incentives Per Sq. Ft. | |||||||||||||||||||||||||||||||||||||||||||||||||||||||||
| 4th Quarter 2020 | 96 | 100 | % | 449,783 | $ | 32.16 | $ | 31.95 | $ | 93,635 | 1 | % | 11 | % | 6.0 | $ | 12,945,573 | $ | 28.78 | (7) | ||||||||||||||||||||||||||||||||||||||||||||||||
| 3rd Quarter 2020 | 98 | 100 | % | 471,726 | $ | 37.38 | $ | 37.74 | $ | (169,801) | (1) | % | 6 | % | 5.6 | $ | 16,274,556 | $ | 34.50 | (7) | ||||||||||||||||||||||||||||||||||||||||||||||||
| 2nd Quarter 2020 | 47 | 100 | % | 277,681 | $ | 28.55 | $ | 25.64 | $ | 805,618 | 11 | % | 23 | % | 8.2 | $ | 8,590,153 | $ | 30.94 | |||||||||||||||||||||||||||||||||||||||||||||||||
| 1st Quarter 2020 | 76 | 100 | % | 466,453 | $ | 26.78 | $ | 25.58 | $ | 559,471 | 5 | % | 14 | % | 6.8 | $ | 14,633,657 | $ | 31.37 | (7) | ||||||||||||||||||||||||||||||||||||||||||||||||
| Total - 12 months | 317 | 100 | % | 1,665,643 | $ | 31.53 | $ | 30.76 | $ | 1,288,923 | 3 | % | 12 | % | 6.4 | $ | 52,443,939 | $ | 31.49 | |||||||||||||||||||||||||||||||||||||||||||||||||
| New Lease Summary - Comparable (2) | ||||||||||||||||||||||||||||||||||||||||||||||||||||||||||||||||||||
| Quarter | Number of Leases Signed | % of Comparable Leases Signed | GLA Signed | Contractual Rent (3) Per Sq. Ft. | Prior Rent (4) Per Sq. Ft. | Annual Increase in Rent | Cash Basis % Increase Over Prior Rent | Straight-lined Basis % Increase Over Prior Rent | Weighted Average Lease Term (5) | Tenant Improvements & Incentives (6) | Tenant Improvements & Incentives Per Sq. Ft. | |||||||||||||||||||||||||||||||||||||||||||||||||||||||||
| 4th Quarter 2020 | 39 | 41 | % | 156,262 | $ | 35.65 | $ | 37.27 | $ | (253,720) | (4) | % | 8 | % | 9.1 | $ | 12,731,293 | $ | 81.47 | (7) | ||||||||||||||||||||||||||||||||||||||||||||||||
| 3rd Quarter 2020 | 39 | 40 | % | 164,712 | $ | 36.23 | $ | 36.84 | $ | (100,451) | (2) | % | 5 | % | 8.5 | $ | 15,427,773 | $ | 93.67 | (7) | ||||||||||||||||||||||||||||||||||||||||||||||||
| 2nd Quarter 2020 | 12 | 26 | % | 122,726 | $ | 26.79 | $ | 20.36 | $ | 789,852 | 32 | % | 52 | % | 14.9 | $ | 8,483,168 | $ | 69.12 | |||||||||||||||||||||||||||||||||||||||||||||||||
| 1st Quarter 2020 | 29 | 38 | % | 151,171 | $ | 32.72 | $ | 30.44 | $ | 345,686 | 8 | % | 18 | % | 8.2 | $ | 13,395,793 | $ | 88.61 | (7) | ||||||||||||||||||||||||||||||||||||||||||||||||
| Total - 12 months | 119 | 38 | % | 594,871 | $ | 33.24 | $ | 31.93 | $ | 781,367 | 4 | % | 15 | % | 9.7 | $ | 50,038,027 | $ | 84.12 | |||||||||||||||||||||||||||||||||||||||||||||||||
| Renewal Lease Summary - Comparable (2) (8) | ||||||||||||||||||||||||||||||||||||||||||||||||||||||||||||||||||||
| Quarter | Number of Leases Signed | % of Comparable Leases Signed | GLA Signed | Contractual Rent (3) Per Sq. Ft. | Prior Rent (4) Per Sq. Ft. | Annual Increase in Rent | Cash Basis % Increase Over Prior Rent | Straight-lined Basis % Increase Over Prior Rent | Weighted Average Lease Term (5) | Tenant Improvements & Incentives (6) | Tenant Improvements & Incentives Per Sq. Ft. | |||||||||||||||||||||||||||||||||||||||||||||||||||||||||
| 4th Quarter 2020 | 57 | 59 | % | 293,521 | $ | 30.30 | $ | 29.12 | $ | 347,355 | 4 | % | 13 | % | 4.0 | $ | 214,280 | $ | 0.73 | |||||||||||||||||||||||||||||||||||||||||||||||||
| 3rd Quarter 2020 | 59 | 60 | % | 307,014 | $ | 38.00 | $ | 38.23 | $ | (69,350) | (1) | % | 7 | % | 4.1 | $ | 846,783 | $ | 2.76 | |||||||||||||||||||||||||||||||||||||||||||||||||
| 2nd Quarter 2020 | 35 | 74 | % | 154,955 | $ | 29.93 | $ | 29.83 | $ | 15,766 | — | % | 8 | % | 3.4 | $ | 106,985 | $ | 0.69 | |||||||||||||||||||||||||||||||||||||||||||||||||
| 1st Quarter 2020 | 47 | 62 | % | 315,282 | $ | 23.93 | $ | 23.25 | $ | 213,785 | 3 | % | 12 | % | 5.9 | $ | 1,237,864 | $ | 3.93 | |||||||||||||||||||||||||||||||||||||||||||||||||
| Total - 12 months | 198 | 62 | % | 1,070,772 | $ | 30.58 | $ | 30.11 | $ | 507,556 | 2 | % | 10 | % | 4.4 | $ | 2,405,912 | $ | 2.25 | |||||||||||||||||||||||||||||||||||||||||||||||||
| Total Lease Summary - Comparable and Non-comparable (2) (9) | ||||||||||||||||||||||||||||||||||||||||||||||||||||||||||||||||||||
| Quarter | Number of Leases Signed | GLA Signed | Contractual Rent (3) Per Sq. Ft. | Weighted Average Lease Term (5) | Tenant Improvements & Incentives (6) | Tenant Improvements & Incentives Per Sq. Ft. | ||||||||||||||||||||||||||||||||||||||||||||||||||||||||||||||
| 4th Quarter 2020 | 103 | 468,901 | $ | 32.67 | 6.1 | $ | 13,430,989 | $ | 28.64 | |||||||||||||||||||||||||||||||||||||||||||||||||||||||||||
| 3rd Quarter 2020 | 101 | 481,105 | $ | 37.66 | 5.7 | $ | 16,304,772 | $ | 33.89 | |||||||||||||||||||||||||||||||||||||||||||||||||||||||||||
| 2nd Quarter 2020 | 50 | 314,679 | $ | 26.16 | 8.2 | $ | 9,314,002 | $ | 29.60 | |||||||||||||||||||||||||||||||||||||||||||||||||||||||||||
| 1st Quarter 2020 | 82 | 491,003 | $ | 27.46 | 7.3 | $ | 17,337,865 | $ | 35.31 | |||||||||||||||||||||||||||||||||||||||||||||||||||||||||||
| Total - 12 months | 336 | 1,755,688 | $ | 31.41 | 6.6 | $ | 56,387,628 | $ | 32.12 | |||||||||||||||||||||||||||||||||||||||||||||||||||||||||||
| Notes: | ||||||||
| (1) | Information reflects activity in retail spaces only; office and residential spaces are not included. See Glossary of Terms for further discussion of information included above. | |||||||
| (2) | Comparable leases represent those leases signed on spaces for which there was a former tenant. | |||||||
| (3) | Contractual rent represents contractual minimum rent under the new lease for the first 12 months of the term. | |||||||
| (4) | Prior rent represents minimum rent and percentage rent, if any, paid by the prior tenant in the final 12 months of the term. | |||||||
| (5) | Weighted average is determined on the basis of contractual rent for the first 12 months of the term. | |||||||
| (6) | See Glossary of Terms. | |||||||
| (7) | Approximately $0.1 million ($0.03 per square foot) in 4th Quarter 2020, $0.5 million ($0.90 per square foot) in 3rd Quarter 2020 and $2.8 million ($5.37 per square foot) in 1st Quarter 2020, of the Tenant Improvements & Incentives are for properties under active redevelopment and are included in the Projected Cost for those properties on the Summary of Redevelopment Opportunities. | |||||||
| (8) | Renewal leases represent expiring leases rolling over with the same tenant in the same location. All other leases are categorized as new. | |||||||
| (9) | The Number of Leases Signed, GLA Signed, Contractual Rent Per Sq. Ft. and Weighted Average Lease Term columns include information for leases signed at Phase 3 of both of our Assembly Row and Pike & Rose projects. The Tenant Improvements & Incentives and Tenant Improvements & Incentives Per Sq. Ft. columns do not include the tenant improvements and incentives on leases signed for those projects; these amounts for leases signed for Phase 3 of Assembly Row and Pike & Rose are included in the Projected Cost column for those projects shown on the Assembly Row and Pike & Rose schedule. | |||||||
28
| Federal Realty Investment Trust | |||||||||||||||||||||||||||||||||||
| Lease Expirations | |||||||||||||||||||||||||||||||||||
| December 31, 2020 | |||||||||||||||||||||||||||||||||||
| Assumes no exercise of lease options | |||||||||||||||||||||||||||||||||||
| Anchor Tenants (1) | Small Shop Tenants | Total | |||||||||||||||||||||||||||||||||
| Year | Expiring SF | % of Anchor SF | Minimum Rent PSF (2) | Expiring SF | % of Small Shop SF | Minimum Rent PSF (2) | Expiring SF (4) | % of Total SF | Minimum Rent PSF (2) | ||||||||||||||||||||||||||
| 2021 | 702,000 | 5 | % | $ | 24.44 | 788,000 | 12 | % | $ | 41.76 | 1,490,000 | 7 | % | $ | 33.60 | ||||||||||||||||||||
| 2022 | 1,905,000 | 13 | % | $ | 17.17 | 880,000 | 13 | % | $ | 45.09 | 2,785,000 | 13 | % | $ | 25.99 | ||||||||||||||||||||
| 2023 | 1,371,000 | 9 | % | $ | 20.83 | 917,000 | 14 | % | $ | 44.18 | 2,288,000 | 11 | % | $ | 30.19 | ||||||||||||||||||||
| 2024 | 2,377,000 | 16 | % | $ | 18.11 | 903,000 | 14 | % | $ | 46.34 | 3,280,000 | 15 | % | $ | 25.89 | ||||||||||||||||||||
| 2025 | 1,665,000 | 12 | % | $ | 22.62 | 800,000 | 12 | % | $ | 44.05 | 2,465,000 | 12 | % | $ | 29.57 | ||||||||||||||||||||
| 2026 | 1,116,000 | 8 | % | $ | 21.10 | 544,000 | 8 | % | $ | 49.65 | 1,659,000 | 8 | % | $ | 30.45 | ||||||||||||||||||||
| 2027 | 948,000 | 7 | % | $ | 32.91 | 510,000 | 8 | % | $ | 48.99 | 1,457,000 | 7 | % | $ | 38.53 | ||||||||||||||||||||
| 2028 | 878,000 | 6 | % | $ | 20.85 | 403,000 | 6 | % | $ | 52.04 | 1,281,000 | 6 | % | $ | 30.66 | ||||||||||||||||||||
| 2029 | 951,000 | 7 | % | $ | 27.56 | 383,000 | 6 | % | $ | 46.75 | 1,334,000 | 6 | % | $ | 33.08 | ||||||||||||||||||||
| 2030 | 930,000 | 6 | % | $ | 28.84 | 263,000 | 4 | % | $ | 51.30 | 1,193,000 | 6 | % | $ | 33.78 | ||||||||||||||||||||
| Thereafter | 1,637,000 | 11 | % | $ | 24.70 | 219,000 | 3 | % | $ | 43.96 | 1,857,000 | 9 | % | $ | 26.98 | ||||||||||||||||||||
| Total (3) | 14,480,000 | 100 | % | $ | 22.49 | 6,610,000 | 100 | % | $ | 46.02 | 21,089,000 | 100 | % | $ | 29.86 | ||||||||||||||||||||
| Assumes all lease options are exercised | |||||||||||||||||||||||||||||||||||
| Anchor Tenants (1) | Small Shop Tenants | Total | |||||||||||||||||||||||||||||||||
| Year | Expiring SF | % of Anchor SF | Minimum Rent PSF (2) | Expiring SF | % of Small Shop SF | Minimum Rent PSF (2) | Expiring SF (4) | % of Total SF | Minimum Rent PSF (2) | ||||||||||||||||||||||||||
| 2021 | 406,000 | 3 | % | $ | 25.71 | 699,000 | 10 | % | $ | 41.15 | 1,105,000 | 5 | % | $ | 35.47 | ||||||||||||||||||||
| 2022 | 294,000 | 2 | % | $ | 17.62 | 569,000 | 9 | % | $ | 44.65 | 863,000 | 4 | % | $ | 35.45 | ||||||||||||||||||||
| 2023 | 374,000 | 2 | % | $ | 21.42 | 591,000 | 9 | % | $ | 41.12 | 965,000 | 5 | % | $ | 33.48 | ||||||||||||||||||||
| 2024 | 519,000 | 4 | % | $ | 21.15 | 473,000 | 7 | % | $ | 45.34 | 992,000 | 5 | % | $ | 32.67 | ||||||||||||||||||||
| 2025 | 327,000 | 2 | % | $ | 24.60 | 452,000 | 7 | % | $ | 42.45 | 779,000 | 4 | % | $ | 34.96 | ||||||||||||||||||||
| 2026 | 339,000 | 2 | % | $ | 21.99 | 286,000 | 4 | % | $ | 50.87 | 624,000 | 3 | % | $ | 35.21 | ||||||||||||||||||||
| 2027 | 730,000 | 5 | % | $ | 21.48 | 437,000 | 7 | % | $ | 48.70 | 1,167,000 | 5 | % | $ | 31.67 | ||||||||||||||||||||
| 2028 | 641,000 | 4 | % | $ | 17.66 | 390,000 | 6 | % | $ | 47.36 | 1,031,000 | 5 | % | $ | 28.90 | ||||||||||||||||||||
| 2029 | 812,000 | 6 | % | $ | 24.11 | 373,000 | 6 | % | $ | 44.31 | 1,185,000 | 6 | % | $ | 30.47 | ||||||||||||||||||||
| 2030 | 524,000 | 4 | % | $ | 20.96 | 364,000 | 5 | % | $ | 44.57 | 888,000 | 4 | % | $ | 30.64 | ||||||||||||||||||||
| Thereafter | 9,514,000 | 66 | % | $ | 22.91 | 1,976,000 | 30 | % | $ | 49.61 | 11,490,000 | 54 | % | $ | 27.50 | ||||||||||||||||||||
| Total (3) | 14,480,000 | 100 | % | $ | 22.49 | 6,610,000 | 100 | % | $ | 46.02 | 21,089,000 | 100 | % | $ | 29.86 | ||||||||||||||||||||
| Notes: | |||||||||||||||||||||||||||||||||||
| (1) | Anchor is defined as a commercial tenant leasing 10,000 square feet or more. | ||||||||||||||||||||||||||||||||||
| (2) | Minimum Rent reflects in-place contractual (defined as rents billed on a cash basis without taking the impacts of rent abatements into account) rent as of December 31, 2020. | ||||||||||||||||||||||||||||||||||
| (3) | Represents occupied square footage of the commercial portion of our portfolio as of December 31, 2020. | ||||||||||||||||||||||||||||||||||
| (4) | Individual items may not add up to total due to rounding. | ||||||||||||||||||||||||||||||||||
29
| Federal Realty Investment Trust | ||||||||||||||||||||||||||
| Portfolio Leased Statistics | ||||||||||||||||||||||||||
| December 31, 2020 | ||||||||||||||||||||||||||
| Overall Portfolio Statistics (1) | December 31, 2020 | December 31, 2019 | ||||||||||||||||||||||||
| Type | Size | Leased | Leased % | Size | Leased | Leased % | ||||||||||||||||||||
| Commercial Properties (2) (3) (4) (sf) | 23,378,000 | 21,562,000 | 92.2 | % | 23,676,000 | 22,299,000 | 94.2 | % | ||||||||||||||||||
| Residential Properties (units) (5) | 2,782 | 2,638 | 94.8 | % | 2,788 | 2,670 | 95.8 | % | ||||||||||||||||||
| Comparable Property Statistics (1) | December 31, 2020 | December 31, 2019 | ||||||||||||||||||||||||
| Type | Size | Leased | Leased % | Size | Leased | Leased % | ||||||||||||||||||||
| Commercial Properties (2) (4) (sf) | 22,118,000 | 20,373,000 | 92.1 | % | 22,151,000 | 21,058,000 | 95.1 | % | ||||||||||||||||||
| Residential Properties (5) (units) | 2,651 | 2,521 | 95.1 | % | 2,651 | 2,537 | 95.7 | % | ||||||||||||||||||
| Notes: | ||||||||||||||||||||||||||
| (1) | See Glossary of Terms. | |||||||||||||||||||||||||
| (2) | Leasable square feet excludes redevelopment square footage not yet placed in service. | |||||||||||||||||||||||||
| (3) | At December 31, 2020, the leased percentage was 96.2% for anchor tenants and 84.6% for small shop tenants. | |||||||||||||||||||||||||
| (4) | Occupied percentage was 90.2% and 92.5% at December 31, 2020 and 2019, respectively, and comparable property occupied percentage was 90.1% and 93.4% at December 31, 2020 and 2019, respectively. | |||||||||||||||||||||||||
| (5) | Our residential metrics exclude "The Delwyn," our 87 unit residential building that opened at Bala Cynwyd in late 2020, and is currently in the process of being leased-up for the first time. If these units were included, our total residential units would be 2,869 and our percentage leased would be 92.6%. | |||||||||||||||||||||||||
30
| Federal Realty Investment Trust | ||||||||||||||||||||||||||
| Summary of Top 25 Tenants | ||||||||||||||||||||||||||
| December 31, 2020 | ||||||||||||||||||||||||||
| Rank | Tenant Name | Credit Ratings (S&P/Moody's/Fitch) (1) | Annualized Base Rent | Percentage of Total Annualized Base Rent (3) | Total GLA | Percentage of Total GLA (3) | Number of Stores Leased | |||||||||||||||||||
| 1 | Splunk, Inc. | NR / NR / NR | $ | 25,818,000 | 3.64 | % | 536,000 | 2.06 | % | 2 | ||||||||||||||||
| 2 | TJX Companies, The | A / A2 / NR | $ | 19,002,000 | 2.68 | % | 963,000 | 3.69 | % | 30 | ||||||||||||||||
| 3 | Ahold Delhaize | BBB / Baa1 / BBB+ | $ | 15,166,000 | 2.14 | % | 852,000 | 3.27 | % | 14 | ||||||||||||||||
| 4 | Gap, Inc., The | BB- / Ba2 / NR | $ | 11,626,000 | 1.64 | % | 306,000 | 1.17 | % | 27 | ||||||||||||||||
| 5 | L.A. Fitness International LLC | CCC+ / Caa3 / NR | $ | 10,383,000 | 1.46 | % | 415,000 | 1.59 | % | 10 | ||||||||||||||||
| 6 | Bed, Bath & Beyond, Inc. | B+ / Ba3 / NR | $ | 9,538,000 | 1.34 | % | 574,000 | 2.20 | % | 15 | ||||||||||||||||
| 7 | CVS Corporation | BBB / Baa2 / NR | $ | 9,485,000 | 1.34 | % | 248,000 | 0.95 | % | 19 | ||||||||||||||||
| 8 | Home Depot, Inc. | A / A2 / A | $ | 7,193,000 | 1.01 | % | 478,000 | 1.83 | % | 6 | ||||||||||||||||
| 9 | Ross Stores, Inc. | BBB+ / A2 / NR | $ | 6,535,000 | 0.92 | % | 315,000 | 1.21 | % | 11 | ||||||||||||||||
| 10 | Michaels Stores, Inc. | B / Ba3 / NR | $ | 6,457,000 | 0.91 | % | 327,000 | 1.25 | % | 14 | ||||||||||||||||
| 11 | Dick's Sporting Goods, Inc. | NR / NR / NR | $ | 6,425,000 | 0.91 | % | 289,000 | 1.11 | % | 6 | ||||||||||||||||
| 12 | Hudson's Bay Company (Saks, Lord & Taylor) | NR / NR / NR | $ | 6,332,000 | 0.89 | % | 220,000 | 0.84 | % | 4 | ||||||||||||||||
| 13 | Bank of America, N.A. | A- / A2 / A+ | $ | 6,215,000 | 0.88 | % | 107,000 | 0.41 | % | 25 | ||||||||||||||||
| 14 | Kroger Co., The | BBB / Baa1 / NR | $ | 6,162,000 | 0.87 | % | 529,000 | 2.03 | % | 11 | ||||||||||||||||
| 15 | Nordstrom, Inc. | BB+ / Baa3 / NR | $ | 6,136,000 | 0.86 | % | 218,000 | 0.84 | % | 6 | ||||||||||||||||
| 16 | DSW, Inc | NR / NR / NR | $ | 5,692,000 | 0.80 | % | 224,000 | 0.86 | % | 11 | ||||||||||||||||
| 17 | Best Buy Co., Inc. | BBB / Baa1 / NR | $ | 5,670,000 | 0.80 | % | 186,000 | 0.71 | % | 4 | ||||||||||||||||
| 18 | AMC Entertainment Inc. | CC / Caa3 / NR | $ | 5,424,000 | 0.76 | % | 233,000 | 0.89 | % | 5 | ||||||||||||||||
| 19 | Ulta Beauty, Inc. | NR / NR / NR | $ | 5,388,000 | 0.76 | % | 152,000 | 0.58 | % | 14 | ||||||||||||||||
| 20 | Whole Foods Market, Inc. | A+ / A2 / NR | $ | 4,772,000 | 0.67 | % | 167,000 | 0.64 | % | 4 | ||||||||||||||||
| 21 | Starbucks Corporation | BBB+ / Baa1 / BBB | $ | 4,398,000 | 0.62 | % | 67,000 | 0.26 | % | 38 | ||||||||||||||||
| 22 | AB Acquisition LLC (Acme, Safeway) | BB- / Ba3 / NR | $ | 4,312,000 | 0.61 | % | 412,000 | 1.58 | % | 7 | ||||||||||||||||
| 23 | Wells Fargo Bank, N.A. | BBB+ / A2 / A+ | $ | 4,233,000 | 0.60 | % | 51,000 | 0.20 | % | 13 | ||||||||||||||||
| 24 | JPMorgan Chase Bank | A- / A2 / AA- | $ | 4,165,000 | 0.59 | % | 71,000 | 0.27 | % | 17 | ||||||||||||||||
| 25 | Target Corporation | A / A2 / A- | $ | 4,004,000 | 0.56 | % | 443,000 | 1.70 | % | 5 | ||||||||||||||||
| Totals - Top 25 Tenants | $ | 200,531,000 | 28.25 | % | 8,383,000 | 32.14 | % | 318 | ||||||||||||||||||
| Total (5): | $ | 709,762,000 | (2) | 26,082,000 | (4) | |||||||||||||||||||||
| Notes: | ||||||||||||||||||||||||||
| (1) | Credit Ratings are as of December 31, 2020. Subsequent rating changes have not been reflected. | |||||||||||||||||||||||||
| (2) | See Glossary of Terms. | |||||||||||||||||||||||||
| (3) | Individual items may not add up to total due to rounding. | |||||||||||||||||||||||||
| (4) | Excludes redevelopment square footage not yet placed in service. | |||||||||||||||||||||||||
| (5) | Totals reflect both the commercial and residential portions of our properties. | |||||||||||||||||||||||||
31
| Federal Realty Investment Trust | ||
| Tenant Diversification by Category | ||
| December 31, 2020 | ||
The below reflects the breakout of our Annualized Base Rent1 as of December 31, 2020 by type of tenant:
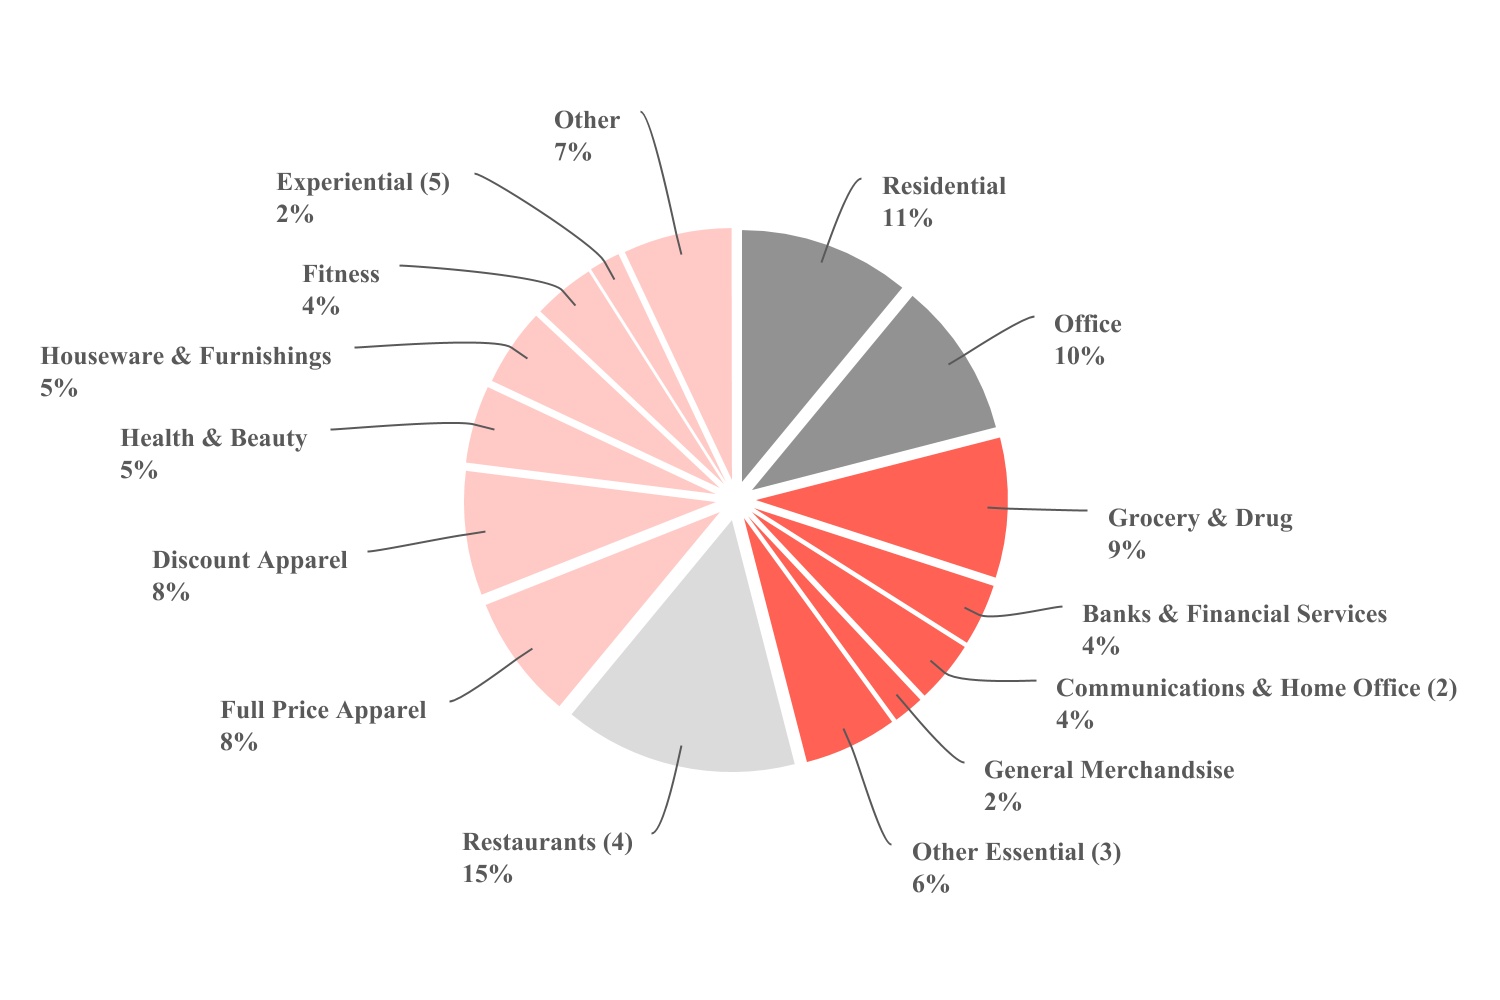
| 25% of Annualized Base Rent comes from Essential Retail | ||||||||
| 21% of Annualized Base Rent comes from Office and Residential | ||||||||
| Notes: | |||||||||||||||||||||||
| (1) | See Glossary of Terms. Excludes redevelopment square footage not yet placed in service. | ||||||||||||||||||||||
| (2) | Communications & Home Office includes: Telecommunications, Electronics, and Office Supply. | ||||||||||||||||||||||
| (3) | Other Essential includes: Auto, Liquor, Home Improvement, Pets, and Medical. | ||||||||||||||||||||||
| (4) | Total Restaurants comprise full service (less than 8%) and quick service (less than 8%). | ||||||||||||||||||||||
| (5) | Experiential includes: Activity, Cinema, and Entertainment. | ||||||||||||||||||||||
32
Glossary of Terms
EBITDA for Real Estate ("EBITDAre"): EBITDAre is a non-GAAP measure that the National Association of Real Estate Investment Trusts ("NAREIT") defines as: net income computed in accordance with GAAP plus net interest expense, income tax expense, depreciation and amortization, gain or loss on sale of real estate, impairments of real estate, and adjustments to reflect the entity's share of EBITDAre of unconsolidated affiliates. We calculate EBITDAre consistent with the NAREIT definition. As EBITDA is a widely known and understood measure of performance, management believes EBITDAre represents an additional non-GAAP performance measure, independent of a company's capital structure, that will provide investors with a uniform basis to measure the enterprise value of a company. EBITDAre also approximates a key performance measure in our debt covenants, but it should not be considered an alternative measure of operating results or cash flow from operations as determined in accordance with GAAP. The reconciliation of net income to EBITDAre for the three months and year ended December 31, 2020 and 2019 is as follows:
| Three Months Ended | Year Ended | ||||||||||||||||||||||
| December 31, | December 31, | ||||||||||||||||||||||
| 2020 | 2019 | 2020 | 2019 | ||||||||||||||||||||
| (in thousands) | |||||||||||||||||||||||
| Net income | $ | 102,211 | $ | 148,966 | $ | 135,888 | $ | 360,542 | |||||||||||||||
| Interest expense | 37,543 | 27,056 | 136,289 | 109,623 | |||||||||||||||||||
| Other interest income | (539) | (511) | (1,894) | (1,266) | |||||||||||||||||||
| Early extinguishment of debt | 11,179 | — | 11,179 | — | |||||||||||||||||||
| Provision (benefit) for income tax | 124 | 241 | (194) | 772 | |||||||||||||||||||
| Depreciation and amortization | 64,424 | 61,431 | 255,027 | 239,758 | |||||||||||||||||||
| Gain on sale of real estate | (86,435) | (86,278) | (98,117) | (116,779) | |||||||||||||||||||
| Impairment charge | — | — | 57,218 | — | |||||||||||||||||||
| Adjustments of EBITDAre of unconsolidated affiliates | 1,517 | 1,730 | 6,417 | 6,917 | |||||||||||||||||||
| EBITDAre (1) | $ | 130,024 | $ | 152,635 | $ | 501,813 | $ | 599,567 | |||||||||||||||
(1) Excluding the charge related to the buyout of the Kmart lease at Assembly Square Marketplace, our EBITDAre would have been $611.5 million for the year ended December 31, 2019.
Funds From Operations (FFO): FFO is a supplemental measure of real estate companies' operating performances. NAREIT defines FFO as follows: net income, computed in accordance with GAAP plus real estate related depreciation and amortization, gains and losses on sale of real estate, and impairment write-downs of depreciable real estate. NAREIT developed FFO as a relative measure of performance and liquidity of an equity REIT in order to recognize that the value of income-producing real estate historically has not depreciated on the basis determined under GAAP. However, FFO does not represent cash flows from operating activities in accordance with GAAP (which, unlike FFO, generally reflects all cash effects of transactions and other events in the determination of net income); should not be considered an alternative to net income as an indication of our performance; and is not necessarily indicative of cash flow as a measure of liquidity or ability to pay dividends. We consider FFO a meaningful, additional measure of operating performance primarily because it excludes the assumption that the value of real estate assets diminishes predictably over time, and because industry analysts have accepted it as a performance measure. Comparison of our presentation of FFO to similarly titled measures for other REITs may not necessarily be meaningful due to possible differences in the application of the NAREIT definition used by such REITs.
Property Operating Income: Rental income and mortgage interest income, less rental expenses and real estate taxes.
Overall Portfolio: Includes all operating properties owned in reporting period.
Comparable Properties: Represents our consolidated property portfolio other than those properties that distort comparability between periods in two primary categories: (1) assets that were not owned for the full quarter in both periods presented and (2) assets currently under development or being repositioned for significant redevelopment and investment. Comparable property growth statistics are calculated on a GAAP basis.
Annualized Base Rent (ABR): Represents aggregate, annualized in-place contractual (defined as rents billed on a cash basis without taking the impact of rent abatements into account) minimum rent for all occupied spaces as of the reporting period.
Retail Leasing Summary - Lease Rollover Calculation: The rental increases associated with comparable spaces generally include all leases signed for retail space in arms-length transactions reflecting market leverage between landlords and tenants during the period. The comparison between annual rent for expiring leases and new leases is determined by including minimum rent and percentage rent paid on the expiring lease and minimum rent and in some instances, projections of first lease year percentage rent, to be paid on the new lease. In atypical circumstances, management may exercise judgment as to how to most effectively reflect the comparability of rents reported in this calculation. As a result of accommodations made to certain tenants to help them to stay open during and after the COVID-19 pandemic, we have found it necessary to exercise more judgement in 2020 than in prior years in order to appropriately reflect the comparability of rents in the calculation. The change in rental income on comparable space leases is impacted by numerous factors including current market rates, location, individual tenant creditworthiness, use of space, market conditions when the expiring lease was signed, capital investment made in the space and the specific lease structure. Rent abatement and short term rent restructuring agreements that are a result of COVID-19 impacts are not included in this calculation.
Tenant Improvements and Incentives: Represents not only the total dollars committed for the improvement (fit-out) of a space as it relates to a specific lease and, except for redevelopments, may also include base building costs (i.e. expansion, escalators or new entrances) which are required to make the space leasable. Incentives include amounts paid to tenants as an inducement to sign a lease that do not represent building improvements. Costs related to redevelopments require judgment by management in determining what reflects base building cost and thus, is not included in the "tenant improvements and incentives" amount.
33