Attached files
| file | filename |
|---|---|
| EX-99.1 - EX-99.1 - FEDERAL HOME LOAN MORTGAGE CORP | a20204qerexhibit991.htm |
| 8-K - 8-K - FEDERAL HOME LOAN MORTGAGE CORP | fmcc-20210211.htm |

Exhibit 99.2 Fourth Quarter 2020 Financial Results Supplement February 11, 2021
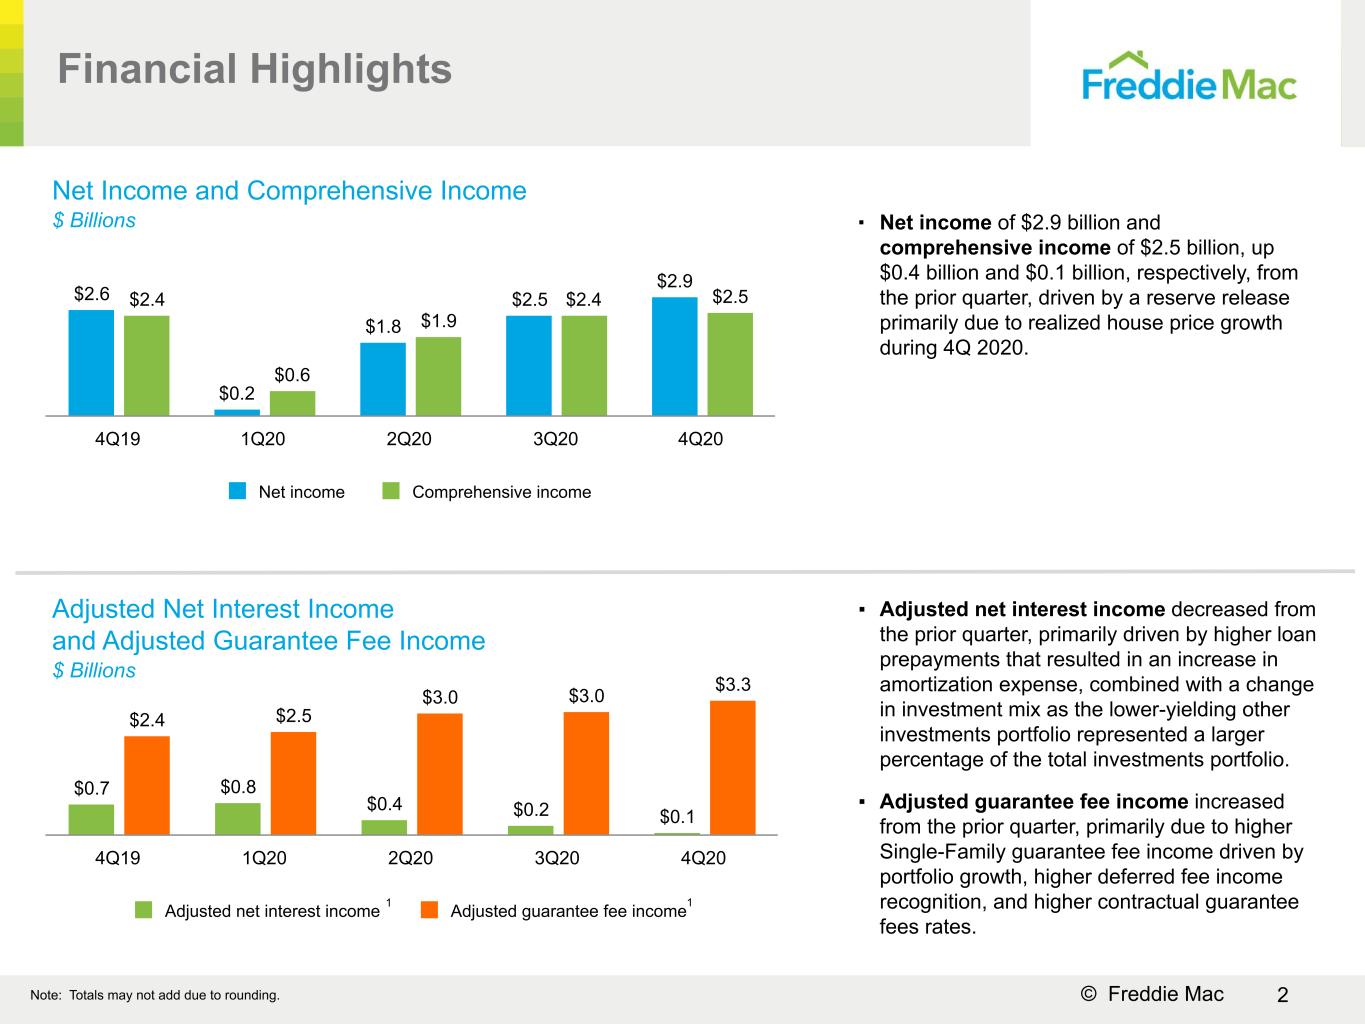
2© Freddie Mac Financial Highlights $2.6 $0.2 $1.8 $2.5 $2.9 $2.4 $0.6 $1.9 $2.4 $2.5 Net income Comprehensive income 4Q19 1Q20 2Q20 3Q20 4Q20 $0.7 $0.8 $0.4 $0.2 $0.1 $2.4 $2.5 $3.0 $3.0 $3.3 Adjusted net interest income Adjusted guarantee fee income 4Q19 1Q20 2Q20 3Q20 4Q20 Adjusted Net Interest Income and Adjusted Guarantee Fee Income $ Billions Net Income and Comprehensive Income $ Billions ▪ Adjusted net interest income decreased from the prior quarter, primarily driven by higher loan prepayments that resulted in an increase in amortization expense, combined with a change in investment mix as the lower-yielding other investments portfolio represented a larger percentage of the total investments portfolio. ▪ Adjusted guarantee fee income increased from the prior quarter, primarily due to higher Single-Family guarantee fee income driven by portfolio growth, higher deferred fee income recognition, and higher contractual guarantee fees rates. ▪ Net income of $2.9 billion and comprehensive income of $2.5 billion, up $0.4 billion and $0.1 billion, respectively, from the prior quarter, driven by a reserve release primarily due to realized house price growth during 4Q 2020. 11 Note: Totals may not add due to rounding.
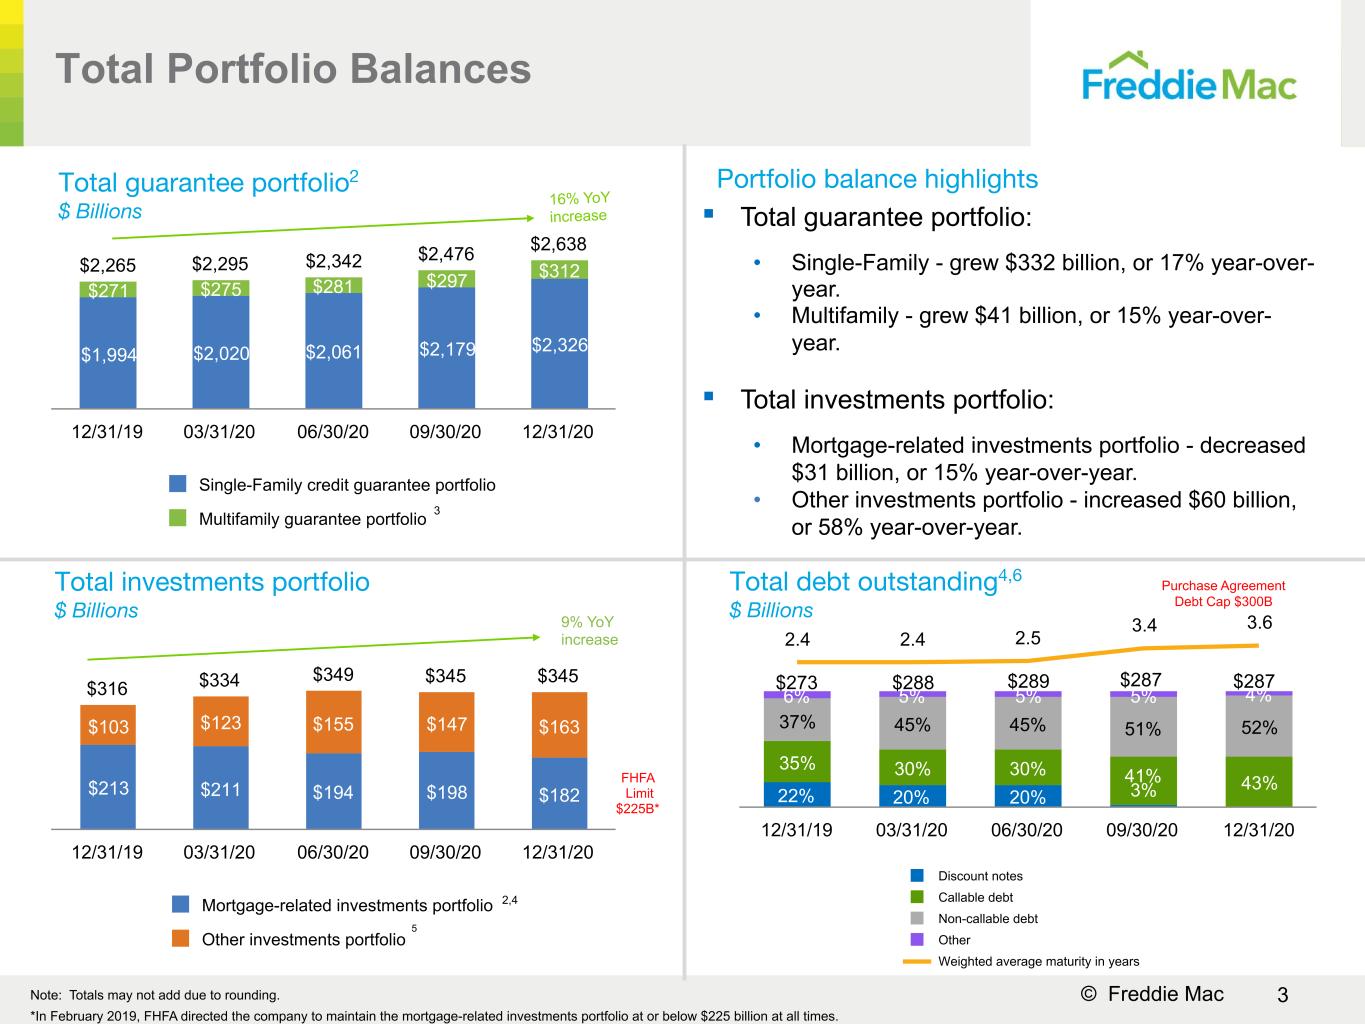
3© Freddie Mac $316 $334 $349 $345 $345 $213 $211 $194 $198 $182 $103 $123 $155 $147 $163 Mortgage-related investments portfolio Other investments portfolio 12/31/19 03/31/20 06/30/20 09/30/20 12/31/20 $2,265 $2,295 $2,342 $2,476 $2,638 $1,994 $2,020 $2,061 $2,179 $2,326 $271 $275 $281 $297 $312 Single-Family credit guarantee portfolio Multifamily guarantee portfolio 12/31/19 03/31/20 06/30/20 09/30/20 12/31/20 Total Portfolio Balances Total debt outstanding4,6 $ Billions Portfolio balance highlightsTotal guarantee portfolio2 $ Billions Total investments portfolio $ Billions 16% YoY increase ▪ Total guarantee portfolio: • Single-Family - grew $332 billion, or 17% year-over- year. • Multifamily - grew $41 billion, or 15% year-over- year. ▪ Total investments portfolio: • Mortgage-related investments portfolio - decreased $31 billion, or 15% year-over-year. • Other investments portfolio - increased $60 billion, or 58% year-over-year. 9% YoY increase 22% 20% 20% 3% 35% 30% 30% 41% 43% 37% 45% 45% 51% 52% 6% 5% 5% 5% 4% 2.4 2.4 2.5 3.4 3.6 Discount notes Callable debt Non-callable debt Other Weighted average maturity in years 12/31/19 03/31/20 06/30/20 09/30/20 12/31/20 3 2,4 Note: Totals may not add due to rounding. *In February 2019, FHFA directed the company to maintain the mortgage-related investments portfolio at or below $225 billion at all times. Purchase Agreement Debt Cap $300B $273 $288 $289 $287 FHFA Limit $225B* 5 $287

4© Freddie Mac Multifamily8Single-Family7 Percentage of Loans in Forbearance 0.10% 1.91% 2.01% Forbearance Period Repayment Period Total 0.37% 0.23% 0.18% 0.63% 1.29% 2.70% Current One Month Two Months Three Months to Six Months Greater Than Six Months Total Percentage of loans in the single-family guarantee portfolio that were in forbearance by payment status as of December 31, 2020 (based on loan count). Percentage of loans in the multifamily mortgage portfolio currently under a forbearance program (based on UPB). Past Due

5© Freddie Mac Conservatorship Matters • The January 2021 Letter Agreement increased the Capital Reserve Amount used for purposes of calculating the dividend requirement on the senior preferred stock from $20 billion to the amount of adjusted total capital necessary to meet the capital requirements and buffers set forth in the Enterprise Regulatory Capital Framework (ERCF). As a result, the company will not be required to pay a dividend to Treasury again until the company has built sufficient capital to meet the capital requirements and buffers set forth in the ERCF. Dividend Payments and Draws9 $ Billions $16.4 $86.5 $140.2 Net Worth Amount Senior Preferred Stock Liquidation Preference Remaining Treasury commitment As of December 31, 2020 $71.6 $119.7 Cumulative draws from Treasury Cumulative dividend payments to Treasury As of December 31, 2020 Net Worth Amount, Liquidation Preference, and Treasury Commitment $ Billions
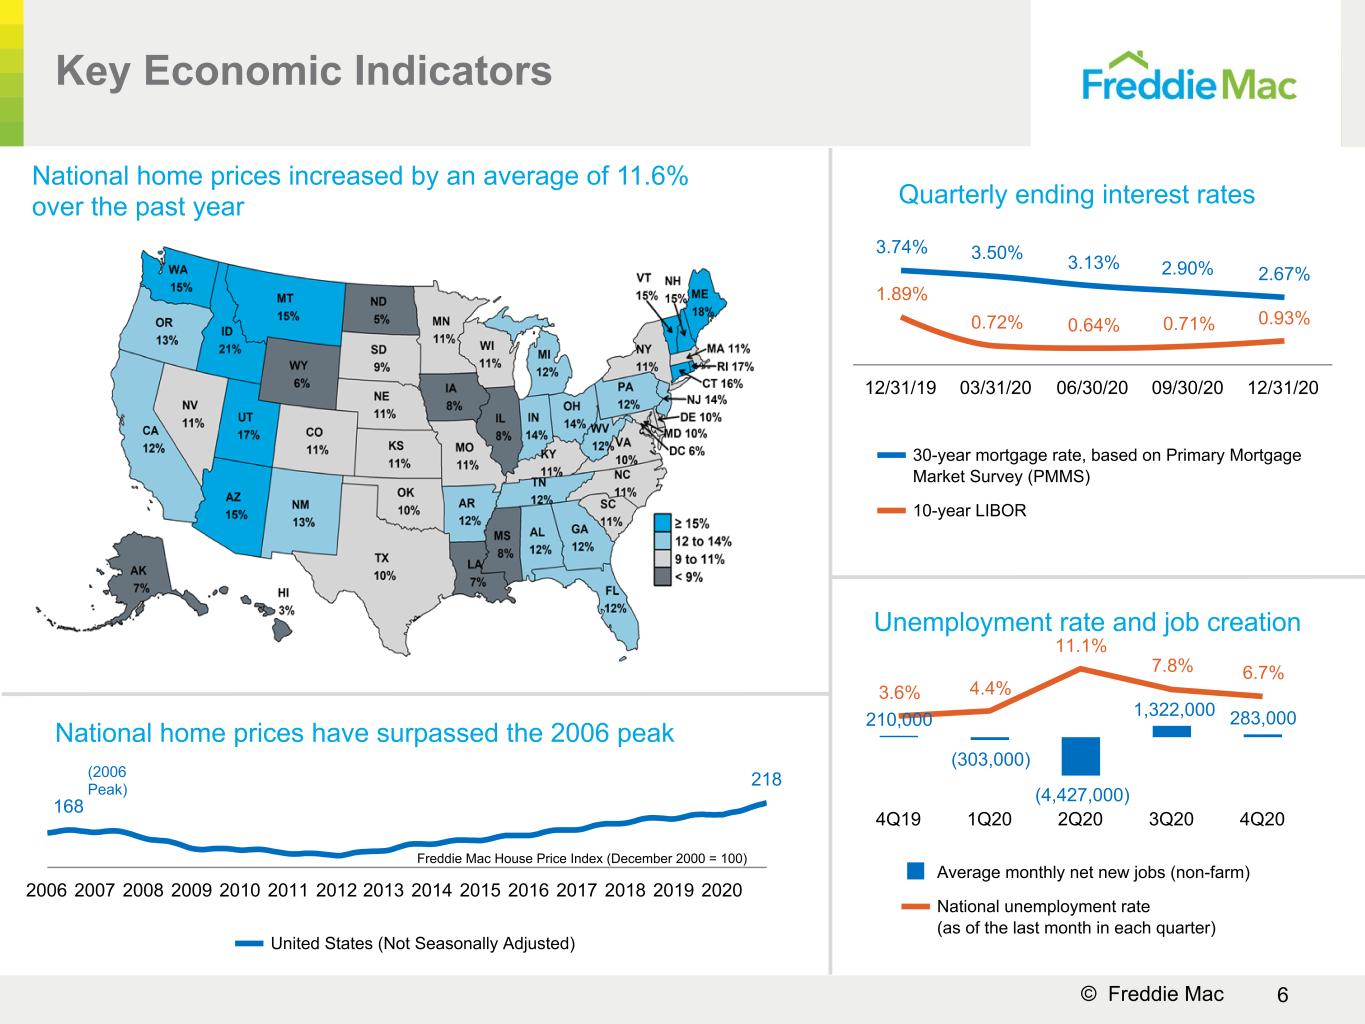
6© Freddie Mac 210,000 (303,000) (4,427,000) 1,322,000 283,000 3.6% 4.4% 11.1% 7.8% 6.7% Average monthly net new jobs (non-farm) National unemployment rate (as of the last month in each quarter) 4Q19 1Q20 2Q20 3Q20 4Q20 Key Economic Indicators National home prices increased by an average of 11.6% over the past year Quarterly ending interest rates 3.74% 3.50% 3.13% 2.90% 2.67% 1.89% 0.72% 0.64% 0.71% 0.93% 30-year mortgage rate, based on Primary Mortgage Market Survey (PMMS) 10-year LIBOR 12/31/19 03/31/20 06/30/20 09/30/20 12/31/20 168 218 United States (Not Seasonally Adjusted) 2006 2007 2008 2009 2010 2011 2012 2013 2014 2015 2016 2017 2018 2019 2020 Freddie Mac House Price Index (December 2000 = 100) (2006 Peak) National home prices have surpassed the 2006 peak Unemployment rate and job creation

7© Freddie Mac 0.26% 0.26% 1.95% 2.44% 2.04% 1.84% 1.79% 4.44% 5.47% 5.30% 0.63% 0.60% 2.48% 3.04% 2.64% Core single-family portfolio (loans originated post-2008) Legacy and relief refinance single-family portfolio Total 4Q19 1Q20 2Q20 3Q20 4Q20 $147 $138 $232 $337 $384 $63 $55 $60 $101 $109 $84 $83 $172 $236 $275 48 49 48 46 47 Home purchase UPB Refinance UPB 4Q19 1Q20 2Q20 3Q20 4Q20 Single-Family Guarantee Financial Highlights and Key Metrics Note: Totals may not add due to rounding. (73%) (74%) (75%) (77%) (78%) Single-Family Guarantee Segment Earnings $ Millions $1,420 $588 $753 $1,311 $1,884 4Q19 1Q20 2Q20 3Q20 4Q20 Guarantee fees charged on new acquisitions (bps)10 $1,994 $2,020 $2,061 $2,179 $2,326 $1,701 $1,739 $1,794 $1,928 $2,093 $293 $281 $267 $251 $233 Core single-family portfolio (loans originated post-2008) Legacy and relief refinance single-family portfolio 4Q19 1Q20 2Q20 3Q20 4Q20 17% YoY increase Credit guarantee portfolio $ Billions Serious delinquency rates7 (85 ) 86 87 88 (90 ) New business activity $ Billions

8© Freddie Mac 752 752 758 761 761 4Q19 1Q20 2Q20 3Q20 4Q20 13% 14% 10% 10% 10% 4Q19 1Q20 2Q20 3Q20 4Q20 New business activity with debt-to-income ratio > 45% Weighted average original loan-to-value ratio (OLTV) Weighted average original credit score 75% 74% 72% 71% 70% 4Q19 1Q20 2Q20 3Q20 4Q20 Single-Family Guarantee Loan Purchase Credit Characteristics4 43% 40% 26% 30% 28% 20% 21% 18% 16% 18% 37% 39% 56% 54% 54% 4% 5% 3% 3% 4% Home purchase Cash-out refinance Other refinance Investment properties as a percentage of loan purchases 4Q19 1Q20 2Q20 3Q20 4Q20 Loan purpose and investment properties as a percentage of loan purchases
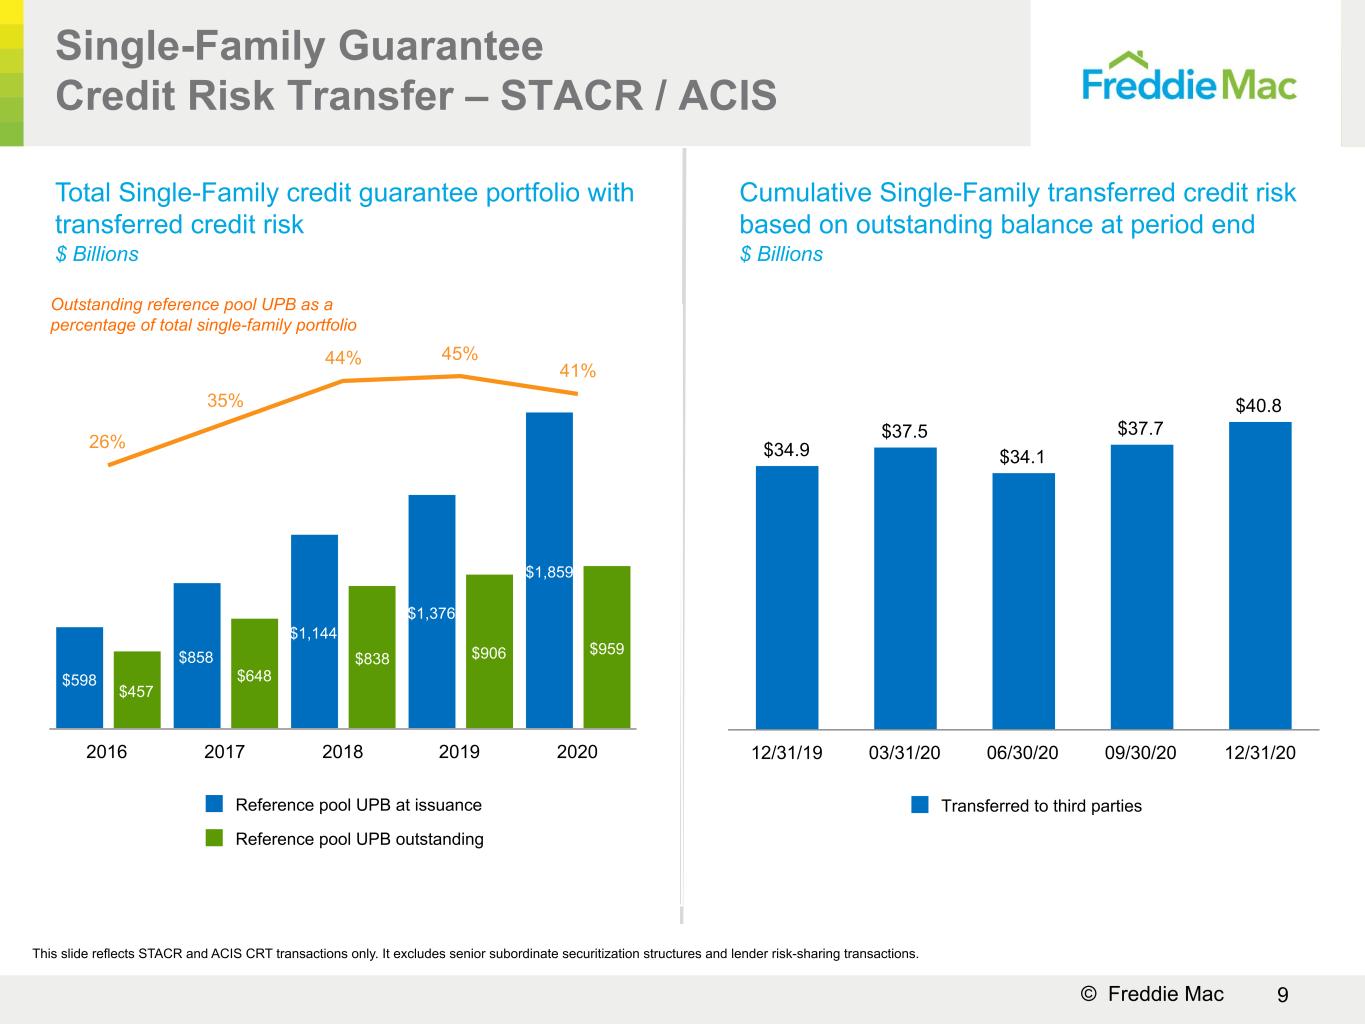
9© Freddie Mac Total Single-Family credit guarantee portfolio with transferred credit risk $ Billions $598 $858 $1,144 $1,376 $1,859 $457 $648 $838 $906 $959 26% 35% 44% 45% 41% Reference pool UPB at issuance Reference pool UPB outstanding 2016 2017 2018 2019 2020 Outstanding reference pool UPB as a percentage of total single-family portfolio Cumulative Single-Family transferred credit risk based on outstanding balance at period end $ Billions $34.9 $37.5 $34.1 $37.7 $40.8 Transferred to third parties 12/31/19 03/31/20 06/30/20 09/30/20 12/31/20 Single-Family Guarantee Credit Risk Transfer – STACR / ACIS This slide reflects STACR and ACIS CRT transactions only. It excludes senior subordinate securitization structures and lender risk-sharing transactions.

10© Freddie Mac Multifamily acquisitions of units by area median income (AMI) (% of eligible units acquired) 94% 91% 93% 94% 96% 6% 9% 7% 6% 4% ≤120% AMI >120% AMI 2016 2017 2018 2019 2020 69% 69% 69% 66% 70% 4Q19 1Q20 2Q20 3Q20 4Q20 1.32 1.42 1.36 1.42 1.38 4Q19 1Q20 2Q20 3Q20 4Q20 Weighted average original loan-to-value ratio (OLTV) for new business activity Multifamily Financial Highlights and Key Metrics Weighted average original debt service coverage ratio (ODSCR) for new business activity Multifamily comprehensive income (loss) $ Millions $502 $(174) $1,063 $1,177 $1,149 4Q19 1Q20 2Q20 3Q20 4Q20 (89 %)

11© Freddie Mac Multifamily securitization activity11,12 $ Billions $52.1 $67.5 $72.8 $75.4 $75.0 $49.9 $60.7 $66.3 $67.9 $65.7 $2.2 $6.8 $6.5 $7.5 $9.3 Primary securitization products Other securitization products 2016 2017 2018 2019 2020 $56.8 $73.2 $78.0 $78.4 $83.0 $56.8 $73.2 $77.5 $77.9 $82.5 $0.5 $0.5 $0.5 New loan purchase activity LIHTC new business activity 2016 2017 2018 2019 2020 Multifamily Key Metrics, continued New business activity4 $ Billions Note: Totals may not add due to rounding.

12© Freddie Mac Freddie Mac (60+ day) FDIC insured institutions (90+ day) MF CMBS market (60+ day) ACLI investment bulletin (60+ day) 4Q16 4Q17 4Q18 4Q19 4Q20 $213 $249 $280 $353 $158 $203 $237 $271 $312 $13 $7 $7 $6 $4 $42 $39 $36 $33 $36 Guarantee portfolio Mortgage-related securities Unsecuritized loans and other 12/31/16 12/31/17 12/31/18 12/31/19 12/31/20 Multifamily market and Freddie Mac delinquency rates8 Total portfolio unit count In Thousands Total portfolio loan count In Thousands Total portfolio $ Billions 17 21 24 27 29 12/31/16 12/31/17 12/31/18 12/31/19 12/31/20 Multifamily Portfolio Metrics 66% increase since 2016 (82%) Note: Totals may not add due to rounding. (74%) (85%) (88%) (88%) $309 3,404 3,946 4,289 4,305 4,598 12/31/16 12/31/17 12/31/18 12/31/19 12/31/20 0.22% 0.10% 1.95% 0.16%
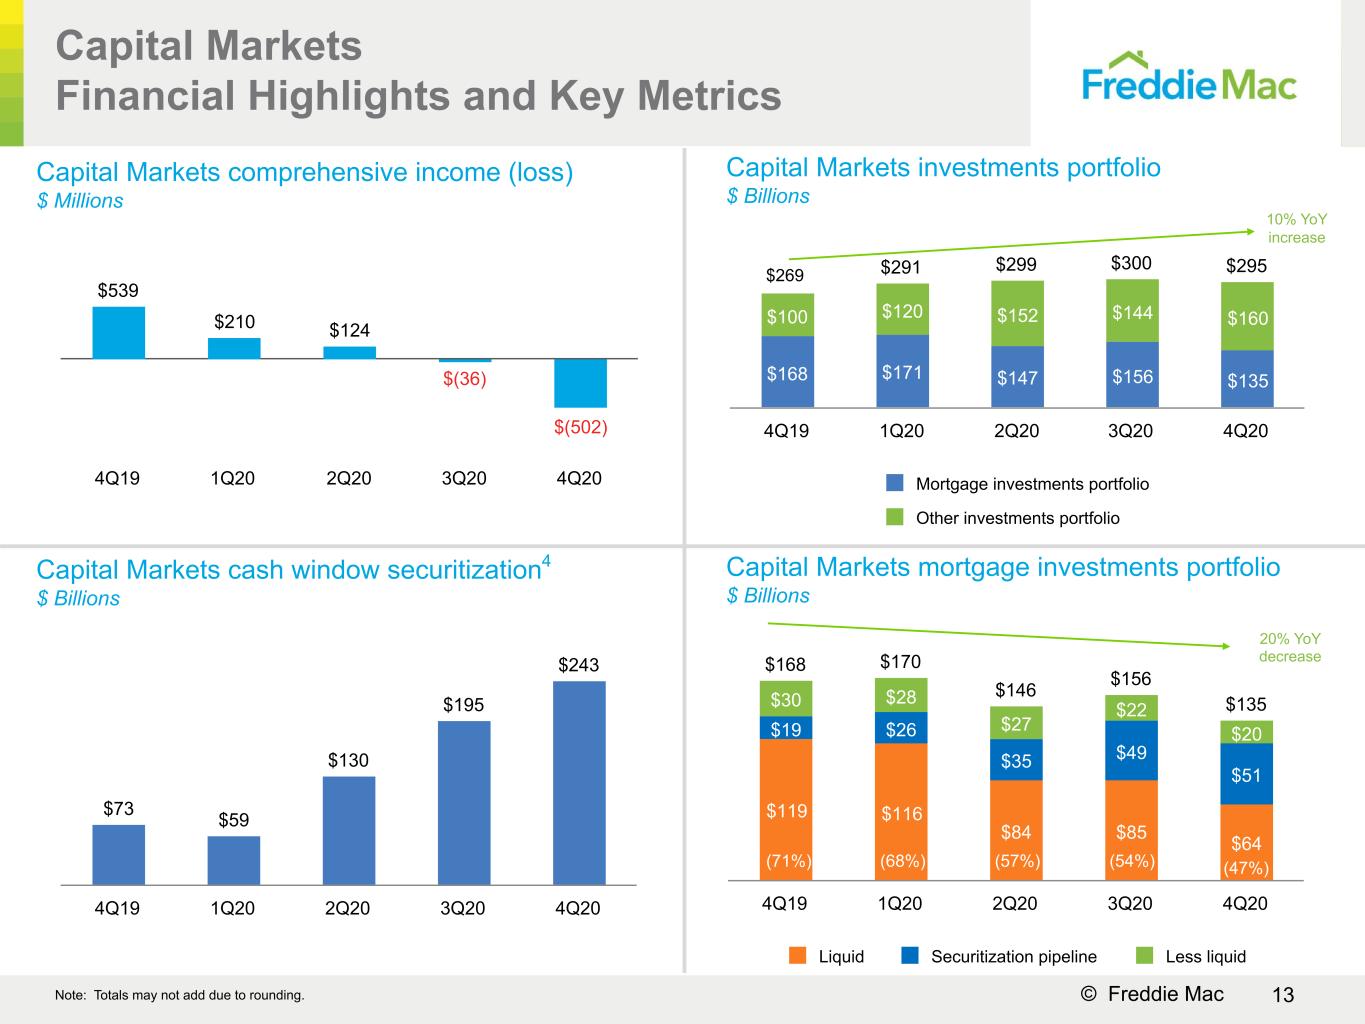
13© Freddie Mac $168 $170 $146 $156 $135 $119 $116 $84 $85 $64 $19 $26 $35 $49 $51 $30 $28 $27 $22 $20 Liquid Securitization pipeline Less liquid 4Q19 1Q20 2Q20 3Q20 4Q20 Capital Markets Financial Highlights and Key Metrics Note: Totals may not add due to rounding. $268 $291 $299 $300 $295 $168 $171 $147 $156 $135 $100 $120 $152 $144 $160 Mortgage investments portfolio Other investments portfolio 4Q19 1Q20 2Q20 3Q20 4Q20 $539 $210 $124 $(36) $(502) 4Q19 1Q20 2Q20 3Q20 4Q20 Capital Markets investments portfolio $ Billions 10% YoY increase Capital Markets cash window securitization4 $ Billions $73 $59 $130 $195 $243 4Q19 1Q20 2Q20 3Q20 4Q20 Capital Markets mortgage investments portfolio $ Billions 20% YoY decrease Capital Markets comprehensive income (loss) $ Millions (71%) (68%) (57%) (54%) (47%) 9
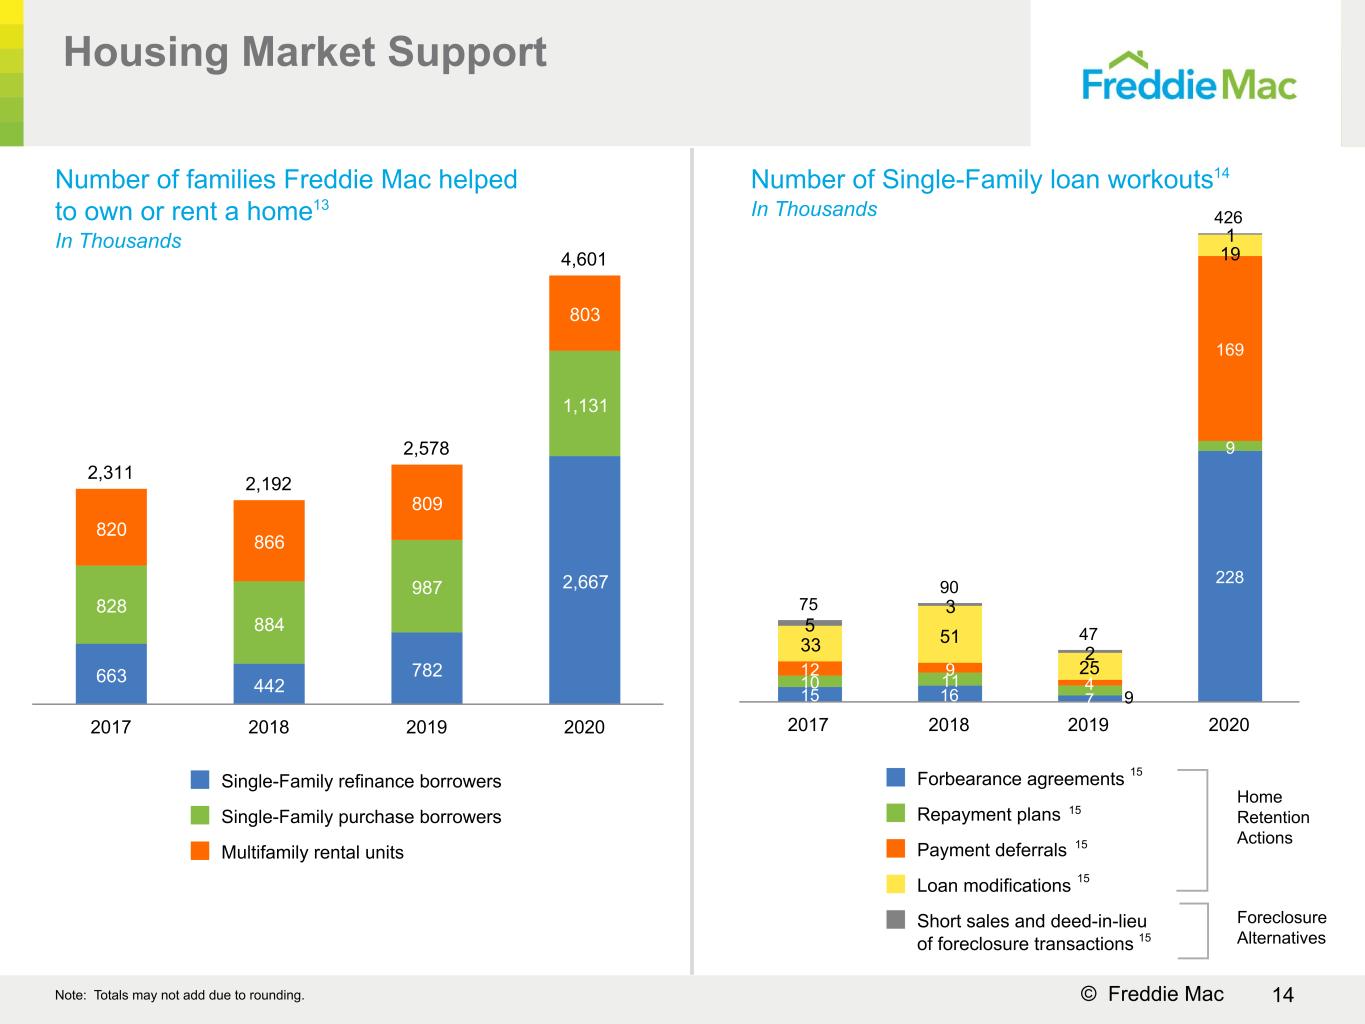
14© Freddie Mac Number of families Freddie Mac helped to own or rent a home13 In Thousands 75 90 47 426 15 16 7 228 10 11 9 12 9 4 169 33 51 25 19 5 3 2 1 Forbearance agreements Repayment plans Payment deferrals Loan modifications Short sales and deed-in-lieu of foreclosure transactions 2017 2018 2019 2020 Housing Market Support Home Retention Actions 2,311 2,192 2,578 4,601 663 442 782 2,667 828 884 987 1,131 820 866 809 803 Single-Family refinance borrowers Single-Family purchase borrowers Multifamily rental units 2017 2018 2019 2020 Note: Totals may not add due to rounding. Foreclosure Alternatives 15 15 15 15 15 9 Number of Single-Family loan workouts14 In Thousands
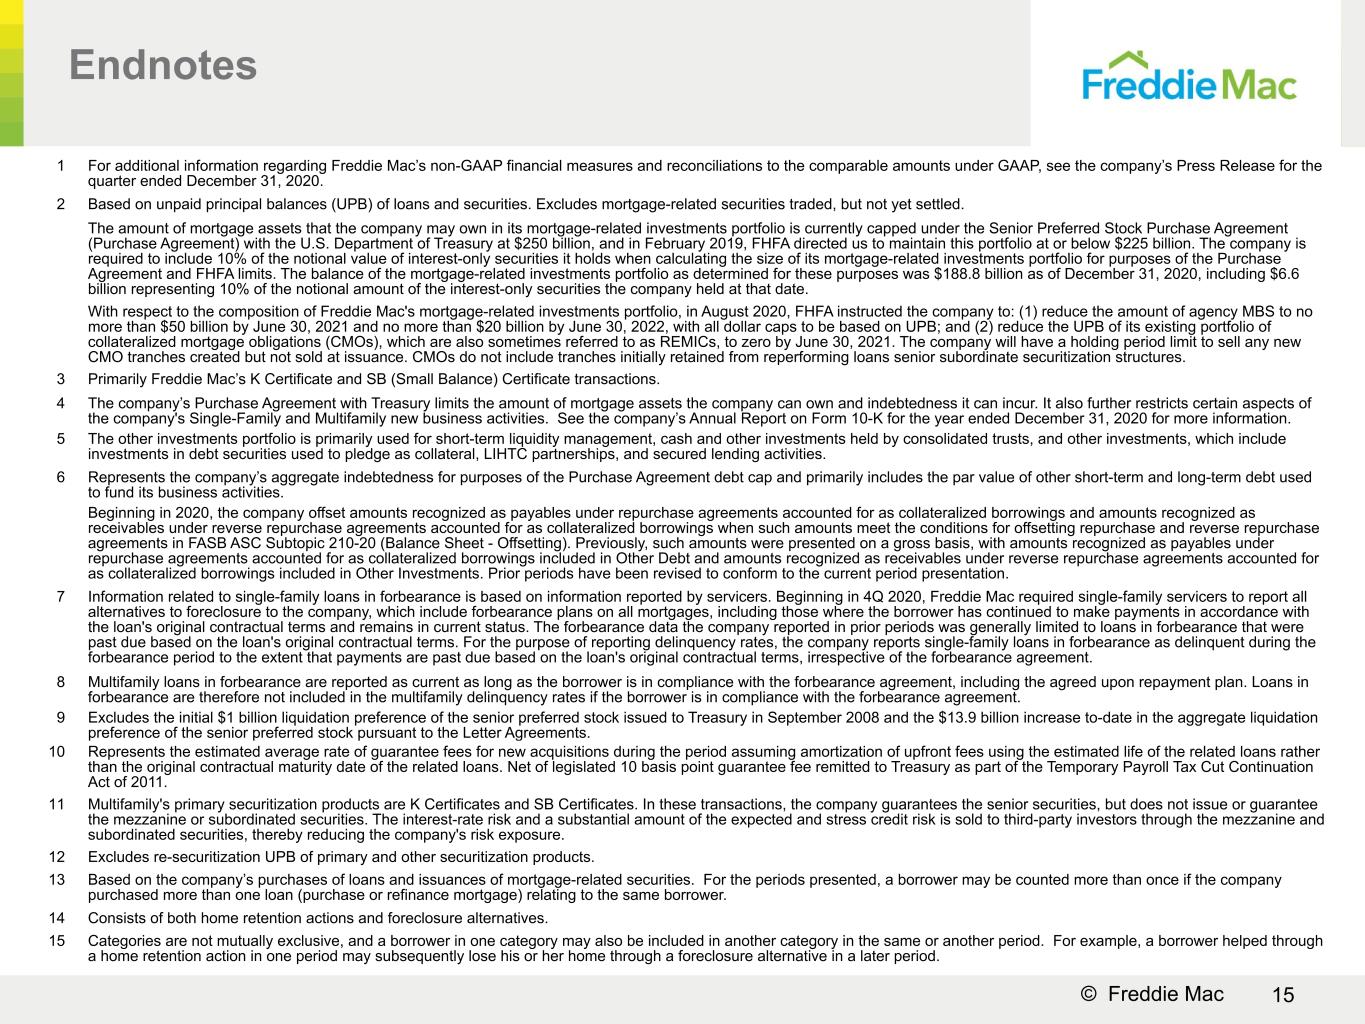
15© Freddie Mac Endnotes 1 For additional information regarding Freddie Mac’s non-GAAP financial measures and reconciliations to the comparable amounts under GAAP, see the company’s Press Release for the quarter ended December 31, 2020. 2 Based on unpaid principal balances (UPB) of loans and securities. Excludes mortgage-related securities traded, but not yet settled. The amount of mortgage assets that the company may own in its mortgage-related investments portfolio is currently capped under the Senior Preferred Stock Purchase Agreement (Purchase Agreement) with the U.S. Department of Treasury at $250 billion, and in February 2019, FHFA directed us to maintain this portfolio at or below $225 billion. The company is required to include 10% of the notional value of interest-only securities it holds when calculating the size of its mortgage-related investments portfolio for purposes of the Purchase Agreement and FHFA limits. The balance of the mortgage-related investments portfolio as determined for these purposes was $188.8 billion as of December 31, 2020, including $6.6 billion representing 10% of the notional amount of the interest-only securities the company held at that date. With respect to the composition of Freddie Mac's mortgage-related investments portfolio, in August 2020, FHFA instructed the company to: (1) reduce the amount of agency MBS to no more than $50 billion by June 30, 2021 and no more than $20 billion by June 30, 2022, with all dollar caps to be based on UPB; and (2) reduce the UPB of its existing portfolio of collateralized mortgage obligations (CMOs), which are also sometimes referred to as REMICs, to zero by June 30, 2021. The company will have a holding period limit to sell any new CMO tranches created but not sold at issuance. CMOs do not include tranches initially retained from reperforming loans senior subordinate securitization structures. 3 Primarily Freddie Mac’s K Certificate and SB (Small Balance) Certificate transactions. 4 The company’s Purchase Agreement with Treasury limits the amount of mortgage assets the company can own and indebtedness it can incur. It also further restricts certain aspects of the company's Single-Family and Multifamily new business activities. See the company’s Annual Report on Form 10-K for the year ended December 31, 2020 for more information. 5 The other investments portfolio is primarily used for short-term liquidity management, cash and other investments held by consolidated trusts, and other investments, which include investments in debt securities used to pledge as collateral, LIHTC partnerships, and secured lending activities. 6 Represents the company’s aggregate indebtedness for purposes of the Purchase Agreement debt cap and primarily includes the par value of other short-term and long-term debt used to fund its business activities. Beginning in 2020, the company offset amounts recognized as payables under repurchase agreements accounted for as collateralized borrowings and amounts recognized as receivables under reverse repurchase agreements accounted for as collateralized borrowings when such amounts meet the conditions for offsetting repurchase and reverse repurchase agreements in FASB ASC Subtopic 210-20 (Balance Sheet - Offsetting). Previously, such amounts were presented on a gross basis, with amounts recognized as payables under repurchase agreements accounted for as collateralized borrowings included in Other Debt and amounts recognized as receivables under reverse repurchase agreements accounted for as collateralized borrowings included in Other Investments. Prior periods have been revised to conform to the current period presentation. 7 Information related to single-family loans in forbearance is based on information reported by servicers. Beginning in 4Q 2020, Freddie Mac required single-family servicers to report all alternatives to foreclosure to the company, which include forbearance plans on all mortgages, including those where the borrower has continued to make payments in accordance with the loan's original contractual terms and remains in current status. The forbearance data the company reported in prior periods was generally limited to loans in forbearance that were past due based on the loan's original contractual terms. For the purpose of reporting delinquency rates, the company reports single-family loans in forbearance as delinquent during the forbearance period to the extent that payments are past due based on the loan's original contractual terms, irrespective of the forbearance agreement. 8 Multifamily loans in forbearance are reported as current as long as the borrower is in compliance with the forbearance agreement, including the agreed upon repayment plan. Loans in forbearance are therefore not included in the multifamily delinquency rates if the borrower is in compliance with the forbearance agreement. 9 Excludes the initial $1 billion liquidation preference of the senior preferred stock issued to Treasury in September 2008 and the $13.9 billion increase to-date in the aggregate liquidation preference of the senior preferred stock pursuant to the Letter Agreements. 10 Represents the estimated average rate of guarantee fees for new acquisitions during the period assuming amortization of upfront fees using the estimated life of the related loans rather than the original contractual maturity date of the related loans. Net of legislated 10 basis point guarantee fee remitted to Treasury as part of the Temporary Payroll Tax Cut Continuation Act of 2011. 11 Multifamily's primary securitization products are K Certificates and SB Certificates. In these transactions, the company guarantees the senior securities, but does not issue or guarantee the mezzanine or subordinated securities. The interest-rate risk and a substantial amount of the expected and stress credit risk is sold to third-party investors through the mezzanine and subordinated securities, thereby reducing the company's risk exposure. 12 Excludes re-securitization UPB of primary and other securitization products. 13 Based on the company’s purchases of loans and issuances of mortgage-related securities. For the periods presented, a borrower may be counted more than once if the company purchased more than one loan (purchase or refinance mortgage) relating to the same borrower. 14 Consists of both home retention actions and foreclosure alternatives. 15 Categories are not mutually exclusive, and a borrower in one category may also be included in another category in the same or another period. For example, a borrower helped through a home retention action in one period may subsequently lose his or her home through a foreclosure alternative in a later period.

16© Freddie Mac Safe Harbor Statements Freddie Mac obligations Freddie Mac’s securities are obligations of Freddie Mac only. The securities, including any interest or return of discount on the securities, are not guaranteed by and are not debts or obligations of the United States or any federal agency or instrumentality other than Freddie Mac. No offer or solicitation of securities This presentation includes information related to, or referenced in the offering documentation for, certain Freddie Mac securities, including offering circulars and related supplements and agreements. Freddie Mac securities may not be eligible for offer or sale in certain jurisdictions or to certain persons. This information is provided for your general information only, is current only as of its specified date and does not constitute an offer to sell or a solicitation of an offer to buy securities. The information does not constitute a sufficient basis for making a decision with respect to the purchase or sale of any security. All information regarding or relating to Freddie Mac securities is qualified in its entirety by the relevant offering circular and any related supplements. Investors should review the relevant offering circular and any related supplements before making a decision with respect to the purchase or sale of any security. In addition, before purchasing any security, please consult your legal and financial advisors for information about and analysis of the security, its risks and its suitability as an investment in your particular circumstances. Forward-looking statements Freddie Mac's presentations may contain forward-looking statements, which may include statements pertaining to the conservatorship, the company’s current expectations and objectives for its Single-family Guarantee, Multifamily, and Capital Markets segments, its efforts to assist the housing market, liquidity and capital management, economic and market conditions and trends, the effects of the COVID-19 pandemic and actions taken in response thereto on its business, financial condition, and liquidity, its market share, the effect of legislative and regulatory developments and new accounting guidance, credit quality of loans the company owns or guarantees, the costs and benefits of the company’s credit risk transfer transactions, and results of operations and financial condition on a GAAP, Segment Earnings, non-GAAP and fair value basis. Forward-looking statements involve known and unknown risks and uncertainties, some of which are beyond the company’s control. Management’s expectations for the company’s future necessarily involve a number of assumptions, judgments, and estimates, and various factors, including changes in market conditions, liquidity, mortgage spreads, credit outlook, actions by the U.S. government (including FHFA, Treasury, Congress, and state and local governments), and the impacts of legislation or regulations and new or amended accounting guidance, could cause actual results to differ materially from these expectations. These assumptions, judgments, estimates and factors are discussed in the company’s Annual Report on Form 10-K for the year ended December 31, 2020, and Current Reports on Form 8-K, which are available on the Investor Relations page of the company’s website at www.freddiemac.com/investors and the SEC’s website at www.sec.gov. The company undertakes no obligation to update forward-looking statements it makes to reflect events or circumstances occurring after the date of this presentation.
