Attached files
| file | filename |
|---|---|
| 8-K - FORM 8-K - Stock Yards Bancorp, Inc. | f8k_020921.htm |
Exhibit 99.1
Stock Yards Bancorp KBW Winter Financial Services Symposium V irtual Event February 10 - 11, 2021
Cautionary statement for investors 2 This presentation contains forward - looking statements about future financial performance, business plans and strategies of Stock Yards Bancorp , Inc . Because forward - looking statements involve risks and uncertainties, actual results may differ materially from those expressed or implied . We caution investors not to place undue reliance on these forward - looking statements and advise them to carefully review the risk factors described in documents that the Company files with the Securities and Exchange Commission, including the Company’s most recent Annual Report on Form 10 - K and Quarterly Report on Form 10 - Q .
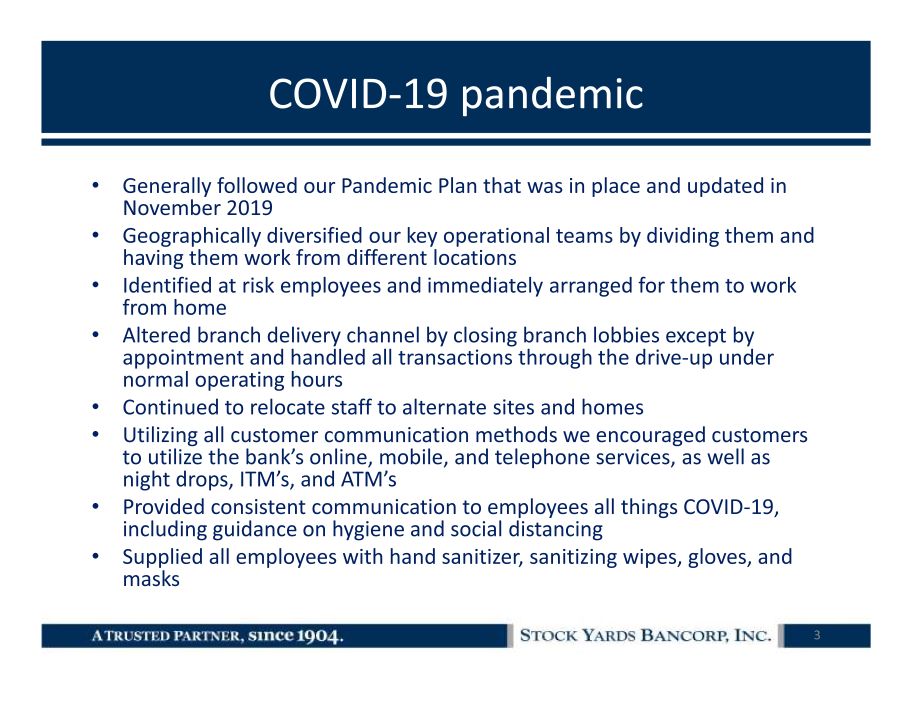
COVID - 19 pandemic • Generally followed our Pandemic Plan that was in place and updated in November 2019 • Geographically diversified our key operational teams by dividing them and having them work from different locations • Identified at risk employees and immediately arranged for them to work from home • Altered branch delivery channel by closing branch lobbies except by appointment and handled all transactions through the drive - up under normal operating hours • Continued to relocate staff to alternate sites and homes • Utilizing all customer communication methods we encouraged customers to utilize the bank’s online, mobile, and telephone services, as well as night drops, ITM’s, and ATM’s • Provided consistent communication to employees all things COVID - 19, including guidance on hygiene and social distancing • Supplied all employees with hand sanitizer, sanitizing wipes, gloves, and masks 3
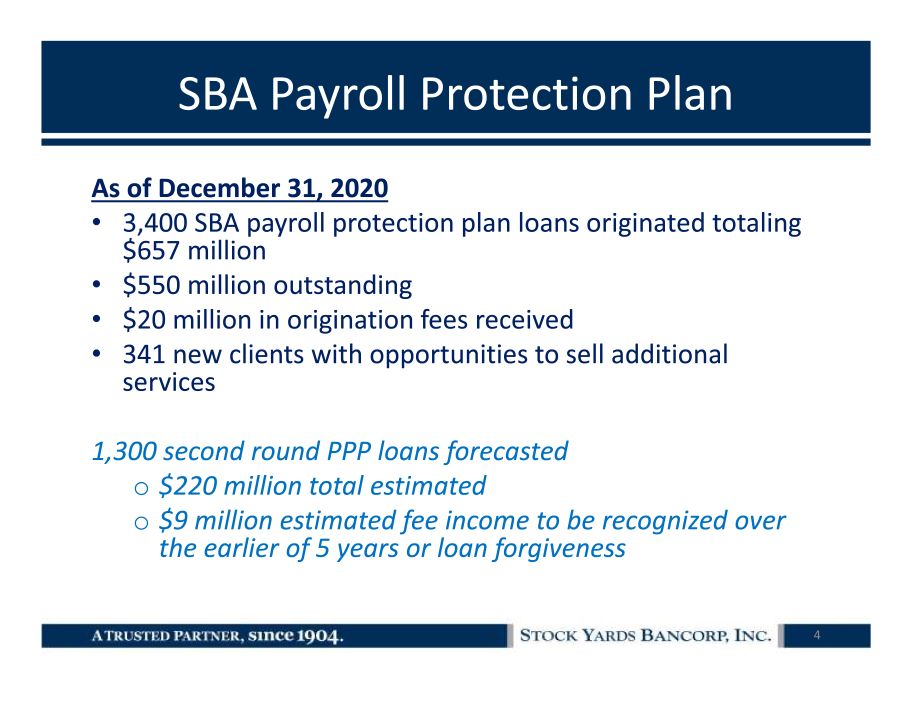
SBA Payroll Protection Plan As of December 31, 2020 • 3,400 SBA payroll protection plan loans originated totaling $657 million • $550 million outstanding • $20 million in origination fees received • 341 new clients with opportunities to sell additional services 1,300 second round PPP loans forecasted o $220 million total estimated o $9 million estimated fee income to be recognized over the earlier of 5 years or loan forgiveness 4
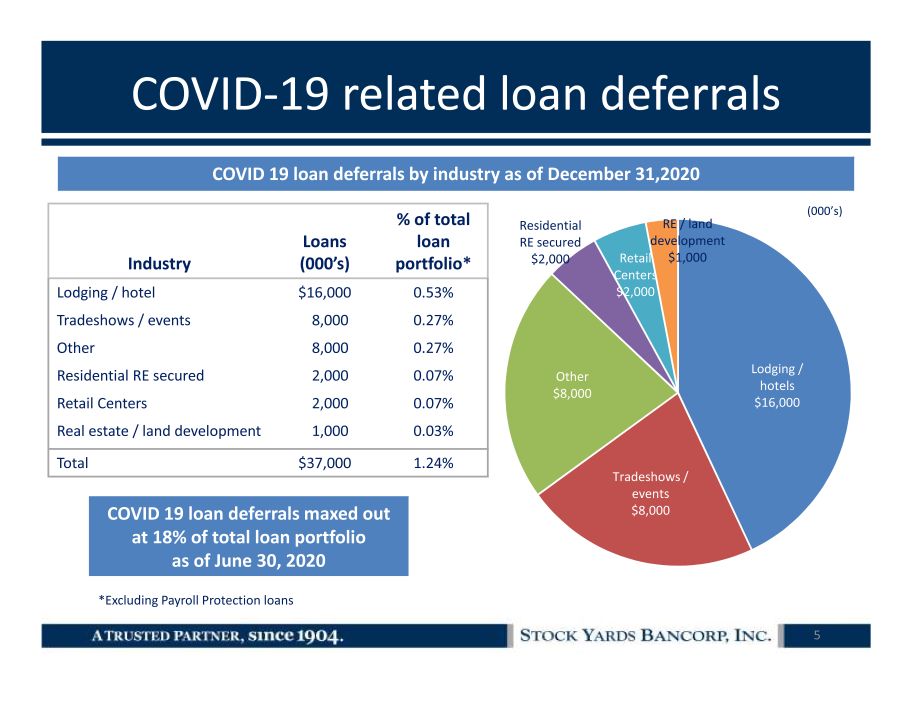
COVID - 19 related loan deferrals Industry Loans (000’s) % of total loan portfolio* Lodging / hotel $16,000 0.53% Tradeshows / events 8,000 0.27% Other 8,000 0.27% Residential RE secured 2,000 0.07% Retail Centers 2,000 0.07% Real estate / land development 1,000 0.03% Total $37,000 1.24% Lodging / hotels $16,000 Tradeshows / events $8,000 Other $8,000 Residential RE secured $2,000 Retail Centers $2,000 RE / land development $1,000 (000’s) 5 COVID 19 loan deferrals by industry as of December 31,2020 *Excluding Payroll Protection loans COVID 19 loan deferrals maxed out at 18% of total loan portfolio as of June 30, 2020
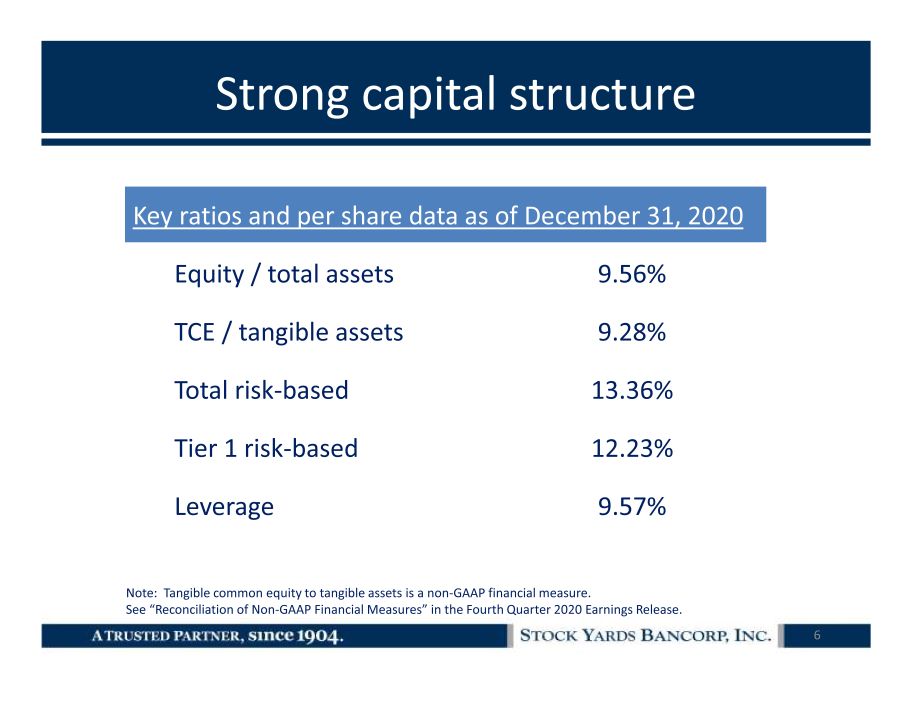
Strong capital structure Key ratios and per share data as of December 31 , 2020 Equity / total assets 9.56% TCE / tangible assets 9.28% Total risk - based 13.36% Tier 1 risk - based 12.23% Leverage 9.57% 6 Note: Tangible common equity to tangible assets is a non - GAAP financial measure. See “Reconciliation of Non - GAAP Financial Measures” in the Fourth Quarter 2020 Earnings Release.
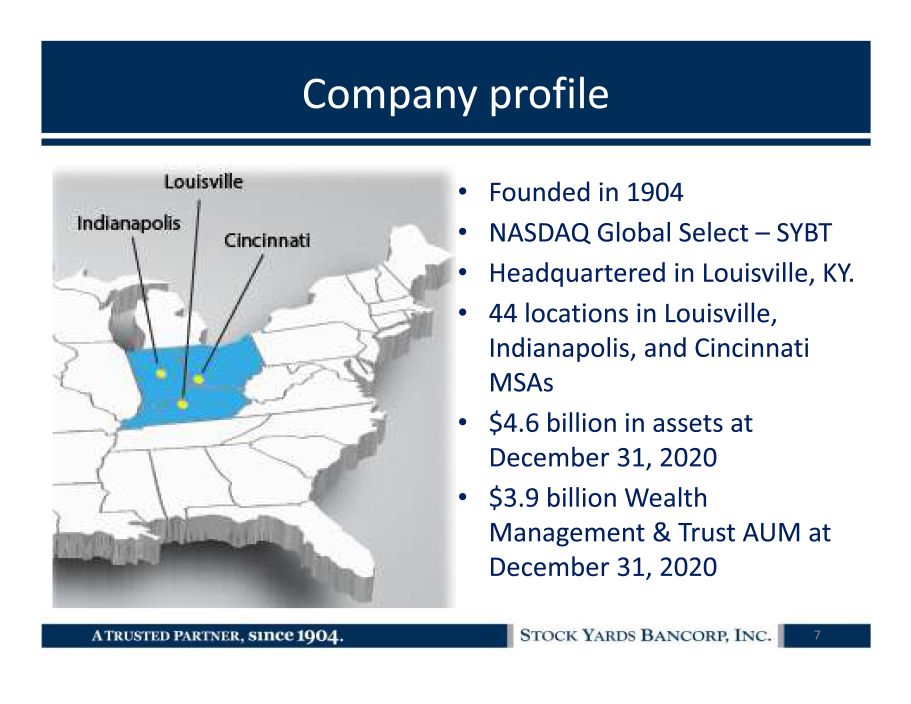
Company profile 7 • Founded in 1904 • NASDAQ Global Select – SYBT • Headquartered in Louisville, KY. • 44 locations in Louisville, Indianapolis, and Cincinnati MSAs • $4.6 billion in assets at December 31, 2020 • $3.9 billion Wealth Management & Trust AUM at December 31, 2020
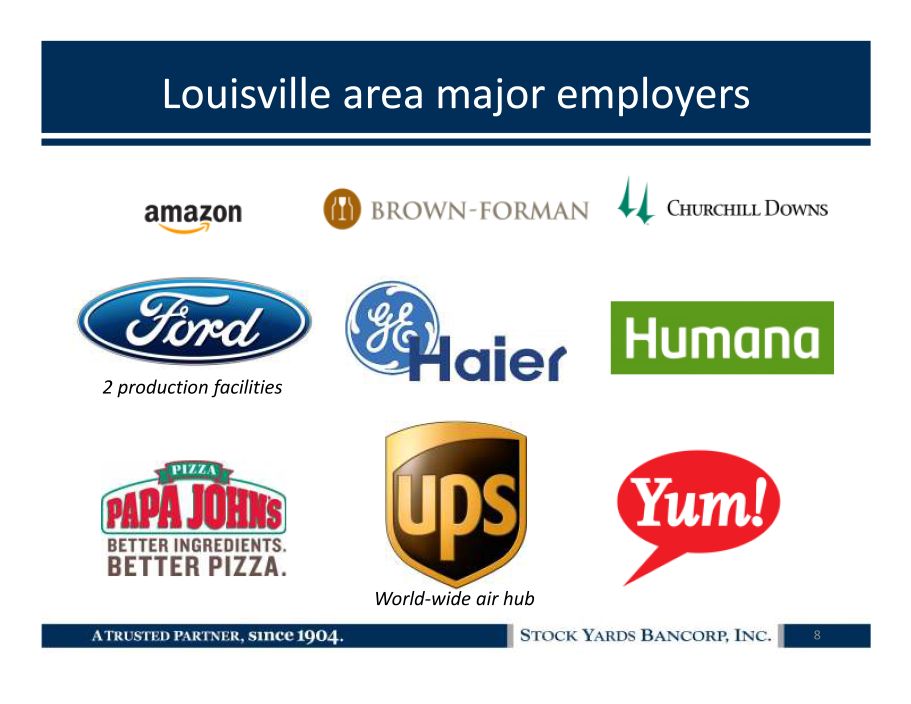
Louisville area major employers 8 World - wide air hub 2 production facilities
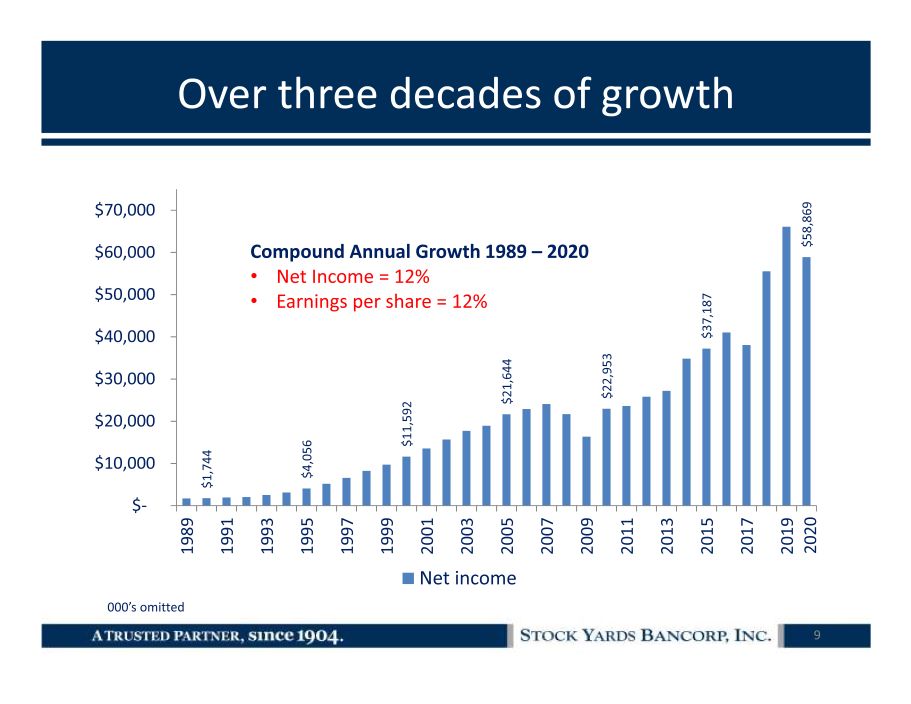
Over three decades of growth $1,744 $4,056 $11,592 $21,644 $22,953 $37,187 $58,869 $- $10,000 $20,000 $30,000 $40,000 $50,000 $60,000 $70,000 1989 1991 1993 1995 1997 1999 2001 2003 2005 2007 2009 2011 2013 2015 2017 2019 Net income Compound Annual Growth 1989 – 2020 • Net Income = 12% • Earnings per share = 12% 000’s omitted 9 2020
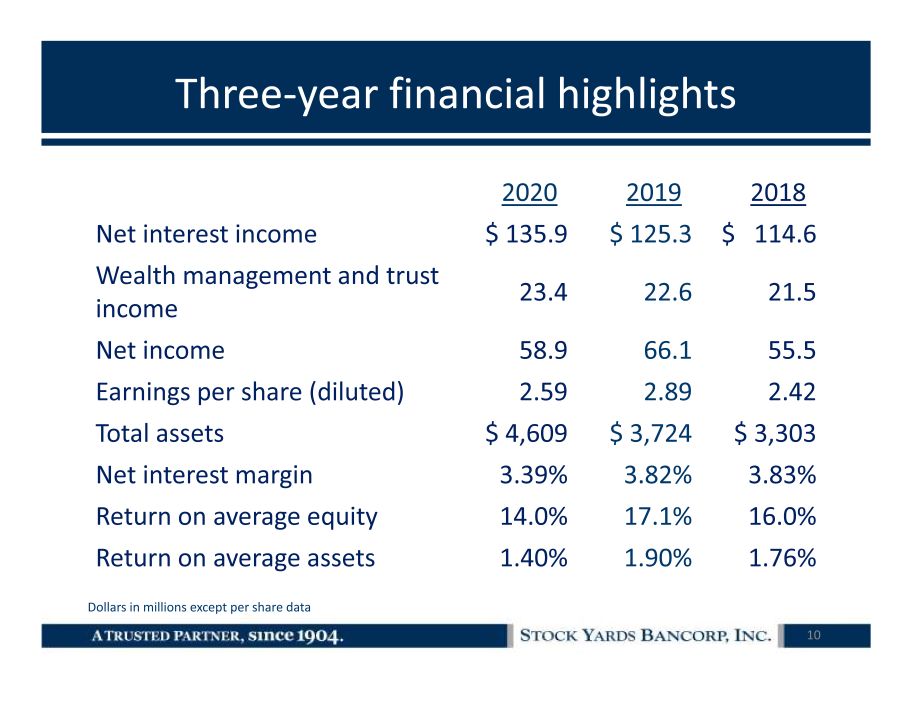
Three - year financial highlights 10 2020 2019 2018 Net interest income $ 135.9 $ 125.3 $ 114.6 Wealth management and trust income 23.4 22.6 21.5 Net income 58.9 66.1 55.5 Earnings per share (diluted) 2.59 2.89 2.42 Total assets $ 4,609 $ 3,724 $ 3,303 Net interest margin 3.39% 3.82% 3.83% Return on average equity 14.0% 17.1% 16.0% Return on average assets 1.40% 1.90% 1.76% Dollars in millions except per share data
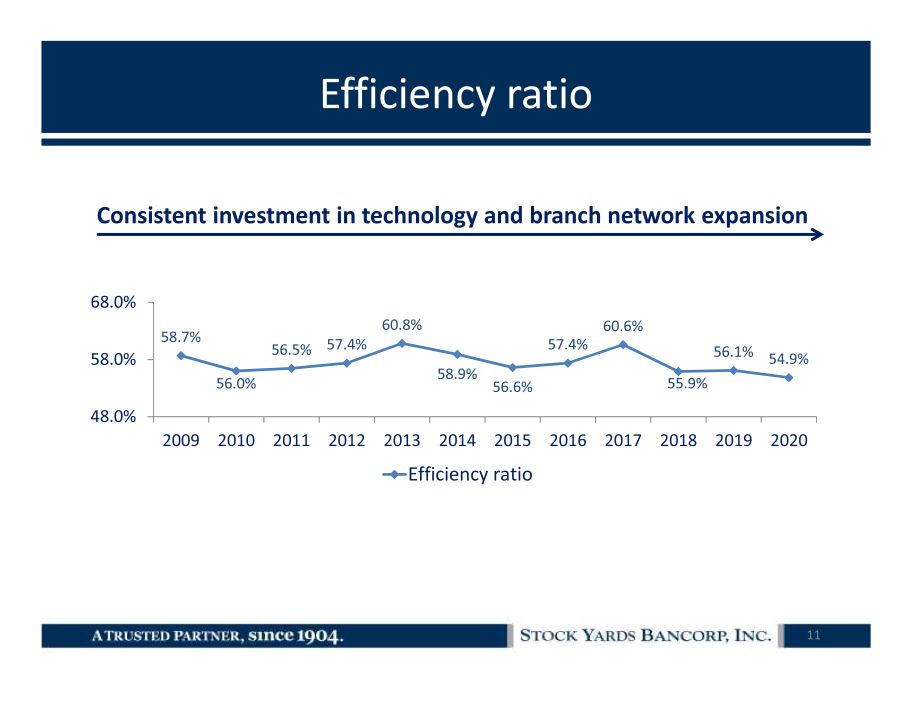
Efficiency ratio 58.7% 56.0% 56.5% 57.4% 60.8% 58.9% 56.6% 57.4% 60.6% 55.9% 56.1% 54.9% 48.0% 58.0% 68.0% 2009 2010 2011 2012 2013 2014 2015 2016 2017 2018 2019 2020 Efficiency ratio Consistent investment in technology and branch network expansion 11
Key drivers for 2021 and beyond • Continued attraction and retention of talented people • Commercial banking focus leading to full relationships • Organic business model with sustainable growth in large mature markets complimented by acquisition • Growing core deposit base • Diverse and enviable non - interest income streams 12
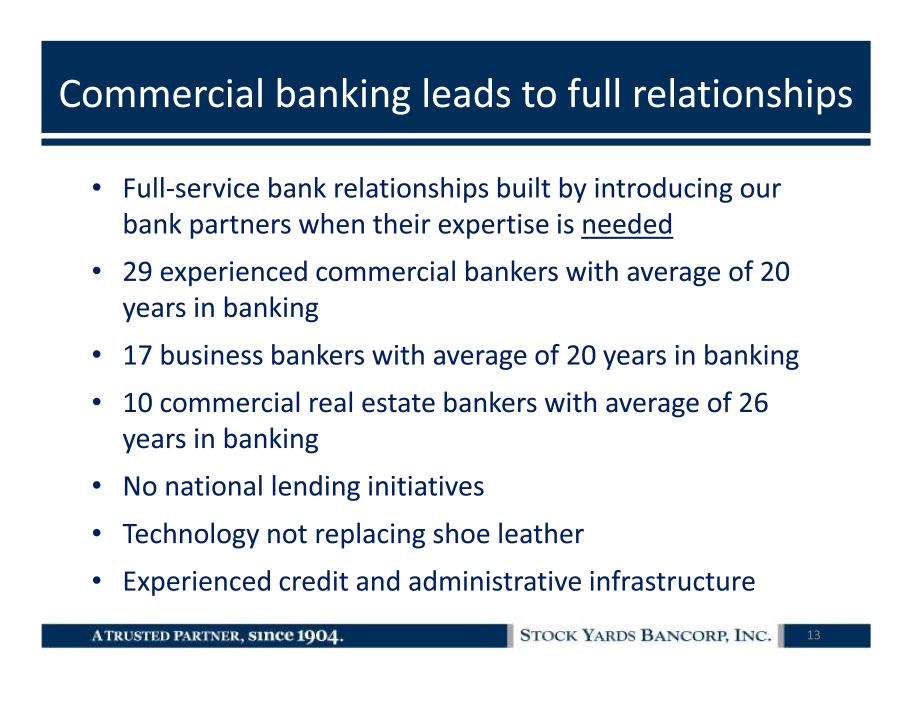
Commercial banking leads to full relationships • Full - service bank relationships built by introducing our bank partners when their expertise is needed • 29 experienced commercial bankers with average of 20 years in banking • 17 business bankers with average of 20 years in banking • 10 commercial real estate bankers with average of 26 years in banking • No national lending initiatives • Technology not replacing shoe leather • Experienced credit and administrative infrastructure 13
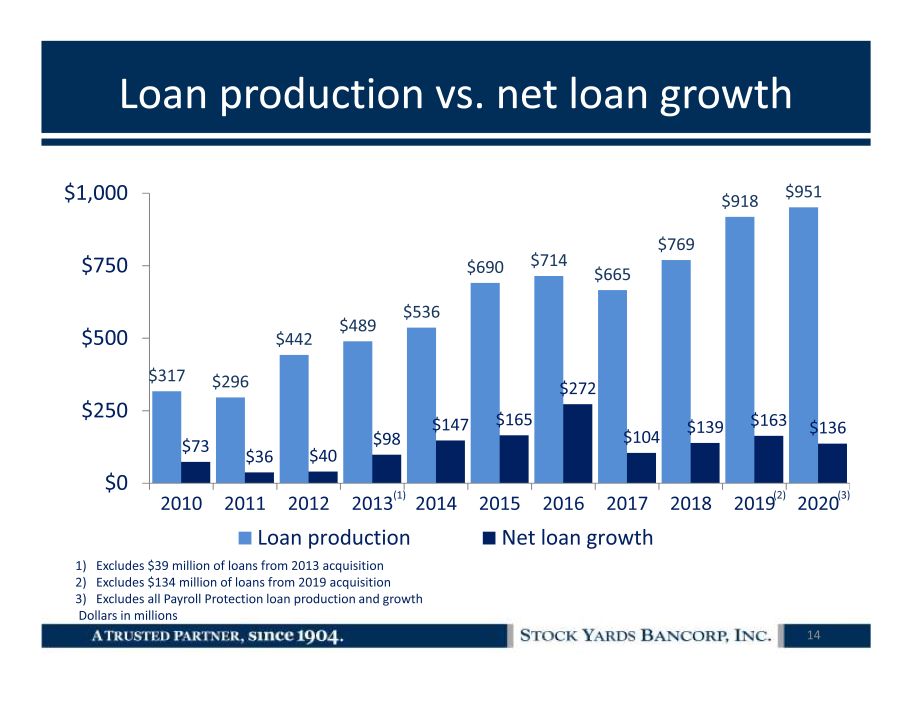
Loan production vs. net loan growth 14 $317 $296 $442 $489 $536 $690 $714 $665 $769 $918 $951 $73 $ 36 $40 $98 $147 $165 $272 $104 $139 $163 $136 $0 $250 $500 $750 $1,000 2010 2011 2012 2013 2014 2015 2016 2017 2018 2019 2020 Loan production Net loan growth 1) Excludes $39 million of loans from 2013 acquisition 2) Excludes $134 million of loans from 2019 acquisition 3) Excludes all Payroll Protection loan production and growth Dollars in millions (1) (2) (3)
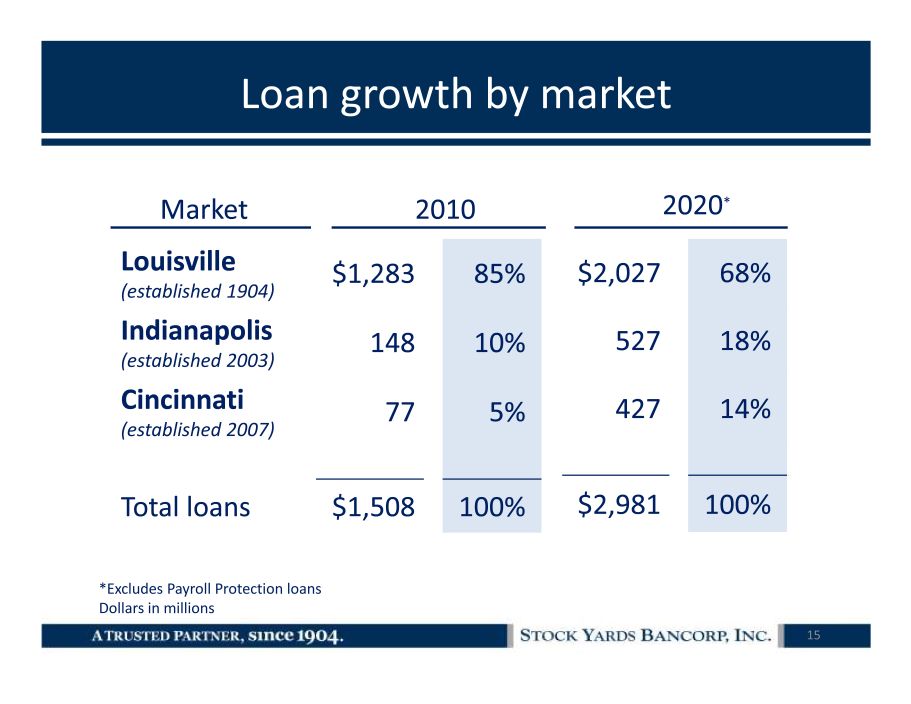
Loan growth by market Louisville (established 1904) $1,283 85% Indianapolis (established 2003) 148 10% Cincinnati (established 2007) 77 5% Total loans $1,508 100% $2,027 68% 527 18% 427 14% $2,981 100% Market 2010 2020 * *Excludes Payroll Protection loans Dollars in millions 15
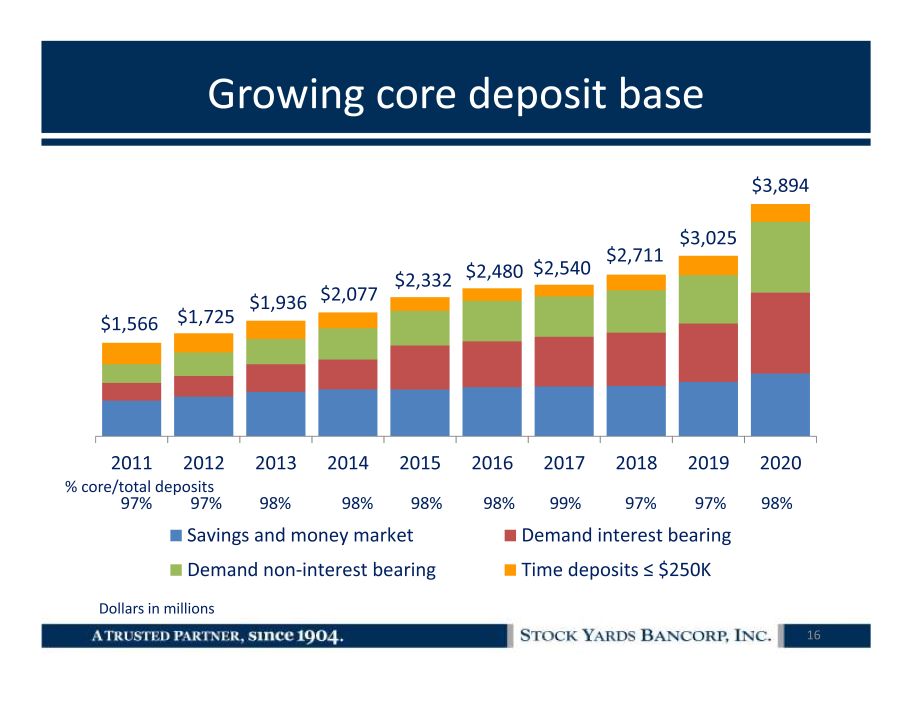
Growing core deposit base Dollars in millions 16 $1,566 $1,725 $1,936 $2,077 $2,332 $ 2,480 $ 2,540 $2,711 $3,025 $3,894 2011 2012 2013 2014 2015 2016 2017 2018 2019 2020 Savings and money market Demand interest bearing Demand non-interest bearing Time deposits ≤ $250K % core/total deposits 97% 97% 98% 98% 98% 99% 97% 98% 98% 97%
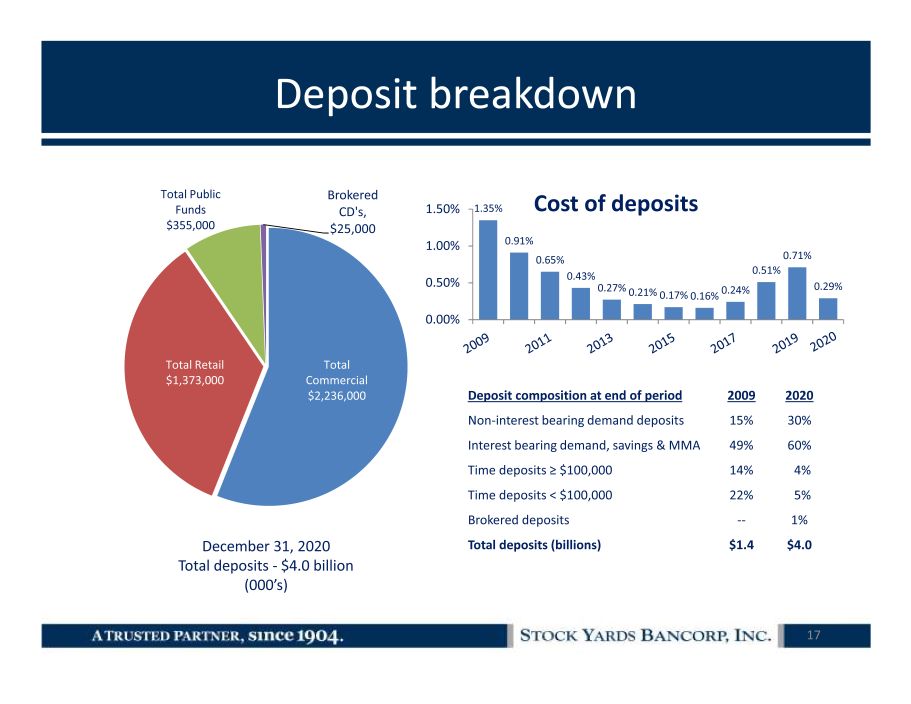
Deposit breakdown Deposit composition at end of period 2009 2020 Non - interest bearing demand deposits 15% 30% Interest bearing demand, savings & MMA 49% 60% Time deposits ≥ $100,000 14% 4% Time deposits < $100,000 22% 5% Brokered deposits -- 1% Total deposits (billions) $1.4 $4.0 1.35% 0.91% 0.65% 0.43% 0.27% 0.21% 0.17% 0.16% 0.24% 0.51% 0.71% 0.29% 0.00% 0.50% 1.00% 1.50% Cost of deposits Total Commercial $2,236,000 Total Retail $1,373,000 Total Public Funds $355,000 Brokered CD's, $25,000 December 31, 2020 Total deposits - $4.0 billion (000’s) 17
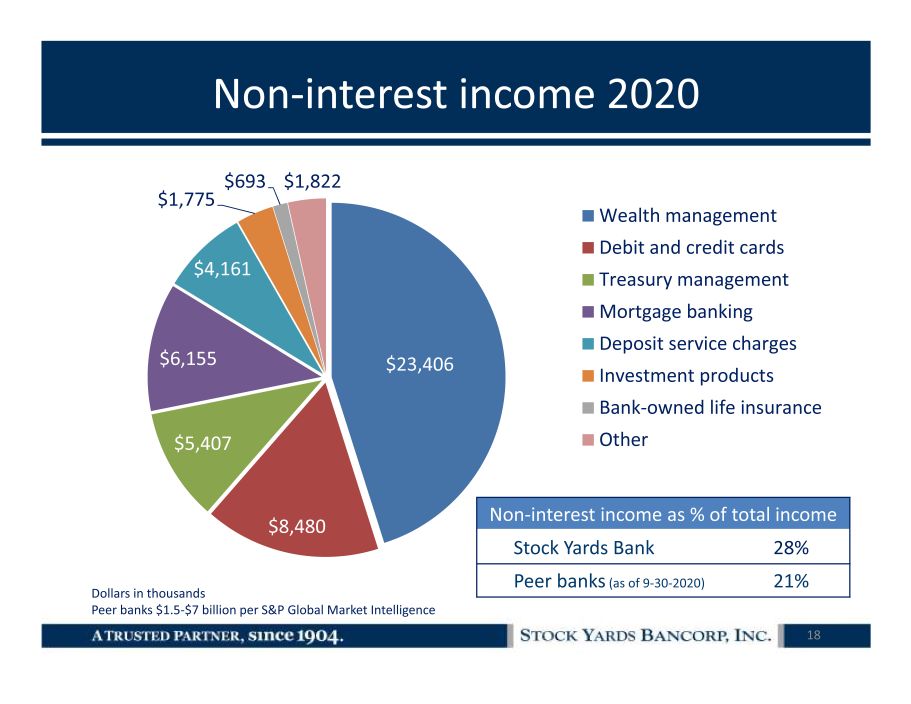
$23,406 $8,480 $5,407 $6,155 $4,161 $1,775 $693 $1,822 Wealth management Debit and credit cards Treasury management Mortgage banking Deposit service charges Investment products Bank-owned life insurance Other Non - interest income 2020 Non - interest income as % of total income Stock Yards Bank 28% Peer banks (as of 9 - 30 - 2020) 21% Dollars in thousands Peer banks $1.5 - $7 billion per S&P Global Market Intelligence 18
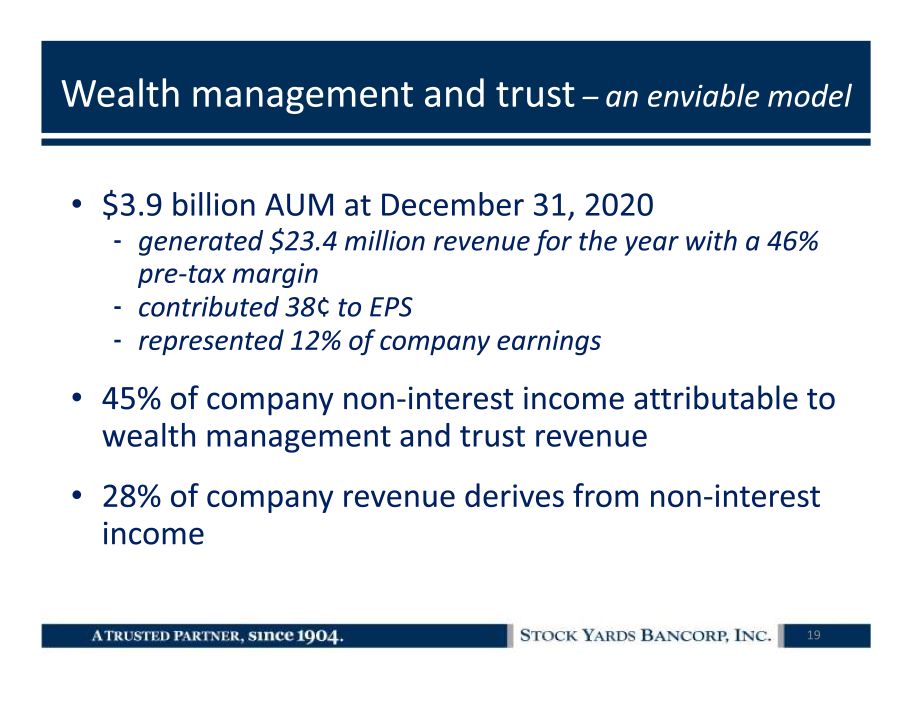
Wealth management and trust – an enviable model 19 • $3.9 billion AUM at December 31, 2020 - generated $23.4 million revenue for the year with a 46% pre - tax margin - contributed 38 ¢ to EPS - represented 12% of company earnings • 45% of company non - interest income attributable to wealth management and trust revenue • 28% of company revenue derives from non - interest income
Key investments points 20 • Industry leading performance • Consistent growth strategy • Diversified revenue streams distinguished by wealth management business with growing card income • Expanding presence in large markets • Positioned for sustainable, profitable growth • We want long term shareholders
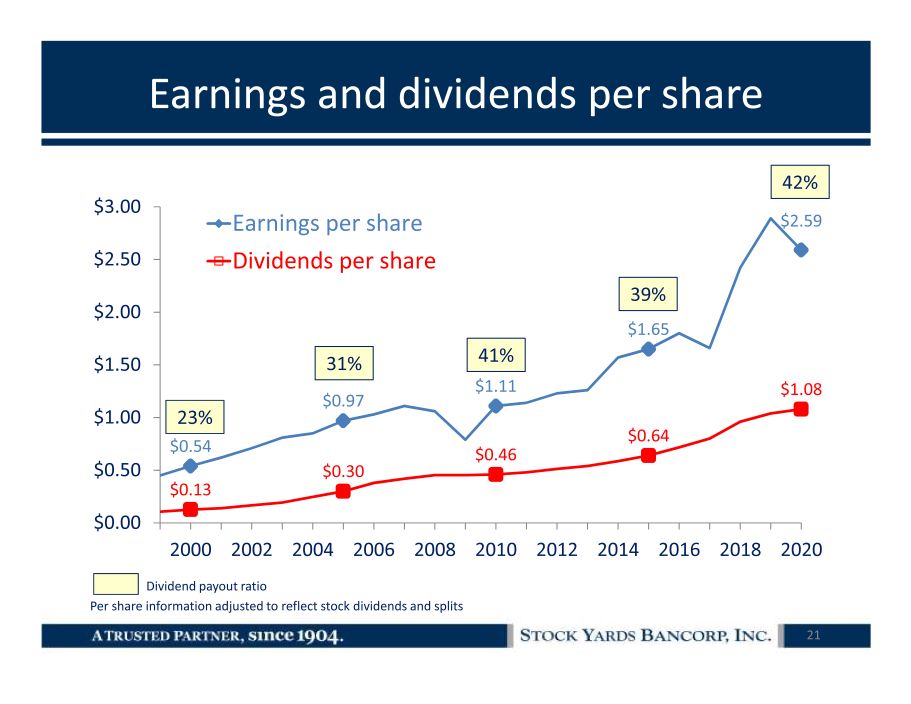
Earnings and dividends per share 21 Per share information adjusted to reflect stock dividends and splits Dividend payout ratio $0.54 $0.97 $1.11 $1.65 $2.59 $0.13 $0.30 $0.46 $0.64 $1.08 $0.00 $0.50 $1.00 $1.50 $2.00 $2.50 $3.00 2000 2002 2004 2006 2008 2010 2012 2014 2016 2018 2020 Earnings per share Dividends per share 23 % 31 % 41 % 39% 42 %
22 Stock Yards Bancorp, Inc. Merger with Kentucky Bancshares, Inc. (OTCQX:KTYB) January 27, 2021
Forward - Looking Statements Certain statements contained in this communication, which are not statements of historical fact, constitute forward - looking statements w ithin the meaning of the Private Securities Litigation Reform Act of 1995. Such statements include, but are not limited to, certain plans, expectation s, goals, projections and benefits relating to the proposed merger transaction between Stock Yards and Kentucky Bancshares, which are subject to numerous assumptions, ri sks and uncertainties. Words or phrases such as “anticipate,” “believe,” “aim,” “can,” “conclude,” “continue,” “could,” “estimate,” “expect,” “foresee,” “goa l,” “intend,” “may,” “might,” “outlook,” “possible,” “plan,” “predict,” “project,” “potential,” “seek,” “should,” “target,” “will,” “will likely,” “would,” or the neg ati ve of these terms or other comparable terminology, as well as similar expressions, are intended to identify forward - looking statements but are not the exclusive means of identifying such statements. Please refer to each of Stock Yards’ and Kentucky Bancshares' Annual Report on Form 10 - K for the year ended December 31, 2019, a nd, in the case of Stock Yards, its Quarterly Report on Form 10 - Q for the three months ended September 30, 2020, as well as their other filings with the SEC for a m ore detailed discussion of risks, uncertainties and factors that could cause actual results to differ from those discussed in the forward - looking statements. Forward - looking statements are not historical facts but instead express only management’s beliefs regarding future results or ev ents, many of which, by their nature, are inherently uncertain and outside of the management’s control. It is possible that actual results and outcomes may differ, po ssibly materially, from the anticipated results or outcomes indicated in these forward - looking statements. In addition to factors disclosed in reports filed by Stock Ya rds and Kentucky Bancshares with the SEC, risks and uncertainties for Stock Yards, Kentucky Bancshares and the combined company include, but are not limited to: t he possibility that any of the anticipated benefits of the proposed merger will not be realized or will not be realized within the expected time period; the ri sk that integration of Kentucky Bancshares’ operations with those of Stock Yards will be materially delayed or will be more costly or difficult than expected ; t he parties’ inability to meet expectations regarding the timing, completion and accounting and tax treatments of the merger; the inability to complete the mer ger due to the failure of Kentucky Bancshares’ shareholders to adopt the merger agreement; the failure to satisfy other conditions to completion of the merger, inc luding receipt of required regulatory and other approvals; the failure of the proposed transaction to close for any other reason; diversion of management's attenti on from ongoing business operations and opportunities due to the merger; the challenges of integrating and retaining key employees; the effect of the announcemen t o f the merger on Stock Yards’, Kentucky Bancshares’ or the combined company's respective customer and employee relationships and operating results; the poss ibi lity that the merger may be more expensive to complete than anticipated, including as a result of unexpected factors or events; dilution caused by Stock Yar ds’ issuance of additional shares of Stock Yards common stock in connection with the merger; the magnitude and duration of the COVID - 19 pandemic and its impact on th e global economy and financial market conditions and the business, results of operations and financial condition of Stock Yards, Kentucky Bancshares and the co mbined company; and general competitive, economic, political and market conditions and fluctuations. All forward - looking statements included in this communi cation are made as of the date hereof and are based on information available at that time. Except as required by law, neither Stock Yards nor Kentucky Bancs har es assumes any obligation to update any forward - looking statement to reflect events or circumstances that occur after the date the forward - looking statements were m ade. Forward - looking statements 23
Important additional information Additional Information Regarding the Proposed Transaction This communication is being made in respect of the proposed merger transaction between Stock Yards and Kentucky Bancshares. S toc k Yards will file a registration statement on Form S - 4 with the SEC in connection with the proposed transaction. The registration statement will include a proxy statement of Kent u cky Bancshares that also constitutes a prospectus of Stock Yards which, when finalized, will be sent to the shareholders of Kentucky Bancshares seeking their approval of the merg er - related proposals. This document is not a substitute for the proxy statement/prospectus or registration statement or any other document that Stock Yards or Kentucky Bancshares ma y f ile with the SEC. KENTUCKY BANCSHARES’ SHAREHOLDERS ARE ADVISED TO READ THE REGISTRATION STATEMENT ON FORM S - 4 AND THE RELATED PROXY STATEMENT/PROSPECTUS, AS WELL AS A NY AMENDMENTS OR SUPPLEMENTS TO THOSE DOCUMENTS AND ANY OTHER RELEVANT DOCUMENTS FILED OR TO BE FILED WITH THE SEC IN CONNECTION WITH THE PROP OSE D TRANSACTION, WHEN THEY BECOME AVAILABLE BECAUSE THEY WILL CONTAIN IMPORTANT INFORMATION ABOUT STOCK YARDS, KENTUCKY BANCSHARES AND THE PROPOSED TR ANSACTION. When filed, the registration statement, the definitive proxy statement/prospectus and other documents relating to the merger transaction fil ed by Stock Yards and Kentucky Bancshares can be obtained free of charge from the SEC’s website at www.sec.gov. These documents also can be obtained free of charge by accessi ng Stock Yards’ website at www.syb.com under the tab “Investors Relations” and then under “SEC Filings.” Alternatively, these documents, when available, can be obtained free of charge from Stock Yards upon written request to Stock Yards, Attention: Chief Financial Officer, 1040 East Main Street, Louisville, Kentucky 40206 or by calling (502) 582 - 2571, or to Kentucky Bancshares, Attention: Chief Financial Officer, 339 Main Street, Paris, Kentucky 40361 or by calling (859) 987 - 1795. Participants in the Solicitation Stock Yards, Kentucky Bancshares and their respective directors and executive officers may be deemed to be participants in th e s olicitation of proxies from Kentucky Bancshares’ shareholders in connection with the proposed transaction. Information about the directors and executive officers of Stock Yar ds and their ownership of Stock Yards common stock is set forth in the definitive proxy statement for Stock Yards’ 2020 annual meeting of shareholders, as previously filed with th e S EC on March 13, 2020, and Stock Yards’ Annual Report on Form 10 - K for the year ended December 31, 2019, as previously filed with the SEC on February 28, 2020, as well as other document s filed with the SEC. Information about the directors and executive officers of Kentucky Bancshares and their ownership of Kentucky Bancshares common stock is set forth in the def ini tive proxy statement for Kentucky Bancshares’s 2020 annual meeting of shareholders, as previously filed with the SEC on May 11, 2020, and Kentucky Bancshares’ Annual Report on F orm 10 - K for the year ended December 31, 2019, as previously filed with the SEC on March 10, 2020, as well as other documents filed with the SEC. Additional information regard ing the participants in the proxy solicitation and a description of their direct and indirect interests, by securities holdings or otherwise, will be included in the proxy statem ent /prospectus and other relevant documents regarding the proposed transaction to be filed with the SEC when they become available. You may obtain free copies of these documents from Sto ck Yards or Kentucky Bancshares using the sources indicated above. No Offer or Solicitation This communication is not intended to and shall not constitute an offer to sell or the solicitation of an offer to buy securi tie s nor shall there be any sale of securities in any jurisdiction in which such offer, solicitation or sale would be unlawful prior to registration or qualification under the securities laws of such jurisdiction. This communication is also not a solicitation of any vote in any jurisdiction pursuant to the proposed transactions or otherwise. No offer of securities or so lic itation will be made except by means of a prospectus meeting the requirements of Section 10 of the Securities Act of 1933, as amended. Non - GAAP Measures This communication contains certain non - GAAP financial measures of Stock Yards and Kentucky Bancshares determined by methods oth er than in accordance with generally accepted accounting principles. We use non - GAAP financial measures to provide meaningful supplemental information regarding our performan ce. We believe these non - GAAP measures are beneficial in assessing our operating results and related trends, and when planning and forecasting future periods. These non - GA AP disclosures should be considered in addition to, and not as a substitute for or preferable to, financial results determined in accordance with GAAP. The non - GAAP financial measu res we use may differ from the non - GAAP financial measures other financial institutions use to measure their results of operations. 24
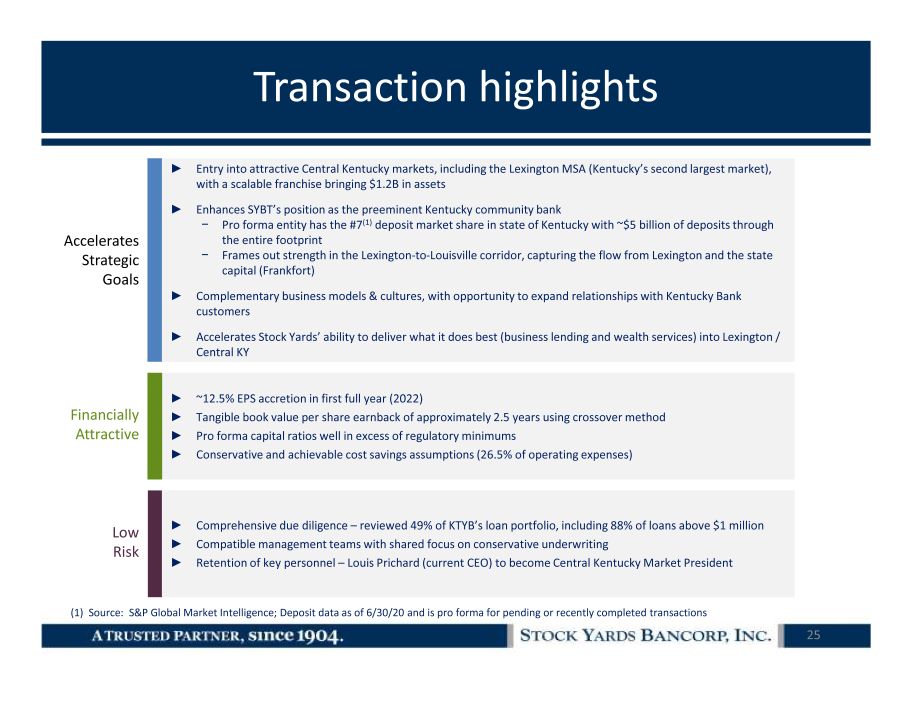
Transaction highlights ► Entry into attractive Central Kentucky markets, including the Lexington MSA (Kentucky’s second largest market), with a scalable franchise bringing $1.2B in assets ► Enhances SYBT’s position as the preeminent Kentucky community bank − Pro forma entity has the #7 (1) deposit market share in state of Kentucky with ~$5 billion of deposits through the entire footprint − Frames out strength in the Lexington - to - Louisville corridor, capturing the flow from Lexington and the state capital (Frankfort) ► Complementary business models & cultures, with opportunity to expand relationships with Kentucky Bank customers ► Accelerates Stock Yards’ ability to deliver what it does best (business lending and wealth services) into Lexington / Central KY ► ~12.5% EPS accretion in first full year (2022) ► Tangible book value per share earnback of approximately 2.5 years using crossover method ► Pro forma capital ratios well in excess of regulatory minimums ► Conservative and achievable cost savings assumptions (26.5% of operating expenses) ► Comprehensive due diligence – reviewed 49% of KTYB’s loan portfolio, including 88% of loans above $1 million ► Compatible management teams with shared focus on conservative underwriting ► Retention of key personnel – Louis Prichard (current CEO) to become Central Kentucky Market President Accelerates Strategic Goals Financially Attractive Low Risk (1) Source: S&P Global Market Intelligence; Deposit data as of 6/30/20 and is pro forma for pending or recently completed t ran sactions 25
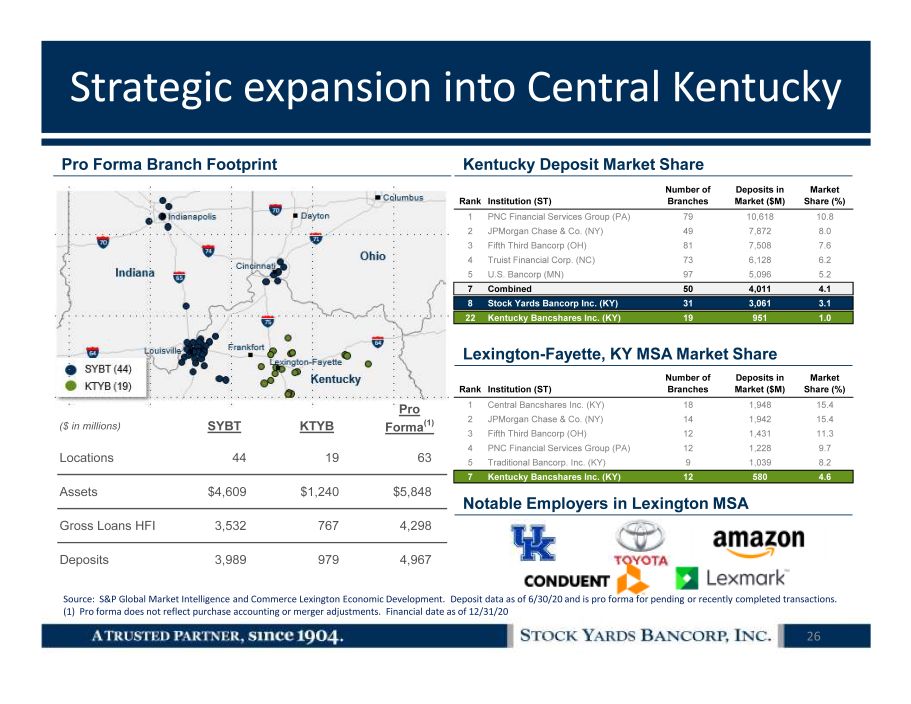
Strategic expansion into Central Kentucky Source: S&P Global Market Intelligence and Commerce Lexington Economic Development. Deposit data as of 6/30/20 and is pro f orm a for pending or recently completed transactions. (1) Pro forma does not reflect purchase accounting or merger adjustments. Financial date as of 12/31/20 Rank Institution (ST) Number of Branches Deposits in Market ($M) Market Share (%) 1 PNC Financial Services Group (PA) 79 10,618 10.8 2 JPMorgan Chase & Co. (NY) 49 7,872 8.0 3 Fifth Third Bancorp (OH) 81 7,508 7.6 4 Truist Financial Corp. (NC) 73 6,128 6.2 5 U.S. Bancorp (MN) 97 5,096 5.2 7 Combined 50 4,011 4.1 8 Stock Yards Bancorp Inc. (KY) 31 3,061 3.1 22 Kentucky Bancshares Inc. (KY) 19 951 1.0 Rank Institution (ST) Number of Branches Deposits in Market ($M) Market Share (%) 1 Central Bancshares Inc. (KY) 18 1,948 15.4 2 JPMorgan Chase & Co. (NY) 14 1,942 15.4 3 Fifth Third Bancorp (OH) 12 1,431 11.3 4 PNC Financial Services Group (PA) 12 1,228 9.7 5 Traditional Bancorp. Inc. (KY) 9 1,039 8.2 7 Kentucky Bancshares Inc. (KY) 12 580 4.6 Pro Forma Branch Footprint Pro ($ in millions) SYBT KTYB Forma (1) Locations 44 19 63 Assets $4,609 $1,240 $5,848 Gross Loans HFI 3,532 767 4,298 Deposits 3,989 979 4,967 Kentucky Deposit Market Share Lexington - Fayette, KY MSA Market Share Notable Employers in Lexington MSA 26
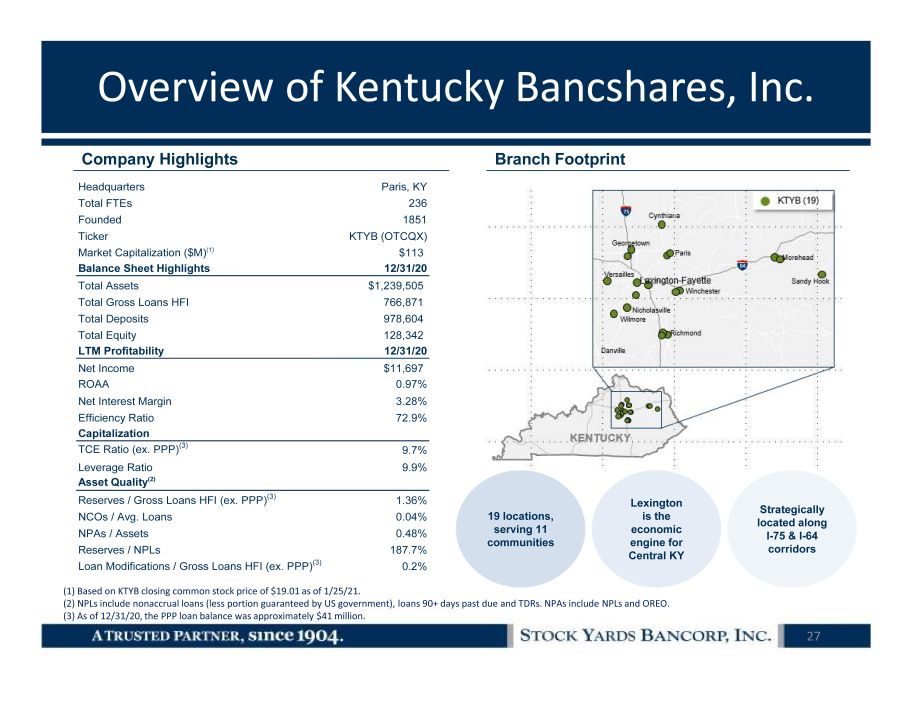
Overview of Kentucky Bancshares, Inc. (1) Based on KTYB closing common stock price of $19.01 as of 1/25/21. (2) NPLs include nonaccrual loans (less portion guaranteed by US government), loans 90+ days past due and TDRs. NPAs include NPL s and OREO. (3) As of 12/31/20, the PPP loan balance was approximately $41 million. Headquarters Paris, KY Total FTEs 236 Founded 1851 Ticker KTYB (OTCQX) Market Capitalization ($M) (1) $113 Balance Sheet Highlights 12/31/20 Total Assets $1,239,505 Total Gross Loans HFI 766,871 Total Deposits 978,604 Total Equity 128,342 LTM Profitability 12/31/20 Net Income $11,697 ROAA 0.97% Net Interest Margin 3.28% Efficiency Ratio 72.9% Capitalization TCE Ratio (ex. PPP) (3) 9.7% Leverage Ratio 9.9% Asset Quality (2) Reserves / Gross Loans HFI (ex. PPP) (3) 1.36% NCOs / Avg. Loans 0.04% NPAs / Assets 0.48% Reserves / NPLs 187.7% Loan Modifications / Gross Loans HFI (ex. PPP) (3) 0.2% Company Highlights 19 locations, serving 11 communities Lexington is the economic engine for Central KY Strategically located along I - 75 & I - 64 corridors Branch Footprint 27
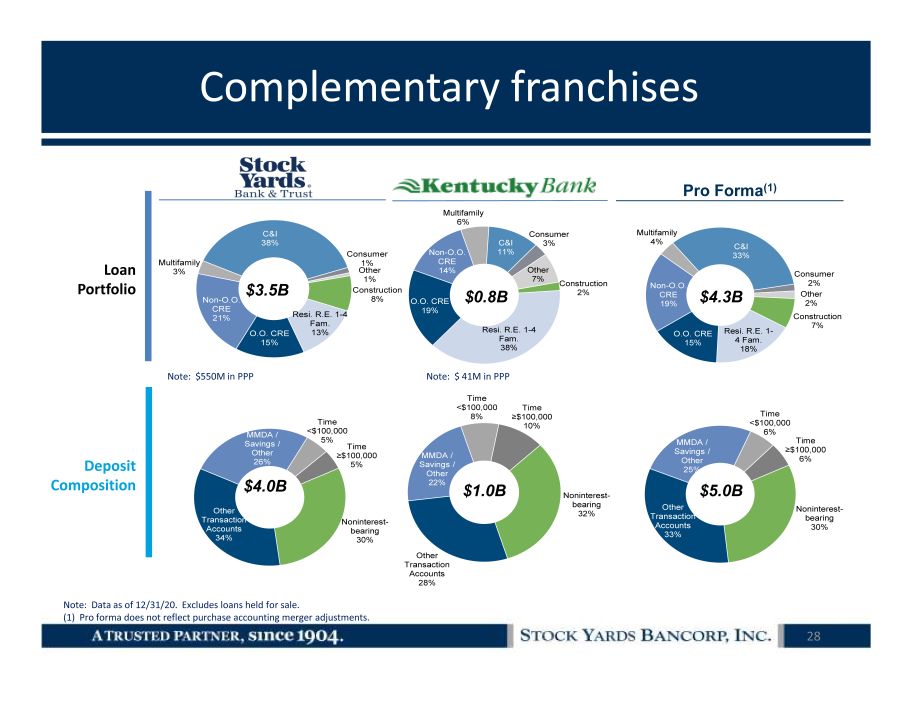
Complementary franchises Note: Data as of 12/31/20. Excludes loans held for sale. (1) Pro forma does not reflect purchase accounting merger adjustments. Construction 8% Resi. R.E. 1 - 4 Fam. 13% O.O. CRE 15% Non - O.O. CRE 21% Multifamily 3% C&I 38% Consumer 1% Other 1% Noninterest - bearing 30% Other Transaction Accounts 34% MMDA / Savings / Other 26% Time <$100,000 5% Time ≥$100,000 5% Loan Portfolio Deposit Composition Construction 2% Resi. R.E. 1 - 4 Fam. 38% O.O. CRE 19% Non - O.O. CRE 14% Multifamily 6% C&I 11% Consumer 3% Other 7% Noninterest - bearing 32% Other Transaction Accounts 28% MMDA / Savings / Other 22% Time <$100,000 8% Time ≥$100,000 10% Construction 7% Resi. R.E. 1 - 4 Fam. 18% O.O. CRE 15% Non - O.O. CRE 19% Multifamily 4% C&I 33% Consumer 2% Other 2% Noninterest - bearing 30% Other Transaction Accounts 33% MMDA / Savings / Other 25% Time <$100,000 6% Time ≥$100,000 6% Pro Forma (1) $3.5B $0.8B $4.3B $4.0B $ 1.0 B $5.0B Note: $550M in PPP Note: $ 41M in PPP 28
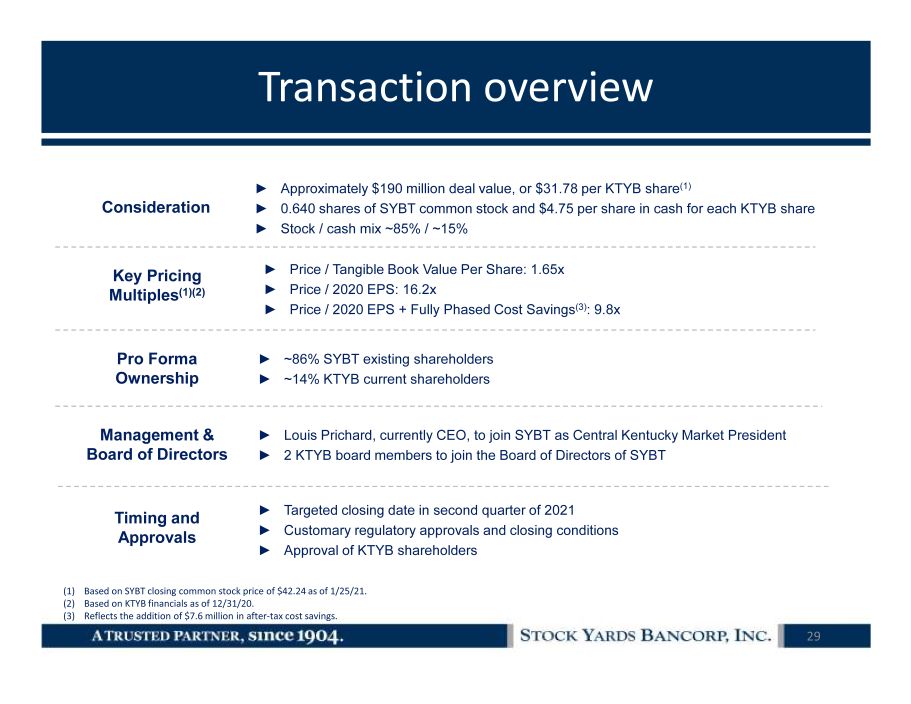
Transaction overview (1) Based on SYBT closing common stock price of $42.24 as of 1/25/21. (2) Based on KTYB financials as of 12/31/20. (3) Reflects the addition of $7.6 million in after - tax cost savings. Consideration ► Approximately $190 million deal value, or $31.78 per KTYB share (1) ► 0.640 shares of SYBT common stock and $4.75 per share in cash for each KTYB share ► Stock / cash mix ~85% / ~15% Key Pricing Multiples (1)(2) Pro Forma Ownership Management & Board of Directors ► Price / Tangible Book Value Per Share: 1.65x ► Price / 2020 EPS: 16.2x ► Price / 2020 EPS + Fully Phased Cost Savings (3) : 9.8x Timing and Approvals ► ~86% SYBT existing shareholders ► ~14% KTYB current shareholders ► Targeted closing date in second quarter of 2021 ► Customary regulatory approvals and closing conditions ► Approval of KTYB shareholders ► Louis Prichard, currently CEO, to join SYBT as Central Kentucky Market President ► 2 KTYB board members to join the Board of Directors of SYBT 29
30 Supplemental information
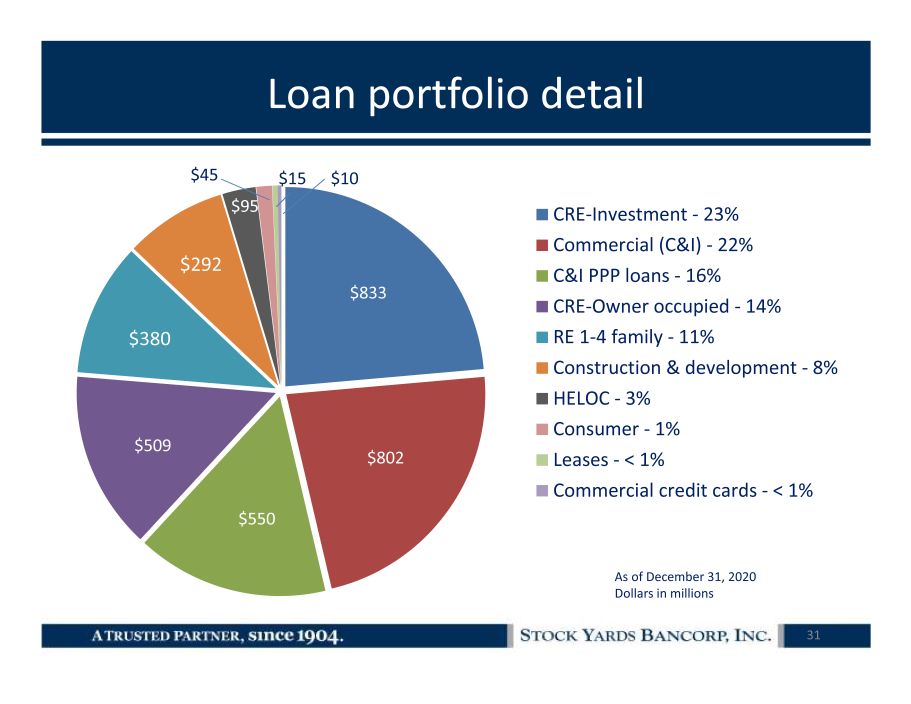
Loan portfolio detail 31 $833 $802 $550 $509 $380 $292 $95 $45 $15 $10 CRE-Investment - 23% Commercial (C&I) - 22% C&I PPP loans - 16% CRE-Owner occupied - 14% RE 1-4 family - 11% Construction & development - 8% HELOC - 3% Consumer - 1% Leases - < 1% Commercial credit cards - < 1% As of December 31, 2020 Dollars in millions
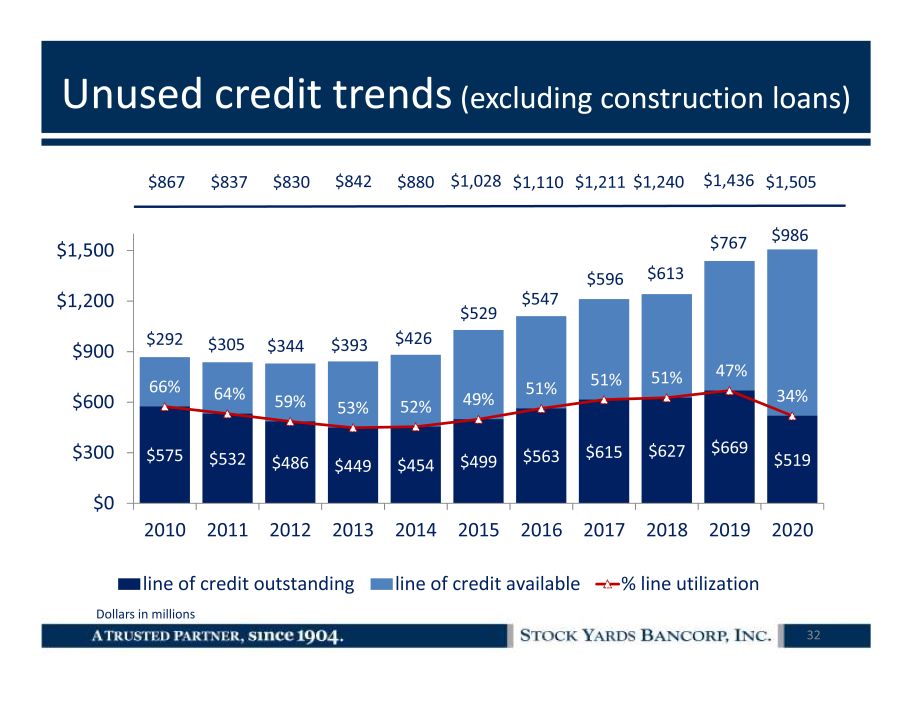
Unused credit trends (excluding construction loans) 32 $575 $532 $486 $449 $454 $499 $563 $615 $627 $669 $519 $292 $305 $344 $393 $426 $529 $547 $596 $613 $767 $986 66% 64% 59% 53% 52% 49% 51% 51% 51% 47% 34% $0 $300 $600 $900 $1,200 $1,500 2010 2011 2012 2013 2014 2015 2016 2017 2018 2019 2020 line of credit outstanding line of credit available % line utilization $1,436 $1,240 $867 $837 $830 $842 $880 $1,028 $1,110 $1,211 $1,505 Dollars in millions
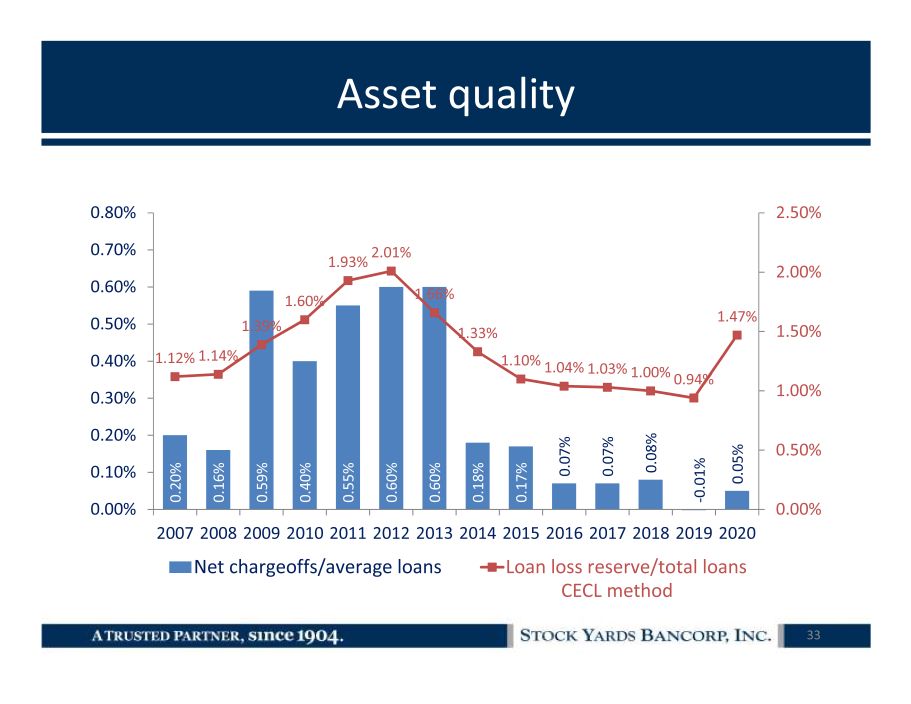
Asset quality 0.20% 0.16% 0.59% 0.40% 0.55% 0.60% 0.60% 0.18% 0.17% 0.07% 0.07% 0.08% 0.05% 1.12% 1.14% 1.39% 1.60% 1.93% 2.01% 1.66% 1.33% 1.10% 1.04% 1.03% 1.00% 0.94% 1.47% 0.00% 0.50% 1.00% 1.50% 2.00% 2.50% 0.00% 0.10% 0.20% 0.30% 0.40% 0.50% 0.60% 0.70% 0.80% 2007 2008 2009 2010 2011 2012 2013 2014 2015 2016 2017 2018 2019 2020 Net chargeoffs/average loans Loan loss reserve/total loans 33 - 0.01% CECL method
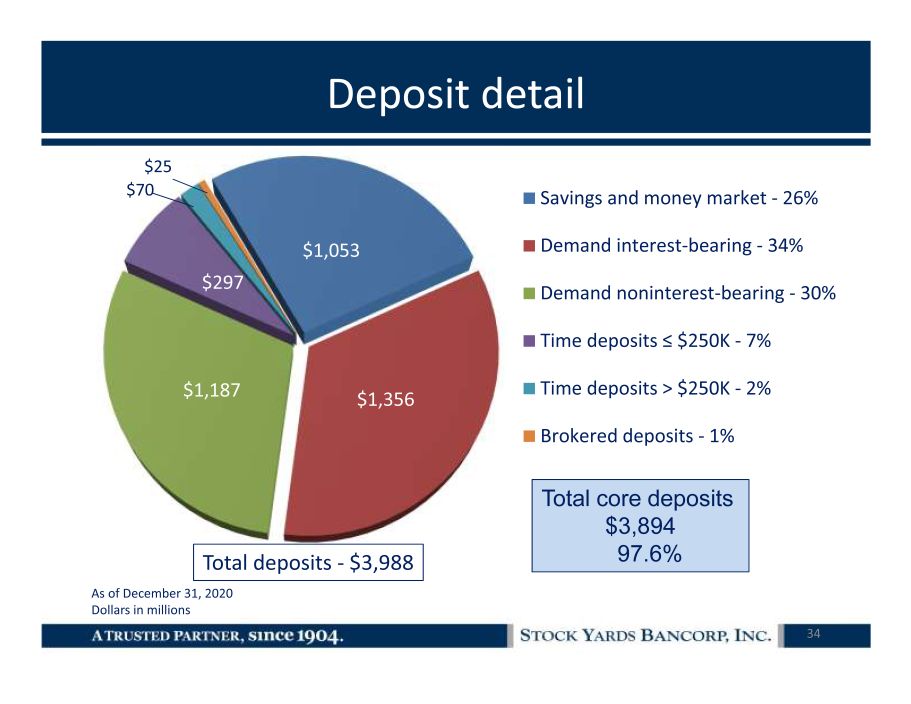
Deposit detail 34 $1,053 $1,356 $1,187 $297 $70 $25 Savings and money market - 26% Demand interest-bearing - 34% Demand noninterest-bearing - 30% Time deposits ≤ $250K - 7% Time deposits > $250K - 2% Brokered deposits - 1% Total deposits - $3,988 Total core deposits $3,894 97.6% As of December 31, 2020 Dollars in millions
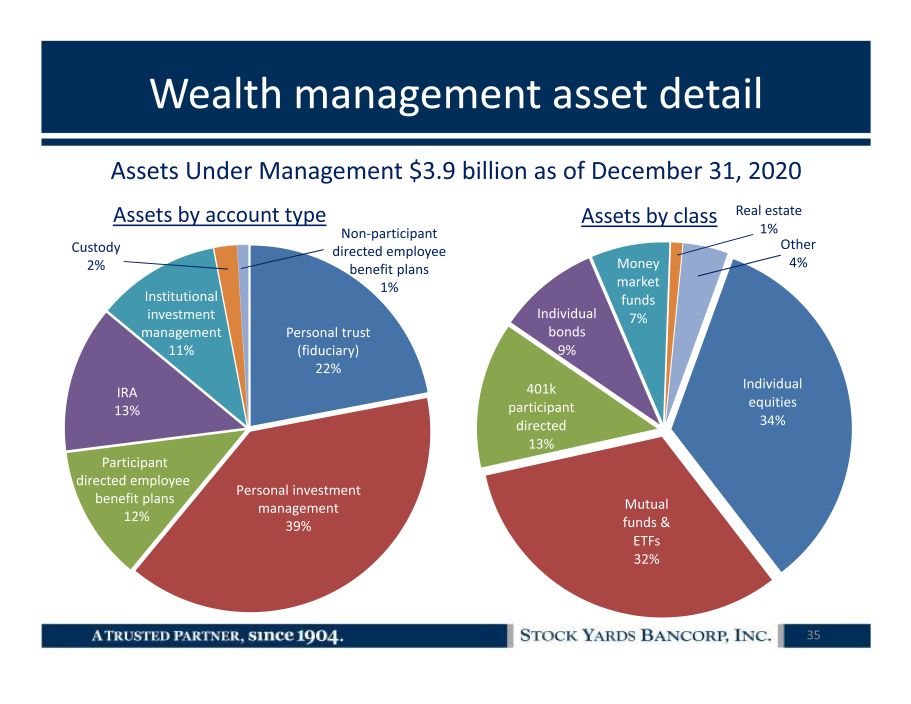
Wealth management asset detail 35 Assets Under Management $3.9 billion as of December 31, 2020 Individual equities 34% Mutual funds & ETFs 32% 401k participant directed 13% Individual bonds 9% Money market funds 7% Real estate 1% Other 4% Assets by class Assets by account type Personal investment m anagement 39% Personal trust (fiduciary) 22% Institutional investment management 11% Participant d irected employee benefit plans 12% Non - participant d irected employee benefit plans 1 % IRA 13% Custody 2 %