Attached files
| file | filename |
|---|---|
| EX-99.1 - EX-99.1 - Rexford Industrial Realty, Inc. | rexrex991q4-2020.htm |
| 8-K - 8-K - Rexford Industrial Realty, Inc. | rexr-20210210.htm |
Exhibit 99.2
Table of Contents. | ||||||||
| Section | Page | ||||
| Corporate Data: | |||||
Investor Company Summary | 3 | ||||
Financial and Portfolio Highlights and Common Stock Data | 4 | ||||
| Consolidated Financial Results: | |||||
Consolidated Balance Sheets | 5 | ||||
Consolidated Statements of Operations | 6-7 | ||||
Non-GAAP FFO, Core FFO and AFFO Reconciliations | 8-9 | ||||
Statement of Operations Reconciliations | 10 | ||||
Stabilized Same Property Portfolio Performance | 11 | ||||
Capitalization Summary | 12 | ||||
Debt Summary | 13-14 | ||||
| Portfolio Data: | |||||
Portfolio Overview | 15 | ||||
Occupancy and Leasing Trends | 16 | ||||
Leasing Statistics | 17-18 | ||||
Top Tenants and Lease Segmentation | 19 | ||||
Capital Expenditure Summary | 20 | ||||
| Properties and Space Under Repositioning/Redevelopment | 21-23 | ||||
Current Year Acquisitions and Dispositions Summary | 24-25 | ||||
Guidance | 26-27 | ||||
Net Asset Value Components | 28 | ||||
Notes and Definitions | 29-33 | ||||
Disclosures:
Forward-Looking Statements: This supplemental package contains “forward-looking statements” within the meaning of the Private Securities Litigation Reform Act of 1995. We caution investors that any forward-looking statements presented herein are based on management’s beliefs and assumptions and information currently available to management. Such statements are subject to risks, uncertainties and assumptions and may be affected by known and unknown risks, trends, uncertainties and factors that are beyond our control. Should one or more of these risks or uncertainties materialize, or should underlying assumptions prove incorrect, actual results may vary materially from those anticipated, estimated or projected. These risks and uncertainties include, without limitation: general risks affecting the real estate industry (including, without limitation, the market value of our properties, the inability to enter into or renew leases at favorable rates, dependence on tenants’ financial condition, and competition from other developers, owners and operators of real estate); risks associated with the disruption of credit markets or a global economic slowdown; risks associated with the potential loss of key personnel (most importantly, members of senior management); risks associated with our failure to maintain our status as a Real Estate Investment Trust under the Internal Revenue Code of 1986, as amended; possible adverse changes in tax and environmental laws; an epidemic or pandemic (such as the outbreak and worldwide spread of novel coronavirus (COVID-19), and the measures that international, federal, state and local governments, agencies, law enforcement and/or health authorities may implement to address it, which may (as with COVID-19) precipitate or exacerbate one or more of the above-mentioned factors and/or other risks, and significantly disrupt or prevent us from operating our business in the ordinary course for an extended period; litigation, including costs associated with prosecuting or defending pending or threatened claims and any adverse outcomes, and potential liability for uninsured losses and environmental contamination.
For a further discussion of these and other factors that could cause our future results to differ materially from any forward-looking statements, see Item 1A. Risk Factors in our 2019 Annual Report on Form 10-K, which was filed with the Securities and Exchange Commission (“SEC”) on February 19, 2020, and our Quarterly Report on Form 10-Q for the quarter ended September 30, 2020, which was filed with the SEC on October 26, 2020. We disclaim any obligation to publicly update or revise any forward-looking statement to reflect changes in underlying assumptions or factors, of new information, data or methods, future events or other changes.
| Fourth Quarter 2020 Supplemental Financial Reporting Package | Page 2 |  | ||||||
Investor Company Summary. | ||||||||
| Executive Management Team | ||||||||
| Howard Schwimmer | Co-Chief Executive Officer, Director | |||||||
| Michael S. Frankel | Co-Chief Executive Officer, Director | |||||||
| Laura Clark | Chief Financial Officer | |||||||
| David Lanzer | General Counsel and Corporate Secretary | |||||||
| Board of Directors | ||||||||
| Richard Ziman | Chairman | |||||||
| Howard Schwimmer | Co-Chief Executive Officer, Director | |||||||
| Michael S. Frankel | Co-Chief Executive Officer, Director | |||||||
| Robert L. Antin | Director | |||||||
| Diana J. Ingram | Director | |||||||
| Debra L. Morris | Director | |||||||
| Tyler H. Rose | Director | |||||||
| Peter Schwab | Director | |||||||
| Investor Relations Information | ||||||||
| ICR | ||||||||
| Stephen Swett | ||||||||
| www.icrinc.com | ||||||||
| 212-849-3882 | ||||||||
| Equity Research Coverage | ||||||||||||||
| Bank of America Merrill Lynch | James Feldman | (646) 855-5808 | ||||||||||||
| Baird | David Rodgers | (216) 737-7341 | ||||||||||||
| Berenberg Capital Markets | Connor Siversky | (646) 949-9037 | ||||||||||||
| Capital One | Chris Lucas | (571) 633-8151 | ||||||||||||
| Citigroup Investment Research | Emmanuel Korchman | (212) 816-1382 | ||||||||||||
| Green Street | Vince Tibone | (949) 640-8780 | ||||||||||||
| J.P. Morgan | Michael W. Mueller, CFA | (212) 622-6689 | ||||||||||||
| Jefferies LLC | Jonathan Petersen | (212) 284-1705 | ||||||||||||
| Wells Fargo Securities | Blaine Heck | (443) 263-6529 | ||||||||||||
Disclaimer: This list may not be complete and is subject to change as firms add or delete coverage of our company. Please note that any opinions, estimates, forecasts or predictions regarding our historical or predicted performance made by these analysts are theirs alone and do not represent opinions, estimates, forecasts or predictions of Rexford Industrial Realty, Inc. or its management. We are providing this listing as a service to our stockholders and do not by listing these firms imply our endorsement of, or concurrence with, such information, conclusions or recommendations. Interested persons may obtain copies of analysts’ reports on their own; we do not distribute these reports.
| Fourth Quarter 2020 Supplemental Financial Reporting Package | Page 3 | | ||||||
Financial and Portfolio Highlights and Common Stock Data. (1) | ||||||||
| (in thousands except share and per share data and portfolio statistics) | ||||||||
| Three Months Ended | |||||||||||||||||||||||||||||
| December 31, 2020 | September 30, 2020 | June 30, 2020 | March 31, 2020 | December 31, 2019 | |||||||||||||||||||||||||
| Financial Results: | |||||||||||||||||||||||||||||
| Total rental income | $ | 88,495 | $ | 83,622 | $ | 79,770 | $ | 77,490 | $ | 74,015 | |||||||||||||||||||
| Net income | $ | 18,155 | $ | 31,197 | $ | 16,271 | $ | 15,272 | $ | 24,382 | |||||||||||||||||||
| Net Operating Income (NOI) | $ | 66,461 | $ | 62,938 | $ | 60,886 | $ | 59,376 | $ | 55,859 | |||||||||||||||||||
| Company share of Core FFO | $ | 43,099 | $ | 40,557 | $ | 38,832 | $ | 37,519 | $ | 35,754 | |||||||||||||||||||
| Company share of Core FFO per common share - diluted | $ | 0.34 | $ | 0.33 | $ | 0.32 | $ | 0.33 | $ | 0.32 | |||||||||||||||||||
| Adjusted EBITDA | $ | 65,328 | $ | 56,384 | $ | 55,982 | $ | 55,566 | $ | 52,232 | |||||||||||||||||||
| Dividend declared per common share | $ | 0.215 | $ | 0.215 | $ | 0.215 | $ | 0.215 | $ | 0.185 | |||||||||||||||||||
| Portfolio Statistics: | |||||||||||||||||||||||||||||
| Portfolio rentable square feet (“RSF”) - consolidated | 31,501,111 | 27,711,078 | 27,633,778 | 27,303,260 | 26,425,208 | ||||||||||||||||||||||||
| Ending occupancy - consolidated portfolio | 95.2 | % | 97.2 | % | 95.4 | % | 95.6 | % | 96.5 | % | |||||||||||||||||||
| Ending percentage leased - consolidated portfolio | 96.2 | % | 97.3 | % | 96.0 | % | 95.7 | % | 96.8 | % | |||||||||||||||||||
| Stabilized occupancy - consolidated portfolio | 96.7 | % | 97.9 | % | 97.0 | % | 97.4 | % | 97.9 | % | |||||||||||||||||||
| Leasing spreads - GAAP | 29.9 | % | 26.8 | % | 32.3 | % | 36.6 | % | 42.0 | % | |||||||||||||||||||
| Leasing spreads - cash | 18.1 | % | 17.4 | % | 18.2 | % | 24.4 | % | 27.1 | % | |||||||||||||||||||
| Stabilized Same Property Performance: | |||||||||||||||||||||||||||||
Stabilized Same Property Portfolio RSF(2) | 19,688,025 | 19,688,025 | 19,688,025 | 19,688,025 | 19,688,025 | ||||||||||||||||||||||||
Stabilized Same Property Portfolio ending occupancy(2) | 98.2 | % | 98.5 | % | 97.9 | % | 98.4 | % | 98.3 | % | |||||||||||||||||||
Stabilized Same Property Portfolio NOI growth(2)(3) | 2.5 | % | 4.5 | % | 3.6 | % | 4.0 | n/a | |||||||||||||||||||||
Stabilized Same Property Portfolio Cash NOI growth(2)(3) | 7.1 | % | 5.0 | % | (1.7) | % | 7.9 | n/a | |||||||||||||||||||||
| Capitalization: | |||||||||||||||||||||||||||||
| Common stock price at quarter end | $ | 49.11 | $ | 45.76 | $ | 41.43 | $ | 41.01 | $ | 45.67 | |||||||||||||||||||
| Common shares issued and outstanding | 131,193,139 | 123,551,852 | 123,546,160 | 116,087,092 | 113,580,755 | ||||||||||||||||||||||||
Total shares and units issued and outstanding at period end(4) | 137,799,832 | 127,455,361 | 127,454,636 | 120,004,376 | 116,304,528 | ||||||||||||||||||||||||
| Weighted average shares outstanding - diluted | 126,401,077 | 123,843,977 | 120,068,176 | 114,314,331 | 112,096,619 | ||||||||||||||||||||||||
| Series A, B and C Preferred Stock and Series 1 and 2 CPOP Units | $ | 319,068 | $ | 319,068 | $ | 319,068 | $ | 319,068 | $ | 278,281 | |||||||||||||||||||
| Total equity market capitalization | $ | 7,086,418 | $ | 6,151,425 | $ | 5,599,514 | $ | 5,240,447 | $ | 5,589,909 | |||||||||||||||||||
| Total consolidated debt | $ | 1,223,494 | $ | 908,046 | $ | 908,250 | $ | 905,645 | $ | 860,958 | |||||||||||||||||||
| Total combined market capitalization (net debt plus equity) | $ | 8,133,619 | $ | 6,815,852 | $ | 6,253,391 | $ | 6,033,660 | $ | 6,372,010 | |||||||||||||||||||
| Ratios: | |||||||||||||||||||||||||||||
| Net debt to total combined market capitalization | 12.9 | % | 9.7 | % | 10.5 | % | 13.1 | % | 12.3 | % | |||||||||||||||||||
| Net debt to Adjusted EBITDA (quarterly results annualized) | 4.0x | 2.9x | 2.9x | 3.6x | 3.7x | ||||||||||||||||||||||||
(1)For definition/discussion of non-GAAP financial measures and reconciliations to their nearest GAAP equivalents, see the definitions section & reconciliation section beginning on page 29 and page 8 of this report, respectively.
(2)For comparability, Stabilized Same Property Portfolio RSF, ending occupancy, NOI growth and Cash NOI growth for all comparable periods has been restated to remove the results of 6750 Central Avenue, which was sold during Q4’20. See page 25 for details related to dispositions.
(3)Represents the year over year percentage change in NOI, Cash NOI and Cash NOI, excluding the impact of COVID-19 rent relief agreements, for the Stabilized Same Property Portfolio.
(4)Includes the following # of OP Units/vested LTIP units held by noncontrolling interests: 6,606,693 (Dec 31, 2020), 3,903,509 (Sep 30, 2020), 3,908,476 (Jun 30, 2020), 3,917,284 (Mar 31, 2020) and 2,723,773 (Dec 31, 2019). Excludes the following # of shares of unvested restricted stock: 232,899 (Dec 31, 2020), 236,739 (Sep 30, 2020), 243,039 (Jun 30, 2020), 244,255 (Mar 31, 2020) and 212,545 (Dec 31, 2019). Excludes unvested LTIP units and unvested performance units.
| Fourth Quarter 2020 Supplemental Financial Reporting Package | Page 4 | | ||||||
Consolidated Balance Sheets. | ||||||||
| (unaudited and in thousands) | ||||||||
| December 31, 2020 | September 30, 2020 | June 30, 2020 | March 31, 2020 | December 31, 2019 | |||||||||||||||||||||||||
| ASSETS | |||||||||||||||||||||||||||||
| Land | $ | 2,636,816 | $ | 2,163,518 | $ | 2,128,243 | $ | 2,068,460 | $ | 1,927,098 | |||||||||||||||||||
| Buildings and improvements | 2,201,187 | 1,791,668 | 1,770,930 | 1,748,675 | 1,680,178 | ||||||||||||||||||||||||
| Tenant improvements | 84,462 | 80,541 | 77,211 | 75,341 | 72,179 | ||||||||||||||||||||||||
| Furniture, fixtures, and equipment | 132 | 132 | 141 | 141 | 141 | ||||||||||||||||||||||||
| Construction in progress | 25,358 | 41,941 | 39,860 | 26,791 | 18,794 | ||||||||||||||||||||||||
| Total real estate held for investment | 4,947,955 | 4,077,800 | 4,016,385 | 3,919,408 | 3,698,390 | ||||||||||||||||||||||||
| Accumulated depreciation | (375,423) | (354,203) | (337,938) | (316,812) | (296,777) | ||||||||||||||||||||||||
| Investments in real estate, net | 4,572,532 | 3,723,597 | 3,678,447 | 3,602,596 | 3,401,613 | ||||||||||||||||||||||||
| Cash and cash equivalents | 176,293 | 243,619 | 254,373 | 112,432 | 78,857 | ||||||||||||||||||||||||
| Restricted cash | 1,230 | 42,387 | 67 | 46 | — | ||||||||||||||||||||||||
| Rents and other receivables, net | 10,208 | 5,838 | 4,790 | 5,859 | 5,889 | ||||||||||||||||||||||||
| Deferred rent receivable, net | 40,893 | 40,473 | 37,552 | 31,339 | 29,671 | ||||||||||||||||||||||||
| Deferred leasing costs, net | 23,148 | 21,842 | 20,269 | 19,482 | 18,688 | ||||||||||||||||||||||||
| Deferred loan costs, net | 2,240 | 2,419 | 2,599 | 2,770 | 695 | ||||||||||||||||||||||||
Acquired lease intangible assets, net(1) | 92,172 | 67,304 | 71,513 | 76,138 | 73,090 | ||||||||||||||||||||||||
| Acquired indefinite-lived intangible | 5,156 | 5,156 | 5,156 | 5,156 | 5,156 | ||||||||||||||||||||||||
| Interest rate swap asset | — | — | — | — | 766 | ||||||||||||||||||||||||
| Other assets | 14,390 | 13,982 | 16,656 | 10,717 | 9,671 | ||||||||||||||||||||||||
| Acquisition related deposits | 4,067 | 3,625 | 63,612 | 5,896 | 14,526 | ||||||||||||||||||||||||
Assets associated with real estate held for sale, net(2) | 8,845 | — | — | — | — | ||||||||||||||||||||||||
| Total Assets | $ | 4,951,174 | $ | 4,170,242 | $ | 4,155,034 | $ | 3,872,431 | $ | 3,638,622 | |||||||||||||||||||
| LIABILITIES & EQUITY | |||||||||||||||||||||||||||||
| Liabilities | |||||||||||||||||||||||||||||
| Notes payable | $ | 1,216,160 | $ | 906,608 | $ | 906,687 | $ | 903,802 | $ | 857,842 | |||||||||||||||||||
| Interest rate swap liability | 17,580 | 20,869 | 22,916 | 22,690 | 8,488 | ||||||||||||||||||||||||
| Accounts payable, accrued expenses and other liabilities | 45,384 | 45,212 | 33,731 | 39,000 | 31,112 | ||||||||||||||||||||||||
| Dividends payable | 29,747 | 27,532 | 27,532 | 25,931 | 21,624 | ||||||||||||||||||||||||
Acquired lease intangible liabilities, net(3) | 67,256 | 61,148 | 61,108 | 63,914 | 59,340 | ||||||||||||||||||||||||
| Tenant security deposits | 31,602 | 27,683 | 26,158 | 30,342 | 28,779 | ||||||||||||||||||||||||
| Prepaid rents | 12,660 | 10,970 | 11,163 | 8,074 | 8,988 | ||||||||||||||||||||||||
Liabilities associated with real estate held for sale(2) | 193 | — | — | — | — | ||||||||||||||||||||||||
| Total Liabilities | 1,420,582 | 1,100,022 | 1,089,295 | 1,093,753 | 1,016,173 | ||||||||||||||||||||||||
| Equity | |||||||||||||||||||||||||||||
| Preferred stock | 242,327 | 242,327 | 242,327 | 242,327 | 242,327 | ||||||||||||||||||||||||
| Common stock | 1,313 | 1,236 | 1,236 | 1,162 | 1,136 | ||||||||||||||||||||||||
| Additional paid in capital | 3,182,599 | 2,821,127 | 2,820,216 | 2,524,274 | 2,439,007 | ||||||||||||||||||||||||
| Cumulative distributions in excess of earnings | (163,389) | (148,492) | (147,907) | (132,843) | (118,751) | ||||||||||||||||||||||||
| Accumulated other comprehensive income | (17,709) | (20,231) | (22,214) | (21,950) | (7,542) | ||||||||||||||||||||||||
| Total stockholders’ equity | 3,245,141 | 2,895,967 | 2,893,658 | 2,612,970 | 2,556,177 | ||||||||||||||||||||||||
| Noncontrolling interests | 285,451 | 174,253 | 172,081 | 165,708 | 66,272 | ||||||||||||||||||||||||
| Total Equity | 3,530,592 | 3,070,220 | 3,065,739 | 2,778,678 | 2,622,449 | ||||||||||||||||||||||||
| Total Liabilities and Equity | $ | 4,951,174 | $ | 4,170,242 | $ | 4,155,034 | $ | 3,872,431 | $ | 3,638,622 | |||||||||||||||||||
(1)Includes net above-market tenant lease intangibles of $8,308 (December 31, 2020), $5,900 (September 30, 2020), $6,230 (June 30, 2020), $6,410 (March 31, 2020) and $6,675 (December 31, 2019).
(2)At December 31, 2020, our property located at 14723-14825 Oxnard Street was classified as held for sale.
(3)Represents net below-market tenant lease intangibles as of the balance sheet date.
| Fourth Quarter 2020 Supplemental Financial Reporting Package | Page 5 | | ||||||
Consolidated Statements of Operations. | ||||||||
| Quarterly Results | (unaudited and in thousands, except share and per share data) | |||||||
| Three Months Ended | |||||||||||||||||||||||||||||
| Dec 31, 2020 | Sep 30, 2020 | Jun 30, 2020 | Mar 31, 2020 | Dec 31, 2019 | |||||||||||||||||||||||||
| Revenues | |||||||||||||||||||||||||||||
Rental income(1) | $ | 88,495 | $ | 83,622 | $ | 79,770 | $ | 77,490 | $ | 74,015 | |||||||||||||||||||
| Management, leasing, and development services | 95 | 118 | 114 | 93 | 105 | ||||||||||||||||||||||||
| Interest income | 59 | 116 | 66 | 97 | 279 | ||||||||||||||||||||||||
| Total Revenues | 88,649 | 83,856 | 79,950 | 77,680 | 74,399 | ||||||||||||||||||||||||
| Operating Expenses | |||||||||||||||||||||||||||||
| Property expenses | 22,034 | 20,684 | 18,884 | 18,114 | 18,156 | ||||||||||||||||||||||||
| General and administrative | 9,042 | 9,464 | 8,972 | 9,317 | 8,215 | ||||||||||||||||||||||||
| Depreciation and amortization | 30,554 | 28,811 | 28,381 | 27,523 | 26,877 | ||||||||||||||||||||||||
| Total Operating Expenses | 61,630 | 58,959 | 56,237 | 54,954 | 53,248 | ||||||||||||||||||||||||
| Other Expenses | |||||||||||||||||||||||||||||
| Acquisition expenses | 35 | 70 | 14 | 5 | (3) | ||||||||||||||||||||||||
| Interest expense | 8,673 | 7,299 | 7,428 | 7,449 | 7,364 | ||||||||||||||||||||||||
| Total Expenses | 70,338 | 66,328 | 63,679 | 62,408 | 60,609 | ||||||||||||||||||||||||
| Loss on extinguishment of debt | (104) | — | — | — | — | ||||||||||||||||||||||||
| (Loss) gain on sale of real estate | (52) | 13,669 | — | — | 10,592 | ||||||||||||||||||||||||
| Net Income | 18,155 | 31,197 | 16,271 | 15,272 | 24,382 | ||||||||||||||||||||||||
| Less: net income attributable to noncontrolling interests | (1,160) | (1,531) | (1,084) | (717) | (734) | ||||||||||||||||||||||||
| Net income attributable to Rexford Industrial Realty, Inc. | 16,995 | 29,666 | 15,187 | 14,555 | 23,648 | ||||||||||||||||||||||||
| Less: preferred stock dividends | (3,636) | (3,636) | (3,637) | (3,636) | (3,636) | ||||||||||||||||||||||||
| Less: earnings allocated to participating securities | (120) | (129) | (129) | (131) | (108) | ||||||||||||||||||||||||
| Net income attributable to common stockholders | $ | 13,239 | $ | 25,901 | $ | 11,421 | $ | 10,788 | $ | 19,904 | |||||||||||||||||||
| Earnings per Common Share | |||||||||||||||||||||||||||||
| Net income attributable to common stockholders per share - basic | $ | 0.11 | $ | 0.21 | $ | 0.10 | $ | 0.09 | $ | 0.18 | |||||||||||||||||||
| Net income attributable to common stockholders per share - diluted | $ | 0.10 | $ | 0.21 | $ | 0.10 | $ | 0.09 | $ | 0.18 | |||||||||||||||||||
| Weighted average shares outstanding - basic | 125,995,123 | 123,548,978 | 119,810,283 | 114,054,434 | 111,612,279 | ||||||||||||||||||||||||
| Weighted average shares outstanding - diluted | 126,401,077 | 123,843,977 | 120,068,176 | 114,314,331 | 112,096,619 | ||||||||||||||||||||||||
(1)See footnote (1) on page 7 for details related to our presentation of “Rental income” in the consolidated statements of operations for all periods presented.
| Fourth Quarter 2020 Supplemental Financial Reporting Package | Page 6 | | ||||||
Consolidated Statements of Operations. | ||||||||
| Quarterly Results | (unaudited and in thousands) | |||||||
| Three Months Ended December 31, | Year Ended December 31, | ||||||||||||||||||||||
| 2020 | 2019 | 2020 | 2019 | ||||||||||||||||||||
| Revenues | |||||||||||||||||||||||
Rental income(1) | $ | 88,495 | $ | 74,015 | $ | 329,377 | $ | 264,252 | |||||||||||||||
| Management, leasing, and development services | 95 | 105 | 420 | 406 | |||||||||||||||||||
| Interest income | 59 | 279 | 338 | 2,555 | |||||||||||||||||||
| Total Revenues | 88,649 | 74,399 | 330,135 | 267,213 | |||||||||||||||||||
| Operating Expenses | |||||||||||||||||||||||
| Property expenses | 22,034 | 18,156 | 79,716 | 63,272 | |||||||||||||||||||
| General and administrative | 9,042 | 8,215 | 36,795 | 30,300 | |||||||||||||||||||
| Depreciation and amortization | 30,554 | 26,877 | 115,269 | 98,891 | |||||||||||||||||||
| Total Operating Expenses | 61,630 | 53,248 | 231,780 | 192,463 | |||||||||||||||||||
| Other Expenses | |||||||||||||||||||||||
| Acquisition expenses | 35 | (3) | 124 | 171 | |||||||||||||||||||
| Interest expense | 8,673 | 7,364 | 30,849 | 26,875 | |||||||||||||||||||
| Total Expenses | 70,338 | 60,609 | 262,753 | 219,509 | |||||||||||||||||||
| Loss on extinguishment of debt | (104) | — | (104) | — | |||||||||||||||||||
| (Loss) gain on sale of real estate | (52) | 10,592 | 13,617 | 16,297 | |||||||||||||||||||
| Net Income | 18,155 | 24,382 | 80,895 | 64,001 | |||||||||||||||||||
| Less: net income attributable to noncontrolling interests | (1,160) | (734) | (4,492) | (2,022) | |||||||||||||||||||
| Net income attributable to Rexford Industrial Realty, Inc. | 16,995 | 23,648 | 76,403 | 61,979 | |||||||||||||||||||
| Less: preferred stock dividends | (3,636) | (3,636) | (14,545) | (11,055) | |||||||||||||||||||
| Less: earnings allocated to participating securities | (120) | (108) | (509) | (447) | |||||||||||||||||||
| Net income attributable to common stockholders | $ | 13,239 | $ | 19,904 | $ | 61,349 | $ | 50,477 | |||||||||||||||
(1)On January 1, 2019, we adopted ASC 842 and, among other practical expedients, elected the “non-separation practical expedient” in ASC 842, which allows us to avoid separating lease and non-lease rental income. As a result of this election, all rental income earned pursuant to tenant leases, including tenant reimbursements, is reflected as one line, “Rental income,” in the consolidated statements of operations. Prior to the adoption of ASC 842, we presented rental revenues, tenant reimbursements and other income related to leases separately in our consolidated statements of operations. Under the section “Rental Income” on page 32 in the definitions section of this report, we include a presentation of rental revenues, tenant reimbursements and other income for all periods because we believe this information is frequently used by management, investors, securities analysts and other interested parties to evaluate our performance.
| Fourth Quarter 2020 Supplemental Financial Reporting Package | Page 7 | | ||||||
Non-GAAP FFO and Core FFO Reconciliations. (1) | ||||||||
| (unaudited and in thousands, except share and per share data) | ||||||||
| Three Months Ended | |||||||||||||||||||||||||||||
| December 31, 2020 | September 30, 2020 | June 30, 2020 | March 31, 2020 | December 31, 2019 | |||||||||||||||||||||||||
| Net Income | $ | 18,155 | $ | 31,197 | $ | 16,271 | $ | 15,272 | $ | 24,382 | |||||||||||||||||||
| Add: | |||||||||||||||||||||||||||||
| Depreciation and amortization | 30,554 | 28,811 | 28,381 | 27,523 | 26,877 | ||||||||||||||||||||||||
| Deduct: | |||||||||||||||||||||||||||||
| (Loss) gain on sale of real estate | (52) | 13,669 | — | — | 10,592 | ||||||||||||||||||||||||
| Funds From Operations (FFO) | 48,761 | 46,339 | 44,652 | 42,795 | 40,667 | ||||||||||||||||||||||||
| Less: preferred stock dividends | (3,636) | (3,636) | (3,637) | (3,636) | (3,636) | ||||||||||||||||||||||||
Less: FFO attributable to noncontrolling interests(2) | (2,182) | (2,017) | (2,005) | (1,450) | (1,087) | ||||||||||||||||||||||||
Less: FFO attributable to participating securities(3) | (188) | (197) | (192) | (195) | (188) | ||||||||||||||||||||||||
| Company share of FFO | $ | 42,755 | $ | 40,489 | $ | 38,818 | $ | 37,514 | $ | 35,756 | |||||||||||||||||||
| Company share of FFO per common share‐basic | $ | 0.34 | $ | 0.33 | $ | 0.32 | $ | 0.33 | $ | 0.32 | |||||||||||||||||||
| Company share of FFO per common share‐diluted | $ | 0.34 | $ | 0.33 | $ | 0.32 | $ | 0.33 | $ | 0.32 | |||||||||||||||||||
| FFO | $ | 48,761 | $ | 46,339 | $ | 44,652 | $ | 42,795 | $ | 40,667 | |||||||||||||||||||
| Add: | |||||||||||||||||||||||||||||
| Acquisition expenses | 35 | 70 | 14 | 5 | (3) | ||||||||||||||||||||||||
| Loss on extinguishment of debt | 104 | — | — | — | — | ||||||||||||||||||||||||
| Amortization of loss on termination of interest rate swap | 218 | — | — | — | — | ||||||||||||||||||||||||
| Core FFO | 49,118 | 46,409 | 44,666 | 42,800 | 40,664 | ||||||||||||||||||||||||
| Less: preferred stock dividends | (3,636) | (3,636) | (3,637) | (3,636) | (3,636) | ||||||||||||||||||||||||
Less: Core FFO attributable to noncontrolling interests(2) | (2,193) | (2,019) | (2,005) | (1,450) | (1,086) | ||||||||||||||||||||||||
Less: Core FFO attributable to participating securities(3) | (190) | (197) | (192) | (195) | (188) | ||||||||||||||||||||||||
| Company share of Core FFO | $ | 43,099 | $ | 40,557 | $ | 38,832 | $ | 37,519 | $ | 35,754 | |||||||||||||||||||
| Company share of Core FFO per common share‐basic | $ | 0.34 | $ | 0.33 | $ | 0.32 | $ | 0.33 | $ | 0.32 | |||||||||||||||||||
| Company share of Core FFO per common share‐diluted | $ | 0.34 | $ | 0.33 | $ | 0.32 | $ | 0.33 | $ | 0.32 | |||||||||||||||||||
| Weighted-average shares outstanding-basic | 125,995,123 | 123,548,978 | 119,810,283 | 114,054,434 | 111,612,279 | ||||||||||||||||||||||||
Weighted-average shares outstanding-diluted(4) | 126,401,077 | 123,843,977 | 120,068,176 | 114,314,331 | 112,096,619 | ||||||||||||||||||||||||
(1)For a definition and discussion of non-GAAP financial measures, see the definitions section beginning on page 29 of this report.
(2)Noncontrolling interests relate to interests in the Company’s operating partnership, represented by common units and preferred units (Series 1 & Series 2 CPOP units) of partnership interests in the operating partnership that are owned by unit holders other than the Company.
(3)Participating securities include unvested shares of restricted stock, unvested LTIP units and unvested performance units.
(4)Weighted-average shares outstanding-diluted includes adjustments for unvested performance units if the effect is dilutive for the reported period.
| Fourth Quarter 2020 Supplemental Financial Reporting Package | Page 8 | | ||||||
Non-GAAP AFFO Reconciliation. (1) | ||||||||
| (unaudited and in thousands, except share and per share data) | ||||||||
| Three Months Ended | |||||||||||||||||||||||||||||
| December 31, 2020 | September 30, 2020 | June 30, 2020 | March 31, 2020 | December 31, 2019 | |||||||||||||||||||||||||
Funds From Operations(2) | $ | 48,761 | $ | 46,339 | $ | 44,652 | $ | 42,795 | $ | 40,667 | |||||||||||||||||||
| Add: | |||||||||||||||||||||||||||||
| Amortization of deferred financing costs | 408 | 373 | 381 | 343 | 347 | ||||||||||||||||||||||||
| Non-cash stock compensation | 2,491 | 3,101 | 3,709 | 3,570 | 2,800 | ||||||||||||||||||||||||
| Loss on extinguishment of debt | 104 | — | — | — | — | ||||||||||||||||||||||||
| Amortization of loss on termination of interest rate swap | 218 | — | — | — | — | ||||||||||||||||||||||||
| Deduct: | |||||||||||||||||||||||||||||
| Preferred stock dividends | 3,636 | 3,636 | 3,637 | 3,636 | 3,636 | ||||||||||||||||||||||||
Straight line rental revenue adjustment(3) | 434 | 3,088 | 6,212 | 1,672 | 2,200 | ||||||||||||||||||||||||
| Amortization of net below-market lease intangibles | 2,711 | 2,751 | 2,669 | 2,402 | 2,191 | ||||||||||||||||||||||||
Capitalized payments(4) | 2,149 | 2,442 | 2,355 | 2,067 | 1,851 | ||||||||||||||||||||||||
| Note payable premium amortization | 47 | 66 | 59 | 16 | (2) | ||||||||||||||||||||||||
Recurring capital expenditures(5) | 2,671 | 1,380 | 1,323 | 1,575 | 1,383 | ||||||||||||||||||||||||
2nd generation tenant improvements and leasing commissions(6) | 1,741 | 2,243 | 2,000 | 1,727 | 1,754 | ||||||||||||||||||||||||
| Adjusted Funds From Operations (AFFO) | $ | 38,593 | $ | 34,207 | $ | 30,487 | $ | 33,613 | $ | 30,801 | |||||||||||||||||||
(1)For a definition and discussion of non-GAAP financial measures, see the definitions section beginning on page 29 of this report.
(2)A reconciliation of net income to Funds From Operations is set forth on page 8 of this report.
(3)The straight line rental revenue adjustment includes concessions of $2,358 (including deferral of $250 of base rent provided by COVID-19 rent relief agreements), $2,273 (including deferral of $686 of base rent provided by COVID-19 rent relief agreements), $5,775 (including impact of acceleration of $825 of future concessions and deferral of $3,635 of base rent provided by COVID-19 rent relief agreements), $1,329 and $1,285 for the three months ended December 31, 2020, September 30, 2020, June 30, 2020, March 31, 2020, and December 31, 2019, respectively.
(4)Includes capitalized interest, taxes, insurance and construction related compensation costs.
(5)Excludes nonrecurring capital expenditures of $20,569, $18,835, $14,773, $12,411 and $10,857 for the three months ended December 31, 2020, September 30, 2020, June 30, 2020, March 31, 2020, and December 31, 2019, respectively.
(6)Excludes 1st generation tenant improvements and leasing commissions of $1,327, $1,744, $549, $831 and $1,497 for the three months ended December 31, 2020, September 30, 2020, June 30, 2020, March 31, 2020, and December 31, 2019, respectively.
| Fourth Quarter 2020 Supplemental Financial Reporting Package | Page 9 | | ||||||
Statement of Operations Reconciliations - NOI, Cash NOI, EBITDAre and Adjusted EBITDA. (1) | ||||||||
| (unaudited and in thousands) | ||||||||
| NOI and Cash NOI | |||||||||||||||||||||||||||||
| Three Months Ended | |||||||||||||||||||||||||||||
| Dec 31, 2020 | Sep 30, 2020 | Jun 30, 2020 | Mar 31, 2020 | Dec 31, 2019 | |||||||||||||||||||||||||
Rental income(2)(3) | $ | 88,495 | $ | 83,622 | $ | 79,770 | $ | 77,490 | $ | 74,015 | |||||||||||||||||||
| Property expenses | 22,034 | 20,684 | 18,884 | 18,114 | 18,156 | ||||||||||||||||||||||||
| Net Operating Income (NOI) | $ | 66,461 | $ | 62,938 | $ | 60,886 | $ | 59,376 | $ | 55,859 | |||||||||||||||||||
| Amortization of above/below market lease intangibles | (2,711) | (2,751) | (2,669) | (2,402) | (2,191) | ||||||||||||||||||||||||
| Straight line rental revenue adjustment | (434) | (3,088) | (6,212) | (1,672) | (2,200) | ||||||||||||||||||||||||
| Cash NOI | $ | 63,316 | $ | 57,099 | $ | 52,005 | $ | 55,302 | $ | 51,468 | |||||||||||||||||||
EBITDAre and Adjusted EBITDA | |||||||||||||||||||||||||||||
| Three Months Ended | |||||||||||||||||||||||||||||
| Dec 31, 2020 | Sep 30, 2020 | Jun 30, 2020 | Mar 31, 2020 | Dec 31, 2019 | |||||||||||||||||||||||||
| Net income | $ | 18,155 | $ | 31,197 | $ | 16,271 | $ | 15,272 | $ | 24,382 | |||||||||||||||||||
| Interest expense | 8,673 | 7,299 | 7,428 | 7,449 | 7,364 | ||||||||||||||||||||||||
| Depreciation and amortization | 30,554 | 28,811 | 28,381 | 27,523 | 26,877 | ||||||||||||||||||||||||
| Loss (gain) on sale of real estate | 52 | (13,669) | — | — | (10,592) | ||||||||||||||||||||||||
EBITDAre | $ | 57,434 | $ | 53,638 | $ | 52,080 | $ | 50,244 | $ | 48,031 | |||||||||||||||||||
| Stock-based compensation amortization | 2,491 | 3,101 | 3,709 | 3,570 | 2,800 | ||||||||||||||||||||||||
| Loss on extinguishment of debt | 104 | — | — | — | — | ||||||||||||||||||||||||
| Acquisition expenses | 35 | 70 | 14 | 5 | (3) | ||||||||||||||||||||||||
Pro forma effect of acquisitions(4) | 5,260 | 5 | 179 | 1,747 | 1,500 | ||||||||||||||||||||||||
Pro forma effect of dispositions(5) | 4 | (430) | — | — | (96) | ||||||||||||||||||||||||
| Adjusted EBITDA | $ | 65,328 | $ | 56,384 | $ | 55,982 | $ | 55,566 | $ | 52,232 | |||||||||||||||||||
(1)For a definition and discussion of non-GAAP financial measures, see the definitions section beginning on page 29 of this report.
(2)See footnote (1) on page 7 for details related to our presentation of “Rental income” in the consolidated statements of operations for all periods presented.
(3)Reflects (reduction) increase to rental income due to changes in the Company’s assessment of lease payment collectability as follows (in thousands): $(2,114), $(1,479), $(1,059), $(395) and $117 for the three months ended December 31, 2020, September 30, 2020, June 30, 2020, March 31, 2020, and December 31, 2019, respectively.
(4)Represents the estimated impact on Q4'20 EBITDAre of Q4'20 acquisitions as if they had been acquired on October 1, 2020, the impact on Q3'20 EBITDAre of Q3'20 acquisitions as if they had been acquired on July 1, 2020, the impact on Q2'20 EBITDAre of Q2'20 acquisitions as if they had been acquired on April 1, 2020, the impact on Q1'20 EBITDAre of Q1'20 acquisitions as if they had been acquired on January 1, 2020, and the impact on Q4'19 EBITDAre of Q4'19 acquisitions as if they had been acquired on October 1, 2019. We have made a number of assumptions in such estimates and there can be no assurance that we would have generated the projected levels of EBITDAre had we owned the acquired entities as of the beginning of each period.
(5)Represents the impact on Q4'20 EBITDAre of Q4'20 dispositions as if they had been sold as of October 1, 2020, Q3'20 EBITDAre of Q3'20 dispositions as if they had been sold as of July 1, 2020, and the impact on Q4'19 EBITDAre of Q4'19 dispositions as if they had been sold as of October 1, 2019. We did not sell any properties during Q2'20 or Q1'20.
| Fourth Quarter 2020 Supplemental Financial Reporting Package | Page 10 | | ||||||
Stabilized Same Property Portfolio Performance. (1) | ||||||||
| (unaudited and dollars in thousands) | ||||||||
| Stabilized Same Property Portfolio: | ||||||||||||||||||||||||||||||||||||||||||||||||||
| Number of properties | 159 | |||||||||||||||||||||||||||||||||||||||||||||||||
| Square Feet | 19,688,025 | |||||||||||||||||||||||||||||||||||||||||||||||||
| Stabilized Same Property Portfolio NOI and Cash NOI: | ||||||||||||||||||||||||||||||||||||||||||||||||||
| Three Months Ended December 31, | Year Ended December 31, | |||||||||||||||||||||||||||||||||||||||||||||||||
| 2020 | 2019 | $ Change | % Change | 2020 | 2019 | $ Change | % Change | |||||||||||||||||||||||||||||||||||||||||||
Rental income(2)(3)(4) | $ | 58,763 | $ | 57,185 | $ | 1,578 | 2.8% | $ | 232,477 | $ | 223,985 | $ | 8,492 | 3.8% | ||||||||||||||||||||||||||||||||||||
| Property expenses | 14,232 | 13,757 | 475 | 3.5% | 54,434 | 52,228 | 2,206 | 4.2% | ||||||||||||||||||||||||||||||||||||||||||
| Stabilized same property portfolio NOI | $ | 44,531 | $ | 43,428 | $ | 1,103 | 2.5% | (4) | $ | 178,043 | $ | 171,757 | $ | 6,286 | 3.7% | (4) | ||||||||||||||||||||||||||||||||||
| Straight-line rental revenue | 530 | (885) | 1,415 | (159.9)% | (4,629) | (4,268) | (361) | 8.5% | ||||||||||||||||||||||||||||||||||||||||||
| Amort. of above/below market lease intangibles | (1,148) | (1,537) | 389 | (25.3)% | (5,411) | (6,790) | 1,379 | (20.3)% | ||||||||||||||||||||||||||||||||||||||||||
| Stabilized same property portfolio Cash NOI | $ | 43,913 | $ | 41,006 | $ | 2,907 | 7.1% | (4) | $ | 168,003 | $ | 160,699 | $ | 7,304 | 4.5% | (4) | ||||||||||||||||||||||||||||||||||
| Stabilized Same Property Portfolio Occupancy: | ||||||||||||||||||||
| December 31, | ||||||||||||||||||||
| 2020 | 2019 | Change (basis points) | ||||||||||||||||||
| Occupancy: | ||||||||||||||||||||
| Los Angeles County | 98.6% | 98.6% | 0 bps | |||||||||||||||||
| Orange County | 98.9% | 99.1% | (20) bps | |||||||||||||||||
| San Bernardino County | 98.8% | 97.4% | 140 bps | |||||||||||||||||
| Ventura County | 92.6% | 99.1% | (650) bps | |||||||||||||||||
| San Diego County | 97.6% | 97.1% | 50 bps | |||||||||||||||||
| Total/Weighted Average | 98.2% | 98.3% | (10) bps | |||||||||||||||||
Average Occupancy(5): | 98.3% | 98.0% | 30 bps | |||||||||||||||||
(1)For a definition and discussion of non-GAAP financial measures, see the definitions section beginning on page 29 of this report.
(2)See “Stabilized Same Property Portfolio Rental Income” on page 32 of the definitions section of this report for a breakdown of rental income into rental revenues, tenant reimbursement and other income for the three months and years ended December 31, 2020 and 2019.
(3)Reflects (reduction) increase to rental income due to changes in the Company’s assessment of lease payment collectability as follows (in thousands): $(1,758) and $120 for the three months ended December 31, 2020 and 2019, respectively, and $(4,121) and $(596) for the year ended December 31, 2020 and 2019, respectively.
(4)Rental income includes lease termination fees of $22 thousand and $10 thousand for the three months ended December 31, 2020 and 2019, respectively and $457 thousand and $12 thousand for the year ended December 31, 2020 and 2019, respectively. Excluding these lease termination fees, Stabilized Same Property Portfolio NOI increased by approximately 2.5% and 3.4% and Stabilized Same Property Portfolio Cash NOI increased by approximately 7.1% and 4.3% during the three months and year ended December 31, 2020, compared to the three months and year ended December 31, 2019, respectively.
(5)Calculated by averaging the occupancy rate at the end of each quarter in 2020 and 4Q-2019 (for 2020) and the end of each quarter in 2019 and 4Q-2018 (for 2019).
| Fourth Quarter 2020 Supplemental Financial Reporting Package | Page 11 | | ||||||
Capitalization Summary. | ||||||||
| (unaudited and in thousands, except share and per share data) | ||||||||
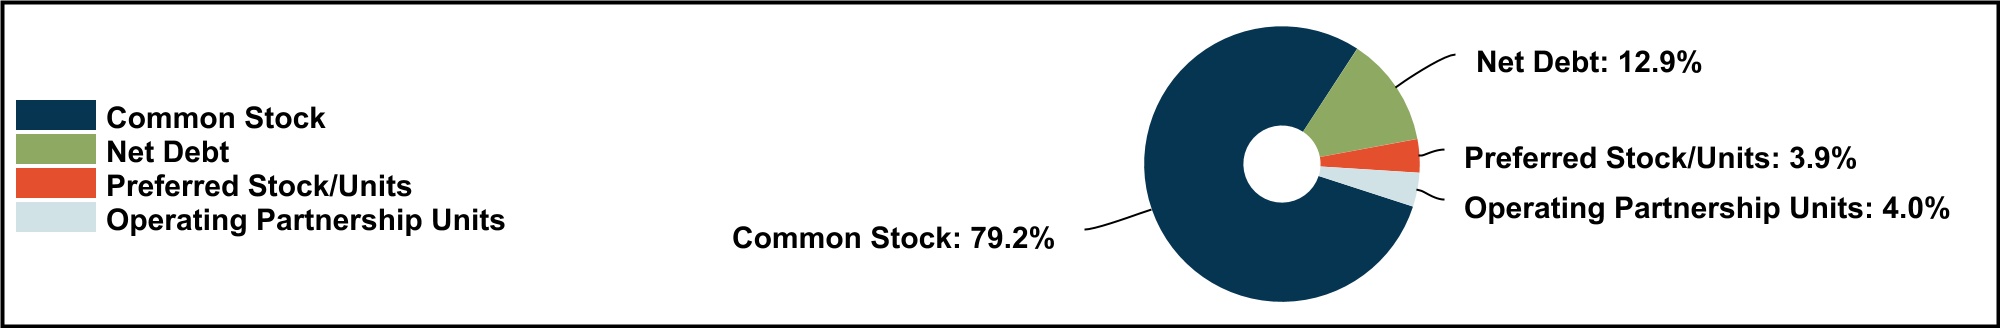
| Capitalization as of December 31, 2020 | ||||||||
| Description | December 31, 2020 | September 30, 2020 | June 30, 2020 | March 31, 2020 | December 31, 2019 | |||||||||||||||||||||||||||
Common shares outstanding(1) | 131,193,139 | 123,551,852 | 123,546,160 | 116,087,092 | 113,580,755 | |||||||||||||||||||||||||||
Operating partnership units outstanding(2) | 6,606,693 | 3,903,509 | 3,908,476 | 3,917,284 | 2,723,773 | |||||||||||||||||||||||||||
| Total shares and units outstanding at period end | 137,799,832 | 127,455,361 | 127,454,636 | 120,004,376 | 116,304,528 | |||||||||||||||||||||||||||
| Share price at end of quarter | $ | 49.11 | $ | 45.76 | $ | 41.43 | $ | 41.01 | $ | 45.67 | ||||||||||||||||||||||
| Common Stock and Operating Partnership Units - Capitalization | $ | 6,767,350 | $ | 5,832,357 | $ | 5,280,446 | $ | 4,921,379 | $ | 5,311,628 | ||||||||||||||||||||||
Series A, B and C Cumulative Redeemable Preferred Stock(3) | $ | 251,250 | $ | 251,250 | $ | 251,250 | $ | 251,250 | $ | 251,250 | ||||||||||||||||||||||
4.43937% Series 1 Cumulative Redeemable Convertible Preferred Units(4) | 27,031 | 27,031 | 27,031 | 27,031 | 27,031 | |||||||||||||||||||||||||||
4.00% Series 2 Cumulative Redeemable Convertible Preferred Units(4) | 40,787 | 40,787 | 40,787 | 40,787 | — | |||||||||||||||||||||||||||
| Preferred Equity | $ | 319,068 | $ | 319,068 | $ | 319,068 | $ | 319,068 | $ | 278,281 | ||||||||||||||||||||||
| Total Equity Market Capitalization | $ | 7,086,418 | $ | 6,151,425 | $ | 5,599,514 | $ | 5,240,447 | $ | 5,589,909 | ||||||||||||||||||||||
| Total Debt | $ | 1,223,494 | $ | 908,046 | $ | 908,250 | $ | 905,645 | $ | 860,958 | ||||||||||||||||||||||
| Less: Cash and cash equivalents | (176,293) | (243,619) | (254,373) | (112,432) | (78,857) | |||||||||||||||||||||||||||
| Net Debt | $ | 1,047,201 | $ | 664,427 | $ | 653,877 | $ | 793,213 | $ | 782,101 | ||||||||||||||||||||||
| Total Combined Market Capitalization (Net Debt plus Equity) | $ | 8,133,619 | $ | 6,815,852 | $ | 6,253,391 | $ | 6,033,660 | $ | 6,372,010 | ||||||||||||||||||||||
| Net debt to total combined market capitalization | 12.9 | % | 9.7 | % | 10.5 | % | 13.1 | % | 12.3 | % | ||||||||||||||||||||||
Net debt to Adjusted EBITDA (quarterly results annualized)(5) | 4.0x | 2.9x | 2.9x | 3.6x | 3.7x | |||||||||||||||||||||||||||
Net debt & preferred equity to Adjusted EBITDA (quarterly results annualized)(5) | 5.2x | 4.4x | 4.3x | 5.0x | 5.1x | |||||||||||||||||||||||||||
(1)Excludes the following number of shares of unvested restricted stock: 232,899 (Dec 31, 2020), 236,739 (Sep 30, 2020), 243,039 (Jun 30, 2020), 244,255 (Mar 31, 2020) and 212,545 (Dec 31, 2019).
(2)Represents outstanding common units of the Company’s operating partnership (“OP”), Rexford Industrial Realty, LP, that are owned by unitholders other than Rexford Industrial Realty, Inc. Represents the noncontrolling interest in our OP. As of Dec 31, 2020, includes 588,790 vested LTIP Units & 614,022 vested performance units & excludes 236,646 unvested LTIP Units & 905,732 unvested performance units.
(3)Values based on liquidation preference of $25 per share and the following number of outstanding shares of preferred stock: 5.875% Series A (3,600,000); 5.875% Series B (3,000,000); 5.625% Series C (3,450,000).
(4)Value based on 593,960 outstanding Series 1 preferred units at a liquidation preference of $45.50952 per unit and 906,374 outstanding Series 2 preferred units at a liquidation preference of $45.00 per unit.
(5)For a definition and discussion of non-GAAP financial measures, see the definitions section beginning on page 29 of this report.
| Fourth Quarter 2020 Supplemental Financial Reporting Package | Page 12 | | ||||||
Debt Summary. | ||||||||
| (unaudited and dollars in thousands) | ||||||||
| Debt Detail: | ||||||||||||||||||||||||||||||||
| As of December 31, 2020 | ||||||||||||||||||||||||||||||||
| Debt Description | Maturity Date | Stated Interest Rate | Effective Interest Rate(1) | Principal Balance(2) | Expiration Date of Effective Swaps | |||||||||||||||||||||||||||
| Unsecured Debt: | ||||||||||||||||||||||||||||||||
$500M Revolving Credit Facility(3) | 2/13/2024(4) | LIBOR +0.85%(5) | 0.994% | $ | — | |||||||||||||||||||||||||||
| $225M Term Loan Facility | 1/14/2023 | LIBOR +1.10%(5) | 2.474% | 225,000 | 1/14/2022 | |||||||||||||||||||||||||||
| $150M Term Loan Facility | 5/22/2025 | LIBOR +1.55%(5) | 4.313% | 150,000 | 11/22/2024 | |||||||||||||||||||||||||||
| $100M Senior Notes | 8/6/2025 | 4.290% | 4.290% | 100,000 | ||||||||||||||||||||||||||||
| $125M Senior Notes | 7/13/2027 | 3.930% | 3.930% | 125,000 | ||||||||||||||||||||||||||||
| $25M Series 2019A Senior Notes | 7/16/2029 | 3.880% | 3.880% | 25,000 | ||||||||||||||||||||||||||||
| $400M Senior Notes | 12/1/2030 | 2.125% | 2.125% | 400,000 | ||||||||||||||||||||||||||||
| $75M Series 2019B Senior Notes | 7/16/2034 | 4.030% | 4.030% | 75,000 | ||||||||||||||||||||||||||||
| Secured Debt: | ||||||||||||||||||||||||||||||||
| 2601-2641 Manhattan Beach Boulevard | 4/5/2023 | 4.080% | 4.080% | 4,065 | ||||||||||||||||||||||||||||
| $60M Term Loan | 8/1/2023(6) | LIBOR + 1.70% | 1.844% | 58,499 | ||||||||||||||||||||||||||||
| 960-970 Knox Street | 11/1/2023 | 5.000% | 5.000% | 2,488 | ||||||||||||||||||||||||||||
| 7612-7642 Woodwind Drive | 1/5/2024 | 5.240% | 5.240% | 3,895 | ||||||||||||||||||||||||||||
| 11600 Los Nietos Road | 5/1/2024 | 4.190% | 4.190% | 2,785 | ||||||||||||||||||||||||||||
| 5160 Richton Street | 11/15/2024 | 3.790% | 3.790% | 4,387 | ||||||||||||||||||||||||||||
| 22895 Eastpark Drive | 11/15/2024 | 4.330% | 4.330% | 2,749 | ||||||||||||||||||||||||||||
| 701-751 Kingshill Place | 1/5/2026 | 3.900% | 3.900% | 7,100 | ||||||||||||||||||||||||||||
| 13943-13955 Balboa Boulevard | 7/1/2027 | 3.930% | 3.930% | 15,661 | ||||||||||||||||||||||||||||
| 2205 126th Street | 12/1/2027 | 3.910% | 3.910% | 5,200 | ||||||||||||||||||||||||||||
| 2410-2420 Santa Fe Avenue | 1/1/2028 | 3.700% | 3.700% | 10,300 | ||||||||||||||||||||||||||||
| 11832-11954 La Cienega Boulevard | 7/1/2028 | 4.260% | 4.260% | 4,072 | ||||||||||||||||||||||||||||
| 1100-1170 Gilbert Street (Gilbert/La Palma) | 3/1/2031 | 5.125% | 5.125% | 2,293 | ||||||||||||||||||||||||||||
| 3.063% | $ | 1,223,494 | ||||||||||||||||||||||||||||||
| Debt Composition: | ||||||||||||||||||||||||||||||||
| Category | Weighted Average Term Remaining (yrs)(7) | Stated Interest Rate | Effective Interest Rate | Balance | % of Total | |||||||||||||||||||||||||||
| Fixed | 6.8 | 3.12% | 3.12% | $ | 1,164,995 | 95% | ||||||||||||||||||||||||||
| Variable | 2.6 | LIBOR + 1.70% | 1.84% | $ | 58,499 | 5% | ||||||||||||||||||||||||||
| Secured | 4.2 | 3.03% | $ | 123,494 | 10% | |||||||||||||||||||||||||||
| Unsecured | 6.9 | 3.07% | $ | 1,100,000 | 90% | |||||||||||||||||||||||||||
*See footnotes on the following page*
| Fourth Quarter 2020 Supplemental Financial Reporting Package | Page 13 | | ||||||
Debt Summary (Continued). | ||||||||
| (unaudited and dollars in thousands) | ||||||||
| Debt Maturity Schedule: | ||||||||||||||||||||||||||||||||
| Year | Secured(8) | Unsecured | Total | % Total | Effective Interest Rate | |||||||||||||||||||||||||||
| 2021 | $ | — | $ | — | $ | — | — | % | — | % | ||||||||||||||||||||||
| 2022 | — | — | — | — | % | — | % | |||||||||||||||||||||||||
| 2023 | 65,052 | 225,000 | 290,052 | 24 | % | 2.391 | % | |||||||||||||||||||||||||
| 2024 | 13,816 | — | 13,816 | 1 | % | 4.387 | % | |||||||||||||||||||||||||
| 2025 | — | 250,000 | 250,000 | 20 | % | 4.304 | % | |||||||||||||||||||||||||
| 2026 | 7,100 | — | 7,100 | 1 | % | 3.900 | % | |||||||||||||||||||||||||
| 2027 | 20,861 | 125,000 | 145,861 | 12 | % | 3.929 | % | |||||||||||||||||||||||||
| 2028 | 14,372 | — | 14,372 | 1 | % | 3.859 | % | |||||||||||||||||||||||||
| 2029 | — | 25,000 | 25,000 | 2 | % | 3.880 | % | |||||||||||||||||||||||||
| 2030 | — | 400,000 | 400,000 | 33 | % | 2.125 | % | |||||||||||||||||||||||||
| Thereafter | 2,293 | 75,000 | 77,293 | 6 | % | 4.062 | % | |||||||||||||||||||||||||
| Total | $ | 123,494 | $ | 1,100,000 | $ | 1,223,494 | 100 | % | 3.063 | % | ||||||||||||||||||||||
(1)Includes the effect of interest rate swaps effective as of December 31, 2020, and excludes the effect of premiums/discounts, deferred loan costs and the credit facility fee.
(2)Excludes unamortized debt issuance costs, premiums and discounts aggregating $7.3 million as of December 31, 2020.
(3)The credit facility is subject to a facility fee which is calculated as a percentage of the total commitment amount, regardless of usage. The facility fee ranges from 0.125% to 0.300% depending on our investment grade rating. As December 31, 2020, the facility fee rate is 0.200%.
(4)Two additional six-month extensions are available, provided that certain conditions are satisfied.
(5)The applicable LIBOR margin ranges from 0.725% to 1.400% for the revolving credit facility, 0.90% to 1.75% for the $225M term loan facility and 1.40% to 2.35% for the $150M term loan facility depending on our investment grade rating. As a result, the effective interest rate for these loans can fluctuate from period to period.
(6)One two-year extension is available, provided that certain conditions are satisfied.
(7)The weighted average remaining term to maturity of our consolidated debt is 6.6 years.
(8)Excludes the effect of scheduled monthly principal payments on amortizing loans.
| Fourth Quarter 2020 Supplemental Financial Reporting Package | Page 14 | | ||||||
Portfolio Overview. | ||||||||
| At December 31, 2020 | (unaudited results) | |||||||
| Consolidated Portfolio: | ||||||||
| Rentable Square Feet | Occupancy % | In-Place ABR(2) | ||||||||||||||||||||||||||||||||||||||||||||||||||||||||||||
| Market | # Properties | Stabilized Same Properties Portfolio | Non-Stabilized Same Properties Portfolio | Total Portfolio | Stabilized Same Properties Portfolio | Non-Stabilized Same Properties Portfolio | Total Portfolio | Total Portfolio Excluding Repositioning(1) | Total (in 000’s) | Per Square Foot | ||||||||||||||||||||||||||||||||||||||||||||||||||||
| Central LA | 14 | 1,309,471 | 1,167,088 | 2,476,559 | 98.6 | % | 99.3 | % | 98.9 | % | 98.9 | % | $ | 23,153 | $9.45 | |||||||||||||||||||||||||||||||||||||||||||||||
| Greater San Fernando Valley | 48 | 3,114,571 | 2,054,344 | 5,168,915 | 97.4 | % | 96.1 | % | 96.9 | % | 97.1 | % | 56,437 | $11.27 | ||||||||||||||||||||||||||||||||||||||||||||||||
| Mid-Counties | 20 | 1,026,443 | 1,365,262 | 2,391,705 | 99.8 | % | 91.7 | % | 95.2 | % | 95.2 | % | 24,018 | $10.55 | ||||||||||||||||||||||||||||||||||||||||||||||||
| San Gabriel Valley | 22 | 1,983,109 | 1,473,103 | 3,456,212 | 99.5 | % | 100.0 | % | 99.7 | % | 99.7 | % | 29,818 | $8.65 | ||||||||||||||||||||||||||||||||||||||||||||||||
| South Bay | 39 | 2,833,444 | 1,605,314 | 4,438,758 | 98.8 | % | 90.4 | % | 95.8 | % | 97.3 | % | 48,450 | $11.40 | ||||||||||||||||||||||||||||||||||||||||||||||||
| Los Angeles County | 143 | 10,267,038 | 7,665,111 | 17,932,149 | 98.6 | % | 95.3 | % | 97.2 | % | 97.7 | % | 181,876 | $10.43 | ||||||||||||||||||||||||||||||||||||||||||||||||
| North Orange County | 12 | 937,451 | 375,024 | 1,312,475 | 98.2 | % | 100.0 | % | 98.7 | % | 98.7 | % | 13,624 | $10.52 | ||||||||||||||||||||||||||||||||||||||||||||||||
| OC Airport | 7 | 522,595 | 62,838 | 585,433 | 98.2 | % | 100.0 | % | 98.4 | % | 98.4 | % | 6,851 | $11.90 | ||||||||||||||||||||||||||||||||||||||||||||||||
| South Orange County | 4 | 329,458 | 27,960 | 357,418 | 100.0 | % | 100.0 | % | 100.0 | % | 100.0 | % | 3,635 | $10.17 | ||||||||||||||||||||||||||||||||||||||||||||||||
| West Orange County | 8 | 663,411 | 459,762 | 1,123,173 | 100.0 | % | 73.7 | % | 89.2 | % | 100.0 | % | 9,186 | $9.16 | ||||||||||||||||||||||||||||||||||||||||||||||||
| Orange County | 31 | 2,452,915 | 925,584 | 3,378,499 | 98.9 | % | 86.9 | % | 95.7 | % | 99.2 | % | 33,296 | $10.31 | ||||||||||||||||||||||||||||||||||||||||||||||||
| Inland Empire East | 1 | 43,201 | — | 43,201 | 88.5 | % | — | % | 88.5 | % | 88.5 | % | 264 | $6.90 | ||||||||||||||||||||||||||||||||||||||||||||||||
| Inland Empire West | 27 | 3,658,089 | 1,226,185 | 4,884,274 | 98.9 | % | 53.4 | % | 87.5 | % | 92.7 | % | 37,713 | $8.83 | ||||||||||||||||||||||||||||||||||||||||||||||||
| San Bernardino County | 28 | 3,701,290 | 1,226,185 | 4,927,475 | 98.8 | % | 53.4 | % | 87.5 | % | 92.7 | % | 37,977 | $8.81 | ||||||||||||||||||||||||||||||||||||||||||||||||
| Ventura | 16 | 1,227,954 | 1,175,718 | 2,403,672 | 92.6 | % | 96.7 | % | 94.6 | % | 94.6 | % | 22,843 | $10.04 | ||||||||||||||||||||||||||||||||||||||||||||||||
| Ventura County | 16 | 1,227,954 | 1,175,718 | 2,403,672 | 92.6 | % | 96.7 | % | 94.6 | % | 94.6 | % | 22,843 | $10.04 | ||||||||||||||||||||||||||||||||||||||||||||||||
| Central San Diego | 16 | 1,106,157 | 237,049 | 1,343,206 | 97.4 | % | 86.3 | % | 95.5 | % | 95.5 | % | 17,294 | $13.49 | ||||||||||||||||||||||||||||||||||||||||||||||||
| North County San Diego | 14 | 932,671 | 583,439 | 1,516,110 | 97.9 | % | 93.9 | % | 96.3 | % | 96.3 | % | 17,067 | $11.68 | ||||||||||||||||||||||||||||||||||||||||||||||||
| San Diego County | 30 | 2,038,828 | 820,488 | 2,859,316 | 97.6 | % | 91.7 | % | 95.9 | % | 95.9 | % | 34,361 | $12.53 | ||||||||||||||||||||||||||||||||||||||||||||||||
| CONSOLIDATED TOTAL / WTD AVG | 248 | 19,688,025 | 11,813,086 | 31,501,111 | 98.2 | % | 90.2 | % | 95.2 | % | 96.7 | % | $ | 310,353 | $10.35 | |||||||||||||||||||||||||||||||||||||||||||||||
(1)Excludes space aggregating 480,446 square feet at our properties that were in various stages of repositioning or lease-up as of December 31, 2020. See pages 21-22 for additional details on these properties.
(2)See page 29 for definition and details on how these amounts are calculated.
| Fourth Quarter 2020 Supplemental Financial Reporting Package | Page 15 | | ||||||
Occupancy and Leasing Trends. | ||||||||
| (unaudited results, data represents consolidated portfolio only) | ||||||||
| Occupancy by County: | ||||||||
| Dec 31, 2020 | Sep 30, 2020 | Jun 30, 2020 | Mar 31, 2020 | Dec 31, 2019 | ||||||||||||||||||||||||||||
Occupancy:(1) | ||||||||||||||||||||||||||||||||
| Los Angeles County | 97.2% | 98.2% | 97.3% | 97.2% | 97.4% | |||||||||||||||||||||||||||
| Orange County | 95.7% | 94.4% | 91.6% | 91.2% | 96.3% | |||||||||||||||||||||||||||
| San Bernardino County | 87.5% | 96.8% | 95.6% | 96.9% | 97.4% | |||||||||||||||||||||||||||
| Ventura County | 94.6% | 96.3% | 95.0% | 96.8% | 96.6% | |||||||||||||||||||||||||||
| San Diego County | 95.9% | 96.3% | 90.3% | 90.5% | 91.4% | |||||||||||||||||||||||||||
| Total/Weighted Average | 95.2% | 97.2% | 95.4% | 95.6% | 96.5% | |||||||||||||||||||||||||||
| Consolidated Portfolio RSF | 31,501,111 | 27,711,078 | 27,633,778 | 27,303,260 | 26,425,208 | |||||||||||||||||||||||||||
| Leasing Activity: | ||||||||||||||||||||||||||||||||
| Three Months Ended | ||||||||||||||||||||||||||||||||
| Dec 31, 2020 | Sep 30, 2020 | Jun 30, 2020 | Mar 31, 2020 | Dec 31, 2019 | ||||||||||||||||||||||||||||
Leasing Activity (SF):(2) | ||||||||||||||||||||||||||||||||
New leases(2) | 672,134 | 987,176 | 550,977 | 424,435 | 439,138 | |||||||||||||||||||||||||||
Renewal leases(2) | 1,132,687 | 575,003 | 818,529 | 1,169,923 | 1,022,293 | |||||||||||||||||||||||||||
| Gross leasing | 1,804,821 | 1,562,179 | 1,369,506 | 1,594,358 | 1,461,431 | |||||||||||||||||||||||||||
| Expiring leases | 1,839,669 | 998,277 | 1,328,499 | 1,486,424 | 1,459,500 | |||||||||||||||||||||||||||
| Expiring leases - placed into repositioning | 13,020 | — | — | 198,762 | — | |||||||||||||||||||||||||||
| Net absorption | (47,868) | 563,902 | 41,007 | (90,828) | 1,931 | |||||||||||||||||||||||||||
Retention rate(3) | 79 | % | 68 | % | 67 | % | 81 | % | 73 | % | ||||||||||||||||||||||
| Weighted Average New / Renewal Leasing Spreads: | ||||||||||||||||||||||||||||||||
| Three Months Ended | ||||||||||||||||||||||||||||||||
| Dec 31, 2020 | Sep 30, 2020 | Jun 30, 2020 | Mar 31, 2020 | Dec 31, 2019 | ||||||||||||||||||||||||||||
| GAAP Rent Change | 29.9% | 26.8% | 32.3% | 36.6% | 42.0% | |||||||||||||||||||||||||||
| Cash Rent Change | 18.1% | 17.4% | 18.2% | 24.4% | 27.1% | |||||||||||||||||||||||||||
(1)See page 15 for the occupancy by County of our total consolidated portfolio excluding repositioning space.
(2)Excludes month-to-month tenants.
(3)Retention rate is calculated as renewal lease square footage plus relocation/expansion square footage, divided by expiring lease square footage. Retention excludes square footage related to the following: (i) expiring leases associated with space that is placed into repositioning after the tenant vacates, (ii) early terminations with prenegotiated replacement leases and (iii) move outs where space is directly leased by subtenants.
| Fourth Quarter 2020 Supplemental Financial Reporting Package | Page 16 | | ||||||
Leasing Statistics. | ||||||||
| (unaudited results, data represents consolidated portfolio only) | ||||||||
| Leasing Activity: | ||||||||
| # Leases Signed | SF of Leasing | Weighted Average Lease Term (Years) | ||||||||||||||||||
| Fourth Quarter 2020: | ||||||||||||||||||||
| New | 57 | 672,134 | 4.7 | |||||||||||||||||
| Renewal | 51 | 1,132,687 | 4.6 | |||||||||||||||||
| Total/Weighted Average | 108 | 1,804,821 | 4.6 | |||||||||||||||||
| Change in Annual Rental Rates and Turnover Costs for Current Quarter Leases: | ||||||||||||||||||||||||||||||||||||||||||||||||||
| GAAP Rent | Cash Rent | |||||||||||||||||||||||||||||||||||||||||||||||||
| Fourth Quarter 2020: | Current Lease | Prior Lease | Rent Change - GAAP | Weighted Avg. Abatement (Months) | Starting Cash Rent - Current Lease | Expiring Cash Rent - Prior Lease | Rent Change - Cash | Turnover Costs per SF(2) | ||||||||||||||||||||||||||||||||||||||||||
New(1) | $13.45 | $10.27 | 31.0% | 1.0 | $13.07 | $10.84 | 20.5% | $5.34 | ||||||||||||||||||||||||||||||||||||||||||
| Renewal | $11.42 | $8.81 | 29.5% | 1.0 | $11.15 | $9.51 | 17.3% | $1.19 | ||||||||||||||||||||||||||||||||||||||||||
| Weighted Average | $11.86 | $9.13 | 29.9% | 1.0 | $11.57 | $9.80 | 18.1% | $2.23 | ||||||||||||||||||||||||||||||||||||||||||
| Uncommenced Leases by County: | ||||||||||||||||||||||||||||||||||||||
| Market | Uncommenced Renewal Leases: Leased SF(3) | Uncommenced New Leases: Leased SF(3) | Percent Leased | ABR Under Uncommenced Leases (in thousands)(4)(5) | In-Place + Uncommenced ABR (in thousands)(4)(5) | In-Place + Uncommenced ABR per SF(5) | ||||||||||||||||||||||||||||||||
| Los Angeles County | 595,149 | 4,563 | 97.2% | $ | 1,653 | $ | 183,529 | $10.53 | ||||||||||||||||||||||||||||||
| Orange County | 89,750 | 7,374 | 95.9% | 349 | 33,645 | $10.39 | ||||||||||||||||||||||||||||||||
| San Bernardino County | 80,999 | 255,236 | 92.7% | 2,299 | 40,276 | $8.82 | ||||||||||||||||||||||||||||||||
| San Diego County | 143,044 | 8,132 | 96.2% | 266 | 34,627 | $12.59 | ||||||||||||||||||||||||||||||||
| Ventura County | 96,312 | 41,076 | 96.3% | 461 | 23,304 | $10.07 | ||||||||||||||||||||||||||||||||
| Total/Weighted Average | 1,005,254 | 316,381 | 96.2% | $ | 5,028 | $ | 315,381 | $10.41 | ||||||||||||||||||||||||||||||
(1)GAAP and cash rent statistics and turnover costs for new leases exclude 16 leases aggregating 386,271 RSF for which there was no comparable lease data. Of these 16 excluded leases, three leases for 75,410 RSF related to current year significant repositioning/redevelopment properties. Comparable leases generally exclude: (i) space that has never been occupied under our ownership, (ii) repositioned/redeveloped space, (iii) space that has been vacant for over one year or (iv) lease terms shorter than six months.
(2)Turnover costs include estimated tenant improvement and leasing costs associated with leases executed during the current period. Excludes costs for first generation leases.
(3)Reflects the square footage of renewal and new leases, respectively, that have been signed but have not yet commenced as of December 31, 2020.
(4)Includes $2.9 million of annualized base rent under Uncommenced New Leases and $2.1 million of incremental annualized base rent under Uncommenced Renewal Leases.
(5)See page 29 for further details on how these amounts are calculated.
| Fourth Quarter 2020 Supplemental Financial Reporting Package | Page 17 | | ||||||
Leasing Statistics (Continued). | ||||||||
| (unaudited results, data represents consolidated portfolio only) | ||||||||
| Lease Expiration Schedule as of December 31, 2020: | ||||||||
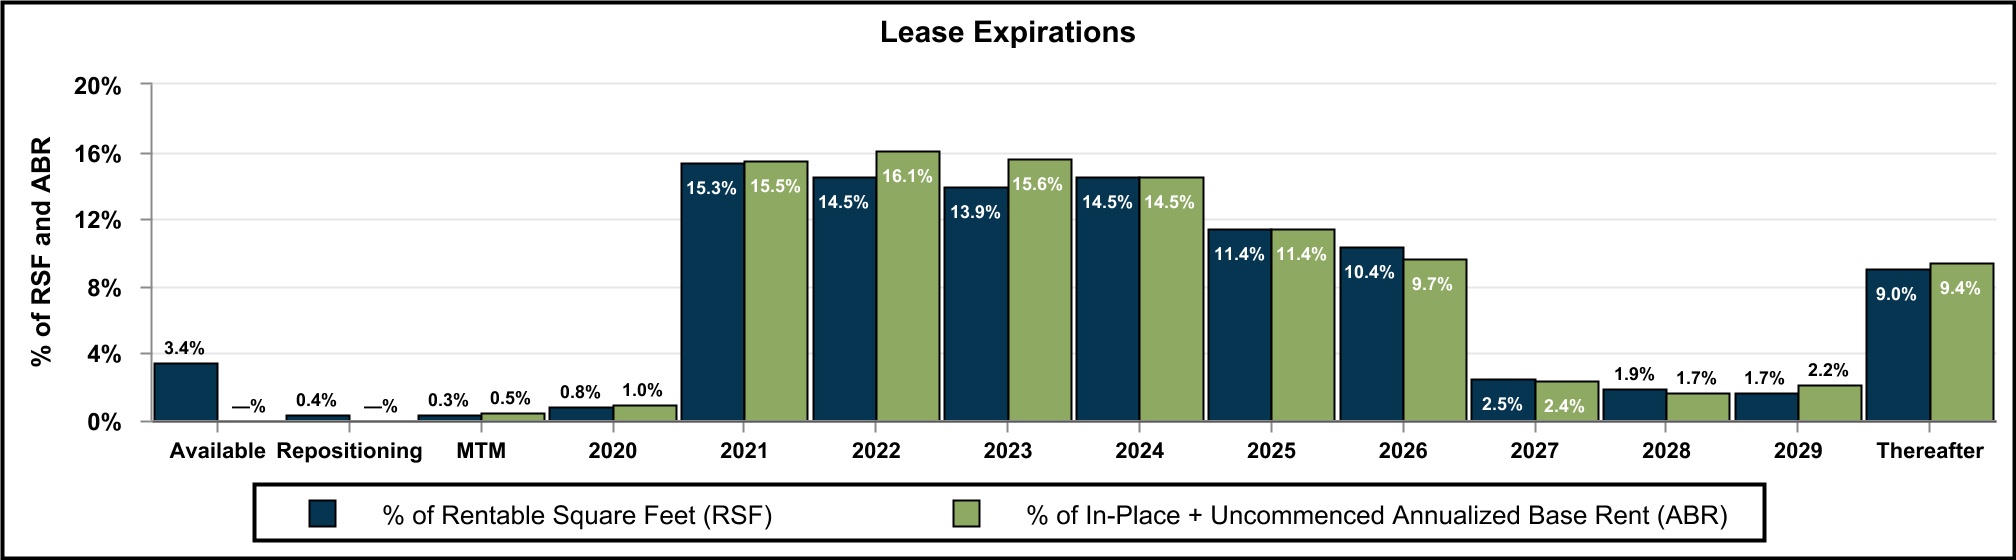
| Year of Lease Expiration | # of Leases Expiring | Total Rentable Square Feet | In-Place + Uncommenced ABR (in thousands) | In-Place + Uncommenced ABR per SF | ||||||||||||||||||||||
| Available | — | 1,073,471 | $ | — | $— | |||||||||||||||||||||
Current Repositioning(1) | — | 120,800 | — | $— | ||||||||||||||||||||||
| MTM Tenants | 74 | 84,753 | 1,688 | $19.92 | ||||||||||||||||||||||
| 2020 | 14 | 272,385 | 3,269 | $12.00 | ||||||||||||||||||||||
| 2021 | 344 | 4,822,327 | 48,860 | $10.13 | ||||||||||||||||||||||
| 2022 | 397 | 4,571,145 | 50,644 | $11.08 | ||||||||||||||||||||||
| 2023 | 323 | 4,369,316 | 49,264 | $11.27 | ||||||||||||||||||||||
| 2024 | 166 | 4,563,962 | 45,602 | $9.99 | ||||||||||||||||||||||
| 2025 | 111 | 3,597,396 | 35,880 | $9.97 | ||||||||||||||||||||||
| 2026 | 48 | 3,265,594 | 30,496 | $9.34 | ||||||||||||||||||||||
| 2027 | 13 | 785,900 | 7,752 | $9.86 | ||||||||||||||||||||||
| 2028 | 11 | 591,074 | 5,458 | $9.23 | ||||||||||||||||||||||
| 2029 | 9 | 550,549 | 6,894 | $12.52 | ||||||||||||||||||||||
| Thereafter | 30 | 2,832,439 | 29,574 | $10.44 | ||||||||||||||||||||||
| Total Portfolio | 1,540 | 31,501,111 | $ | 315,381 | $10.41 | |||||||||||||||||||||
(1)Represents vacant space at properties that were classified as current repositioning as of December 31, 2020. Excludes completed repositioning properties, properties in lease-up and future repositioning properties. See pages 21-22 for additional details on these properties.
| Fourth Quarter 2020 Supplemental Financial Reporting Package | Page 18 | | ||||||
Top Tenants and Lease Segmentation. | ||||||||
| (unaudited results, data represents consolidated portfolio only) | ||||||||
| Top 10 Tenants: | ||||||||
| Tenant | Submarket | Leased Rentable SF | % of In-Place + Uncommenced ABR | In-Place + Uncommenced ABR per SF | Lease Expiration | |||||||||||||||||||||||||||
| Federal Express Corporation | Multiple Submarkets(1) | 527,861 | 2.7% | $15.87(1) | 11/30/2032 (1) | |||||||||||||||||||||||||||
| Unified Natural Foods, Inc. | Central LA | 695,120 | 1.7% | $7.76 | 5/8/2038 | |||||||||||||||||||||||||||
| Michael Kors (USA), Inc. | Mid-Counties | 565,619 | 1.6% | $8.94 | 11/30/2026 | |||||||||||||||||||||||||||
| Cosmetic Laboratories of America, LLC | Greater San Fernando Valley | 319,348 | 0.9% | $8.64 | 6/30/2027 | |||||||||||||||||||||||||||
| Global Mail. Inc. | Mid-Counties | 240,959 | 0.7% | $10.68 | 6/30/2030 | |||||||||||||||||||||||||||
| Omega/Cinema Props, Inc. | Central LA | 246,588 | 0.8% | $10.02 | 12/31/2029 | |||||||||||||||||||||||||||
| 32 Cold, LLC | Central LA | 149,157 | 0.8% | $16.00 | 3/31/2026 (2) | |||||||||||||||||||||||||||
| Dendreon Pharmaceuticals, LLC | West Orange County | 184,000 | 0.7% | $12.00 | 2/28/2030 | |||||||||||||||||||||||||||
| Command Logistic Services | South Bay | 228,903 | 0.7% | $9.60 | 9/30/2025 | |||||||||||||||||||||||||||
| Universal Technical Institute of Southern California, LLC | South Bay | 142,593 | 0.7% | $14.52 | 8/31/2030 | |||||||||||||||||||||||||||
| Top 10 Total / Weighted Average | 3,300,148 | 11.3% | $10.76 | |||||||||||||||||||||||||||||
(1)Includes (i) one land lease in North Orange County expiring January 31, 2021, (ii) 30,160 RSF in Ventura expiring September 30, 2027, (iii) one land lease in LA - Mid-Counties expiring June 30, 2029, (iv) 42,270 RSF in LA - South Bay expiring October 31, 2030, (v) 311,995 RSF in North County San Diego expiring February 28, 2031, and (vi) 143,436 RSF in LA - South Bay expiring November 30, 2032.
(2)Includes (i) 78,280 RSF expiring September 30, 2025, and (ii) 70,877 RSF expiring March 31, 2026.
| Lease Segmentation by Size: | ||||||||||||||||||||||||||||||||||||||||||||||||||
| Square Feet | Number of Leases | Leased Rentable SF | Rentable Square Feet | Leased % | Leased % Excluding Repositioning | In-Place + Uncommenced ABR (in thousands)(1) | % of In-Place + Uncommenced ABR | In-Place + Uncommenced ABR per SF(1) | ||||||||||||||||||||||||||||||||||||||||||
| <4,999 | 721 | 1,542,276 | 1,682,792 | 91.6% | 91.6% | $ | 25,430 | 8.0% | $16.49 | |||||||||||||||||||||||||||||||||||||||||
| 5,000 - 9,999 | 229 | 1,636,518 | 1,741,370 | 94.0% | 94.4% | 21,781 | 6.9% | $13.31 | ||||||||||||||||||||||||||||||||||||||||||
| 10,000 - 24,999 | 303 | 4,868,880 | 5,068,951 | 96.1% | 97.1% | 59,807 | 19.0% | $12.28 | ||||||||||||||||||||||||||||||||||||||||||
| 25,000 - 49,999 | 137 | 4,930,439 | 5,364,273 | 91.9% | 97.9% | 54,167 | 17.2% | $10.99 | ||||||||||||||||||||||||||||||||||||||||||
| >50,000 | 150 | 17,328,727 | 17,643,725 | 98.2% | 98.7% | 154,196 | 48.9% | $8.90 | ||||||||||||||||||||||||||||||||||||||||||
| Total / Weighted Average | 1,540 | 30,306,840 | 31,501,111 | 96.2% | 97.7% | $ | 315,381 | 100.0% | $10.41 | |||||||||||||||||||||||||||||||||||||||||
(1)See page 29 for further details on how these amounts are calculated.
| Fourth Quarter 2020 Supplemental Financial Reporting Package | Page 19 | | ||||||
Capital Expenditure Summary. | ||||||||
| (unaudited results, in thousands, except square feet and per square foot data) | ||||||||
| Year Ended December 31, 2020 | ||||||||
| Year to Date | |||||||||||||||||||||||||||||||||||||||||
| Q4-2020 | Q3-2020 | Q2-2020 | Q1-2020 | Total | SF(1) | PSF | |||||||||||||||||||||||||||||||||||
| Tenant Improvements: | |||||||||||||||||||||||||||||||||||||||||
| New Leases‐1st Generation | $ | 63 | $ | 363 | $ | 108 | $ | 355 | $ | 889 | 851,851 | $ | 1.04 | ||||||||||||||||||||||||||||
| New Leases‐2nd Generation | 80 | 286 | 293 | 27 | 686 | 281,642 | $ | 2.44 | |||||||||||||||||||||||||||||||||
| Renewals | 34 | 63 | 17 | 4 | 118 | 450,871 | $ | 0.26 | |||||||||||||||||||||||||||||||||
| Total Tenant Improvements | $ | 177 | $ | 712 | $ | 418 | $ | 386 | $ | 1,693 | |||||||||||||||||||||||||||||||
| Leasing Commissions & Lease Costs: | |||||||||||||||||||||||||||||||||||||||||
| New Leases‐1st Generation | $ | 1,264 | $ | 1,381 | $ | 441 | $ | 476 | $ | 3,562 | 1,223,553 | $ | 2.91 | ||||||||||||||||||||||||||||
| New Leases‐2nd Generation | 629 | 1,630 | 856 | 723 | 3,838 | 1,682,072 | $ | 2.28 | |||||||||||||||||||||||||||||||||
| Renewals | 998 | 264 | 834 | 973 | 3,069 | 2,500,831 | $ | 1.23 | |||||||||||||||||||||||||||||||||
| Total Leasing Commissions & Lease Costs | $ | 2,891 | $ | 3,275 | $ | 2,131 | $ | 2,172 | $ | 10,469 | |||||||||||||||||||||||||||||||
| Total Recurring Capex | $ | 2,671 | $ | 1,380 | $ | 1,323 | $ | 1,575 | $ | 6,949 | 27,929,513 | $ | 0.25 | ||||||||||||||||||||||||||||
| Recurring Capex % of NOI | 4.0 | % | 2.2 | % | 2.2 | % | 2.7 | % | 2.8 | % | |||||||||||||||||||||||||||||||
| Recurring Capex % of Rental Revenue | 3.6 | % | 2.0 | % | 2.0 | % | 2.4 | % | 2.5 | % | |||||||||||||||||||||||||||||||
| Nonrecurring Capex: | |||||||||||||||||||||||||||||||||||||||||
Redevelopment and Repositioning in Process(2) | $ | 15,401 | $ | 14,291 | $ | 12,365 | $ | 9,412 | $ | 51,469 | |||||||||||||||||||||||||||||||
Unit Renovation(3) | 954 | 602 | 749 | 760 | 3,065 | ||||||||||||||||||||||||||||||||||||
Other(4) | 4,214 | 3,942 | 1,659 | 2,239 | 12,054 | ||||||||||||||||||||||||||||||||||||
| Total Nonrecurring Capex | $ | 20,569 | $ | 18,835 | $ | 14,773 | $ | 12,411 | $ | 66,588 | 20,463,668 | $ | 3.25 | ||||||||||||||||||||||||||||
Other Capitalized Costs(5) | $ | 2,206 | $ | 2,495 | $ | 2,412 | $ | 2,123 | $ | 9,236 | |||||||||||||||||||||||||||||||
(1)For tenant improvements and leasing commissions, reflects the aggregate square footage of the leases in which we incurred such costs, excluding new/renewal leases in which there were no tenant improvements and/or leasing commissions. For recurring capex, reflects the weighted average square footage of our consolidated portfolio for the period (including properties that were sold during the period). For nonrecurring capex, reflects the aggregate square footage of the properties in which we incurred such capital expenditures.
(2)Includes capital expenditures related to properties that were under redevelopment or repositioning during 2020. See pages 21-22 for details of these properties.
(3)Includes non-tenant-specific capital expenditures with costs less than $100,000 per unit.
(4)Includes other nonrecurring capital expenditures including, but not limited to, seismic and fire sprinkler upgrades, replacements of either roof or parking lots, ADA related construction and capital expenditures for deferred maintenance existing at the time such property was acquired.
(5)Includes the following capitalized costs: (i) compensation costs of personnel directly responsible for and who spend their time on development, renovation and rehabilitation activity and (ii) interest, property taxes and insurance costs incurred during the redevelopment and construction periods of repositioning or redevelopment projects.
| Fourth Quarter 2020 Supplemental Financial Reporting Package | Page 20 | | ||||||
Properties and Space Under Repositioning/Redevelopment.(1) | ||||||||
| As of December 31, 2020 | (unaudited results, in thousands, except square feet) | |||||||
| Repositioning | |||||||||||||||||||||||||||||||||||||||||||||||||||||||||||||||||||||||||||||
Est. Constr. Period(1) | |||||||||||||||||||||||||||||||||||||||||||||||||||||||||||||||||||||||||||||
| Property (Submarket) | Total Property RSF(2) | Repo/ Lease-Up RSF(2) | Total Property Leased % 12/31/20 | Start | Target Complet. | Est. Stabilization Period(1)(3) | Purch. Price(1) | Projected Repo Costs(1) | Projected Total Invest.(1) | Cumulative Investment to Date(1) | Actual Cash NOI 4Q-2020(1) | Est. An. Stabilized Cash NOI(1) | Est. Stabilized Yield(1) | ||||||||||||||||||||||||||||||||||||||||||||||||||||||||||||||||
| SIGNIFICANT CURRENT REPOSITIONING IN PROCESS: | |||||||||||||||||||||||||||||||||||||||||||||||||||||||||||||||||||||||||||||
12821 Knott Street (West OC)(4) | 166,132 | 166,132 | 0% | 1Q-19 | 3Q-21 | 4Q-21 | $ | 19,768 | $ | 11,661 | $ | 31,429 | $ | 21,812 | $ | (5) | $ | 1,800 | 5.7% | ||||||||||||||||||||||||||||||||||||||||||||||||||||||||||
| OTHER CURRENT REPOSITIONING IN PROCESS: | |||||||||||||||||||||||||||||||||||||||||||||||||||||||||||||||||||||||||||||
Other Repositioning - 23 properties with estimated costs < $1 million individually(5) | $ | 18,578 | $ | 7,767 | 6.4% | ||||||||||||||||||||||||||||||||||||||||||||||||||||||||||||||||||||||||
| LEASE-UP: | |||||||||||||||||||||||||||||||||||||||||||||||||||||||||||||||||||||||||||||
| The Merge (Inland Empire West) | 333,491 | 333,544 | 18% | 2Q-19 | 4Q-20 | 3Q-21 | $ | 23,827 | $ | 33,018 | $ | 56,845 | $ | 54,300 | $ | (22) | $ | 3,100 | 5.5% | ||||||||||||||||||||||||||||||||||||||||||||||||||||||||||
4Q-2020 STABILIZED(1): | |||||||||||||||||||||||||||||||||||||||||||||||||||||||||||||||||||||||||||||
| 29003 Avenue Sherman (SF Valley) | 68,123 | 68,123 | 100% | 3Q-18 | 4Q-19 | 4Q-20 | $ | 9,531 | $ | 1,313 | $ | 10,844 | $ | 10,675 | $ | (31) | $ | 558 | 5.1% | ||||||||||||||||||||||||||||||||||||||||||||||||||||||||||
727 Kingshill Place (South Bay)(6) | 46,005 | 46,005 | 100% | 1Q-20 | 4Q-20 | 4Q-20 | $ | 8,894 | $ | 1,674 | $ | 10,568 | $ | 10,508 | $ | (11) | $ | 518 | 4.9% | ||||||||||||||||||||||||||||||||||||||||||||||||||||||||||
| TOTAL | 114,128 | 114,128 | $ | 18,425 | $ | 2,987 | $ | 21,412 | $ | 21,183 | $ | (42) | $ | 1,076 | |||||||||||||||||||||||||||||||||||||||||||||||||||||||||||||||
| FUTURE REPOSITIONING: | |||||||||||||||||||||||||||||||||||||||||||||||||||||||||||||||||||||||||||||
12133 Greenstone Ave. (Mid-Counties)(7) | 12,586 | 12,586 | 100% | 1Q-21 | 4Q-21 | 1Q-22 | $ | 5,657 | $ | 6,552 | $ | 12,209 | $ | 5,781 | $ | 24 | $ | 783 | 6.4% | ||||||||||||||||||||||||||||||||||||||||||||||||||||||||||
| 11529-11547 Tuxford St. (SF Valley) | 29,730 | 29,730 | 100% | 1Q-21 | 3Q-21 | 4Q-21 | $ | 5,025 | $ | 1,538 | $ | 6,563 | $ | 5,037 | $ | 46 | $ | 388 | 5.9% | ||||||||||||||||||||||||||||||||||||||||||||||||||||||||||
Rancho Pacifica - Bldgs 1 & 6 (South Bay)(8) | 488,114 | 385,537 | 100% | 1Q-21 | 3Q-21 | 4Q-21 | $ | 89,123 | $ | 9,626 | $ | 98,749 | $ | 90,087 | $ | 667 | $ | 5,876 | 6.0% | ||||||||||||||||||||||||||||||||||||||||||||||||||||||||||
| 16221 Arthur Street (Mid-Counties) | 61,372 | 61,372 | 100% | 1Q-21 | 2Q-21 | 3Q-21 | $ | 6,279 | $ | 1,837 | $ | 8,116 | $ | 6,401 | $ | 105 | $ | 613 | 7.6% | ||||||||||||||||||||||||||||||||||||||||||||||||||||||||||
| 14421-14441 Bonelli St. (SG Valley) | 148,740 | 148,740 | 100% | 2Q-21 | 4Q-21 | 1Q-22 | $ | 19,500 | $ | 2,813 | $ | 22,313 | $ | 19,500 | $ | 165 | $ | 1,323 | 5.9% | ||||||||||||||||||||||||||||||||||||||||||||||||||||||||||
| 11600 Los Nietos Road (Mid-Counties) | 103,982 | 103,982 | 100% | 2Q-21 | 1Q-22 | 2Q-22 | $ | 17,014 | $ | 4,941 | $ | 21,955 | $ | 17,014 | $ | 184 | $ | 1,103 | 5.0% | ||||||||||||||||||||||||||||||||||||||||||||||||||||||||||
| 15650-15700 Avalon Blvd. (South Bay) | 98,259 | 98,259 | 95% | 2Q-21 | 3Q-21 | 4Q-21 | $ | 28,273 | $ | 4,843 | $ | 33,116 | $ | 28,358 | $ | 323 | $ | 1,694 | 5.0% | ||||||||||||||||||||||||||||||||||||||||||||||||||||||||||
| 3441 MacArthur Blvd. (OC Airport) | 122,060 | 122,060 | 100% | 4Q-21 | 2Q-22 | 3Q-22 | $ | 9,038 | $ | 5,370 | $ | 14,408 | $ | 9,083 | $ | 224 | $ | 1,200 | 8.3% | ||||||||||||||||||||||||||||||||||||||||||||||||||||||||||
| TOTAL | 1,064,843 | 962,266 | $ | 179,909 | $ | 37,520 | $ | 217,429 | $ | 181,261 | $ | 1,738 | $ | 12,980 | |||||||||||||||||||||||||||||||||||||||||||||||||||||||||||||||
*See footnotes on page 23*
| Fourth Quarter 2020 Supplemental Financial Reporting Package | Page 21 | | ||||||
Properties and Space Under Repositioning/Redevelopment (Continued).(1) | ||||||||
| As of December 31, 2020 | (unaudited results, in thousands, except square feet) | |||||||
| Redevelopment | |||||||||||||||||||||||||||||||||||||||||||||||||||||||||||||||||||||||
Est. Constr. Period(1) | |||||||||||||||||||||||||||||||||||||||||||||||||||||||||||||||||||||||
| Property (Submarket) | Projected RSF(9) | Property Leased % 12/31/20 | Start | Target Complet. | Estimated Stabilization Period(1)(3) | Purchase Price(1) | Projected Redev. Costs(1) | Projected Total Investment(1) | Cumulative Investment to Date(1) | Actual Cash NOI 4Q-2020(1) | Est. Annual Stabilized Cash NOI(1) | Estimated Stabilized Yield(1) | |||||||||||||||||||||||||||||||||||||||||||||||||||||||||||
| CURRENT REDEVELOPMENT: | |||||||||||||||||||||||||||||||||||||||||||||||||||||||||||||||||||||||
| Avenue Paine (SF Valley) | 111,024 | 0% | 3Q-19 | 4Q-21 | 2Q-22 | $ | 5,515 | $ | 11,742 | $ | 17,257 | $ | 6,411 | $ | (17) | $ | 1,075 | 6.2% | |||||||||||||||||||||||||||||||||||||||||||||||||||||
| 851 Lawrence Drive (Ventura) | 90,856 | 0% | 2Q-18 | 1Q-21 | 4Q-21 | $ | 6,663 | $ | 12,143 | $ | 18,806 | $ | 12,650 | $ | — | $ | 1,116 | 5.9% | |||||||||||||||||||||||||||||||||||||||||||||||||||||
| TOTAL | 201,880 | $ | 12,178 | $ | 23,885 | $ | 36,063 | $ | 19,061 | $ | (17) | $ | 2,191 | ||||||||||||||||||||||||||||||||||||||||||||||||||||||||||
| FUTURE REDEVELOPMENT: | |||||||||||||||||||||||||||||||||||||||||||||||||||||||||||||||||||||||
4416 Azusa Canyon Rd. (SG Valley)(10) | 128,350 | 100% | 1Q-21 | 3Q-22 | 1Q-23 | $ | 12,277 | $ | 12,728 | $ | 25,005 | $ | 12,402 | $ | 179 | $ | 1,347 | 5.4% | |||||||||||||||||||||||||||||||||||||||||||||||||||||
9615 Norwalk Blvd. (Mid-Counties)(10)(11) | 201,808 | 100% | 2Q-21 | 1Q-23 | 2023 | $ | 9,642 | $ | 23,525 | $ | 33,167 | $ | 10,445 | $ | 234 | $ | 2,202 | 6.6% | |||||||||||||||||||||||||||||||||||||||||||||||||||||
| 415 Motor Avenue (SG Valley) | 96,950 | 0% | 2Q-21 | 2Q-22 | 2022 | $ | 7,376 | $ | 10,098 | $ | 17,474 | $ | 7,934 | $ | (23) | $ | 1,003 | 5.7% | |||||||||||||||||||||||||||||||||||||||||||||||||||||
15601 Avalon Blvd. (South Bay)(12) | 84,727 | 0% | 3Q-21 | 3Q-22 | 2023 | $ | 15,500 | $ | 9,879 | $ | 25,379 | $ | 15,520 | $ | (30) | $ | 1,305 | 5.1% | |||||||||||||||||||||||||||||||||||||||||||||||||||||
| 1055 Sandhill Ave. (South Bay) | 126,013 | 0% | 4Q-21 | 1Q-23 | 2023 | $ | 11,994 | $ | 14,216 | $ | 26,210 | $ | 12,410 | $ | (64) | $ | 1,485 | 5.7% | |||||||||||||||||||||||||||||||||||||||||||||||||||||
12752-12822 Monarch St. (West OC)(13) | 275,838 | 100% | 4Q-21 | 3Q-22 | 2023 | $ | 34,098 | $ | 14,468 | $ | 48,566 | $ | 35,054 | $ | 445 | $ | 2,907 | 6.0% | |||||||||||||||||||||||||||||||||||||||||||||||||||||
| TOTAL | 913,686 | $ | 90,887 | $ | 84,914 | $ | 175,801 | $ | 93,765 | $ | 741 | $ | 10,249 | ||||||||||||||||||||||||||||||||||||||||||||||||||||||||||
*See footnotes on page 23*
| Fourth Quarter 2020 Supplemental Financial Reporting Package | Page 22 | | ||||||
Properties and Space Under Repositioning/Redevelopment (Continued).(1) | ||||||||
| As of December 31, 2020 | (unaudited results, in thousands, except square feet) | |||||||
| Stabilized Repositionings: Properties and Space | |||||||||||||||||||||||||||||||||||||||||||||||||||||||||||
| Property (Submarket) | Rentable Square Feet | Stabilized Period | Stabilized Yield | ||||||||||||||||||||||||||||||||||||||||||||||||||||||||
| 14750 Nelson (San Gabriel Valley) | 201,990 | 1Q-19 | 8.0% | ||||||||||||||||||||||||||||||||||||||||||||||||||||||||
| 1998 Surveyor Avenue (Ventura) | 56,306 | 1Q-19 | 5.8% | ||||||||||||||||||||||||||||||||||||||||||||||||||||||||
| 15401 Figueroa Street (South Bay) | 38,584 | 1Q-19 | 7.2% | ||||||||||||||||||||||||||||||||||||||||||||||||||||||||
| 1332-1340 Rocky Pt. Dr. (North SD) | 73,747 | 1Q-19 | 6.5% | ||||||||||||||||||||||||||||||||||||||||||||||||||||||||
| 1580 Carson Street (South Bay) | 43,787 | 3Q-19 | 6.3% | ||||||||||||||||||||||||||||||||||||||||||||||||||||||||
| 3233 Mission Oaks Blvd. - Unit H / Unit 3233 (Ventura) | 43,927 (Unit H) / 109,636 (Unit 3233) | 1Q-18 / 4Q-19 | 9.0%(14) | ||||||||||||||||||||||||||||||||||||||||||||||||||||||||
| 2455 Conejo Spectrum St.(Ventura) | 98,218 | 1Q-20 | 5.3% | ||||||||||||||||||||||||||||||||||||||||||||||||||||||||
| 635 8th Street (SF Valley) | 72,250 | 1Q-20 | 5.0% | ||||||||||||||||||||||||||||||||||||||||||||||||||||||||
| 16121 Carmenita Road (Mid-Counties) | 109,780 | 3Q-20 | 5.9% | ||||||||||||||||||||||||||||||||||||||||||||||||||||||||
| 10015 Waples Court (Central SD) | 106,412 | 3Q-20 | 5.7% | ||||||||||||||||||||||||||||||||||||||||||||||||||||||||
| 1210 N. Red Gum Street (North OC) | 64,570 | 3Q-20 | 6.9% | ||||||||||||||||||||||||||||||||||||||||||||||||||||||||
| 7110 E. Rosecrans Avenue - Unit B (South Bay) | 37,417 | 3Q-20 | n/a(15) | ||||||||||||||||||||||||||||||||||||||||||||||||||||||||
| 29003 Avenue Sherman (SF Valley) | 68,123 | 4Q-20 | 5.1% | ||||||||||||||||||||||||||||||||||||||||||||||||||||||||
| 727 Kingshill Place (South Bay) | 46,005 | 4Q-20 | 4.9% | ||||||||||||||||||||||||||||||||||||||||||||||||||||||||
(1)For definitions of “Properties and Space Under Repositioning/Redevelopment,” “Estimated Construction Period (definition changed in Q4-20),” “Purchase Price,” “Projected Repositioning/Redevelopment Costs,” “Projected Total Investment,” “Cumulative Investment to Date,” “Estimated Annual Stabilized Cash NOI,” “Actual Cash NOI,” “Estimated Stabilized Yield” and “Stabilization Date - Properties and Space Under Repositioning” see page 31 in the Notes and Definitions section of this report.
(2)“Total Property RSF” is the total RSF of the entire property or particular building(s) (footnoted if applicable) under repositioning. “Repositioning/Lease-up RSF” is the actual RSF that is subject to repositioning at the property/building, and may be less than Total Property RSF.
(3)Represents the estimated quarter that the project will reach stabilization. Includes time to complete construction & lease-up the project. The actual period of stabilization may vary materially from our estimates.
(4)At 12821 Knott Street, we are repositioning the existing 120,800 RSF building and are constructing approximately 45,000 RSF of new warehouse space.
(5)“Other Repositioning” includes 23 repositioning properties where estimated costs are generally less than $1.0 million individually. Other Repositioning is comprised of properties both included and excluded from our stabilized same properties portfolio.
(6)During 1Q-20, we acquired 701-751 Kingshill Place, a six-building property totaling 169,069 RSF. Amounts presented on page 21 relate to one of the six buildings located at 727 Kingshill Place (46,005 RSF).
(7)12133 Greenstone Avenue is a single tenant container storage facility with a 12,586 rentable square foot truck terminal building on 4.8 acres with excess land.
(8)Rancho Pacifica Buildings 1 & 6 are located at 2301-2329 Pacifica Place and 2332-2366 Pacifica Place, and represent two buildings totaling 488,114 RSF, out of six buildings at our Rancho Pacifica Park property, which has a total 1,152,883 RSF.
(9)Represents the estimated rentable square footage of the project upon completion of redevelopment.
(10)As of December 31, 2020, these projects have existing buildings aggregating 437,147 RSF (also included in our Total Portfolio RSF) that we intend to fully or partially demolish prior to constructing new buildings. Includes the following properties: 4416 Azusa Canyon Road (70,510 RSF), 9615 Norwalk Boulevard (26,362 RSF),15601 Avalon Boulevard (63,690 RSF), 12752 Monarch Street (276,585 RSF).
(11)9615 Norwalk is a 10.26 acre storage-yard with two occupied buildings totaling 26,362 RSF. In January 2019, we converted the tenant’s MTM land lease to a term lease with an expiration date of March 31, 2021. We will demolish the existing buildings and construct a new 201,808 RSF building upon termination of the land lease.
(12)In February 2021, we leased 15601 Avalon Boulevard to a tenant under a short-term lease. Upon termination of the lease, we will demolish the existing building and construct a new 84,727 RSF building.
(13)As of December 31, 2020, 12752-12822 Monarch Street contains two buildings totaling 276,585 RSF. We plan to demolish one building with 98,360 RSF at this property and add a new 97,613 RSF building after the in-place lease terminates. At completion, the total project will contain 275,838 RSF.
(14)Represents the stabilized yield for the entire 3233 Mission Oaks Boulevard property (461,717 RSF).
(15)We are unable to provide a meaningful stabilized yield for this completed project as this was a partial repositioning of a larger property.
| Fourth Quarter 2020 Supplemental Financial Reporting Package | Page 23 | | ||||||
Current Year Acquisitions and Dispositions Summary. | ||||||||
| As of December 31, 2020 | (unaudited results, data represents consolidated portfolio only) | |||||||
| 2020 Current Period Acquisitions | ||||||||||||||||||||||||||||||||||||||||||||
| Acquisition Date | Property Address | County | Submarket | Rentable Square Feet | Acquisition Price ($ in MM) | Occ. % at Acquisition | Occ.% at Dec 31, 2020 | |||||||||||||||||||||||||||||||||||||
| 3/5/2020 | 701-751 Kingshill Place(1) | Los Angeles | South Bay | 169,069 | $ | 33.25 | 73% | 90% | ||||||||||||||||||||||||||||||||||||
| 3/5/2020 | 2601-2641 Manhattan Beach Blvd(1) | Los Angeles | South Bay | 126,726 | 39.48 | 96% | 91% | |||||||||||||||||||||||||||||||||||||
| 3/5/2020 | 2410-2420 Santa Fe Avenue(1) | Los Angeles | South Bay | 112,000 | 35.74 | 100% | 100% | |||||||||||||||||||||||||||||||||||||
| 3/5/2020 | 11600 Los Nietos Road(1) | Los Angeles | Mid-Counties | 103,982 | 16.63 | 100% | 100% | |||||||||||||||||||||||||||||||||||||
| 3/5/2020 | 5160 Richton Street(1) | San Bernardino | Inland Empire - West | 94,976 | 15.65 | 86% | 100% | |||||||||||||||||||||||||||||||||||||
| 3/5/2020 | 2205 W. 126th Street(1) | Los Angeles | South Bay | 63,532 | 17.71 | 40% | 100% | |||||||||||||||||||||||||||||||||||||
| 3/5/2020 | 11832-11954 La Cienega Blvd(1) | Los Angeles | South Bay | 63,462 | 19.66 | 93% | 93% | |||||||||||||||||||||||||||||||||||||
| 3/5/2020 | 7612-7642 Woodwind Drive(1) | Orange | West Orange County | 62,377 | 13.78 | 100% | 100% | |||||||||||||||||||||||||||||||||||||
| 3/5/2020 | 960-970 Knox Street(1) | Los Angeles | South Bay | 39,400 | 9.94 | 100% | 87% | |||||||||||||||||||||||||||||||||||||
| 3/5/2020 | 25781 Atlantic Ocean Drive(1) | Orange | South Orange County | 27,960 | 5.52 | 100% | 100% | |||||||||||||||||||||||||||||||||||||
| 4/1/2020 | Brady Way(2) | Orange | West Orange County | — | 0.87 | n/a | n/a | |||||||||||||||||||||||||||||||||||||
| 4/3/2020 | 720-720 Vernon Avenue | Los Angeles | San Gabriel Valley | 71,692 | 15.52 | 100% | 100% | |||||||||||||||||||||||||||||||||||||
| 5/5/2020 | 6687 Flotilla Street | Los Angeles | Central | 120,000 | 21.00 | 100% | 100% | |||||||||||||||||||||||||||||||||||||
| 5/28/2020 | 1055 Sandhill Avenue(3) | Los Angeles | South Bay | — | 14.45 | n/a | n/a | |||||||||||||||||||||||||||||||||||||
| 6/19/2020 | 22895 Eastpark Drive | Orange | North Orange County | 34,950 | 6.84 | 100% | 100% | |||||||||||||||||||||||||||||||||||||
| 6/19/2020 | 8745-8775 Production Avenue | San Diego | Central San Diego | 46,820 | 7.85 | 65% | 47% | |||||||||||||||||||||||||||||||||||||
| 6/26/2020 | 15850 Slover Avenue | San Bernardino | Inland Empire - West | 60,127 | 9.96 | —% | —% | |||||||||||||||||||||||||||||||||||||
| 7/1/2020 | 15650-15700 Avalon Blvd | Los Angeles | South Bay | 166,088 | 28.08 | 100% | 95% | |||||||||||||||||||||||||||||||||||||
| 7/1/2020 | 11308-11350 Penrose Street | Los Angeles | Greater San Fernando Valley | 151,604 | 25.43 | 100% | 100% | |||||||||||||||||||||||||||||||||||||
| 7/1/2020 | 11076-11078 Fleetwood Street | Los Angeles | Greater San Fernando Valley | 26,040 | 4.71 | 100% | 50% | |||||||||||||||||||||||||||||||||||||
| 7/1/2020 | 11529-11547 Tuxford Street | Los Angeles | Greater San Fernando Valley | 29,730 | 5.00 | 100% | 100% | |||||||||||||||||||||||||||||||||||||
| 7/17/2020 | 12133 Greenstone Avenue | Los Angeles | Mid-Counties | 12,586 | 5.48 | 100% | 100% | |||||||||||||||||||||||||||||||||||||
| 10/14/2020 | 12772-12746 San Fernando Road | Los Angeles | Greater San Fernando Valley | 140,837 | 22.05 | 56% | 56% | |||||||||||||||||||||||||||||||||||||
| 10/26/2020 | 15601 Avalon Blvd | Los Angeles | South Bay | 63,690 | 15.50 | —% | —% | |||||||||||||||||||||||||||||||||||||
| 11/17/2020 | Gateway Pointe | Los Angeles | Mid-Counties | 989,195 | 296.59 | 100% | 89% | |||||||||||||||||||||||||||||||||||||
| 11/17/2020 | 13943-13955 Balboa Blvd(4) | Los Angeles | Greater San Fernando Valley | 200,632 | 45.34 | 100% | 100% | |||||||||||||||||||||||||||||||||||||
| 12/3/2020 | Van Nuys Airport Industrial Center | Los Angeles | Greater San Fernando Valley | 426,466 | 154.64 | 99% | 99% | |||||||||||||||||||||||||||||||||||||
| 12/4/2020 | 4039 State Street | San Bernardino | Inland Empire - West | 139,000 | 29.67 | 100% | 100% | |||||||||||||||||||||||||||||||||||||
| 12/4/2020 | 10156 Live Oak Avenue | San Bernardino | Inland Empire - West | 236,912 | 46.81 | —% | — | |||||||||||||||||||||||||||||||||||||
| 12/4/2020 | 10694 Tamarind Avenue | San Bernardino | Inland Empire - West | 99,999 | 22.39 | 100% | 100% | |||||||||||||||||||||||||||||||||||||
| 12/4/2020 | 2520 Baseline Road | San Bernardino | Inland Empire - West | 156,586 | 30.53 | 100% | 100% | |||||||||||||||||||||||||||||||||||||
| 12/9/2020 | 12211 Greenstone Avenue | Los Angeles | Mid-Counties | — | 16.80 | 100% | 100% | |||||||||||||||||||||||||||||||||||||
| 12/15/2020 | 1921, 2011, 2055, 2099, 2040 East 27th St. | Los Angeles | Central | 300,389 | 63.40 | 100% | 100% | |||||||||||||||||||||||||||||||||||||
| 12/15/2020 | 2750 & 2800 Alameda Street | Los Angeles | Central | 164,026 | 30.37 | 100% | 100% | |||||||||||||||||||||||||||||||||||||
| 12/31/2020 | 29010 Avenue Paine(5) | Los Angeles | Greater San Fernando Valley | 100,157 | 16.04 | 100% | 100% | |||||||||||||||||||||||||||||||||||||
| 12/31/2020 | 29010 Commerce Center Drive(5) | Los Angeles | Greater San Fernando Valley | 117,151 | 24.48 | 100% | 100% | |||||||||||||||||||||||||||||||||||||
| 12/31/2020 | 13369 Valley Boulevard(5) | San Bernardino | Inland Empire - West | 105,041 | 20.66 | 100% | 100% | |||||||||||||||||||||||||||||||||||||
| 12/31/2020 | 6635 Caballero Boulevard(5) | Los Angeles | Mid-Counties | 92,395 | 22.80 | 100% | 100% | |||||||||||||||||||||||||||||||||||||
| 12/31/2020 | 1235 South Lewis Street | Orange | North Orange County | 62,607 | 16.80 | 100% | 100% | |||||||||||||||||||||||||||||||||||||
| Total 2020 Current Period Acquisitions: | 4,978,204 | $ | 1,227.42 | |||||||||||||||||||||||||||||||||||||||||
| *See footnotes on the following page* | ||||||||||||||||||||||||||||||||||||||||||||
| Fourth Quarter 2020 Supplemental Financial Reporting Package | Page 24 | | ||||||
Current Year Acquisitions and Dispositions Summary (Continued). | ||||||||
| As of December 31, 2020 | (unaudited results, data represents consolidated portfolio only) | |||||||
| 2020 Current Period Dispositions | ||||||||||||||||||||||||||||||||||||||||||||
| Disposition Date | Property Address | County | Submarket | Rentable Square Feet | Sale Price ($ in MM) | Rational for Selling | ||||||||||||||||||||||||||||||||||||||
| 8/13/2020 | 3927 Oceanic Drive | San Diego | San Diego - North County | 54,740 | $ | 10.30 | Opportunistic Sale | |||||||||||||||||||||||||||||||||||||
| 9/18/2020 | 121 West 33rd Street | San Diego | San Diego - South County | 76,745 | 13.50 | Opportunistic Sale | ||||||||||||||||||||||||||||||||||||||
| 9/30/2020 | 2700-2722 South Fairview Street | Orange | Orange County - Airport | 116,575 | 20.40 | Tenant Exercised Purchase Option | ||||||||||||||||||||||||||||||||||||||
| 12/31/2020 | 6750 Central Avenue | San Bernadino | Inland Empire East | 8,666 | 1.30 | Opportunistic Sale | ||||||||||||||||||||||||||||||||||||||
| Total Year-to-Date Dispositions: | 256,726 | $ | 45.50 | |||||||||||||||||||||||||||||||||||||||||
(1)These properties were acquired as part of ten-property portfolio acquisition for $207.4 million (including $4.2 million of purchase accounting adjustments), including assumed debt. The acquisition was completed through a combination of cash and an UPREIT transaction, whereby the seller contributed a portion of the portfolio value to the Company's operating partnership in exchange for a blend of OP Units and newly issued convertible preferred operating partnership units ("Series 2 CPOP Units"). The newly issued Series 2 CPOP Units are non-callable by the Company for five years and feature a $45.00 liquidation preference, 4.0% dividend and 0.7722% conversion premium, all of which are more fully described in the Current Report on Form 8-K filed with the SEC on March 6, 2020.
(2)Brady Way is a 1 acre parcel of land adjacent to our property located at 12821 Knott Street.
(3)1055 Sandhill Avenue consists of 158,595 RSF of vacant manufacturing buildings on 5.8 acres of land. The Company intends to demolish the existing structures and construct a new 126,013 RSF single tenant building.
(4)This property was acquired for $45.3 million (including purchase price accounting adjustments), including assumed debt. The acquisition was completed through a combination of cash and an UPREIT transaction, where by the seller contributed the property to the Company's operating partnership in exchange for the issuance of 592,186 OP Units.
(5)These properties were acquired as part of a portfolio acquisition for $84.0 million (including purchase price accounting adjustments). The acquisition was completed through an UPREIT transaction, where by the seller contributed the property to the Company's operating partnership in exchange for the issuance of 1,800,000 OP Units.
| Fourth Quarter 2020 Supplemental Financial Reporting Package | Page 25 | | ||||||
Guidance. | ||||||||
| As of December 31, 2020 | ||||||||
2021 OUTLOOK*
| METRIC | 2020 ACTUAL | 2021 GUIDANCE | ||||||||||||
Net Income Attributable to Common Stockholders per diluted share (1) | $0.51 | $0.40 - $0.43 (2) | ||||||||||||
Company share of Core FFO per diluted share (1) | $1.32 | $1.40 - $1.43 (2) | ||||||||||||
Stabilized Same Property Portfolio NOI Growth - GAAP (3) | 3.7% | 3.0% - 4.0% | ||||||||||||
Stabilized Same Property Portfolio NOI Growth - Cash (3) | 4.5% | 6.0% - 7.0% | ||||||||||||
| Average 2021 Stabilized Same Property Portfolio Occupancy (FY) | 97.8% | 97.0% - 97.5% | ||||||||||||
General and Administrative Expenses (4) | $36.8M | $44.5M - $45.5M | ||||||||||||
| Net Interest Expense | $30.8M | $36.0M - $36.5M | ||||||||||||
(1)Our 2021 Net Income and Core FFO guidance refers to the Company's in-place portfolio as of February 10, 2021, and does not include any assumptions for prospective acquisitions, dispositions or balance sheet activities that have not closed. The Company’s in-place portfolio as of February 10, 2021, reflects the acquisition of three industrial properties representing 176,670 square feet of improvements, a 2.5 acre industrial outdoor storage site, and two redevelopment sites totaling 16.57 acres that occurred subsequent to December 31, 2020.
(2)See page 32 for a reconciliation of the Company’s 2021 guidance range of net income attributable to common stockholders per diluted share, the most directly comparable forward-looking GAAP financial measure, to Company share of Core FFO per diluted share.
(3)Our 2021 Stabilized Same Property Portfolio is a subset of our consolidated portfolio and includes properties that were wholly owned by us for the period from January 1, 2020 through February 10, 2021, and that were stabilized as of January 1, 2020. Our 2021 Stabilized Same Property Portfolio excludes properties that were or will be classified as repositioning (current and future) or lease-up during 2020 and 2021. As of January 1, 2021, our 2021 Stabilized Same Property Portfolio consists of 195 properties aggregating 24,658,872 rentable square feet.
(4)Our 2021 General and Administrative expense guidance includes estimated non-cash equity compensation expense of $17.1 million.
* A number of factors could impact the Company’s ability to deliver results in line with its guidance, including, but not limited to, interest rates, the economy, the supply and demand of industrial real estate, the availability and terms of financing to potential acquirers of real estate, the impact of COVID-19 and actions taken to contain its spread on the Company, the Company’s tenants and the economy, and the timing and yields for divestment and investment. There can be no assurance that the Company can achieve such results.
| Fourth Quarter 2020 Supplemental Financial Reporting Package | Page 26 | | ||||||
Guidance (Continued). | ||||||||
| As of December 31, 2020 | ||||||||
2021 Guidance Rollforward(1)
| Range ($ per share) | ||||||||||||||||||||
| Earnings Components | Low | High | Notes | |||||||||||||||||
| 2020 Core FFO Per Diluted Share | $1.32 | $1.32 | 2020 Core FFO per share growth of 7% | |||||||||||||||||
| Same Property Portfolio NOI Growth - GAAP | 0.05 | 0.07 | Guidance range of 3.0% - 4.0% SP NOI Growth | |||||||||||||||||
| Repositioning/Redevelopment - Incremental NOI Contribution | 0.02 | 0.03 | Incremental NOI contribution from Repositioning/Redevelopment completions | |||||||||||||||||
| 2020 Acquisitions - Incremental NOI Contribution | 0.25 | 0.26 | 2020 Acquisitions projected to contribute incremental NOI of $31M to $32M | |||||||||||||||||
| 2020 Disposition NOI | (0.01) | (0.01) | 2020 Disposition volume of $45.5M | |||||||||||||||||
| 2021 Acquisitions Closed to Date | 0.01 | 0.01 | YTD closed $95M of acquisitions; no prospective activity is assumed for guidance purposes | |||||||||||||||||
Net General & Administrative Expenses (2) | (0.06) | (0.07) | Guidance range of $44.5M to $45.5M | |||||||||||||||||
| Net Interest Expense | (0.05) | (0.05) | Guidance range of $36.0M to $36.5M | |||||||||||||||||
Other (3) | (0.13) | (0.13) | Includes incremental impact from 2020 equity issuance | |||||||||||||||||
| 2021 Core FFO Per Diluted Share Guidance | $1.40 | $1.43 | ||||||||||||||||||
| Core FFO Annual Growth Per Diluted Share (excludes prospective acquisitions) | 6% | 8% | ||||||||||||||||||
(1)2021 Guidance and Guidance Rollforward represent the in-place portfolio as of February 10, 2021, and does not include any assumptions for prospective acquisitions, dispositions or balance sheet activities that have not closed.
(2)2021 General and Administrative expense guidance includes estimated non-cash equity compensation expense of $17.1 million. Non-cash equity compensation includes performance-based units that are tied to the Company's overall performance and may or may not be realized based on actual results. The current G&A guidance range contemplates the impact of performance based compensation based on the company achieving the low or high end of its Core FFO guidance range.
(3)As of December 31, 2020, 131.5 million diluted shares are outstanding compared to the weighted average diluted shares outstanding of 121.2 million in 2020. No additional balance sheet activity is assumed for guidance purposes.
| Fourth Quarter 2020 Supplemental Financial Reporting Package | Page 27 | | ||||||
Net Asset Value Components. | ||||||||
| As of December 31, 2020 | (unaudited and in thousands, except share data) | |||||||
| Net Operating Income | ||||||||
Pro Forma Net Operating Income (NOI)(1) | Three Months Ended Dec 31, 2020 | |||||||
| Total operating rental income | $88,495 | |||||||
| Property operating expenses | (22,034) | |||||||
Pro forma effect of uncommenced leases(2) | 1,208 | |||||||
Pro forma effect of acquisitions(3) | 5,260 | |||||||
Pro forma effect of dispositions(4) | 4 | |||||||
Pro forma NOI effect of significant properties under repositioning or development(5) | 5,456 | |||||||
| Pro Forma NOI | 78,389 | |||||||
| Amortization of net below-market lease intangibles | (2,711) | |||||||
| Straight line rental revenue adjustment | (434) | |||||||
| Pro Forma Cash NOI | $75,244 | |||||||
| Balance Sheet Items | ||||||||
| Other assets and liabilities | December 31, 2020 | |||||||
| Cash and cash equivalents | $176,293 | |||||||
| Restricted cash | 1,230 | |||||||
| Rents and other receivables, net | 10,208 | |||||||
| Other assets | 14,390 | |||||||
| Acquisition related deposits | 4,067 | |||||||
| Accounts payable, accrued expenses and other liabilities | (45,384) | |||||||
| Dividends payable | (29,747) | |||||||
| Tenant security deposits | (31,602) | |||||||
| Prepaid rents | (12,660) | |||||||
| Estimated remaining cost to complete repositioning/redevelopment projects | (147,596) | |||||||
| Total other assets and liabilities | $(60,801) | |||||||
| Debt and Shares Outstanding | ||||||||
Total consolidated debt(6) | $1,223,494 | |||||||
| Preferred stock/units - liquidation preference | $319,068 | |||||||
Common shares outstanding(7) | 131,193,139 | |||||||
Operating partnership units outstanding(8) | 6,606,693 | |||||||
| Total common shares and operating partnership units outstanding | 137,799,832 | |||||||
(1)For a definition and discussion of non-GAAP financial measures, see the notes and definitions section beginning on page 29 of this report.
(2)Represents the estimated incremental base rent from uncommenced new and renewal leases as if they had commenced as of October 1, 2020.
(3)Represents the estimated incremental NOI from Q4'20 acquisitions as if they had been acquired on October 1, 2020. We have made a number of assumptions in such estimates and there can be no assurance that we would have generated the projected levels of NOI had we actually owned the acquired entities as of October 1, 2020.
(4)Represents the deduction of actual Q4'20 NOI for the properties that were sold during the current quarter. See page 25 for a detail of current year disposition properties.
(5)Represents the estimated incremental NOI from the properties that were classified as current or future repositioning/redevelopment or lease-up during the three months ended December 31, 2020, assuming that all repositioning/redevelopment work had been completed and all of the properties were fully stabilized as of October 1, 2020. Includes properties that are separately listed on pages 21-22 and excludes “Other Repositionings.” We have made a number of assumptions in such estimates and there can be no assurance that we would have generated the projected levels of NOI had these properties actually been stabilized as of October 1, 2020.
(6)Excludes unamortized loan discount and debt issuance costs totaling $7.3 million.
(7)Represents outstanding shares of common stock of the Company, which excludes 232,899 shares of unvested restricted stock.
(8)Represents outstanding common units of the Company’s operating partnership, Rexford Industrial Realty, L.P., that are owned by unit holders other than Rexford Industrial Realty, Inc. Includes 588,790 vested LTIP Units and 614,022 vested performance units and excludes 236,646 unvested LTIP Units and 905,732 unvested performance units.
| Fourth Quarter 2020 Supplemental Financial Reporting Package | Page 28 | | ||||||
Notes and Definitions. | ||||||||
Adjusted Funds from Operations (“AFFO”): We calculate adjusted funds from operations, or AFFO, by adding to or subtracting from FFO, as defined below, the following items: (i) certain non-cash operating revenues and expenses, (ii) capitalized operating expenditures such as construction payroll, (iii) recurring capital expenditures required to maintain and re-tenant our properties, (iv) capitalized interest costs resulting from the repositioning/redevelopment of certain of our properties and (v) 2nd generation tenant improvements and leasing commissions. Management uses AFFO as a supplemental performance measure because it provides a performance measure that, when compared year over year, captures trends in portfolio operating results. We also believe that, as a widely recognized measure of the performance of REITs, AFFO will be used by investors as a basis to assess our performance in comparison to other REITs. However, because AFFO may exclude certain non-recurring capital expenditures and leasing costs, the utility of AFFO as a measure of our performance is limited. Additionally, other Equity REITs may not calculate AFFO using the method we do. As a result, our AFFO may not be comparable to such other Equity REITs’ AFFO. AFFO should be considered only as a supplement to net income (as computed in accordance with GAAP) as a measure of our performance.
In-Place Annualized Base Rent and Uncommenced Annualized Base Rent:
•In-Place Annualized Base Rent (“In-Place ABR”): Calculated as the monthly contractual base rent (before rent abatements) per the terms of the lease, as of December 31, 2020, multiplied by 12. Includes leases that have commenced as of December 31, 2020 or leases where tenant has taken early possession of space as of December 31, 2020. Excludes billboard and antenna revenue and tenant reimbursements.
•In-Place ABR per Square Foot: Calculated by dividing In-Place ABR for the lease by the occupied square feet of the lease, as of December 31, 2020.
•Combined In-Place and Uncommenced Annualized Base Rent (“In-Place + Uncommenced ABR”): Calculated by adding (i) In-Place ABR and (ii) ABR Under Uncommenced Leases (see definition below). Does not include adjustments for leases that expired and were not renewed subsequent to December 31, 2020, or adjustments for future known non-renewals.
•ABR Under Uncommenced Leases: Calculated by adding the following:
(i) ABR under Uncommenced New Leases = first full month of contractual base rents (before rent abatements) to be received under Uncommenced New Leases, multiplied by 12.
(ii) Incremental ABR under Uncommenced Renewal Leases = difference between: (a) the first full month of contractual base rents (before rent abatements) to be received under Uncommenced Renewal Leases and (b) the monthly In-Place ABR for the same space as of December 31, 2020, multiplied by 12.
•In-Place + Uncommenced ABR per Square Foot: Calculated by dividing (i) In-Place + Uncommenced ABR for the leases by (ii) the square footage under commenced and uncommenced leases (net of renewal space) as of December 31, 2020.
•Uncommenced New Leases: Reflects new leases (for vacant space) that have been signed but have not yet commenced as of December 31, 2020.
•Uncommenced Renewal Leases: Reflects renewal leases (for space occupied by renewing tenant) that have been signed but have not yet commenced as of December 31, 2020.
Capital Expenditures, Non-recurring: Expenditures made with respect to a property for repositioning, redevelopment, major property or unit upgrade or renovation, and further includes capital expenditures for seismic upgrades, roof or parking lot replacements and capital expenditures for deferred maintenance existing at the time such property was acquired.
Capital Expenditures, Recurring: Expenditures made with respect to a property for maintenance of such property and replacement of items due to ordinary wear and tear including, but not limited to, expenditures made for maintenance of parking lot, roofing materials, mechanical systems, HVAC systems and other structural systems. Recurring capital expenditures shall not include any of the following: (a) major upgrade or renovation of such property not necessary for proper maintenance or marketability of such property; (b) capital expenditures for seismic upgrades; (c) capital expenditures for deferred maintenance for such property existing at the time such property was acquired; or (d) replacements of either roof or parking lots.
Capital Expenditures, First Generation: Capital expenditures for newly acquired space, newly developed or redeveloped space, or change in use.
Cash NOI: Cash basis NOI is a non-GAAP measure, which we calculate by adding or subtracting from NOI (i) fair value lease revenue and (ii) straight-line rent adjustment. We use Cash NOI, together with NOI, as a supplemental performance measure. Cash NOI should not be used as a measure of our liquidity, nor is it indicative of funds available to fund our cash needs. Cash NOI should not be used as a substitute for cash flow from operating activities computed in accordance with GAAP. We use Cash NOI to help evaluate the performance of the Company as a whole, as well as the performance of our Stabilized Same Property Portfolio.
Core Funds from Operations (“Core FFO”): We calculate Core FFO by adjusting FFO, as defined below, to exclude the impact of certain items that we do not consider reflective of our core revenue or expense streams. Core FFO adjustments consist of (i) acquisition expenses, (ii) loss on extinguishment of debt, (iii) the amortization of the loss on termination of interest rate swap and (iv) other amounts as they may occur. Management believes that Core FFO is a useful supplemental measure as it provides a more meaningful and consistent comparison of operating performance and allows investors to more easily compare the Company's operating results. Because these adjustments have a real economic impact on our financial condition and results from operations, the utility of Core FFO as a measure of our performance is limited. Other REITs may not calculate Core FFO in a consistent manner. Accordingly, our Core FFO may not be comparable to other REITs' core FFO. Core FFO should be considered only as a supplement to net income computed in accordance with GAAP as a measure of our performance.
| Fourth Quarter 2020 Supplemental Financial Reporting Package | Page 29 | | ||||||
Notes and Definitions. | ||||||||
Debt Covenants ($ in thousands)
| December 31, 2020 | |||||||||||||||||
| Current Period Covenant | Credit Facility, $225M Term Loan and $150M Term Loan | Senior Notes ($100M, $125M, $25M, $75M) | |||||||||||||||
| Maximum Leverage Ratio | less than 60% | 22.9% | 24.2% | ||||||||||||||
| Maximum Secured Leverage Ratio | less than 45% | 2.3% | N/A | ||||||||||||||
| Maximum Secured Leverage Ratio | less than 40% | N/A | 2.4% | ||||||||||||||
| Maximum Secured Recourse Debt | less than 15% | N/A | —% | ||||||||||||||
| Minimum Tangible Net Worth | $2,792,944 | $3,875,943 | N/A | ||||||||||||||
| Minimum Tangible Net Worth | $2,704,354 | N/A | $3,875,943 | ||||||||||||||
| Minimum Fixed Charge Coverage Ratio | at least 1.50 to 1.00 | 4.5 to 1.00 | 4.5 to 1.00 | ||||||||||||||
| Unencumbered Leverage Ratio | less than 60% | 23.3% | 24.8% | ||||||||||||||
| Unencumbered Interest Coverage Ratio | at least 1.75 to 1.00 | 7.91 to 1.00 | 7.91 to 1.00 | ||||||||||||||
| December 31, 2020 | |||||||||||
| Current Period Covenant | $400M 2.125% Senior Notes | ||||||||||
| Maximum Debt to Total Asset Ratio | less than 60% | 22.5% | |||||||||
| Maximum Secured Debt to Total Asset Ratio | less than 40% | 2.3% | |||||||||
| Minimum Debt Service Coverage Ratio | at least 1.50 to 1.00 | 4.3 to 1.00 | |||||||||
| Minimum Unencumbered Assets to Unsecured Debt Ratio | at least 1.50 to 1.00 | 4.5 to 1.00 | |||||||||
Our actual performance for each covenant is calculated based on the definitions set forth in each loan agreement/indenture.
EBITDAre and Adjusted EBITDA: We calculate EBITDAre in accordance with the standards established by the National Association of Real Estate Investment Trusts (“NAREIT”). EBITDAre is calculated as net income (loss) (computed in accordance with GAAP), before interest expense, tax expense, depreciation and amortization, gains (or losses) from sales of depreciable operating property, impairment losses and adjustments to reflect our proportionate share of EBITDAre from our unconsolidated joint venture. We calculate Adjusted EBITDA by adding or subtracting from EBITDAre the following items: (i) non-cash stock based compensation expense, (ii) gain (loss) on extinguishment of debt, (iii) acquisition expenses and (iv) the pro-forma effects of acquisitions and dispositions. We believe that EBITDAre and Adjusted EBITDA are helpful to investors as a supplemental measure of our operating performance as a real estate company because it is a direct measure of the actual operating results of our industrial properties. We also use these measures in ratios to compare our performance to that of our industry peers. In addition, we believe EBITDAre and Adjusted EBITDA are frequently used by securities analysts, investors and other interested parties in the evaluation of Equity REITs. However, because EBITDAre and Adjusted EBITDA are calculated before recurring cash charges including interest expense and income taxes, and are not adjusted for capital expenditures or other recurring cash requirements of our business, their utility as a measure of our liquidity is limited. Accordingly, EBITDAre and Adjusted EBITDA should not be considered alternatives to cash flow from operating activities (as computed in accordance with GAAP) as a measure of our liquidity. EBITDAre and Adjusted EBITDA should not be considered as alternatives to
net income or loss as an indicator of our operating performance. Other Equity REITs may calculate EBITDAre and Adjusted EBITDA differently than we do; accordingly, our EBITDAre and Adjusted EBITDA may not be comparable to such other Equity REITs’ EBITDAre and Adjusted EBITDA. EBITDAre and Adjusted EBITDA should be considered only as supplements to net income (as computed in accordance with GAAP) as a measure of our performance.
Fixed Charge Coverage Ratio:
For the Three Months Ended | |||||||||||||||||||||||||||||
| Dec 31, 2020 | Sep 30, 2020 | Jun 30, 2020 | Mar 31, 2020 | Dec 31, 2019 | |||||||||||||||||||||||||
EBITDAre | $ | 57,434 | $ | 53,638 | $ | 52,080 | $ | 50,244 | $ | 48,031 | |||||||||||||||||||
Amortization of above/below market lease intangibles | (2,711) | (2,751) | (2,669) | (2,402) | (2,191) | ||||||||||||||||||||||||
Non-cash stock compensation | 2,491 | 3,101 | 3,709 | 3,570 | 2,800 | ||||||||||||||||||||||||
| Loss on extinguishment of debt | 104 | — | — | — | — | ||||||||||||||||||||||||
Straight line rental revenue adj. | (434) | (3,088) | (6,212) | (1,672) | (2,200) | ||||||||||||||||||||||||
Capitalized payments | (1,331) | (1,279) | (1,294) | (1,185) | (984) | ||||||||||||||||||||||||
Recurring capital expenditures | (2,671) | (1,380) | (1,323) | (1,575) | (1,383) | ||||||||||||||||||||||||
2nd gen. tenant improvements & leasing commissions | (1,741) | (2,243) | (2,000) | (1,727) | (1,754) | ||||||||||||||||||||||||
| Cash flow for fixed charge coverage calculation | 51,141 | 45,998 | 42,291 | 45,253 | 42,319 | ||||||||||||||||||||||||
| Cash interest expense calculation detail: | |||||||||||||||||||||||||||||
| Interest expense | 8,673 | 7,299 | 7,428 | 7,449 | 7,364 | ||||||||||||||||||||||||
| Capitalized interest | 818 | 1,163 | 1,061 | 882 | 867 | ||||||||||||||||||||||||
| Note payable premium amort. | 47 | 66 | 59 | 16 | (2) | ||||||||||||||||||||||||
| Amort. of deferred financing costs | (408) | (373) | (381) | (343) | (347) | ||||||||||||||||||||||||
| Amort. of swap termination fee | (218) | — | — | — | — | ||||||||||||||||||||||||
| Cash interest expense | 8,912 | 8,155 | 8,167 | 8,004 | 7,882 | ||||||||||||||||||||||||
| Scheduled principal payments | 241 | 205 | 175 | 50 | 40 | ||||||||||||||||||||||||
| Preferred stock/unit dividends | 4,344 | 4,344 | 4,344 | 4,059 | 3,936 | ||||||||||||||||||||||||
| Fixed charges | $ | 13,497 | $ | 12,704 | $ | 12,686 | $ | 12,113 | $ | 11,858 | |||||||||||||||||||
| Fixed Charge Coverage Ratio | 3.8 | x | 3.6 | x | 3.3 | x | 3.7 | x | 3.6 | x | |||||||||||||||||||
Funds from Operations (“FFO”): We calculate FFO in accordance with the standards established by NAREIT. FFO represents net income (loss) (computed in accordance with GAAP), excluding gains (or losses) on sale of real estate assets, gains (or losses) on sale of assets incidental to our business, impairment losses of depreciable operating property or assets incidental to our business, real estate related depreciation and amortization (excluding amortization of deferred financing costs) and after adjustments for unconsolidated joint ventures. Management uses FFO as a supplemental performance measure because, in excluding real estate related depreciation and amortization, gains and losses from property dispositions or assets incidental to our business, other than temporary impairments of unconsolidated real estate entities, and impairment on our investment in real estate and other assets incidental to our business, it provides a performance measure that, when compared
| Fourth Quarter 2020 Supplemental Financial Reporting Package | Page 30 | | ||||||
Notes and Definitions. | ||||||||
year over year, captures trends in occupancy rates, rental rates and operating costs. We also believe that, as a widely recognized measure of performance used by other REITs, FFO may be used by investors as a basis to compare our operating performance with that of other REITs. However, because FFO excludes depreciation and amortization and captures neither the changes in the value of our properties that result from use or market conditions nor the level of capital expenditures and leasing commissions necessary to maintain the operating performance of our properties, all of which have real economic effects and could materially impact our results from operations, the utility of FFO as a measure of our performance is limited. Other equity REITs may not calculate or interpret FFO in accordance with the NAREIT definition as we do, and, accordingly, our FFO may not be comparable to such other REITs’ FFO. FFO should not be used as a measure of our liquidity, and is not indicative of funds available for our cash needs, including our ability to pay dividends. FFO should be considered only as a supplement to net income computed in accordance with GAAP as a measure of our performance.
Net Operating Income (“NOI”): NOI is a non-GAAP measure which includes the revenue and expense directly attributable to our real estate properties. NOI is calculated as total revenue from real estate operations including i) rental income, ii) tenant reimbursements, and iii) other income less property expenses. We use NOI as a supplemental performance measure because, in excluding real estate depreciation and amortization expense, general and administrative expenses, interest expense, gains (or losses) on sale of real estate and other non-operating items, it provides a performance measure that, when compared year over year, captures trends in occupancy rates, rental rates and operating costs. We also believe that NOI will be useful to investors as a basis to compare our operating performance with that of other REITs. However, because NOI excludes depreciation and amortization expense and captures neither the changes in the value of our properties that result from use or market conditions, nor the level of capital expenditures and leasing commissions necessary to maintain the operating performance of our properties (all of which have real economic effect and could materially impact our results from operations), the utility of NOI as a measure of our performance is limited. Other equity REITs may not calculate NOI in a similar manner and, accordingly, our NOI may not be comparable to such other REITs’ NOI. Accordingly, NOI should be considered only as a supplement to net income as a measure of our performance. NOI should not be used as a measure of our liquidity, nor is it indicative of funds available to fund our cash needs. NOI should not be used as a substitute for cash flow from operating activities in accordance with GAAP. We use NOI to help evaluate the performance of the Company as a whole, as well as the performance of our Stabilized Same Property Portfolio.
Proforma NOI: Proforma NOI is calculated by adding to NOI the following adjustments: (i) the estimated impact on NOI of uncommenced leases as if they had commenced at the beginning of the reportable period, (ii) the estimated impact on NOI of current period acquisitions as if they had been acquired at the beginning of the reportable period, (iii) the actual NOI of properties sold during the current period and (iv) the estimated incremental NOI from properties that were classified as repositioning/lease-up properties as of the end of the reporting period, assuming that all repositioning work had been completed and the properties/space were fully stabilized as of the beginning of the reportable period. These estimates do not purport to be indicative of what operating results would have been had the transactions actually occurred at the beginning of the reportable period and may not be indicative of future operating results.
Definitions Related to Properties and Space Under Repositioning/Redevelopment:
•Properties and Space Under Repositioning: Typically defined as properties or units where a significant amount of space is held vacant in order to implement capital improvements that improve the functionality (not including basic refurbishments, i.e., paint and carpet), cash flow and value of that space. A repositioning is considered complete once the investment is fully or nearly fully deployed and the property is marketable for leasing.
•Properties Under Redevelopment: Typically defined as a properties where we plan to fully or partially demolish an existing building(s) due to building obsolescence and/or a properties with excess land where we plan to construct a ground-up building.
•Estimated Construction Period: During 4Q-2020 we changed our definition of the “Start of the Estimated Construction Period” to the period we start physical construction on a property. Previously we defined the “Start” as the period we start activities to get a property ready for its intended use, which includes pre-construction activities, including securing entitlements or permits, design, site work, and other necessary activities preceding construction. The Target Completion of the Estimated Construction Period is our current estimate of the period in which we will have substantially completed a project and the project is made available for occupancy. We expect to update our timing estimates on a quarterly basis.
•Purchase Price: Represents the contractual purchase price of the property plus closing costs.
•Projected Repositioning/Redevelopment Costs: Represents the estimated costs to be incurred to complete construction and lease-up each repositioning/redevelopment project. Estimated costs include (i) nonrecurring capital expenditures, (ii) estimated tenant improvement allowances/costs and (iii) estimated leasing commissions. We expect to update our estimates upon completion of the project, or sooner if there are any significant changes to expected costs from quarter to quarter.
•Projected Total Investment: Includes the sum of the Purchase Price and Projected Repositioning/Redevelopment Costs.
•Cumulative Investment to Date: Includes the Purchase Price and nonrecurring capital expenditures, tenant improvement costs and leasing commission costs incurred as of the reporting date.
•Estimated Annual Stabilized Cash NOI: Represents management’s estimate of each project’s annual Cash NOI once the property has reached stabilization and initial rental concessions, if any, have elapsed. Actual results may vary materially from our estimates.
•Actual Quarterly NOI: Represents the actual cash NOI (a non-GAAP measure defined on page 29) for the repositioning/redevelopment property for the entire reported quarter or from the date of acquisition if such property was acquired during the current reported quarter.
•Estimated Stabilized Yield: Calculated by dividing each project’s Estimated Annual Stabilized Cash NOI by its Projected Total Investment.
•Stabilization Date - Properties and Space Under Repositioning/Redevelopment: We consider a repositioning/redevelopment property to be stabilized at the earlier of the following: (i) upon reaching 90% occupancy or (ii) one year from the date of completion of repositioning/redevelopment construction work.
| Fourth Quarter 2020 Supplemental Financial Reporting Package | Page 31 | | ||||||
Notes and Definitions. | ||||||||
Rental Income: See below for a breakdown of consolidated rental income for the last five trailing quarters. We believe this information is frequently used by management, investors, securities analysts and other interested parties to evaluate the our performance.
| Three Months Ended | |||||||||||||||||||||||||||||
| Dec 31, 2020 | Sep 30, 2020 | Jun 30, 2020 | Mar 31, 2020 | Dec 31, 2019 | |||||||||||||||||||||||||
| Rental revenue | $ | 73,876 | $ | 70,153 | $ | 67,349 | $ | 65,255 | $ | 62,137 | |||||||||||||||||||
| Tenant reimbursements | 14,468 | 13,247 | 12,433 | 11,993 | 11,381 | ||||||||||||||||||||||||
| Other income | 151 | 222 | (12) | 242 | 497 | ||||||||||||||||||||||||
| Rental income | $ | 88,495 | $ | 83,622 | $ | 79,770 | $ | 77,490 | $ | 74,015 | |||||||||||||||||||
Rent Change - Cash: Compares the first month cash rent excluding any abatement on new/renewal leases to the last month rent for the most recent expiring lease. Data included for comparable leases only. Comparable leases generally exclude: (i) space that has never been occupied under our ownership, (ii) repositioned/redeveloped space, (iii) space that has been vacant for over one year or (iv) lease terms shorter than six months.
Rent Change - GAAP: Compares GAAP rent, which straightlines rental rate increases and abatements, on new/renewal leases to GAAP rent for the most recent expiring lease. Data included for comparable leases only. Comparable leases generally exclude: (i) space that has never been occupied under our ownership, (ii) repositioned/redeveloped space, (iii) space that has been vacant for over one year or (iv) lease terms shorter than six months.
Stabilized Same Property Portfolio (“SSPP”): Our 2020 SSPP is a subset of our consolidated portfolio and includes properties that were wholly owned by us for the period from January 1, 2019 through December 31, 2020, and excludes any properties that were acquired or sold during the period from January 1, 2019 through December 31, 2020, and properties acquired prior to January 1, 2019, that were classified as current or future repositioning, redevelopment or lease-up during 2019 and 2020, which we believe significantly affected the properties’ results during the comparative periods.
Stabilized Same Property Portfolio Rental Income: See below for a breakdown of 2020 & 2019 rental income for our SSPP. We believe this information is frequently used by management, investors, securities analysts and other interested parties to evaluate the our performance.
| Three Months Ended December 31, | Year Ended December 31, | ||||||||||||||||||||||||||||||||||||||||||||||
| 2020 | 2019 | $ Change | % Change | 2020 | 2019 | $ Change | % Change | ||||||||||||||||||||||||||||||||||||||||
| Rental revenue | $ | 49,776 | $ | 48,368 | $ | 1,408 | 2.9% | $ | 197,351 | $ | 189,108 | $ | 8,243 | 4.4% | |||||||||||||||||||||||||||||||||
| Tenant reimb. | 8,843 | 8,394 | 449 | 5.3% | 34,590 | 33,616 | 974 | 2.9% | |||||||||||||||||||||||||||||||||||||||
| Other income | 144 | 423 | (279) | (66.0)% | 536 | 1,261 | (725) | (57.5)% | |||||||||||||||||||||||||||||||||||||||
| Rental income | $ | 58,763 | $ | 57,185 | $ | 1,578 | 2.8% | $ | 232,477 | $ | 223,985 | $ | 8,492 | 3.8% | |||||||||||||||||||||||||||||||||
Reconciliation of Net Income Attributable to Common Stockholders per Diluted Share Guidance to Company share of Core FFO per Diluted Share Guidance:
| 2021 Estimate | |||||||||||
| Low | High | ||||||||||
| Net income attributable to common stockholders | $ | 0.40 | $ | 0.43 | |||||||
| Company share of depreciation and amortization | $ | 1.00 | $ | 1.00 | |||||||
| Company share of Core FFO | $ | 1.40 | $ | 1.43 | |||||||
Reconciliation of Net Income to NOI and Cash NOI (in thousands):
| Three Months Ended | |||||||||||||||||||||||||||||
| Dec 31, 2020 | Sep 30, 2020 | Jun 30, 2020 | Mar 31, 2020 | Dec 31, 2019 | |||||||||||||||||||||||||
| Net Income | $ | 18,155 | $ | 31,197 | $ | 16,271 | $ | 15,272 | $ | 24,382 | |||||||||||||||||||
| Add: | |||||||||||||||||||||||||||||
| General and administrative | 9,042 | 9,464 | 8,972 | 9,317 | 8,215 | ||||||||||||||||||||||||
| Depreciation & amortization | 30,554 | 28,811 | 28,381 | 27,523 | 26,877 | ||||||||||||||||||||||||
| Acquisition expenses | 35 | 70 | 14 | 5 | (3) | ||||||||||||||||||||||||
| Interest expense | 8,673 | 7,299 | 7,428 | 7,449 | 7,364 | ||||||||||||||||||||||||
| Loss on extinguishment of debt | 104 | 0 | 0 | 0 | 0 | ||||||||||||||||||||||||
| Subtract: | |||||||||||||||||||||||||||||
| Mgmt, leasing, & dvlpmt services | 95 | 118 | 114 | 93 | 105 | ||||||||||||||||||||||||
| Interest income | 59 | 116 | 66 | 97 | 279 | ||||||||||||||||||||||||
| (Loss) gain on sale of real estate | (52) | 13,669 | — | — | 10,592 | ||||||||||||||||||||||||
| NOI | $ | 66,461 | $ | 62,938 | $ | 60,886 | $ | 59,376 | $ | 55,859 | |||||||||||||||||||
| S/L rental revenue adj. | (434) | (3,088) | (6,212) | (1,672) | (2,200) | ||||||||||||||||||||||||
| Amort. of above/below market lease intangibles | (2,711) | (2,751) | (2,669) | (2,402) | (2,191) | ||||||||||||||||||||||||
| Cash NOI | $ | 63,316 | $ | 57,099 | $ | 52,005 | $ | 55,302 | $ | 51,468 | |||||||||||||||||||
| Fourth Quarter 2020 Supplemental Financial Reporting Package | Page 32 | | ||||||
Notes and Definitions. | ||||||||
Reconciliation of Net Income to Total Portfolio NOI, Stabilized Same Property Portfolio NOI and Stabilized Same Property Portfolio Cash NOI:
| Three Months Ended December 31, | Year Ended December 31, | ||||||||||||||||||||||
| 2020 | 2019 | 2020 | 2019 | ||||||||||||||||||||
| Net income | $ | 18,155 | $ | 24,382 | $ | 80,895 | $ | 64,001 | |||||||||||||||
| Add: | |||||||||||||||||||||||
| General and administrative | 9,042 | 8,215 | 36,795 | 30,300 | |||||||||||||||||||
| Depreciation and amortization | 30,554 | 26,877 | 115,269 | 98,891 | |||||||||||||||||||
| Acquisition expenses | 35 | (3) | 124 | 171 | |||||||||||||||||||
| Interest expense | 8,673 | 7,364 | 30,849 | 26,875 | |||||||||||||||||||
| Loss on extinguishment of debt | 104 | — | 104 | — | |||||||||||||||||||
| Deduct: | |||||||||||||||||||||||
| Management, leasing and development services | 95 | 105 | 420 | 406 | |||||||||||||||||||
| Interest income | 59 | 279 | 338 | 2,555 | |||||||||||||||||||
| (Loss) gain on sale of real estate | (52) | 10,592 | 13,617 | 16,297 | |||||||||||||||||||
| NOI | $ | 66,461 | $ | 55,859 | $ | 249,661 | $ | 200,980 | |||||||||||||||
| Non-Stabilized Same Prop. Portfolio rental income | (29,732) | (16,830) | (96,900) | (40,267) | |||||||||||||||||||
| Non-Stabilized Same Prop. Portfolio property exp. | 7,802 | 4,399 | 25,282 | 11,044 | |||||||||||||||||||
| Stabilized Same Property Portfolio NOI | $ | 44,531 | $ | 43,428 | $ | 178,043 | $ | 171,757 | |||||||||||||||
| Straight line rental revenue adjustment | 530 | (885) | (4,629) | (4,268) | |||||||||||||||||||
| Amort. of above/below market lease intangibles | (1,148) | (1,537) | (5,411) | (6,790) | |||||||||||||||||||
| Stabilized Same Property Portfolio Cash NOI | $ | 43,913 | $ | 41,006 | $ | 168,003 | $ | 160,699 | |||||||||||||||
| Fourth Quarter 2020 Supplemental Financial Reporting Package | Page 33 | | ||||||