Attached files
| file | filename |
|---|---|
| EX-99.1 - EX-99.1 - INTERPUBLIC GROUP OF COMPANIES, INC. | ipgq42020earningsreleaseex.htm |
| 8-K - 8-K - INTERPUBLIC GROUP OF COMPANIES, INC. | ipg-20210210.htm |

Interpublic Group February 10, 2021 FOURTH QUARTER & FULL YEAR 2020 EARNINGS CONFERENCE CALL

2Interpublic Group of Companies, Inc. • Fourth Quarter 2020 net revenue change was -6.1% and organic change was -5.4% ◦ U.S. organic change of net revenue was -1.8% ◦ International organic change of net revenue was -10.5% • Fourth Quarter net income as reported was $112.3 million and adjusted EBITA before restructuring charges was $498.8 million with margin of 21.8% • Fourth Quarter diluted EPS was $0.28, and adjusted diluted EPS was $0.86 • FY-20 net revenue change was -6.5% and organic change was -4.8% • FY-20 cash flow from operations was $1.85 billion • FY-20 restructuring program charges of $413.8 million targeted to reduce annualized expenses by approximately $160 million • Increased quarterly common share dividend 6% to $0.27 Overview — Fourth Quarter & Full Year 2020 "Organic growth" refers exclusively to the organic change of net revenue. Adjusted EBITA before restructuring charges is calculated as net income available to IPG common stockholders before provision for income taxes, total (expenses) and other income, equity in net income of unconsolidated affiliates, net income attributable to noncontrolling interests, amortization of acquired intangibles and restructuring charges. Adjusted diluted EPS is adjusted for amortization of acquired intangibles, restructuring charges and net losses on sales of businesses. See reconciliation of organic net revenue change on pages 20-21 and non-GAAP reconciliation of adjusted results on pages 22-26.

3Interpublic Group of Companies, Inc. Three Months Ended December 31, 2020 2019 Net Revenue $ 2,284.4 $ 2,433.0 Billable Expenses 265.6 468.8 Total Revenue 2,550.0 2,901.8 Salaries and Related Expenses 1,346.2 1,432.1 Office and Other Direct Expenses 364.8 419.7 Billable Expenses 265.6 468.8 Cost of Services 1,976.6 2,320.6 Selling, General and Administrative Expenses 22.4 24.5 Depreciation and Amortization 73.7 65.4 Restructuring Charges 253.9 — Total Operating Expense 2,326.6 2,410.5 Operating Income 223.4 491.3 Interest Expense, net (40.0) (38.7) Other Expense, net (9.8) (24.8) Income Before Income Taxes 173.6 427.8 Provision for Income Taxes 58.1 86.1 Equity in Net Income of Unconsolidated Affiliates 1.5 0.5 Net Income 117.0 342.2 Net Income Attributable to Noncontrolling Interests (4.7) (13.3) Net Income Available to IPG Common Stockholders $ 112.3 $ 328.9 Earnings per Share Available to IPG Common Stockholders - Basic $ 0.29 $ 0.85 Earnings per Share Available to IPG Common Stockholders - Diluted $ 0.28 $ 0.84 Weighted-Average Number of Common Shares Outstanding - Basic 390.5 386.9 Weighted-Average Number of Common Shares Outstanding - Diluted 396.1 393.3 Dividends Declared per Common Share $ 0.255 $ 0.235 ($ in Millions, except per share amounts) Operating Performance

4Interpublic Group of Companies, Inc. Three Months Ended Twelve Months Ended $ % Change $ % Change December 31, 2019 $ 2,433.0 $ 8,625.1 Foreign currency 3.2 0.1% (68.5) (0.8%) Net acquisitions/(divestitures) (20.3) (0.8%) (79.1) (0.9%) Organic (131.5) (5.4%) (413.0) (4.8%) Total change (148.6) (6.1%) (560.6) (6.5%) December 31, 2020 $ 2,284.4 $ 8,064.5 Three Months Ended December 31, Twelve Months Ended December 31, Change Change 2020 2019 (1) Organic Total 2020 2019 (1) Organic Total IAN $ 1,985.7 $ 2,082.4 (3.8%) (4.6%) $ 6,921.4 $ 7,328.8 (3.6%) (5.6%) DXTRA $ 298.7 $ 350.6 (15.1%) (14.8%) $ 1,143.1 $ 1,296.3 (11.2%) (11.8%) (1) Results for the three months and twelve months ended December 31, 2019 have been recast to conform to the current-period presentation. See reconciliation of segment organic net revenue change on pages 20-21. ($ in Millions) Net Revenue

5Interpublic Group of Companies, Inc. Organic Net Revenue Change by Region “All Other Markets” includes Canada, Africa and the Middle East. Circle proportions represent consolidated net revenue distribution. See reconciliation of organic net revenue change, including total net revenue change, on page 20. Three Months Ended December 31, 2020 -1.8% United States -9.7% United Kingdom -7.3% Continental Europe 2.3% Latin America -17.4% Asia Pacific -10.5% International -5.4% Worldwide -14.0% All Other Markets +

6Interpublic Group of Companies, Inc. Depreciation & Amortization 2.3% 1.8% 2020 2019 Operating Expenses % of Net Revenue (1) Excludes billable expenses (2) Excludes amortization of acquired intangibles. Salaries & Related 58.9% 58.9% 2020 2019 Office & Other Direct 16.0% 17.3% 2020 2019 Selling, General & Administrative 1.0% 1.0% 2020 2019 Amortization of Acquired Intangibles 0.9% 0.9% 2020 2019 Restructuring Charges 11.1% —% 2020 2019 Three Months Ended December 31 (2) (1)
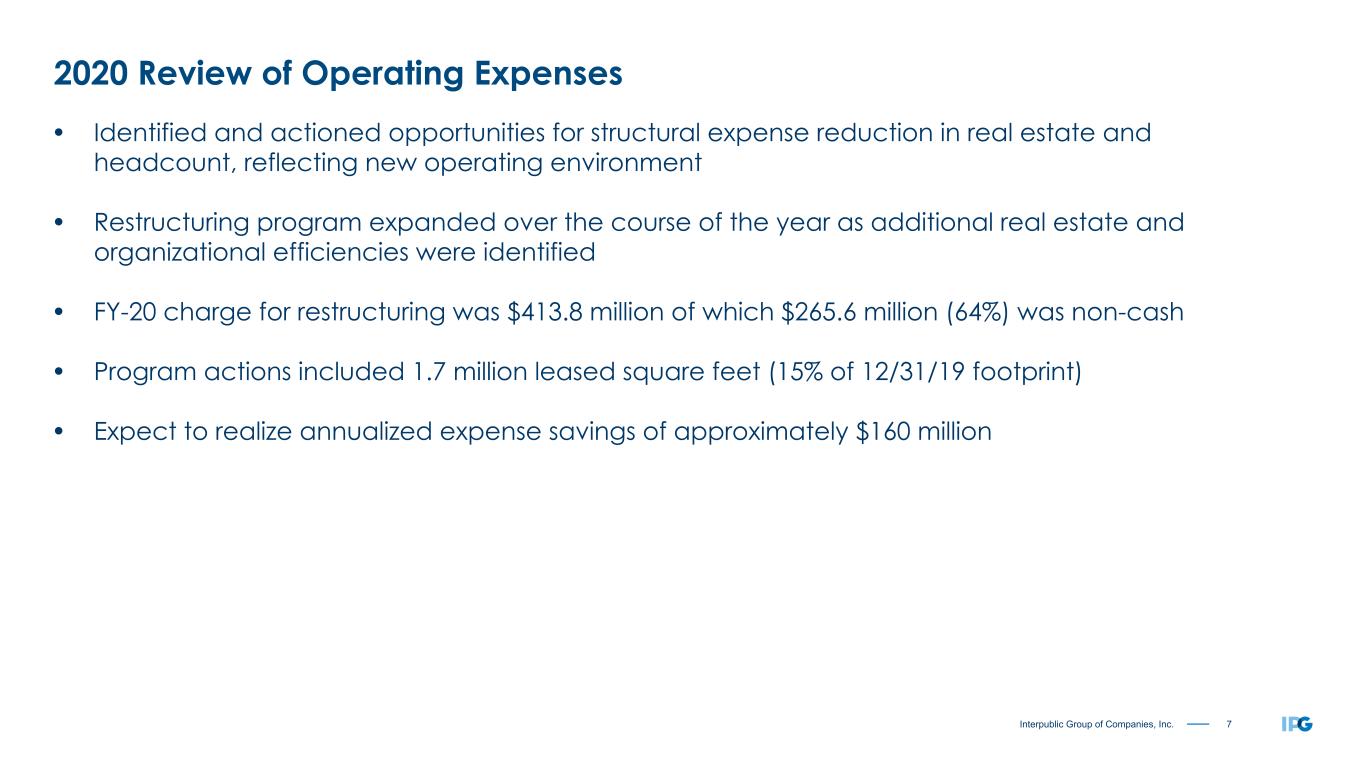
7Interpublic Group of Companies, Inc. • Identified and actioned opportunities for structural expense reduction in real estate and headcount, reflecting new operating environment • Restructuring program expanded over the course of the year as additional real estate and organizational efficiencies were identified • FY-20 charge for restructuring was $413.8 million of which $265.6 million (64%) was non-cash • Program actions included 1.7 million leased square feet (15% of 12/31/19 footprint) • Expect to realize annualized expense savings of approximately $160 million 2020 Review of Operating Expenses

8Interpublic Group of Companies, Inc. Three Months Ended December 31, 2020 As Reported Amortization of Acquired Intangibles Restructuring Charges Net Losses on Sales of Businesses Adjusted Results (Non-GAAP) Operating Income and Adjusted EBITA before Restructuring Charges (1) $ 223.4 $ (21.5) $ (253.9) $ 498.8 Total (Expenses) and Other Income (2) (49.8) $ (15.2) (34.6) Income Before Income Taxes 173.6 (21.5) (253.9) (15.2) 464.2 Provision for Income Taxes 58.1 4.2 56.9 2.0 121.2 Effective Tax Rate 33.5 % 26.1 % Equity in Net Income of Unconsolidated Affiliates 1.5 1.5 Net Income Attributable to Noncontrolling Interests (4.7) (4.7) DILUTED EPS COMPONENTS: Net Income Available to IPG Common Stockholders $ 112.3 $ (17.3) $ (197.0) $ (13.2) $ 339.8 Weighted-Average Number of Common Shares Outstanding 396.1 396.1 Earnings per Share Available to IPG Common Stockholders (3) $ 0.28 $ (0.04) $ (0.50) $ (0.03) $ 0.86 ($ in Millions, except per share amounts) (1) Refer to non-GAAP reconciliation of Adjusted EBITA before Restructuring Charges on slide 24. (2) Consists of non-operating expenses including interest expense, net and other expense, net. (3) Earnings per share may not add due to rounding. See full non-GAAP reconciliation of adjusted diluted earnings per share on page 22. Adjusted Diluted Earnings Per Share

9Interpublic Group of Companies, Inc. Twelve Months Ended December 31, 2020 As Reported Amortization of Acquired Intangibles Restructuring Charges Net Losses on Sales of Businesses Net Impact of Various Discrete Tax Items (1) Adjusted Results (Non-GAAP) Operating Income and Adjusted EBITA before Restructuring Charges (2) $ 588.4 $ (85.9) $ (413.8) $ 1,088.1 Total (Expenses) and Other Income (3) (227.1) $ (67.0) (160.1) Income Before Income Taxes 361.3 (85.9) (413.8) (67.0) 928.0 Provision for Income Taxes 8.0 16.9 93.1 5.0 $ 122.6 245.6 Effective Tax Rate 2.2 % 26.5 % Equity in Net Income of Unconsolidated Affiliates 0.9 0.9 Net Income Attributable to Noncontrolling Interests (3.1) (3.1) DILUTED EPS COMPONENTS: Net Income Available to IPG Common Stockholders $ 351.1 $ (69.0) $ (320.7) $ (62.0) $ 122.6 $ 680.2 Weighted-Average Number of Common Shares Outstanding 393.2 393.2 Earnings per Share Available to IPG Common Stockholders (4) $ 0.89 $ (0.18) $ (0.82) $ (0.16) $ 0.31 $ 1.73 ($ in Millions, except per share amounts) (1) Includes a tax benefit of $136.2 related to the finalization and settlement of the U.S. Federal income tax audit of the years 2006 through 2016, partially offset by $13.6 of tax expense related to the estimated costs associated with our change in our APB 23 assertion for certain foreign subsidiaries. (2) Refer to non-GAAP reconciliation of Adjusted EBITA before Restructuring Charges on slide 24. (3) Consists of non-operating expenses including interest expense, net and other expense, net. (4) Earnings per share may not add due to rounding. See full non-GAAP reconciliation of adjusted diluted earnings per share on page 23. Adjusted Diluted Earnings Per Share

10Interpublic Group of Companies, Inc. Twelve Months Ended December 31, 2020 2019 Net Income $ 354.2 $ 673.9 OPERATING ACTIVITIES: Depreciation & amortization 369.0 368.0 Non-cash restructuring charges (1) 265.6 11.7 Other non-cash items 79.5 16.9 Net losses on sales of businesses 67.0 43.4 Deferred taxes (46.4) 9.7 Change in working capital, net 900.1 442.8 Change in other non-current assets & liabilities (141.8) (37.2) Net cash provided by Operating Activities 1,847.2 1,529.2 INVESTING ACTIVITIES: Capital expenditures (167.5) (198.5) Acquisitions, net of cash acquired (4.9) (0.6) Other investing activities (43.8) 37.4 Net cash used in Investing Activities (216.2) (161.7) FINANCING ACTIVITIES: Repayment of long-term debt (503.7) (403.3) Common stock dividends (398.1) (363.1) Acquisition-related payments (46.6) (15.8) Tax payments for employee shares withheld (22.3) (22.4) Distributions to noncontrolling interests (19.5) (21.6) Proceeds from long-term debt 646.2 — Exercise of stock options 6.5 4.3 Net increase (decrease) in short-term borrowings 1.5 (19.8) Other financing activities (10.2) (1.3) Net cash used in Financing Activities (346.2) (843.0) Currency effect 31.0 (6.0) Net increase in cash, cash equivalents and restricted cash $ 1,315.8 $ 518.5 ($ in Millions) Cash Flow (1) Includes $209.9 related to change in operating lease right-of-use assets and liabilities resulting from 2020 restructuring actions.

11Interpublic Group of Companies, Inc. December 31, 2020 December 31, 2019 CURRENT ASSETS: Cash and cash equivalents $ 2,509.0 $ 1,192.2 Accounts receivable, net 4,646.4 5,209.2 Accounts receivable, billable to clients 1,820.7 1,934.1 Assets held for sale 0.8 22.8 Other current assets 390.7 412.4 Total current assets $ 9,367.6 $ 8,770.7 CURRENT LIABILITIES: Accounts payable $ 7,269.7 $ 7,205.4 Accrued liabilities 832.4 742.8 Contract liabilities 657.8 585.6 Short-term borrowings 48.0 52.4 Current portion of long-term debt 502.5 502.0 Current portion of operating leases 268.5 267.2 Liabilities held for sale 1.6 65.0 Total current liabilities $ 9,580.5 $ 9,420.4 ($ in Millions) Balance Sheet — Current Portion

12Interpublic Group of Companies, Inc. Short-Term Debt Senior Notes - Current $551 $250 $500 $500 $500 $650 $540 $500 $51 2021 2022 2023 2024 2025 2026 2027 2028 2029 2030 2031 2032+ Senior Notes 3.75% 4.65% 5.40%4.00% 3.75% 4.20% Total Debt = $3.5 billion ($ in Millions) Debt Maturity Schedule (1) 4.75% (1) Senior Notes due on October 1, 2021. (2) On March 30, 2020, we issued a total of $650 in aggregate principal amount of unsecured senior notes due March 30, 2030. Senior Notes shown at face value on December 31, 2020. (2)

13Interpublic Group of Companies, Inc. • Intense focus on navigating the impact of COVID-19 and well-positioned to participate in the global economic recovery • Foundation for sustained growth ◦ Quality of our agency offerings ◦ Exceptional talent ◦ “Open architecture” solutions ◦ Data management at scale ◦ Strong creative and innovative marketing & media solutions ◦ Integrated digital and digital specialists • Effective expense management is an ongoing priority • Financial strength a continued source of value creation Summary

14Interpublic Group of Companies, Inc. Appendix

15Interpublic Group of Companies, Inc. Twelve Months Ended December 31, 2020 2019 Net Revenue $ 8,064.5 $ 8,625.1 Billable Expenses 996.5 1,596.2 Total Revenue 9,061.0 10,221.3 Salaries and Related Expenses 5,345.0 5,568.8 Office and Other Direct Expenses 1,367.9 1,564.1 Billable Expenses 996.5 1,596.2 Cost of Services 7,709.4 8,729.1 Selling, General and Administrative Expenses 58.8 93.8 Depreciation and Amortization 290.6 278.5 Restructuring Charges 413.8 33.9 Total Operating Expense 8,472.6 9,135.3 Operating Income 588.4 1,086.0 Interest Expense, net (162.7) (164.8) Other Expense, net (64.4) (42.9) Income Before Income Taxes 361.3 878.3 Provision for Income Taxes 8.0 204.8 Equity in Net Income of Unconsolidated Affiliates 0.9 0.4 Net Income 354.2 673.9 Net Income Attributable to Noncontrolling Interests (3.1) (17.9) Net Income Available to IPG Common Stockholders $ 351.1 $ 656.0 Earnings per Share Available to IPG Common Stockholders - Basic $ 0.90 $ 1.70 Earnings per Share Available to IPG Common Stockholders - Diluted $ 0.89 $ 1.68 Weighted-Average Number of Common Shares Outstanding - Basic 389.4 386.1 Weighted-Average Number of Common Shares Outstanding - Diluted 393.2 391.2 Dividends Declared per Common Share $ 1.020 $ 0.940 ($ in Millions, except per share amounts) Operating Performance

16Interpublic Group of Companies, Inc. Organic Net Revenue Change by Region “All Other Markets” includes Canada, Africa and the Middle East. Circle proportions represent consolidated net revenue distribution. See reconciliation of organic net revenue change, including total net revenue change, on page 21. Twelve Months Ended December 31, 2020 -2.9% United States -9.2% United Kingdom -4.4% Continental Europe 0.4% Latin America -13.6% Asia Pacific -8.0% International -4.8% Worldwide -8.5% All Other Markets +
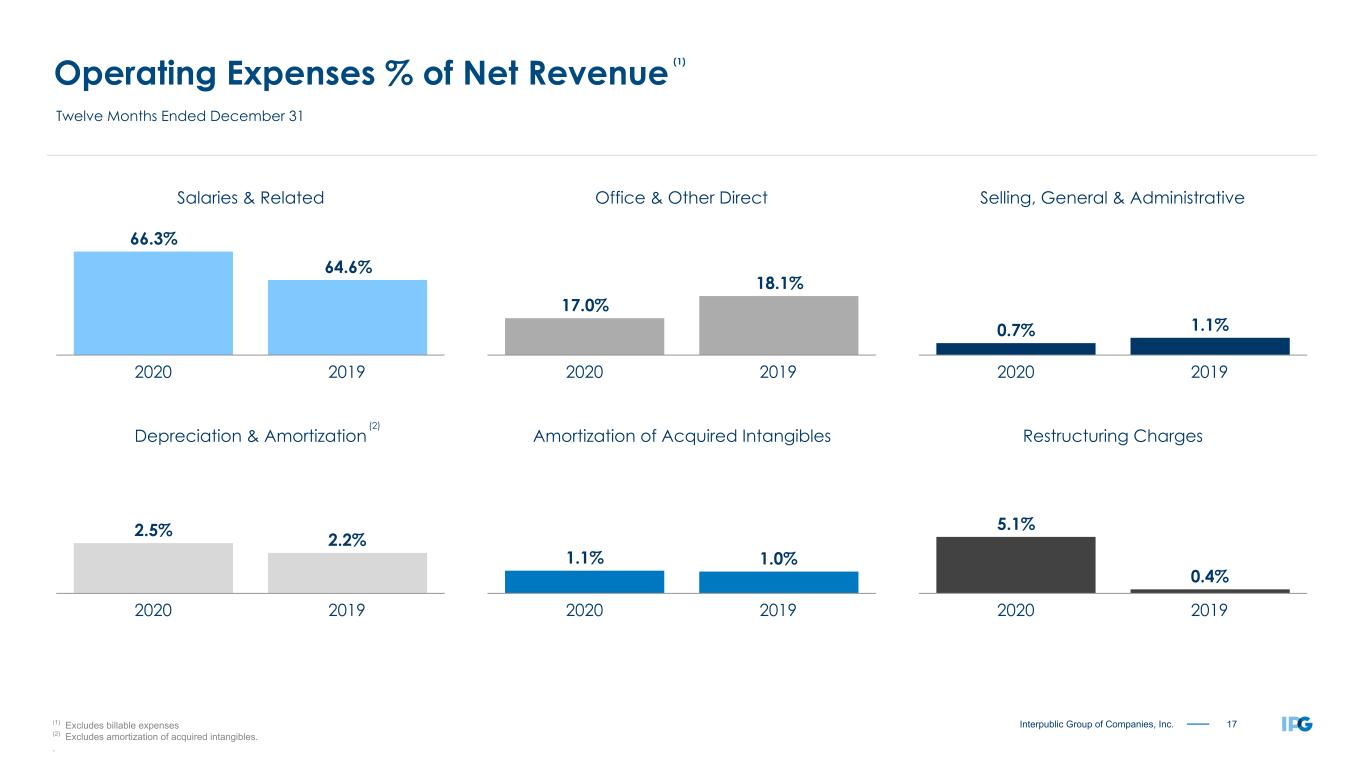
17Interpublic Group of Companies, Inc. Operating Expenses % of Net Revenue (1) Excludes billable expenses (2) Excludes amortization of acquired intangibles. . Salaries & Related 66.3% 64.6% 2020 2019 Office & Other Direct 17.0% 18.1% 2020 2019 Selling, General & Administrative 0.7% 1.1% 2020 2019 Depreciation & Amortization 2.5% 2.2% 2020 2019 Amortization of Acquired Intangibles 1.1% 1.0% 2020 2019 Restructuring Charges 5.1% 0.4% 2020 2019 Twelve Months Ended December 31 (2) (1)
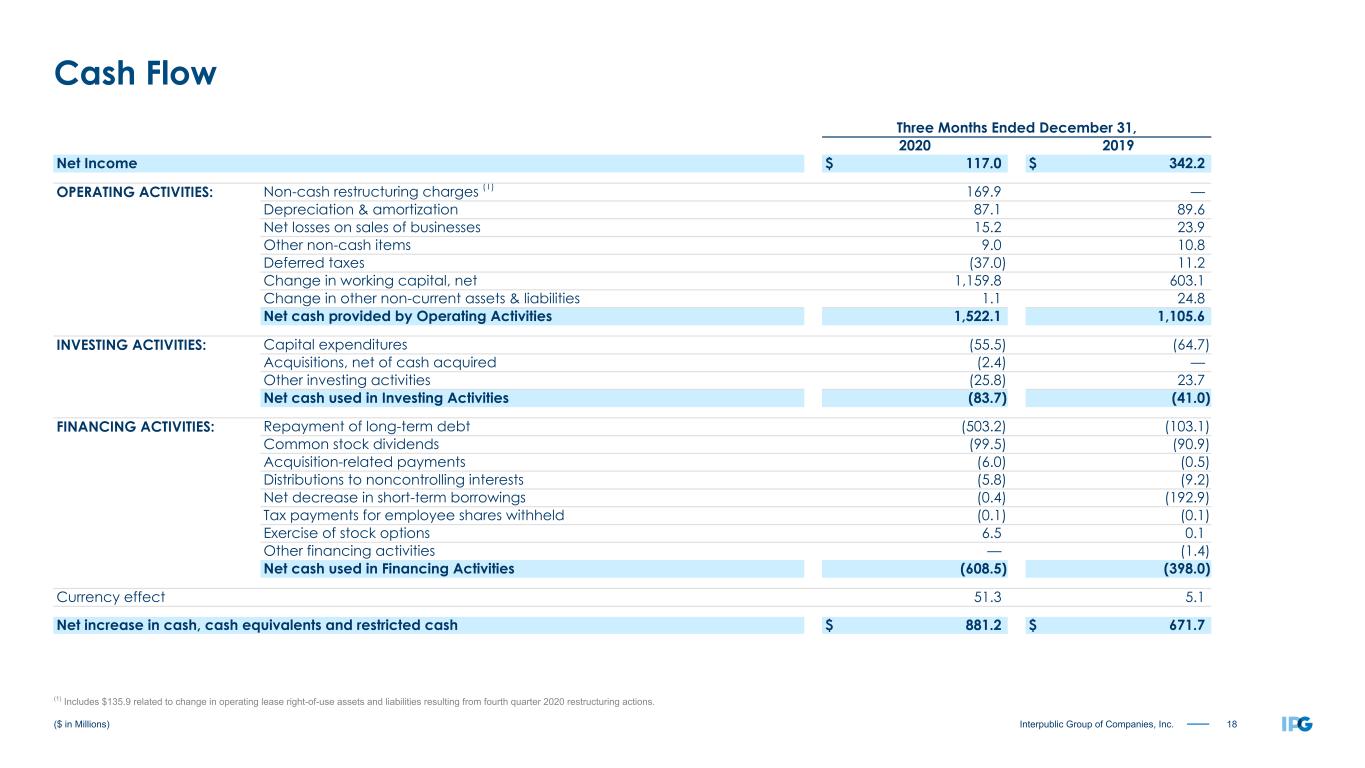
18Interpublic Group of Companies, Inc. Three Months Ended December 31, 2020 2019 Net Income $ 117.0 $ 342.2 OPERATING ACTIVITIES: Non-cash restructuring charges (1) 169.9 — Depreciation & amortization 87.1 89.6 Net losses on sales of businesses 15.2 23.9 Other non-cash items 9.0 10.8 Deferred taxes (37.0) 11.2 Change in working capital, net 1,159.8 603.1 Change in other non-current assets & liabilities 1.1 24.8 Net cash provided by Operating Activities 1,522.1 1,105.6 INVESTING ACTIVITIES: Capital expenditures (55.5) (64.7) Acquisitions, net of cash acquired (2.4) — Other investing activities (25.8) 23.7 Net cash used in Investing Activities (83.7) (41.0) FINANCING ACTIVITIES: Repayment of long-term debt (503.2) (103.1) Common stock dividends (99.5) (90.9) Acquisition-related payments (6.0) (0.5) Distributions to noncontrolling interests (5.8) (9.2) Net decrease in short-term borrowings (0.4) (192.9) Tax payments for employee shares withheld (0.1) (0.1) Exercise of stock options 6.5 0.1 Other financing activities — (1.4) Net cash used in Financing Activities (608.5) (398.0) Currency effect 51.3 5.1 Net increase in cash, cash equivalents and restricted cash $ 881.2 $ 671.7 ($ in Millions) Cash Flow (1) Includes $135.9 related to change in operating lease right-of-use assets and liabilities resulting from fourth quarter 2020 restructuring actions.

19Interpublic Group of Companies, Inc. 2020 Q1 Q2 Q3 Q4 FY 2020 Depreciation and amortization (1) $ 51.5 $ 51.3 $ 49.7 $ 52.2 $ 204.7 Amortization of acquired intangibles 21.3 21.8 21.3 21.5 85.9 Amortization of restricted stock and other non-cash compensation 23.2 12.6 20.6 10.6 67.0 Net amortization of bond discounts and deferred financing costs 2.3 3.0 3.3 2.8 11.4 2019 Q1 Q2 Q3 Q4 FY 2019 Depreciation and amortization (1) $ 49.5 $ 51.7 $ 47.3 $ 44.0 $ 192.5 Amortization of acquired intangibles 21.6 21.3 21.7 21.4 86.0 Amortization of restricted stock and other non-cash compensation 28.2 15.9 14.2 21.9 80.2 Net amortization of bond discounts and deferred financing costs 2.3 2.3 2.4 2.3 9.3 ($ in Millions) (1) Excludes amortization of acquired intangibles. Depreciation and Amortization

20Interpublic Group of Companies, Inc. Components of Change Change Three Months Ended December 31, 2019 Foreign Currency Net Acquisitions / (Divestitures) Organic Three Months Ended December 31, 2020 Organic Total SEGMENT: IAN (1) $ 2,082.4 $ 0.0 $ (18.1) $ (78.6) $ 1,985.7 (3.8%) (4.6%) DXTRA (1) 350.6 3.2 (2.2) (52.9) 298.7 (15.1%) (14.8%) Total $ 2,433.0 $ 3.2 $ (20.3) $ (131.5) $ 2,284.4 (5.4%) (6.1%) GEOGRAPHIC: United States $ 1,421.3 $ — $ (5.2) $ (25.3) $ 1,390.8 (1.8%) (2.1%) International 1,011.7 3.2 (15.1) (106.2) 893.6 (10.5%) (11.7%) United Kingdom 204.2 4.4 0.6 (19.8) 189.4 (9.7%) (7.2%) Continental Europe 246.6 10.5 (9.2) (18.0) 229.9 (7.3%) (6.8%) Asia Pacific 270.2 4.4 (4.4) (47.1) 223.1 (17.4%) (17.4%) Latin America 119.7 (17.2) (1.9) 2.7 103.3 2.3% (13.7%) All Other Markets 171.0 1.1 (0.2) (24.0) 147.9 (14.0%) (13.5%) Worldwide $ 2,433.0 $ 3.2 $ (20.3) $ (131.5) $ 2,284.4 (5.4%) (6.1%) ($ in Millions) Reconciliation of Organic Net Revenue (1) Results for the three months ended December 31, 2019 have been recast to conform to the current-period presentation.

21Interpublic Group of Companies, Inc. Components of Change Change Twelve Months Ended December 31, 2019 Foreign Currency Net Acquisitions / (Divestitures) Organic Twelve Months Ended December 31, 2020 Organic Total SEGMENT: IAN (1) $ 7,328.8 $ (66.9) $ (73.3) $ (267.2) $ 6,921.4 (3.6%) (5.6%) DXTRA (1) 1,296.3 (1.6) (5.8) (145.8) 1,143.1 (11.2%) (11.8%) Total $ 8,625.1 $ (68.5) $ (79.1) $ (413.0) $ 8,064.5 (4.8%) (6.5%) GEOGRAPHIC: United States $ 5,386.1 $ — $ (20.9) $ (153.8) $ 5,211.4 (2.9%) (3.2%) International 3,239.0 (68.5) (58.2) (259.2) 2,853.1 (8.0%) (11.9%) United Kingdom 727.0 2.4 1.7 (66.8) 664.3 (9.2%) (8.6%) Continental Europe 742.4 5.9 (31.9) (32.8) 683.6 (4.4%) (7.9%) Asia Pacific 858.3 (7.9) (23.4) (116.5) 710.5 (13.6%) (17.2%) Latin America 389.9 (63.8) (4.1) 1.4 323.4 0.4% (17.1%) All Other Markets 521.4 (5.1) (0.5) (44.5) 471.3 (8.5%) (9.6%) Worldwide $ 8,625.1 $ (68.5) $ (79.1) $ (413.0) $ 8,064.5 (4.8%) (6.5%) ($ in Millions) Reconciliation of Organic Net Revenue (1) Results for the twelve months ended December 31, 2019 have been recast to conform to the current-period presentation.

22Interpublic Group of Companies, Inc. Three Months Ended December 31, 2020 As Reported Amortization of Acquired Intangibles Restructuring Charges Net Losses on Sales of Businesses Adjusted Results (Non-GAAP) Operating Income and Adjusted EBITA before Restructuring Charges (2) $ 223.4 $ (21.5) $ (253.9) $ 498.8 Total (Expenses) and Other Income (3) (49.8) $ (15.2) (34.6) Income Before Income Taxes 173.6 (21.5) (253.9) (15.2) 464.2 Provision for Income Taxes 58.1 4.2 56.9 2.0 121.2 Effective Tax Rate 33.5 % 26.1 % Equity in Net Income of Unconsolidated Affiliates 1.5 1.5 Net Income Attributable to Noncontrolling Interests (4.7) (4.7) Net Income Available to IPG Common Stockholders $ 112.3 $ (17.3) $ (197.0) $ (13.2) $ 339.8 Weighted-Average Number of Common Shares Outstanding - Basic 390.5 390.5 Dilutive effect of stock options and restricted shares 5.6 5.6 Weighted-Average Number of Common Shares Outstanding - Diluted 396.1 396.1 Earnings per Share Available to IPG Common Stockholders (4): Basic $ 0.29 $ (0.04) $ (0.50) $ (0.03) $ 0.87 Diluted $ 0.28 $ (0.04) $ (0.50) $ (0.03) $ 0.86 ($ in Millions, except per share amounts) (1) The table reconciles our reported results to our adjusted non-GAAP results. Management believes the resulting comparisons provide useful supplemental data that, while not a substitute for GAAP measures, allow for greater transparency in the review of our financial and operational performance. (1) Refer to non-GAAP reconciliation of Adjusted EBITA before Restructuring Charges on slide 24. (3) Consists of non-operating expenses including interest expense, net and other expense, net. (4) Earnings per share may not add due to rounding. Reconciliation of Adjusted Results (1)

23Interpublic Group of Companies, Inc. Twelve Months Ended December 31, 2020 As Reported Amortization of Acquired Intangibles Restructuring Charges Net Losses on Sales of Businesses Net Impact of Various Discrete Tax Items (2) Adjusted Results (Non-GAAP) Operating Income and Adjusted EBITA before Restructuring Charges (3) $ 588.4 $ (85.9) $ (413.8) $ 1,088.1 Total (Expenses) and Other Income (4) (227.1) $ (67.0) (160.1) Income Before Income Taxes 361.3 (85.9) (413.8) (67.0) 928.0 Provision for Income Taxes 8.0 16.9 93.1 5.0 $ 122.6 245.6 Effective Tax Rate 2.2 % 26.5 % Equity in Net Income of Unconsolidated Affiliates 0.9 0.9 Net Income Attributable to Noncontrolling Interests (3.1) (3.1) Net Income Available to IPG Common Stockholders $ 351.1 $ (69.0) $ (320.7) $ (62.0) $ 122.6 $ 680.2 Weighted-Average Number of Common Shares Outstanding - Basic 389.4 389.4 Dilutive effect of stock options and restricted shares 3.8 3.8 Weighted-Average Number of Common Shares Outstanding - Diluted 393.2 393.2 Earnings per Share Available to IPG Common Stockholders (5): Basic $ 0.90 $ (0.18) $ (0.82) $ (0.16) $ 0.31 $ 1.75 Diluted $ 0.89 $ (0.18) $ (0.82) $ (0.16) $ 0.31 $ 1.73 ($ in Millions, except per share amounts) Reconciliation of Adjusted Results (1) (1) The table reconciles our reported results to our adjusted non-GAAP results. Management believes the resulting comparisons provide useful supplemental data that, while not a substitute for GAAP measures, allow for greater transparency in the review of our financial and operational performance. (2) Includes a tax benefit of $136.2 related to the finalization and settlement of the U.S. Federal income tax audit of the years 2006 through 2016, partially offset by $13.6 of tax expense related to the estimated costs associated with our change in our APB 23 assertion for certain foreign subsidiaries. (3) Refer to non-GAAP reconciliation of Adjusted EBITA before Restructuring Charges on slide 24. (4) Consists of non-operating expenses including interest expense, net and other expense, net. (5) Earnings per share may not add due to rounding.

24Interpublic Group of Companies, Inc. Reconciliation of Adjusted EBITA Three Months Ended December 31, Twelve Months Ended December 31, 2020 2019 2020 2019 Net Revenue $ 2,284.4 $ 2,433.0 $ 8,064.5 $ 8,625.1 Non-GAAP Reconciliation: Net Income Available to IPG Common Stockholders $ 112.3 $ 328.9 $ 351.1 $ 656.0 Add Back: Provision for Income Taxes 58.1 86.1 8.0 204.8 Subtract: Total (Expenses) and Other Income (49.8) (63.5) (227.1) (207.7) Equity in Net Income of Unconsolidated Affiliates 1.5 0.5 0.9 0.4 Net Income Attributable to Noncontrolling Interests (4.7) (13.3) (3.1) (17.9) Operating Income $ 223.4 $ 491.3 $ 588.4 $ 1,086.0 Add Back: Amortization of Acquired Intangibles 21.5 21.4 85.9 86.0 Adjusted EBITA $ 244.9 $ 512.7 $ 674.3 $ 1,172.0 Adjusted EBITA Margin on Net Revenue % 10.7 % 21.1 % 8.4 % 13.6 % Restructuring Charges (2) $ 253.9 N/A $ 413.8 $ 31.8 Adjusted EBITA before Restructuring Charges $ 498.8 N/A $ 1,088.1 $ 1,203.8 Adjusted EBITA before Restructuring Charges Margin on Net Revenue % 21.8 % N/A 13.5 % 14.0 % (1) ($ in Millions) (1) The table reconciles our reported results to our adjusted non-GAAP results. Management believes the resulting comparisons provide useful supplemental data that, while not a substitute for GAAP measures, allow for greater transparency in the review of our financial and operational performance. (2) In the second, third and fourth quarters of 2020, the Company took restructuring actions to lower our operating expenses structurally and permanently relative to revenue and to accelerate the transformation of our business. The adjustment of $31.8 for restructuring charges for the twelve months ended December 31, 2019 only includes restructuring charges during the first quarter of 2019, which relate to a cost initiative to better align our cost structure with our revenue due to client losses occurring in 2018.
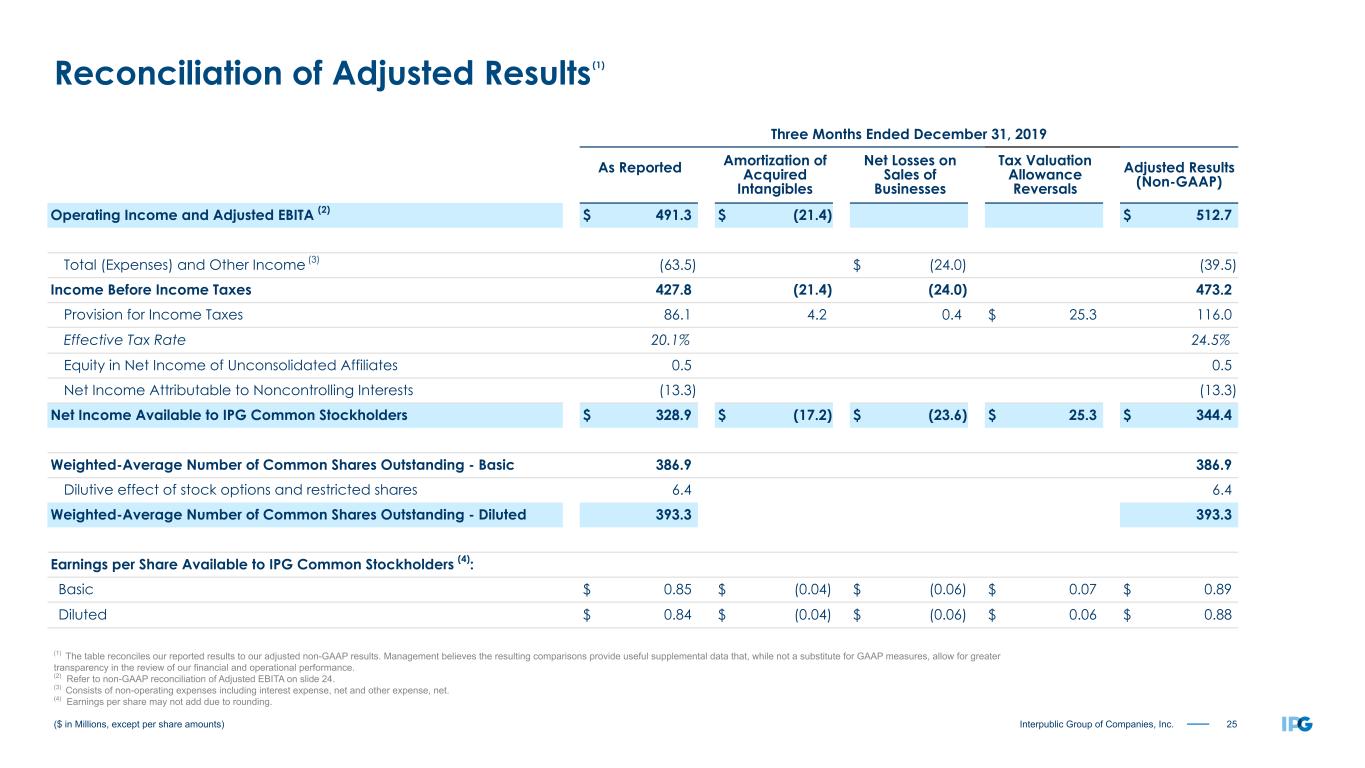
25Interpublic Group of Companies, Inc. Three Months Ended December 31, 2019 As Reported Amortization of Acquired Intangibles Net Losses on Sales of Businesses Tax Valuation Allowance Reversals Adjusted Results (Non-GAAP) Operating Income and Adjusted EBITA (2) $ 491.3 $ (21.4) $ 512.7 Total (Expenses) and Other Income (3) (63.5) $ (24.0) (39.5) Income Before Income Taxes 427.8 (21.4) (24.0) 473.2 Provision for Income Taxes 86.1 4.2 0.4 $ 25.3 116.0 Effective Tax Rate 20.1 % 24.5 % Equity in Net Income of Unconsolidated Affiliates 0.5 0.5 Net Income Attributable to Noncontrolling Interests (13.3) (13.3) Net Income Available to IPG Common Stockholders $ 328.9 $ (17.2) $ (23.6) $ 25.3 $ 344.4 Weighted-Average Number of Common Shares Outstanding - Basic 386.9 386.9 Dilutive effect of stock options and restricted shares 6.4 6.4 Weighted-Average Number of Common Shares Outstanding - Diluted 393.3 393.3 Earnings per Share Available to IPG Common Stockholders (4): Basic $ 0.85 $ (0.04) $ (0.06) $ 0.07 $ 0.89 Diluted $ 0.84 $ (0.04) $ (0.06) $ 0.06 $ 0.88 ($ in Millions, except per share amounts) (1) The table reconciles our reported results to our adjusted non-GAAP results. Management believes the resulting comparisons provide useful supplemental data that, while not a substitute for GAAP measures, allow for greater transparency in the review of our financial and operational performance. (2) Refer to non-GAAP reconciliation of Adjusted EBITA on slide 24. (3) Consists of non-operating expenses including interest expense, net and other expense, net. (4) Earnings per share may not add due to rounding. Reconciliation of Adjusted Results (1)

26Interpublic Group of Companies, Inc. Twelve Months Ended December 31, 2019 As Reported Amortization of Acquired Intangibles Q1 2019 Restructuring Charges Net Losses on Sales of Businesses Net Impact of Various Discrete Tax Items (2) Adjusted Results (Non-GAAP) Operating Income and Adjusted EBITA before Restructuring Charges (3) $ 1,086.0 $ (86.0) $ (31.8) $ 1,203.8 Total (Expenses) and Other Income (4) (207.7) $ (46.3) (161.4) Income Before Income Taxes 878.3 (86.0) (31.8) (46.3) 1,042.4 Provision for Income Taxes 204.8 16.9 7.6 0.4 $ 39.2 268.9 Effective Tax Rate 23.3 % 25.8 % Equity in Net Income of Unconsolidated Affiliates 0.4 0.4 Net Income Attributable to Noncontrolling Interests (17.9) (17.9) Net Income Available to IPG Common Stockholders $ 656.0 $ (69.1) $ (24.2) $ (45.9) $ 39.2 $ 756.0 Weighted-Average Number of Common Shares Outstanding - Basic 386.1 386.1 Dilutive effect of stock options and restricted shares 5.1 5.1 Weighted-Average Number of Common Shares Outstanding - Diluted 391.2 391.2 Earnings per Share Available to IPG Common Stockholders (5): Basic $ 1.70 $ (0.18) $ (0.06) $ (0.12) $ 0.10 $ 1.96 Diluted $ 1.68 $ (0.18) $ (0.06) $ (0.12) $ 0.10 $ 1.93 ($ in Millions, except per share amounts) (1) The table reconciles our reported results to our adjusted non-GAAP results. Management believes the resulting comparisons provide useful supplemental data that, while not a substitute for GAAP measures, allow for greater transparency in the review of our financial and operational performance. (2) Includes $13.9 related to the settlement of certain tax positions in the second quarter of 2019 and $25.3 related to tax valuation allowance reversals in the fourth quarter of 2019. (3) Refer to non-GAAP reconciliation of Adjusted EBITA before Restructuring Charges on slide 24. (4) Consists of non-operating expenses including interest expense, net and other expense, net. (5) Earnings per share may not add due to rounding. Reconciliation of Adjusted Results (1)

27Interpublic Group of Companies, Inc. 558 541 481 443 425 416 408 398 389 391 393 395 473 466 432 421 419 408 398 390 383 386 389 391 85 75 49 22 6 8 10 8 6 5 4 4 2010 2011 2012 2013 2014 2015 2016 2017 2018 2019 2020 At 12/31/2020 (Amounts in Millions) Total Shares: Basic and Eligible for Dilution Dilutive SharesBasic Shares (1) Includes basic common shares outstanding, restricted shares, in-the-money stock options and convertible debt and preferred stock eligible for dilution. (2) Equals weighted-average shares outstanding as defined above for the twelve months ending December 31st for the periods presented. (1) Weighted-Average (2) (1)
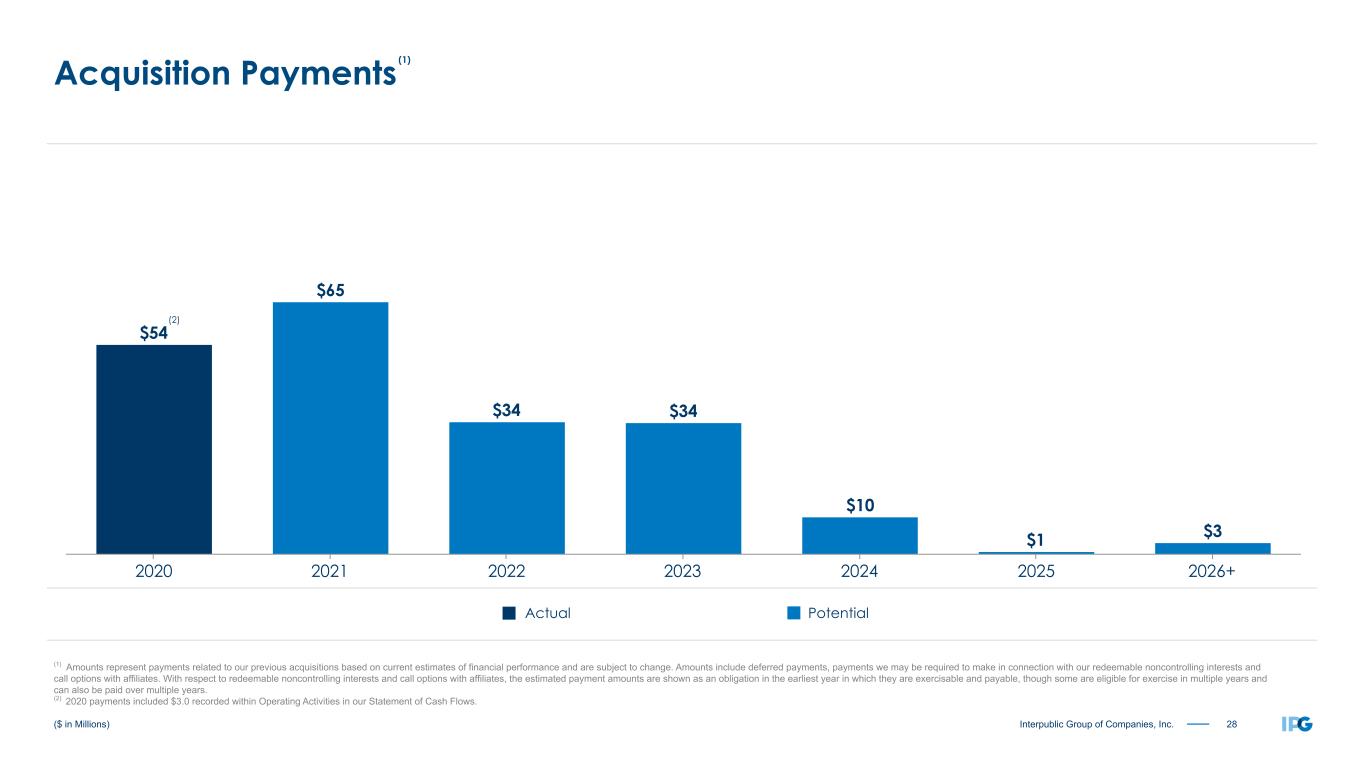
28Interpublic Group of Companies, Inc. $54 $65 $34 $34 $10 $1 $3 2020 2021 2022 2023 2024 2025 2026+ ($ in Millions) Acquisition Payments PotentialActual (1) Amounts represent payments related to our previous acquisitions based on current estimates of financial performance and are subject to change. Amounts include deferred payments, payments we may be required to make in connection with our redeemable noncontrolling interests and call options with affiliates. With respect to redeemable noncontrolling interests and call options with affiliates, the estimated payment amounts are shown as an obligation in the earliest year in which they are exercisable and payable, though some are eligible for exercise in multiple years and can also be paid over multiple years. (2) 2020 payments included $3.0 recorded within Operating Activities in our Statement of Cash Flows. (2) (1) (2) (1)

29Interpublic Group of Companies, Inc. Metrics Update

30Interpublic Group of Companies, Inc. Metrics Update CATEGORY: NET REVENUE SALARIES & RELATED OFFICE & OTHER DIRECT REAL ESTATE FINANCIAL (% of net revenue) (% of net revenue) METRIC: By Client Sector Twelve Months Ended Twelve Months Ended Total Square Feet Available Liquidity Base, Benefits & Tax Occupancy Expense Credit Facilities Covenant Incentive Expense All Other Office and Other Direct Expenses Severance Expense Temporary Help

31Interpublic Group of Companies, Inc. Net Revenue By Client Sector Top 500 Clients for the Twelve Months Ended December 31 Approximately 85% of Consolidated Net Revenue (1) 2020 2019 Health Care 26% Tech & Telecom 16% Auto & Transportation 8% Food & Beverage 10% Consumer Goods 8% Financial Services 13% Retail 10% Other 9% Health Care 22% Tech & Telecom 17% Auto & Transportation 10% Food & Beverage 10% Consumer Goods 9% Financial Services 14% Retail 8% Other 10%

32Interpublic Group of Companies, Inc. 66.3% 64.6% 2020 2019 Salaries & Related Expenses % of Net Revenue Twelve Months Ended December 31
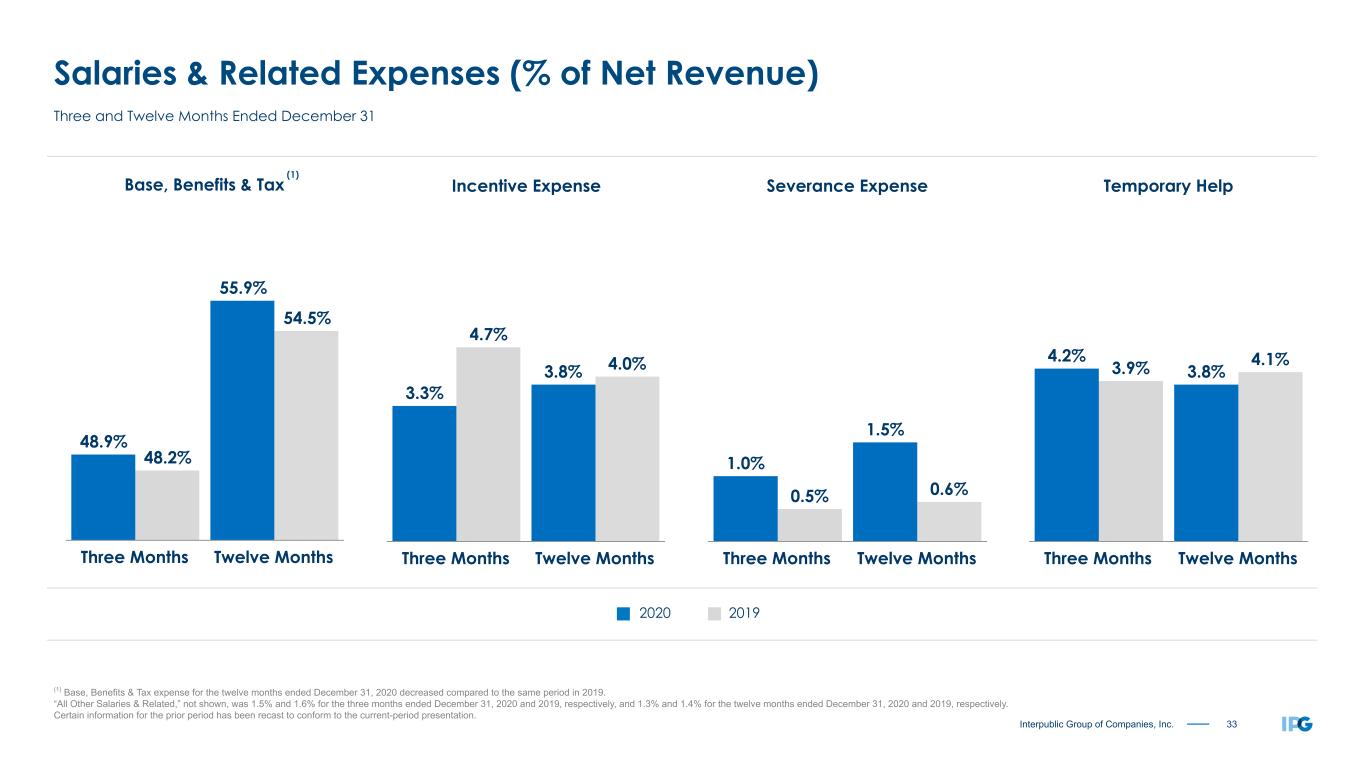
33Interpublic Group of Companies, Inc. Base, Benefits & Tax 48.9% 55.9% 48.2% 54.5% Three Months Twelve Months Severance Expense 1.0% 1.5% 0.5% 0.6% Three Months Twelve Months Incentive Expense 3.3% 3.8% 4.7% 4.0% Three Months Twelve Months Temporary Help 4.2% 3.8%3.9% 4.1% Three Months Twelve Months Salaries & Related Expenses (% of Net Revenue) (1) Base, Benefits & Tax expense for the twelve months ended December 31, 2020 decreased compared to the same period in 2019. “All Other Salaries & Related,” not shown, was 1.5% and 1.6% for the three months ended December 31, 2020 and 2019, respectively, and 1.3% and 1.4% for the twelve months ended December 31, 2020 and 2019, respectively. Certain information for the prior period has been recast to conform to the current-period presentation. Three and Twelve Months Ended December 31 2020 2019 (1)

34Interpublic Group of Companies, Inc. 17.0% 18.1% 2020 2019 Office & Other Direct Expenses % of Net Revenue Twelve Months Ended December 31

35Interpublic Group of Companies, Inc. Occupancy Expense 5.5% 6.2% 5.6% 6.3% Three Months Twelve Months All Other 10.5% 10.8% 11.7% 11.8% Three Months Twelve Months Office & Other Direct Expenses (% of Net Revenue) “All Other” primarily includes client service costs, non-pass through production expenses, travel and entertainment, professional fees, spending to support new business activity, telecommunications, office supplies, bad debt expense, adjustments to contingent acquisition obligations, foreign currency losses (gains) and other expenses. Three and Twelve Months Ended December 31 2020 2019

36Interpublic Group of Companies, Inc. 12.6 12.4 11.9 11.6 11.1 11.1 10.9 10.5 10.4 10.4 10.3 10.9 11.0 10.4 10.5 10.8 10.0 10.1 9.9 10.0 10.1 10.0 10.0 10.1 9.9 10.5 10.4 8.6 2.1 1.6 1.9 1.5 1.2 1.1 0.8 0.5 0.4 0.3 0.4 0.4 0.6 1.8 2007 2008 2009 2010 2011 2012 2013 2014 2015 2016 2017 2018 2019 2020 ($ in Millions) Real Estate Total Square Feet as of December 31, Sublease/VacantOccupied (1) Increase primarily due to the inclusion of Acxiom real estate. (2) Decrease primarily due to real estate restructuring actions taken as part of the 2020 Restructuring Plan. See slide 7 for further details. (1) (2)

37Interpublic Group of Companies, Inc. $1,192 $1,554 $1,085 $1,628 $2,509 $1,492 $1,492 $1,492 $1,491 $1,491$500 $500 $500 $500 12/31/2019 3/31/2020 6/30/2020 9/30/2020 12/31/2020 ($ in Millions) Available Liquidity Cash, Cash Equivalents + Available Committed Credit Facilities Available Committed Credit FacilityCash and Cash Equivalents 364-Day Credit Facility (1) In March 2020, we entered into an agreement for a 364-day revolving credit facility. (2) Includes net proceeds from our March 2020 debt issuance of $650 aggregate principal amount of Senior Notes. (2) (1)

38Interpublic Group of Companies, Inc. Covenants Four Quarters Ended December 31, 2020 Leverage Ratio (not greater than) (2) (3) 4.25x Actual Leverage Ratio 2.86x CREDIT AGREEMENT EBITDA RECONCILIATION: Four Quarters Ended December 31, 2020 Net Income Available to IPG Common Stockholders $ 351.1 + Non-Operating Adjustments (4) 237.3 Operating Income $ 588.4 + Depreciation and Amortization 412.3 + Other Non-cash Charges Reducing Operating Income 209.9 Credit Agreement EBITDA (2): $ 1,210.6 ($ in Millions) Credit Facilities Covenant (1) (1) The leverage ratio financial covenant applies to both our committed corporate credit facility, amended and restated as of November 1, 2019, (as further amended, the "Credit Agreement") and our 364-day credit facility entered into on March 27, 2020 and amended as of July 28, 2020 (as amended, the "364-Day Credit Facility"). (2) The leverage ratio is defined as debt as of the last day of such fiscal quarter to EBITDA (as defined in the Credit Agreement and the 364-Day Credit Facility) for the four quarters then ended. (3) On July 28, 2020, we entered into Amendment No. 1 to the Credit Agreement and Amendment No. 1 to the 364-Day Credit Facility (together, the “Amendments”). The Amendments increased the maximum leverage ratio covenant to 4.25x in the case of the 364-Day Credit Facility and, in the case of the Credit Agreement, to (i) 4.25x through the quarter ended June 30, 2021, and (ii) 3.50x thereafter. (4) Includes adjustments of the following items from our consolidated statement of operations: provision for income taxes, total (expenses) and other income, equity in net loss of unconsolidated affiliates, and net loss attributable to noncontrolling interests.

39Interpublic Group of Companies, Inc. This investor presentation contains forward-looking statements. Statements in this investor presentation that are not historical facts, including statements about management’s beliefs and expectations, constitute forward-looking statements. These statements are based on current plans, estimates and projections, and are subject to change based on a number of factors, including those outlined under item 1A, Risk Factors, in our most recent Annual Report on Form 10-K and our quarterly reports on Form 10-Q and our other filings with the Securities and Exchange Commission ("SEC"). Forward-looking statements speak only as of the date they are made, and we undertake no obligation to update publicly any of them in light of new information or future events. Forward-looking statements involve inherent risks and uncertainties. A number of important factors could cause actual results to differ materially from those contained in any forward-looking statement. Such factors include, but are not limited to, the following: ▪ the effects of a challenging economy on the demand for our advertising and marketing services, on our clients’ financial condition and on our business or financial condition; ▪ the impacts of the novel coronavirus (COVID-19) pandemic and, the measures to contain its spread, including social distancing efforts and restrictions on businesses, social activities and travel, any failure to realize anticipated benefits from the rollout of COVID-19 vaccination campaigns and the resulting impact on the economy, our clients and demand for our services, which may precipitate or exacerbate other risks and uncertainties; ▪ our ability to attract new clients and retain existing clients; ▪ our ability to retain and attract key employees; ▪ risks associated with assumptions we make in connection with our critical accounting estimates, including changes in assumptions associated with any effects of a weakened economy; ▪ potential adverse effects if we are required to recognize impairment charges or other adverse accounting-related developments; ▪ risks associated with the effects of global, national and regional economic and political conditions, including counterparty risks and fluctuations in economic growth rates, interest rates and currency exchange rates; ▪ developments from changes in the regulatory and legal environment for advertising and marketing and communications services companies around the world, including laws and regulations related to data protection and consumer privacy; and ▪ failure to fully realize the anticipated benefits of our 2020 restructuring actions and other cost-saving initiatives. Investors should carefully consider these factors and the additional risk factors outlined in more detail under Item 1A, Risk Factors, in our most recent Annual Report on Form 10-K and our quarterly reports on Form 10-Q and our other SEC filings. Cautionary Statement
