Attached files
| file | filename |
|---|---|
| EX-23.1 - EX-23.1 - loanDepot, Inc. | d814714dex231.htm |
Table of Contents
As filed with the Securities and Exchange Commission on February 9, 2021.
No. 333-252024
UNITED STATES
SECURITIES AND EXCHANGE COMMISSION
Washington, D.C. 20549
Amendment No. 5
to
FORM S-1
REGISTRATION STATEMENT
UNDER
THE SECURITIES ACT OF 1933
loanDepot, Inc.
(Exact name of registrant as specified in its charter)
| Delaware | 6199 | 85-3948939 | ||
| (State or other jurisdiction of incorporation or organization) |
(Primary Standard Industrial Classification Code Number) |
(I.R.S. Employer Identification No.) |
26642 Towne Centre Drive
Foothill Ranch, California 92610
(888) 337-6888
(Address, including zip code, and telephone number, including area code, of registrant’s principal executive offices)
Peter A. L. Macdonald
Secretary and Executive Vice President
c/o LD Holdings Group LLC
26642 Towne Centre Drive
Foothill Ranch, California 92610
(888) 337-6888
(Name, address, including zip code, and telephone number, including area code, of agent for service)
With copies to:
| Joshua N. Korff Michael Kim Kirkland & Ellis LLP 601 Lexington Avenue New York, New York 10022 (212) 446-4800 |
Michael Kaplan Yasin Keshvargar Davis Polk & Wardwell LLP 450 Lexington Avenue New York, New York 10017 (212) 450-4000 |
Approximate date of commencement of proposed sale to the public: As soon as practicable after this Registration Statement becomes effective.
If any of the securities being registered on this Form are to be offered on a delayed or continuous basis pursuant to Rule 415 under the Securities Act of 1933, check the following box: ☐
If this Form is filed to register additional securities for an offering pursuant to Rule 462(b) under the Securities Act, please check the following box and list the Securities Act registration statement number of the earlier effective registration statement for the same offering. ☐
If this Form is a post-effective amendment filed pursuant to Rule 462(c) under the Securities Act, check the following box and list the Securities act registration statement number of the earlier effective registration statement for the same offering. ☐
If this Form is a post-effective amendment filed pursuant to Rule 462(d) under the Securities Act, check the following box and list the Securities Act registration statement number of the earlier effective registration statement for the same offering. ☐
If delivery of the prospectus is expected to be made pursuant to Rule 434, please check the following box. ☐
Indicate by check mark whether the registrant is a large accelerated filer, an accelerated filer, a non-accelerated filer, smaller reporting company, or an emerging growth company. See the definitions of “large accelerated filer,” “accelerated filer,” “smaller reporting company,” and “emerging growth company” in Rule 12b-2 of the Exchange Act.
| Large accelerated filer | ☐ | Accelerated filer | ☐ | |||
| Non-accelerated filer | ☒ | Smaller reporting company | ☐ | |||
| Emerging growth company | ☐ | |||||
If an emerging growth company, indicate by check mark if the registrant has elected not to use the extended transition period for complying with any new or revised financial accounting standards provided pursuant to Section 7(a)(2)(B) of the Securities Act. ☐
CALCULATION OF REGISTRATION FEE
|
| ||||||||
| Title of Each Class of Securities to be Registered |
Amount to Be Registered(1) |
Proposed Maximum Offering Price Per Share(2) |
Proposed Offering Price(1)(2) |
Amount of Registration Fee | ||||
| Class A Common Stock, $0.001 par value per share |
17,250,000 | $21.00 | $362,250,000 | $39,521.50(3) | ||||
|
| ||||||||
|
| ||||||||
| (1) | Includes 2,250,000 shares of Class A common stock that may be purchased by the underwriters upon the exercise of their option to purchase additional shares. See “Underwriting.” |
| (2) | Estimated solely for the purpose of computing the amount of the registration fee pursuant to Rule 457(a) under the Securities Act of 1933, as amended. |
| (3) | Previously paid |
The Registrant hereby amends this Registration Statement on such date or dates as may be necessary to delay its effective date until the Registrant shall file a further amendment which specifically states that this Registration Statement shall thereafter become effective in accordance with Section 8(a) of the Securities Act of 1933 or until this Registration Statement shall become effective on such date as the Commission, acting pursuant to said Section 8(a), may determine.
Table of Contents
The information in this preliminary prospectus is not complete and may be changed. These securities may not be sold until the registration statement filed with the Securities and Exchange Commission is effective. This preliminary prospectus is not an offer to sell and does not seek an offer to buy these securities and it is not soliciting an offer to buy these securities in any jurisdiction where the offer or sale thereof is not permitted.
PRELIMINARY PROSPECTUS
Subject to Completion, dated February 9, 2021
15,000,000 Shares

loanDepot, Inc.
Class A Common Stock
This is an initial public offering of shares of Class A Common Stock of loanDepot, Inc. We are offering 9,410,000 shares of our Class A Common Stock. The selling stockholders identified in this prospectus are offering an additional 5,590,000 shares of Class A Common Stock. We will not receive any of the proceeds from the sale of shares being sold by the selling stockholders.
Prior to this offering, there has been no public market for our Class A Common Stock. The initial public offering price per share of the Class A Common Stock is expected to be between $19.00 and $21.00. We intend to list our Class A Common Stock on the New York Stock Exchange (the “NYSE”) under the symbol “LDI”.
We will have four classes of authorized common stock after this offering: Class A Common Stock, Class B Common Stock, Class C Common Stock and Class D Common Stock. Each share of Class A Common Stock and Class B Common Stock entitles its holder to one vote on all matters presented to our stockholders generally. Each share of Class C Common Stock and Class D Common Stock entitles its holder to five votes on all matters presented to our stockholders generally. The holders of Class B Common Stock and Class C Common Stock will not have any of the economic rights (including the rights to dividends) provided to holders of Class A Common Stock and Class D Common Stock. Upon completion of this offering, all of our Class D common stock will be held by affiliates of Parthenon Capital Partners (“Parthenon Capital”) and all of our Class B common stock and Class C common stock will be held by the Continuing LLC Members (as defined below), as the case may be, on a one-to-one basis with the number of Holdco Units they own.
Immediately following this offering, the holders of our Class A Common Stock issued in this offering collectively will hold 5.3% of the economic interest in us and 1.1% of the combined voting power in us, affiliates of Parthenon Capital who previously owned the stock of LD Investment Holdings, Inc. (the “Parthenon Blocker”), will hold 35.3% of the economic interest in us and 36.9% of the combined voting power in us, and the Continuing LLC Members (as defined below), through their ownership of Class B common stock and/or Class C common stock, as the case may be, collectively will hold no economic interest in us and the remaining 62.0% of the combined voting power in us. We will be a holding company, and upon completion of this offering and the application of the net proceeds therefrom, our principal asset will be the LLC Interests we hold In LD Holdings Group LLC (“LD Holdings ”). The remaining 59.4% economic interest in LD Holdings will be owned by the Continuing LLC Members through their ownership of equity interests in LD Holdings (“Holdco Units”). We will be the sole manager of LD Holdings. As the sole manager, we will operate and control all of the business and affairs of LD Holdings, and through LD Holdings and its subsidiaries, we will conduct our business. Upon completion of this offering, we will be a “controlled company” under the NYSE’s governance standards.
Investing in our Class A Common Stock involves risks. See “Risk factors” beginning on page 30.
Neither the Securities and Exchange Commission nor any state securities commission nor any other regulatory body has approved or disapproved of these securities or passed upon the accuracy or adequacy of this prospectus. Any representation to the contrary is a criminal offense.
| Per Share | Total | |||||||
| Initial public offering price |
$ | $ | ||||||
| Underwriting discounts and commissions(1) |
$ | $ | ||||||
| Proceeds, before expenses, to us |
$ | $ | ||||||
| Proceeds, before expenses, to the selling stockholders |
$ | $ | ||||||
| (1) | See “Underwriting” for a full description of compensation payable in connection with this offering. |
The underwriters have an option to purchase up to 2,250,000 additional shares from us and the selling stockholders at the initial public offering price, less underwriting discounts and commissions. The underwriters can exercise this option at any time and from time to time within 30 days from the date of this prospectus.
The underwriters expect to deliver the shares of Class A Common Stock against payment therefor in New York, New York on or about , 2021.
| Goldman Sachs & Co. LLC | BofA Securities | Credit Suisse | Morgan Stanley |
| Barclays | Citigroup | Jefferies | UBS Investment Bank |
| JMP Securities | Nomura | Piper Sandler | ||
| Raymond James | William Blair | AmeriVet Securities |
The date of this prospectus is , 2021
Table of Contents

| Eleven years ago, I founded loanDepot, confident we could deliver the dream of homeownership to individuals and families across the nation.
I wasn’t alone on my journey. There were 50 bright, dedicated and passionate individuals that joined me, and together, from day 1, we were inspired to do our best–and be our best–for our customers. We were committed to providing honest products with great value, and committed to delivering them in an innovative, delightful way. |
Anthony Hsieh CEO | |||
|
To do what we did back then took more than wisdom and tenacity, it took courage. We chose to enter the market at a time when few were willing to take the chance, and even fewer were succeeding. Despite the headwinds originally against us, we had a vision, and we never lost our focus. We knew that online demand for mortgage products and services was going to grow and we believed the market would gravitate to originators with a recognizable brand that could deliver seamless experiences on par with emerging and best-in-class digital technologies.
We always had high expectations for ourselves. We acted with focus and urgency every single day, because we knew that behind every loan file was a family, and that family deserved the best we could offer.
Even at that time, we knew, in order to truly do our best for our customers, we had to compete with the exceptional digital experiences customers have outside of the mortgage industry each and every day. We knew we had to disrupt the mortgage industry in the same way that Apple, Netflix and Amazon disrupted their verticals, ultimately forever changing consumer behavior.
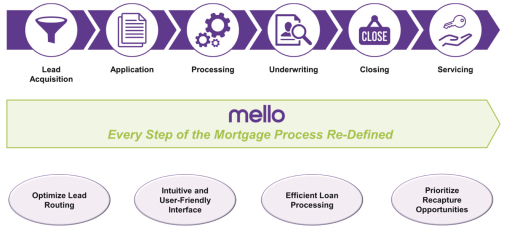
This early recognition separated us from the pack, and is what led to the creation of mello. mello changed the game for the mortgage industry, and allowed us to be in control of our own digital destiny, ensuring that we could deliver a loan experience to customers that felt simple, easy and rewarding. The advent of mello, and the subsequent development of the mello smartloan, brought full circle the reasons why the team and I originally came together over a decade ago.
| ||||


Table of Contents
| I’m often asked how a company that started with 50 employees and a dream was able to accomplish all that we have in just eleven short years. For us, the answer is simple-we think and do differently to delight our customers. | ||||||
|
|
Thinking and doing differently, for us, means building and harnessing technology and data in a way that leads to customer satisfaction and loyalty.
| |||||
|
|
Thinking and doing differently is what allows us to be one click away from millions of customers at all times, and to be able to intelligently and nimbly match our customers with the right loan officer and the right product, at the right price, at the right time.
| |||||


| We’ve grown from 50 founding employees, to now, team members 10,000 strong, serving more than 30,000 customers each month, helping them achieve their financial goals in a way that is personalized, convenient and fast. We’ve created a company that is built to serve customers throughout the entire loan transaction, from the onset of the purchase or refinance decision through loan closing and servicing. We now possess roughly 3% market share of annual mortgage origination volumes, which makes up part of the $11T total addressable market. Thanks to our brand investment over time, we are also one of the most recognized brands in the industry today. All of this gives us enormous runway. And, to some, it may seem like we are in a much different place than we were eleven years ago.
But, from my vantage point, much feels the same.
As we continue rounding the corner into our second decade, the size and scale of our platform has changed, but our core values and principles have not. We’re going to keep doing what we set out to do eleven years ago. We will continue thinking and doing things differently on behalf of our customers, serving, delivering and innovating with intent. We’ll continue to challenge what’s possible, all while remaining true to our customers, our team and our purpose.
Because, at loanDepot, we know home means everything. | ||||

| ||||
Table of Contents

Table of Contents

Table of Contents

| At loanDepot, we believe in these essential guiding principles, each of which is an invaluable part of every action we take:
• Our brand is perishable. As our Founder and CEO Anthony Hsieh says, “Spoiled milk can’t go back in the refrigerator.” Exceptional customer service is an integral part of our foundation and going the extra mile for both internal and external customers is, simply put, part of our DNA. Moreover, this promise to customers is what reinforces our brand and lets individuals and families across the nation know that they can count on us. It is our responsibility to guide and care for our customers during this important time in their lives—on every call, with every customer, every time.
• We take care of our house. We have a responsibility to and for each other, our company, our customers and our communities, and we realize that “our house” encompasses everyone who relies upon us.
• Momentum isn’t achieved overnight. Every day, we work together to achieve the goals we have set for our company and for our customers. Those accomplishments create unprecedented momentum over time. Every successful connection, interaction and closing adds up over time, reinforcing the important work we do—and enables us to stay focused on the future.
• Mortgages will never go out of style. Our company does important work for families and individuals nationwide. We help them create memories, establish roots and become valuable parts of communities. The fundamental desire to become a homeowner will never change, but the processes by which customers attain a mortgage absolutely must.
• Fundamentals don’t change, no matter your size. Whether you have a team of 500 or 50,000, the essentials of business do not change. We apply our expansive mortgage industry knowledge to those fundamentals to create unique, streamlined experiences that are effective, efficient and, most important, exceptional. | ||||
| • We follow the “Double ‘A’ Rule.” Our Founder and CEO, Anthony Hsieh, relies on two words to manage his teams: attitude and abilities, and creating dream teams requires both. Positive attitudes are infectious and help define our company’s culture. Ability translates to performance. Ensuring that each team member is placed in a role that optimizes their talents both ensures their individual success, as well as the company’s collective success.
• Play smart offense. Others will try to imitate us, but they may never fully replicate what we have built, on our own, with our own resourcefulness and with our own hands. We will always forge our own path and lead by example.
| ||||
Table of Contents
|
• Ingenuity requires time and effort. While innovation is at the heart of every decision we make, when it comes to setting and achieving goals, we do it in a manner that delivers optimal profitability. From our investment in technology to our investment in our team members, we put in the time, the effort and the ingenuity to ensure that the time we spend, and the investment we make, is well worth it.
• We must always be the best that we can be. Our company culture is built around the tenets of responsibility and accountability. To be America’s lender—and to achieve an unmatched level of trust from individuals and families across the country—we must be our very best at all times. That is what sets us apart. That is what makes us loanDepot.
| ||||
Table of Contents
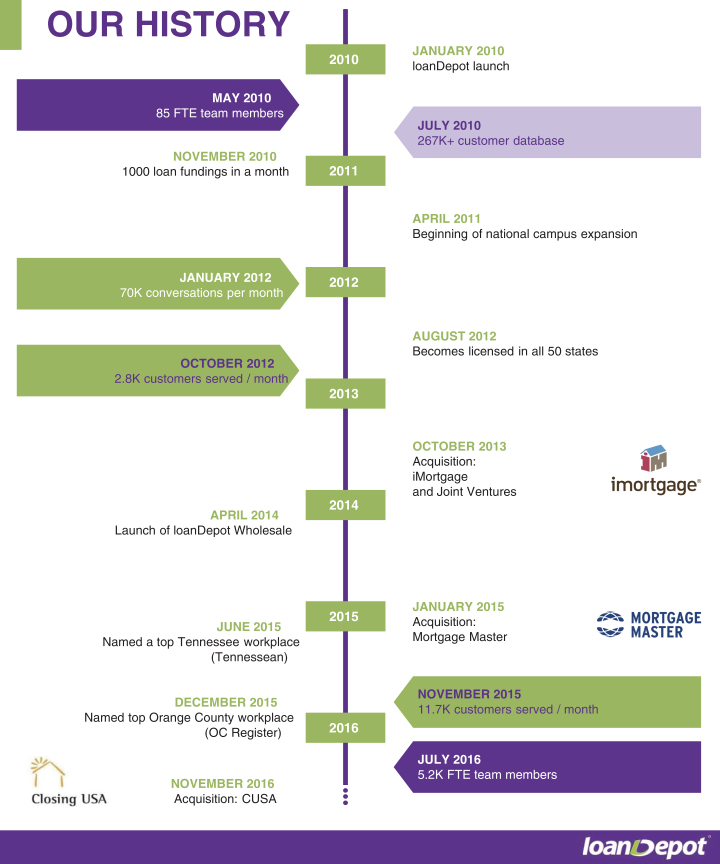
Table of Contents

Table of Contents
| Page | ||||
| 1 | ||||
| 22 | ||||
| 27 | ||||
| 30 | ||||
| 77 | ||||
| 79 | ||||
| 84 | ||||
| 85 | ||||
| 86 | ||||
| 88 | ||||
| 90 | ||||
| 96 | ||||
| MANAGEMENT’S DISCUSSION AND ANALYSIS OF FINANCIAL CONDITION AND RESULTS OF OPERATIONS |
105 | |||
| 146 | ||||
| 168 | ||||
| 174 | ||||
| 198 | ||||
| 205 | ||||
| 208 | ||||
| 218 | ||||
| 220 | ||||
| 224 | ||||
| 234 | ||||
| 234 | ||||
| 235 | ||||
| F-1 | ||||
i
Table of Contents
Through and including , 2021 (the 25th day after the date of this prospectus), all dealers effecting transactions in these securities, whether or not participating in the offering, may be required to deliver a prospectus. This is in addition to a dealer’s obligation to deliver a prospectus when acting as an underwriter and with respect to any unsold allotment or subscription.
Neither we, the selling stockholders nor the underwriters have authorized anyone to provide any information or to make any representations other than those contained in this prospectus or in any free writing prospectuses we have prepared. Neither we, the selling stockholders nor the underwriters take any responsibility for, nor can we or they provide any assurance as to the reliability of, any other information that others may give you. This prospectus is an offer to sell only the shares offered hereby, but only under circumstances and in jurisdictions where it is lawful to do so. The information contained in this prospectus is current only as of its date. Our business, prospects, financial condition and results of operations may have changed since that date.
MARKET, INDUSTRY AND OTHER DATA
This prospectus contains statistical data and estimates, including those relating to market size, competitive position and growth rates of the markets in which we participate, that we obtained from our own internal estimates and research, as well as from industry and general publications and research, surveys and studies conducted by third parties. Industry publications, studies and surveys generally state that they have been obtained from sources believed to be reliable, although they do not guarantee the accuracy or completeness of such information. While we believe that each of these studies and publications is reliable, we have not independently verified market and industry data from third-party sources. While we believe our internal company research is reliable and the definitions of our market and industry are appropriate, neither this research nor these definitions have been verified by any independent source.
TRADEMARKS, SERVICE MARKS AND TRADE NAMES
We own the trademarks, service marks and trade names that we use in connection with the operation of our business, including our corporate names, logos and website names. This prospectus may also contain trademarks, service marks, trade names and copyrights of other companies, which are the property of their respective owners. Solely for convenience, the trademarks, service marks, trade names and copyrights referred to in this prospectus are listed without the TM, SM, © and ® symbols, but we will assert, to the fullest extent under applicable law, our rights or the rights of the applicable licensors, if any, to these trademarks, service marks, trade names and copyrights.
BASIS OF PRESENTATION
In this prospectus, unless otherwise noted or indicated by the context, references to terms such as ‘‘originate,’’ “facilitate,” ‘‘fund,’’ ‘‘provide,’’ ‘‘extend’’ or ‘‘finance’’ are to the generation of all of our loans, regardless of form and whether originated directly by us or facilitated from a third party.
The following industry terms are used in this prospectus unless otherwise noted or indicated by the context:
“Agencies” refers to the GSEs, FHA, FHFA and certain other federal governmental authorities;
“CFPB” refers to the Consumer Financial Protection Bureau;
“ECOA” refers to Equal Credit Opportunity Act;
“Fannie Mae” refers to the Federal National Mortgage Association;
ii
Table of Contents
“FHA” refers to the Federal Housing Administration;
“FHFA” refers to the Federal Housing Finance Agency;
“Freddie Mac” refers to the Federal Home Loan Mortgage Corporation;
“Ginnie Mae” refers to the Government National Mortgage Association;
“GSEs” refers to Government Sponsored Enterprises, namely Fannie Mae and Freddie Mac;
“HOEPA” refers to the Home Ownership and Equity Protection Act of 1994;
“HUD” refers to the Department of Housing and Urban Development;
“IRLCs” refers to interest rate lock commitments;
“LHFS” refers to loans held for sale;
“LTV” refers to loan-to-value;
“MBS” refers to mortgage-backed securities;
“MSR” refers to mortgage servicing rights;
“NPS” refers to “Net Promoter Score.” Net Promoter Score is calculated by subtracting the percentage of Promoters (ratings of 9 or 10) minus the percentage of Detractors (ratings of 6 or lower) on the question: How likely would you be to recommend us to a friend or colleague using a scale of 0 to 10 with 10 being highly likely?
“October Transactions” refers to (i) the repayment of our convertible debt facility of $75.0 million with cash on hand, (ii) the issuance of our $500.0 million of Senior Notes (as defined herein) and the application of the net proceeds therefrom, which were used to repay the borrowings under our unsecured term loan, pay down our secured credit facilities and for general corporate purposes, (iii) the borrowings under our Advance Receivables Trust (as defined herein) and (iv) the repurchase of all of the mortgage loans securing our 2018 Securitization Facility, which was subsequently repaid in full (the “October Transactions”);
“RESPA” refers to the Real Estate Settlement Procedures Act;
“TILA” refers to the Truth in Lending Act;
“UPB” refers to unpaid principal balance;
“VA” refers to the Department of Veterans Affairs; and
“Warehouse Lines” refer to the warehouse lines of credit that we use to finance most of our loan originations on a short-term basis.
Numerical figures included in this prospectus have been subject to rounding adjustments. Accordingly, numerical figures shown as totals in various tables may not be arithmetic aggregations of the figures that precede them.
All references to years in this prospectus, unless otherwise noted or indicated by the context, refer to our fiscal years, which end on December 31.
iii
Table of Contents
This summary highlights information contained elsewhere in this prospectus. Because this is only a summary, it does not contain all of the information that may be important to you. You should read this entire prospectus and should consider, among other things, the matters set forth under “Basis of presentation,” “Summary historical consolidated and condensed combined financial information,” “Risk factors,” “Selected historical consolidated financial information” and “Management’s discussion and analysis of financial condition and results of operations,” and our financial statements and related notes thereto appearing elsewhere in this prospectus before making your investment decision.
In this prospectus, unless otherwise noted or indicated by the context, the terms “loanDepot,” the “Company,” “we,” “our,” and “us” refer (1) prior to the consummation of the Offering Transactions described under “Organizational Structure—Offering Transactions,” to LD Holdings Group LLC (“LD Holdings”) and its consolidated subsidiaries, and (2) after the Offering Transactions described under “Organizational Structure—Offering Transactions,” to loanDepot, Inc., the issuer of the Class A Common Stock offered hereby, and its consolidated subsidiaries, including LD Holdings. The term “LDLLC” refers to our primary mortgage loan origination subsidiary, loanDepot.com, LLC. We refer to the members of LD Holdings (excluding LD Investment Holdings, Inc.) prior to the Offering Transactions, collectively as the “Continuing LLC Members.”
Our Company
loanDepot is a customer-centric, technology-empowered residential mortgage platform with a widely recognized consumer brand. We launched our business in 2010 to disrupt the legacy mortgage industry and make obtaining a mortgage a positive experience for consumers. We have built a leading technology platform designed around the consumer that has redefined the mortgage process. Our digital-first approach has allowed us to become one of the fastest-growing, at-scale mortgage originators in the U.S. We are the second largest retail-focused non-bank mortgage originator and the fifth largest overall retail originator, according to Inside Mortgage Finance. We originated $79.4 billion of loans for the twelve months ended September 30, 2020 and experienced 116% year-over-year origination volume growth for the nine months ended September 30, 2020.
Consumer-facing industries continue to be disrupted by technological innovation. The mortgage industry is no different with consumers expecting increased levels of convenience and speed. The residential mortgage market in the U.S. is massive—with approximately $11.0 trillion of mortgages outstanding as of September 30, 2020—and is largely served by legacy mortgage originators, which require consumers to navigate time-consuming and paper-based processes to apply for and obtain mortgage loans. mello®, our proprietary end-to-end technology platform, combined with our differentiated data analytics capabilities and nationally recognized consumer brand, uniquely positions us to capitalize on the ongoing shift towards at-scale, digitally-enabled platforms.
Our innovative culture and contemporary consumer brand represent key differentiators for loanDepot. We have fostered an entrepreneurial mindset and relentlessly deliver an exceptional experience to our customers. Our guiding principle is to delight our customers by exceeding their expectations. This has allowed us to achieve a Net Promoter Score (NPS) of 74 for the period between September 2017 and November 2020. We believe that we are one of only two non-banks with a nationally-recognized consumer brand in the U.S. retail mortgage origination industry. Since the Company’s launch in 2010, we have invested over $1.2 billion in marketing and the promotion of our brand, and we believe there are significant barriers-to-entry in creating a brand comparable to ours.
mello® drives streamlined customer experiences and operational efficiency throughout the entire lifecycle of a mortgage loan, including fully digital capabilities for customer acquisition, application, processing, and
1
Table of Contents
servicing. Our front-end interface is intuitive and user-friendly, driving high customer engagement and lower acquisition costs. We have nearly doubled our consumer direct conversion rates year-over-year for the nine months ended September 30, 2020 and our customer acquisition cost declined by 52% to $767 for the three months ended September 30, 2020 from $1,585 for the year ended December 31, 2017. Additionally, our customer acquisition cost declined by 33% to $890 for the nine months ended September 30, 2020 from $1,323 for the nine months ended September 30, 2019. We define customer acquisition cost as our marketing and advertising expense divided by closings per period. mello® also powers our back-end technology, automating and streamlining numerous functions for our customers, team members and partners. This has allowed us to reduce speed to funding loans by 12% between 2016 and the nine months ended September 30, 2020, thus enhancing the customer experience while driving increased profitability.
We are a data driven company. We utilize data from lead acquisition, digital marketing, in-market relationships, and our servicing portfolio to identify and acquire new customers and retain our existing customers. During the last twelve months, we have analyzed, enriched, and optimized more than 9 million customer leads with a deep understanding of each potential customer’s financial profile and needs. We also maintain mello DataMart, an extensive proprietary data warehouse of over 38 million contacts generated over our ten-year history. Our predictive analytics, machine learning and artificial intelligence drive optimized lead performance.
We leverage our brand, technology and data to serve customers across our two interconnected strategies: Retail and Partner. Our Retail strategy focuses on directly reaching consumers through a combination of digital marketing and more than 2,000 digitally-empowered licensed mortgage professionals. In our Partner strategy, we have established deep relationships with mortgage brokers, realtors, joint ventures with home builders, and other referral partners. These partnerships are valuable origination sources with lower customer acquisition costs. Our technology is a key component of the value proposition to these partner relationships, allowing us to integrate directly into our partners’ native systems. We maintain integrated referral relationships with several leading brands, including a partnership with one of the 10 largest U.S. retail banks by total assets. During 2019, our Retail strategy produced 72% of our origination volume, with our Partner strategy representing the remaining 28%.
Our digital-first approach across our Retail and Partner strategies leverages the power of mello® to create a streamlined experience for consumers. Our predictive models route leads to the right loan officer at the right time to optimize the consumer’s experience and best serve their needs. Based on each consumer’s needs and preferences, leads are directed to in-house or in-market loan officers, team members at our centralized operations locations, or our digital self-service platform. Our in-market loan officers are able to leverage their long-term relationships as well as our proprietary mello® platform and loanDepot brand, driving improved profitability per loan officer.
2
Table of Contents
Our national brand along with our expertise in digital marketing, big data and marketing analytics, not only drives new customer acquisition, but also maximizes retention and customer lifetime value. We leverage these capabilities to “recapture” existing customers for subsequent refinance and purchase transactions. Our recapture rates are among the highest in the industry—for the nine months ended September 30, 2020, our organic refinance consumer direct recapture rate was 61% highlighting the efficacy of our marketing efforts and the strength of our customer relationships. This compares to an industry average refinance recapture rate of only 18% for the three months ended September 30, 2020 according to Black Knight Mortgage Monitor. In addition, we achieved an overall organic recapture rate of 47% for the nine months ended September 30, 2020. Our recapture originations have lower customer acquisition costs than originations to new customers, positively impacting our profit margins.
We have significantly increased our originations market share from 1.0% in 2014 to 2.6% for the first nine months of 2020, and our strong consumer brand and proprietary technology platform have positioned us to continue gaining additional share. Our Retail and Partner strategies have led to a balanced mix of purchase and refinance mortgages, with purchase originations representing 41% of total originations in 2019. We have a well-defined plan to accelerate this growth by expanding upon our technological and brand advantages, growing our market share in both purchase and refinance markets, and further increasing customer retention and lifetime value. Secular demographic and housing market tailwinds provide further support for our competitive advantages.
Our platform and technology create a significant financial advantage. Our brand effectiveness and marketing capabilities optimize our customer acquisition costs, and our automation reduces unnecessary expenses throughout the origination process. We are able to scale quickly and efficiently which allows us to grow both transaction volume and profitability. During the COVID-19 pandemic, our technology platform and culture enabled us to hire, train and onboard over 3,500 new team members remotely. Our growth and profitability during the last nine months is further evidence of the scalability of our platform and validates the investments we have made in our brand and our technology. For the nine months ended September 30, 2020, we generated $63.4 billion in originations (116% year-over-year growth), $3.0 billion in revenue (227% year-over-year growth), $1,465.9 million in net income and $1,085.9 million in adjusted net income, making us one of the fastest-growing and most profitable companies in our industry.
3
Table of Contents
Market Opportunity
Largest consumer asset class in the United States
According to the Federal Reserve, residential mortgages represent the largest segment of the broader U.S. consumer finance market. One-to-four family residential mortgage origination volume is expected to be $2.7 trillion in 2021 according to Fannie Mae. According to the Mortgage Bankers Association (the “MBA”), there was approximately $11.0 trillion of residential mortgage debt outstanding in the U.S. as of September 30, 2020, which is forecasted to increase to $12.2 trillion by the end of 2022 according to the MBA. The chart below presents the total U.S. one-to-four family residential mortgage originations and forecasts for the periods indicated.
One-to-Four Family Mortgage Originations
($ in trillions)
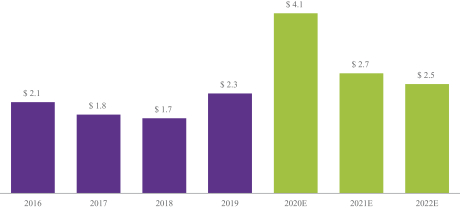
Source: Historicals per MBA. Mortgage Forecast per Fannie Mae as of November 2020.
Technology-enabled disruptors continue to capture market share in an industry that remains highly fragmented
Technology-enabled disruptors continue to gain share in the highly fragmented residential mortgage origination market. We more than doubled our market share since 2014 while other technology-enabled non-banks have also grown share as consumers increasingly prefer technology-driven mortgage solutions. Independent technology-enabled disruptors, by better serving the needs of consumers as compared with legacy providers, are well positioned to capitalize on the broader shift in the mortgage market from banks to non-banks—from 2008 through the nine months ended September 30, 2020, non-banks increased their share of the top 50 mortgage originators from 22% to 69% according to Inside Mortgage Finance. The mortgage origination market remains highly fragmented with the top five originators representing only 26% of total originators in the nine months ended September 30, 2020 according to Inside Mortgage Finance. This fragmentation leaves a significant opportunity for market participants with scaled consumer brands and disruptive technology to continue to consolidate share.
High barriers of entry for building a scaled and innovative contemporary mortgage company
The barriers to building a technology-driven, contemporary mortgage company with a nationally-recognized brand are significant. In order to reach a 2.6% market share for the nine months ended September 30, 2020, we have invested over $1.2 billion over the course of more than 10 years in marketing and promotion our brand. We
4
Table of Contents
have accumulated more than 10 years of proprietary data on consumer behavior that we use to optimize our marketing efforts and the customer experience. We have assembled a management team with a unique combination of skillsets that we believe is difficult for competitors to replicate. These skillsets include a deep understanding of the mortgage industry, technology development, digital marketing, and data capture and analytics. Our scale and widely recognized brand leads to a virtuous cycle of growth, increased data, and further investments in our brand and technology platform.
The challenging nature of building a technology-enabled residential mortgage platform that provides exceptional customer experiences is evidenced by the large differential between the NPS scores of technology-focused disruptors compared to the rest of our industry. We believe we are one of only two contemporary, non-bank retail mortgage originators operating at scale in the United States. Both we and our largest competitor have net promoter scores that exceed 70. Increasing consumer demands for higher quality experiences creates a significant opportunity for contemporary mortgage brands to continue gaining market share.
Numerous secular tailwinds supporting continued market growth
Historically low 30-year fixed mortgage rates are continuing to drive strong demand for both purchase and refinance mortgages. The Federal Reserve forecasts that the federal funds rate will remain below 0.25% through 2022. At current market rates, over 95% of existing mortgages are “in-the-money” (meaning borrowers are able to benefit from refinancing their mortgage), representing total industry refinance opportunity of over $10 trillion based on management estimates. These factors have led Fannie Mae to forecast $1.1 trillion in mortgage refinance origination volume in 2021.
Additionally, housing market growth has been supported by the growth of the millennial demographic. Millennials now represent 73% of first time home buyers according to the National Association of Realtors. This demographic shift has helped drive a steady growth in purchase originations over time, increasing every year since 2011.
Our Strengths
Innovative Workplace and Customer-Centric Culture
Since our founding in 2010, we have fostered a culture focused on continuous innovation and customer-centricity. Our innovation-oriented culture has driven us to transform and simplify the mortgage process, while leveraging our vast data capabilities to provide a superior customer experience. Our approach has resulted in our industry-leading platform that is disrupting the mortgage industry by combining cutting-edge proprietary technology, mortgage industry expertise, marketing capabilities, and data analytics in a way that is fundamentally different from legacy mortgage providers.
Our commitment to customer service permeates our entire organization and is a central component in team member training and mentorship across the company. We utilize an innovative approach to provide daily customer feedback to our team members. We provide our team members dashboards that push daily customer feedback to ensure continued improvement in the experience for our consumers. Our founder, Chairman, and CEO, Anthony Hsieh, also fosters an open door environment and hosts intimate CEO Connect forums, during which team members have a dialogue around innovation and customer experiences. We treat recruiting, onboarding, training and retaining team members as one of our “primary business lines,” to identify, mentor, and promote the best talent.
Our relentless focus on and success in delivering exceptional customer experiences is evidenced by our NPS score of 74 for the period between September 2017 and November 2020. As further evidence of this
5
Table of Contents
commitment, our initial inbound customer contact answer time is generally answered in as little as one second. These metrics demonstrate our commitment to putting our customers’ needs first.
Well-recognized Brand and Data-Driven Marketing Capabilities
Since our founding in 2010, we have invested over $1.2 billion in marketing and the promotion of a leading, contemporary consumer brand—we believe we have the second most recognized consumer brand among non-bank mortgage originators, with more brand momentum than any other company. We have a multi-faceted marketing strategy, which includes both lead aggregation and a vast media presence. Our media strategy includes traditional elements including television, display advertisement, and published media as well as a significant social media presence and other contemporary approaches. We have proven our ability to build a strong brand based on the quality of our business and our commitment to excellent customer service. We believe that this approach to brand-building allows us to amplify our brand through both traditional elements in addition to our wide following on social media, published media coverage, and earned media mentions.
Recently, we introduced national television campaigns that feature our passionate team members and showcase our customer-centric culture. Our “Home Means Everything” television campaign was launched on May 4, 2020 and generated more than 3.5 billion impressions through October 31, 2020. This has helped drive our continued growth in national brand awareness among consumers. We also had approximately 1.5 million visits to loandepot.com in the month of October 2020. Our nationally recognized loanDepot brand has increased our ability to generate customer leads and has helped us become the second largest retail-focused non-bank mortgage originator with a 2.6% market share for the nine months ended September 30, 2020. We believe that our focus on providing a superior consumer experience is the best way for us to continue building our brand and extend the lifetime value for our customers.
The loanDepot brand is supported by our innovative, data science-based approach to marketing and customer acquisition, powered by our proprietary technology. We analyzed, enriched, and optimized more than 9 million new customer leads during the last twelve months ended September 30, 2020, and have compiled a database of more than 38 million customer leads since our inception. Our innovative platform is highly scalable and we leverage our machine learning and predictive analytics capabilities to match the customer with the right loan officer, the right product, at the right time. We efficiently route leads to in-house and in-market loan officers based on a variety of factors, including readiness to purchase, geographic and behavioral data, as well as product fit. We are highly effective in engaging customers by phone, email, and text messaging. We interact and build relationships with our customers through our multi-channel social media presence. Our marketing approach leads to higher customer satisfaction, while lowering customer acquisition costs, which averaged $767 per loan for the three months ended September 30, 2020, representing a 52% decrease from $1,585 in 2017. Additionally, our customer acquisition cost declined by 33% to $890 for the nine months ended September 30, 2020 from $1,323 for the nine months ended September 30, 2019.
Our focus on brand loyalty, extensive data resources and analytics, and proactive marketing capabilities allow us to continue enhancing the customer experience beyond the initial loan origination. Our organic refinance consumer direct recapture rate of 61% for the first nine months of 2020, which measures our ability to “recapture” subsequent refinance mortgage business of borrowers from our servicing portfolio, is more than three times the industry average of 18% and highlights the efficacy of our marketing and data analytics efforts and the strength of our customer relationships. Additionally, our brand and marketing efforts represent significant value for our in-market loan officers, who also receive centrally-sourced leads from our servicing portfolio and direct marketing efforts, and thus do not have to rely solely on personal relationships, as is the case with legacy originators who are exclusively in-market focused.
6
Table of Contents
End-to-End Proprietary Technology Drives Growth, Efficiencies and a Differentiated Customer Experience
Our fully-integrated, proprietary mello® technology platform has been developed over the last 10-plus years as a purpose-built, next-generation platform to streamline the entire mortgage lifecycle by providing a seamless and efficient experience for our customers, team members and partners. We have spent over $400.0 million on our technology since inception and currently have a dedicated team of over 300 technology professionals focused on continuously improving our platform. mello® enables us to deliver superior results through optimized lead generation and analytics, our best-in-class front-end interface, efficient loan fulfillment and enhanced customer lifecycle engagement.
Analyze, Enrich and Optimize Leads: Our machine-learning-based models and analytics drive lead generation and optimization. We have a massively scalable lead generation and ingestion engine with billions of data enrichment points. Our machine learning programs utilize sophisticated algorithms to drive dynamic marketing campaigns and optimize our ability to reach prospective high value consumers, resulting in an average cost per loan associated with our mortgage variable expenses of $3,582, representing a 8% decrease from 2017 to the three months ended September 30, 2020. We are able to route our approximately 23,000 leads per day to the ideal loan officers holding the applicable license who can respond within seconds. Our average monthly closings per licensed loan officer increased 89% to 10.7 for the three months ended September 30, 2020 from 5.7 for the year ended December 31, 2017. Additionally, average monthly closings per licensed loan officer increased 66% to 8.8 for the nine months ended September 30, 2020 from 5.3 for the nine months ended September 30, 2019.
Front-end Consumer Experience: We have created a customized front-end experience to offer an efficient and user-friendly interface across mobile, web, and person-to-person interactions, enabling us to deliver industry-leading customer service to every borrower, regardless of channel and customer preferences and needs. No matter the level of our consumer’s technological background, we are able to deliver a best-in-class customer experience through the breadth of our user interface platform.
Loan Fulfillment and Execution: Our end-to-end loan execution solutions are designed to deliver efficiencies across our organization, reducing the time to close a loan, lowering fulfillment costs, and driving a superior customer experience. With mello®, completing a mortgage process has never been simpler. Our data-first approach is focused on automatically collecting key inputs and data in lieu of requiring additional documents. We have automated condition population and condition clearance approaches that drive increased efficiency. Our nearly fully paperless underwriting process and data-first integration with third-party data providers has increased our data integrity for every loan. Paired with our proprietary artificial intelligence software, we are able to engage in over 5,000 discrete intelligent actions on every loan file. We have automated task-triggers based on the consumer data provided delivering increased visibility to our consumers.
Customer Lifecycle Engagement: Our proprietary marketing technology, along with our differentiated strategy, maximizes consumer engagement throughout the customer life cycle. Our predictive models route leads to the right loan officer at the right time to optimize the consumer’s experience and best serve their needs. Through automated notifications, streamlined processes, and numerous communication mediums, our customers experience a revolutionary mortgage experience that saves time, is transparent, and is optimized to exceed their rising expectations. Our technology triggers real-time prompts for specific client interactions and engagement based on individual user behavior. We utilize machine learning-based predictive modeling to target borrowers who qualify for loan modifications and refinancing transactions, offer complementary home services to customers, improve our product fit and pricing engine, and expedite loan processing.
7
Table of Contents
Retail and Partner Strategies Powered by Single Proprietary Technology Platform Leading to Best-in-Class Efficiency
Our digital-first approach across our Retail and Partner strategies is powered by our single proprietary technology platform, mello®. In our Retail strategy, mello® routes leads to the right loan officer at the right time to optimize the consumer’s experience and best serve their needs. Based on each consumer’s needs and preferences, leads are directed to in-market loan officers or team members at our centralized operations. For our Partner strategy, mello® provides seamless technology experience and fulfillment services to brokers and joint venture partners. Our single proprietary technology has led to superior user experiences and higher efficiencies for our platform.
We believe our ability to leverage our mello® technology platform will allow us to grow share through our Retail and Partner strategies that will continue to generate enhanced returns and allow us to further invest in our brand, marketing and technology, creating a virtuous cycle that will allow us to consistently deliver above market growth and attractive returns to our shareholders.
Experienced, Founder-Led Management Team with Industry-Leading Skillsets
Anthony Hsieh, our founder, Chairman and CEO, is recognized as continuously disrupting the existing mortgage and lending model and driving the evolution of the industry as a whole. A self-made entrepreneur, Hsieh founded loanDepot in 2010 with a commitment to responsible lending and a goal of exceeding customer expectations. This timing was courageous, as many lenders left the industry following the 2008 economic crisis.
Prior to founding loanDepot, Hsieh successfully established two other innovative mortgage companies. In 2002, he established HomeLoanCenter.com, the first online lender to offer a full spectrum of home loan products in all 50 states. HomeLoanCenter.com featured live interest rate quotes and loan offerings that were tailored to borrower needs and credit profiles. Hsieh continued to lead the business for three years after merging with IAC/Interactive subsidiary LendingTree in 2004. In 1989, Hsieh acquired a mortgage brokerage company which he transformed into LoansDirect.com, taking advantage of the upswell of activity surrounding the debut of internet-based commerce. The company remained one of the most profitable and successful mortgage lenders through the 1990s, and was acquired by E*TRADE Financial in 2001.
Hsieh’s vision and leadership is well-recognized. He was named Asian Real Estate Association of America Person of the Year in 2017 and the 2018 Executive of the Year by LendIt Fintech. In addition, Hsieh has been an important national voice for the lending industry, having appeared on Fox News, CNBC and Bloomberg TV, among other national outlets.
At loanDepot, we have assembled a senior management team with an outstanding vision, passion for innovation, focus on the customer, and mortgage industry expertise. The loanDepot executive team has on average more than 25 years of industry experience; many of these individuals, as well as other members of the broader team, have worked with Hsieh for years, and notably, were side by side with him at the advent of the digital mortgage, giving the overall team a unique and decisive advantage in today’s marketplace.
The loanDepot team is deep and diverse, with unparalleled experience in building and running successful technology-empowered consumer-driven businesses. They also possess exceptional expertise across a variety of disciplines, including technology platform development, customer acquisition and marketing, data analytics, brand building, mortgage originations, and capital markets. This team, led by Hsieh, has a proven track record of building and managing best-in-class businesses.
8
Table of Contents
High-Growth, Profitable Financial Profile
We believe our brand, platform and technology create a significant financial advantage. Our brand effectiveness and marketing capabilities optimize our customer acquisition investments and our automation reduces unnecessary costs across the origination process. We can scale quickly and efficiently which allows us to grow both transaction volume and profitability.
For the nine months ended September 30, 2020, we generated $3.0 billion in adjusted revenue and $1,085.9 million in adjusted net income. Over the same time period, our total net revenue was $3.0 billion and our net income was $1.47 billion. We have grown originations from $29.3 billion in the first nine months of 2019 to $63.4 billion in the first nine months of 2020, representing 116% growth—the fourth highest growth rate over this period among the top 15 mortgage lenders, according to Inside Mortgage Finance. We have organically grown our high-quality servicing portfolio from $30.6 billion at September 30, 2019 to $77.2 billion at September 30, 2020, representing 153% growth—the third highest growth rate over the period among the top 50 mortgage servicers, according to Inside Mortgage Finance. Adjusted revenue and adjusted net income are non-GAAP financial measures. For a reconciliation of these non-GAAP measures to their most comparable U.S. GAAP measures, see “Selected Historical Consolidated Financial Data—Reconciliation of Non-GAAP Measures.”
Our Strategies for Growth
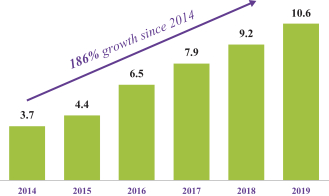
We have demonstrated our ability to grow our business and market share, having grown from a de novo start-up in 2010 to the second largest non-bank retail originator in the U.S. with a 2.6% share of a $11.0 trillion mortgage market as of September 30, 2020. We believe that we are well positioned to continue our market share growth through both our Retail strategy, where we have invested in our team members and technology to enable rapid scaling, and our Partner strategy, where independent brokers, in addition to joint venture and integrated referral partners, increasingly choose to work with us based on our reputation for excellent customer service and seamless user experiences. Our growth has accelerated in recent quarters as our long-term investments in brand marketing and innovative technology have helped us achieve industry-leading growth and profitability.
loanDepot Originations
($ in billions)
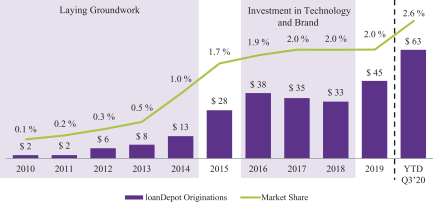
Source: Market share per MBA volumes.
9
Table of Contents
We believe that continuing to make these investments will allow us to grow market share, increase customer retention and deliver enhanced returns that will ultimately enable a virtuous cycle of further investment and returns. We intend to grow by executing on the following key strategies:
Expand Upon Our Already Significant Top-of-Funnel Reach
Our continued investments in building a significant top-of-funnel reach supported by advanced data analytics will allow us to grow market share in any economic environment. Our platform attracts customers through a variety of means including: digital leads, affiliate relationships, brand recognition, social media engagement, local in-market relationships, and existing customer retention.
Our technology and data analytics have allowed us to cultivate an increasing number of leads with higher lead conversion over time. We have analyzed, enriched and optimized more than nine million leads during the last twelve months ended September 30, 2020, a 14% increase since 2017. Our mello® technology takes in these leads and ingests billions of data enrichment points resulting in better data segmentation and lead routing becoming a more efficient customer acquisition tool. Our conversion rates in consumer direct have nearly doubled year-over-year for the nine months ended September 30, 2020.
We are able to increase our reach through joint venture and integrated referral partners, including one of the ten largest U.S. retail banks, that provide exclusive leads to our origination platform. Our partners are valuable sources of high-quality customers and our technology enables us to source customers directly from within a partner’s customer portal, amongst other highly integrated functionality. We are able to effectively leverage the traffic provided from these relationships to broaden our reach and expand upon our brand.
Client Leads by Year (in millions)
Continue to Grow our Brand Leveraging Our Marketing Capabilities
We believe the loanDepot brand is one of only two nationally-scaled non-bank mortgage brands in the U.S., representing a distinguished and long-lasting advantage over other market participants.
We plan to continue to enhance our brand through investments in digital marketing, our social media presence and traditional media advertising, as well as continued development of our data science capabilities. Our “Home Means Everything” television marketing campaign represents a significant opportunity to build upon our strong momentum, reach a large potential customer base, and continue to increase our brand awareness. The campaign continues to run nationwide and we believe we will generate more than 5 billion impressions in the fourth quarter.
10
Table of Contents
We intend to continue to actively manage our social media presence and loanDepot.com website traffic, which have historically generated high levels of consumer engagement. We believe our social media engagement is industry-leading. The number of loanDepot.com average daily sessions have increased 69% year-over-year for the nine months ended September 30, 2020.
Expand Upon our Data Analytics Advantage
We have invested in building out a leading technology platform that leverages data science, artificial intelligence and machine learning. We will continue to invest significantly in these capabilities to further enhance the customer experience throughout the lifecycle of a loan, reduce the costs of acquiring customers and processing new loans and increase customer retention.
Machine learning and AI processes work best with large amounts of data, and large amounts of data are incomprehensible without the power harvested through machine learning and AI. Our proprietary data warehouse, mello DataMart, presents a unique and growing advantage boosted by our over 38 million unique individuals and nearly 100 million consumer interactions captured. Through these data points, we are able to refine our lead generation capabilities, which allow us to route approximately 90% of our leads within 5 seconds to optimize execution.
melloMarket360 is a market intelligence platform that we have developed to provide loan officers with up-to-date information on real estate activity in their area and market intelligence on competing loan officer productivity. melloMarket360 leverages real estate mortgage data and analytics across realtors, builders and originators in local communities, allowing loan officers to research every aspect of their market and tailor their sales and marketing approach to match consumer demand. Our melloMarket360 technology helps loan officers prepare for meetings with realtors, add value to existing realtor relationships, and develop new relationships with builders. In addition to enhancing productivity of our existing loan officers, melloMarket360 has become a powerful recruitment tool for loanDepot to attract talented new loan officers who can leverage our resources to significantly increase their productivity. Over time, loanDepot’s reservoir of data will continue to expand, and the melloMarket360 platform will become even more powerful and easier to use.
melloClear, our proprietary underwriting engine, helps decrease our labor capacity utilization by approximately 55%. We believe that our underwriting capabilities will continuously improve as we increase data integrations with technology partners and agencies to automate inputs, such as income, employment, and asset verification, and enhance processing speeds. Through continued investment and innovation, we are well positioned to attract new customers, recruit top loan officers to our platform, and increase the efficiency in which we meet all users’ needs.
11
Table of Contents
Leverage our Local Presence to Profitably Take Share in Varying Market Environments
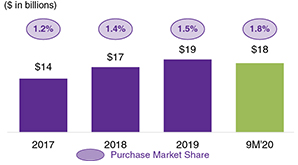
We offer our customers the opportunity to interact with both our digital-first online resources and our in-market, relationship-based loan officers. Our network of in-market loan officers has helped us build a strong presence in the purchase market, which accounted for 41% of our total originations in 2019. Homebuyers—even younger generations—overwhelmingly prefer the high-touch, personalized service provided by local mortgage professionals. According to a 2019 Ellie Mae study, 79% of millennial and 78% of generation X consumers reported meeting with their lender in person “often” or “sometimes”. Our partnerships with builders, realtors and other companies close to the home-buying decision also serve as a consistent source of purchase volume.
Steady Purchase Volume Growth
|
|
Increase Customer Retention and Lifetime Value
We expect to drive higher customer retention and lifetime value by leveraging our technology-driven marketing capabilities, data and customer service to attract repeat customers for refinance transactions and loanDepot’s ancillary homeowner services, which include settlement services, real estate broker services, and insurance services.
Our expertise in marketing, predictive analytics, and continuous customer engagement enable us to proactively identify our customers who may benefit from a refinance transaction. Our ability to market effectively to our existing customers is further supported by our growing servicing portfolio. In 2012, we made the strategic decision to begin retaining the servicing on a portion of our loan originations, and our servicing portfolio reached $77.2 billion in unpaid principal balance (“UPB”), representing over 272,000 customers, as of September 30, 2020. During the nine months ended September 30, 2020, we retained servicing on 86% of loans sold.
12
Table of Contents
Industry-Leading Recapture Rates
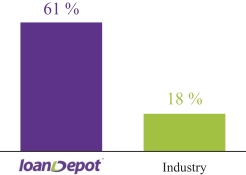
|
Owning the customer relationship across the mortgage lifecycle, including originations, servicing, and ancillary products, strengthens our customer relationships and provides us with better data to market new products and services to our existing customers. We have one of the highest organic refinance consumer direct recapture rates in our industry at 61% in our consumer direct for the nine months ended September 30, 2020, as compared to the industry-average of 18% for the three months ended September 30, 2020. As a natural evolution of our strategy, we intend to move our servicing operations from a sub-servicer relationship to our in-house servicing platform, further strengthening customer relationships and further increasing recapture rates. We believe that we will continue to deliver strong customer retention and generate attractive lifetime values by providing services across the homeowner ecosystem and throughout the lifecycle of a mortgage loan.
Corporate Information
loanDepot, Inc. was incorporated on November 6, 2020 and has had no business transactions or activities and had no material assets or liabilities prior to the Reorganization Transactions and this offering. Our principal executive offices are located at 26642 Towne Centre Drive, Foothill Ranch, California 92610. Our telephone number is (888) 337-6888. The address of our main website is www.loandepot.com. The information contained on or accessible through our website does not constitute a part of this prospectus.
Recent Developments
While the financial markets have demonstrated significant volatility due to the economic impacts of COVID-19, interest rates have fallen to historic lows resulting in increased mortgage refinance originations and favorable margins. Our efficient and scalable platform has enabled us to respond quickly to the increased market demand. Market demand in 2020 was driven by a prolonged period of historically low interest rates. This demand contributed to gain on sale margins reaching levels that the Company does not believe will be sustained in future years and could result in decreases in revenue. We have highlighted below the key steps we have undertaken since the onset of the pandemic to position our platform for continued success:
| • | Materially increased our tangible net worth to $1.5 billion, as of November 30, 2020. |
| • | Increased our total loan funding capacity to $7.7 billion with our current lending partners. |
| • | Achieved record monthly origination volume of $11.8 billion in November 2020. |
| • | Stepped up protocols related to verification of key metrics such as employment and income to help ensure the highest quality underwriting standards are maintained. |
| • | Announced 97% of our workforce may continue working remotely through at least January 2021. |
13
Table of Contents
As a servicer, we are required to advance principal and interest to the investor for up to four months on GSE backed mortgages and longer on other government agency backed mortgages on behalf of clients who have entered a forbearance plan. As of November 30, 2020, 3%, or $2.3 billion UPB, of our servicing portfolio was in active forbearance. The following charts show the progression of forbearance requests in our servicing portfolio following the passage of the CARES Act on March 27, 2020.
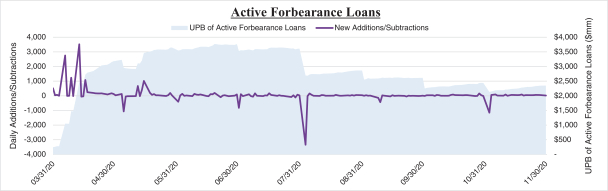
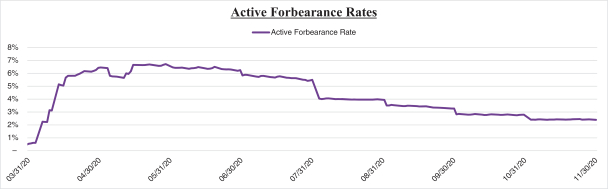
While these advance requirements may be significant at higher levels of forbearance, we believe we are very well-positioned in terms of our liquidity. As of November 30, 2020, we had $429.9 million of cash and cash equivalents. We will continue evaluating the capital markets as well, which would further supplement our liquidity should the need arise.
While we currently engage third-parties as subservicers, we plan to bring servicing operations in-house in 2021, recognizing that, as we have continued to grow, an internal servicing operation would lower servicing costs and further optimize the performance of our MSR portfolio.
On October 1, 2020, we declared profit distributions of $175.0 million to certain of our unitholders as allowed under the Company’s operating agreement (the “Sponsor Distribution”), which will reduce our tangible net worth.
Throughout October 2020, we consummated the October Transactions, which included (i) the repayment of our convertible debt facility of $75.0 million with cash on hand, (ii) the issuance of $500.0 million of our 6.500% Senior Notes due 2025 and the application of the net proceeds therefrom, which were used to repay the borrowings under our unsecured term loan, pay down our secured credit facilities and for general corporate purposes, (iii) the issuance of the 2020-VF1 Notes by our Advance Receivables Trust which permits us to finance up to $130.0 million of servicing advance receivables with respect to residential mortgage loans serviced by us on behalf of Fannie Mae and Freddie Mac and (iv) the repurchase of all of the mortgage loans securing our 2018 Securitization Facility, which was subsequently repaid in full.
14
Table of Contents
Also in October 2020, the Company issued notes through an additional securitization facility (“2020-1 Securitization Facility”) backed by a revolving warehouse line of credit. The 2020-1 Securitization Facility is secured by newly originated, first-lien, residential mortgage loans eligible for purchase by Fannie Mae and Freddie Mac for the purchase of mortgage loans or in accordance with the criteria of Ginnie Mae for the guarantee of securities backed by mortgage loans. The 2020-1 Securitization Facility issued $600.0 million in notes and certificates that bear interest at 30-day LIBOR plus a margin. The 2020-1 Securitization Facility will terminate on the earlier of (i) the two-year anniversary of the initial purchase date, (ii) upon the Company exercising its right to optional prepayment in full and (iii) the date of the occurrence and continuance of an event of default.
In November 2020, the Company declared profit distributions of $278.8 million to certain of its unitholders as allowed under the Company’s operating agreement. This distribution satisfied the $53.8 million of outstanding Shareholder Notes (as defined below) and the remaining $225.0 million was distributed in cash. In addition to the distributions described below, we expect to make similar distributions of approximately $146.2 million before April 30, 2021.
In December 2020, the Company distributed $71.1 million to its unitholders based on their estimated tax liability. In accordance with the Company’s operating agreement, unitholders are entitled to receive distributions equal to their estimated tax liability.
In December 2020, the Company issued notes through a new securitization facility (“2020-2 Securitization Facility”) backed by a revolving warehouse line of credit. The 2020-2 Securitization Facility is secured by newly originated, first-lien, fixed rate residential mortgage loans eligible for purchase by the GSEs or in accordance with the criteria of Ginnie Mae for the guarantee of securities backed by mortgage loans. The 2020-2 Securitization Facility issued $500.0 million in notes and certificates that bear interest at 30-day LIBOR plus a margin. The 2020-2 Securitization Facility will terminate on the earlier of (i) the three year anniversary of the initial purchase date, (ii) upon the Company exercising its right to optional prepayment in full and (iii) the date of the occurrence and continuance of an event of default.
Prior to the closing of this offering, LD Holdings will distribute $6.2 million to its unitholders based on their estimated tax liability. In accordance with the Company’s operating agreement, unitholders are entitled to receive distributions equal to their estimated liability.
Also prior to the closing of this offering, LD Holdings will declare and distribute $152.8 million of profit and liquidating distributions to certain of its unitholders as permitted under LD Holdings’ operating agreement.
Preliminary Estimated Unaudited Financial Results for the Three Months and Fiscal Year Ended December 31, 2020
The information set forth below represents our preliminary estimated unaudited financial results for the periods presented, based upon information available to us as of the date of this prospectus, and is subject to revision based upon the completion of our year-end financial closing process as well as the related external audit of our results of operations for the fiscal year ended December 31, 2020. We have provided ranges, rather than specific amounts, for the financial results primarily because our financial closing procedures and the external audit for the fiscal year ended December 31, 2020 are not yet complete. During the course of the preparation of our financial statements and related notes and the completion of the external audit for the year ended December 31, 2020, additional adjustments to the preliminary estimated financial information presented below may be identified. Any such adjustments may be material. For these or other reasons, actual results for this period may differ materially from this preliminary estimated data. Additional factors that might cause differences include, but are not limited to, the matters described in the sections entitled “Cautionary Statement Regarding Forward-Looking Statements” and “Risk Factors.”
15
Table of Contents
Based upon such preliminary estimated financial results, we expect the financial metrics set forth below for the periods presented to be between the ranges set out in the following tables.
| Condensed Consolidated Statement of Operations Data: (Dollars in thousands) |
Preliminary Three Months Ended December 31, 2020 |
Preliminary Year Ended December 31, 2020 |
||||||||||||||
| Low | High | Low | High | |||||||||||||
| (estimated) | (estimated) | |||||||||||||||
| Originations(1) |
$ | 37,412,607 | $ | 37,412,607 | $ | 100,760,151 | $ | 100,760,151 | ||||||||
| Total net revenues |
1,259,442 | 1,324,362 | 4,273,222 | 4,338,142 | ||||||||||||
| Net income |
530,756 | 558,114 | 1,996,695 | 2,024,053 | ||||||||||||
| Adjusted total revenue(2) |
1,215,126 | 1,277,761 | 4,215,327 | 4,277,962 | ||||||||||||
| Adjusted EBITDA(2) |
511,981 | 538,371 | 2,066,153 | 2,092,543 | ||||||||||||
| Adjusted net income(2) |
362,603 | 381,294 | 1,448,494 | 1,467,185 | ||||||||||||
| Condensed Consolidated Balance Sheet Data: (Dollars in thousands) |
Preliminary Year Ended December 31, 2020 |
|||||||||||||||
| Low | High | |||||||||||||||
| (estimated) | ||||||||||||||||
| Cash and cash equivalents |
$ | 275,697 | $ | 289,908 | ||||||||||||
| Warehouse and other lines of credit |
6,380,106 | 6,708,978 | ||||||||||||||
| Debt obligations, net |
691,092 | 726,715 | ||||||||||||||
| Total equity |
1,606,642 | 1,689,459 | ||||||||||||||
| (1) | Represents the actual results for originations for the three and twelve months ended December 31, 2020. |
| (2) | To provide investors with additional information in addition to our results as determined by GAAP, we disclose Adjusted Total Revenue, Adjusted EBITDA and Adjusted Net Income as non-GAAP measures which management believes provide useful information to investors. These measures are not financial measures calculated in accordance with GAAP and should not be considered as a substitute for revenue, net income, or any other operating performance measure calculated in accordance with GAAP, and may not be comparable to a similarly titled measure reported by other companies. For purposes of this “Recent Developments” section, we have calculated Adjusted Total Revenue, Adjusted EBITDA and Adjusted Net Income in the same manner as for all other periods presented in this prospectus. See “Selected Historical Consolidated Condensed Financial Information —Reconciliation of Non-GAAP Measures” for a discussion of how we define and calculate Adjusted Total Revenue, Adjusted EBITDA and Adjusted Net Income and a discussion of why we believe these measures are important. |
| Reconciliation of Total Revenue to Adjusted Total Revenue (Unaudited): (Dollars in thousands) |
Three Months Ended December 31, 2020 |
Twelve Months Ended December 31, 2020 |
||||||||||||||
| Low | High | Low | High | |||||||||||||
| Total net revenue |
$ | 1,259,442 | $ | 1,324,362 | $ | 4,273,222 | $ | 4,338,142 | ||||||||
| Change in fair value of servicing rights(1) |
(15,864 | ) | (16,682 | ) | 89,672 | 99,212 | ||||||||||
| Net (gains) losses from derivatives hedging servicing rights(1) |
4,389 | 4,616 | (13,621 | ) | (15,070 | ) | ||||||||||
| Realized and unrealized (gains) losses from derivative assets and liabilities(2) |
(32,841 | ) | (34,534 | ) | (133,947 | ) | (144,322 | ) | ||||||||
|
|
|
|
|
|
|
|
|
|||||||||
| Change in fair value of servicing rights, net of hedging gains and losses(3) |
(44,316 | ) | (46,601 | ) | (57,895 | ) | (60,180 | ) | ||||||||
|
|
|
|
|
|
|
|
|
|||||||||
| Adjusted total revenue |
$ | 1,215,126 | 1,277,761 | 4,215,327 | 4,277,962 | |||||||||||
|
|
|
|
|
|
|
|
|
|||||||||
| (1) | Included in change in fair value of servicing rights, net in the Company’s consolidated statements of operations. |
16
Table of Contents
| (2) | Included in gain on origination and sale of loans, net in the Company’s consolidated statements of operations. |
| (3) | Represents the change in the fair value of servicing rights attributable to changes in assumptions, net of hedging gains and losses. |
| Reconciliation of Net Income to Adjusted EBITDA (Unaudited): (Dollars in thousands) |
Three Months Ended December 31, 2020 |
Twelve Months Ended December 31, 2020 |
||||||||||||||
| Low | High | Low | High | |||||||||||||
| Net income |
$ | 530,756 | $ | 558,114 | $ | 1,996,695 | $ | 2,024,053 | ||||||||
| Interest expense - non-funding debt(1) |
15,407 | 16,202 | 47,713 | 48,193 | ||||||||||||
| Income tax expense (benefit) |
766 | 804 | 2,227 | 2,255 | ||||||||||||
| Depreciation and amortization |
8,293 | 8,720 | 35,245 | 35,958 | ||||||||||||
| Change in fair value of servicing rights, net of hedging gains and losses(2) |
(44,316 | ) | (46,601 | ) | (57,895 | ) | (60,180 | ) | ||||||||
| Change in fair value - contingent consideration |
32,650 | 32,650 | ||||||||||||||
| Stock compensation expense and management fees |
1,076 | 1,131 | 9,518 | 9,613 | ||||||||||||
|
|
|
|
|
|
|
|
|
|||||||||
| Adjusted EBITDA |
$ | 511,981 | $ | 538,371 | $ | 2,066,153 | $ | 2,092,543 | ||||||||
|
|
|
|
|
|
|
|
|
|||||||||
| (1) | Represents other interest expense, which include amortization of debt issuance costs, in the Company’s consolidated statement of operations. |
| (2) | Represents the change in fair value of servicing rights attributable to changes in assumptions, net of hedging gains and losses. |
| Reconciliation of Net Income to Adjusted Net Income (Unaudited): (Dollars in thousands) |
Three Months Ended December 31, 2020 |
Twelve Months Ended December 31, 2020 |
||||||||||||||
| Low | High | Low | High | |||||||||||||
| Net income |
$ | 530,756 | $ | 558,114 | $ | 1,996,695 | $ | 2,024,053 | ||||||||
| Income tax expense |
766 | 804 | 2,227 | 2,255 | ||||||||||||
|
|
|
|
|
|
|
|
|
|||||||||
| Income before taxes |
531,522 | 558,919 | 1,998,922 | 2,026,309 | ||||||||||||
| Adjustments to income taxes (benefit)(1) |
136,808 | 143,860 | 514,503 | 521,573 | ||||||||||||
|
|
|
|
|
|
|
|
|
|||||||||
| Tax-effected net income(1) |
394,714 | 415,059 | 1,484,420 | 1,504,736 | ||||||||||||
| Change in fair value of servicing rights, net of hedging gains and losses(2) |
(44,316 | ) | (46,601 | ) | (57,895 | ) | (60,180 | ) | ||||||||
| Stock compensation expense and management fees |
1,076 | 1,131 | 9,518 | 9,613 | ||||||||||||
| Tax effect of adjustments(3) |
11,130 | 11,704 | 12,452 | 13,015 | ||||||||||||
|
|
|
|
|
|
|
|
|
|||||||||
| Adjusted net income |
$ | 362,603 | $ | 381,294 | $ | 1,448,494 | $ | 1,467,185 | ||||||||
|
|
|
|
|
|
|
|
|
|||||||||
| (1) | loanDepot, Inc. is subject to federal, state and local income taxes. Adjustments to income tax (benefit) reflects the effective income tax rates below: |
| Three Months Ended December 31, 2020 |
Twelve Months Ended December 31, 2020 |
|||||||
| Statutory U.S. federal income tax rate |
21.00 | % | 21.00 | % | ||||
| State and local income taxes (net of federal benefit) |
4.74 | 4.74 | ||||||
|
|
|
|
|
|||||
| Effective income tax rate |
25.74 | % | 25.74 | % | ||||
|
|
|
|
|
|||||
| (2) | Amounts represent the change in the fair value of servicing rights attributable to changes in assumptions, net of hedging gains and losses. |
17
Table of Contents
| (3) | Amounts represent the income tax effect of (a) change in fair value of servicing rights, net of hedging gains and losses and (b) stock compensation expense and management fees at the aforementioned effective income tax rates. |
Ernst & Young LLP has not audited, reviewed or performed any procedures with respect to the estimated preliminary financial information set forth above. Accordingly, Ernst & Young LLP does not express an opinion or any other form of assurance with respect thereto. These estimates are not a comprehensive statement of our financial results as of and for the three months and the fiscal year ended December 31, 2020, and should not be viewed as a substitute for full financial statements prepared in accordance with GAAP. In addition, these preliminary estimates as of and for the three months and the fiscal year ended December 31, 2020, are not necessarily indicative of the results to be achieved in any future period.
The estimated preliminary financial information described above constitute forward-looking statements. Our estimates of results are based solely on information available to us as of the date of this prospectus and are inherently uncertain. While we believe that such information and estimates are based on reasonable assumptions and management’s reasonable judgment, our actual results may vary, and such variations may be material. Factors that could cause the actual results to differ include the discovery of new information that affects accounting estimates, management judgment, or impacts valuation methodologies underlying these estimated results; the completion of our audit for the fiscal year ended December 31, 2020; our inability to realize cost savings on the timeline or in the amount we currently anticipate; and a variety of business, economic and competitive risks and uncertainties, many of which are not within our control, and we undertake no obligation to update this information. Accordingly, you should not place undue reliance on this estimated preliminary data. Our actual consolidated financial statements and related notes as of and for the year ended December 31, 2020 are not expected to be available until after this offering is completed. See “Management’s Discussion and Analysis of Financial Condition and Results of Operations,” “Risk Factors” and “Cautionary Statement Regarding Forward-Looking Statements.”
18
Table of Contents
ORGANIZATIONAL STRUCTURE
Following the offering, loanDepot, Inc. will be a holding company and its sole material asset will be an equity interest in LD Holdings. LD Holdings will also be a holding company and have no material assets other than its equity interests in its direct subsidiaries consisting of a 99.99% ownership in LDLLC (the major asset of the group), and 100% equity ownership in each of the following: Artemis Management LLC, (“Artemis”), LD Settlement Services LLC (“LD Settlement Services”) and mello Holdings LLC (“Mello”). Through its ability to appoint the board of managers of LD Holdings, which will have the ability to appoint the board of managers of LDLLC (our operating subsidiary that conduct most of our operations directly), and the other direct subsidiaries of LD Holdings (consisting of Artemis, LD Settlement Services, and Mello), loanDepot, Inc. will indirectly operate and control all of the business and affairs and consolidate the financial results of LD Holdings and its subsidiaries, including LDLLC.
Prior to the offering, the third amended and restated limited liability company agreement of LD Holdings (the “3rd Holdings LLC Agreement”) will be further amended (“4th Holdings LLC Agreement” or “Holdings LLC Agreement”) to, among other things, modify its capital structure by replacing the different classes of interests) with a single new class of Class A common units that we refer to as “LLC Units” which will be owned by the Continuing LLC Members.
In connection with the exchange transactions set forth above, we will issue to the Continuing LLC Members a number of shares of loanDepot, Inc. Class C Common Stock equal to the number of Holdco Units held by such Continuing LLC Members. Our Class B Common Stock will entitle holders thereof to one vote per share, and our Class C and Class D Common Stock with entitle holders thereof to five votes per share and each class will vote as a single class with our Class A Common Stock. However, the Class B and Class C Common Stock will not have any economic rights. Pursuant to the terms of the Holdings LLC Agreement, the Continuing LLC Members will have the right to exchange one Holdco Unit and one share of Class B Common Stock or Class C Common Stock, as applicable, together for cash or one share of our Class A Common Stock (at our election), subject to customary conversion rate adjustments for stock splits, stock dividends and reclassifications. Any Holdco Units exchanged under the exchange provisions described above will thereafter be owned by loanDepot, Inc. Any shares of Class B Common Stock and Class C Common Stock exchanged will be cancelled.
Thereafter, LD Investment Holdings, Inc. (“Parthenon Blocker”) and loanDepot, Inc. will engage in a series of transactions that will result in Parthenon Blocker merging with and into loanDepot, Inc., with loanDepot, Inc. remaining as the surviving corporation. As a result of such transactions, affiliates of Parthenon Capital Partners (the “Parthenon Stockholders”) will exchange all of the equity interests of Parthenon Blocker in return for shares of loanDepot, Inc. Class D Common Stock.
19
Table of Contents
The diagram below depicts our simplified organizational structure immediately following this offering and assuming no exercise by the underwriters of their option to purchase additional shares of Class A Common Stock. See “Organizational Structure.”
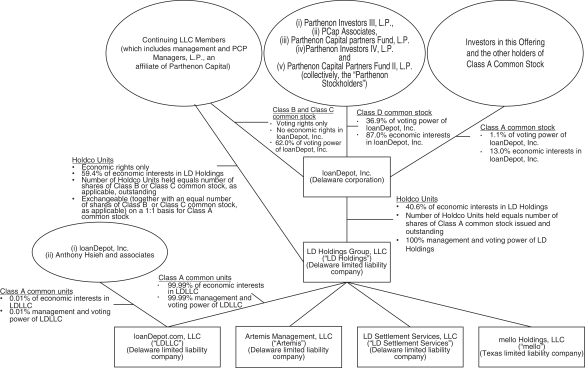
OUR SPONSOR
An affiliate of Parthenon Capital acquired its interest in us in December 2009, Parthenon Capital continues to hold a significant portion of the equity interest of LD Holdings. Parthenon Capital is a private equity investment firm with approximately $5.5 billion of capital under management as of November 2020. Parthenon Capital was founded in March 1998 and focuses on investing in select middle-market companies. The firm invests in a variety of industry sectors with particular expertise in business and financial services, healthcare, and technology-enabled services. The Parthenon Stockholders will participate as selling stockholders and receive net proceeds of approximately $105.1 million (or approximately $120.9 million if the underwriters exercise in full their option to purchase additional shares of Class A Common Stock) from the sale of their shares of Class A Common Stock (upon conversion of their shares of Class D Common Stock) in this offering, assuming an initial public offering price of $20.00 per share, which is the midpoint of the estimated price range set forth on the cover page of this prospectus.
20
Table of Contents
RISK FACTORS
Participating in this offering involves substantial risk. Our ability to execute our strategy also is subject to certain risks. The risks described under the heading “Risk factors” immediately following this summary may cause us not to realize the full benefits of our competitive strengths or may cause us to be unable to successfully execute all or part of our strategy. Some of the more significant challenges and risks we face include the following:
| • | the COVID-19 pandemic; |
| • | our recent rapid growth; |
| • | our ability to continue to grow our loan production volume; |
| • | the market’s acceptance of our new products and enhancements; |
| • | our ability to identify necessary and appropriate information technology system improvements; |
| • | our ability to successfully hedge changes in interest rates; |
| • | our ability to maintain our relationships with our subservicers; |
| • | challenges to the MERS system; |
| • | errors in our management’s estimates and judgment decisions in connection with matters that are inherently uncertain, such as fair value determinations; |
| • | the occurrence of a data breach or other failure of our cybersecurity; |
| • | the outcome of legal proceedings to which we are a party; |
| • | our home loan origination revenues are highly dependent on macroeconomic and U.S. residential real estate market conditions; |
| • | changes in federal, state and local laws, as well as changes in regulatory enforcement policies and priorities; |
| • | the multi-class structure of our common stock may adversely affect the trading market for our Class A Common Stock and will limit or preclude your ability to influence corporate matters; |
| • | our status as a “controlled company” and ability to rely on exemptions from certain corporate governance requirements; |
| • | certain provisions in our certificate of incorporation and our by-laws that may delay or prevent a change of control; and |
| • | the requirements of being a public company may strain our resources, divert management’s attention and affect our ability to attract and retain qualified board members and officers. |
21
Table of Contents
| Issuer |
loanDepot, Inc. |
| Class A Common Stock offered by us |
9,410,000 shares of Class A Common Stock (or 10,821,500 shares if the underwriters’ option is exercised in full). |
| Class A Common Stock offered by the selling stockholders |
5,590,000 shares of Class A Common Stock (or 6,428,500 shares if the underwriters’ option is exercised in full). |
| Underwriters’ option to purchase additional shares |
We and the selling stockholders have granted the underwriters a 30-day option to purchase up to an additional 2,250,000 shares of Class A Common Stock at the public offering price less underwriting discounts and commissions, of which 1,411,500 shares will be offered by us and 838,500 shares will be offered by the selling stockholders. |
| Common stock to be outstanding after giving effect to this offering and the use of proceeds to us therefrom |
17,207,649 shares of Class A Common Stock (or 19,457,649 shares if the underwriters’ option is exercised in full), including 15,000,000 (or 17,250,000 if the underwriters’ option is exercised in full) shares of Class A Common Stock (or shares if the underwriters’ option is exercised in full) to be sold in this offering and 2,207,649 vested restricted stock units of Class A common stock granted to employees in connection with the offering. If all outstanding Holdco Units and Class B and Class C Common Stock held by the Continuing LLC Members and Class D Common Stock held by the Parthenon Stockholders were exchanged for newly-issued shares of Class A Common Stock on a one-for-one basis, 325,000,000 shares of Class A Common Stock (or 325,000,000 fully diluted shares if the underwriters’ option is exercised in full) would be outstanding. |
| 0 shares of Class B Common Stock. |
| 193,091,469 shares (on a fully diluted basis) of Class C Common Stock (or 191,679,969 shares if the underwriters’ option is exercised in full), equal to one share per Holdco Unit (other than any Holdco Units owned by loanDepot, Inc.). |
| 114,700,882 shares of Class D Common Stock (or 113,862,382 shares if the underwriters’ option is exercised in full), equal to one share per Holdco Unit (other than any Holdco Units owned by loanDepot, Inc.). |
| Voting |
One vote per share of Class A and Class B Common Stock; Five votes per share of Class C and Class D Common Stock. All classes of common stock vote together as a single class unless otherwise required by law. Five years from the date of this offering, all shares of Class C and D Common Stock will be converted into shares of Class B and Class A Common Stock, respectively. As such, five years |
22
Table of Contents
| from the date of this offering all shares of our common stock will have one vote per share. |
| Voting power |
Each share of Class A Common Stock entitles its holder to one vote on all matters presented to our stockholders generally, representing an aggregate of 1.1% of the combined voting power of our issued and outstanding common stock upon completion of this offering (or 1.3% if the underwriters exercise in full their option to purchase additional shares of Class A Common Stock). |
| Each share of Class B Common Stock entitles its holder to one vote on all matters presented to our stockholders generally. Upon completion of this offering, no one will own any Class B Common Stock. |
| Each share of Class C Common Stock entitles its holder to five votes on all matters presented to our stockholders generally representing an aggregate of 62.0% of the combined voting power of our issued and outstanding common stock upon completion of this offering (or 61.9%, if the underwriters exercise in full their option to purchase additional shares of Class A Common Stock). Upon completion of this offering, certain Continuing LLC Members will own all of our outstanding Class C Common Stock. |
| Each share of Class D Common Stock entitles its holder to five votes on all matters presented to our stockholders generally, representing an aggregate of 36.9% of the combined voting power of our issued and outstanding common stock upon consummation of this offering (or 36.8%, if the underwriters exercise in full their option to purchase additional shares of Class A Common Stock). Upon completion of this offering, the Parthenon Stockholders will own all of our outstanding Class D Common Stock. |
| Holders of all outstanding shares of our Class A Common Stock, Class B Common Stock, Class C Common Stock and Class D Common Stock will vote together as a single class on all matters presented to our stockholders for their vote or approval, except as otherwise required by applicable law. See “Description of Capital Stock.” |
| Use of proceeds |
We estimate that the net proceeds to us from the offering will be approximately $168.2 million (or approximately $194.3 million if the underwriters exercise in full their option to purchase additional shares of Class A Common Stock), assuming an initial public offering price of $20.00 per share, which is the midpoint of the estimated price range set forth on the cover page of this prospectus, after deducting underwriting discounts and commissions and estimated offering expenses. We will not receive any proceeds from the sale of shares by the selling stockholders. |
23
Table of Contents
| We intend to use net proceeds of approximately $168.2 million together with cash on hand to purchase 9,410,000 Holdco Units, together with an equal number of shares of our Class B and Class C Common Stock, from certain owners of Holdco Units (the “Exchanging Members”), including our Chief Executive Officer and certain of our other officers (at a purchase price per unit and share of Class B and Class C Common Stock, based on the midpoint of the estimated price range set forth on the cover page of this prospectus, net of underwriting discounts and commissions). |
| If the underwriters exercise in full their option to purchase additional shares of Class A Common Stock, in addition to the use of our net proceeds as described above, we intend to use approximately $26.1 million of the net proceeds from our sale of additional shares together with cash on hand to purchase 1,411,500 Holdco Units, together with an equal number of shares of Class B and Class C Common Stock, from the Exchanging Members, including our Chief Executive Officer and certain of our other officers (at a purchase price per unit and share of Class B and Class C Common Stock, based on the midpoint of the estimated price range set forth on the cover page of this prospectus, net of underwriting discounts and commissions). If the underwriters exercise in full their option to purchase additional shares of Class A Common Stock, the remaining 838,500 shares will be sold by the selling stockholders, and we will not retain any proceeds from their sale of such shares. See “Use of Proceeds.” |
| Dividend policy |
Beginning with the first full quarter following the completion of this offering, we intend to pay a quarterly cash dividend on our common stock of $0.08 per share (or an annual dividend of $0.32 per share), and resulting in an annual yield of 1.6% based on a price of $20.00 per share, which is the midpoint of the estimated price range set forth on the cover page of this prospectus, subject to the discretion of our board of directors and our compliance with applicable law, and depending on, among other things, our results of operations, financial condition, level of indebtedness, capital requirements, contractual restrictions, including the satisfaction of our obligations under the TRA, restrictions in our debt agreements, business prospects and other factors that our board of directors may deem relevant. See “Dividend Policy.” |
| Controlled company |
Upon completion of this offering, we will be a “controlled company” under NYSE corporate governance standards. We intend to avail ourselves of the “controlled company” exemptions under the rules of the NYSE, including exemptions from certain of the corporate governance listing requirements. See “Management—Controlled Company.” |
| Listing |
We intend to list our Class A Common Stock on the NYSE under the symbol “LDI”. |
24
Table of Contents
| Exchange rights of the Continuing LLC Members |
Prior to the offering, we will conduct the reorganization described in “Organizational Structure” which will provide, among other things, that each Continuing LLC Member will have the right to cause us and LD Holdings to exchange its Holdco Units and Class B or Class C Common Stock for cash or shares of Class A Common Stock of loanDepot, Inc. on a one-for-one basis (at our election), subject to customary adjustment for stock splits, stock dividends and reclassifications. See “Certain Relationships and Related Party Transactions—Limited Liability Company Agreement of LD Holdings.” |
| Tax receivable agreement |
Our purchase of Holdco Units from the Exchanging Members using a portion of the net proceeds from this offering and any future exchanges of Holdco Units for cash or our Class A Common Stock pursuant to the exchange rights described above are expected to result in increases in loanDepot, Inc.’s allocable tax basis in the assets of LD Holdings. These increases in tax basis are expected to increase (for tax purposes) depreciation and amortization deductions allocable to loanDepot, Inc. and therefore reduce the amount of tax that loanDepot, Inc. otherwise would be required to pay in the future. This increase in tax basis may also decrease gain (or increase loss) on future dispositions of certain assets to the extent tax basis is allocated to those assets. We will enter into a tax receivable agreement with the Parthenon Stockholders and certain Parthenon affiliates owning Holdco Units of the Continuing LLC Members, whereby loanDepot, Inc. will agree to pay to such parties or their permitted assignees, 85% of the amount of cash tax savings, if any, in U.S. federal, state and local taxes that loanDepot, Inc. realizes or is deemed to realize as a result of these increases in tax basis, increases in basis from such payments and deemed interest deductions arising from such payments. Assuming no material changes in the relevant tax law and that we earn sufficient taxable income to realize all tax benefits that are subject to the tax receivable agreement, we expect that the tax savings associated with the purchase of Holdco Units from the Exchanging Members in connection with this offering and future exchanges of Holdco Units and Class B Common Stock as described above would aggregate to approximately $1,068.7 million over 15 years from the date of this offering based on an initial public offering price of $20.00 per share of our Class A Common Stock, which is the midpoint of the estimated price range set forth on the cover page of this prospectus, and assuming all future exchanges would occur one year after this offering. Under such scenario, we would be required to pay to the Parthenon Stockholders, Parthenon affiliates owning Holdco Units and certain of the Continuing LLC Members or their permitted assignees approximately 85% of such amount, or approximately $908.4 million, over the 15-year period from the date of this offering. If we were to elect to terminate the tax receivable agreement immediately after this offering, based on an initial public offering price of $20.00 per share of our Class A Common Stock, |
25
Table of Contents
| which is the midpoint of the estimated price range set forth on the cover page of this prospectus, we estimate that we would be required to pay approximately $961.6 million in the aggregate under the tax receivable agreement. See “Certain Relationships and Related Party Transactions—Tax Receivable Agreement.” |
| Risk factors |
Please read the section entitled “Risk factors” for a discussion of some of the factors you should carefully consider before deciding to invest in our Class A Common Stock. |
| Reserved Share Program |
At our request, the underwriters have reserved for sale, at the initial public offering price, up to 5% of the Class A common stock offered by this prospectus for sale to some of our directors, officers and employees through a reserved share program, or Reserved Share Program. If these persons purchase reserved shares, it will reduce the number of shares of Class A common stock available for sale to the general public. Any reserved shares of Class A common stock that are not so purchased will be offered by the underwriters to the general public on the same terms as the other shares of Class A common stock offered by this prospectus. See “Underwriting—Reserved Share Program.” |
In this prospectus, unless otherwise indicated or the context otherwise requires, the number of shares of Class A Common Stock outstanding and the other information based thereon:
| • | assumes an initial offering price of $20.00 per share, the midpoint of the estimated price range set forth on the cover of this prospectus; |
| • | assumes that the underwriters’ option to purchase 2,250,000 additional shares of Class A Common Stock from us and the selling stockholders is not exercised; |
| • | excludes 193,091,469 shares of Class A Common Stock issuable upon the exchange of 193,091,469 Holdco Units and an equal number of shares of Class B Common Stock and Class C Common Stock that will be held by the Continuing LLC Members immediately following this offering and the use of proceeds to us therefrom; and |
| • | excludes 14,123,387 shares of Class A Common Stock reserved as of the date of this prospectus for future issuance under the loanDepot, Inc. 2021 Omnibus Incentive Plan (the “2021 Omnibus Incentive Plan”) (including any equity based awards given as compensation to employees (“LTIP Units”), which may be granted thereunder) that have not yet been granted, but includes the 2,207,649 vested restricted stock units of Class A common stock to be granted to employees in connection with the offering (see “Executive Compensation 2021 Omnibus Incentive Plan—Available Shares”). |
26
Table of Contents
SUMMARY HISTORICAL CONSOLIDATED FINANCIAL INFORMATION
loanDepot, Inc. was incorporated in November 2020 in contemplation of the Reorganization Transactions, and, prior to the Reorganization Transactions, had no previous operations, assets or liabilities. The following tables present summary historical consolidated financial information for LD Holdings, our accounting predecessor, for the periods and as of the dates indicated. The summary consolidated statement of operations data presented below for the years ended December 31, 2019, 2018 and 2017 and the consolidated balance sheet data as of December 31, 2019, 2018 and 2017 are derived from the audited consolidated financial statements of LD Holdings included elsewhere in this prospectus. Our historical results are not necessarily indicative of future results and our interim results are not necessarily indicative of results to be expected for a full fiscal year period.
The summary consolidated statement of operations data presented below for the nine months ended September 30, 2020 and 2019 and the balance sheet data presented below as of September 30, 2020 and 2019 are derived from LD Holdings’ unaudited consolidated financial statements included elsewhere in this prospectus. LD Holdings’ unaudited consolidated financial statements have been prepared on the same basis as their audited consolidated financial statements and, in our opinion, reflect all adjustments, consisting only of normal and recurring adjustments, necessary for a fair presentation of such financial statements in all material respects. The results for any interim period are not necessarily indicative of the results that may be expected for a full year or any future period. The summary of our consolidated financial data set forth below should be read together with our consolidated financial statements and our consolidated interim financial statements and the related notes, as well as the sections captioned “Selected Historical Consolidated Condensed Financial Statements,” “Pro Forma Unaudited Consolidated Financial Information” and “Management’s Discussion and Analysis of Financial Condition and Results of Operations” appearing elsewhere in this prospectus.
| Condensed Consolidated Statement of Operations Data: (Dollars in thousands) |
Nine Months Ended September 30, |
Year Ended December 31, | ||||||||||||||||||
| 2020 | 2019 | 2019 | 2018 | 2017 | ||||||||||||||||
| (Unaudited) | ||||||||||||||||||||
| Revenues: |
||||||||||||||||||||
| Net interest income (expense) |
$ | 9,268 | $ | (3,057 | ) | $ | (2,775 | ) | $ | 17,295 | $ | 16,749 | ||||||||
| Gain on origination and sale of loans, net |
2,873,455 | 788,054 | 1,125,853 | 799,564 | 1,011,791 | |||||||||||||||
| Origination income, net |
167,554 | 107,850 | 149,500 | 153,036 | 159,184 | |||||||||||||||
| Servicing fee income |
121,520 | 85,022 | 118,418 | 141,195 | 115,486 | |||||||||||||||
| Change in fair value of servicing rights, net |
(216,132 | ) | (100,051 | ) | (119,546 | ) | (51,487 | ) | (88,701 | ) | ||||||||||
| Other income |
58,115 | 44,022 | 65,681 | 54,750 | 58,470 | |||||||||||||||
|
|
|
|
|
|
|
|
|
|
|
|||||||||||
| Total net revenues |
3,013,780 | 921,840 | 1,337,131 | 1,114,353 | 1,272,979 | |||||||||||||||
| Expenses: |
||||||||||||||||||||
| Personnel expense |
1,022,734 | 525,948 | 765,256 | 681,378 | 726,616 | |||||||||||||||
| Marketing and advertising expense |
173,628 | 133,799 | 187,880 | 190,777 | 216,012 | |||||||||||||||
| Direct origination expense |
88,627 | 61,786 | 93,531 | 83,033 | 76,232 | |||||||||||||||
| Subservicing expense |
52,154 | 28,736 | 41,397 | 50,433 | 36,403 | |||||||||||||||
| General, administrative, occupancy and other expenses |
209,241 | 153,076 | 216,396 | 212,076 | 187,910 | |||||||||||||||
|
|
|
|
|
|
|
|
|
|
|
|||||||||||
| Total expenses |
1,546,384 | 903,345 | 1,304,460 | 1,217,697 | 1,243,173 | |||||||||||||||
| Income tax expense (benefit) |
1,457 | 288 | (1,749 | ) | (475 | ) | 1,436 | |||||||||||||
|
|
|
|
|
|
|
|
|
|
|
|||||||||||
| Net income (loss) |
1,465,939 | 18,207 | 34,420 | (102,869 | ) | 28,370 | ||||||||||||||
| Net income (loss) attributable to non-controlling interests |
— | — | — | — | — | |||||||||||||||
|
|
|
|
|
|
|
|
|
|
|
|||||||||||
| Net income (loss) attributable to loanDepot, Inc. |
$ | 1,465,939 | $ | 18,207 | $ | 34,420 | $ | (102,869 | ) | $ | 28,370 | |||||||||
|
|
|
|
|
|
|
|
|
|
|
|||||||||||
27
Table of Contents
| Condensed Consolidated Balance Sheet Data: (Dollars in thousands) |
September 30, | December 31, | ||||||||||||||||||
| 2020 | 2019 | 2019 | 2018 | 2017 | ||||||||||||||||
| (Unaudited) | (Unaudited) | |||||||||||||||||||
| Assets |
||||||||||||||||||||
| Cash and cash equivalents |
$ | 637,511 | $ | 46,333 | $ | 73,301 | $ | 105,685 | $ | 84,479 | ||||||||||
| Loans held for sale, at fair value |
4,888,364 | 3,081,401 | 3,681,840 | 2,295,451 | 2,431,446 | |||||||||||||||
| Derivative assets, at fair value |
722,149 | 164,599 | 131,228 | 73,439 | 104,148 | |||||||||||||||
| Servicing rights, at fair value |
780,451 | 349,472 | 447,478 | 412,953 | 530,049 | |||||||||||||||
| Total assets |
8,651,313 | 4,255,080 | 4,952,511 | 3,436,793 | 3,658,495 | |||||||||||||||
| Liabilities and equity |
||||||||||||||||||||
| Warehouse and other lines of credit |
4,601,062 | 2,900,512 | 3,466,567 | 2,126,640 | 2,258,665 | |||||||||||||||
| Derivative liabilities, at fair value |
59,432 | 5,463 | 9,977 | 32,575 | 9,039 | |||||||||||||||
| Debt obligations, net |
706,478 | 539,384 | 592,095 | 547,893 | 469,357 | |||||||||||||||
| Total liabilities |
7,017,792 | 3,893,877 | 4,576,626 | 3,087,902 | 3,200,681 | |||||||||||||||
| Total redeemable units and unitholders’ equity |
1,633,521 | 361,203 | 375,885 | 348,891 | 457,814 | |||||||||||||||
| Equity |
— | — | — | — | — | |||||||||||||||
| Noncontrolling interests |
— | — | — | — | — | |||||||||||||||
| Total equity |
— | — | — | — | — | |||||||||||||||
| Total liabilities, redeemable units, unitholders’ equity and equity |
8,651,313 | 4,255,080 | 4,952,511 | 3,436,793 | 3,658,495 | |||||||||||||||
Key Performance Indicators
| (Unaudited) |
Nine Months Ended September 30, |
Year Ended December 31, | ||||||||||||||||||
| 2020 | 2019 | 2019 | 2018 | 2017 | ||||||||||||||||
| Non-GAAP financial measures: |
||||||||||||||||||||
| Adjusted total revenue |
$ | 3,000,201 | $ | 938,982 | $ | 1,346,178 | $ | 1,107,661 | $ | 1,287,228 | ||||||||||
| Adjusted EBITDA |
1,554,172 | 94,507 | 124,005 | (33,833 | ) | 93,155 | ||||||||||||||
| Adjusted net income (loss) |
1,085,891 | 27,209 | 31,885 | (80,109 | ) | 30,128 | ||||||||||||||
| Adjusted EBITDA margin |
51.8 | % | 10.1 | % | 9.2 | % | (3.1 | )% | 7.2 | % | ||||||||||
| Adjusted net income margin |
36.2 | 2.9 | 2.4 | (7.2 | ) | 2.3 | ||||||||||||||
| Loan origination metrics: |
||||||||||||||||||||
| Total loan originations |
$ | 63,364,799 | $ | 29,268,054 | $ | 45,324,026 | $ | 33,039,029 | $ | 35,193,887 | ||||||||||
| Retail loan originations |
50,591,415 | 21,291,576 | 32,700,837 | 24,103,719 | 27,136,741 | |||||||||||||||
| Partner loan originations |
12,773,384 | 7,976,478 | 12,623,189 | 8,935,310 | 8,057,146 | |||||||||||||||
| Loan originations by purpose: |
||||||||||||||||||||
| Purchase |
$ | 18,487,155 | $ | 13,215,487 | $ | 18,513,555 | $ | 16,640,101 | $ | 14,060,472 | ||||||||||
| Refinance |
44,877,644 | 16,052,567 | 26,810,471 | 16,398,928 | 21,133,415 | |||||||||||||||
|
|
|
|
|
|
|
|
|
|
|
|||||||||||
| Total originations |
$ | 63,364,799 | $ | 29,268,054 | $ | 45,324,026 | $ | 33,039,029 | $ | 35,193,887 | ||||||||||
|
|
|
|
|
|
|
|
|
|
|
|||||||||||
| Purchase (%) |
29.2 | % | 45.2 | % | 40.8 | % | 50.4 | % | 40.0 | % | ||||||||||
| Refinance (%) |
70.8 | 54.8 | 59.2 | 49.6 | 60.0 | |||||||||||||||
| Total market share—loan originations |
2.6 | % | 2.0 | % | 2.0 | % | 2.0 | % | 2.0 | % | ||||||||||
| Gain on sale margin |
4.80 | % | 3.06 | % | 2.81 | % | 2.88 | % | 3.33 | % | ||||||||||
| Gain on sale margin—retail |
4.96 | 3.67 | 3.39 | 3.62 | 3.87 | |||||||||||||||
| Gain on sale margin—partner |
3.34 | 1.15 | 1.16 | 1.09 | 1.30 | |||||||||||||||
28
Table of Contents
| (Unaudited) |
September 30, | December 31, | ||||||||||||||||||
| 2020 | 2019 | 2019 | 2018 | 2017 | ||||||||||||||||
| Servicing metrics: |
||||||||||||||||||||
| Total servicing portfolio (unpaid principal balance) |
$ | 77,171,998 | $ | 30,553,920 | $ | 36,336,126 | $ | 32,815,954 | $ | 46,764,869 | ||||||||||
| Total servicing portfolio (units) |
272,701 | 130,640 | 148,750 | 141,561 | 203,592 | |||||||||||||||
| 60+ days delinquent ($) |
$ | 2,073,862 | $ | 339,870 | $ | 383,272 | $ | 410,647 | $ | 597,811 | ||||||||||
| 60+ days delinquent (%) |
2.7 | % | 1.1 | % | 1.1 | % | 1.3 | % | 1.3 | % | ||||||||||
| Servicing rights, at fair value: |
||||||||||||||||||||
| Fair value, net(1) |
$ | 776,993 | $ | 346,915 | $ | 444,443 | $ | 408,989 | $ | 528,911 | ||||||||||
| Weighted average servicing fee |
0.31 | % | 0.35 | % | 0.35 | % | 0.33 | % | 0.30 | % | ||||||||||
| Multiple(2) |
3.3x | 3.3x | 3.6x | 3.9x | 3.8x | |||||||||||||||
| (1) | Amounts represent the fair value of servicing rights, net of servicing liabilities, which are included in accounts payable, accrued expenses and other liabilities in the consolidated balance sheets. |
| (2) | Amount represents the fair value of servicing rights, net divided by the weighted average annualized servicing fee. |
29
Table of Contents
An investment in our Class A Common Stock involves risk. You should carefully consider the following risks as well as the other information included in this prospectus, including “Selected Financial Data,” “Unaudited Pro Forma Consolidated Financial Information,” “Management’s Discussion and Analysis of Financial Condition and Results of Operations” and the financial statements and related notes contained elsewhere in this prospectus, before investing in our Class A Common Stock. Any of the following risks could materially and adversely affect our business, financial condition or results of operations. However, the selected risks described below are not the only risks facing us. Additional risks and uncertainties not currently known to us or those we currently view to be immaterial may also materially and adversely affect our business, financial condition or results of operations. In such a case, the trading price of the Class A Common Stock could decline and you may lose all or part of your investment in our company.
Risks Related to Our Business
The COVID-19 pandemic poses unique challenges to our business and the effects of the pandemic could adversely impact our ability to originate mortgages, our servicing operations, our liquidity and our employees.
The COVID-19 pandemic has had, and continues to have, a significant impact on the national economy and the communities in which we operate. While the full extent of the pandemic’s effect on the macroeconomic environment has yet to be fully determined and could continue for months or years, we expect that the pandemic and governmental programs created as a response to the pandemic, will continue to affect certain aspects of our business, including the origination of mortgages, our servicing operations, our liquidity and our employees. Although the impact of COVID-19 on our business has been immaterial so far, such effects, if they continue for a prolonged period, may have a material adverse effect on our business and results of operation.
Our origination of mortgages business was immaterially impacted at the outset of the COVID-19 pandemic. However, future growth is uncertain. If the COVID-19 pandemic leads to a prolonged economic downturn with sustained high unemployment rates, we anticipate that the number of real estate transactions will decrease. Any such slowdown may materially impact the number and volume of mortgages we originate.
Our liquidity may be adversely affected by the COVID-19 pandemic. We fund substantially all of the mortgage loans we close through borrowings under our loan funding facilities. Given the broad impact of the COVID-19 pandemic on the financial markets, our future ability to borrow money to fund our current and future loan production is unknown. Our mortgage origination liquidity could also be affected as our lenders reassess their exposure to the mortgage origination industry and either curtail access to uncommitted Warehouse Lines capacity or impose higher costs to access such capacity. Our liquidity may be further constrained as there may be less demand by investors to acquire our mortgage loans in the secondary market. Even if such demand exists, we face a substantially higher repurchase risk as a result of the COVID-19 pandemic stemming from our clients’ inability to repay the underlying loans.
It is possible that the COVID-19 pandemic may affect the productivity of our employees. As a result of the pandemic, in March 2020, we transitioned to a remote working environment for the substantial majority of our employees. While our employees have transitioned effectively to working from home, over time such remote operations may decrease the cohesiveness of our employees and our ability to maintain our culture, both of which are integral to our success. Additionally, a remote working environment may impede our ability to undertake new business projects, to foster a creative environment, to hire new employees and to retain existing employees.
To the extent the COVID-19 pandemic adversely affects our business, operations, financial condition and operating results, it may also have the effect of heightening many of the other risks described in this “Risk factors” section, such as those relating to our high level of indebtedness, our need to generate sufficient cash flows to service our indebtedness, and our ability to comply with the covenants contained in the agreements that govern our indebtedness.
30
Table of Contents
The executive, legislative and regulatory reaction to COVID-19, including the passage of the CARES Act, poses new and quickly evolving compliance obligations on our business, and we may experience unfavorable changes in, or failure to comply with, existing or future regulations and laws adopted in response to COVID-19.
Due to the unprecedented pause of major sectors of the U.S. economy from COVID-19, numerous states and the federal government adopted measures requiring mortgage servicers to work with consumers negatively impacted by COVID-19. The CARES Act imposes several new compliance obligations on our mortgage servicing activities, including, but not limited to mandatory forbearance offerings, altered credit reporting obligations, and moratoriums on foreclosure actions and late fee assessments. Many states have taken similar measures to provide mortgage payment and other relief to consumers. Nevertheless, servicers of mortgage loans are contractually bound to advance monthly payments to investors, insurers and taxing authorities regardless of whether the borrower actually makes those payments. We expect that such payments may continue to increase throughout the duration of the pandemic. While Fannie Mae and Freddie Mac recently issued guidance limiting the number of payments a servicer must advance in the case of a forbearance, we expect that a borrower who has experienced a loss of employment or a reduction of income will not repay the forborne payments at the end of the forbearance period. Additionally, we are prohibited from collecting certain servicing related fees, such as late fees, and initiating foreclosure proceedings. Accordingly, there is no assurance that we will be successful in continuing to make contractual advances to investors and others in the coming months and we will ultimately have to replace such funds to make payments in respect of such prepayments and mortgage payoffs. As a result, we may have to use cash on hand, including borrowings under our Secured Credit Facilities, our Variable Funding Note (“GMSR VFN”), and our variable funding note facility (the “Advance Receivables Trust”) to make the payments required under our servicing operation.
With the urgency to help consumers, the expedient passage of the CARES Act increases the likelihood of unintended consequences from the legislation. An example of such unintended consequences is the liquidity pressure placed on mortgage servicers given our contractual obligation to continue to advance payments to investors on loans in forbearance where consumers are not making their typical monthly mortgage payments. Moreover, certain provisions of the CARES Act are subject to interpretation given the existing ambiguities in the legislation, which creates class action and other litigation risk.
Although much of the executive, legislative and regulatory actions stemming from the COVID-19 pandemic that affect our business are servicing-centric, regulators are also adjusting compliance obligations impacting our mortgage origination activities. Many states have adopted temporary measures allowing for otherwise prohibited remote mortgage loan origination activities. While these temporary measures allow us to continue to do business remotely, they impose notice, procedural, and other compliance obligations on our origination activity.
Federal, state, and local executive, legislative and regulatory responses to the COVID-19 pandemic are rapidly evolving, not consistent in scope or application, and subject to change without advance notice. Such efforts may impose additional compliance obligations, which may negatively impact our mortgage origination and servicing business. Any additional legal or regulatory responses to the COVID-19 pandemic may unfavorably restrict our business operations, alter our established business practices, and otherwise raise our compliance costs.
We have experienced rapid growth, which may be difficult to sustain and which may place significant demands on our operational, administrative and financial resources.
Our substantial growth in loan production and the servicing portfolio has caused, and if it continues will continue to cause, significant demands on our operational, legal, and accounting infrastructure, and will result in increased expenses. In addition, we are required to continuously develop our systems and infrastructure in response to the increasing sophistication of the lending markets and legal, accounting and regulatory developments relating to all of our existing and projected business activities. Our future growth will depend, among other things, on our ability to maintain an operating platform and management system sufficient to
31
Table of Contents
address our growth and will require us to incur significant additional expenses and to commit additional senior management and operational resources. As a result, we face significant challenges in:
| • | securing funding to maintain our operations and future growth; |
| • | maintaining and improving our loan retention and recapture rates; |
| • | maintaining and scaling adequate financial, business and risk controls; |
| • | implementing new or updated information and financial systems and procedures; |
| • | training, managing and appropriately sizing our work force and other components of our business on a timely and cost-effective basis; |
| • | navigating complex and evolving regulatory and competitive environments; |
| • | increasing and maintaining the number of borrowers utilizing our products and services; |
| • | increasing the volume of loans originated and facilitated through us; |
| • | entering into new markets and introducing new products; |
| • | continuing to develop, maintain and scale our platform; |
| • | effectively using limited personnel and technology resources; |
| • | effectively maintaining and scaling our financial and risk management controls and procedures; |
| • | maintaining the security of our platform, systems and infrastructure and the confidentiality of the information (including personally identifiable information) provided and utilized across our platform; and |
| • | attracting, integrating and retaining an appropriate number of qualified employees. |
We may not be able to manage our expanding operations effectively and we may not be able to continue to grow, and any failure to do so could adversely affect our ability to generate revenue and control our expenses.
We may not be able to continue to grow our loan production volume, which could negatively affect our business, financial condition and results of operations.
Our loan originations, particularly our refinance mortgage loan volume, are dependent on interest rates and are expected to decline if interest rates increase. Our loan origination activities are also subject to overall market factors that can impact our ability to grow our loan production volume. For example, increased competition from new and existing market participants, slow growth in the level of new home purchase activity or reductions in the overall level of refinancing activity can impact our ability to continue to grow our loan origination volume, and we may be forced to accept lower margins in order to continue to compete and keep our volume of activity consistent with past or projected levels.
Our mortgage loan originations also depend on the referral-driven nature of the mortgage loan industry. The origination of purchase money mortgage loans is greatly influenced by traditional market participants in the home buying process such as real estate agents and builders. As a result, our ability to maintain existing, and secure new, relationships with such traditional market participants will influence our ability to grow our purchase money mortgage loan volume and, thus, our mobile and local retail originations business. Regulatory developments also limit our ability to enter into marketing services agreements with referral sources, which could adversely impact us. See “Business—supervision and regulation—Federal, state and local regulation.” In addition, we will need to convert leads regarding prospective borrowers into funded loans and that depends on the pricing that we will be able to offer relative to the pricing of our competitors and our ability to process, underwrite and close loans on a timely basis. Institutions that compete with us in this regard may have significantly greater access to capital or resources than we do, which may give them the benefit of a lower cost of operations.
32
Table of Contents
If new products and enhancements do not achieve sufficient market acceptance, our financial results and competitive position will be harmed.
We have derived substantially all of our revenue from originating, selling and servicing traditional mortgage loans. Efforts to expand into new consumer products, such as insurance, real estate services, or other products consistent with our business purpose, may not succeed and may reduce expected revenue growth. Furthermore, we incur expenses and expend resources upfront to develop, acquire and market new products and platform enhancements to incorporate additional features, improve functionality or otherwise make our products more desirable to consumers. While we continue to manage a servicing portfolio of personal loans, we stopped accepting new loan applications for personal loans in the fourth quarter of 2018. New products must achieve high levels of market acceptance in order for us to recoup our investment in developing and bringing them to market. If we are unable to grow our revenues or if our margins become compressed, then our business, financial condition and results of operations could be adversely affected.
Recently launched and future products could fail to attain sufficient market acceptance for many reasons, including:
| • | our failure to predict market demand accurately or to supply products that meet market demand in a timely fashion; |
| • | negative publicity about our products’ performance or effectiveness or our customer experience; |
| • | our ability to obtain financing sources to support such products; |
| • | regulatory hurdles; |
| • | delays in releasing the new products to market; and |
| • | the introduction or anticipated introduction of competing products by our competitors. |
If our new and recently launched products do not achieve adequate acceptance in the market, our competitive position, revenue and operating results could be harmed. The adverse effect on our financial results may be particularly acute because of the significant development, marketing, sales and other expenses we will have incurred in connection with the new products or enhancements before such products or enhancements generate sufficient revenue. Further, the failure of certain technological enhancements to reduce our cost of production could have an adverse effect on our business, financial position and results of operations.
Certain changes in the management of LDLLC, and certain other changes in its ownership or in its board of directors may cause one or more events of default under our current Warehouse Lines and other financing arrangements.
Certain changes in the management of LDLLC, the board of directors of LDLLC and/or the ownership of LDLLC may cause an event of default under one or more of our current Warehouse Lines and other financing arrangements, which may in turn cause events of default under many of our other Warehouse Lines and financing arrangements due to standard cross-default provisions. Uncured events of default under our Warehouse Lines and other financing arrangements would cause a material adverse effect on our business, financial condition and results of operations.
The success and growth of our business will depend upon our ability to adapt to and implement technological changes.
We rely on our proprietary technology to make our platform available to clients, evaluate loan applicants and service loans. In addition, we may increasingly rely on technological innovation as we introduce new products, expand our current products into new markets and continue to streamline various loan-related and lending processes. The process of developing new technologies and products is complex, and if we are unable to successfully innovate and continue to deliver a superior client experience, the demand for our products and services may decrease and our growth and operations may be harmed.
33
Table of Contents
All of our loan distribution channels are dependent upon technological advancement, such as our ability to process applications over the internet, accept electronic signatures, provide process status updates instantly and other conveniences expected by borrowers and counterparties. We must ensure that our technology facilitates a borrower experience that equals or exceeds the borrower experience provided by our competitors. Maintaining and improving this technology will require significant capital expenditures. To the extent we are dependent on any particular technology or technological solution, we may be harmed if such technology or technological solution becomes non-compliant with existing industry standards, fails to meet or exceed the capabilities of our competitors’ equivalent technologies or technological solutions, becomes increasingly expensive to service, retain and update, becomes subject to third-party claims of intellectual property infringement, misappropriation or other violation, or malfunctions or functions in a way we did not anticipate that results in loan defects potentially requiring repurchase. Additionally, new technologies and technological solutions are continually being released. As such, it is difficult to predict the problems we may encounter in improving our technologies’ functionality. There is no assurance that we will be able to successfully adopt new technology as critical systems and applications become obsolete and better ones become available. Additionally, if we fail to develop our technologies to respond to technological developments and changing borrower needs in a cost-effective manner, or fail to acquire, integrate or interface with third-party technologies effectively, we may experience disruptions in our operations, lose market share or incur substantial costs. As these requirements increase in the future, we will have to fully develop these technological capabilities to remain competitive and any failure to do so could adversely affect our business, financial condition and results of operations.
If we fail to promote and maintain our brands in a cost-effective manner, or if we experience negative publicity, we may lose market share and our revenue may decrease.
We believe that developing and maintaining awareness of our brands in a cost-effective manner is critical to attracting new and retaining existing consumers. Successful promotion of our brands will depend largely on the effectiveness of our marketing efforts and the experience of our consumers. Our efforts to build our brands have involved significant expense, and our future marketing efforts will require us to maintain or incur significant additional expense. These brand promotion activities may not result in increased revenue and, even if they do, any increases may not offset the expenses incurred. If we fail to successfully promote and maintain our brands or if we incur substantial expenses in an unsuccessful attempt to promote and maintain our brands, we may lose our existing consumers to our competitors or be unable to attract new consumers.
Additionally, reputational risk, or the risk to our business, results of operation and financial condition from negative public opinion, is inherent in our business. Negative public opinion can result from actual or alleged conduct by our employees or representatives in any number of activities, including lending and debt collection practices, marketing and promotion practices, corporate governance and actions taken by government regulators and community organizations in response to those activities. Negative public opinion can also result from media coverage, whether accurate or not.
In recent years, consumer advocacy groups and some media reports have advocated governmental action to prohibit or place severe restrictions on non-bank lenders. If the negative characterization of independent mortgage loan originators becomes increasingly accepted by consumers, demand for any or all of our mortgage loan products could significantly decrease. Additionally, if the negative characterization of independent mortgage loan originators is accepted by legislators and regulators, we could become subject to more restrictive laws and regulations applicable to mortgage loan products.
In addition, our ability to attract and retain customers is highly dependent upon the external perceptions of our level of service, trustworthiness, business practices, financial condition and other subjective qualities. Negative perceptions or publicity regarding these matters—even if related to isolated incidents or to practices not specific to the origination or servicing of loans, such as debt collection—could erode trust and confidence and damage our reputation among existing and potential customers. In turn, this could decrease the demand for our products, increase regulatory scrutiny and detrimentally effect our business.
34
Table of Contents
We may grow by making acquisitions, and we may not be able to identify or consummate acquisitions or otherwise manage our growth effectively.
Part of our growth strategy has included acquisitions, and we may acquire additional companies or businesses. We may not be successful in identifying origination platforms or businesses, or other businesses that meet our acquisition criteria in the future. In addition, even after a potential acquisition target has been identified, we may not be successful in completing or integrating the acquisition. We face significant competition for attractive acquisition opportunities from other well-capitalized companies, many of which have greater financial resources and a greater access to debt and equity capital to secure and complete acquisitions than we do. As a result of such competition, we may be unable to acquire certain assets or businesses that we deem attractive or the purchase price may be significantly elevated or other terms may be substantially more onerous. Any delay or failure on our part to identify, negotiate, finance on favorable terms, consummate and integrate such acquisitions could impede our growth.
There can be no assurance that we will be able to manage our expanding operations effectively or that we will be able to continue to grow, and any failure to do so could adversely affect our ability to generate revenue and control our expenses. Furthermore, we may be responsible for any legacy liabilities of businesses we acquire. The existence or amount of these liabilities may not be known at the time of acquisition and may have a material adverse effect on our consolidated financial position, results of operations or cash flow.
Our hedging strategies may not be successful in mitigating our risks associated with changes in interest rates.
Our profitability is directly affected by the level of, and changes in, interest rates. The market value of closed LHFS and IRLCs generally decline as interest rates rise and increase when interest rates fall. Changes in interest rates could also lead to increased prepayment rates, which could materially and adversely affect the value of our MSRs. Historically, the value of MSRs has increased when interest rates rise as higher interest rates lead to decreased prepayment rates and have decreased when interest rates decline as lower interest rates lead to increased prepayment rates. As a result, large moves and substantial volatility in interest rates materially affect our consolidated financial position, results of operations and cash flows.
We employ various economic hedging strategies that utilize derivative instruments to mitigate the interest rate and fall-out risks that are inherent in many of our assets, including our IRLCs, our LHFS and our MSRs. Our derivative instruments, which currently consist of whole loan forwards, mortgage backed security forwards “TBAs,” interest rate swap futures, U.S. Treasury futures and options on U.S. Treasury futures, are accounted for as free-standing derivatives and are included on our consolidated balance sheet at fair market value. Our operating results may suffer because the losses on the derivatives we enter into may not be offset by a change in the fair value of the related hedged transaction.
Our hedging strategies may also require us to post cash or collateral margin to our hedging counterparties. The level of cash or collateral that is required to be posted is largely driven by the mark to market of our derivative instruments. The exchange of margin with our hedging counterparties could under certain market conditions, adversely affect our short-term liquidity position.
Some of our derivatives (whole loans forwards and TBAs) are not traded on a regulated exchange with a central clearinghouse that determines the margin requirements and offers protection against a lack of performance by individual market participants. This exposes us to the risk that a counterparty may not be able to post margin or otherwise perform on the terms of the contract. This failure could adversely affect our liquidity position and have a material adverse effect on our financial position, results of operations or cash flows.
Our hedging activities in the future may include entering into interest rate swaps, caps and floors and/or options to purchase these items. Our hedging decisions in the future will be determined in light of the facts and circumstances existing at the time and may differ from our current hedging strategy. Moreover, our hedging
35
Table of Contents
strategies may not be effective in mitigating the risks related to changes in interest rates and could affect our profitability and financial condition. Poorly designed strategies or improperly executed transactions could actually increase our risk and losses.
We rely on internal models to manage risk and to make business decisions. Our business could be adversely affected if those models fail to produce reliable and/or valid results.
We make significant use of business and financial models in connection with our proprietary technology to measure and monitor our risk exposures and to manage our business. For example, we use models to measure and monitor our exposures to interest rate, credit and other market risks. The information provided by these models is used in making business decisions relating to strategies, initiatives, transactions, pricing and products. If these models are ineffective at predicting future losses or are otherwise inadequate, we may incur unexpected losses or otherwise be adversely affected.
We build these models using historical data and our assumptions about factors such as future mortgage loan demand, default rates, home price trends and other factors that may overstate or understate future experience. Our assumptions may be inaccurate and our models may not be as predictive as expected for many reasons, including the fact that they often involve matters that are inherently beyond our control and difficult to predict, such as macroeconomic conditions, and that they often involve complex interactions between a number of variables and factors.
Our models could produce unreliable results for a variety of reasons, including but not limited to, the limitations of historical data to predict results due to unprecedented events or circumstances, invalid or incorrect assumptions underlying the models, the need for manual adjustments in response to rapid changes in economic conditions, incorrect coding of the models, incorrect data being used by the models, or inappropriate application of a model to products or events outside of the model’s intended use. In particular, models are less dependable when the economic environment is outside of historical experience, as was the case from 2008-2010 or during the present COVID-19 pandemic.
We continue to monitor the markets and make necessary adjustments to our models and apply appropriate management judgment in the interpretation and adjustment of the results produced by our models. This process takes into account updated information while maintaining controlled processes for model updates, including model development, testing, independent validation and implementation. As a result of the time and resources, including technical and staffing resources, that are required to perform these processes effectively, it may not be possible to replace existing models quickly enough to ensure that they will always properly account for the impacts of recent information and actions.
The geographic concentration of our loan originations may adversely affect our retail lending business, which would adversely affect our financial condition and results of operations.
A substantial portion of our aggregate mortgage loan origination is secured by properties concentrated in the states of California, Florida, Texas and New York, and properties securing a substantial portion of our outstanding UPB of mortgage loan servicing rights portfolio are located in California, Texas, Florida, and New York. During the global financial crisis of 2007-2008 (the “Financial Crisis”), the states of California and Florida experienced severe declines in property values and a disproportionately high rate of delinquencies and foreclosures relative to other states. To the extent that the states of California, Florida, Texas, and New York experience weaker economic conditions or greater rates of decline in real estate values than the United States generally, the concentration of loans that we service in those states may decrease the value of our servicing rights and adversely affect our retail lending business. The impact of property value declines may increase in magnitude and it may continue for a long period of time. Additionally, if states in which we have greater concentrations of business were to change their licensing or other regulatory requirements to make our business cost-prohibitive, we may be required to stop doing business in those states or may be subject to a higher cost of
36
Table of Contents
doing business in those states, which could materially adversely affect our business, financial condition and results of operations.
We may be required to indemnify the purchasers of loans that we originate (including securitization trusts), or repurchase those loans, if those loans fail to meet certain criteria or characteristics or under other circumstances.
Our contracts with purchasers of mortgage loans that we originate, including the GSEs and other financial institutions that purchase mortgage loans for investor or private label securitization, and the agreements for securitization transactions for which we act as the securitizer, contain provisions that require us to indemnify the related securitization trust or the purchaser of the mortgage loans or to repurchase the mortgage loans under certain circumstances. We also pool FHA-insured and VA-guaranteed mortgage loans, which back securities guaranteed by Ginnie Mae. While our contracts vary, they generally contain provisions that require us to indemnify these parties, or repurchase these mortgage loans, if:
| • | our representations and warranties concerning mortgage loan quality and mortgage loan characteristics are inaccurate or are otherwise breached and not remedied within any applicable cure period (usually 90 days or less) after we receive notice of the breach; |
| • | we fail to secure adequate mortgage insurance within a certain period after closing of the applicable mortgage loan; |
| • | a mortgage insurance provider denies coverage; |
| • | if the borrower defaults on the on the loan payments within a contractually defined period (early payment default); |
| • | if the borrower prepays the mortgage loan within a contractually defined period (early payoff); or |
| • | the mortgage loans fail to comply with underwriting or regulatory requirements. |
We believe that, as a result of the current market environment, many purchasers of mortgage loans are particularly aware of the conditions under which mortgage loan originators or sellers must indemnify them against losses related to purchased mortgage loans, or repurchase those mortgage loans, and would benefit from enforcing any repurchase remedies they may have.
Repurchased loans typically can only be resold at a steep discount to their repurchase price, if at all. They are also typically sold at a significant discount to the UPB. To recognize these potential indemnification and repurchase losses, we have recorded estimated loan repurchase reserves of $27.6 million and $19.2 million at September 30, 2020 and 2019, respectively. Our liability for repurchase losses is assessed quarterly. Although not all mortgage loans repurchased are in arrears or default, as a practical matter most have been. Factors that we consider in evaluating our reserve for such losses include default expectations, expected investor repurchase demands (influenced by, among other things, current and expected mortgage loan file requests and mortgage loan insurance rescission notices) and appeals success rates (where the investor rescinds the demand based on a cure of the defect or acknowledges that the mortgage loan satisfies the investor’s applicable representations and warranties), reimbursement by third-party originators and projected loss severity. Also, although we re-evaluate our reserves for repurchase losses each quarter, evaluations of that sort necessarily are estimates and there remains a risk that the reserves will not be adequate.
Additionally, if home values decrease, our realized mortgage loan losses from mortgage loan indemnifications and repurchases may increase. As such, our indemnification and repurchase costs may increase beyond our current expectations. See “Management’s discussion and analysis of financial condition and results of operations—Critical accounting policies and estimates—Loan repurchase reserve.” If we are required to indemnify the GSEs or other purchasers against loan losses, or repurchase loans, that result in losses that exceed our reserve, this could materially adversely affect our business, financial condition and results of operations.
37
Table of Contents
Additionally, we may not be able to recover amounts from some third parties, such as brokers through our wholesale channel, from whom we may seek indemnification or against whom we may assert a loan repurchase demand in connection with a breach of a representation or warranty due to financial difficulties or otherwise. As a result, we are exposed to counterparty risk in the event of non-performance by counterparties to our various contracts, including, without limitation, as a result of the rejection of an agreement or transaction in bankruptcy proceedings, which could result in substantial losses for which we may not have insurance coverage.
If the value of the collateral underlying certain of our loan funding facilities decreases, we could be required to satisfy a margin call, and an unanticipated margin call could have a material adverse effect on our liquidity.
Certain of our loan funding and MSR-backed facilities are subject to margin calls based on the lender’s opinion of the value of the loan collateral securing such financing. In addition, certain of our hedges related to newly originated mortgages are also subject to margin calls. A margin call would require us to repay a portion of the outstanding borrowings. A large, unanticipated margin call could have a material adverse effect on our liquidity. As a result of the change in the interest rate market due to COVID-19, we have faced some margin calls on hedges. To date these calls have not been material but if the interest rate market continues to be significantly impacted by COVID-19, we could face additional margin calls that could impact our liquidity.
Our servicing rights are highly volatile assets with continually changing values, and these changes in value, or inaccuracies in our estimates of their value, could adversely affect our financial condition and results of operations.
The value of our servicing rights is based on the cash flows projected to result from the servicing of the related loans and continually fluctuates due to a number of factors. Our servicing portfolio is subject to “run off,” meaning that loans serviced by us (or our subservicer) may be prepaid prior to maturity, refinanced with a loan not serviced by us or liquidated through foreclosure, deed-in-lieu of foreclosure or other liquidation process or repaid through standard amortization of principal. As a result, our ability to maintain the size of our servicing portfolio depends on our ability to originate additional mortgages. In determining the value for our servicing rights and subservicing agreement, management makes certain assumptions, many of which are beyond our control, including, among other things:
| • | the speed of prepayment and repayment within the underlying pools of loans; |
| • | projected and actual rates of delinquencies, defaults and liquidations; |
| • | future interest rates and other market conditions; |
| • | our cost to service the loans; |
| • | ancillary fee income; and |
| • | amounts of future servicing advances. |
We use external, third-party valuations that utilize market participant data to value our servicing rights for purposes of financial reporting. We also benchmark these valuations to internal financial models. These models are complex and use asset-specific collateral data and market inputs for interest and discount rates. In addition, the modeling requirements of servicing rights are complex because of the high number of variables that drive cash flows associated with servicing rights. Even if the general accuracy of our valuation models is validated, valuations are highly dependent upon the reasonableness of the assumptions and the results of the models utilized in such valuations.
If loan delinquencies or prepayment speeds are higher than anticipated or other factors perform worse than modeled, the recorded value of our servicing rights would decrease, which would adversely affect our financial condition and results of operations.
38
Table of Contents
Substantially all of our loan servicing operations are conducted pursuant to subservicing contracts with subservicers, and any termination by our subservicers of these contracts, or a material change in the terms thereof that is adverse to us, would adversely affect our business, financial condition, liquidity and results of operations.
Substantially all of our loan servicing operations are currently conducted pursuant to a subservicing contract with Cenlar FSB (“Cenlar”) (for mortgage loans) and a subservicing contract with CardWorks Servicing, LLC (for personal loans), each an unaffiliated third-party loan servicing provider. We are responsible for ensuring each subservicer’s compliance with the applicable servicing criteria and applicable law, and we are required to have procedures in place to provide reasonable assurance that its activities comply in all material respects with applicable servicing criteria and applicable law. In the event that Cenlar’s activities do not comply with the servicing criteria or applicable law for a mortgage loan, it could negatively impact our agreements with the Agencies or other investors. In addition, because our subservicers maintain the primary contact with the borrower of a serviced loan throughout the life of the loan, we have less ability to become involved with any potential loss mitigation. Therefore, we may not have control over a rise in delinquencies and/or claims among non-performing loans, both of which, in the case of mortgage loans, could have a material adverse effect on our business, financial condition, liquidity and results of operations.
Further, our subservicers may, under certain circumstances, terminate their subservicing contracts with or without cause, with little notice and in some instances with no compensation to us. Upon any such termination, it would be difficult to replace a large volume of subservicing on comparable terms in a short period of time, or perhaps at all.
In addition, for mortgage loans, the approval of the GSEs or other investors that own the mortgage loans underlying our servicing rights would be required to transfer our mortgage loan servicing rights portfolio from our subservicer to another subservicer. Such approval would be in the applicable investor’s discretion, and there is no assurance that such approval could be obtained if and when necessary. If we were to have our subservicing contract terminated by our subservicer, or if there was a change in the terms under which our subservicer performs subservicing that was materially adverse to us, it would adversely affect our business, financial condition and results of operations.
In order to be able to maintain or grow our servicing business, our servicing rights must be replaced as the loans that we service are repaid or refinanced, and if our loan business loses market share, our servicing business would also be impacted.
Our servicing portfolio, including both our mortgage loans and personal loans portfolios, are subject to “run-off,” meaning that loans serviced by us, as applicable, may be repaid at maturity, prepaid prior to maturity, refinanced with a loan not serviced by us or liquidated through foreclosure, deed-in-lieu of foreclosure or other liquidation process or repaid through standard amortization of principal. As a result, our ability to maintain the size of our servicing portfolio depends on our ability to originate loans with respect to which we retain the servicing rights.
If our mortgage loan business loses market share, or if the volume of mortgage loan originations otherwise decreases or if the mortgage loans underlying our servicing portfolio are repaid or refinanced at a faster pace, we may not be able to maintain or grow the size of our servicing portfolio, which could have a material adverse effect on our business, financial condition and results of operations.
We are required to make servicing advances that can be subject to delays in recovery or, to a lesser extent, may not be recoverable in certain circumstances, which could adversely affect our liquidity, business, financial condition and results of operations.
For mortgage loans, during any period in which a borrower is not making payments, we are required under most of our servicing agreements in respect of our servicing rights to advance our own funds to meet contractual principal and interest remittance requirements for investors, pay property taxes and insurance premiums, legal
39
Table of Contents
expenses and other protective advances. We also advance funds under these agreements to maintain, repair and market real estate properties on behalf of investors. As home values change, we may have to reconsider certain of the assumptions underlying our decisions to make advances. In addition, if a mortgage loan serviced by us is in default or becomes delinquent, the repayment to us of the advance may be delayed until the mortgage loan is repaid or refinanced or foreclosure or a liquidation occurs. If we receive requests for advances in excess of amounts that we are able to fund at that time, we may not be able to fund these advance requests, which could materially and adversely affect our mortgage loan servicing activities and our status as an approved servicer by Fannie Mae and Freddie Mac and result in our termination as an issuer and approved servicer by Ginnie Mae. A delay in our ability to collect an advance may adversely affect our liquidity, and our inability to be reimbursed for an advance could adversely affect our business, financial condition and results of operations. As our servicing portfolio continues to age, defaults might increase as the loans get older, which may increase our costs of servicing and could be detrimental to our business. Market disruptions such as the COVID-19 pandemic and the response by the CARES Act, and the GSEs, through which a temporary period of forbearance is being offered for customers unable to pay on certain mortgage loans as a result of the COVID-19 pandemic may also increase the number of defaults, delinquencies or forbearances related to the loans we service, increasing the advances we make for such loans. With specific regard to the COVID-19 pandemic, any regulatory or GSE-specific relief on servicing advance obligations provided to mortgage loan servicers has so far been limited to GSE-eligible mortgage loans, leaving out any non-GSE mortgage loan products such as jumbo mortgage loans. As of September 30, 2020, approximately 3.4%, or $2.6 billion UPB, of our servicing portfolio was in active forbearance.
With delinquent VA guaranteed loans, the VA guarantee may not make us whole on losses or advances we may have made on the loan. If the VA determines the amount of the guarantee payment will be less than the cost of acquiring the property, it may elect to pay the VA guarantee and leave the property securing the loan with us (a “VA no-bid”). If we cannot sell the property for a sufficient amount to cover amounts outstanding on the loan we will suffer a loss which may, on an aggregate basis and if the percentage of VA no-bids increases, have a detrimental impact on our business and financial condition.
In addition, for certain loans securitized in accordance with Ginnie Mae guidelines, we, as the servicer, have the unilateral right to repurchase any individual loan in a Ginnie Mae securitization pool if that loan meets defined criteria, including being delinquent greater than 90 days. Once we have the unilateral right to repurchase the delinquent loan, we have effectively regained control over the loan and we must recognize the loan on our balance sheet and recognize a corresponding financial liability. Any significant increase in required servicing advances or delinquent loan repurchases, could have a significant adverse impact on our cash flows, even if they are reimbursable, and could also have a detrimental effect on our business and financial condition
Our counterparties may terminate our servicing rights, which could adversely affect our business, financial condition and results of operations.
The owners of the mortgage loans (including securitization trusts) for which we have retained servicing rights, may, under certain circumstances, terminate our right to service the mortgage loans. As is standard in the industry, under the terms of our master servicing agreements with the GSEs in respect of the servicing rights for mortgage loans that we retain, the GSEs have the right to terminate us as servicer of the mortgage loans we service on their behalf at any time (and, in certain instances, without the payment of any termination fee) and also have the right to cause us to sell the servicing rights to a third-party. In addition, failure to comply with servicing standards could result in termination of our agreements with the GSEs with little or no notice and without any compensation. Currently, a subservicer performs the servicing activities on the mortgage loans underlying our servicing rights portfolio. However, we are responsible to the GSEs that own the underlying loans for such activities. Consequently, in the event of a default by our subservicer, the GSE could terminate our servicing rights or require that our servicing rights be transferred to another subservicer.
Adverse actions by Ginnie Mae could materially and adversely impact our business, reputation, financial condition, liquidity and results of operations, including if Ginnie Mae were to terminate us as an issuer or
40
Table of Contents
servicer of Ginnie Mae loans or otherwise take action indicating that such a termination was planned. For example, such actions could make financing our business more difficult, including by making future financing more expensive or, if a lender were to allege a default under our debt agreements, could trigger cross-defaults under all our other material debt agreements. See “—Changes in GSE or Ginnie Mae selling and/or servicing guidelines could adversely affect our business, financial condition and results of operations.”
If we were to have our servicing rights terminated on a material portion of our servicing portfolio, the value of our servicing rights could be reduced or, potentially, eliminated entirely and our business, financial condition and results of operations could be adversely affected.
Our servicing rights portfolio has a limited performance history, which makes our future results of operations more difficult to predict.
With respect to mortgage loans, the likelihood of delinquencies and defaults, and the associated risks to our business, including higher costs to service such mortgage loans and a greater risk that we may incur losses due to repurchase or indemnification demands, changes as mortgage loans season, or increase in age. Newly originated mortgage loans typically exhibit low delinquency and default rates as the changes in economic conditions, individual financial circumstances and other factors that drive borrower delinquency often do not appear for months or years. Most of the mortgage loans underlying our servicing rights portfolio were originated in recent years. As a result, we expect the delinquency rate and defaults of the loans underlying the servicing rights portfolio to increase in future periods as the portfolio seasons, but we cannot predict the magnitude of this impact on our results of operations. In addition, because most of the mortgage loans in our portfolios are recently originated, it may be difficult to compare our business to our mortgage loan originator competitors. Such competitors may have better ability to model delinquency and default risk based on their longer operating histories and may have a better ability than we do in establishing appropriate loss reserves on their financial statements. Any inadequacy of our loss reserves established for delinquencies and defaults may result in future financial restatements or other adverse events.
We may in the future stop utilizing a subservicer for mortgage loan servicing operations, which may subject us to compliance, operational and execution risks.
We may in the future stop utilizing a subservicer for mortgage loan servicing operations, which may subject us to compliance, operational and execution risks. Were we to transition from an outsourcing model to the servicing of loans in-house, we would be subject to guidelines set forth by the Agencies. Failure to meet stipulations of servicing guidelines can result in the assessment of fines and loss of reimbursement of loan-related advances, expenses, interest and servicing fees. When the servicing of a portfolio is assumed either through purchase of servicing rights or through a subservicing arrangement, various loans in the acquired portfolio may have been previously serviced in a manner that will contribute towards our not meeting certain servicing guidelines. If not recovered from a prior servicer, such events frequently lead to the eventual realization of a loss to us. In the event we were to stop utilizing a subservicer, the increased regulatory scrutiny, potential operational disruptions, and executions risks associated with such a transition could have a material adverse effect on our business and results of operations.
We may incur increased costs and related losses if a borrower challenges the validity of a foreclosure action on a mortgage loan or if a court overturns a foreclosure, which could adversely affect our business, financial condition, liquidity and results of operations.
We may incur costs if we are required to, or if we elect to, execute or re-file documents or take other action in our capacity as a servicer in connection with pending or completed foreclosures on mortgage loans. We may incur litigation costs if the validity of a foreclosure action is challenged by a borrower. If a court overturns a foreclosure because of errors or deficiencies in the foreclosure process, we may have liability to a title insurer or the purchaser of the property sold in foreclosure. These costs and liabilities may not be legally or otherwise
41
Table of Contents
reimbursable to us, particularly to the extent they relate to securitized mortgage loans. In addition, if certain documents required for a foreclosure action are missing or defective, we could be obligated to cure the defect or repurchase the mortgage loan. A significant increase in litigation costs could adversely affect our liquidity, and our inability to be reimbursed for an advance could adversely affect our business, financial condition and results of operations. We may also incur the aforementioned costs and liabilities to the extent that they may be incurred by our subservicer under certain circumstances.
We rely on joint ventures with industry partners through which we originate mortgage loans. If any of these joint ventures are terminated, our revenues could decline.
We are party to joint ventures, with partners such as home builders and real estate brokers, and the termination of any of these joint ventures (including as a result of one of our partners exiting the industry), or a decline in the activity of the building industry generally, could cause revenue from loans originated through these joint ventures to decline, which would negatively impact our business.
Challenges to the MERS System could materially and adversely affect our business, results of operations and financial condition.
MERSCORP, Inc. maintains an electronic registry, referred to as the MERS System, which tracks servicers, ownership of servicing rights and ownership of mortgage loans in the United States. Mortgage Electronic Registration Systems, Inc. (“MERS”), a wholly owned subsidiary of MERSCORP, Inc., can serve as a nominee for the owner of a mortgage loan and in that role initiate foreclosures or become the mortgagee of record for the loan in local land records. We and/or our subservicer have in the past and may continue to use MERS as a nominee. The MERS System is widely used by participants in the mortgage finance industry.
Several legal challenges in the courts and by governmental authorities have been made disputing MERS’s legal standing to initiate foreclosures or act as nominee for lenders in mortgages and deeds of trust recorded in local land records. These challenges have focused public attention on MERS and on how mortgage loans are recorded in local land records. Although most legal decisions have accepted MERS as mortgagee, these challenges could result in delays and additional costs in commencing, prosecuting and completing foreclosure proceedings, conducting foreclosure sales of mortgaged properties and submitting proofs of claim in borrower bankruptcy cases.
Finally, borrowers are raising new challenges to the recording of mortgages in the name of MERS, including challenges questioning the ownership and enforceability of mortgage loans registered in MERS. Currently, MERS is the primary defendant in several class action lawsuits in various state jurisdictions, where the plaintiffs allege improper mortgage assignment and the failure to pay recording fees in violation of state recording statutes. The plaintiffs in such actions generally seek to compel defendants to record all assignments, restitution, compensatory and punitive damages, and appropriate attorneys’ fees and costs. An adverse decision in any jurisdiction may delay the foreclosure process in other jurisdictions.
We depend on the accuracy and completeness of information about borrowers and any misrepresented information could adversely affect our business, financial condition and results of operations.
In deciding whether to extend credit or to enter into other transactions with borrowers, we rely on information furnished to us by or on behalf of borrowers, including credit, identification, employment and other relevant information. Some of the information regarding borrowers provided to us is used to determine whether to lend to borrowers and the risk profiles of such borrowers. Such risk profiles are subsequently utilized by Warehouse Line counterparties who lend us capital to fund mortgage loans. We also may rely on representations of borrowers as to the accuracy and completeness of that information.
While we have a practice of seeking to independently verify some of the borrower information that we use in deciding whether to extend credit or to agree to a loan modification, including, depending on the program,
42
Table of Contents
employment, assets, income and credit score, in accordance with applicable law, not all borrower information is independently verified, and if any of the information that is independently verified (or any other information considered in the loan review process) is misrepresented and such misrepresentation is not detected prior to loan funding, the value of the loan may be significantly lower than expected. Additionally, there is a risk that, following the date of the credit report that we obtain and review, a borrower may have become delinquent in the payment of an outstanding obligation, defaulted on a pre-existing debt obligation, taken on additional debt, lost his or her job or other sources of income; or sustained other adverse financial events. Whether a misrepresentation is made by the loan applicant, another third-party or one of our employees, we generally bear the risk of loss associated with the misrepresentation. We may not detect all misrepresented information in our mortgage loan originations or from service providers we engage to assist in the loan approval process. Any such misrepresented information could adversely affect our business, financial condition and results of operations.
We are also subject to the risk of fraudulent activity associated with the origination of loans. The level of our fraud charge-offs and results of operations could be materially adversely affected if fraudulent activity were to significantly increase. High profile fraudulent activity or significant increases in fraudulent activity could lead to regulatory intervention, negatively impact our operating results, brand and reputation and lead us to take steps to reduce fraud risk, which could increase our costs.
Our financial statements are based in part on assumptions and estimates made by our management, including those used in determining the fair values of a substantial portion of our assets. If the assumptions or estimates are subsequently proven incorrect or inaccurate, there could be a material adverse effect on our business, financial position, results of operations or cash flows.
Accounting rules for mortgage loan sales and securitizations, valuations of financial instruments and servicing rights, and other aspects of our operations are highly complex and involve significant judgment and assumptions. For example, we utilize certain assumptions and estimates in preparing our financial statements, including when determining the fair values of certain assets and liabilities and reserves related to mortgage loan representations and warranty claims and to litigation claims and assessments. These complexities and significant assumptions could lead to a delay in the preparation of financial information and also increase the risk of errors and restatements, as well as the cost of compliance. Changes in accounting interpretations or assumptions could impact our financial statements and our ability to timely prepare our financial statements. If the assumptions or estimates underlying our financial statements are incorrect, we may experience significant losses as the ultimate realization of value may be materially different than the amounts reflected in our consolidated statement of financial position as of any particular date, and there could be a material adverse effect on our business, financial position, results of operations or cash flows.
A substantial portion of our assets are recorded at fair value based upon significant estimates and assumptions with changes in fair value included in our consolidated results of operations. The determination of the fair value of our assets involves numerous estimates and assumptions made by our management. Such estimates and assumptions include, without limitation, estimates of future cash flows associated with our servicing rights and derivative assets based upon assumptions involving, among other things, discount rates, prepayment speeds, cost of servicing of the underlying serviced mortgage loans, pull-through rates and direct origination expenses. The use of different estimates or assumptions in connection with the valuation of these assets could produce materially different fair values, or our fair value estimates may not be realized in an actual sale or settlement, either of which could have a material adverse effect on our consolidated financial position, results of operations or cash flows.
Reserves are established for mortgage loan representations and warranty claims when it is probable that a loss has been incurred and the amount of such loss can be reasonably estimated. In light of the inherent uncertainties involved in loan repurchase claims related to representations and warranties, it is not always possible to determine a reasonable estimate of the amount of a probable loss, and we may estimate a range of possible loss for consideration in our estimates. The estimates are based upon currently available information and
43
Table of Contents
involve significant judgment taking into account the varying stages and inherent uncertainties of such repurchase and indemnification requests. Accordingly, our estimates may change from time to time and such changes may be material to our consolidated results of operations, and the ultimate settlement of such matters may have a material adverse effect on our consolidated financial position, results of operations or cash flows.
Reserves are established for pending or threatened litigation, claims or assessments when it is probable that a loss has been incurred and the amount of such loss can be reasonably estimated. In light of the inherent uncertainties involved in litigation and other legal proceedings, it is not always possible to determine a reasonable estimate of the amount of a probable loss, and we may estimate a range of possible loss for consideration in its estimates. The estimates are based upon currently available information and involve significant judgment taking into account the varying stages and inherent uncertainties of such matters. Accordingly, our estimates may change from time to time and such changes may be material to our consolidated results of operations, and the ultimate settlement of such matters may have a material adverse effect on our consolidated financial position, results of operations or cash flows.
For additional information on the key areas for which assumptions and estimates are used in preparing our financial statements, see “Management’s discussion and analysis of financial condition and results of operations—Critical accounting policies and estimates.”
Our reported financial results may be materially and adversely affected by future changes in accounting principles generally accepted in the United States.
U.S. Generally Accepted Accounting Principles (“GAAP”) is subject to standard setting or interpretation by the Financial Accounting Standards Board (“FASB”), the Public Company Accounting Oversight Board, the United State Securities and Exchange Commission (“SEC”) and various bodies formed to promulgate and interpret appropriate accounting principles. A change in these principles or interpretations could have a significant effect on our reported financial results and could materially and adversely affect the transactions completed before the announcement of a change. A change in these principles or interpretations could also require us to alter our accounting systems in a manner that could increase our operating costs, impact the content of our financial statements and impact our ability to timely prepare our financial statements.
Our vendor relationships subject us to a variety of risks and the failure of third parties to provide various services that are important to our operations could have a material adverse effect on our business.
We have significant vendors that, among other things, provide us with financial, technology and other services to support our loan servicing and originations activities. In April 2012, the CFPB issued guidance stating that institutions under its supervision may be held responsible for the actions of the companies with which they contract. Accordingly, we could be adversely impacted to the extent our vendors are unfamiliar with legal requirements applicable to the particular products or services being offered or fail to take efforts to implement such requirements effectively. In addition, if our current vendors were to stop providing services to us on acceptable terms, including as a result of one or more vendor bankruptcies due to poor economic conditions, we may be unable to procure alternatives from other vendors in a timely and efficient manner and on acceptable terms, or at all. Further, we may incur significant costs to resolve any such disruptions in service and this could adversely affect our business, financial condition and results of operations.
Some services important to our business are outsourced to third-party vendors. For example, substantially all of our mortgage loan servicing operations are currently conducted by Cenlar. It would be difficult and disruptive for us to replace some of our third-party vendors, particularly Cenlar, in a timely manner if they were unwilling or unable to provide us with these services in the future (as a result of their financial or business conditions or otherwise), and our business and operations likely would be materially adversely affected. In addition, if a third-party provider fails to provide the services we require, fails to meet contractual requirements,
44
Table of Contents
such as compliance with applicable laws and regulations, or suffers a technological disruption, cyberattack or other security breach, our business could suffer economic and reputational harm that could have a material adverse effect on our business and results of operations. See “—Risks related to our business—Substantially all of our loan servicing operations are conducted pursuant to subservicing contracts with subservicers, and any termination by our subservicers of these contracts, or a material change in the terms thereof that is adverse to us, would adversely affect our business, financial condition, liquidity and results of operations.”
Some of the loans we service are higher risk loans, which are more expensive to service than conventional mortgage loans.
Some of the mortgage loans we service are higher risk loans, meaning that the loans are to less credit worthy borrowers, delinquent or for properties the value of which has decreased. These loans are more expensive to service because they require more frequent interaction with customers and greater monitoring and oversight.
Additionally, in connection with the ongoing mortgage market reform and regulatory developments, servicers of higher risk loans are subject to increased scrutiny by state and federal regulators and will experience higher compliance and regulatory costs, which could result in a further increase in servicing costs. We may not be able to pass along any of the additional expenses we incur in servicing higher risk loans to our servicing clients. The greater cost of servicing higher risk loans, which may be further increased through regulatory reform, consent decrees or enforcement, could adversely affect our business, financial condition and results of operations.
Our risk management policies and procedures may not be effective.
Our risk management framework seeks to mitigate risk and appropriately balance risk and return. We have established policies and procedures intended to identify, monitor and manage the types of risk to which we are subject, including credit risk, market and interest rate risk, liquidity risk, cyber risk, regulatory, legal and reputational risk. Although we have devoted significant resources to develop our risk management policies and procedures and expect to continue to do so in the future, these policies and procedures, as well as our risk management techniques such as our hedging strategies, may not be fully effective. There may also be risks that exist, or that develop in the future, that we have not appropriately anticipated, identified or mitigated. As regulations and markets in which we operate continue to evolve, our risk management framework may not always keep sufficient pace with those changes. If our risk management framework does not effectively identify or mitigate our risks, we could suffer unexpected losses and could be materially adversely affected.
The loss of the services of our senior management could adversely affect our business.
The experience of our senior management, including Anthony Hsieh, our Chief Executive Officer, is a valuable asset to us. Our management team has significant experience in the residential mortgage loan production and servicing industry and the investment management industry. Furthermore, certain of our Warehouse Lines specify that a substantial change in the management responsibilities of Mr. Hsieh constitutes an event of default. We do not maintain key life insurance policies relating to our senior management. See “—Risks related to our business—The departure or change in the responsibilities of Anthony Hsieh, our Chief Executive Officer, and certain other changes in our ownership or in our board of directors may cause one or more events of default under our Warehouse Lines and other financing arrangements.”
Our business could suffer if we fail to attract and retain a highly skilled workforce.
Our future success will depend on our ability to identify, hire, develop, motivate and retain highly qualified personnel for all areas of our organization, in particular skilled managers, loan officers and underwriters. Trained and experienced personnel are in high demand and may be in short supply in some areas. Many of the companies
45
Table of Contents
with which we compete for experienced employees have greater resources than we have and may be able to offer more attractive terms of employment. In addition, we invest significant time and expense in training our employees, which increases their value to competitors who may seek to recruit them. We may not be able to attract, develop and maintain an adequate skilled workforce necessary to operate our business and labor expenses may increase as a result of a shortage in the supply of qualified personnel. If we are unable to attract and retain such personnel, we may not be able to take advantage of acquisitions and other growth opportunities that may be presented to us and this could materially affect our business, financial condition and results of operations.
Cyberattacks, information or security breaches and technology disruptions or failures, including failure of internal operational or security systems or infrastructure, of ours or of our third-party vendors’ could damage our business operations and increase our costs, which could adversely affect our business, financial condition and results of operations.
The financial services industry as a whole is characterized by rapidly changing technologies and we are dependent on the security and efficacy of our infrastructure, computer and data management systems, as well as those of third parties with whom we interact. In the ordinary course of our business, we receive, process, retain, transmit and store proprietary information and sensitive or confidential data, including certain public and non-public personal information concerning employees and borrowers. Additionally, we enter into relationships with third-party vendors to assist with various aspects of our business, some of which require the exchange of personal employee or borrower information. We devote significant resources to maintain and regularly update our systems and processes that are designed to protect the security of our computer systems, software, networks and other technology assets against attempts by unauthorized parties to obtain access to confidential or sensitive information, destroy data, disrupt or degrade service, sabotage systems or cause other damage and we employ extensive layered security at all levels within our organization to help us detect malicious activity, both from within the organization and from external sources.
Despite our efforts to ensure the integrity of our systems, it is possible that we and our third-party vendors may not be able to in the future, anticipate or implement effective preventive measures against all security breaches or unauthorized access of our information technology systems or the information technology systems of third-party vendors that receive, process, retain and transmit electronic information on our behalf. The techniques used to obtain unauthorized, improper or illegal access to our systems and those of our third-party vendors, our data, our employees’ customers’ and loan applicants’ data or to disable, degrade or sabotage service are constantly evolving, and have become increasingly complex and sophisticated. Furthermore, such techniques change frequently and are often not recognized or detected until after they have been launched and security attacks can originate from a wide variety of sources, including third parties such as computer hackers, persons involved with organized crime or associated with external service providers, or foreign state or foreign state-supported actors. Those parties may also attempt to fraudulently induce employees, customers or other users of our systems to disclose sensitive information in order to gain access to our data or that of our borrowers. These risks may increase in the future as we continue to increase our reliance on the internet and use of web-based product offerings.
Cybersecurity risks have significantly increased in recent years. From time to time, we and our third-party vendors that collect, store, process, retain and transmit confidential or sensitive information, including borrower personal and transactional data or employee data (including service providers located offshore who conduct support services for us), are targeted by unauthorized parties using malicious code and viruses or otherwise attempting to breach the security of our or our vendors’ systems and data. We and our third-party vendors may in the future experience system disruptions and failures caused by software failure, fire, power loss, telecommunications failures, employee misconduct, human error, unauthorized intrusion, security breaches, acts of vandalism, traditional computer hackers, computer viruses and disabling devices, phishing attacks, malicious or destructive code, denial of service or information, natural disasters, health pandemics and other similar events, which may result in the unauthorized release, gathering, monitoring, misuse, loss or destruction of confidential, proprietary or other sensitive information of ours, our employees or customers, and otherwise interrupt or delay
46
Table of Contents
our ability to provide services to our customers. This is especially applicable in the current response to the COVID-19 pandemic and the shift we have experienced in having most of our employees work from their homes for the time being, as our employees access our secure networks through their home networks. Developments in technological capabilities and the implementation of technology changes or upgrades could also result in a compromise or breach of the technology that we use to protect our employees’ and customers’ personal information and transaction data. Although we have established, and continue to establish on an ongoing basis, defenses to identify and mitigate cyberattacks, any loss, unauthorized access to, or misuse of confidential or personal information could disrupt our operations, damage our reputation, and expose us to claims from customers, financial institutions, regulators, employees and other persons, any of which could have an adverse effect on our business, financial condition and results of operations.
A successful penetration, compromise, breach or circumvention of the security of our or our third-party vendors’ information technology systems through electronic, physical or other means, or a defect in the integrity of our or our third-party vendors’ systems or cybersecurity could cause serious negative consequences for our business, including significant disruption of our operations, misappropriation of our proprietary, confidential or sensitive information, including personal information of our borrowers or employees, damage to our computers or operating systems and to those of our borrowers and counterparties, and subject us to significant costs, litigation, disputes, reporting obligations, regulatory action, investigation, fines, penalties, remediation costs, damages and other liabilities. In addition, our remediation efforts may not be successful and we may not have adequate insurance to cover these losses. Any of the foregoing events could result in violations of applicable privacy and other laws, financial loss to us or to our borrowers, loss of confidence in our security measures, customer dissatisfaction, significant litigation exposure and harm to our reputation, and diversion of management attention, all of which could adversely affect our business, financial condition and results of operations.
We face litigation and legal proceedings that could have a material adverse effect on our revenues, financial condition, cash flows and results of operations.
We are routinely and currently involved in legal proceedings concerning matters that arise in the ordinary course of our business. See “Business—Legal proceedings.” These legal proceedings range from actions involving a single plaintiff to class action lawsuits with potentially tens of thousands of class members. These actions and proceedings are generally based on alleged violations of consumer protection, employment, contract and other laws.
Recently, on December 24, 2020, we received a demand letter from one of the senior members of our operations team asserting, among other things, allegations of loan origination noncompliance and various employment related claims, including allegations of a hostile work environment and gender discrimination, with unspecified damages. We are conducting an investigation into the claims and our investigation is not complete. While the Company’s management does not believe these allegations have merit, should the executive file a formal lawsuit against us, it could result in substantial costs and a diversion of our management’s attention and resources.
Our business in general exposes us to both formal and informal periodic inquiries, from various state and federal agencies as part of those agencies’ oversight of the origination and sale of mortgage loans and servicing activities. See “—Risks related to our regulatory environment” below. An adverse result in governmental investigations or examinations or private lawsuits, including purported class action lawsuits, may adversely affect our financial results. In addition, a number of participants in our industry have been the subject of purported class action lawsuits and regulatory actions by state regulators, and other industry participants have been the subject of actions by state Attorneys General. Litigation and other proceedings may require that we pay settlement costs, legal fees, damages, penalties or other charges, any or all of which could adversely affect our financial results. In particular, legal proceedings brought under state consumer protection statutes may result in a separate fine for each violation of the statute, which, particularly in the case of class action lawsuits, could result in damages substantially in excess of the amounts we earned from the underlying activities and that could have a material adverse effect on our liquidity, financial position and results of operations.
47
Table of Contents
We may be unable to sufficiently obtain, maintain, protect and enforce our intellectual property and proprietary rights and we may encounter disputes from time to time relating to our use of the intellectual property of third parties.
We rely on a combination of trademarks, service marks, copyrights, trade secrets, domain names and confidentiality procedures and contractual provisions with employees and third parties to protect our intellectual property and proprietary rights. As of September 30, 2020, we hold 27 registered United States trademarks and 34 United States trademark applications, including with respect to the name “loanDepot,” “mello” and other logos and various additional designs and word marks relating to the “loanDepot” name, as well as seven United States patent applications. Nonetheless, as new challenges with respect to intellectual property protection arise, we cannot assure you that these measures will be adequate to protect our intellectual property and proprietary rights that we have secured, that we will be able to secure appropriate protections for all of our intellectual property and proprietary rights in the future, or that third parties will not misappropriate, infringe upon or otherwise violate our intellectual property or proprietary rights, particularly in foreign countries where laws or enforcement practices may not protect our intellectual property and proprietary rights as fully as in the United States. Despite our efforts to protect our intellectual property and proprietary rights, unauthorized third parties may attempt to disclose, obtain, duplicate, copy or use proprietary aspects of our technology, curricula, online resource material, and other intellectual property. Our management’s attention may be diverted by these attempts, and we may need to expend funds in litigation or other proceedings to protect our intellectual property proprietary rights against any infringement, misappropriation or violation. Furthermore, attempts to enforce our intellectual property rights against third parties could also provoke these third parties to assert their own intellectual property or other rights against us, or result in a holding that invalidates or narrows the scope of our rights, in whole or in part.
Confidentiality procedures and contractual provisions can also be difficult to enforce and, even if successfully enforced, may not be entirely effective. In addition, we cannot guarantee that we have entered into confidentiality agreements with all employees, partners, independent contractors or consultants that have or may have had access to our trade secrets or other proprietary information. Any of our issued or registered intellectual property rights may be challenged, invalidated, held unenforceable or circumvented in litigation or other proceedings, including re-examination, inter partes review, post-grant review, interference and derivation proceedings and equivalent proceedings in foreign jurisdictions (e.g., opposition proceedings), and such intellectual property rights may be lost or no longer provide us meaningful competitive advantages. Third parties may also independently develop products, services and technology similar or duplicative of our products and services.
Our success and ability to compete also depends in part on our ability to operate without infringing, misappropriating or otherwise violating the intellectual property or proprietary rights of third parties. We have encountered and may in the future encounter disputes from time to time over rights and obligations concerning intellectual property or proprietary rights of others, and we may not prevail in these disputes. Third parties may raise claims against us alleging an infringement, misappropriation or other violation of their intellectual property or proprietary rights. Some third-party intellectual property rights may be extremely broad, and it may not be possible for us to conduct our operations in such a way as to avoid all alleged infringements, misappropriations or other violations of such intellectual property rights. In addition, former employers of our current, former or future employees may assert claims that such employees have improperly disclosed to us the confidential or proprietary information of these former employers. The resolution of any such disputes or litigations is difficult to predict. Future litigation may also involve non-practicing entities or other intellectual property owners who have no relevant product offerings or revenue and against who our own intellectual property may therefore provide little or no deterrence or protection. Any such intellectual property claims could subject us to costly litigation and impose a significant strain on our financial resources and management personnel, regardless of whether such claim has merit. Such claims may also result in adverse judgements or settlement on unfavorable terms. Our insurance may not cover potential claims of this type adequately or at all, and we may be required to pay significant money damages, lose significant revenues, be prohibited from using the relevant systems, processes, technologies or other intellectual property, cease offering certain products or services, alter the content of our classes, or incur significant license, royalty or technology development expenses.
48
Table of Contents
Our products and operations use software, hardware and services that may be difficult to replace or cause errors or failures of our products and disrupt our operations, which could adversely affect our business.
In addition to our proprietary technology, we license third-party software, utilize third-party hardware and depend on services from various third parties for use in our products and day-to-day operations. In the future, this software or these services may not be available to us on commercially reasonable terms, or at all. Any loss of the right to use any of the software or services could result in decreased functionality of our products and operations until equivalent technology is either developed by us or, if available from another provider, is identified, obtained and integrated, which could adversely affect our business. In addition, any errors or defects in or failures of the software or services we rely on, whether maintained by us or by third parties, could result in errors or defects in our products or cause our products to fail or could disrupt our day-to-day operations, which could adversely affect our business and be costly to correct. Many of these providers attempt to impose limitations on their liability for such errors, defects or failures, and if enforceable, we may have additional liability to our clients or to other third parties that could harm our reputation and increase our operating costs. We will need to maintain our relationships with third-party software and service providers and to obtain software and services from such providers that do not contain any errors or defects. Any failure to do so could adversely affect our ability to deliver effective products to our clients and loan applicants, as well as interrupt our day-to-day operations, which could adversely affect our business.
Terrorist attacks and other acts of violence or war may affect the real estate industry generally and our business, financial condition and results of operations.
The terrorist attacks on September 11, 2001 disrupted the U.S. financial markets, including the real estate capital markets, and negatively impacted the U.S. economy in general. Any future terrorist attacks, the anticipation of any such attacks, the consequences of any military or other response by the United States and its allies, and other armed conflicts could cause consumer confidence and spending to decrease or result in increased volatility in the United States and worldwide financial markets and economy. The economic impact of these events could also adversely affect the credit quality of some of our loans and investments and the properties underlying our interests.
We may suffer losses as a result of the adverse impact of any future attacks and these losses may adversely impact our performance. A prolonged economic slowdown, recession or declining real estate values could impair the performance of our investments and harm our financial condition and results of operations, increase our funding costs, limit our access to the capital markets or result in a decision by lenders not to extend credit to us. We cannot predict the severity of the effect that potential future armed conflicts and terrorist attacks would have on us. Losses resulting from these types of events may not be fully insurable.
Flooding, severe storms, hurricanes, landslides, wildfires, mudslides, earthquakes or other natural disasters may affect the real estate industry generally and our business, financial condition and results of operations.
From time to time, areas of the United States may be affected by flooding, severe storms, hurricanes, landslides, wildfires, mudslides, earthquakes or other natural disasters. For instance, properties in California may be particularly susceptible to certain types of uninsurable hazards, such as earthquakes, floods, mudslides, wildfires and other natural disasters, properties in Florida, Georgia, South Carolina and North Carolina may be particularly susceptible to certain types of uninsurable hazards, such as hurricanes, and properties located in Texas, North Carolina, South Carolina, Louisiana and Mississippi may be particularly susceptible to damage by flooding. The Agencies or investors may be unwilling to reimburse for losses experienced with the property disposition and associated losses on sales in connection with material natural disasters. Additionally, such material natural disasters could disrupt or displace members of our workforce, which would affect our ability to operate our business in the ordinary course.
49
Table of Contents
Risks Related to Our Industry
Our mortgage loan origination revenues are highly dependent on macroeconomic and U.S. residential real estate market conditions.
Our results of operations are materially affected by conditions in the mortgage loan and real estate markets, the financial markets and the economy generally. During the Financial Crisis for example, a decline in home prices led to an increase in delinquencies and defaults, which led to further home price declines and losses for creditors. This depressed mortgage loan origination activity and general access to credit. Post-Financial Crisis, the disruption in the capital markets and secondary mortgage markets has also reduced liquidity and investor demand for mortgage loans and MBS, while yield requirements for these products increased. Continuing concerns about inflation, rising interest rates, energy costs, geopolitical issues and the availability and cost of credit could contribute to increased volatility and diminished expectations for the economy and markets going forward. If present U.S. and global economic uncertainties persist, loan origination activity may become muted. Should any of these situations occur, our loan originations and revenue would decline and our business would be negatively impacted.
Our earnings may decrease because of changes in prevailing interest rates.
We generate a sizeable portion of our revenues from loans we make to clients that are used to refinance existing mortgage loans. Generally, the refinance market experiences significant fluctuations. As interest rates rise, refinancing volumes generally decrease as fewer consumers are incentivized to refinance their mortgages. This could adversely affect our revenues or require us to increase marketing expenditures in an attempt to maintain refinancing related origination volumes. Higher interest rates may also reduce demand for purchase mortgage loans as home ownership becomes more expensive and could also reduce demand for our home equity loans. Market demand in 2020 was driven by a prolonged period of historically low interest rates. This demand contributed to gain on sale margins reaching levels that the Company does not believe will be sustained in future years and could result in decreases in revenue. Decreases in interest rates can also potentially adversely affect our business as the stream of servicing fees and correspondingly, the value of servicing rights, decreases as interest rates decrease.
For more information regarding how changes in interest rates may negatively affect our financial condition and results of operations, see “Management’s discussion and analysis of financial condition and results of operations—Key factors influencing our results of operations” and “—Quantitative and qualitative disclosures about market risk.”
The industries in which we operate are highly competitive, and are likely to become more competitive, and our inability to compete successfully or decreased margins resulting from increased competition could adversely affect our business, financial condition and results of operations.
We operate in highly competitive industries that could become even more competitive as a result of economic, legislative, regulatory and technological changes. With respect to our mortgage loan businesses, we face and may in the future face competition in such areas as loan product offerings, rates, fees and customer service. With respect to servicing, we face competition in areas such as fees, compliance capabilities and performance in reducing delinquencies.
Competition in originating loans comes from large commercial banks and savings institutions and other independent loan originators and servicers. Many of these institutions have significantly greater resources and access to capital than we do, which gives them the benefit of a lower cost of funds. Commercial banks and savings institutions may also have significantly greater access to potential customers given their deposit-taking and other banking functions. Also, some of these competitors are less reliant than we are on the sale of mortgage loans into the secondary markets to maintain their liquidity and may be able to participate in government programs that we are unable to participate in because we are not a state or federally chartered depository institution, all of which may place us at a competitive disadvantage. The advantages of our largest competitors include, but are not limited to, their ability to hold new loan originations in an investment portfolio and their access to lower rate bank deposits as a source of liquidity.
Additionally, more restrictive loan underwriting standards have resulted in a more homogenous product offering, which has increased competition across the mortgage loan industry for loan originations. Furthermore,
50
Table of Contents
our existing and potential competitors may decide to modify their business models to compete more directly with our loan origination and servicing models. Since the withdrawal of a number of large participants from these markets following the Financial Crisis, there have been relatively few large nonbank participants.
In addition, technological advances and heightened e-commerce activities have increased consumers’ accessibility to products and services. This has intensified competition among banks and nonbanks in offering mortgage loans. We may be unable to compete successfully in our industries and this could adversely affect our business, financial condition and results of operations.
Increases in delinquencies and defaults may adversely affect our business, financial condition and results of operations.
The level of home prices and home price appreciation affects performance in the mortgage loan industry. For example, falling home prices between 2007 and 2011 across the United States resulted in higher LTV ratios, lower recoveries in foreclosure and an increase in loss severities above those that would have been realized had property values remained the same or continued to increase. There is a risk that housing prices decline, reducing borrower equity and incentive to repay. Additionally, adverse macroeconomic conditions may reduce borrowers’ ability to pay. Further, if rates rise borrowers with adjustable rate mortgage loans may face higher monthly payments as the interest rates on those mortgage loans adjust upward from their initial fixed rates or low introductory rates. All of these factors could potentially contribute to an increase in mortgage loan delinquencies and correspondingly, defaults and foreclosures.
Increased mortgage loan delinquencies, defaults and foreclosures may result in lower revenue for loans that we service for the Agencies, because we only collect servicing fees for performing loans. Additionally, while increased delinquencies generate higher ancillary fees, including late fees, these fees are not likely to be recoverable in the event that the related loan is liquidated. Also, increased mortgage loan defaults may ultimately reduce the number of mortgage loans that we service.
Increased mortgage loan delinquencies, defaults and foreclosures will also result in a higher cost to service those loans due to the increased time and effort required to collect payments from delinquent borrowers and to liquidate properties or otherwise resolve loan defaults if payment collection is unsuccessful, and only a portion of these increased costs are recoverable under our servicing agreements. Any loan level advances made on defaulted loans within the allowable levels provided by investors and insurers are recoverable either from the borrower in a reinstatement or the investors/insurers in a liquidation. Increased mortgage loan delinquencies, defaults and foreclosures may also result in an increase in our interest expense and affect our liquidity if we are required to borrow to fund an increase in our advancing obligations. Any additional cost to service these loans, including interest expense on loan level advances, are generally not recoverable and are considered a cost of doing business.
In addition, we are subject to risks of borrower defaults and bankruptcies in cases where we might be required to repurchase loans sold with recourse or under representations and warranties. In these cases, a borrower filing for bankruptcy during foreclosure could have the effect of staying the foreclosure and thereby delaying the foreclosure process, which may potentially result in a reduction or discharge of a borrower’s mortgage loan debt. Even if we are successful in directing a foreclosure on a mortgage loan that has been repurchased, the liquidation proceeds upon sale of the underlying real estate may not be sufficient to recover our cost basis in the loan, resulting in a loss to us. Furthermore, any costs or delays involved in the foreclosure of the mortgage loan or a liquidation of the underlying property will further reduce the net proceeds and, thus, increase the loss. If these risks materialize, they could have a material adverse effect on our business, financial condition and results of operations.
In the event we originate mortgage loans that we are unable to sell, we will bear the risk of loss of principal on such mortgage loans. An increase in delinquency rates could therefore adversely affect our business, financial condition and results of operations.
51
Table of Contents
Our underwriting guidelines may not be able to accurately predict the likelihood of defaults on some of the mortgage loans in our portfolio.
We originate and sell Agency-eligible and non-Agency-eligible residential mortgage loans. Agency-eligible loans are underwritten in accordance with guidelines defined by the Agencies, as well as additional requirements in some cases, designed to predict a borrower’s ability and willingness to repay. In spite of these standards, our underwriting guidelines may not always correlate with mortgage loan defaults. For example, FICO scores, which we obtain on a substantial majority of our loans, purport only to be a measurement of the relative degree of risk a borrower represents to a lender (i.e., that a borrower with a higher score is statistically expected to be less likely to default in payment than a borrower with a lower score). Underwriting guidelines cannot predict two of the most common reasons for a default on a mortgage loan: loss of employment and serious medical illness. Any increase in default rates could have a material adverse effect on our business, financial condition, liquidity and results of operations.
Adverse developments in the secondary mortgage loan market, including the MBS market, could have a material adverse effect on our business, financial position, results of operations and cash flows.
We historically have relied on selling or securitizing our mortgage loans into the secondary market in order to generate liquidity to fund maturities of our indebtedness, the origination and warehousing of mortgage loans, the retention of servicing rights and for general working capital purposes. We bear the risk of being unable to sell or securitize our mortgage loans at advantageous times and prices or in a timely manner. Demand in the secondary market and our ability to complete the sale or securitization of our mortgage loans depends on a number of factors, many of which are beyond our control, including general economic conditions, general conditions in the banking system, the willingness of lenders to provide funding for mortgage loans, the willingness of investors to purchase mortgage loans and MBS and changes in regulatory requirements. If it is not possible or economical for us to complete the sale or securitization of certain of our LHFS, we may lack liquidity under our Warehouse Lines to continue to fund such mortgage loans and our revenues and margins on new loan originations would be materially and negatively impacted, which would materially and negatively impact our consolidated net revenue and net income and also have a material adverse effect on our overall business and our consolidated financial position. The severity of the impact would be most significant to the extent we were unable to sell conforming mortgage loans to the GSEs or securitize such loans pursuant to Agency-sponsored programs.
Any significant disruption or period of illiquidity in the general MBS market would directly affect our liquidity because no existing alternative secondary market would likely be able to accommodate on a timely basis the volume of loans that we typically sell in any given period. Accordingly, if the MBS market experiences a period of illiquidity, we might be prevented from selling the loans that we produce into the secondary market in a timely manner or at favorable prices, which could materially adversely affect our business, financial condition and results of operations.
Risks Related to Our Regulatory Environment
We operate in a highly regulated industry that is undergoing regulatory transformation which has created inherent uncertainty. Changing federal, state and local laws, as well as changing regulatory enforcement policies and priorities, may negatively impact the management of our business, results of operations and ability to compete.
We are required to comply with a wide array of federal, state and local laws and regulations that regulate, among other things, the manner in which we conduct our loan origination and servicing activities, the terms of our loans and the fees that we may charge, and the collection, use, retention, protection, disclosure, transfer and other processing of personal information. See “Business—Supervision and regulation.” A material or continued failure to comply with any of these laws or regulations could subject us to lawsuits or governmental actions and/or damage our reputation, which could materially adversely affect our business, financial condition and results of operations.
52
Table of Contents
Additionally, federal, state and local governments and regulatory agencies have recently proposed or enacted numerous new laws, regulations and rules related to mortgage loans. Federal and state regulators are also enforcing existing laws, regulations and rules aggressively and enhancing their supervisory expectations regarding the management of legal and regulatory compliance risks. Consumer finance regulation is constantly changing, and new laws or regulations, or new interpretations of existing laws or regulations, could have a materially adverse impact on our ability to operate as we currently intend. See “—Regulatory agencies and consumer advocacy groups are becoming more aggressive in asserting claims that the practices of lenders and loan servicers result in a disparate impact on protected classes.”
These regulatory changes and uncertainties make our business planning more difficult and could result in changes to our business model and potentially adversely impact our result of operations. New laws or regulations also require us to incur significant expenses to ensure compliance. Accordingly, uncertainty persists regarding the competitive impact of new laws or regulations. As compared to our competitors, we could be subject to more stringent state or local regulations, or could incur marginally greater compliance costs as a result of regulatory changes. In addition, our failure to comply (or to ensure that our agents and third-party service providers comply) with these laws or regulations may result in costly litigation or enforcement actions, the penalties for which could include but are not limited to: revocation of required licenses; fines and other monetary penalties; civil and criminal liability; substantially reduced payments by borrowers; modification of the original terms of loans, permanent forgiveness of debt, or inability to directly or indirectly collect all or a part of the principal of or interest on loans; delays in the foreclosure process and increased servicing advances; and increased repurchase and indemnification claims.
Proposals to change the statutes affecting financial services companies are frequently introduced in Congress, state legislatures and local governing bodies and, if enacted, may affect our operating environment in substantial and unpredictable ways. In addition, numerous federal, state and local regulators have the authority to pass or change regulations that could affect our operating environment in substantial and unpredictable ways. We cannot determine whether any such legislative or regulatory proposals will be enacted and, if enacted, the ultimate impact that any such potential legislation or implementing regulations, or any such potential regulatory actions by federal or state regulators, would have upon our financial condition or results of operations.
In addition, as a result of the U.S. presidential election held on November 3, 2020, there is a risk that the new presidential administration could increase requirements with respect to existing COVID-19 programs, could impose new COVID-19 programs and restrictions, including new forbearance initiatives, and could otherwise revise or create new regulatory requirements that apply to us or increase regulatory enforcement and examination efforts at the loan origination and servicing sectors, impacting our business, operations and profitability.
With respect to state regulation, although we seek to comply with applicable state loan, loan broker, mortgage loan originator, servicing, debt collection and similar statutes in all U.S. jurisdictions, and with licensing or other requirements that we believe may be applicable to us, if we are found to not have complied with applicable laws, we could lose one or more of our licenses or authorizations or face other sanctions or penalties or be required to obtain a license in such jurisdiction, which may have an adverse effect on our ability to continue to originate mortgage loans, perform our servicing obligations or make our loan platform available to borrowers in particular states, which may adversely impact our business.
We depend on the programs of the Agencies. Discontinuation, or changes in the roles or practices, of these entities, without comparable private sector substitutes, could materially and negatively affect our results of operations and ability to compete.
We sell mortgage loans to various entities, including Fannie Mae and Freddie Mac, which include the mortgage loans in GSE-guaranteed securitizations. In addition, we pool FHA insured and VA guaranteed mortgage loans, which back securities guaranteed by Ginnie Mae. We derive material financial benefits from our relationships with the Agencies, as our ability to originate and sell mortgage loans under their programs reduces
53
Table of Contents
our credit exposure and mortgage loans inventory financing costs. In addition, we receive compensation for servicing loans on behalf of Fannie Mae, Freddie Mac and Ginnie Mae.
The future of the GSEs and the role of the Agencies in the U.S. mortgage markets are uncertain. In 2008, Fannie Mae and Freddie Mac experienced catastrophic credit losses and were placed in the conservatorship of the FHFA. As a result, housing finance reform continues to be an ongoing topic of discussion. The roles of the GSEs (including as insurers or guarantors of MBS) could be eliminated, or significantly reduced as a consequence of such proposed reforms. Elimination of the traditional roles of Fannie Mae and Freddie Mac, or any changes to the nature or extent of the guarantees provided by Fannie Mae and Freddie Mac or the fees, terms and guidelines that govern our selling and servicing relationships with them, such as increases in the guarantee fees we are required to pay, initiatives that increase the number of repurchase requests and/or the manner in which they are pursued, or possible limits on delivery volumes imposed upon us and other seller/servicers, could also materially and adversely affect our business, including our ability to sell and securitize loans through our loan production segment, and the performance, liquidity and market value of our investments. Moreover, any changes to the nature of the GSEs or their guarantee obligations could redefine what constitutes an Agency MBS and could have broad adverse implications for the market and our business, financial condition, liquidity and results of operations.
The Trump administration has made reforming Fannie Mae and Freddie Mac, including their relationship with the federal government, a priority. In September 2019, the U.S. Department of the Treasury released a proposal for reform, and, in October 2019, FHFA released a strategic plan regarding the conservatorships, which included a Scorecard that has Fannie Mae and Freddie Mac preparing for exiting conservatorship as one of its key objectives. Among other things, the Treasury recommendations include recapitalizing the GSEs, increasing private-sector competition with the GSEs, replacing GSE statutory affordable housing goals, changing mortgage underwriting requirements for GSE guarantees, revising the CFPB qualified mortgage regulations (for further discussion of these regulations, see ”—Risks related to regulatory environment—The CFPB continues to be active in its monitoring of the loan origination and servicing sectors, and its rules increase our regulatory compliance burden and associated costs.”), and continuing to support the market for 30-year fixed-rate mortgages. Some of Treasury’s recommendations would require administrative action whereas others would require legislative action. It is uncertain whether these recommendations will be enacted. If these recommendations are enacted, the future roles of Fannie Mae and Freddie Mac could be reduced (perhaps significantly) and the nature of their guarantee obligations could be considerably limited relative to historical measurements. In addition, various other proposals to generally reform the U.S. housing finance market have been offered by members of the U.S. Congress, and certain of these proposals seek to significantly reduce or eliminate over time the role of the GSEs in purchasing and guaranteeing mortgage loans. Any such proposals, if enacted, may have broad adverse implications for the MBS market and our business. It is possible that the adoption of any such proposals might lead to higher fees being charged by the GSEs or lower prices on our sales of mortgage loans to them.
The extent and timing of any reform regarding the GSEs and/or the home mortgage market are uncertain, which makes our business planning more difficult. Discontinuation, or significant changes in the roles or practices, of the Agencies, including changes to their guidelines and other proposed reforms, could require us to revise our business models, which could ultimately negatively impact our results of operations. Significant uncertainty also persists regarding the competitive impact of proposals to eliminate the GSEs in favor of private sector models.
Changes in GSE or Ginnie Mae selling and/or servicing guidelines could adversely affect our business, financial condition and results of operations.
The Agencies require us to follow specific guidelines, which may be changed at any time. The Agencies have the ability to provide monetary incentives for loan servicers that perform well and to assess penalties for those that do not, including compensatory penalties against loan servicers in connection with the failure to meet
54
Table of Contents
specified timelines relating to delinquent loans and foreclosure proceedings and other breaches of servicing obligations. We generally cannot negotiate the terms of these guidelines or predict the penalties that the Agencies might impose for a failure to comply with those guidelines. Any failure by us to conform to these guidelines would materially adversely affect us.
We are required to follow specific guidelines that impact the way that we originate and service Agency loans, including guidelines with respect to:
| • | credit standards for mortgage loans; |
| • | maintaining prepayment speeds commensurate with that of our peers; |
| • | our staffing levels and other origination and servicing practices; |
| • | the fees that we may charge to consumers or pass-through to the Agencies; |
| • | our modification standards and procedures; |
| • | unanticipated changes to pricing and guarantee fees; |
| • | the amount of non-reimbursable advances; and |
| • | internal controls such as data privacy and security, compliance, quality control and internal audit. |
Our selling and servicing obligations under our contracts with the Agencies may be amended, restated, supplemented or otherwise modified by the Agencies from time to time without our specific consent. A significant modification to our selling and/or servicing obligations under our Agency contracts could adversely affect our business, financial condition and results of operations.
In particular, the nature of the GSEs’ guidelines for servicing delinquent mortgage loans that they own, or that back securities which they guarantee, can result in monetary incentives for servicers that perform well and penalties for those that do not. In addition, the FHFA has directed Fannie Mae to assess compensatory penalties against servicers in connection with the failure to meet specified timelines relating to delinquent loans and foreclosure proceedings and other breaches of servicing obligations. A significant change in these guidelines that has the effect of decreasing the fees we charge or requires us to expend additional resources in providing mortgage loan services could decrease our revenues or increase our costs, which would adversely affect our business, financial condition and results of operations.
We are subject to regulatory investigations and inquiries and may incur fines, penalties and increased costs that could negatively impact our future liquidity, financial position and results of operations or damage our reputation.
Federal and state agencies have broad enforcement powers over us and others in the loan origination and servicing industry, including powers to investigate our lending and servicing practices and broad discretion to deem particular practices unfair, deceptive, abusive or otherwise not in accordance with the law. See “Business—Supervision and regulation.” The continued focus of regulators on the practices of the loan origination and servicing industry have resulted and could continue to result in new enforcement actions that could directly or indirectly affect the manner in which we conduct our business and increase the costs of defending and settling any such matters, which could impact our reputation and/or results of operations.
In addition, the laws and regulations applicable to us are subject to administrative or judicial interpretation, but some of these laws and regulations have been enacted only recently and may not yet have been interpreted or may be interpreted infrequently. As a result of infrequent or sparse interpretations, ambiguities in these laws and regulations may leave uncertainty with respect to permitted or restricted conduct under them. Any ambiguity under a law to which we are subject may lead to regulatory investigations, governmental enforcement actions or private causes of action, such as class action lawsuits, with respect to our compliance with applicable laws and
55
Table of Contents
regulations. Provisions that by their terms, or as interpreted, apply to lenders or servicers of loans may be construed in a manner that favors our borrowers and customers over loan originators and servicers. Furthermore, provisions of our loan agreements could be construed as unenforceable by a court.
Failure to obtain approval from Fannie Mae or applicable state regulators prior to consummation of this offering could adversely affect our business.
The transactions described in “Organizational Structure,” including the consummation of this offering, require certain state regulatory and Agency approvals. As of the date of this prospectus, we have not obtained an approval of the Transactions from Fannie Mae. During the nine month period ended September 30, 2020 and the year ended December 31, 2019, Fannie Mae accounted for approximately 30% and 11%, respectively, of our sold mortgage production and approximately 28% and 15%, respectively, of our servicing portfolio at period end. Our failure to obtain such approval prior to consummating this offering means that our business that involves Fannie Mae may be restricted. In this regard, Fannie Mae could impose a number of remedies or certain other requirements, including but not limited to compensatory fees, restricting our ability to sell originated loans to Fannie Mae, service Fannie Mae loans or hold Fannie Mae related servicing rights, or impose other requirements that may have the effect of limiting our business. While we believe it to be unlikely, it is also possible that Fannie Mae could suspend or terminate our Fannie Mae seller/servicer approval. Any such business restrictions or suspension or termination of our Fannie Mae seller/servicer approval may need to be reported to regulators, Agencies, or other counterparties and could adversely impact our business.
The CFPB continues to be active in its monitoring of the loan origination and servicing sectors, and its rules increase our regulatory compliance burden and associated costs.
We are subject to the regulatory, supervisory and examination authority of the CFPB, which has oversight of federal and state non-depository lending and servicing institutions, including residential mortgage originators and loan servicers. The CFPB has rulemaking authority with respect to many of the federal consumer protection laws applicable to mortgage lenders and servicers, including TILA and RESPA and the Fair Debt Collections Practices Act. The CFPB has issued a number of regulations under the Dodd-Frank Act relating to loan origination and servicing activities, including ability-to-repay and “Qualified Mortgage” standards and other origination standards and practices as well as servicing requirements that address, among other things, periodic billing statements, certain notices and acknowledgements, prompt crediting of borrowers’ accounts for payments received, additional notice, review and timing requirements with respect to delinquent borrowers, loss mitigation, prompt investigation of complaints by borrowers, and lender-placed insurance notices. The CFPB has also amended provisions of HOEPA regarding the determination of high-cost mortgages, and of Regulation B, to implement additional requirements under the ECOA with respect to valuations, including appraisals and automated valuation models. The CFPB has also issued guidance to loan servicers to address potential risks to borrowers that may arise in connection with transfers of servicing. Additionally, through bulletins 2012-03 and 2016-02, the CFPB has increased the focus on lender liability and vendor management across the mortgage and settlement services industries, which may vary depending on the services being performed.
For example, the CFPB iteratively adopted rules over the course of several years regarding mortgage servicing practices that required us to make modifications and enhancements to our mortgage servicing processes and systems.
The CFPB’s examinations have increased, and will likely continue to increase, our administrative and compliance costs. They could also greatly influence the availability and cost of residential mortgage credit and increase servicing costs and risks. These increased costs of compliance, the effect of these rules on the lending industry and loan servicing, and any failure in our ability to comply with the new rules by their effective dates, could be detrimental to our business. The CFPB also issued guidelines on sending examiners to banks and other institutions that service and/or originate mortgages to assess whether consumers’ interests are protected. The CFPB has conducted routine examinations of our business and will conduct future examinations.
56
Table of Contents
The CFPB also has broad enforcement powers, and can order, among other things, rescission or reformation of contracts, the refund of moneys or the return of real property, restitution, disgorgement or compensation for unjust enrichment, the payment of damages or other monetary relief, public notifications regarding violations, limits on activities or functions, remediation of practices, external compliance monitoring and civil money penalties. The CFPB has been active in investigations and enforcement actions and, when necessary, has issued civil money penalties to parties the CFPB determines have violated the laws and regulations it enforces. Our failure to comply with the federal consumer protection laws, rules and regulations to which we are subject, whether actual or alleged, could expose us to enforcement actions or potential litigation liabilities.
In addition, the occurrence of one or more of the foregoing events or a determination by any court or regulatory agency that our policies and procedures do not comply with applicable law could impact our business operations. For example, if the violation is related to our servicing operations it could lead to downgrades by one or more rating agencies, a transfer of our servicing responsibilities, increased delinquencies on mortgage loans we service or any combination of these events. Such a determination could also require us to modify our servicing standards. The expense of complying with new or modified servicing standards may be substantial. Any such changes or revisions may have a material impact on our servicing operations, which could be detrimental to our business.
The federal government may seek significant monetary damages and penalties against mortgage loan lenders and servicers under the Financial Institutions Reform, Recovery, and Enforcement Act of 1989 (“FIRREA”) and the False Claims Act (“FCA”) for making false statements and seeking reimbursement for ineligible costs and expenses.
During the Obama administration, the federal government initiated a number of actions against mortgage loan lenders and servicers alleging violations of FIRREA and the FCA. Some of the actions against lenders alleged that the lenders sold defective loans to Fannie Mae and Freddie Mac, while representing that the loans complied with the GSE’s underwriting guidelines. The federal government has also brought actions against lenders asserting that they submitted claims for FHA-insured loans that the lender falsely certified to HUD met FHA underwriting requirements that resulted in FHA paying out millions of dollars in insurance claims to cover the defaulted loans. See “Business—Supervision and regulation—Supervision and enforcement” and the risk factor captioned “—We are subject to regulatory investigations and inquiries and may incur fines, penalties and increased costs that could negatively impact our future liquidity, financial position and results of operations or damage our reputation.” Because these actions carry the possibility for treble damages, many have resulted in settlements totaling in the hundreds of millions of dollars, as well as required lenders and servicers to make significant changes in their practices.
In October 2019 HUD and the U.S. Department of Justice signed an Interagency Memorandum on the Application of the False Claims Act (“FCA”) that provides prudential guidance on appropriate use of the FCA for violations by FHA lenders. HUD anticipates that FHA requirements will be enforced primarily through HUD’s administrative proceedings, but the memorandum specifically addresses how HUD and the United States Department of (“DOJ”), including the U.S. Attorneys’ Offices, will consult with each other regarding use of the FCA in connection with defects on mortgage loans insured by FHA. HUD will utilize the Mortgagee Review Board (“MRB”), which was created by statute and empowered to take certain actions for non-compliance by FHA lenders, to review and refer FCA claims. The memorandum prescribes the standards for when HUD, through the MRB, may refer a matter to DOJ for pursuit of FCA claims, and also sets forth how DOJ and HUD will cooperate during the investigative, litigation, and settlement phases of FCA matters when DOJ receives a referral from a third party, such as in qui tam cases. The memorandum also recognizes that application of the FCA requires, among other elements of proof, a material violation of HUD requirements, and DOJ attorneys will solicit HUD’s views to determine whether the elements of the FCA can be established. In light of the fact that the memorandum was signed only recently and the change in administration, it is difficult to predict the role that FCA claims will play in the future.
57
Table of Contents
Unlike our competitors that are depository institutions, we are subject to state licensing and operational requirements that result in substantial compliance costs and our business would be adversely affected if our licenses are impaired.
Because we are not a federally chartered depository institution, we generally do not benefit from federal preemption of state mortgage loan banking, loan servicing or debt collection licensing and regulatory requirements. We must comply with state licensing requirements and varying compliance requirements in all the states in which we operate and the District of Columbia, and we are sensitive to regulatory changes that may increase our costs through stricter licensing laws, disclosure laws or increased fees or that may impose conditions to licensing that we or our personnel are unable to meet. Further, our reliance on Warehouse Lines for purposes of funding loans contains certain risks, as the recent mortgage loan crisis resulted in Warehouse Lines lenders refusing to honor lines of credit for non-banks without a deposit base.
In most states in which we operate, a regulatory agency or agencies regulate and enforce laws relating to loan servicers, brokers and originators. These rules and regulations, which vary from state to state, generally provide for, but are not limited to: licensing as a loan servicer, loan originator or broker (including individual-level licensure for employees engaging in loan origination activities), loan modification processor/underwriter or third-party debt default specialist (or a combination thereof); requirements as to the form and content of contracts and other documentation; licensing of our employees and independent contractors with whom we contract; and employee hiring background checks. They also set forth restrictions on origination, brokering, servicing and collection practices, restrictions related to fees and charges, including interest rate limits, and disclosure and record-keeping requirements. They establish a variety of borrowers’ rights in the event of violations of such rules. Future state legislation and changes in existing laws and regulations may significantly increase our compliance costs or reduce the amount of ancillary fees, including late fees that we may charge to borrowers. This could make our business cost-prohibitive in the affected state or states and could materially affect our business. For example, the California state legislature on August 31, 2020 passed a bill that replaced California’s Department of Business Oversight with a new Department of Financial Protection and Innovation that is modeled after the CFPB. Governor Newsom signed the bill into law on September 25, 2020. While this bill does not directly apply to us because the bill contains an exemption for most existing licensees, this could establish a model for other states to create similar agencies that would supervise our residential lending and servicing activities.
In addition, we are subject to periodic examinations by state and other regulators in the jurisdictions in which we conduct business, which can result in increases in our administrative costs and refunds to borrowers of certain fees earned by us, and we may be required to pay substantial penalties imposed by those regulators due to compliance errors, or we may lose our license or our ability to do business in the jurisdiction otherwise may be impaired. Fines and penalties incurred in one jurisdiction may cause investigations or other actions by regulators in other jurisdictions.
We may not be able to maintain all currently requisite licenses and permits. In addition, the states that currently do not provide extensive regulation of our business may later choose to do so, and if such states so act, we may not be able to obtain or maintain all requisite licenses and permits, which could require us to modify or limit our activities in the relevant state(s). The failure to satisfy those and other regulatory requirements could result in a default under our Warehouse Lines, other financial arrangements and/or servicing agreements and thereby have a material adverse effect on our business, financial condition and results of operations.
The current COVID-19 pandemic has increased the risk that mortgage loan servicers will be unable to foreclose upon delinquent borrowers in a timely manner.
On March 27, 2020 the president signed the CARES Act into law. The law includes important, immediate protections for tenants and homeowners. In addition, states and local governments have enacted similar protections for tenants and homeowners. The law included an eviction moratorium that restricts lessors of
58
Table of Contents
“covered properties” from filing new eviction actions for non-payment of rent, and also prohibits charging fees, penalties, or other charges to the tenant related to such nonpayment of rent. The federal moratorium also provides that a lessor (of a covered property) may not evict a tenant after the moratorium expires except on 30 days’ notice—which may not be given until after the moratorium period. The eviction moratorium applies to “covered dwellings,” which includes those dwellings on or in “covered properties.” The federal moratorium defines a “covered property” as a property that has a federally backed mortgage loan; or has a federally backed multifamily mortgage loan. The federal eviction moratorium took effect on March 27, 2020 and expired 120 days later. State and local governments have also enacted their own moratoriums on evictions. Some of these moratoriums bar evictions during the “emergency period,” the definition of which can vary based on the city or county. The GSE’s and HUD have also extended their eviction moratoriums through the end of the year, and further extensions are possible. Additionally, the law includes provisions restricting the ability of lenders to foreclose on properties for certain periods of time. To the extent that we have originated or are servicing mortgage loans for properties that are covered by any of these moratoriums, the owners of these properties may not be able to receive rent payments from tenants as expected, which may in turn cause these owners to delay or reduce their payments on their mortgage loans.
While the CFPB recently announced its flexible supervisory and enforcement approach during the COVID-19 pandemic on certain consumer communications required by the mortgage servicing rules, managing to the CFPB’s loss mitigation rules with mounting CARES Act forbearance requests is particularly challenging. The intersection of the CFPB’s mortgage servicing rules and the COVID-19 pandemic is evolving and will pose new challenges to the servicing industry. The CFPB’s recent publication of COVID-19-related FAQs did not resolve potential conflicts between the CARES Act and the Fair Credit Reporting Act with respect to reporting of consumer credit information mandated by the Fair Credit Reporting Act. There are conflicting interpretations of the CARES Act amendment of the Fair Credit Reporting Act with regards to delinquent loans entering a forbearance.
We may be subject to liability for potential violations of predatory lending laws, which could adversely impact our results of operations, financial condition and business.
Various U.S. federal, state and local laws have been enacted that are designed to discourage predatory lending practices. HOEPA amended TILA to prohibit inclusion of certain provisions in “high cost mortgage loans” that have interest rates or origination costs in excess of prescribed levels, and require that borrowers receiving such loans be given certain disclosures, in addition to the standard TILA mortgage loan disclosures, prior to origination. It also provides that an assignee of such a “high cost mortgage loan” is subject to all claims and any defense which the borrower could assert against the original creditor, which has severely constrained the secondary market for such loans. The Dodd-Frank Act amended HOEPA to enhance its protections. The amendments expanded the types of loans covered by HOEPA to include home-purchase loans and open-end, home-secured credit transactions (such as home equity lines of credit) which were previously exempt; added a new HOEPA threshold for what is considered a high-cost mortgage based on prepayment penalties; lowered the two existing thresholds based on a loan’s rate and points and fees so more loans will qualify as high-cost loans; and imposed additional restrictions on high-cost loans, such as prohibiting balloon payment features (with certain exceptions) regardless of the term. Some states have enacted, or may enact, similar laws or regulations, which in some cases impose restrictions and requirements greater than those in HOEPA. In addition, under the anti-predatory lending laws of some states, the origination of certain mortgage loans, including loans that are not classified as “high-cost” loans under applicable law, must satisfy a net tangible benefit test with respect to the related borrower. Such tests may be highly subjective and open to interpretation. As a result, a court may determine that a residential mortgage loan, for example, does not meet the test even if the related originator reasonably believed that the test was satisfied. If any of our mortgage loans are found to have been originated in violation of predatory or abusive lending laws, we could incur losses, which could adversely impact our results of operations, financial condition and business. If any of our mortgage loans are found to exceed high-cost thresholds under HOEPA or equivalent state laws, we may be unable to sell them on the secondary market and/or be required to repurchase them from our investors.
59
Table of Contents
Regulatory agencies and consumer advocacy groups are becoming more aggressive in asserting claims that the practices of lenders and loan servicers result in a disparate impact on protected classes.
Antidiscrimination statutes, such as the Fair Housing Act and the ECOA, prohibit creditors from discriminating against loan applicants and borrowers based on certain characteristics, such as race, religion and national origin. Various federal regulatory agencies and departments, including the DOJ and CFPB, take the position that these laws apply not only to intentional discrimination, but also to neutral practices that have a disparate impact on a group that shares a characteristic that a creditor may not consider in making credit decisions relating to protected classes (i.e., creditor or servicing practices that have a disproportionate negative affect on a protected class of individuals).
These regulatory agencies, as well as consumer advocacy groups and plaintiffs’ attorneys, are focusing greater attention on “disparate impact” claims. In 2015, the U.S. Supreme Court confirmed that the “disparate impact” theory applies to cases brought under the Fair Housing Act, while emphasizing that a causal relationship must be shown between a specific policy of the defendant and a discriminatory result that is not justified by a legitimate objective of the defendant. Although it is still unclear whether the theory applies under ECOA, regulatory agencies and private plaintiffs can be expected to continue to apply it to both the Fair Housing Act and ECOA in the context of mortgage loan lending and servicing. To the extent that the “disparate impact” theory continues to apply, we may be faced with significant administrative burdens in attempting to comply and potential liability for failures to comply.
In addition to reputational harm, violations of the ECOA and the Fair Housing Act can result in actual damages, punitive damages, injunctive or equitable relief, attorneys’ fees and civil money penalties.
The Dodd-Frank Act prevents us from using arbitration agreements to protect against class actions on residential real estate loans.
At present, where permitted by applicable law, companies providing consumer products and services, frequently require their customers to agree to arbitrate any disputes on an individual basis rather than pursuing lawsuits, including class actions. Such agreements are binding in accordance with their terms as a matter of federal law, even where state law provides otherwise. Thus, arbitration agreements can serve as a vehicle for eliminating class action exposure.
Under the Dodd-Frank Act, arbitration agreements are not permitted for residential real estate loans. Accordingly, in the event of a purported violation of applicable law with respect to our real estate lending activities, we could be subject to class action liability.
In recent years, federal regulators and the DOJ have increased their focus on enforcing the Servicemembers Civil Relief Act (“SCRA”) against loan owners and servicers. Similarly, state legislatures have taken steps to strengthen their own state-specific versions of the SCRA.
The SCRA provides relief to borrowers who enter active military service and to borrowers in reserve status who are called to active duty after the origination of their mortgage loan. The SCRA provides generally that a borrower who is covered by the SCRA may not be charged interest on a mortgage loan in excess of 6% per annum during the period of the borrower’s active duty. The DOJ and federal regulators have entered into significant settlements with a number of loan servicers alleging violations of the SCRA. Some of the settlements have alleged that the servicers did not correctly apply the SCRA’s 6% interest rate cap, while other settlements have alleged that servicers did not comply with the SCRA’s foreclosure and default judgment protections when seeking to foreclose upon a mortgage loan note or collect payment of a debt. Recent settlements indicate that the DOJ and federal regulators broadly interpret the scope of the substantive protections under the SCRA and are moving aggressively both to identify instances in which loan servicers have not complied with the SCRA. Alleged SCRA non-compliance was a focal point of the National Mortgage Settlement by the DOJ as well as the
60
Table of Contents
Independent Foreclosure Review jointly supervised by the Office of the Comptroller of the Currency and the Board of Governors of the Federal Reserve, and several additional SCRA-related settlements continue to make this a significant area of scrutiny for both regulatory examinations and public enforcement actions.
In addition, most states have their own versions of the SCRA. In most instances these laws extend some or all of the substantive benefits of the federal SCRA to members of the state National Guard who are in state service, but certain states also provide greater substantive protections to National Guard members or individuals who are in federal military service. Recent years have seen states revise their laws to increase the potential benefits to individuals, and these changes pose additional compliance burdens on creditors as they seek to comply with both the federal and relevant state versions of the SCRA.
Privacy and information security are an increasing focus of regulators at the federal and state levels.
Privacy requirements under the Gramm-Leach-Bliley Act (“GLBA”) and Fair Credit Reporting Act (“FCRA”) are within the regulatory and enforcement authority of the CFPB and are a standard part of CFPB examinations. Information security requirements under GLBA and FCRA are, for non-depository mortgage lenders, generally under the regulatory and enforcement authority of the Federal Trade Commission (“FTC”). The FTC has taken several actions against financial institutions and other companies for failure to adequately safeguard personal information. State entities may also initiate actions for alleged violations of privacy or security requirements under state law.
We are also subject to a variety of other local, state, national and international laws, directives and regulations that apply to the collection, use, retention, protection, disclosure, transfer and other processing of personal information, including the California Consumer Privacy Act (“CCPA”), which took effect on January 1, 2020 and provides California consumers with new privacy rights such as the right to request deletion of their data, the right to receive data on record for them and the right to know what categories of data are maintained about them, and increases the privacy and security obligations of entities handling certain personal information of such consumers. The CCPA allows consumers to submit verifiable consumer requests regarding their personal information and requires our business to implement procedures to comply with such requests. The California Attorney General issued, and subsequently updated, proposed regulations to further define and clarify the CCPA. The impact of this law and its corresponding regulations, future enforcement activity and potential liability is unknown. Moreover, a new proposed privacy law, the California Privacy Rights Act (“CPRA”) was approved by California voters in the November 3, 2020 election. The CPRA, which becomes effective on January 1, 2023, will significantly modify the CCPA, potentially resulting in further uncertainty and requiring us to incur additional costs and expenses in an effort to comply. While CCPA and CPRA contain exceptions for data subject to GLBA, and those exceptions cover the majority of our transactional data, these data protection and privacy law regimes continue to evolve and may result in ever-increasing public scrutiny and escalating levels of enforcement and sanctions and increased costs for compliance. Several additional states have enacted similar laws to the CCPA and we expect more states to follow. Furthermore, we also must comply with regulations in connection with doing business and offering loan products over the internet, including various state and federal e-signature rules mandating that certain disclosures be made, and certain steps be followed in order to obtain and authenticate e-signatures, with which we have limited experience.
Failure to comply with any of these laws could result in enforcement action against us, including fines, imprisonment of company officials and public censure, any of which could result in serious harm to our reputation, business and have a material adverse effect on our business, financial condition and results of operations. Subsequent changes to data protection and privacy laws could also impact how we process personal information, and therefore limit the effectiveness of our products or services or our ability to operate or expand our business, including limiting strategic partnerships that may involve the sharing of personal information.
61
Table of Contents
The Federal Communications Commission (“FCC”) and the FTC have increased their enforcement of the Telephone Consumer Protection Act (“TCPA”) and the Telemarketing Sales Rule.
The TCPA, Telemarketing Sales Rule and related laws and regulations govern, among other things, communications via telephone and text and the use of automatic telephone dialing systems (“ATDS”) and artificial and prerecorded voices. The FCC and the FTC have responsibility for regulating various aspects of these laws. The TCPA requires us to adhere to “do-not-call” registry requirements which, in part, mandate we maintain and regularly update lists of consumers who have chosen not to be called and restrict calls to consumers who are on a state or national do-not-call list. Many states have similar consumer protection laws regulating telemarketing. These laws limit our ability to communicate with consumers and reduce the effectiveness of our marketing programs. The TCPA does not distinguish between voice and data, and as such, short message service and multimedia message service messages are also “calls” for the purpose of TCPA obligations and restrictions.
The TCPA provides that it is unlawful for any person within the United States, or any person outside the United States if the recipient is within the United States, to make any call (other than a call made for emergency purposes or made with the prior express consent of the called party) using any ATDS or an artificial or prerecorded voice to any telephone number or other number for which the called party is charged. In 2013, the FCC adopted new rules stating that the party making the call must obtain “prior express written consent” from the called party with respect to any communication covered by the TCPA that was made after October 16, 2013, which introduces an advertisement or that constitutes telemarketing. These requirements are significantly more rigorous and detailed than the requirements for prior express consent in other contexts. The TCPA provides a private right of action under which a plaintiff, including a plaintiff in a class action, may recover actual monetary loss or $500 for each call or text made in violation of the prohibitions on calls made using an “artificial or pre-recorded voice” or ATDS. A court may treble the amount of damages upon a finding of a “willful or knowing” violation. There is no statutory cap on maximum aggregate exposure (although some courts have applied in TCPA class actions constitutional limits on excessive penalties). An action may be brought by the FCC, a state attorney general, an individual, or a class of individuals. Like other companies that rely on telephone and text communications, we are regularly subject to putative, class action suits alleging violations of the TCPA. To date, no such class has been certified. If in the future we are found to have violated the TCPA, the amount of damages and potential liability could be extensive and adversely impact our business. Accordingly, were such a class certified or if we are unable to successfully defend such a suit, then TCPA damages could have a material adverse effect on our results of operations and financial condition.
Risks Related to Our Indebtedness
We rely on warehouse lines of credit and other sources of capital and liquidity to meet the financing requirements of our business.
Our ability to finance our operations and repay maturing obligations rests on our ability to borrow money and secure investors to purchase loans we originate or facilitate. We rely in particular on our warehouse lines of credit to fund our mortgage loan originations. We are generally required to renew our Warehouse Lines each year, which exposes us to refinancing, interest rate, and counterparty risks. As of September 30, 2020, we had thirteen Warehouse Lines which provide an aggregate available mortgage loan lending facility of $5.5 billion, and eleven of our Warehouse Lines allow advances to fund loans at closing of the consumer’s mortgage loan. We rely on two such Warehouse Line providers for 29% of our aggregate available home lending facility. If any Warehouse Line provider ceased doing business with us, our business, operations, and results of operations could materially suffer. See “Management’s discussion and analysis of financial condition and results of operations—Liquidity and capital resources—Warehouse lines.” Our ability to extend or renew existing Warehouse Lines and obtain new Warehouse Lines is affected by a variety of factors including:
| • | limitations imposed on us under our Warehouse Lines and other debt agreements, including restrictive covenants and borrowing conditions, which limit our ability to raise additional debt and require that we maintain certain financial results, including minimum tangible net worth, minimum liquidity, minimum |
62
Table of Contents
| pre-tax net income, minimum debt service coverage ratio, and maximum total liabilities to tangible net worth ratio as well as require us to maintain committed Warehouse Lines with third-party lenders; |
| • | changes in financial covenants mandated by Warehouse Line lenders, which we may not be able to achieve; |
| • | any decrease in liquidity in the credit markets; |
| • | potential valuation changes to our mortgage loans, servicing rights or other collateral; |
| • | prevailing interest rates; |
| • | the strength of the Warehouse Line lenders from whom we borrow, and the regulatory environment in which they operate, including proposed capital strengthening requirements; |
| • | our ability to sell our products to the Agencies; |
| • | Warehouse Line lenders seeking to reduce their exposure to residential loans due to other reasons, including a change in such lender’s strategic plan or lines of business; and |
| • | accounting changes that may impact calculations of covenants in our Warehouse Lines and other debt agreements which result in our ability to continue to satisfy such covenants. |
Warehouse Lines may not be available to us with counterparties on acceptable terms or at all. While we believe that our current ability to access Warehouse Lines for our mortgage loan products has been enhanced due to our operating history, experience and performance under the Warehouse Line facilities, it is possible that this advantage will dissipate as new mortgage loan products are developed and introduced, as the cost and terms of credit with respect to those new mortgage loan products may prove to be less favorable than the terms we have for our current mortgage loan products, or the terms that our competitors may have on their new mortgage loan products.
Our access to and our ability to renew our existing Warehouse Lines could suffer in the event of: (i) the deterioration in the performance of the mortgage loans underlying the Warehouse Lines; (ii) our failure to maintain sufficient levels of eligible assets or credit enhancements; (iii) our inability to access the secondary market for mortgage loans (see “—We depend on the programs of the Agencies. Discontinuation, or changes in the roles or practices, of these entities, without comparable private sector substitutes, could materially and negatively affect our; results of operations and ability to compete.”) or (iv) termination of our role as servicer of the underlying mortgage loan assets in the event that (x) we default in the performance of our servicing obligations or (y) we declare bankruptcy or become insolvent.
An event of default, an adverse action by a regulatory authority or a general deterioration in the economy that constricts the availability of credit, similar to the market conditions in 2007 through 2010, may increase our cost of funds and make it difficult or impossible for us to renew existing Warehouse Lines or obtain new Warehouse Lines, any of which would have a material adverse effect on our business and results of operations, and would result in substantial diversion of our management’s attention.
Our existing indebtedness, including the Senior Notes, Secured Credit Facilities, GMSR VFN, Term Notes, 2020-VF1 Notes and Warehouse Lines, also impose financial and non-financial covenants and restrictions on us that limit the amount of indebtedness that we may incur, impact our liquidity through minimum cash reserve requirements, and impact our flexibility to determine our operating policies and investment strategies. Certain of our warehouse lines contain financial covenants under which net income or net income before income taxes for the applicable measurement period must be $1.00 or more. If we default on one of our obligations under a Warehouse Line or breach our representations and warranties contained therein, the lender may be able to terminate the transaction, accelerate any amounts outstanding, require us to prematurely repurchase the loans, and cease entering into any other repurchase transactions with us. Because our Warehouse Lines typically contain cross-default provisions, a default that occurs under any one agreement could allow the lenders under our
63
Table of Contents
other agreements and under our other debt obligations to also declare a default. Additional Warehouse Lines, bank credit facilities or other debt facilities that we may enter into in the future may contain additional covenants and restrictions. If we fail to meet or satisfy any of these covenants, we would be in default under these agreements, and our lenders could elect to declare outstanding amounts due and payable, terminate their commitments, require the posting of additional collateral and enforce their interests against existing collateral. Any losses that we incur on our Warehouse Lines could materially adversely affect our financial condition and results of operations.
See “Management’s Discussion and Analysis of Financial Condition and Results of Operations—Liquidity and Capital Resources—Debt obligations” for more information about these and other financing arrangements. If we are unable to access such other sources of capital and liquidity, our business, financial condition and results of operations may be negatively impacted.
Our indebtedness and other financial obligations may limit our financial and operating activities and our ability to incur additional debt to fund future needs.
As of September 30, 2020, we had $5.3 billion of outstanding indebtedness, of which $4.6 billion was secured, short-term indebtedness under our Warehouse Lines, $401.8 million was secured indebtedness under the Term Notes, the Secured Credit Facilities, the GMSR VFN and capital lease obligations. For more information regarding our financing arrangements, see “—Warehouse lines” and “—Debt obligations” under “Management’s discussion and analysis of financial condition and results of operations—Liquidity and capital resources.” and “—Secured credit facilities” under “Description of certain other indebtedness.” Subject to the limits contained in the credit agreements that govern the Secured Credit Facilities, the indenture that governs our Senior Notes and the applicable agreements governing our other debt instruments, we may be able to incur substantial additional debt from time to time to finance working capital, capital expenditures, investments or acquisitions, or for other purposes. If we do so, the risks related to our high level of debt could increase. Specifically, our high level of debt could have important consequences to the holders of our Class A Common Stock, including the following:
| • | require us to dedicate a substantial portion of cash flow from operations to the payment of principal and interest on indebtedness, including indebtedness we may incur in the future, thereby reducing the funds available for other purposes; |
| • | limiting our ability to obtain additional financing to fund future working capital, capital expenditures, acquisitions or other general corporate requirements, including our ability to obtain short-term credit, including renewing or replacing Warehouse Lines; |
| • | increase our vulnerability to fluctuations in market interest rates, to the extent that the spread we earn between the interest we receive on our LHFS and the interest we pay under our indebtedness is reduced; |
| • | increasing our cost of borrowing; |
| • | place us at a competitive disadvantage to competitors with relatively less debt in economic downturns, adverse industry conditions or catastrophic external events; or |
| • | reduce our flexibility in planning for, or responding to, changing business, industry and economic conditions. |
In addition, our indebtedness could limit our ability to obtain additional financing on acceptable terms, or at all, to fund our day-to-day loan origination operations, future acquisitions, working capital, capital expenditures, debt service requirements, general corporate and other purposes, any of which would have a material adverse effect on our business and financial condition. The agreements governing our outstanding indebtedness contain financial and other restrictive covenants that limit our ability to engage in activities that may be in our long-term best interests. Our failure to comply with those covenants could result in an event of default, which, if not cured or waived, could result in the acceleration of such debt. Our liquidity needs could vary significantly and may be
64
Table of Contents
affected by general economic conditions, industry trends, performance and many other factors not within our control. Further, our Warehouse Lines are short-term debt that must to be renewed by our lenders on a regular basis, typically once a year.
Obligations under our indebtedness could have other important consequences. For example, our failure to comply with the restrictive covenants in the agreements governing our indebtedness that limit our ability to incur liens, to incur debt and to sell assets, among other things, could result in an event of default that, if not cured or waived, could harm our business or prospects and could result in our bankruptcy. In addition, if we defaulted on our obligations under any of our secured debt, our secured lenders could proceed against the collateral granted to them to secure that indebtedness. Furthermore, if we default on our obligations under one debt agreement, it may trigger defaults under our other debt agreements which include cross-default provisions.
Risks Related to Our Organizational Structure
We are a holding company with no operations of our own and, as such, we depend on our subsidiaries for cash to fund all of our operations and expenses, including future dividend payments, if any.
We will be a holding company and will have no material assets other than our equity interest in LD Holdings, which is a holding company and will have no material assets other than its 99.99% equity interest in LDLLC, and 100% equity interest in Artemis, LD Settlement Services, and Mello (and indirect interests in other subsidiaries). We have no independent means of generating revenue. We intend to cause LDLLC (and the other subsidiaries, if practicable) to make distributions to LD Holdings, and LD Holdings to make distributions to its unitholders in an amount sufficient to cover all applicable taxes payable by them determined according to assumed rates, payments owing under the tax receivable agreement, and dividends, if any, declared by us. To the extent that we need funds, and LDLLC or LD Holdings are restricted from making such distributions under applicable law or regulation or contract, or are otherwise unable to provide such funds, it could materially and adversely affect our liquidity and financial condition.
We will be a “controlled company” and, as a result, qualify for, and intend to rely on, exemptions from certain corporate governance requirements. You will not have the same protections afforded to stockholders of companies that are subject to such requirements.
After completion of this offering, we will be a “controlled company” within the meaning of the NYSE corporate governance standards. Under these rules, a company of which more than 50% of the voting power is held by an individual, group or another company is a “controlled company” and may elect not to comply with certain corporate governance requirements, including:
| • | the requirement that a majority of the board of directors consists of independent directors; |
| • | the requirement that our director nominees be selected, or recommended for our board of directors’ selection by a nominating and governance committee comprised solely of independent directors with a written charter addressing the nomination process; |
| • | the requirement that the compensation of our executive officers be determined, or recommended to our board of directors for determination, by a compensation committee comprised solely of independent directors; and |
| • | the requirement for an annual performance evaluation of the nominating/corporate governance and compensation committees. |
Following this offering, we intend to use these exemptions. As a result, we may not have a majority of independent directors, our governance and nominating committee and compensation committee may not consist entirely of independent directors and such committees will not be subject to annual performance evaluations. Accordingly, you will not have the same protections afforded to stockholders of companies that are subject to all of the corporate governance requirements.
65
Table of Contents
The Parthenon Stockholders and the Continuing LLC Members control us and their interests may conflict with yours in the future.
Immediately following the offering, the Parthenon Stockholders and the Continuing LLC Members will own approximately 98.9% of the combined voting power of our common stock (or 98.7% if the underwriters’ option is exercised in full). Accordingly, the Parthenon Stockholders and the Continuing LLC Members, if voting in the same manner, will be able to control the election and removal of our directors and thereby determine our corporate and management policies, including potential mergers or acquisitions, payment of dividends, assets sales, amendment of our certificate of incorporation or bylaws and other significant corporate transactions for so long as the Parthenon Stockholders and the Continuing LLC Members retain significant ownership of us. This concentration of ownership may delay or deter possible changes in control of our company, which may reduce the value of an investment in our common stock. So long as the Parthenon Stockholders and the Continuing LLC Members continue to own a significant amount of our combined voting power, even if such amount is less than 50%, they will continue to be able to strongly influence or effectively control our decisions.
In addition, immediately following the offering, the Continuing LLC Members will own 59.4% of the Holdco Units (or 59.0% if the underwriters’ option is exercised in full). Because they hold their ownership interest in our business through LD Holdings, rather than us, these existing unitholders may have conflicting interests with holders of our Class A Common Stock. For example, the Continuing LLC Members may have different tax positions from us which could influence their decisions regarding whether and when to dispose of assets, and whether and when to incur new or refinance existing indebtedness, especially in light of the existence of the tax receivable agreement. In addition, the structuring of future transactions may take into consideration these existing unitholders’ tax considerations even where no similar benefit would accrue to us. See “Certain Relationships and Related Party Transactions—Tax Receivable Agreement.”
Certain of our stockholders will have the right to engage or invest in the same or similar businesses as us.
In the ordinary course of its business activities, Parthenon Capital and its affiliates may engage in activities where its interests conflict with our interests or those of our stockholders. Our amended and restated certificate of incorporation will provide that Parthenon Capital or any of its officers, directors, agents, stockholders, members, partners, affiliates and subsidiaries will have no duty to refrain from engaging directly or indirectly in the same or similar business activities or lines of business as us or any of our subsidiaries, even if the opportunity is one that we might reasonably have pursued or had the ability or desire to pursue if granted the opportunity to do so. No such person will be liable to us for breach of any fiduciary or other duty, as a director or officer or otherwise, by reason of the fact that such person, acting in good faith, pursues or acquires any such business opportunity, directs any such business opportunity to another person or fails to present any such business opportunity, or information regarding any such business opportunity, to us unless, in the case of any such person who is our director or officer, any such business opportunity is expressly offered to such director or officer solely in his or her capacity as our director or officer. Additionally, Anthony Hsieh shall have the right to engage in certain “non-core” business ventures, as disclosed to and previously approved by the Company’s Board of Directors. See “Description of Capital Stock—Corporate Opportunity.”
We will be required to pay, under the tax receivable agreement, the Parthenon Stockholders and certain Continuing LLC Members for certain tax benefits we may claim arising in connection with our purchase of Holdco Units and future exchanges of Holdco Units under the Holdings LLC Agreement, which payments could be substantial.
The Continuing LLC Members may from time to time cause LD Holdings to exchange an equal number of Holdco Units and Class B or Class C Common Stock for cash or Class A Common Stock of loanDepot, Inc. on a one-for-one basis at our election (as described in more detail in “Certain Relationships and Related Party Transactions—Limited Liability Company Agreement of LD Holdings”). In addition, we intend to purchase Holdco Units from the Exchanging Members. As a result of these transactions, we expect to become entitled to certain tax basis adjustments reflecting the difference between the price we pay to acquire Holdco Units of LD
66
Table of Contents
Holdings and the proportionate share of LD Holdings’ tax basis allocable to such units at the time of the exchange. As a result, the amount of tax that we would otherwise be required to pay in the future may be reduced by the increase (for tax purposes) in depreciation and amortization deductions attributable to our interests in LD Holdings, although the U.S. Internal Revenue Service (“IRS”) may challenge all or part of that tax basis adjustment, and a court could sustain such a challenge.
We will enter into a tax receivable agreement with the Parthenon Stockholders, Parthenon affiliates owning Holdco Units and certain of the Continuing LLC Members that will provide for the payment by us to such parties or their permitted assignees of 85% of the amount of cash savings, if any, in U.S. federal, state and local tax that we realize or are deemed to realize as a result of (i) the tax basis adjustments referred to above, (ii) any incremental tax basis adjustments attributable to payments made pursuant to the tax receivable agreement and (iii) any deemed interest deductions arising from payments made by us pursuant to the tax receivable agreement. While the actual amount of the adjusted tax basis, as well as the amount and timing of any payments under this agreement will vary depending upon a number of factors, including the basis of our proportionate share of LD Holdings’ assets on the dates of exchanges, the timing of exchanges, the price of shares of our Class A Common Stock at the time of each exchange, the extent to which such exchanges are taxable, the deductions and other adjustments to taxable income to which LD Holdings is entitled, and the amount and timing of our income, we expect that during the anticipated term of the tax receivable agreement, the payments that we may make to the Parthenon Stockholders, Parthenon affiliates owning Holdco Units and certain of the Continuing LLC Members or their permitted assignees could be substantial. Payments under the tax receivable agreement may give rise to additional tax benefits and therefore to additional potential payments under the tax receivable agreement. In addition, the tax receivable agreement will provide for interest accrued from the due date (without extensions) of the corresponding tax return for the taxable year with respect to which the payment obligation arises to the date of payment under the agreement. Assuming no material changes in the relevant tax law and that we earn sufficient taxable income to realize all tax benefits that are subject to the tax receivable agreement, we expect that the tax savings associated with the purchase of Holdco Units from the Exchanging Members in connection with exchanges of Holdco Units and Class B or Class C Common Stock as described above would aggregate to approximately $1,068.7 million over 15 years from the date of this offering based on an initial public offering price of $20.00 per share of our Class A Common Stock, which is the midpoint of the estimated price range set forth on the cover page of this prospectus, and assuming all future exchanges would occur one year after this offering. Under such scenario, we would be required to pay to the Parthenon Stockholders, Parthenon affiliates owning Holdco Units and certain of the Continuing LLC Members or their permitted assignees approximately 85% of such amount, or approximately $908.4 million, over the 15-year period from the date of this offering. We note, however, that the analysis set forth above assumes no material changes in the relevant tax law. It is possible that there could be major tax legislation in 2021 and in later years which would change the relevant tax law, and therefore alter this analysis in material ways. We are not able to predict the specific effect of such future tax legislation on this analysis.
Further, upon consummation of the offering, loanDepot, Inc. will have acquired a significant equity interest in LD Holdings from Parthenon Blocker after a series of transactions that will result in Parthenon Blocker merging with and into loanDepot, Inc., with loanDepot, Inc. remaining as the surviving corporation. See “Organizational Structure—Reorganization Transactions at LD Holdings.” The Company will not realize any of the cash savings in U.S. federal, state and local tax described above regarding tax basis adjustments and deemed interest deductions in relation to any Class D Common Stock received by the Parthenon Stockholders in the Reorganization Transactions. The Parthenon Stockholders or their permitted assignees, however, will be entitled to receive payments under the tax receivable agreement in respect of the cash tax savings, if any, that we realize or are deemed to realize as a result of future exchanges of Holdco Units and Class B or Class C Common Stock for cash or Class A Common Stock of loanDepot, Inc. There may be a material negative effect on our liquidity if, as a result of timing discrepancies or otherwise, (i) the payments under the tax receivable agreement exceed the actual benefits we realize in respect of the tax attributes subject to the tax receivable agreement, and/or (ii) distributions to us by LD Holdings are not sufficient to permit us to make payments under the tax receivable agreement after it has paid its taxes and other obligations. For example, were the IRS to challenge a tax basis
67
Table of Contents
adjustment, or other deductions or adjustments to the taxable income of LD Holdings or its subsidiaries, none of the parties to the tax receivable agreement will reimburse us for any payments that may previously have been made under the tax receivable agreement, except that excess payments made to the Parthenon Stockholders, Parthenon affiliates owning Holdco Units and certain of the Continuing LLC Members or their permitted assignees will be netted against payments otherwise to be made, if any, after our determination of such excess. As a result, in certain circumstances we could make payments to the Parthenon Stockholders, Parthenon affiliates owning Holdco Units and certain of the Continuing LLC Members or their permitted assignees under the tax receivable agreement in excess of our ultimate cash tax savings. In addition, the payments under the tax receivable agreement are not conditioned upon any recipient’s continued ownership of interests in us or LD Holdings. The Parthenon Stockholders, Parthenon affiliates owning Holdco Units and certain of the Continuing LLC Members will receive payments under the tax receivable agreement until such time that they validly assign or otherwise transfer their rights to receive such payments.
In certain circumstances, including certain changes of control of the Company, payments by us under the tax receivable agreement may be accelerated and/or significantly exceed the actual benefits we realize in respect of the tax attributes subject to the tax receivable agreement.
The tax receivable agreement will provide that (i) in the event that we materially breach any of our material obligations under the agreement, whether as a result of failure to make any payment, failure to honor any other material obligation required thereunder or by operation of law as a result of the rejection of the agreements in a bankruptcy or otherwise, (ii) if, at any time, we elect an early termination of the agreement, or (iii) upon a change of control of the Company, our (or our successor’s) obligations under the agreements (with respect to all Holdco Units of LD Holdings, whether or not such units have been exchanged or acquired before or after such election) would accelerate and become payable in a lump sum amount equal to the present value of the anticipated future tax benefits calculated based on certain assumptions. These assumptions include the assumptions that (i) we (or our successor) will have sufficient taxable income to fully utilize the deductions arising from the increased tax deductions and tax basis and other benefits subject to the tax receivable agreement, (ii) we (or our successor) will utilize any loss carryovers generated by the increased tax deductions as quickly as allowable by law, and (iii) LD Holdings and its subsidiaries will sell certain nonamortizable assets (and realize certain related tax benefits) no later than a specified date. As a result of the foregoing, if we materially breach a material obligation under the agreement, experience a change of control, or if we elect to terminate the agreement early, we would be required to make an immediate lump sum payment equal to the present value of the anticipated future tax savings, which payment may be made significantly in advance of the actual realization of such future tax savings. In these situations, our obligations under the tax receivable agreement could have a substantial negative impact on our liquidity. There can be no assurance that we will be able to fund or finance our obligations under the tax receivable agreement. Additionally, the obligation to make a lump sum payment on a change of control may deter potential acquirors, which could negatively affect our stockholders’ potential returns. If we were to elect to terminate the tax receivable agreement immediately after this offering, based on an initial public offering price of $20.00 per share of our Class A Common Stock, which is the midpoint of the estimated price range set forth on the cover page of this prospectus, we estimate that we would be required to pay approximately $961.6 million in the aggregate under the tax receivable agreement. We note, however, that the analysis set forth above assumes no material changes in the relevant tax law. It is possible that there could be major tax legislation in 2021 and in later years which would change the relevant tax law, and therefore alter this analysis in material ways. We are not able to predict the specific effect of such future tax legislation on this analysis.
In certain circumstances, LD Holdings will be required to make distributions to us and the other holders of Holdco Units and the distributions that LD Holdings will be required to make may be substantial.
The holders of LD Holdings Units, including loanDepot, Inc., will incur U.S. federal, state and local income taxes on their proportionate share of any taxable income of LD Holdings. Net profits and net losses of LD Holdings will generally be allocated to the holders of Holdco Units (including loanDepot, Inc.) pro rata in accordance with their respective share of the net profits and net losses of LD Holdings. The Holdings LLC Agreement will provide for cash distributions to each holder of Holdco Units (including LoanDepot Inc.), which
68
Table of Contents
we refer to as “tax distributions,” based on certain assumptions. LD Holdings may be required to make tax distributions that, in the aggregate, may exceed the amount of taxes that LD Holdings would have paid if it were taxed on its net income at the assumed rate.
Funds used by LD Holdings to satisfy its tax distribution obligations will not be available for reinvestment in our business. Moreover, the tax distributions that LD Holdings will be required to make may be substantial, and may exceed (as a percentage of LD Holdings’ income) the overall effective tax rate applicable to a similarly situated corporate taxpayer, and any tax distribution to a holder in excess of a similarly situated corporate taxpayer will not affect such holder’s rights except as required by applicable tax law.
Tax distributions to us may exceed the sum of our tax liabilities to various taxing authorities and the amount we are required to pay under the tax receivable agreement. This may lead, under certain scenarios, to us having significant cash on hand in excess of our current operating needs. We will, in the sole discretion of our board of directors, use this cash to invest in our business, pay obligations under the tax receivable agreement, pay dividends to our stockholders or retain such cash for business exigencies in the future.
Certain provisions of our amended and restated certificate of incorporation and our amended and restated bylaws could hinder, delay or prevent a change in control of us, which could adversely affect the price of our Class A Common Stock.
Certain provisions of our amended and restated certificate of incorporation and our amended and restated bylaws will contain provisions that could make it more difficult for a third party to acquire us without the consent of our board of directors. These provisions will:
| • | authorize the issuance of undesignated preferred stock, the terms of which may be established and the shares of which may be issued without stockholder approval, and which may include super voting, special approval, dividend, or other rights or preferences superior to the rights of the holders of common stock; |
| • | prohibit stockholder action by written consent, requiring all stockholder actions be taken at a meeting of our stockholders; |
| • | provide that the board of directors is expressly authorized to make, alter or repeal our amended and restated bylaws; |
| • | establish advance notice requirements for nominations for elections to our board of directors or for proposing matters that can be acted upon by stockholders at stockholder meetings; |
| • | establish a classified board of directors, as a result of which our board of directors will be divided into three classes, with each class serving for staggered three-year terms, which prevents stockholders from electing an entirely new board of directors at an annual meeting; |
| • | provide that directors can be removed only for cause; |
| • | provide that any vacancy occurring on the board of directors shall be filled only by a majority of the directors then in office, although less than a quorum, or by a sole remaining director; |
| • | make it more difficult for a person who would be an “interested stockholder” (other than Parthenon Capital and its affiliates and their respective direct and indirect transferees) to effect various business combinations with us for a three-year period; |
| • | prohibit stockholders from calling special meetings of stockholders; and |
| • | require the approval of holders of at least 662⁄3% of the outstanding shares of the voting power of our outstanding common stock to amend the amended and restated bylaws and certain provisions of the amended and restated certificate of incorporation. |
69
Table of Contents
In addition, these provisions may make it difficult and expensive for a third party to pursue a tender offer, change in control or takeover attempt that is opposed by our management or our board of directors. Stockholders who might desire to participate in these types of transactions may not have an opportunity to do so, even if the transaction is favorable to stockholders. These anti-takeover provisions could substantially impede the ability of stockholders to benefit from a change in control or change our management and board of directors and, as a result, may adversely affect the market price of our Class A Common Stock and your ability to realize any potential change of control premium. See “Description of Capital Stock—Anti-Takeover Effects of Certain Provisions of Delaware Law and Our Amended and Restated Certificate of Incorporation, Amended and Restated Bylaws and Stockholders Agreement.”
Risks Related to this Offering and Our Class A Common Stock
An active trading market for our Class A Common Stock may never develop or be sustained, which may cause shares of our Class A Common Stock to trade at a discount from the initial public offering price and make it difficult to sell the shares of Class A Common Stock you purchase.
Prior to this offering, there has not been a public trading market for shares of our Class A Common Stock. It is possible that an active trading market for our Class A Common Stock will not develop or continue, or, if developed, that any market will be sustained that would make it difficult for you to sell your shares of Class A Common Stock at an attractive price or at all. The initial public offering price per share of our Class A Common Stock will be determined by agreement among us, the selling stockholders and the underwriters, and may not be indicative of the price at which shares of our Class A Common Stock will trade in the public market after this offering. The market price of our Class A Common Stock may decline below the initial public offering price and you may not be able to sell your shares of our Class A Common Stock at or above the price you paid in this offering, or at all.
The market price of our Class A Common Stock may be volatile, which could cause the value of your investment to decline.
Even if a trading market develops, the market price of our Class A Common Stock may be highly volatile and could be subject to wide fluctuations. In addition, the trading volume in our Class A Common Stock may fluctuate and cause significant price variations to occur. Securities markets worldwide experience significant price and volume fluctuations. This market volatility, as well as general economic, market or political conditions, could reduce the market price of shares of our Class A Common Stock in spite of our operating performance. In addition, our results of operations could be below the expectations of public market analysts and investors due to a number of potential factors, including variations in our quarterly or annual results of operations, additions or departures of key management personnel, changes in our earnings estimates (if provided) or failure to meet analysts’ earnings estimates, publication of research reports about our industry, litigation and government investigations, changes or proposed changes in laws or regulations or differing interpretations or enforcement thereof affecting our business, adverse market reaction to any indebtedness we may incur or securities we may issue in the future, changes in market valuations of similar companies or speculation in the press or the investment community with respect to us or our industry, adverse announcements by us or others and developments affecting us, announcements by our competitors of significant contracts, acquisitions, dispositions, strategic partnership, joint ventures or capital commitments, actions by institutional stockholders, increases in market interest rates that may lead investors in our shares to demand a higher yield, and in response the market price of shares of our Class A Common Stock could decreases significantly. You may be unable to resell your shares of Class A Common Stock at or above the initial public offering price, or at all.
These broad market and industry factors may decrease the market price of our Class A Common Stock, regardless of our actual operating performance. The stock market in general has from time to time experienced extreme price and volume fluctuations, including in recent months. In addition, in the past, following periods of volatility in the overall market and the market price of a company’s securities, securities class action litigation
70
Table of Contents
has often been instituted against these companies. This litigation, if instituted against us, could result in substantial costs and a diversion of our management’s attention and resources.
The multi- class structure of our common stock will have the effect of concentrating voting control with those stockholders who held our capital stock prior to the completion of this offering, including our directors, executive officers, Mr. Hsieh and his affiliates (the “Hsieh Stockholders”) and Parthenon Stockholders, who will hold in the aggregate 98.9% of the voting power of our capital stock following the completion of this offering, which will limit or preclude your ability to influence corporate matters, including the election of directors and the approval of any change of control transaction.
Our Class C and Class D Common Stock have five votes per share, and our Class A Common Stock, which is the stock we are offering in this offering, has one vote per share. Following this offering, the holders of our outstanding Class C and Class D Common Stock will hold 98.9% of the voting power of our outstanding capital stock. Because of the five-to-one voting ratio between our Class C and Class D Common Stock and the Class A Common Stock offered hereby, the holders of our Class C and Class D Common Stock collectively will continue to control a majority of the combined voting power of our common stock and therefore be able to control all matters submitted to our stockholders for approval. Such rights and differential voting of the Parthenon Stockholders and Hsieh Stockholders shall cease five years from the date of this offering. This concentrated control will limit or preclude your ability to influence corporate matters for the foreseeable future, including the election of directors, amendments of our organizational documents, and any merger, consolidation, sale of all or substantially all of our assets, or other major corporate transaction requiring stockholder approval. In addition, this may prevent or discourage unsolicited acquisition proposals or offers for our capital stock that you may feel are in your best interest as one of our stockholders.
Additionally, equity of LD Holdings issued to certain executives are held indirectly through one or more management holding companies (the “Management Holding Companies”) organized for the purpose of holding such equity.
Concurrently with the issuance thereof, Incentive Units granted to certain members of the Company’s executive management team were immediately contributed to one or more Management Holding Companies in exchange for an equal number of “LLC Units” issued by the applicable Management Holding Company. Specifically, as of December 20, 2020, an aggregate of: (i) 346,717.275 Class Z Units are held by Trilogy Management Investors, LLC, (ii) 14,567.098 Class Y Units are held by Trilogy Management Investors Two, LLC, (iii) 6,645.315 Class X Units are held by Trilogy Management Investors Three, LLC, (iv) 3,300,311,438.427 Class X Units are held by Trilogy Management Investors Six, LLC, (v) 584,123,273.588 Class X Units are held by Trilogy Management Investors Seven, LLC and (vi) 88,084,925.975 Class V Units are held by Trilogy Management Investors Eight, LLC.
Each of the Management Holding Companies is managed by a sole manager, initially designated as Anthony Hsieh, which manager has the principal decision-making authority on behalf of the applicable Management Holding Company. The units held by the Management Holding Companies, and the LLC Units issued in exchange therefor, are non-voting and subject to the terms and conditions of the Holdings LLC Agreement, including, without limitation, the restrictions on transfer set forth therein. As a result, Anthony Hsieh will exercise a substantial amount of decision-making authority on behalf of management’s equity interests.
The multi-class structure of our common stock may adversely affect the trading market for our Class A Common Stock.
Certain stock index providers, such as S&P Dow Jones, exclude companies with multiple classes of shares of common stock from being added to certain stock indices, including the S&P 500. In addition, several stockholder advisory firms and large institutional investors oppose the use of multiple class structures. As a result, the multi-class structure of our common stock may prevent the inclusion of our Class A Common Stock in
71
Table of Contents
such indices, may cause stockholder advisory firms to publish negative commentary about our corporate governance practices or otherwise seek to cause us to change our capital structure, and may result in large institutional investors not purchasing shares of our Class A Common Stock. Any exclusion from stock indices could result in a less active trading market for our Class A Common Stock. Any actions or publications by stockholder advisory firms or institutional investors critical of our corporate governance practices or capital structure could also adversely affect the value of our Class A Common Stock.
We will incur increased costs and become subject to additional regulations and requirements as a result of becoming a public company, and our management will be required to devote substantial time to new compliance matters, which could lower profits or make it more difficult to run our business.
As a public company, we expect to incur significant legal, accounting, reporting and other expenses that we have not incurred as a private company, including costs associated with public company reporting requirements and costs of recruiting and retaining non-executive directors. We also have incurred and will incur costs associated with compliance with the Sarbanes-Oxley Act and rules and regulations of the SEC, and various other costs of a public company. The expenses incurred by public companies generally for reporting and corporate governance purposes have been increasing. We expect these rules and regulations to increase our legal and financial compliance costs and to make some activities more time-consuming and costly, although we are currently unable to estimate these costs with any degree of certainty. Our management will need to devote a substantial amount of time to ensure that we comply with all of these requirements. Furthermore, because we have not operated as a company with publicly traded common stock in the past, we might not be successful in implementing these requirements.
In addition, changing laws, regulations and standards relating to corporate governance and public disclosure are creating uncertainty for public companies, increasing legal and financial compliance costs and making some activities more time consuming. These laws, regulations and standards are subject to varying interpretations, in many cases due to their lack of specificity, and, as a result, their application in practice may evolve over time as new guidance is provided by regulatory and governing bodies. This could result in continuing uncertainty regarding compliance matters and higher costs necessitated by ongoing revisions to disclosure and governance practices. We intend to invest resources to comply with evolving laws, regulations and standards, and this investment may result in increased general and administrative expenses and a diversion of management’s time and attention from revenue-generating activities to compliance activities. If our efforts to comply with new laws, regulations and standards differ from the activities intended by regulatory or governing bodies due to ambiguities related to practice, regulatory authorities may initiate legal proceedings against us, which could have an adverse effect on our business, financial condition and results of operations.
These laws and regulations also could make it more difficult or costly for us to obtain certain types of insurance, including director and officer liability insurance, and we may be forced to accept reduced policy limits and coverage or incur substantially higher costs to obtain the same or similar coverage. These laws and regulations could also make it more difficult to attract and retain qualified persons to serve on our board of directors, our board committees or as executive officers. Furthermore, if we are unable to satisfy our obligations as a public company, we could be subject to delisting of our Class A Common Stock, fines, sanctions and other regulatory action and potentially civil litigation.
Failure to comply with the requirements to design, implement and maintain effective internal controls could have a material adverse effect on our business and stock price.
As a public company, we will have significant requirements for enhanced financial reporting and internal controls. The process of designing and implementing effective internal controls is a continuous effort that requires us to anticipate and react to changes in our business and the economic and regulatory environments and to expend significant resources to maintain a system of internal controls that is adequate to satisfy our reporting obligations as a public company.
72
Table of Contents
If we are unable to establish or maintain appropriate internal financial reporting controls and procedures, it could cause us to fail to meet our reporting obligations on a timely basis, result in material misstatements in our consolidated financial statements and harm our operating results. In addition, we will be required pursuant to Section 404 of the Sarbanes-Oxley Act, or Section 404, to furnish a report by management on, among other things, the effectiveness of our internal control over financial reporting for the first fiscal year beginning after the effective date of this offering. This assessment will need to include disclosure of any material weaknesses identified by our management in an internal control over financial reporting. In addition, our independent registered public accounting firm will be required to formally attest to the effectiveness of our internal control over financial reporting pursuant to Section 404(b) commencing the year following our first annual report required to be filed with the SEC. Testing and maintaining internal controls may divert our management’s attention from other matters that are important to our business. We may not be able to conclude on an ongoing basis that we have effective internal control over financial reporting in accordance with Section 404 or our independent registered public accounting firm may not issue an unqualified opinion. If either we are unable to conclude that we have effective internal control over financial reporting or our independent registered public accounting firm is unable to provide us with an unqualified report, investors could lose confidence in our reported financial information, which could cause the price of our common stock to decline, and we may be subject to investigation or sanctions by the SEC.
Investors in this offering will experience immediate and substantial dilution.
The initial public offering price of our Class A Common Stock will be substantially higher than the pro forma as adjusted net tangible book value per share of our Class A Common Stock immediately after this offering. As a result, you will pay a price per share of Class A Common Stock that substantially exceeds the per share book value of our tangible assets after subtracting our liabilities. In addition, you will pay more for your shares of Class A Common Stock than the amounts paid by our existing owners. Assuming an offering price of $20.00 per share of Class A Common Stock, which is the midpoint of the estimated price range set forth on the cover page of this prospectus, you will incur immediate and substantial dilution in an amount of $17.51 per share of Class A Common Stock. See “Dilution.”
You may be diluted by the future issuance of additional Class A Common Stock in connection with our incentive plans, acquisitions or otherwise.
After the offering, we will have an aggregate of 2,500,000,000 shares of Class A Common Stock authorized but unissued, including 193,091,469 shares of Class A Common Stock issuable upon exchange of Holdco Units and Class B Common Stock and Class C Common Stock that will be held by the Continuing LLC Members. Our amended and restated certificate of incorporation authorizes us to issue these shares of Class A Common Stock and options, rights, warrants and appreciation rights relating to Class A Common Stock for the consideration and on the terms and conditions established by our board of directors in its sole discretion, whether in connection with acquisitions or otherwise. We have reserved and not yet granted 14,123,387 shares of Class A Common Stock for issuance under our 2021 Omnibus Incentive Plan (including any LTIP Units, which may be granted thereunder excluding 2,207,649 vested restricted stock units of Class A common stock to be granted to employees in connection with the offering), which amount is subject to adjustment in certain events. See “Executive Compensation—2021 Omnibus Incentive Plan”. Any Class A Common Stock that we issue, including under our 2021 Omnibus Incentive Plan or other equity incentive plans that we may adopt in the future, would dilute the percentage ownership held by the investors who purchase Class A Common Stock in the offering.
Future offerings of debt or equity securities by us may adversely affect the market price of our Class A Common Stock.
In the future, we may attempt to obtain financing or to further increase our capital resources by issuing additional shares of our Class A Common Stock or offering additional debt or other equity securities, including
73
Table of Contents
commercial paper, medium-term notes, senior or subordinated notes, debt securities convertible into equity or shares of preferred stock. Future acquisitions could require substantial additional capital in excess of cash from operations. We would expect to obtain the capital required for acquisitions through a combination of additional issuances of equity, corporate indebtedness and/or cash from operations.
Issuing additional shares of our Class A Common Stock or other equity securities or securities convertible into equity may dilute the economic and voting rights of our existing stockholders or reduce the market price of our Class A Common Stock or both. Upon liquidation, holders of such debt securities and preferred shares, if issued, and lenders with respect to other borrowings would receive a distribution of our available assets prior to the holders of our Class A Common Stock. Debt securities convertible into equity could be subject to adjustments in the conversion ratio pursuant to which certain events may increase the number of equity securities issuable upon conversion. Preferred shares, if issued, could have a preference with respect to liquidating distributions or a preference with respect to dividend payments that could limit our ability to pay dividends to the holders of our Class A Common Stock. Our decision to issue securities in any future offering will depend on market conditions and other factors beyond our control, which may adversely affect the amount, timing or nature of our future offerings.
Future sales, or the perception of future sales, of shares of our Class A Common Stock by existing stockholders could result in dilution of the percentage ownership of our stockholders and cause the market price of our Class A Common Stock to decline.
The sale of substantial amounts of shares of our Class A Common Stock in the public market, or the perception that such sales could occur, including sales by the Parthenon Stockholders and the Continuing LLC Members, could have an adverse effect on our stock price and could impair our ability to raise capital through the sale of additional stock. In the future, as we may attempt to obtain financing or to further increase our capital resources by issuing additional shares of our common stock. Issuing additional shares of our Class A Common Stock or other equity securities or securities convertible into equity may dilute the economic and voting rights of our existing stockholders or reduce the market price of our Class A Common Stock or both. Issuing additional shares of our Class B Common Stock and Class C Common Stock, as applicable, when issued with corresponding Holdco Units, may also dilute the economic and voting rights of our existing stockholders or reduce the market price of our Class A Common Stock or both. Additionally, further issuances of our Class D Common Stock, which is convertible into shares of our Class A Common Stock, may also dilute the economic and voting rights of our existing stockholders.
Upon the completion of this offering, we will have a total of 17,207,649 shares of Class A Common Stock issued and outstanding (or 19,457,649 shares of Class A Common Stock if the underwriters exercise their option to purchase additional shares in full) based on an assumed initial public offering price of $20.00 per share (the midpoint of the estimated public offering price range set forth on the cover page of this prospectus). In addition, 307,792,351 shares of Class A Common Stock (assuming the underwriters do not exercise their option to purchase any additional shares) may be issued upon the exercise of the exchange and /or conversion rights described elsewhere in this prospectus. The Class A Common Stock offered hereby will be freely tradable without restriction or further registration under the Securities Act of 1933, as amended (the “Securities Act”), except for any Class A Common Stock that may be held or acquired by our directors, executive officers and other affiliates (as that term is defined in the Securities Act), which will be restricted securities under the Securities Act. The shares of Class A Common Stock not being offered hereby or issuable upon the exercise of the exchange and/or conversion rights as described above will be restricted securities. Restricted securities may be sold only in compliance with the limitations described in “Shares Eligible for Future Sale.” In addition, subject to certain limitations and exceptions, pursuant to certain provisions of the Holdings LLC Agreement, the Continuing LLC Members may exchange an equal number of Holdco Units and Class B Common Stock or Class C Common Stock, as applicable, for shares of our Class A Common Stock on a one-for-one basis, subject to customary conversion rate adjustments for stock splits, stock dividends and reclassifications. Upon consummation of the offering and after giving effect to the use of proceeds to us therefrom, the Continuing LLC
74
Table of Contents
Members will beneficially own 193,091,469 Holdco Units, or 191,679,969 Holdco Units if the underwriters exercise their option to purchase additional shares in full, all of which will be exchangeable for shares of our Class A Common Stock at any time and from time to time (subject to the terms of the Holdings LLC Agreement).
Our amended and restated certificate of incorporation authorizes us to issue additional shares of Class A Common Stock and options, rights, warrants and appreciation rights relating to Class A Common Stock for the consideration and on the terms and conditions established by our board of directors in its sole discretion. In accordance with the Delaware General Corporation Law (“DGCL”) and the provisions of our certificate of incorporation, we may also issue preferred stock that has designations, preferences, rights, powers and duties that are different from, and may be senior to, those applicable to shares of Class A Common Stock. Similarly, the Holdings LLC Agreement permits LD Holdings to issue an unlimited number of additional limited liability company interests of LD Holdings with designations, preferences, rights, powers and duties that are different from, and may be senior to, those applicable to the Holdco Units, and which may be exchangeable for shares of our Class A Common Stock.
Each of our directors and officers, and substantially all of our stockholders, including all of the selling stockholders, have entered into lock-up agreements with the underwriters that restrict their ability to offer, sell, assign, transfer, pledge, contract to sell or otherwise dispose of or hedge their shares of Class A Common Stock, or any options or warrants to purchase any of our Class A Common Stock or any securities convertible into or exchangeable for our Class A Common Stock, subject to specified exceptions. The lock-up agreements pertaining to this offering will expire 180 days from the date of this prospectus. Goldman Sachs & Co. LLC, BofA Securities, Inc., Credit Suisse Securities (USA) LLC and Morgan Stanley & Co. LLC, however, may, in their sole discretion, at any time without prior notice, release all or any portion of the Class A Common Stock from the restrictions in any such agreement. See “Underwriting” for more information.
After the lock-up agreements expire, up to an additional 307,792,351 shares of Class A Common Stock (assuming all outstanding Holdco Units together with an equal number of shares of Class B Common Stock or Class C Common Stock, as applicable, in addition to our Class D Common Stock are exchanged for shares of Class A Common Stock) will be eligible for sale in the public market, all of which are held by our directors, executive officers and their affiliated entities, and will be subject to volume limitations under Rule 144 under the Securities Act and various vesting agreements. These holders will have registration rights that will permit them to sell the securities into the open market. See “Certain Relationships and Related Party Transactions—Registration Rights Agreement.”
We intend to file one or more registration statements on Form S-8 under the Securities Act to register shares of our Class A Common Stock or securities convertible or exchangeable for shares of our Class A Common Stock issued pursuant to our 2021 Omnibus Incentive Plan. See “Executive Compensation—2021 Omnibus Incentive Plan—Available Shares.” Any such Form S-8 registration statements will automatically become effective upon filing. Accordingly, shares registered under such registration statements will be available for sale in the open market. We expect that the initial registration statement on Form S-8 will cover shares of our Class A Common Stock.
As restrictions on resale end, the market price of our shares of Class A Common Stock could drop significantly if the holders of these restricted shares sell them or are perceived by the market as intending to sell them. These factors could also make it more difficult for us to raise additional funds through future offerings or our shares of Class A Common Stock or other securities.
If securities or industry analysts do not publish research or publish inaccurate or unfavorable research about us or our business, the price of our Class A Common Stock and trading volume could decline.
The trading market for our Class A Common Stock will depend in part on the research and reports that securities or industry analysts publish about us or our business. If one or more of the analysts who cover us
75
Table of Contents
downgrade our Class A Common Stock or publish inaccurate or unfavorable research about our business, our stock price would likely decline. If one or more of these analysts cease coverage of our company or fail to publish reports on us regularly, demand for our Class A Common Stock could decrease, which might cause our stock price and trading volume to decline. In addition, if our operating results fail to meet the expectations of securities analysts, our stock price would likely decline.
The provision of our amended and restated certificate of incorporation requiring exclusive forum in certain courts in the State of Delaware or the federal district courts of the United States for certain types of lawsuits may have the effect of discouraging lawsuits against our directors and officers.
Our amended and restated certificate of incorporation will provide that, unless we, in writing, select or consent to the selection of an alternative forum, all complaints asserting any internal corporate claims (defined as claims, including claims in the right of our company: (i) that are based upon a violation of a duty by a current or former director, officer, employee, or stockholder in such capacity; or (ii) as to which the DGCL confers jurisdiction upon the Court of Chancery), to the fullest extent permitted by law, and subject to applicable jurisdictional requirements, shall be the Court of Chancery of the State of Delaware (or, if the Court of Chancery does not have, or declines to accept, subject matter jurisdiction, another state court or a federal court located within the State of Delaware). Additionally, unless we consent in writing to the selection of an alternative forum, the federal district courts of the United States shall be the exclusive forum for the resolution of any complaint asserting a cause of action arising under the Securities Act. Our choice-of-forum provision will not apply to suits brought to enforce any liability or duty created by the Securities Exchange Act of 1934, as amended (the “Exchange Act”). Any person or entity purchasing or otherwise acquiring or holding any interest in our common stock shall be deemed to have notice of and to have consented to the forum selection provisions described in our amended and restated certificate of incorporation. Although we believe these exclusive forum provisions benefit us by providing increased consistency in the application of Delaware law and federal securities laws in the types of lawsuits to which each applies, the exclusive forum provisions may limit a stockholder’s ability to bring a claim in a judicial forum that it finds favorable for disputes with us or any of our directors, officers, or stockholders, which may discourage lawsuits with respect to such claims. Our stockholders will not be deemed to have waived our compliance with the federal securities laws and the rules and regulations thereunder as a result of our exclusive forum provisions. Further, in the event a court finds either exclusive forum provision contained in our certificate of incorporation to be unenforceable or inapplicable in an action, we may incur additional costs associated with resolving such action in other jurisdictions, which could harm our business, operating results and financial condition.
76
Table of Contents
CAUTIONARY STATEMENT REGARDING FORWARD-LOOKING STATEMENTS
This prospectus contains forward-looking statements, which reflect our current views with respect to, among other things, our operations and financial performance. You can identify these statements by the use of words such as “outlook,” “potential,” “continue,” “may,” “seek,” “approximately,” “predict,” “believe,” “expect,” “plan,” “intend,” “estimate” or “anticipate” and similar expressions or the negative versions of these words or comparable words, as well as future or conditional verbs such as “will,” “should,” “would” and “could.” These statements may be found under “Prospectus Summary,” “Use of Proceeds,” “Management’s discussion and analysis of financial condition and results of operations” and “Business,” as well as in this prospectus generally, and are subject to certain risks and uncertainties that could cause actual results to differ materially from those included in the forward-looking statements. These risks and uncertainties include, but are not limited to, those risks described under the section entitled “Risk factors” set forth herein. The forward-looking statements speak only as of the date on which they are made, and, except to the extent required by federal securities laws, we undertake no obligation to update any forward-looking statement to reflect events or circumstances after the date on which the statement is made or to reflect the occurrence of unanticipated events. In light of these risks and uncertainties, there can be no assurance that the forward-looking statements contained in this prospectus will in fact occur. You should not place undue reliance on these forward-looking statements. If one or more of these risks or uncertainties materialize or our underlying assumptions prove to be incorrect, our actual results may vary materially from what we may have expressed or implied by these forward-looking statements. We qualify all of the forward-looking statements in this prospectus by the cautionary statements and risks set forth in the section entitled “Risk factors” and elsewhere in this prospectus. Forward-looking statements in this prospectus include, but are not limited to, the risk factors discussed in the “Risk factors” section of this prospectus and the following:
| • | the COVID-19 pandemic; the pandemic’s impact on our ability to originate mortgages, our servicing operations, our liquidity and our employees; |
| • | the executive, legislative and regulatory reaction to COVID-19, including the passage of the CARES Act; |
| • | our recent rapid growth; |
| • | our ability to continue to grow our loan production volume; |
| • | the market’s acceptance of our new products and enhancements; |
| • | the departure or change in responsibilities of certain of our senior management; |
| • | our ability to identify necessary and appropriate information technology system improvements; |
| • | our ability to maintain our reputation; |
| • | our ability to identify or consummate acquisitions or otherwise manage growth effectively; |
| • | our ability to successful hedge changes in interest rates; |
| • | the geographic concentration of our loan originations; |
| • | our ability to indemnify certain purchasers of loans we originate; |
| • | errors in our management’s estimates and judgment decisions in connection with matters that are inherently uncertain, such as fair value determinations; |
| • | our ability to maintain our relationships with our subservicers; |
| • | our ability to replace loans, which we service that are repaid or refinanced; |
| • | our ability to recover servicing advances; |
| • | the ability of counterparties to terminate servicing rights and contracts; |
| • | our limited performance history of our servicing portfolio; |
77
Table of Contents
| • | increased costs and related losses regarding challenges to the validity of foreclosure actions; |
| • | our reliance on joint ventures with industry partners; |
| • | challenges to the MERS system; |
| • | our reliance on the accuracy and completeness of information about borrowers provided to us; |
| • | our ability to maintain our vendor relationships; |
| • | our ability to attract and retain qualified personnel; |
| • | the occurrence of a data breach or other failure of our cybersecurity; |
| • | the outcome of legal proceedings to which we are a party; |
| • | our ability to obtain, maintain, protect and enforce our intellectual property; |
| • | the impact of terrorist attacks or natural disasters; and |
| • | changes in federal, state and local laws, as well as changes in regulatory enforcement policies and priorities. |
| • | failure of an active public market for our Class A Common Stock developing; |
| • | future sales of our Class A Common Stock, or the perception in the public markets that these sales may occur; |
| • | volatility in the price of our Class A Common Stock; |
| • | dilution in our Class A Common Stock as a result of this offering; |
| • | no expectation to pay any cash dividends for the foreseeable future; |
| • | our inability to effectively implement or maintain a system of internal control over financial reporting; |
| • | securities or industry analysts not publishing research or publishing inaccurate or unfavorable research about us or our business; |
| • | transformation into a public company may increase our costs and disrupt the regular operations of our business; |
| • | the fact that we will be a “controlled company” under the rules of the NYSE; and |
| • | the effect of the Tax Receivable Agreement and our organizational structure. |
| • | our organizational documents may impede or discourage a takeover; |
| • | the provision of our certificate of incorporation requiring exclusive forum in the state courts in the State of Delaware for certain types of lawsuits may have the effect of discouraging lawsuits against our directors and officers; |
| • | other risks, uncertainties and factors set forth in this prospectus, including those set forth under “Risk factors.” |
For a more detailed discussion of these and other factors, see the information under the section “Risk factors” herein.
The Private Securities Litigation Reform Act of 1995 and Section 27A of the Securities Act do not protect any forward-looking statements that we make in connection with this offering. The forward-looking statements included in this prospectus speak only as of the date of this prospectus or as of the date they are made, as applicable. Except as otherwise required by law, we disclaim any intent or obligation to update any “forward-looking statement” made in this prospectus to reflect changed assumptions, the occurrence of unanticipated events or changes to future operating results over time.
78
Table of Contents
loanDepot, Inc. was formed as a Delaware corporation on November 6, 2020. LD Holdings was formed as a Delaware limited liability company on October 16, 2015. Following the Reorganization Transactions and the Offering Transactions described below, loanDepot, Inc. will be a holding company and its sole material asset will be an interest in LD Holdings. LD Holdings will also be a holding company and have no material assets other than its equity interests in its direct subsidiaries consisting of a 99.99% ownership in LDLLC (the major asset of the group), and 100% equity ownership in each of the following: Artemis Management LLC, (“Artemis”), LD Settlement Services LLC (“LD Settlement Services”) and mello Holdings, LLC (“Mello”). Through its ability to act on behalf of LD Holdings, which will have the ability to appoint the board of managers of LDLLC (our operating subsidiary that conduct most of our operations directly), and the other direct subsidiaries of LD Holdings (consisting of Artemis, LD Settlement Services, and Mello), loanDepot, Inc. will indirectly operate and control all of the business and affairs and consolidate the financial results of LD Holdings and its subsidiaries, including LDLLC.
Prior to the offering, the 3rd Holdings LLC Agreement will be further amended to, among other things, modify its capital structure by replacing the different classes of interests) with a single new class of Class A common units that we refer to as “LLC Units” which will be owned by the Continuing LLC Members.
In connection with the exchange transactions set forth above, we will issue to the Continuing LLC Members a number of shares of loanDepot, Inc. Class C Common Stock equal to the number of Holdco Units held by such Continuing LLC Members. Our Class B Common Stock will entitle holders thereof to one vote per share and will vote as a single class with our Class A Common Stock. However, the Class B and Class C Common Stock will not have any economic rights. Pursuant to the terms of the Holdings LLC Agreement, the Continuing LLC Members will have the right to exchange one Holdco Unit and one share of Class B or Class C Common Stock together for cash or one share of our Class A Common Stock (at our election), subject to customary conversion rate adjustments for stock splits, stock dividends and reclassifications. Any Holdco Units exchanged under the exchange provisions described above will thereafter be owned by loanDepot, Inc. Any shares of Class B or Class C Common Stock, as applicable, exchanged will be cancelled.
Thereafter, Parthenon Blocker and loanDepot, Inc. will engage in a series of transactions that will result in Parthenon Blocker merging with and into loanDepot, Inc., with loanDepot, Inc. remaining as the surviving corporation. As a result of such transactions, the Parthenon Stockholders will exchange all of the equity interests of Parthenon Blocker in return for shares of loanDepot, Inc. Class D Common Stock.
The ownership interest of the members of LD Holdings (other than loanDepot, Inc.) will be reflected as a non-controlling interest in our consolidated financial statements.
The diagram below depicts our simplified organizational structure immediately following the Reorganization Transactions and the offering and assuming no exercise by the underwriters of their option to purchase additional shares of Class A Common Stock.
In connection with the offering, loanDepot, Inc. will acquire a number of Holdco Units from LD Holdings and the Exchanging Members that is equal to the number of shares of Class A Common Stock that are issued and outstanding (including shares sold in this offering) and the Continuing LLC Members will own the remaining outstanding Holdco Units. LD Holdings will own 99.99% equity interests of LDLLC and 100% of the equity interests of other subsidiaries as set forth below. loanDepot, Inc., through its significant equity interest in LD Holdings, will benefit from the income of LDLLC and its consolidated subsidiaries to the extent of any distributions made in respect of our holdings of Holdco Units. Any such distributions will be distributed to all holders of Holdco Units, including the Continuing LLC Members, pro rata based on their holdings of Holdco Units.
79
Table of Contents
Reorganization Transactions at LD Holdings.
Immediately prior to the offering, LD Holdings and its direct and indirect equity holders will effect certain transactions, which we collectively refer to as the “Reorganization Transactions.” Currently, LD Holdings capital structure consists of different classes of membership interests, each of which has different capital accounts and amounts of aggregate distributions above which its holders share in future distributions. The entry into the 4th Holdings LLC Agreement, as part of the Reorganization Transactions, will result in the conversion of the current multiple-class structure into a single new class of LLC Units in LD Holdings. The conversion ratios of all of the different classes of units of LD Holdings into a single class will be based on the proceeds that each unit would receive in a hypothetical liquidation (pursuant to the distribution provisions set forth in the 4th Holdings LLC Agreement) of 100% of LD Holdings based on the initial public offering price of the Class A Common Stock. The number of LLC Units issued upon conversion per class of outstanding units will be determined pursuant to the distribution provisions set forth in the 4th Holdings LLC Agreement.
In connection with the exchange transactions set forth above, we will issue to the Continuing LLC Members a number of shares of loanDepot, Inc. Class B and Class C Common Stock equal to the number of Holdco Units held by such Continuing LLC Members, as applicable. Our Class B Common Stock will entitle holders thereof to one vote per share, and our Class C and Class D Common Stock with entitle holders thereof to five votes per share and each class will vote as a single class with our Class A Common Stock. However, the Class B and Class C Common Stock will not have any economic rights. Pursuant to the terms of the Holdings LLC Agreement, the Continuing LLC Members will have the right to exchange one Holdco Unit and one share of Class B Common Stock or Class C Common Stock, as applicable, together for cash or one share of our Class A Common Stock (at our election), subject to customary conversion rate adjustments for stock splits, stock dividends and reclassifications. Any Holdco Units exchanged under the exchange provisions described above will thereafter be owned by loanDepot, Inc. Any shares of Class B Common Stock and Class C Common Stock exchanged will be cancelled.
80
Table of Contents
Thereafter, (i) Parthenon Blocker and loanDepot, Inc. will engage in a series of transactions that will result in Parthenon Blocker merging with and into loanDepot, Inc., with loanDepot, Inc. remaining as the surviving corporation, and (ii) loanDepot, Inc. and LD Holdings will enter into the tax receivable agreement with (a) the Parthenon Stockholders receiving their interest in the tax receivable agreement in connection with the merger transaction described in clause (i) above, and (b) following the completion of the offering, certain of the Continuing LLC Members as part of the consideration received by such Continuing LLC Members in exchange for the sale of Holdco Units to loanDepot, Inc. As a result of the transactions described in clause (i) above, the Parthenon Stockholders will receive shares of our Class D Common Stock and their interest in the tax receivable agreement. loanDepot, Inc. will own one Holdco Unit for each share of Class D Common Stock so issued to the Parthenon Stockholders. In connection with the foregoing transactions, the Parthenon Stockholders and certain other persons will cause to be terminated an existing call option providing the Parthenon Stockholders the option to purchase, from Parthenon Blocker, its equity interest in LDLLC.
The following table summarizes the number of membership interests by class outstanding prior to the Reorganization Transactions, the conversion ratio for each class, and the number of shares of Class A Common Stock that will be outstanding after the Reorganization Transactions and before this offering, assuming (i) that all Holdco Units owned by the Continuing LLC Members, together with an equal number of shares of Class B Common Stock, are exchanged for shares of Class A Common Stock and (ii) the sale of shares of Class A Common Stock in this offering, including by the selling stockholders, at a price per share to the public of $20.00, which is the midpoint of the estimated price range set forth on the cover page of this prospectus.
| Number of applicable units before the Reorganization Transactions as of 1/27/21 |
Conversion Ratio in the Reorganization Transactions |
Number of shares of Class A Common Stock outstanding after the Reorganization Transactions and before the Offering |
||||||||||
| Class A |
268,138 | 45020.8 | % | 120,717,790 | ||||||||
| Class B |
50,000 | 43668.0 | % | 21,833,983 | ||||||||
| Class P-3 |
40,000 | 51477.2 | % | 20,590,891 | ||||||||
| Class P-4 |
1,000 | 2011931.4 | % | 20,119,314 | ||||||||
| Class X(1) |
3,966,348,838 | 3.4 | % | 136,643,631 | ||||||||
| Class V |
88,084,926 | 3.3 | % | 2,886,742 | ||||||||
|
|
|
|
|
|||||||||
| Total |
4,054,433,764 | 322,792,351 | ||||||||||
|
|
|
|
|
|||||||||
| (1) | Class X applicable units adjusted for net settled units for compensation expense purposes. |
The conversion ratio in the Reorganization Transaction is based on the attachment point for each class of Holdco Unit under the 3rd Holdings LLC Agreement. Each class of Holdco Unit is assigned value based on the overall valuation of the Company allocated through the waterfall of unit classes, which is then used to calculate the conversion ratio for each unit class in order to achieve that value. Certain units, such as the Class X units that were granted to certain members of management in June 2020, do not attain any value (through the mechanics of the waterfall) until their attachment point is met, which attachment point was at least equal to (or greater than) the value of the Company on the date such units were granted. Once that attachment point is reached, the value will increase at a rate greater than the value of the overall company has increased. The valuation of the Company has increased significantly between the grant of these X units in June 2020 through the date of this Offering due to changes in the financial performance and forecast for the Company and market conditions.
Incorporation of loanDepot, Inc.
loanDepot, Inc. was incorporated as a Delaware corporation on November 6, 2020. loanDepot, Inc. has not engaged in any business or other activities except in connection with its formation and its operations have been limited to serving as the potential holding company of LD Holdings. The amended and restated certificate of
81
Table of Contents
incorporation of loanDepot, Inc. at the time of the offering will authorize four classes of common stock, Class A Common Stock, Class B Common Stock, Class C Common Stock and Class D Common Stock and one or more series of preferred stock, each having the terms described in “Description of Capital Stock.”
Prior to completion of the offering, a number of shares of Class B Common Stock or Class C Common Stock, as applicable, equal to the number of outstanding Holdco Units owned by the Continuing LLC Members will be issued to the Continuing LLC Members in order to provide them with voting rights in loanDepot, Inc. Each Continuing LLC Member will receive a number of shares of Class B Common Stock or Class C Common Stock, as applicable, equal to the number of Holdco Units held by such Continuing LLC Member. See “Description of Capital Stock—Common Stock.” Holders of our Class A and Class B Common Stock each have one vote per share of Class A and Class B Common Stock, respectively, and holders of our Class C and Class D Common Stock each have five votes per share of Class C and Class D Common Stock, and vote together as a single class on all matters presented to our stockholders for their vote or approval, except as otherwise required by applicable law.
Formation of LD Holdings
LD Holdings Group LLC (f/k/a LoanDepot Holdings, LLC) was formed as a Delaware limited liability company on October 16, 2015. The 4th Holdings LLC Agreement designates loanDepot, Inc. as the member of LD Holdings which is entitled to appoint the board of managers of LD Holdings and provides for Holdco Units. Following the offering, the board of managers of LD Holdings will have the right to determine the timing and amount of any distributions (other than tax distributions as described in “—Holding Company Structure”) to be made to holders of the Holdco Units from LD Holdings, Profits and losses of LD Holdings will be allocated, and all distributions (other than tax distributions) with respect to Holdco Units will be made, pro rata to the holders of the Holdco Units. See “Certain Relationships and Related Party Transactions— Limited Liability Company Agreement of LD Holdings.”
Offering Transactions
We will enter into a tax receivable agreement with the Parthenon Stockholders, Parthenon affiliates owning Holdco Units and certain of the Continuing LLC Members that will provide for the payment from time to time by loanDepot, Inc. to such parties or their permitted assignees of 85% of the amount of the benefits, if any, that loanDepot, Inc. realizes or under certain circumstances (such as following a change of control) is deemed to realize as a result of (i) the increases in tax basis referred to above, (ii) any incremental tax basis adjustments attributable to payments made pursuant to the tax receivable agreement and (iii) any deemed interest deductions arising from payments made by us pursuant to the tax receivable agreement. See “Certain Relationships and Related Party Transactions—Tax Receivable Agreement.”
Further, upon consummation of the offering, loanDepot, Inc. will have acquired a significant equity interest in LD Holdings from Parthenon Blocker after a series of transactions that will result in Parthenon Blocker merging with and into loanDepot, Inc., with loanDepot, Inc. remaining as the surviving corporation. See “Organizational Structure—Reorganization Transactions at LD Holdings.” LD Holdings will not realize any of the cash savings in U.S. federal, state and local tax described above regarding tax basis adjustments and deemed interest deductions in relation to any Class D Common Stock received by the Parthenon Stockholders in the Reorganization Transactions. The Parthenon Stockholders or their permitted assignees, however, will be entitled to receive payments under the tax receivable agreement in respect of the cash tax savings, if any, that we realize or are deemed to realize as a result of future exchanges of Holdco Units and Class B Common Stock for Class A Common Stock of loanDepot, Inc.
We refer to the foregoing transactions as the “Offering Transactions.”
As a result of the transactions described above, and assuming the sale of shares of Class A Common Stock in this offering at a price per share to the public of $20.00, which is the midpoint of the estimated price range set forth on the cover page of this prospectus:
| • | the investors in the offering will collectively own 15,000,000 shares of our Class A Common Stock (or 17,250,000 shares of Class A Common Stock if the underwriters exercise in full their option to purchase additional shares of Class A Common Stock); |
82
Table of Contents
| • | the Continuing LLC Members will collectively hold 193,091,469 Holdco Units, representing 59.4% of the total economic interest of LD Holdings (or 191,679,969 Holdco Units, representing 59.0% if the underwriters exercise in full their option to purchase additional shares of Class A Common Stock), which can be exchanged together with an equal number of Class B or Class C Common Stock for newly issued Class A Common Stock pursuant to the Holdings LLC Agreement; |
| • | the investors in the offering will collectively have 1.1% of the voting power in loanDepot, Inc. (or 1.3% if the underwriters exercise in full their option to purchase additional shares of Class A Common Stock); and |
| • | the Parthenon Stockholders that will receive shares of Class D Common Stock in the Reorganization Transactions and the Continuing LLC Members that will hold Holdco Units and Class B Common Stock that may be exchanged for newly issued Class A Common Stock pursuant to the Holdings LLC Agreement, will collectively have 36.9% of the voting power in loanDepot, Inc. (or 36.8% if the underwriters exercise in full their option to purchase additional shares of Class A Common Stock). |
Our post-offering organizational structure will allow the Continuing LLC Members to retain their equity ownership in LD Holdings, an entity that is classified as a partnership for U.S. federal income tax purposes, in the form of Holdco Units. Investors in the offering and the Parthenon Stockholders will, by contrast, hold their equity ownership in loanDepot, Inc., a Delaware corporation that is a domestic corporation for U.S. federal income tax purposes, in the form of shares of Class A Common Stock and Class D Common Stock, respectively.
The Continuing LLC Members will also hold shares of Class B and Class C Common Stock of loanDepot, Inc. The shares of Class B Common Stock have only voting and no economic rights. A share of Class B or Class C Common Stock cannot be transferred except in connection with a transfer of a Holdco Unit. Further, a Holdco Unit cannot be exchanged with loanDepot, Inc. for a share of our Class A Common Stock without the corresponding share of our Class B Common Stock or Class C being delivered together at the time of exchange for cancellation by us. Accordingly, as the Continuing LLC Members subsequently exchange Holdco Units for shares of Class A Common Stock of loanDepot, Inc. pursuant to the Holdings LLC Agreement, the voting power afforded to the Continuing LLC Members by their shares of Class B or Class C Common Stock is automatically and correspondingly reduced.
Holding Company Structure
loanDepot, Inc. will be a holding company, and its sole material asset will be an equity interest in LD Holdings, which will hold the equity interests in LDLLC as described above. loanDepot, Inc. will indirectly control all of the business and affairs of LD Holdings and its subsidiaries, including LDLLC, through its ability to appoint the board of managers of LD Holdings, which will have the ability to appoint the board of managers of LDLLC.
loanDepot, Inc. will consolidate the financial results of LD Holdings and its subsidiaries, including LDLLC, and the ownership interest of the Continuing LLC Members will be reflected as a non-controlling interest in loanDepot, Inc.’s consolidated financial statements.
Pursuant to the Holdings LLC Agreement, the board of managers of LD Holdings has the right to determine when distributions (other than tax distributions) will be made to the members of LD Holdings and the amount of any such distributions, and loanDepot, Inc. will have the right to appoint such board of managers under the Holdings LLC Agreement. If loanDepot, Inc. authorizes a distribution, such distribution will be made to the holders of Holdco Units, including loanDepot, Inc., pro rata based on their holdings of Holdco Units.
The holders of Holdco Units, including loanDepot, Inc., will generally have to include for purposes of calculating their U.S. federal, state and local income taxes their share of any taxable income of LD Holdings. Taxable income of LD Holdings generally will be allocated to the holders of Holdco Units (including loanDepot, Inc.) pro rata in accordance with their respective share of the net profits and net losses of LD Holdings. LD Holdings will be obligated, subject to available cash and applicable law and contractual restrictions (including pursuant to our debt instruments), to make cash distributions, which we refer to as “tax distributions,” based on certain assumptions, to its members (including loanDepot, Inc.). LD Holdings may be required to make tax distributions that, in the aggregate, may exceed the amount of taxes that LD Holdings would have paid if it were taxed on its net income at the assumed rate. See “Certain Relationships and Related Party Transactions—Limited Liability Company Agreement of LD Holdings.
83
Table of Contents
We estimate that the net proceeds to us from the offering will be approximately $168.2 million (or $194.3 million if the underwriters exercise in full their option to purchase additional shares of Class A Common Stock) based upon an assumed initial public offering price of $20.00 per share, which is the midpoint of the estimated price range set forth on the cover page of this prospectus, after deducting underwriting discounts and commissions and estimated offering expenses. We will not receive any proceeds from the sale of shares of our Class A Common Stock by the selling stockholders.
We intend to use the net proceeds to us from this offering together with cash on hand to purchase 9,410,000 Holdco Units, together with an equal number of 9,410,000 shares of our Class B or Class C Common Stock, from the Exchanging Members, including our Chief Executive Officer and certain of our other officers (at a purchase price per unit and share of Class B or Class C Common Stock, based on the midpoint of the estimated price range set forth on the cover page of this prospectus, net of underwriting discounts and commissions).
If the underwriters exercise in full their option to purchase 2,250,000 additional shares of Class A Common Stock, in addition to the use of our net proceeds as described above, we intend to use approximately $26.1 million of the net proceeds from our sale of 1,411,500 additional shares to purchase 1,411,500 Holdco Units, together with an equal number of shares of Class B or Class C Common Stock, from the Exchanging Members, including our Chief Executive Officer and certain of our other officers (at a purchase price per unit and share of Class B Common Stock or Class C Common Stock, based on the midpoint of the estimated price range set forth on the cover page of this prospectus, net of underwriting discounts and commissions). If the underwriters exercise in full their option to purchase additional shares of Class A Common Stock, the remaining 838,500 shares will be sold by the selling stockholders, and we will not retain any proceeds from their sale of such shares.
See “Certain Relationships and Related Party Transactions” for the amounts of net proceeds that will be used to purchase Holdco Units from our officers and “Principal and Selling Stockholders” for information concerning the selling stockholders and Exchanging Members in this offering.
Each $1.00 increase or decrease in the assumed initial public offering price of $20.00 per share, which is the midpoint of the estimated price range set forth on the cover page of this prospectus, would increase or decrease the net proceeds to us from this offering by approximately $8.7 million assuming that the number of shares offered by us, as set forth on the cover page of this prospectus, remains the same.
84
Table of Contents
Beginning with the first full quarter following the completion of this offering, we intend to pay cash dividends subject to the discretion of our board of directors and our compliance with applicable law, and depending on, among other things, our results of operations, financial condition, level of indebtedness, capital requirements, contractual restrictions, including the satisfaction of our obligations under the tax receivable agreement, restrictions in our debt agreements, business prospects and other factors that our board of directors may deem relevant. We expect to pay a quarterly cash dividend on our common stock of $0.08 per share (or an annual dividend of $0.32 per share) and resulting in an annual yield of 1.6% based on a price of $20.00 per share, which is the midpoint of the estimated price range set forth on the cover page of this prospectus. We will evaluate future increases to our quarterly dividend consistent with our cash flow and liquidity position. The payment, including timing and amount, of such quarterly dividends and any future dividends will be at the discretion of our board of directors.
Our ability to pay dividends depends on our receipt of cash dividends from our operating subsidiaries, which may further restrict our ability to pay dividends as a result of the laws of their jurisdiction of organization or agreements of our subsidiaries, including agreements governing our indebtedness. Future agreements may also limit our ability to pay dividends. See “Management’s Discussion and Analysis of Financial Condition and Results of Operations” and “Description of Certain Indebtedness” for a description of the restrictions on our ability to pay dividends.
Following this offering, we will receive a portion of any distributions made by LDLLC. Under the 10th LLC Agreement, loanDepot, Inc., through its ability to appoint the board of managers of LD Holdings, which will have the ability to appoint the board of managers of LDLLC, has the right to determine when distributions (other than tax distributions) will be made by LDLLC to LD Holdings and the amount of any such distributions. Under the Holdings LLC Agreement, the board of managers of LD Holdings has the right to determine when distributions (other than tax distributions) will be made to unitholders of LD Holdings and the amount of any such distributions. Any such distributions will be distributed to all holders of Holdco Units, including us, pro rata based on their holdings of Holdco Units. The cash received from such distributions will first be used by us to satisfy any tax liability and then to make any payments required under the tax receivable agreement to the Parthenon Stockholders, Parthenon affiliates owning Holdco Units and certain of the Continuing LLC Members or their permitted assignees.
85
Table of Contents
The following table sets forth LD Holdings’ consolidated cash and cash equivalents and capitalization as of September 30, 2020:
| • | on a historical basis for LD Holdings; and |
| • | a pro forma basis for loanDepot, Inc., giving effect to the transactions described under “Unaudited Pro Forma Consolidated Financial Information,” including the October Transactions and the application of the proceeds to us from this offering as described in “Use of Proceeds” based upon an assumed initial public offering price of $20.00 per share, which is the midpoint of the estimated price range set forth on the cover page of this prospectus, after deducting estimated underwriting discounts and commissions and estimated offering expenses and other related transaction costs payable by us. |
You should read this table together with the information contained in this prospectus, including “Unaudited Pro Forma Consolidated Financial Information,” “Management’s Discussion and Analysis of Financial Condition and Results of Operations” and the historical financial statements and related notes included elsewhere in this prospectus.
| As of September 30, 2020 | ||||||||||||||||||||||||||||||||
| $ in thousands | Actual LD Holdings |
October Transaction Adjustments |
Distribution Adjustments |
Offering Adjustments |
Pro Forma loanDepot, Inc. |
|||||||||||||||||||||||||||
| ASSETS |
||||||||||||||||||||||||||||||||
| Cash and cash equivalents |
$ | 637,511 | $ | 5,000 | (1 | ) | $ | (642,511 | ) | (8 | ) | $ | — | $ | — | |||||||||||||||||
| DEBT(2) |
||||||||||||||||||||||||||||||||
| Warehouse lines of credit(3) |
4,601,062 | — | — | — | 4,601,062 | |||||||||||||||||||||||||||
| Secured Credit Facilities |
170,000 | (170,000 | ) | (4 | ) | — | — | — | ||||||||||||||||||||||||
| GMSR VFN |
15,000 | — | — | — | 15,000 | |||||||||||||||||||||||||||
| Term Notes |
200,000 | — | — | — | 200,000 | |||||||||||||||||||||||||||
| Unsecured Term Loan |
250,000 | (250,000 | ) | (5 | ) | — | — | — | ||||||||||||||||||||||||
| Convertible Debt |
75,000 | (75,000 | ) | (6 | ) | — | — | — | ||||||||||||||||||||||||
| Financing Lease Obligations |
18,258 | — | — | — | 18,258 | |||||||||||||||||||||||||||
| Senior Notes |
— | 500,000 | (7 | ) | — | — | 500,000 | |||||||||||||||||||||||||
|
|
|
|
|
|
|
|
|
|
|
|||||||||||||||||||||||
| Total debt |
5,329,320 | 5,000 | — | — | 5,334,320 | |||||||||||||||||||||||||||
| Total redeemable units |
104,200 | — | (32,300 | ) | (9 | ) | (71,900 | ) | (11 | ) | — | |||||||||||||||||||||
| Capital (equity): |
||||||||||||||||||||||||||||||||
| Unitholders’ equity |
1,529,321 | — | (643,707 | ) | (10 | ) | (885,614 | ) | (11 | ) | — | |||||||||||||||||||||
| Class A Common Stock |
— | — | — | 17 | (12 | ) | 17 | |||||||||||||||||||||||||
| Class B Common Stock |
— | — | — | — | — | |||||||||||||||||||||||||||
| Class C Common Stock |
— | — | — | 193 | (12 | ) | 193 | |||||||||||||||||||||||||
| Class D Common Stock |
— | — | — | 115 | (12 | ) | 115 | |||||||||||||||||||||||||
| Preferred stock |
— | — | — | — | — | |||||||||||||||||||||||||||
| Additional paid-in-capital |
— | — | — | 416,309 | (13 | ) | 416,309 | |||||||||||||||||||||||||
| Retained earnings |
— | — | — | (61,455 | ) | (14 | ) | (61,455 | ) | |||||||||||||||||||||||
|
|
|
|
|
|
|
|
|
|
|
|||||||||||||||||||||||
| Total unitholders’ equity/loanDepot, Inc. stockholders’ equity |
1,529,321 | — | (643,707 | ) | (530,435 | ) | 355,179 | |||||||||||||||||||||||||
| Noncontrolling interest |
— | — | — | 467,595 | (15 | ) | 467,595 | |||||||||||||||||||||||||
|
|
|
|
|
|
|
|
|
|
|
|||||||||||||||||||||||
| Total equity |
1,633,521 | — | (676,007 | ) | (134,740 | ) | 822,774 | |||||||||||||||||||||||||
|
|
|
|
|
|
|
|
|
|
|
|||||||||||||||||||||||
| Total Capitalization |
$ | 7,600,352 | $ | 10,000 | $ | (1,318,518 | ) | $ | (134,740 | ) | $ | 6,157,094 | ||||||||||||||||||||
|
|
|
|
|
|
|
|
|
|
|
|||||||||||||||||||||||
86
Table of Contents
| (1) | Includes $5.0 million in net proceeds from our $500.0 million Senior Note issuance, net of the $170.0 million paydown of Secured Credit Facilities and repayment of the $250.0 million Unsecured Term Loan and $75.0 million Convertible Debt. |
| (2) | Debt amounts are shown gross, excluding deferred financing costs. |
| (3) | Does not reflect the repurchase of the mortgage loans securing our 2018 Securitization Facility. Such facility was replaced by our 2020-1 Securitization Facility, resulting in no net changes to our indebtedness. |
| (4) | Balance includes the Original Secured Credit Facility and the Second Secured Credit Facility. As a result of the October Transactions, we repaid $170.0 million under our Secured Credit Facilities. Does not reflect approximately $4.3 million originally drawn under our Advance Receivables Trust, under which incremental borrowings are drawn and repaid from time to time. |
| (5) | In October 2020, we repaid in full the Unsecured Term Loan. |
| (6) | In October 2020, we repaid in full the Convertible Debt. |
| (7) | In October 2020 we issued $500.0 million in 6.50% Senior Notes due 2025. |
| (8) | Reflects cash distributions made by the Company from cash on hand and cash generated from operations during the fourth quarter of 2020 and first quarter of 2021 to certain of its unitholders that included profit distributions of $573.2 million as allowed under the Company’s operating agreement and tax distributions of $102.8 million as required under the Company’s operating agreement. Cash generated from the fourth quarter 2020 and first quarter 2021 are not reflected in the pro forma cash balance, thus the $33.5 million excess of distributions over the pro forma cash balance has been reclassified to accrued expenses and other liabilities. |
| (9) | Includes $32.3 million redemption of units in the fourth quarter of 2020 from profit distributions. |
| (10) | Includes $540.9 million of profit distributions and $102.8 million in tax distributions during the fourth quarter of 2020 and first quarter of 2021. |
| (11) | Includes reductions of $71.9 million of redeemable units and $885.6 million of unitholders’ equity to reflect the reorganization and offering transaction which collapsed the prior capital structure. |
| (12) | Reflects the par value of our Class A, Class C and Class D Common Stock issued in connection with the offering transaction. |
| (13) | The following summarizes the activity for additional paid-in-capital related to the reorganization and offering transaction: |
| Net adjustment for recognition of deferred tax liability of $81.7 million and tax receivable agreement liability of $44.4 million associated with the offering |
$ | (126,076 | ) | |
| Adjustment for stock compensation expense (see Note 14) |
52,791 | |||
| Adjustment for Class A, Class C and Class D Common Stock issued in connection with the offering |
(325 | ) | ||
| Adjustment for noncontrolling interest (see Note 15) |
489,919 | |||
|
|
|
|||
| Additional paid-in-capital adjustment |
$ | 416,309 | ||
|
|
|
| (14) | Includes $8.7 million in certain costs associated with the offering which will be recorded as a reduction to retained earnings at the time of the offering. Costs include legal, accounting and other related costs attributable with the offering. Additionally, reflects $52.8 million reduction to retained earnings for stock compensation expense associated with restricted stock units granted under the loanDepot, Inc. 2021 Omnibus Incentive Plan as a result of the offering. |
| (15) | The following summarizes the activity for noncontrolling interest related to the reorganization and offering transaction: |
| Beginning redeemable units and unitholders’ equity |
$ | 957,514 | ||
| Net adjustment for recognition of deferred tax liability of $81.7 million and tax receivable agreement liability of $44.4 million associated with the offering |
(126,076 | ) | ||
| Adjustment for offering expenses (see Note 14) |
(8,664 | ) | ||
|
|
|
|||
| Total Equity |
822,774 | |||
| Continuing LLC Member interests in LD Holdings |
56.8 | % | ||
|
|
|
|||
| Noncontrolling interests |
$ | 467,595 | ||
|
|
|
87
Table of Contents
If you invest in the initial public offering of our Class A Common Stock, your interest will be diluted to the extent of the excess of the initial public offering price per share of our Class A Common Stock over the pro forma net tangible book value per share of our Class A Common Stock after this offering. Dilution results from the fact that the per share offering price of the Class A Common Stock is substantially in excess of the net tangible book value per share attributable to the existing equity holders.
Our pro forma net tangible book value at September 30, 2020 was approximately $914.6 million. Pro forma net tangible book value represents the amount of total tangible assets less total liabilities of LD Holdings, after giving effect to the Reorganization Transactions, and pro forma net tangible book value per share represents pro forma net tangible book value divided by the number of shares of Class A Common Stock outstanding, after giving effect to the Reorganization Transactions and assuming that all of the Continuing LLC Members exchanged their Holdco Units and Class B or Class C Common Stock and all of the Parthenon Stockholders were exchanged their Class D Common Stock, in each case for newly issued shares of our Class A Common Stock on a one-for-one basis.
After giving effect to this offering, at an assumed initial public offering price of $20.00 per share, which is the midpoint of the estimated price range set forth on the cover page of this prospectus, and the application of estimated net proceeds, after deducting underwriting discounts and commissions and estimated offering expenses payable by us, our pro forma net tangible book value at September 30, 2020 would have been $779.8 million, or $2.40 per share of Class A Common Stock, assuming that all of the Continuing LLC Members exchanged their Holdco Units and Class B or Class C Common Stock and all of the Parthenon Stockholders were exchanged their Class D Common Stock, in each case for newly issued shares of our Class A Common Stock on a one-for-one basis and 2,207,649 of restricted stock units for our Class A Common Stock that will vest upon the completion of this offering.
The following table illustrates the immediate dilution of $17.60 per share to new stockholders purchasing Class A Common Stock in this offering, assuming the underwriters do not exercise their option to purchase additional shares.
| Assumed initial public offering price per share |
$ | 20.00 | ||||||
| Pro forma net tangible book value per share at September 30, 2020 |
$ | 2.83 | ||||||
| Decrease per share attributable to this offering |
0.43 | |||||||
|
|
|
|||||||
| Pro forma net tangible book value per share, as adjusted to give effect to this offering |
2.40 | |||||||
|
|
|
|||||||
| Dilution in pro forma net tangible book value per share to new investors |
$ | 17.60 | ||||||
|
|
|
The following table summarizes, on the same pro forma basis at September 30, 2020, the total number of shares of Class A Common Stock purchased from us, the total cash consideration paid to us and by new investors purchasing shares in the offering, assuming that all of the Continuing LLC Members exchanged their Holdco Units and Class B or Class C Common Stock and all of the Parthenon Stockholders were exchanged their Class D Common Stock, in each case for shares of our Class A Common Stock on a one-for-one basis.
| Shares of Class A Common Stock Purchased/ Granted |
Total Consideration | Average Price |
||||||||||||||||||
| Number | Percentage | Amount | Percentage | Per Share | ||||||||||||||||
| (in thousands, except per share amounts) | ||||||||||||||||||||
| Investors prior to this offering |
307,792 | 95 | % | $ | 883,363 | 75 | % | $ | 2.87 | |||||||||||
| New investors in this offering(1) |
15,000 | 5 | % | $ | 300,000 | 25 | % | $ | 20.00 | |||||||||||
|
|
|
|
|
|
|
|
|
|
|
|||||||||||
| Total |
322,792 | 100 | % | $ | 1,183,363 | 100 | % | $ | 7.40 | |||||||||||
|
|
|
|
|
|
|
|
|
|
|
|||||||||||
| (1) | Does not include 2,207,649 restricted stock units for Class A Common Stock that vested at the completion of this offering and for which no proceeds were received. |
88
Table of Contents
If the underwriters’ option to purchase additional shares is exercised in full, the decrease in pro forma net tangible book value per share at September 30, 2020 attributable to this offering would have been approximately $2.40 per share and the dilution in pro forma net tangible book value per share to new investors would be $17.60 per share. Furthermore, the percentage of our shares held by existing equity owners would decrease to approximately 95.2% and the percentage of our shares held by new investors would increase to approximately 4.8%.
A $1.00 increase or decrease in the assumed initial public offering price of $20.00 per share, which is the midpoint of the estimated price range set forth on the cover page of this prospectus, would increase or decrease total consideration paid by new investors in this offering and total consideration paid by all investors by approximately $8.70 million, assuming that the number of shares offered by us, as set forth on the cover page of this prospectus, remains the same.
89
Table of Contents
SELECTED HISTORICAL CONSOLIDATED CONDENSED FINANCIAL INFORMATION
The following tables present selected historical consolidated financial information for the periods and as of the dates indicated. The selected consolidated statement of operations data presented below for the years ended December 31, 2019, 2018 and 2017 and the consolidated balance sheet data as of December 31, 2019, 2018 and 2017 are derived from the audited consolidated financial statements of LD Holdings included elsewhere in this prospectus. The selected consolidated statement of operations data presented below for the years ended December 31, 2016 and 2015 and the consolidated balance sheet data as of December 31, 2016 and 2015 are derived from the audited consolidated financial statements of LDLLC, LD Holdings accounting predecessor. Our historical results are not necessarily indicative of future results and our interim results are not necessarily indicative of results to be expected for a full fiscal year period.
The selected consolidated statement of operations data presented below for the nine months ended September 30, 2020 and 2019 and the balance sheet data presented below as of September 30, 2020 and 2019 are derived from LD Holdings’ unaudited consolidated financial statements included elsewhere in this prospectus. LD Holdings’ unaudited consolidated financial statements have been prepared on the same basis as their audited consolidated financial statements and, in our opinion, reflect all adjustments, consisting only of normal and recurring adjustments, necessary for a fair presentation of such financial statements in all material respects. The results for any interim period are not necessarily indicative of the results that may be expected for a full year or any future period. These selected financial data should be read together with our consolidated financial statements and our consolidated interim financial statements and the related notes, as well as the sections captioned “Unaudited Pro Forma Consolidated Financial Information” and “Management’s Discussion and Analysis of Financial Condition and Results of Operations” appearing elsewhere in this prospectus.
| Condensed Consolidated Statement of Operations Data: (Dollars in thousands) |
Nine Months Ended September 30, |
Year Ended December 31, | ||||||||||||||||||||||||||
| 2020 | 2019 | 2019 | 2018 | 2017 | 2016 | 2015 | ||||||||||||||||||||||
| (Unaudited) | ||||||||||||||||||||||||||||
| Revenues: |
||||||||||||||||||||||||||||
| Net interest income (expense) |
$ | 9,268 | $ | (3,057 | ) | $ | (2,775 | ) | $ | 17,295 | $ | 16,749 | $ | 16,451 | $ | 14,340 | ||||||||||||
| Gain on origination and sale of loans, net |
2,873,455 | 788,054 | 1,125,853 | 799,564 | 1,011,791 | 1,101,125 | 791,721 | |||||||||||||||||||||
| Origination income, net |
167,554 | 107,850 | 149,500 | 153,036 | 159,184 | 124,942 | 99,917 | |||||||||||||||||||||
| Servicing fee income |
121,520 | 85,022 | 118,418 | 141,195 | 115,486 | 62,132 | 49,445 | |||||||||||||||||||||
| Change in fair value of servicing rights, net |
(216,132 | ) | (100,051 | ) | (119,546 | ) | (51,487 | ) | (88,701 | ) | (40,001 | ) | (59,471 | ) | ||||||||||||||
| Other income |
58,115 | 44,022 | 65,681 | 54,750 | 58,470 | 36,857 | 26,408 | |||||||||||||||||||||
|
|
|
|
|
|
|
|
|
|
|
|
|
|
|
|||||||||||||||
| Total net revenues |
3,013,780 | 921,840 | 1,337,131 | 1,114,353 | 1,272,979 | 1,301,506 | 922,360 | |||||||||||||||||||||
| Expenses: |
||||||||||||||||||||||||||||
| Personnel expense |
1,022,734 | 525,948 | 765,256 | 681,378 | 726,616 | 687,249 | 553,377 | |||||||||||||||||||||
| Marketing and advertising expense |
173,628 | 133,799 | 187,880 | 190,777 | 216,012 | 161,803 | 124,851 | |||||||||||||||||||||
| Direct origination expense |
88,627 | 61,786 | 93,531 | 83,033 | 76,232 | 72,488 | 50,688 | |||||||||||||||||||||
| Subservicing expense |
52,154 | 28,736 | 41,397 | 50,433 | 36,403 | 24,304 | 14,426 | |||||||||||||||||||||
| General, administrative, occupancy and other expenses |
209,241 | 153,076 | 216,396 | 212,076 | 187,910 | 182,354 | 128,877 | |||||||||||||||||||||
|
|
|
|
|
|
|
|
|
|
|
|
|
|
|
|||||||||||||||
| Total expenses |
1,546,384 | 903,345 | 1,304,460 | 1,217,697 | 1,243,173 | 1,128,198 | 872,219 | |||||||||||||||||||||
| Income tax expense (benefit) |
1,457 | 288 | (1,749 | ) | (475 | ) | 1,436 | 4,524 | 711 | |||||||||||||||||||
|
|
|
|
|
|
|
|
|
|
|
|
|
|
|
|||||||||||||||
| Net income (loss) |
$ | 1,465,939 | $ | 18,207 | $ | 34,420 | $ | (102,869 | ) | $ | 28,370 | $ | 168,784 | $ | 49,430 | |||||||||||||
|
|
|
|
|
|
|
|
|
|
|
|
|
|
|
|||||||||||||||
90
Table of Contents
| Condensed Consolidated Balance Sheet Data: (Dollars in thousands) |
September 30, | December 31, | ||||||||||||||||||||||||||
| 2020 | 2019 | 2019 | 2018 | 2017 | 2016 | 2015 | ||||||||||||||||||||||
| (Unaudited) | (Unaudited) | |||||||||||||||||||||||||||
| Assets |
||||||||||||||||||||||||||||
| Cash and cash equivalents |
$ | 637,511 | $ | 46,333 | $ | 73,301 | $ | 105,685 | $ | 84,479 | $ | 107,956 | $ | 62,599 | ||||||||||||||
| Loans held for sale, at fair value |
4,888,364 | 3,081,401 | 3,681,840 | 2,295,451 | 2,431,446 | 2,062,407 | 1,805,524 | |||||||||||||||||||||
| Derivative assets, at fair value |
722,149 | 164,599 | 131,228 | 73,439 | 104,148 | 112,044 | 81,388 | |||||||||||||||||||||
| Servicing rights, at fair value |
780,451 | 349,472 | 447,478 | 412,953 | 530,049 | 340,998 | 223,116 | |||||||||||||||||||||
| Total assets |
8,651,313 | 4,255,080 | 4,952,511 | 3,436,793 | 3,658,495 | 3,042,308 | 2,455,056 | |||||||||||||||||||||
| Liabilities and unitholders’ equity |
||||||||||||||||||||||||||||
| Warehouse and other lines of credit |
4,601,062 | 2,900,512 | 3,466,567 | 2,126,640 | 2,258,665 | 1,905,401 | 1,720,044 | |||||||||||||||||||||
| Derivative liabilities, at fair value |
59,432 | 5,463 | 9,977 | 32,575 | 9,039 | 18,171 | 4,924 | |||||||||||||||||||||
| Debt obligations, net |
706,478 | 539,384 | 592,095 | 547,893 | 469,357 | 167,327 | 153,581 | |||||||||||||||||||||
| Total liabilities |
7,017,792 | 3,893,877 | 4,576,626 | 3,087,902 | 3,200,681 | 2,570,839 | 2,145,669 | |||||||||||||||||||||
| Total redeemable units and unitholders’ equity |
1,633,521 | 361,203 | 375,885 | 348,891 | 457,814 | 471,469 | 309,387 | |||||||||||||||||||||
| Total liabilities, redeemable units and unitholders’ equity |
8,651,313 | 4,255,080 | 4,952,511 | 3,436,793 | 3,658,495 | 3,042,308 | 2,455,056 | |||||||||||||||||||||
| Servicing Portfolio Data: |
||||||||||||||||||||||||||||
| Total servicing portfolio (unpaid principal balance) |
$ | 77,171,998 | $ | 30,553,920 | $ | 36,336,126 | $ | 32,815,954 | $ | 46,764,869 | $ | 29,790,163 | $ | 21,065,873 | ||||||||||||||
| Total servicing portfolio (units) |
272,701 | 130,640 | 148,750 | 141,561 | 203,592 | 128,842 | 94,946 | |||||||||||||||||||||
91
Table of Contents
Key Performance Indicators
| (Unaudited) (Dollars in thousands) |
Nine Months Ended September 30, |
Year Ended December 31, | ||||||||||||||||||
| 2020 | 2019 | 2019 | 2018 | 2017 | ||||||||||||||||
| Non-GAAP financial measures: |
||||||||||||||||||||
| Adjusted total revenue |
$ | 3,000,201 | $ | 938,982 | $ | 1,346,178 | $ | 1,107,661 | $ | 1,287,228 | ||||||||||
| Adjusted EBITDA |
1,554,172 | 94,507 | 124,005 | (33,833 | ) | 93,155 | ||||||||||||||
| Adjusted net income (loss) |
1,085,891 | 27,209 | 31,885 | (80,109 | ) | 30,128 | ||||||||||||||
| Adjusted EBITDA margin |
51.8 | % | 10.1 | % | 9.2 | % | (3.1 | )% | 7.2 | % | ||||||||||
| Adjusted net income margin |
36.2 | 2.9 | 2.4 | (7.2 | ) | 2.3 | ||||||||||||||
| Loan origination metrics: |
||||||||||||||||||||
| Total loan originations |
$ | 63,364,799 | $ | 29,268,054 | $ | 45,324,026 | $ | 33,039,029 | $ | 35,193,887 | ||||||||||
| Retail loan originations |
50,591,415 | 21,291,576 | 32,700,837 | 24,103,719 | 27,136,741 | |||||||||||||||
| Partner loan originations |
12,773,384 | 7,976,478 | 12,623,189 | 8,935,310 | 8,057,146 | |||||||||||||||
| Loan originations by purpose: |
||||||||||||||||||||
| Purchase |
$ | 18,487,155 | $ | 13,215,487 | $ | 18,513,555 | $ | 16,640,101 | $ | 14,060,472 | ||||||||||
| Refinance |
44,877,644 | 16,052,567 | 26,810,471 | 16,398,928 | 21,133,415 | |||||||||||||||
|
|
|
|
|
|
|
|
|
|
|
|||||||||||
| Total originations |
$ | 63,364,799 | $ | 29,268,054 | $ | 45,324,026 | $ | 33,039,029 | $ | 35,193,887 | ||||||||||
|
|
|
|
|
|
|
|
|
|
|
|||||||||||
| Purchase (%) |
29.2 | % | 45.2 | % | 40.8 | % | 50.4 | % | 40.0 | % | ||||||||||
| Refinance (%) |
70.8 | 54.8 | 59.2 | 49.6 | 60.0 | |||||||||||||||
| Total market share—loan originations |
2.6 | % | 2.0 | % | 2.0 | % | 2.0 | % | 2.0 | % | ||||||||||
| Gain on sale margin |
4.80 | % | 3.06 | % | 2.81 | % | 2.88 | % | 3.33 | % | ||||||||||
| Gain on sale margin—retail |
4.96 | 3.67 | 3.39 | 3.62 | 3.87 | |||||||||||||||
| Gain on sale margin—partner |
3.34 | 1.15 | 1.16 | 1.09 | 1.30 | |||||||||||||||
| (Unaudited) (Dollars in thousands) |
September 30, | December 31, | ||||||||||||||||||
| 2020 | 2019 | 2019 | 2018 | 2017 | ||||||||||||||||
| Servicing metrics: |
||||||||||||||||||||
| Total servicing portfolio (unpaid principal balance) |
$ | 77,171,998 | $ | 30,553,920 | $ | 36,336,126 | $ | 32,815,954 | $ | 46,764,869 | ||||||||||
| Total servicing portfolio (units) |
272,701 | 130,640 | 148,750 | 141,561 | 203,592 | |||||||||||||||
| 60+ days delinquent ($) |
$ | 2,073,862 | $ | 339,870 | $ | 383,272 | $ | 410,647 | $ | 597,811 | ||||||||||
| 60+ days delinquent (%) |
2.7 | % | 1.1 | % | 1.1 | % | 1.3 | % | 1.3 | % | ||||||||||
| Servicing rights, at fair value: |
||||||||||||||||||||
| Fair value, net(1) |
$ | 776,993 | $ | 346,915 | $ | 444,443 | $ | 408,989 | $ | 528,911 | ||||||||||
| Weighted average servicing fee |
0.31 | % | 0.35 | % | 0.35 | % | 0.33 | % | 0.30 | % | ||||||||||
| Multiple(2) |
3.3x | 3.3x | 3.6x | 3.9x | 3.8x | |||||||||||||||
| (1) | Amounts represent the fair value of servicing rights, net of servicing liabilities, which are included in accounts payable, accrued expenses and other liabilities in the consolidated balance sheets. |
| (2) | Amount represents the fair value of servicing rights, net divided by the weighted average annualized servicing fee. |
92
Table of Contents
Reconciliation of Non-GAAP Measures
To provide investors with information in addition to our results as determined by GAAP, we disclose Adjusted Total Revenue, Adjusted EBITDA and Adjusted Net Income as non-GAAP measures which management believes provide useful information to investors. These measures are not financial measures calculated in accordance with GAAP and should not be considered as a substitute for revenue, net income, or any other operating performance measure calculated in accordance with GAAP, and may not be comparable to a similarly titled measure reported by other companies.
We define “Adjusted Total Revenue” as total revenues, net of the change in fair value of mortgage servicing rights (“MSRs”) and the related hedging gains and losses. We define “Adjusted EBITDA” as earnings before interest expense and amortization of debt issuance costs on non-funding debt, income taxes, depreciation and amortization, change in fair value of MSRs, net of the related hedging gains and losses, change in fair value of contingent consideration and stock-based compensation expense and management fees. We define “Adjusted Net Income” as tax-effected earnings before stock-based compensation expense and the change in fair value of MSRs, net of the related hedging gains and losses, and the tax effects of those adjustments. Adjustments for income taxes are made to reflect LD Holdings historical results of operations on the basis that it was taxed as a corporation under the Internal Revenue Code, and therefore subject to U.S. federal, state and local income taxes. We exclude from each of these non-GAAP measures the change in fair value of MSRs and related hedging gains and losses as this represents a non-cash non-realized adjustment to our total revenues, reflecting changes in assumptions including discount rates and prepayment speed assumptions, mostly due to changes in market interest rates, which is not indicative of our performance or results of operations. We also exclude stock compensation expense, which is a non-cash expense, and management fees as management does not consider these costs to be indicative of our performance or results of operations. Adjusted EBITDA includes interest expense on funding facilities, which are recorded as a component of “net interest income (expense)”, as these expenses are a direct operating expense driven by loan origination volume. By contrast, interest and amortization expense on nonfunding debt is a function of our capital structure and is therefore excluded from Adjusted EBITDA.
Adjusted Total Revenue, Adjusted EBITDA and Adjusted Net Income have limitations as analytical tools, and you should not consider them in isolation or as a substitute for analysis of our results as reported under U.S. GAAP. Some of these limitations are:
| • | they do not reflect every cash expenditure, future requirements for capital expenditures or contractual commitments; |
| • | Adjusted EBITDA does not reflect the significant interest expense or the cash requirements necessary to service interest or principal payment on our debt; |
| • | although depreciation and amortization are non-cash charges, the assets being depreciated and amortized will often have to be replaced or require improvements in the future, and Adjusted Revenue, Adjusted Net Income and Adjusted EBITDA do not reflect any cash requirement for such replacements or improvements; and |
| • | they are not adjusted for all non-cash income or expense items that are reflected in our statements of cash flows. |
Because of these limitations, Adjusted Revenue, Adjusted EBITDA and Adjusted Net Income are not intended as alternatives to total revenue, net income (loss), or net income attributable to the Company or as an indicator of our operating performance and should not be considered as measures of discretionary cash available to us to invest in the growth of our business or as measures of cash that will be available to us to meet our obligations. We compensate for these limitations by using Adjusted Revenue, Adjusted Net Income and Adjusted EBITDA along with other comparative tools, together with U.S. GAAP measurements, to assist in the evaluation of operating performance. See below for reconciliation of these non-GAAP measures to their most comparable
93
Table of Contents
U.S. GAAP measures. Additionally, our U.S. GAAP-based measures can be found in the combined financial statements and related notes included elsewhere in this prospectus.
| Reconciliation of Total Revenue to Adjusted
Total |
Nine Months Ended September 30, |
Year Ended December 31, | ||||||||||||||||||
| 2020 | 2019 | 2019 | 2018 | 2017 | ||||||||||||||||
| Total net revenue |
$ | 3,013,780 | $ | 921,840 | $ | 1,337,131 | $ | 1,114,353 | $ | 1,272,979 | ||||||||||
| Change in fair value of servicing rights(1) |
111,751 | 65,316 | 51,639 | (34,073 | ) | 26,720 | ||||||||||||||
| Net (gains) losses from derivatives hedging servicing rights(1) |
(19,015 | ) | (23,357 | ) | (20,974 | ) | 13,529 | (4,539 | ) | |||||||||||
| Realized and unrealized (gains) losses from derivative assets and liabilities(2) |
(106,315 | ) | (24,817 | ) | (21,618 | ) | 13,852 | (7,932 | ) | |||||||||||
|
|
|
|
|
|
|
|
|
|
|
|||||||||||
| Change in fair value of servicing rights, net of hedging gains and losses(3) |
(13,579 | ) | 17,142 | 9,047 | (6,692 | ) | 14,249 | |||||||||||||
|
|
|
|
|
|
|
|
|
|
|
|||||||||||
| Adjusted total revenue |
$ | 3,000,201 | $ | 938,982 | $ | 1,346,178 | $ | 1,107,661 | $ | 1,287,228 | ||||||||||
|
|
|
|
|
|
|
|
|
|
|
|||||||||||
| (1) | Included in change in fair value of servicing rights, net in the Company’s consolidated statements of operations. |
| (2) | Included in gain on origination and sale of loans, net in the Company’s consolidated statements of operations. |
| Nine Months Ended September 30, |
Year Ended December 31, | |||||||||||||||||||
| 2020 | 2019 | 2019 | 2018 | 2017 | ||||||||||||||||
| Unrealized gains from derivative assets and liabilities |
$ | 519,465 | $ | 123,302 | $ | 85,679 | $ | (58,473 | ) | $ | (4,015 | ) | ||||||||
| Less: Unrealized gains from derivative assets and liabilities—IRLC and LHFS |
498,090 | 124,409 | 95,578 | (66,150 | ) | (1,374 | ) | |||||||||||||
|
|
|
|
|
|
|
|
|
|
|
|||||||||||
| Unrealized gains from derivative assets and liabilities—servicing rights |
21,375 | (1,107 | ) | (9,899 | ) | 7,677 | (2,641 | ) | ||||||||||||
| Realized losses from derivative assets and liabilities |
(372,030 | ) | (149,355 | ) | (128,634 | ) | 95,063 | (32,239 | ) | |||||||||||
| Less: Realized gains (losses) from derivative assets and liabilities—IRLC and LHFS |
(456,970 | ) | (175,279 | ) | (160,151 | ) | 116,592 | (42,812 | ) | |||||||||||
|
|
|
|
|
|
|
|
|
|
|
|||||||||||
| Realized gains (losses) from derivative assets and liabilities—servicing rights |
84,940 | 25,924 | 31,517 | (21,529 | ) | 10,573 | ||||||||||||||
|
|
|
|
|
|
|
|
|
|
|
|||||||||||
| Realized and unrealized gains (losses) from derivative assets and liabilities—servicing rights |
$ | 106,315 | $ | 24,817 | $ | 21,618 | $ | (13,852 | ) | $ | 7,932 | |||||||||
|
|
|
|
|
|
|
|
|
|
|
|||||||||||
| (3) | Represents the change in the fair value of servicing rights attributable to changes in assumptions, net of hedging gains and losses. |
| Reconciliation of Net Income to Adjusted
EBITDA |
Nine Months Ended September 30, |
Year Ended December 31, | ||||||||||||||||||
| 2020 | 2019 | 2019 | 2018 | 2017 | ||||||||||||||||
| Net income (loss) |
$ | 1,465,939 | $ | 18,207 | $ | 34,420 | $ | (102,869 | ) | $ | 28,370 | |||||||||
| Interest expense—non-funding debt(1) |
32,117 | 30,392 | 41,294 | 41,624 | 29,158 | |||||||||||||||
| Income tax expense (benefit) |
1,457 | 288 | (1,749 | ) | (475 | ) | 1,436 | |||||||||||||
| Depreciation and amortization |
27,122 | 27,285 | 37,400 | 36,279 | 31,861 | |||||||||||||||
| Change in fair value of servicing rights, net of hedging gains and losses(2) |
(13,579 | ) | 17,142 | 9,047 | (6,692 | ) | 14,249 | |||||||||||||
| Change in fair value—contingent consideration |
32,650 | 189 | 2,374 | (4,881 | ) | (15,731 | ) | |||||||||||||
| Stock compensation expense and management fees |
8,466 | 1,004 | 1,219 | 3,181 | 3,812 | |||||||||||||||
|
|
|
|
|
|
|
|
|
|
|
|||||||||||
| Adjusted EBITDA |
$ | 1,554,172 | $ | 94,507 | $ | 124,005 | $ | (33,833 | ) | $ | 93,155 | |||||||||
|
|
|
|
|
|
|
|
|
|
|
|||||||||||
| (1) | Represents other interest expense, which include amortization of debt issuance costs, in the Company’s consolidated statement of operations. |
| (2) | Represents the change in the fair value of servicing rights attributable to changes in assumptions, net of hedging gains and losses. |
94
Table of Contents
| Reconciliation of Net Income to Adjusted Net
Income |
Nine Months Ended September 30, |
Year Ended December 31, | ||||||||||||||||||
| 2020 | 2019 | 2019 | 2018 | 2017 | ||||||||||||||||
| Net income (loss) |
$ | 1,465,939 | $ | 18,207 | $ | 34,420 | $ | (102,869 | ) | $ | 28,370 | |||||||||
| Income tax expense (benefit) |
1,457 | 288 | (1,749 | ) | (475 | ) | 1,436 | |||||||||||||
|
|
|
|
|
|
|
|
|
|
|
|||||||||||
| Income (loss) before taxes (benefit) |
1,467,396 | 18,495 | 32,671 | (103,344 | ) | 29,806 | ||||||||||||||
| Adjustments to income taxes (benefit)(1) |
377,708 | 4,761 | 8,410 | (25,867 | ) | 11,046 | ||||||||||||||
|
|
|
|
|
|
|
|
|
|
|
|||||||||||
| Tax-effected net income (loss)(1) |
1,089,688 | 13,734 | 24,261 | (77,477 | ) | 18,760 | ||||||||||||||
| Change in fair value of servicing rights, net of hedging gains and losses(2) |
(13,579 | ) | 17,142 | 9,047 | (6,692 | ) | 14,249 | |||||||||||||
| Stock compensation expense and management fees |
8,466 | 1,004 | 1,219 | 3,181 | 3,812 | |||||||||||||||
| Tax effect of adjustments(3) |
1,316 | (4,671 | ) | (2,642 | ) | 879 | (6,693 | ) | ||||||||||||
|
|
|
|
|
|
|
|
|
|
|
|||||||||||
| Adjusted net income (loss) |
$ | 1,085,891 | $ | 27,209 | $ | 31,885 | $ | (80,109 | ) | $ | 30,128 | |||||||||
|
|
|
|
|
|
|
|
|
|
|
|||||||||||
| (1) | loanDepot, Inc. is subject to federal, state and local income taxes. Adjustments to income tax (benefit) reflects the effective income tax rates below: |
| (2) | Amounts represent the change in the fair value of servicing rights attributable to changes in assumptions, net of hedging gains and losses. |
| (3) | Amounts represent the income tax effect of (a) change in fair value of servicing rights, net of hedging gains and losses and (b) stock compensation expense and management fees at the aforementioned effective income tax rates. |
| Nine Months Ended September 30, |
Year Ended December 31, | |||||||||||||||||||
| 2020 | 2019 | 2019 | 2018 | 2017 | ||||||||||||||||
| Statutory U.S. federal income tax rate |
21.00 | % | 21.00 | % | 21.00 | % | 21.00 | % | 35.00 | % | ||||||||||
| State and local income taxes (net of federal benefit) |
4.74 | 4.74 | 4.74 | 4.03 | 2.06 | |||||||||||||||
|
|
|
|
|
|
|
|
|
|
|
|||||||||||
| Effective income tax rate |
25.74 | % | 25.74 | % | 25.74 | % | 25.03 | % | 37.06 | % | ||||||||||
|
|
|
|
|
|
|
|
|
|
|
|||||||||||
95
Table of Contents
UNAUDITED PRO FORMA CONSOLIDATED FINANCIAL INFORMATION
The unaudited pro forma consolidated balance sheet as of September 30, 2020 and the unaudited pro forma consolidated statements of operations for the nine months ended September 30, 2020 and the year ended December 31, 2019 present our financial position and results of operations after giving pro forma effect to:
| • | The Reorganization Transactions and Offering Transactions as if such transactions occurred on September 30, 2020 for the unaudited pro forma consolidated balance sheet and on January 1, 2019 for the unaudited pro forma consolidated statements of operations; |
| • | The effects of the tax receivable agreement, as described under “Certain Relationships and Related Party Transactions—Tax Receivable Agreement;” |
| • | A provision for corporate income taxes on the income attributable to the Issuer at a tax rate of 25.74% inclusive of all U.S. federal, state and local income taxes; |
| • | Certain dividends declared and paid by the Company’s subsidiaries subsequent to the balance sheet date. |
The unaudited pro forma consolidated financial statements have been prepared on the basis that we will be taxed as a corporation for U.S. federal and state income tax purposes and, accordingly, will become a taxpaying entity subject to U.S. federal, state and Canadian income taxes. The presentation of the unaudited pro forma consolidated financial information is prepared in conformity with Article 11 of Regulation S-X and is based on currently available information and certain estimates and assumptions. The Company has early-adopted the final amendments to Article 11. The unaudited pro forma consolidated financial information has been adjusted to give effect to events that are (i) directly attributable to the transactions, (ii) factually supportable and (iii) with respect to the statements of operations, expected to have a continuing impact on the results of operations. See the accompanying notes to the Unaudited Pro Forma Consolidated Financial Information for a discussion of assumptions made.
The unaudited pro forma consolidated financial statements are not necessarily indicative of financial results that would have been attained had the described transactions occurred on the dates indicated above or that could be achieved in the future. The unaudited pro forma consolidated financial information also does not give effect to the potential impact of any anticipated synergies, operating efficiencies or cost savings that may result from the transactions or any integration costs that do not have a continuing impact. Future results may vary significantly from the results reflected in the unaudited pro forma consolidated statements of operations and should not be relied on as an indication of our results after the consummation of this offering and the other transactions contemplated by such unaudited pro forma consolidated financial statements. However, management believes that the assumptions provide a reasonable basis for presenting the significant effects of the transactions as contemplated and that the pro forma adjustments give appropriate effect to those assumptions and are properly applied in the unaudited pro forma consolidated financial statements.
As a public company, we will be implementing additional procedures and processes for the purpose of addressing the standards and requirements applicable to public companies. We expect to incur additional annual expenses related to these steps and, among other things, additional directors’ and officers’ liability insurance, director fees, fees to comply with the reporting requirements of the SEC, transfer agent fees, hiring of additional accounting, legal and administrative personnel, increased auditing and legal fees and similar expenses. We have not included any pro forma adjustments relating to these costs.
96
Table of Contents
UNAUDITED PRO FORMA CONSOLIDATED BALANCE SHEET
AS OF SEPTEMBER 30, 2020
| (Dollars in thousands) | LD Holdings Group LLC (as reported) |
October Transaction Adjustments |
Distribution Adjustments |
As Adjusted Before Offering |
Offering Adjustments |
loanDepot, Inc. Proforma |
||||||||||||||||||||||||||||||
| ASSETS |
||||||||||||||||||||||||||||||||||||
| Cash and cash equivalents |
$ | 637,511 | $ | 5,000 | (1 | ) | $ | (642,511 | ) | (2 | ) | $ | — | $ | — | (7 | ) | $ | — | |||||||||||||||||
| Restricted cash |
70,387 | — | — | 70,387 | — | 70,387 | ||||||||||||||||||||||||||||||
| Accounts receivable, net |
118,400 | — | — | 118,400 | — | 118,400 | ||||||||||||||||||||||||||||||
| Loans held for sale, at fair value |
4,888,364 | — | — | 4,888,364 | — | 4,888,364 | ||||||||||||||||||||||||||||||
| Derivative assets, at fair value |
722,149 | — | — | 722,149 | — | 722,149 | ||||||||||||||||||||||||||||||
| Servicing rights, at fair value |
780,451 | — | — | 780,451 | — | 780,451 | ||||||||||||||||||||||||||||||
| Property and equipment, net |
76,250 | — | — | 76,250 | — | 76,250 | ||||||||||||||||||||||||||||||
| Operating lease right-of-use assets |
56,449 | — | — | 56,449 | — | 56,449 | ||||||||||||||||||||||||||||||
| Prepaid expenses and other assets |
57,610 | — | — | 57,610 | — | 57,610 | ||||||||||||||||||||||||||||||
| Loans eligible for repurchase |
1,184,015 | — | — | 1,184,015 | — | 1,184,015 | ||||||||||||||||||||||||||||||
| Investments in joint ventures |
16,773 | — | — | 16,773 | — | 16,773 | ||||||||||||||||||||||||||||||
| Goodwill and intangible assets, net |
42,954 | — | — | 42,954 | — | 42,954 | ||||||||||||||||||||||||||||||
|
|
|
|
|
|
|
|
|
|
|
|
|
|||||||||||||||||||||||||
| Total assets |
$ | 8,651,313 | $ | 5,000 | $ | (642,511 | ) | $ | 8,013,802 | $ | — | $ | 8,013,802 | |||||||||||||||||||||||
|
|
|
|
|
|
|
|
|
|
|
|
|
|||||||||||||||||||||||||
| LIABILITIES, REDEEMABLE UNITS AND UNITHOLDERS’ EQUITY |
||||||||||||||||||||||||||||||||||||
| Warehouse and other lines of credit(3) |
$ | 4,601,062 | $ | — | $ | — | $ | 4,601,062 | $ | — | $ | 4,601,062 | ||||||||||||||||||||||||
| Accrued expenses and other liabilities |
375,957 | — | 33,496 | (2 | ) | 409,453 | 134,741 | (5 | ) | 544,194 | ||||||||||||||||||||||||||
| Derivative liabilities, at fair value |
59,432 | — | — | 59,432 | — | 59,432 | ||||||||||||||||||||||||||||||
| Liability for loans eligible for repurchase |
1,184,015 | — | — | 1,184,015 | — | 1,184,015 | ||||||||||||||||||||||||||||||
| Operating lease liability |
72,590 | — | — | 72,590 | — | 72,590 | ||||||||||||||||||||||||||||||
| Financing lease obligations |
18,258 | — | — | 18,258 | — | 18,258 | ||||||||||||||||||||||||||||||
| Debt obligations, net(4) |
706,478 | 5,000 | (1 | ) | — | 711,478 | — | 711,478 | ||||||||||||||||||||||||||||
|
|
|
|
|
|
|
|
|
|
|
|
|
|||||||||||||||||||||||||
| Total liabilities |
7,017,792 | 5,000 | 33,496 | 7,056,288 | 134,741 | 7,191,029 | ||||||||||||||||||||||||||||||
| Redeemable units |
104,200 | — | (32,300 | ) | (2 | ) | 71,900 | (71,900 | ) | (6 | ) | — | ||||||||||||||||||||||||
| Unitholders’ equity |
1,529,321 | — | (643,707 | ) | (2 | ) | 885,614 | (885,614 | ) | (6 | ) | — | ||||||||||||||||||||||||
| Class A common stock, par value $0.001 per share |
— | — | — | — | 17 | (7 | ) | 17 | ||||||||||||||||||||||||||||
| Class B common stock, par value $0.001 per share |
— | — | — | — | — | — | ||||||||||||||||||||||||||||||
| Class C common stock, par value $0.001 per share |
— | — | — | — | 193 | (7 | ) | 193 | ||||||||||||||||||||||||||||
| Class D common stock, par value $0.001 per share |
— | — | — | — | 115 | (7 | ) | 115 | ||||||||||||||||||||||||||||
| Preferred stock, par value $0.001 per share |
— | — | — | — | — | — | ||||||||||||||||||||||||||||||
| Retained earnings |
— | — | — | — | (61,455 | ) | (8 | ) | (61,455 | ) | ||||||||||||||||||||||||||
| Additional paid-in-capital |
— | — | — | — | 416,309 | (10 | ) | 416,309 | ||||||||||||||||||||||||||||
| Noncontrolling interest |
— | — | — | — | 467,594 | (9 | ) | 467,594 | ||||||||||||||||||||||||||||
|
|
|
|
|
|
|
|
|
|
|
|
|
|||||||||||||||||||||||||
| Total equity |
1,633,521 | — | (676,007 | ) | 957,514 | (134,741 | ) | 822,773 | ||||||||||||||||||||||||||||
|
|
|
|
|
|
|
|
|
|
|
|
|
|||||||||||||||||||||||||
| Total liabilities and equity |
$ | 8,651,313 | $ | 5,000 | $ | (642,511 | ) | $ | 8,013,802 | $ | — | $ | 8,013,802 | |||||||||||||||||||||||
|
|
|
|
|
|
|
|
|
|
|
|
|
|||||||||||||||||||||||||
97
Table of Contents
NOTES TO UNAUDITED PRO FORMA CONSOLIDATED BALANCE SHEET
| (1) | Includes $5.0 million in net proceeds from our $500.0 million Senior Note issuance, net of the $170.0 million paydown of Secured Credit Facilities and repayment of the $250.0 million Unsecured Term Loan and $75.0 million Convertible Debt. Amounts do not reflect deferred financing costs. |
| loan Depot, Inc. Pro Forma |
||||
| Pro forma debt obligations, net |
||||
| Issuance of Senior Notes |
$ | 500,000 | ||
| Paydown of Secured Credit Facilities |
(170,000 | ) | ||
| Repayment of Unsecured Term Loan |
(250,000 | ) | ||
| Repayment of Convertible Debt |
(75,000 | ) | ||
|
|
|
|||
| Debt obligations, net pro forma adjustment |
$ | 5,000 | ||
| (2) | Reflects cash distributions made by the Company from cash on hand and cash generated from operations during the fourth quarter of 2020 and first quarter of 2021 to certain of its unitholders that included profit distributions of $573.2 million as allowed under the Company’s operating agreement and tax distributions of $102.8 million as required under the Company’s operating agreement. Cash generated from the fourth quarter 2020 and first quarter 2021 are not reflected in the pro forma cash balance, thus the $33.5 million excess of distributions over the pro forma cash balance has been reclassified to accrued expenses and other liabilities. |
| (3) | Does not reflect the repurchase of the mortgage loans securing our 2018 Securitization Facility. Such facility was replaced by our 2020-1 Securitization Facility, resulting in no net changes to our indebtedness. |
| (4) | Balance includes the Original Secured Credit Facility and the Second Secured Credit Facility. As a result of the October Transactions, we repaid $170.0 million under our Secured Credit Facilities. Does not reflect approximately $4.3 million originally drawn under our Advance Receivables Trust, under which incremental borrowings are drawn and repaid from time to time. |
| (5) | loanDepot, Inc. is subject to U.S. federal, state, and local income taxes and will file consolidated income tax returns accordingly. We will record a deferred tax liability adjustment of $81.7 million that will include temporary differences in the book basis as compared to the tax basis of loanDepot, Inc.’s investment in LD Holdings, net of tax benefits from future deductions for payments made under the tax receivable agreement as a result of the offering transaction. In connection with this offering, loanDepot, Inc. will enter into a tax receivable agreement with the Parthenon Stockholders and certain Continuing LLC Members, whereby loanDepot, Inc. will agree to pay such parties or their permitted assignees, 85% of the amount of cash tax savings, if any, in U.S. federal, state, and local taxes that loanDepot, Inc. realizes, or is deemed to realize as a result of future tax benefits from increases in tax basis, see “Certain Relationships and Related Party Transactions—Tax Receivable Agreement.” The tax receivable agreement liability will be accounted for as a contingent liability with amounts accrued when deemed probable and estimable. We will record a liability of $44.4 million based on the Company’s estimate of the aggregate amount that it will pay under the tax receivable agreement as a result of the offering transaction. Additionally, we will record a corresponding decrease to additional paid-in-capital of $126.1 million, for the increase in liabilities related to deferred taxes and the tax receivable agreement as a result of the offering transaction. We have not recorded any additional adjustments to reflect future exchanges by the Parthenon Stockholders and certain Continuing LLC Members. |
98
Table of Contents
| loan Depot, Inc. Pro Forma |
||||
| Pro forma accrued expenses and other liabilities |
||||
| Recognition of deferred tax liability |
$ | 81,694 | ||
| Recognition of Tax Receivable Agreement liability |
44,382 | |||
| Recognition of costs associated with the offering including legal, accounting and other expenses |
8,664 | |||
|
|
|
|||
| Accrued expenses and other liabilities pro forma adjustment |
$ | 134,740 | ||
| (6) | Includes reductions of $71.9 million of redeemable units and $885.6 million of unitholders’ equity to reflect the reorganization and offering transaction which collapsed the prior capital structure. |
| (7) | We estimate that the net proceeds to us from the offering will be approximately $168.2 million based upon an assumed initial public offering price of $20.00 per share, which is the midpoint of the estimated price range set forth on the cover page of this prospectus, after deducting underwriting discounts and commissions and estimated offering expenses. We will not receive any proceeds from the sale of shares of our Class A Common Stock by the selling stockholders, therefore we have not reflected any change in cash and cash equivalents. |
We intend to use the net proceeds to us from this offering to purchase 9,410,000 Holdco Units, together with an equal number of 9,410,000 shares of our Class B or Class C Common Stock, from the Exchanging Members, including our Chief Executive Officer and certain of our other officers (at a purchase price per unit and share of Class B or Class C Common Stock, based on the midpoint of the estimated price range set forth on the cover page of this prospectus, net of underwriting discounts and commissions).
Reflects $0.3 million in par value of our Class A, Class C and Class D Common Stock issued in connection with the offering transaction.
| (8) | Reflects an $8.7 million decrease to retained earnings for certain costs associated with the offering, including legal, accounting and other related costs. Additionally, retained earnings is reduced by $52.8 million for pro forma stock compensation expense associated with restricted stock units granted under the loanDepot, Inc. 2021 Omnibus Incentive Plan as part of the offering. The $52.8 million of pro forma stock compensation expense includes $49.1 million for the year ended December 31, 2019 and $3.7 million for the nine months ended September 30, 2020. |
| (9) | Following the reorganization and offering, loanDepot, Inc. will be a holding company and its sole material asset will be an interest in LD Holdings related to Class A and Class D Common Stock representing approximately 43.2% interest in LD Holdings In our capacity as the sole managing member of LD Holdings, we will indirectly operate and control all of LD Holdings’ business and affairs. As a result, we will consolidate the financial results of LD Holdings and will report noncontrolling interests related to the interests held by the continuing members of LD Holdings, which will represent a majority of the economic interest in LD Holdings, on our consolidated balance sheet. Following this offering, loanDepot, Inc. will own 43.2% of the economic interests of LD Holdings, and the continuing members of LD Holdings, represented by the Class C Common Stock, will own the remaining 56.8%. |
99
Table of Contents
The computation of the pro forma noncontrolling interests is as follows:
| loan Depot, Inc. Pro Forma |
||||
| Beginning redeemable units and unitholders’ equity |
$ | 957,514 | ||
| Net adjustment for recognition of deferred tax liability and tax receivable agreement liability |
(126,077 | ) | ||
| Offering expenses |
(8,664 | ) | ||
|
|
|
|||
| Total equity |
822,773 | |||
|
|
|
|||
| Continuing LLC Member interest in LD Holdings |
56.8 | % | ||
|
|
|
|||
| Noncontrolling interests |
$ | 467,594 | ||
| (10) | The following table summarizes the computation of pro forma additional paid-in-capital. |
| loan Depot, Inc. Pro Forma |
||||
| Pro forma additional paid-in-capital |
||||
| Net adjustment from recognition of deferred tax liability and tax receivable agreement liability (see note 3) |
$ | (126,077 | ) | |
| Class A, Class C and Class D Common Stock issued in connection with the offering transaction |
(325 | ) | ||
| Stock compensation expense (see note 6) |
52,791 | |||
| Adjustment for noncontrolling interest |
489,920 | |||
|
|
|
|||
| Net additional paid-in-capital pro forma adjustment |
$ | 416,309 | ||
|
|
|
|||
100
Table of Contents
UNAUDITED PRO FORMA CONSOLIDATED STATEMENT OF OPERATIONS
FOR THE NINE MONTHS ENDED SEPTEMBER 30, 2020
| (Dollars in thousands, except per share data) | LD Holdings Group LLC (as reported) |
Offering Adjustments |
loanDepot, Inc. Proforma |
|||||||||||||
| REVENUES: |
||||||||||||||||
| Interest income |
$ | 98,149 | $ | — | $ | 98,149 | ||||||||||
| Interest expense |
(88,881 | ) | — | (88,881 | ) | |||||||||||
|
|
|
|
|
|
|
|||||||||||
| Net interest income |
9,268 | — | 9,268 | |||||||||||||
| Gain on origination and sale of loans, net |
2,873,455 | — | 2,873,455 | |||||||||||||
| Origination income, net |
167,554 | — | 167,554 | |||||||||||||
| Servicing income |
121,520 | — | 121,520 | |||||||||||||
| Change in fair value of servicing rights, net |
(216,132 | ) | — | (216,132 | ) | |||||||||||
| Other income |
58,115 | — | 58,115 | |||||||||||||
|
|
|
|
|
|
|
|||||||||||
| Total net revenues |
3,013,780 | — | 3,013,780 | |||||||||||||
| EXPENSES: |
||||||||||||||||
| Personnel expense |
1,022,734 | 3,681 | (1) | 1,026,415 | ||||||||||||
| Marketing and advertising expense |
173,628 | — | 173,628 | |||||||||||||
| Direct origination expense |
88,627 | — | 88,627 | |||||||||||||
| General and administrative expense |
120,565 | — | 120,565 | |||||||||||||
| Occupancy expense |
29,437 | — | 29,437 | |||||||||||||
| Depreciation and amortization |
27,122 | — | 27,122 | |||||||||||||
| Subservicing expense |
52,154 | — | 52,154 | |||||||||||||
| Other interest expense |
32,117 | — | 32,117 | |||||||||||||
|
|
|
|
|
|
|
|||||||||||
| Total expenses |
1,546,384 | 3,681 | 1,550,065 | |||||||||||||
| Income before income taxes |
1,467,396 | (3,681 | ) | 1,463,715 | ||||||||||||
| Provision for income taxes |
1,457 | 164,913 | (3) | 166,370 | ||||||||||||
|
|
|
|
|
|
|
|||||||||||
| Net income |
1,465,939 | (168,594 | ) | 1,297,345 | ||||||||||||
| Net income attributable to noncontrolling interests |
— | 831,852 | (4) | 831,852 | ||||||||||||
|
|
|
|
|
|
|
|||||||||||
| Net income attributable to loanDepot, Inc. |
$ | 1,465,939 | $ | (1,000,445 | ) | $ | 465,494 | |||||||||
|
|
|
|
|
|
|
|||||||||||
| Proforma earnings per share (3) |
||||||||||||||||
| Basic |
$ | 3.53 | ||||||||||||||
| Diluted |
3.32 | |||||||||||||||
| Proforma weighted average common shares (3) |
||||||||||||||||
| Basic |
131,908,674 | |||||||||||||||
| Diluted |
325,000,000 | |||||||||||||||
101
Table of Contents
UNAUDITED PRO FORMA CONSOLIDATED STATEMENT OF OPERATIONS
FOR THE YEAR ENDED DECEMBER 31, 2019
| (Dollars in thousands, except per share data) | LD Holdings Group LLC (as reported) |
Offering Adjustments |
loanDepot, Inc. Proforma |
|||||||||||||
| REVENUES: |
||||||||||||||||
| Interest income |
$ | 127,569 | $ | — | $ | 127,569 | ||||||||||
| Interest expense |
(130,344 | ) | — | (130,344 | ) | |||||||||||
|
|
|
|
|
|
|
|||||||||||
| Net interest expense |
(2,775 | ) | — | (2,775 | ) | |||||||||||
| Gain on origination and sale of loans, net |
1,125,853 | — | 1,125,853 | |||||||||||||
| Origination income, net |
149,500 | — | 149,500 | |||||||||||||
| Servicing income |
118,418 | — | 118,418 | |||||||||||||
| Change in fair value of servicing rights, net |
(119,546 | ) | — | (119,546 | ) | |||||||||||
| Other income |
65,681 | — | 65,681 | |||||||||||||
|
|
|
|
|
|
|
|||||||||||
| Total net revenues |
1,337,131 | — | 1,337,131 | |||||||||||||
| EXPENSES: |
||||||||||||||||
| Personnel expense |
765,256 | 49,110 | (1 | ) | 814,366 | |||||||||||
| Marketing and advertising expense |
187,880 | — | 187,880 | |||||||||||||
| Direct origination expense |
93,531 | — | 93,531 | |||||||||||||
| General and administrative expense |
100,493 | 8,664 | (2 | ) | 109,157 | |||||||||||
| Occupancy expense |
37,209 | — | 37,209 | |||||||||||||
| Depreciation and amortization |
37,400 | 37,400 | ||||||||||||||
| Subservicing expense |
41,397 | — | 41,397 | |||||||||||||
| Other interest expense |
41,294 | — | 41,294 | |||||||||||||
|
|
|
|
|
|
|
|||||||||||
| Total expenses |
1,304,460 | 57,774 | 1,362,234 | |||||||||||||
| Income (loss) before income taxes |
32,671 | (57,774 | ) | (25,103 | ) | |||||||||||
| Provision (benefit) for income taxes |
(1,749 | ) | 2,752 | (3 | ) | 1,003 | ||||||||||
|
|
|
|
|
|
|
|||||||||||
| Net income (loss) |
34,420 | (60,527 | ) | (26,107 | ) | |||||||||||
| Net income (loss) attributable to noncontrolling interests |
— | (14,267 | ) | (4 | ) | (14,267 | ) | |||||||||
|
|
|
|
|
|
|
|||||||||||
| Net income (loss) attributable to loanDepot, Inc. |
$ | 34,420 | $ | (46,260 | ) | $ | (11,840 | ) | ||||||||
|
|
|
|
|
|
|
|||||||||||
| Proforma loss per share (3) |
||||||||||||||||
| Basic |
$ | (0.09 | ) | |||||||||||||
| Diluted |
(0.09 | ) | ||||||||||||||
| Proforma weighted average common shares (3) |
||||||||||||||||
| Basic |
131,908,674 | |||||||||||||||
| Diluted |
131,908,674 | |||||||||||||||
102
Table of Contents
NOTES TO UNAUDITED PRO FORMA CONSOLIDATED STATEMENT OF OPERATIONS
| (1) | Reflects the issuance of 3,344,923 restricted stock units, consisting of 2,207,649 vested restricted stock units and 1,137,274 unvested restricted stock units of Class A common stock granted to employees in connection with the offering, under the loanDepot, Inc. 2021 Omnibus Incentive Plan. The pro forma expense is based on the assumed initial public offering price of $20.00 per share (the midpoint of the estimated price range on the cover page of this prospectus) and was $49.1 million for the year ended December 31, 2019, consisting of $44.2 million in compensation expense for the vested restricted stock units on the grant date and $4.9 million in compensation expense recognized throughout the year as the restricted stock units vest. For the nine months ended September 30, 2020, an additional $3.7 million in compensation expense was recognized for vesting of the restricted stock units. |
| (2) | Reflects certain costs associated with the offering which will be recorded as a reduction to retained earnings at the time of the offering. Costs include legal, accounting and other related costs attributable with the offering. |
| (3) | LD Holdings has been and will continue to be treated as a partnership for U.S. federal and state income tax purposes. Following the offering, loanDepot, Inc. will be subject to U.S. federal, state, and local income taxes with respect to its allocable share of any taxable income generated by LD Holdings that will flow through to its interest holders, including us. As a result, the pro forma condensed consolidated statements of operations reflect adjustments to income tax expense (benefit) at a pro forma tax rate of 26.3% for the nine months ended September 30, 2020 and (9.3)% for the year ended December 31, 2019. The pro forma tax rates differ from the blended tax rate of 25.74% due to tax differences created as a result of this transaction. The computation of the pro forma provision for income taxes is below: |
| Nine months ended September 30, 2020 |
Year ended December 31, 2019 |
|||||||
| Income (loss) before income taxes |
$ | 1,463,715 | $ | (25,103 | ) | |||
| Ownership percentage of controlling interest |
43.2 | % | 43.2 | % | ||||
|
|
|
|
|
|||||
| Pro forma income (loss) before taxes attributable to the controlling interest |
631,863 | (10,837 | ) | |||||
| Pro forma tax rate |
26.3 | % | (9.3 | )% | ||||
| Pro forma income tax expense |
166,370 | 1,003 | ||||||
| Historical income tax expense (benefit) |
1,457 | (1,749 | ) | |||||
|
|
|
|
|
|||||
| Pro forma income tax expense adjustment |
$ | 164,913 | $ | 2,752 | ||||
| (4) | Following the reorganization transaction, loanDepot Inc. will become the sole managing member of LD Holdings, and will initially own 43.2% of the economic interest in LD Holdings but will have 100% of the voting power and control the management of LD Holdings. The ownership percentage held by the noncontrolling interest will be approximately 56.8%. Net income attributable to the noncontrolling interest will represent approximately 56.8% of net income. |
| (5) | Pro forma basic earnings per share is computed by dividing pro forma net income attributable to controlling interests by the weighted average shares of Class A and Class D common stock outstanding during the period. Pro forma diluted earnings per share is computed by dividing pro forma net income by the weighted average shares of Class A and Class D common stock outstanding to give effect to potentially dilutive Class A, B, C and D securities. The weighted average share calculation assumes Holdco Units were exchanged for Class A common stock at the beginning of the period. This adjustment is made for purpose of calculating pro forma diluted earnings income per share only and does not necessarily reflect the amount of exchanges that may occur subsequent to this offering. The weighted average number of shares underlying the basic earnings per share calculation reflects only the shares of Class A and Class D common stock outstanding after the offering as they are the only outstanding shares which participate in distributions or |
103
Table of Contents
| dividends by loanDepot, Inc. The Class C common stock is excluded in the basic earnings per share calculation as they do not participate in distributions or dividends by loanDepot, Inc. The following table sets forth a reconciliation of the numerators and denominators used to compute pro forma basic and diluted earnings per share. |
| Nine Months Ended September 30, 2020 |
Year Ended December 31, 2019 |
|||||||
| Income (loss) before income taxes |
$ | 1,463,715 | $ | (25,103 | ) | |||
| Pro forma tax expense |
385,396 | 2,325 | ||||||
|
|
|
|
|
|||||
| Pro forma net income (loss) |
1,078,319 | (27,428 | ) | |||||
| Less: earnings (loss) allocated to noncontrolling interests |
612,825 | (15,588 | ) | |||||
|
|
|
|
|
|||||
| Pro forma net income (loss) attributable to controlling interest |
465,494 | (11,840 | ) | |||||
| Weighted average common shares outstanding - basic |
131,908,674 | 131,908,674 | ||||||
| Incremental shares resulting from dilutive instruments |
193,091,326 | — | ||||||
|
|
|
|
|
|||||
| Weighted average common shares outstanding - diluted |
325,000,000 | 131,908,674 | ||||||
| Earnings (loss) per share - basic |
$ | 3.53 | $ | (0.09 | ) | |||
| Earnings (loss) per share - diluted |
3.32 | (0.09 | ) | |||||
104
Table of Contents
MANAGEMENT’S DISCUSSION AND ANALYSIS OF FINANCIAL CONDITION AND RESULTS OF OPERATIONS
The following discussion and analysis of our financial condition and results of operations should be read in conjunction with our consolidated financial statements and the accompanying notes included elsewhere in this prospectus. The results of operations described below are not necessarily indicative of the results to be expected for any future periods. This discussion includes forward-looking information that involves risks and assumptions which could cause actual results to differ materially from management’s expectations. See “Risk factors” and “Cautionary statement regarding forward-looking statements.”
Overview
loanDepot is a customer-centric and technology-enabled residential mortgage platform. We launched our business in 2010 to provide mortgage loan solutions to consumers who were dissatisfied with the services offered by banks and other traditional market participants. Since our inception, we have significantly expanded our origination platform both in terms of size and capabilities. Our primary sources of revenue are derived from the origination of conventional and government mortgage loans, servicing conventional and government mortgage loans and providing a growing suite of ancillary services.
We are the second largest retail-focused non-bank mortgage originator by closed loan volume for the twelve months ended September 30, 2020 in the United States and the fifth-largest retail originator overall (per Inside Mortgage Finance). We are focused almost exclusively on originating agency-conforming and government mortgage loans, including FHA and VA loans, directly to qualified borrowers and selling these loans into the secondary market.
Key Factors Influencing Our Results of Operations
Market and Economic Environment
According to the Federal Reserve, residential mortgages represent the largest segment of the broader United States consumer finance market. In 2019, annual one-to-four family residential mortgage origination volume reached $2.2 trillion, with an average volume of $1.8 trillion over the last five years. According to the Mortgage Bankers Association, there was approximately $11.0 trillion of residential mortgage debt outstanding in the United States as of September 30, 2020 and is forecasted to increase to $12.2 trillion by the end of 2022.
The consumer lending market and the associated loan origination volumes for mortgage loans are influenced by interest rates and economic conditions. While borrower demand for consumer credit has typically remained strong in most economic environments, general market conditions, including the interest rate environment, unemployment rates, home price appreciation and consumer confidence may affect borrower willingness to seek financing and investor desire and ability to invest in loans. For example, a significant interest rate increase or rise in unemployment could cause potential borrowers to defer seeking financing as they wait for interest rates to stabilize or the general economic environment to improve. Market demand in 2020 was driven by a prolonged period of historically low interest rates. This demand contributed to gain on sale margins reaching levels that the Company does not believe will be sustained in future years and could result in decreases in revenue. Additionally, if the economy weakens and actual or expected default rates increase, loan investors may postpone or reduce their investments in loan products.
The volume of mortgage loan originations associated with home purchases is generally less affected by interest rate fluctuations and more sensitive to broader economic factors as well as the overall strength of the economy and housing prices. Purchase mortgage loan origination volume can be subject to seasonal trends as home sales typically rise during the spring and summer seasons and decline in the fall and winter seasons. This is somewhat offset by purchase loan originations sourced from our joint ventures which experience their highest level of activity during November and December as home builders focus on completing and selling homes prior to year-end. Seasonality has less of an impact on mortgage loan refinancing volumes, which are primarily driven by fluctuations in mortgage loan interest rates.
105
Table of Contents
Impact of the COVID-19 Pandemic
While the financial markets have demonstrated significant volatility due to the economic impacts of COVID-19, interest rates have fallen to historic lows resulting in increased mortgage refinance originations and favorable margins. Our efficient and scalable platform has enabled us to respond quickly to the increased market demand. We have highlighted below the key steps we have undertaken since the onset of the pandemic to position our platform for continued success:
| • | Maintained higher liquidity levels from an increase in cash from retained earnings. |
| • | Increased our total loan funding capacity with our current lending partners. |
| • | Stepped up protocols related to verification of key metrics such as employment and income to ensure the highest quality underwriting standards are maintained. |
| • | Transitioned our workforce to working remotely as of March 19, 2020. |
As a servicer, we are required to advance principal and interest to the investor for up to four months on GSE backed mortgages and longer on other government agency backed mortgages on behalf of clients who have entered a forbearance plan. As of September 30, 2020, approximately 3.4%, or $2.6 billion UPB, of our servicing portfolio was in active forbearance. While these advance requirements may be significant at higher levels of forbearance, we believe we are very well-positioned in terms of our liquidity. We will continue evaluating the capital markets as well, which would further supplement our liquidity should the need arise.
Fluctuations in Interest Rates
Our mortgage loan refinancing volumes (and to a lesser degree, our purchase volumes), balance sheet and results of operations are influenced by changes in interest rates and how we effectively manage the related interest rate risk. As interest rates decline, mortgage loan refinance volumes tend to increase, while an increasing interest rate environment may cause a decrease in refinance volumes and purchase volumes. In addition, the majority of our assets are subject to interest rate risk, including LHFS, which consist of mortgage loans held on our consolidated balance sheet for a short period of time after origination until we are able to sell them, IRLCs, servicing rights and mandatory trades, forward sales contracts and put options that we enter into to manage interest rate risk created by IRLCs and uncommitted LHFS. We refer to such mandatory trades, forward sales contracts, interest rate swap futures and put options collectively as “Hedging Instruments.” As interest rates increase, our LHFS and IRLCs generally decrease in value while our Hedging Instruments utilized to hedge against interest rate risk typically increase in value. However, rising interest rates cause our expected mortgage loan servicing revenues to increase due to a decline in mortgage loan prepayments which extends the average life of our servicing portfolio and increases the value of our servicing rights. Conversely, as interest rates decline, our LHFS and IRLCs generally increase in value while our Hedging Instruments decrease in value. However, in a declining interest rate environment, borrowers tend to refinance their mortgage loans, which increases prepayment speed and causes our expected mortgage loan servicing revenues to decrease, which reduces the average life of our servicing portfolio and decreases the value of our servicing rights. The changes in fair value of our servicing rights are recorded as unrealized gains and losses in changes in fair value of servicing rights, net, in our consolidated statements of operations.
When interest rates rise, rate and term refinancings become less attractive to consumers after a historically long period of low interest rates. However, rising interest rates are also indicative of overall economic growth and inflation that should create more opportunities with respect to cash-out refinancings. In addition, inflation which may result from increases in asset prices and stronger economic growth (leading to higher consumer confidence) typically should generate more purchase-focused transactions requiring loans and greater opportunities for home equity loans, which we expect may offset, at least in part, any decline in rate and term refinancings in a rising interest rate environment.
106
Table of Contents
Innovative Technology
Our origination and servicing operations are powered by mello®, our proprietary and innovative technology stack. mello® is fully-connected across origination and servicing functions – including integrations with key service providers – and is built under our core principle of facilitating a seamless technology-enabled experience through self-serve or high-touch customer journeys. Through our investment in technology, we have significantly automated and streamlined numerous functions within the origination and servicing lifecycle for our users – consumers, employees and partners. A traditionally arduous, paper-intensive process, we have taken a holistic approach to developing a more intuitive and more intelligent mortgage experience. Our customized user interfaces have replaced paper applications and extraneous human interaction, allowing customers and mortgage professionals to quickly and efficiently identify, price, apply for, and execute a mortgage loan. In addition to these customized front-end modules, our intelligent logic-based workflow tools have streamlined various operational functions related to marketing, processing and underwriting loans, resulting in reduced cycle times and cost to produce a loan.
Customer Acquisition and Engagement Strategy
Our customer acquisition and engagement strategy utilizes a variety of mediums and channels to acquire customers, and provide full optionality for those customers to interact with us in a manner that suits their personal preferences. We have the ability to reach new customers efficiently and at scale across every relevant demographic, and provide a high-touch personalized experience across digital and person-to-person interactions throughout the customer lifecycle. Further, we have enhanced these strategies with investments in brand advertising over the course of our history.
We are constantly evaluating emerging technologies and marketing tactics to more efficiently allocate our marketing investments. Our marketing and analytics teams has developed and refined the day-to-day execution of our suite of customer acquisition strategies, which has been demonstrated by our significant origination growth, driving high production volume and revenue relative to annual marketing spend.
Ancillary Businesses
Settlement Services. LD Settlement Services, LLC (“LDSS”), a wholly-owned subsidiary of the Issuer, is our captive title and escrow business, which we acquired in 2016. Title insurance is one of the most significant pieces of a real estate transaction, with vast potential to be digitized and better integrated with our lending operation.
Real Estate Services. mello Home Services, LLC is our captive real estate referral business started in 2018. A large portion of our purchase-oriented customer leads have not yet selected a realtor, thus affording us the opportunity to provide a more integrated customer service between the two key home-buying functions, as well as capture ancillary revenue in a RESPA-compliant manner.
Insurance Services. melloInsurance Services, LLC is a captive insurance broker formed in 2019 to sell homeowners and other consumer insurance policies to LD customers. Our purchase mortgage customers typically do not have a homeowners insurance quote when they apply for a loan with us, presenting the opportunity to offer the product with high capture rates. We launched melloInsurance Services in the third quarter of 2020.
Industry Partners
Although we have experienced rapid organic growth, we continue to pursue selective strategic growth opportunities. In addition to direct borrower relationships, our sales force in our Partner Channel originates loans through their relationships with local home builders, real estate agents and other local contacts, which we refer to as our Partner Channel. Furthermore, we have established joint ventures with several industry partners, including
107
Table of Contents
with two of the ten largest national home builders and other affinity partners and independent mortgage brokers. A local, cost-effective sales presence allows us to generate incremental origination opportunities and develop a personal relationship with customers, which leads to expanded volumes and profitability.
Key Performance Metrics
We manage and assess the performance of our business by evaluating a variety of metrics. Selected key performance metrics are discussed below.
Loan Origination and Sales
Loan originations and sales by volume and units are a measure of how successful we are at growing sales of mortgage loan products and a metric used by management in an attempt to isolate how effectively we are performing. We believe that originations and sales are an indicator of our market penetration in mortgage loans and that this provides useful information because it allows investors to better assess the underlying growth rate of our core business.
Number of Customers Serviced
Number of customers serviced represents the number of mortgage loan units serviced in our servicing portfolio. We believe that our net customer additions are an indicator of the growth of mortgage loans serviced and our servicing income, but may be offset by sales, from time to time, of servicing rights.
Description of Components of Results of Operations
Revenues
Net Interest Income. Net interest income reflects interest earned on LHFS offset by interest expense on amounts borrowed under Warehouse Lines to finance such loans until sold. For more information regarding our Warehouse Lines, see “—Liquidity and Capital Resources—Warehouse Lines” below.
Gain on Origination and Sale of Loans, Net. Gain on origination and sale of loans, net, includes cash and non-cash elements and is comprised of the following components:
| • | gain or loss realized upon the sale of loans to investors; |
| • | the value of servicing rights associated with loans sold to investors on a servicing-retained or servicing-released basis in the current period; |
| • | discount points collected, rebates paid to borrowers and lender paid costs for the origination of loans (including broker fee compensation paid to independent wholesale brokers and brokerage fees paid to our joint ventures for referred loans); |
| • | changes in the fair value of IRLCs that we enter into with loan applicants to originate loans; |
| • | changes in the fair value of LHFS; |
| • | changes in the fair value of Hedging Instruments; |
| • | realized gains and losses on Hedging Instruments; and |
| • | provisions for estimated loan loss obligations that we record for sold loans. |
When we sell loans to investors, we record a gain or loss which is ultimately determined by the proceeds received from the sale of loans compared to their respective carrying values. The gain or loss that we realize on the sale of loans provided through our lending activities is primarily determined by the terms of originated loans,
108
Table of Contents
current market interest rates, the effect of any hedging and other risk management activities that we undertake, the sales price of the loan and the value of any servicing rights generated by the transaction. We carry our LHFS at fair value. Fair value is estimated based on quoted market prices, where available, prices for other traded loans with similar characteristics, and purchase commitments and bid information received from market participants. Changes in fair value are reported as a component of gain on origination and sale of loans, net, within our consolidated statements of operations.
While our contracts vary, we provide representations and warranties to purchasers and insurers of the mortgage loans sold that typically are in place for the life of the loan. In the event of a breach of these representations and warranties, we may be required to repurchase a mortgage loan or indemnify the purchaser or insurer for losses, and any subsequent loss on the mortgage loan may be borne by us. The representations and warranties require adherence to applicable origination and underwriting guidelines, including but not limited to the validity of the lien securing the loan, property eligibility, borrower credit, income and asset requirements and compliance with applicable federal, state and local law. Additionally, we may be obligated to return premiums received to the purchasers for loans sold that experience early payoffs or early payment defaults. We record a liability for our estimate of loan loss obligations that we may experience as a result of our breach of representations and warranties provided to the purchasers or insurers of the loans that we have sold.
We provide IRLCs in order to provide our customers with certainty of the rate for their loan. We recognize in revenue the estimated fair value of IRLCs upon their issuance. The estimated fair value of IRLCs is based on our estimated gain on origination and sale of a loan, net of estimated direct origination costs, funded under the commitment, including servicing rights value, adjusted for the probability that the loan will fund. The IRLC is subject to changes in fair value as the loan approaches funding, as market interest rates for similar loans change and as our assessment of the probability of the funding of loans at similar points in the origination process changes. We recognize IRLCs on the consolidated balance sheet under derivative assets and liabilities, at fair value, on the commitment date with changes in fair value reported as a component of gain on origination and sale of loans, net within our consolidated statements of operations.
The primary factor influencing the probability that the loan will fund within the terms of the IRLC is the change, if any, in interest rates subsequent to the commitment date. In general, the probability of funding increases if current interest rates rise and decreases if current interest rates fall. This is due primarily to the relative attractiveness of current interest rates compared to the applicant’s committed rate. The probability that a loan will fund within the terms of the IRLC is also influenced by the channel source of the application, aging of the application and the purpose of the loan (purchase or refinance).
We manage interest rate risk created by IRLCs and LHFS by entering into hedging instruments, which are accounted for as derivative financial instruments. We account for our derivative financial instruments as free-standing derivatives. We do not designate our derivative financial instruments under hedge accounting. We recognize all of our derivative financial instruments on the consolidated balance sheets at fair value with changes in the fair value reported as a component of gain on origination and sale of loans, net, within our consolidated statements of operations.
We typically originate mortgage loans and then sell them in the secondary market while retaining servicing rights, and thus generate net interest income and gain on origination and sale of loans, net, on such loans, in addition to origination income, servicing fee income and change in fair value of servicing rights, net.
Origination Income, Net. Origination income, net, reflects the fees that we earn, net of lender credits we pay, from originating loans. Origination income includes loan origination fees, processing fees, underwriting fees and other fees collected from the borrower at the time of funding. Lender credits typically include rebates or concessions to borrowers for certain loan origination costs.
Servicing Fee Income. Servicing fee income reflects contractual servicing fees and ancillary and other fees (including late charges) related to the servicing of mortgage loans.
109
Table of Contents
Change in Fair Value of Servicing Rights, Net. Change in fair value of servicing rights, net reflects both (i) changes in the fair value of servicing rights and (ii) gain or loss on sale of servicing rights. Changes in the fair value of servicing rights are influenced by borrower prepayment expectations and actual borrower prepayments (including through a mortgage loan refinancing) relating to the underlying loans that are, in turn, primarily influenced by interest rate levels and expectations.
Other Income. Other income reflects our pro rata share of the net earnings from joint ventures, fee income from title, escrow and settlement services for mortgage loan transactions performed by LDSS, a consolidated subsidiary which provides these services to our customers in conjunction with their real estate transactions.
Expenses
Personnel Expense. Personnel expense reflects employee compensation related to salaries, commissions, incentive compensation, benefits and other employee costs.
Marketing and Advertising Expense. Marketing and advertising expense primarily reflects online advertising costs, including fees paid to search engines, television, print and radio, distribution partners, master service agreements with brokers and desk rental agreements with realtors. We expense and do not capitalize any of our marketing spend.
Direct Origination Expense. Direct origination expense reflects the unreimbursed portion of direct out-of-pocket expenses that we incur in the loan origination process, including underwriting, appraisal, credit report, loan document and other expenses paid to non-affiliates.
General and Administrative Expense. General and administrative expense reflects professional fees, data processing expense, communications expense and other operating expenses.
Occupancy Expense. Occupancy expense reflects our lease costs, utilities, maintenance and security expenses related to the operation of our facilities.
Depreciation and Amortization. Depreciation and amortization reflects depreciation and amortization of property and equipment, amortization of software development, amortization of assets under financing leases and amortization of intangible assets.
Subservicing Expense. Subservicing expense reflects the amounts that we pay to our subservicers to service our mortgage loan servicing portfolio.
Other Interest Expense. Other interest expense comprises costs for debt obligations and financing lease obligations. For more information regarding the debt obligations, see “—Liquidity and Capital Resources” below.
110
Table of Contents
Results of Operations
The following table sets forth our consolidated financial statement data for the periods indicated:
| Nine Months Ended September 30, |
Year Ended December 31, | |||||||||||||||||||
| (Dollars in thousands) |
2020 | 2019 | 2019 | 2018 | 2017 | |||||||||||||||
| (Unaudited) | ||||||||||||||||||||
| REVENUES: |
||||||||||||||||||||
| Interest income |
$ | 98,149 | $ | 86,493 | $ | 127,569 | $ | 122,079 | $ | 90,842 | ||||||||||
| Interest expense |
(88,881 | ) | (89,550 | ) | (130,344 | ) | (104,784 | ) | (74,093 | ) | ||||||||||
|
|
|
|
|
|
|
|
|
|
|
|||||||||||
| Net interest income (expense) |
9,268 | (3,057 | ) | (2,775 | ) | 17,295 | 16,749 | |||||||||||||
| Gain on origination and sale of loans, net |
2,873,455 | 788,054 | 1,125,853 | 799,564 | 1,011,791 | |||||||||||||||
| Origination income, net |
167,554 | 107,850 | 149,500 | 153,036 | 159,184 | |||||||||||||||
| Servicing income |
121,520 | 85,022 | 118,418 | 141,195 | 115,486 | |||||||||||||||
| Change in fair value of servicing rights, net |
(216,132 | ) | (100,051 | ) | (119,546 | ) | (51,487 | ) | (88,701 | ) | ||||||||||
| Other income |
58,115 | 44,022 | 65,681 | 54,750 | 58,470 | |||||||||||||||
|
|
|
|
|
|
|
|
|
|
|
|||||||||||
| Total net revenues |
3,013,780 | 921,840 | 1,337,131 | 1,114,353 | 1,272,979 | |||||||||||||||
| EXPENSES: |
||||||||||||||||||||
| Personnel expense |
1,022,734 | 525,948 | 765,256 | 681,378 | 726,616 | |||||||||||||||
| Marketing and advertising expense |
173,628 | 133,799 | 187,880 | 190,777 | 216,012 | |||||||||||||||
| Direct origination expense |
88,627 | 61,786 | 93,531 | 83,033 | 76,232 | |||||||||||||||
| General and administrative expense |
120,565 | 67,708 | 100,493 | 95,864 | 95,236 | |||||||||||||||
| Occupancy expense |
29,437 | 27,691 | 37,209 | 38,309 | 31,655 | |||||||||||||||
| Depreciation and amortization |
27,122 | 27,285 | 37,400 | 36,279 | 31,861 | |||||||||||||||
| Subservicing expense |
52,154 | 28,736 | 41,397 | 50,433 | 36,403 | |||||||||||||||
| Other interest expense |
32,117 | 30,392 | 41,294 | 41,624 | 29,158 | |||||||||||||||
|
|
|
|
|
|
|
|
|
|
|
|||||||||||
| Total expenses |
1,546,384 | 903,345 | 1,304,460 | 1,217,697 | 1,243,173 | |||||||||||||||
| Income before income taxes |
1,467,396 | 18,495 | 32,671 | (103,344 | ) | 29,806 | ||||||||||||||
| Provision for income taxes |
1,457 | 288 | (1,749 | ) | (475 | ) | 1,436 | |||||||||||||
| Net income (loss) |
1,465,939 | 18,207 | 34,420 | (102,869 | ) | 28,370 | ||||||||||||||
| Net income attributable to noncontrolling interests |
— | — | — | 7,515 | 7,515 | |||||||||||||||
|
|
|
|
|
|
|
|
|
|
|
|||||||||||
| Net income (loss) attributable to |
$ | 1,465,939 | $ | 18,207 | $ | 34,420 | $ | (110,384 | ) | $ | 20,855 | |||||||||
|
|
|
|
|
|
|
|
|
|
|
|||||||||||
| Supplemental financial data (unaudited):(1)(2) |
||||||||||||||||||||
| IRLCs |
$ | 111,273,261 | $ | 54,914,896 | $ | 75,262,459 | $ | 50,375,336 | $ | 54,619,871 | ||||||||||
| IRLCs (units) |
335,644 | 196,852 | 268,692 | 214,537 | 231,445 | |||||||||||||||
| Originations |
$ | 63,364,799 | $ | 29,268,054 | $ | 45,324,026 | $ | 33,039,029 | $ | 35,193,887 | ||||||||||
| Originations (units) |
195,178 | 101,147 | 152,588 | 129,987 | 137,066 | |||||||||||||||
| Loans sold |
$ | 62,155,169 | $ | 28,145,006 | $ | 43,495,622 | $ | 32,752,524 | $ | 34,524,725 | ||||||||||
| Loans sold (units) |
192,197 | 99,203 | 148,426 | 129,757 | 135,954 | |||||||||||||||
| (1) | Excludes consumer loans. |
| (2) | Includes brokered loan originations not funded by the Company. |
111
Table of Contents
Nine Months Ended September 30, 2020 Compared to Nine Months Ended September 30, 2019
Net income was $1.5 billion for the nine months ended September 30, 2020, an increase of $1.4 billion, compared to $18.2 million for the nine months ended September 30, 2019. Total originations were $63.4 billion for the nine months ended September 30, 2020, as compared to $29.3 billion for the nine months ended September 30, 2019, representing an increase of $34.1 billion or 116.5%. Of the total originations for the nine months ended September 30, 2020, our Retail and Partner Channels originated $50.6 billion and $12.8 billion, respectively, as compared to $21.3 billion and $8.0 billion, respectively, for the nine months ended September 30, 2019. We generated additional revenue and net income growth related to increased IRLCs and mortgage loan originations across all business channels. Our operating results were positively influenced by an attractive mortgage loan origination market during the nine months ended September 30, 2020 during which interest rates declined significantly as a result of the COVID-19 global pandemic. The decrease in interest rates resulted in an increase in IRLCs and mortgage loan origination volumes.
Revenues
Net Interest Income (Expense). Net interest income was $9.3 million for the nine months ended September 30, 2020, as compared to net interest expense of $3.1 million for the nine months ended September 30, 2019, representing an increase of $12.3 million or 403.2%. The increase between periods was comprised of:
| • | an increase of $11.7 million or 13.5% in interest income resulting primarily from the $886.5 million increase in average balances of LHFS from $2.5 billion for the nine months ended September 30, 2019 to $3.4 billion for the nine months ended September 30, 2020, partially offset by a reduction in the yield on LHFS between periods. The increase in average loan balances was a result of the increases in originations between periods. The decrease in yield on LHFS was due to the significant decreases in mortgage interest rates during the first quarter of 2020 as a result of the COVID-19 global pandemic. Mortgage interest rates have remained relatively flat during both the second and third quarters of 2020. |
| • | a decrease in interest expense of $0.7 million or 0.7% resulting from a reduction in the cost of warehouse and other lines of credit balances between periods, partially offset by a $1.0 billion increase in average balance of warehouse and other lines of credit from $2.4 billion for the nine months ended September 30, 2019 to $3.4 billion for the nine months ended September 30, 2020. The decrease in cost on warehouse and other lines of credit was due to decreases in 30-day LIBOR during the first and second quarters of 2020. 30- day LIBOR remained relatively flat during the third quarter of 2020. The increase in average warehouse and other lines of credit balance was a result of increased utilization resulting from the increase in originations between periods. |
Gain on Origination and Sale of Loans, Net. Gain on origination and sale of loans, net, was $2.9 billion for the nine months ended September 30, 2020, as compared to $788.1 million for the nine months ended September 30, 2019, representing an increase of $2.1 billion or 264.6%. Gain on origination and sale of loans, net was comprised of the following components:
| Nine Months Ended September 30, |
||||||||
| (Dollars in thousands) |
2020 | 2019 | ||||||
| Premium from loan sales |
$ | 2,125,730 | $ | 664,327 | ||||
| Servicing rights |
574,768 | 205,745 | ||||||
| Unrealized gains from derivative assets and liabilities—IRLCs |
593,450 | 92,803 | ||||||
| Unrealized (losses) gains from Hedging Instruments |
(73,985 | ) | 30,499 | |||||
| Realized losses from Hedging Instruments |
(372,029 | ) | (149,354 | ) | ||||
| Discount points, rebates and lender paid costs |
(72,031 | ) | (52,543 | ) | ||||
| Mark to market gain on loans held for sale |
114,173 | 3,621 | ||||||
| Provision for loan loss obligation for loans sold |
(16,621 | ) | (7,044 | ) | ||||
|
|
|
|
|
|||||
| $ | 2,873,455 | $ | 788,054 | |||||
|
|
|
|
|
|||||
112
Table of Contents
Changes in the components of gain on origination and sale of loans, net, during the nine months ended September 30, 2020 and 2019 were comprised of the following:
| • | $2.1 billion in net premiums realized upon the sale of loans to investors for the nine months ended September 30, 2020, as compared to $664.3 million for the nine months ended September 30, 2019, representing an increase of $1.5 billion or 220.0%. The increase in net premiums realized upon the sale of loans to investors was a result of the increased origination and sale volume between periods as the lower mortgage interest rate environment has increased purchase and refinance origination demand. During the nine months ended September 30, 2020, loans sold increased $34.0 billion or 120.8% to $62.2 billion from $28.1 billion for the nine months ended September 30, 2019; |
| • | $574.8 million in retained servicing rights from loans sold to investors on a servicing-retained basis for the nine months ended September 30, 2020, as compared to $205.7 million for the nine months ended September 30, 2019, representing an increase of $369.0 million or 179.4%, which was driven by an increase in volume of loans sold on a servicing-retained basis to $53.2 billion during the nine months ended September 30, 2020, as compared to $12.4 billion for the nine months ended September 30, 2019, partially offset by decreases in weighted average servicing fees based on the increase in loan origination and sales volume and resulting increase in conventional loans sold with servicing retained during the period, as well as decreases in estimated servicing multiples between periods. The decreases in servicing multiples is attributable to higher estimated prepayment speeds resulting from the decreases in mortgage interest rates between periods. At September 30, 2020, the weighted average prepayment speed of our servicing portfolio was 15.6%, compared to 13.3% at December 31, 2019. At September 30, 2019, the weighted average prepayment speed of our servicing portfolio was 14.9%, compared to 10.9% at December 31, 2018; |
| • | $593.4 million of unrealized gains from IRLCs for the nine months ended September 30, 2020, as compared to $92.8 million for the nine months ended September 30, 2019, representing an increase of $500.6 million or 539.5%. The increase is primarily due to the $56.4 billion or 102.6% increase in volume of IRLCs to $111.3 billion during the nine months ended September 30, 2020 as compared to $54.9 billion during the nine months ended September 30, 2019; |
| • | $446.0 million of realized and unrealized losses from Hedging Instruments for the nine months ended September 30, 2020, as compared to $118.9 million for the nine months ended September 30, 2019. The increase in realized and unrealized losses was primarily due to the overall decline in interest rates and resulting increase in the aforementioned origination volumes and related hedging activity during the nine months ended September 30, 2020 as compared to the nine months ended September 30, 2019; |
| • | $72.0 million of rebates paid to borrowers and lender paid costs, net of discount points collected from borrowers for the origination of loans for the nine months ended September 30, 2020, as compared to $52.5 million for the nine months ended September 30, 2019, representing an increase of $19.5 million or 37.1%. The increase is related to the aforementioned increase in origination volumes between periods; |
| • | $114.2 million of fair value gains on LHFS for the nine months ended September 30, 2020, as compared to $3.6 million for the nine months ended September 30, 2019. The increase is primarily attributable to a higher average balance of LHFS during the nine months ended September 30, 2020 as compared to the nine months ended September 30, 2019, coupled with the impact of changes in the mortgage interest rate environment; and |
| • | $16.6 million of provision for loan loss obligations recorded for loans sold during the nine months ended September 30, 2020, as compared to $7.0 million for the nine months ended September 30, 2019, representing an increase of $9.6 million or 136.0%. The provision for loan loss obligations recorded reflects loan sale volumes which increased to $62.2 billion during the nine months ended September 30, 2020, as compared to $28.1 billion during the nine months ended September 30, 2019; |
Origination Income, Net. Origination income, net, was $167.6 million for the nine months ended September 30, 2020, as compared to $107.9 million for the nine months ended September 30, 2019, representing
113
Table of Contents
an increase of $59.7 million or 55.4%. The increase in origination income, net, between periods was primarily the result of an increase in loan originations and other loan fees attributable to the growth in loan origination volumes.
Servicing Fee Income. Servicing fee income was $121.5 million for the nine months ended September 30, 2020, as compared to $85.0 million for the nine months ended September 30, 2019, representing an increase of $36.5 million or 42.9%. The increase in servicing income between periods was the result of an increase of $23.8 billion in the average UPB of our servicing portfolio due to an increase in servicing-retained loan sales. Our average servicing portfolio increased to $52.7 billion for the nine months ended September 30, 2020, as compared to $28.8 billion for the nine months ended September 30, 2019.
Change in Fair Value of Servicing Rights, Net. Change in fair value of servicing rights, net was a loss of $216.1 million for the nine months ended September 30, 2020, as compared to a loss of $100.1 million for the nine months ended September 30, 2019, representing an increase of $116.1 million or 116.0%. The increase in change in fair value of servicing rights, net was the result of the increase in size of our servicing portfolio which partially contributed to:
| • | $93.0 million in unrealized fair value losses, net of hedging gains, on servicing rights for the nine months ended September 30, 2020, as compared to losses of $41.2 million, net of hedging gains for the nine months ended September 30, 2019, primarily due to growth in our servicing portfolio and the impact of changes in interest rates during both the nine months ended September 30, 2020 and 2019; |
| • | $120.5 million in realized losses resulting from increases in fallout and decay of the portfolio during the nine months ended September 30, 2020 as a result of increased prepayment speeds due to decreases in market interest rates, compared to $55.0 million during the nine months ended September 30, 2019. At September 30, 2020, the weighted average prepayment speed of our servicing portfolio was 15.6%, compared to 13.3% at December 31, 2019. At September 30, 2019, the weighted average prepayment speed of our servicing portfolio was 14.9%, compared to 10.9% at December 31, 2018; and |
| • | $2.5 million in realized losses on sales of servicing rights associated with the sale of $194.0 million in UPB during the nine months ended September 30, 2020, as compared to a $3.8 million loss associated with the sale of $9.3 billion in UPB during the nine months ended September 30, 2019. |
Other Income. Other income was $58.1 million for the nine months ended September 30, 2020, as compared to $44.0 million for the nine months ended September 30, 2019, representing an increase of $14.1 million or 32.0%. The increase between periods was primarily the result of an increase of $19.6 million in escrow and title fee income due to increased mortgage loan settlement services, partially offset by a $2.5 million decrease in income from our investments in joint ventures to $6.7 million for the nine months ended September 30, 2020, as compared to $9.2 million for the nine months ended September 30, 2019 and was primarily attributable to the sale and wind down of two of our joint ventures in 2019 coupled with reductions in net income from a joint venture related to changes in pricing structure, partially offset by increases in loan originations. Additionally, there was a decrease of $2.3 million in other income primarily attributable to sale of trading securities during the fourth quarter of 2019 and resulting decreases in income from trading securities to zero for the nine months ended September 30, 2020 from $1.3 million for the nine months ended September 30, 2019.
Expenses
Personnel Expense. Personnel expense was $1.0 billion for the nine months ended September 30, 2020, as compared to $525.9 million for the nine months ended September 30, 2019, representing an increase of $496.8 million or 94.5%. The increase between periods was primarily the result of an increase of $248.3 million in commissions due to the increase in loan origination volumes, coupled with increases in salaries and benefits expense due to the increase in headcount associated with the growth of our lending operation to support the increased loan origination volumes. As of September 30, 2020, we had 8,614 employees, as compared to 6,284 employees as of September 30, 2019, representing a 37.1% year-over-year increase.
114
Table of Contents
Marketing and Advertising Expense. Marketing and advertising expense was $173.6 million for the nine months ended September 30, 2020, as compared to $133.8 million for the nine months ended September 30, 2019, representing an increase of $39.8 million or 29.8%. The increase between periods was primarily the result of additional acquired leads and national television campaigns.
Direct Origination Expense. Direct origination expense was $88.6 million for the nine months ended September 30, 2020, as compared to $61.8 million for the nine months ended September 30, 2019, representing an increase of $26.8 million or 43.4%. The increase between periods was directly attributable to increased costs for underwriting, credit reports, appraisals, loan documents and other loan origination costs associated with increased loan origination volumes during the period.
General and Administrative Expense. General and administrative expense was $120.6 million for the nine months ended September 30, 2020, as compared to $67.7 million for the nine months ended September 30, 2019, representing an increase of $52.9 million or 78.1%. The increase between periods was primarily the result of a $32.7 million expense related to the contingent consideration associated with the Mortgage Master acquisition and a $8.6 million increase in professional services and consulting. Additionally, increases in other general and administrative expense between periods related to continued investments in our proprietary technology and infrastructure, including a $5.3 million increase in office and equipment expenses, as well as an increase in data and communication expense associated with increases in personnel and sales offices.
Occupancy Expense. Occupancy expense was $29.4 million for the nine months ended September 30, 2020, as compared to $27.7 million for the nine months ended September 30, 2019, representing an increase of $1.7 million or 6.3%. The increase between periods was primarily the result of additional expansion of our retail locations between periods.
Depreciation and Amortization. Depreciation and amortization was $27.1 million for the nine months ended September 30, 2020, as compared to $27.3 million for the nine months ended September 30, 2019, representing a decrease of $0.2 million or 0.6%. The decrease between periods was the result of a higher portion of property and equipment, including technology hardware upgrades and internally developed software, becoming fully amortized.
Subservicing Expense. Subservicing expense was $52.2 million for the nine months ended September 30, 2020, as compared to $28.7 million for the nine months ended September 30, 2019, representing an increase of $23.4 million or 81.5%. The increase between periods was the result of the $23.8 billion increase in our average servicing portfolio to $52.7 billion for the nine months ended September 30, 2020, as compared to $28.8 billion for the nine months ended September 30, 2019.
Other Interest Expense. Other interest expense was $32.1 million for the nine months ended September 30, 2020, as compared to $30.4 million for the nine months ended September 30, 2019, representing an increase of $1.7 million or 5.7%. The increase between periods was the result of a $73.6 million or 14.2% increase in average outstanding debt obligations resulting from (i) our Convertible Debt issued in August 2019, which increased from $25.0 million at September 30, 2019 to $75.0 million at September 30, 2020, (ii) a $121.5 million increase in borrowings under our Original Secured Credit Facility, and (iii) a $5.0 million decrease in borrowings under our Second Secured Credit Facility. The increase in average outstanding debt obligations were partially offset by decreases in 30-day LIBOR between periods.
Provision for Income Taxes. Provision for income taxes was $1.5 million for the nine months ended September 30, 2020, as compared to $0.3 million for the nine months ended September 30, 2019. The increase in provision for income taxes was related to increased profitability of our taxable settlement service entities.
Year Ended December 31, 2019 Compared to Year Ended December 31, 2018
Net income was $34.4 million for the year ended December 31, 2019, an increase of $137.3 million, compared to a net loss of $102.9 million for the year ended December 31, 2018. Total originations were
115
Table of Contents
$45.3 billion for the year ended December 31, 2019, as compared to $33.0 billion for the year ended December 31, 2018, representing an increase of $12.3 billion or 37.2%. Of the total originations by channel for the year ended December 31, 2019, our Retail and Partner Channels originated $32.7 billion and $12.6 billion, respectively, as compared to $24.1 billion and $8.9 billion, respectively, for the year ended December 31, 2018. We generated additional revenue and net income growth related to increased IRLCs and mortgage loan originations across all business channels. Our operating results were positively influenced by an attractive mortgage loan origination market during the year ended December 31, 2019 during which interest rates remained relatively flat during the first half of the year before declining throughout the second half of 2019, resulting in an increase in IRLCs and mortgage loan origination volumes between periods.
Revenues
Net Interest Income (Expense). Net interest expense was $2.8 million for the year ended December 31, 2019, as compared to net interest income of $17.3 million for the year ended December 31, 2018, representing a decrease of $20.1 million or 116.0%. The decrease between periods was comprised of:
| • | an increase of $5.5 million or 4.5% in interest income resulting from the $564.8 million increase in average balances of LHFS from $2.2 billion for the year ended December 31, 2018 to $2.8 billion for the year ended December 31, 2019, partially offset by a reduction in the yield on LHFS between periods. The increase in average loan balances was a result of the increases in originations between periods. The decrease in yield on LHFS was due to the decreases in market interest rates throughout 2019. |
| • | an increase in interest expense of $25.6 million or 24.4% resulting from the $562.5 million increase in average warehouse and other lines of credit balances from $2.3 billion for the year ended December 31, 2018 to $2.8 billion for the year ended December 31, 2019, partially offset by a reduction in the cost of warehouse and other lines of credit balances between periods. The increase in average warehouse and other lines of credit balance was a result of increased utilization from the increase in originations between periods. |
Gain on Origination and Sale of Loans, Net. Gain on origination and sale of loans, net, was $1.1 billion for the year ended December 31, 2019, as compared to $799.6 million for the year ended December 31, 2018, representing an increase of $326.3 million or 40.8%. The increase is primarily attributable to the increase in loan originations during the period. The components of gain on origination and sale of loans, net, are as follows:
| Year Ended December 31, |
||||||||
| 2019 | 2018 | |||||||
| Premium from loan sales |
$ | 905,257 | $ | 496,488 | ||||
| Servicing rights |
334,176 | 343,118 | ||||||
| Unrealized gains (losses) from derivative assets and liabilities—IRLCs |
67,742 | (31,326 | ) | |||||
| Unrealized gains (losses) from Hedging Instruments |
17,937 | (27,147 | ) | |||||
| Realized (losses) gains from Hedging Instruments |
(128,634 | ) | 95,063 | |||||
| Discount points, rebates and lender paid costs |
(75,948 | ) | (83,393 | ) | ||||
| Mark to market gain on loans held for sale |
13,996 | 3,481 | ||||||
| (Provision) benefit for loan loss obligation for loans sold |
(8,673 | ) | 3,280 | |||||
|
|
|
|
|
|||||
| $ | 1,125,853 | $ | 799,564 | |||||
|
|
|
|
|
|||||
Changes in the components of gain on origination and sale of loans, net, during the year ended December 31, 2019 and 2018 were comprised of the following:
| • | $905.3 million in net premiums realized upon the sale of loans to investors for the year ended December 31, 2019, as compared to $496.5 million for the year ended December 31, 2018, representing an increase of $408.8 million or 82.3%. This increase is a result of the increase in loans |
116
Table of Contents
| sold between periods. During the year ended December 31, 2019, loans sold increased $10.7 billion or 32.8% to $43.5 billion from $32.8 billion for the year ended December 31, 2018; |
| • | $334.2 million in retained servicing rights from loans sold to investors on a servicing-retained basis for the year ended December 31, 2019, as compared to $343.1 million for the year ended December 31, 2018, representing a decrease of $8.9 million or 2.6%, which was driven by a decrease in estimated servicing multiples from 3.9x as of December 31, 2018 to 3.6x as of December 31, 2019, coupled with a decrease in volume of loans sold on a servicing-retained basis to $23.9 billion for the year ended December 31, 2019, as compared to $26.8 billion for the year ended December 31, 2018. At December 31, 2019, the weighted average prepayment speed of our servicing portfolio was 13.3%, compared to 10.9% at December 31, 2018 and 11.0% at December 31, 2017; |
| • | $67.7 million of unrealized gains from IRLCs for the year ended December 31, 2019, as compared to unrealized losses of $31.3 million for the year ended December 31, 2018, representing an increase of $99.1 million or 316.2%. The increase is primarily due to the impact of changes in interest rates and resulting $24.9 billion or 49.4% increase in volume of IRLCs to $75.3 billion during year ended December 31, 2019 as compared to $50.4 billion during the year ended December 31, 2018; |
| • | $110.7 million of realized and unrealized losses from Hedging Instruments for the year ended December 31, 2019, as compared to $67.9 million of realized and unrealized gains for the year ended December 31, 2018. The decrease in realized and unrealized gains is primarily due to the overall decrease in market interest rates and the increase in volume during the year ended December 31, 2019 as compared to the year ended December 31, 2018; |
| • | $75.9 million of rebates paid to borrowers and lender paid costs, net of discount points collected from borrowers for the origination of loans for the year ended December 31, 2019, as compared to $83.4 million for the year ended December 31, 2018, representing a decrease of $7.4 million or 8.9%; |
| • | $14.0 million of fair value gains on LHFS for the year ended December 31, 2019, as compared to $3.5 million for the year ended December 31, 2018. The increase is primarily attributable to a decreasing interest rate environment near the end of 2019, as compared to the rising interest rate environment near the end 2018; and |
| • | $8.7 million of provision for loan loss obligations recorded for loans sold during the year ended December 31, 2019, as compared to a recovery of $3.3 million for the year ended December 31, 2018, representing a decrease of $12.0 million or 364.4%. The provision for loan loss obligations recorded reflects loan sale volumes which increased to $43.5 billion during the year ended December 31, 2019, as compared to $32.8 billion during the year ended December 31, 2018; |
Origination Income, Net. Origination income, net, was $149.5 million for the year ended December 31, 2019, as compared to $153.0 million for the year ended December 31, 2018, representing a decrease of $3.5 million or 2.3%. The decrease in origination income, net, between periods was primarily the result of decreases in loan origination fees resulting from (i) increased lender credits due to the competitive pricing market for loans in 2019 and (ii) decreases in fees from personal loans due to the discontinuation of consumer lending in 2018, partially offset by the increase in other loan fees attributable to the growth in loan origination volumes.
Servicing Income. Servicing income was $118.4 million for the year ended December 31, 2019, as compared to $141.2 million for the year ended December 31, 2018, representing a decrease of $22.8 million or 16.1%. The decrease in servicing income between periods was the result of a decrease of $10.9 billion in the average UPB of our servicing portfolio from a decrease in servicing-retained loan sales and bulk sales of servicing rights during 2019. Our average servicing portfolio decreased to $30.1 billion for the year ended December 31, 2019, as compared to $41.0 billion for the year ended December 31, 2018.
Change in Fair Value of Servicing Rights, Net. Change in fair value of servicing rights, net was a loss of $119.5 million for the year ended December 31, 2019, as compared to a loss of $51.5 million for the year ended
117
Table of Contents
December 31, 2018, representing an increase in loss of $68.1 million or 132.2%. The increase in losses was the result of:
| • | $30.1 million in fair value losses, net of hedging gains, on servicing rights for the year ended December 31, 2019, as compared to fair value gains of $20.5 million, net of hedging gains for the year ended December 31, 2018, primarily due to a decline in interest rates during the second half of 2019; |
| • | $85.4 million in realized losses resulting from increases in fallout and decay of the portfolio during the year ended December 31, 2019 as a result of increased prepayment speeds due to decreases in market interest rates during the second half of 2019, compared to $71.0 million during the year ended December 31, 2018. At December 31, 2019, the weighted average prepayment speed of our servicing portfolio was 13.3% compared to 10.9% at December 31, 2018 and 11.0% at December 31, 2017; and |
| • | $4.0 million in realized losses on sales of servicing rights associated with the sale of $12.5 billion in UPB during the year ended December 31, 2019, as compared to a $1.1 million loss associated with the sale of $34.8 billion in UPB during the year ended December 31, 2018. |
Other Income. Other income was $65.7 million for the year ended December 31, 2019, as compared to $54.8 million for the year ended December 31, 2018, representing an increase of $10.9 million or 20.0%. The increase between periods was primarily the result of an increase in escrow and title fee income due to overall increased mortgage loan settlement services, partially offset by a decrease in income from our investments in joint ventures to $12.9 million for the year ended December 31, 2019, as compared to $15.1 million for the year ended December 31, 2018 and was primarily attributable to the sale and wind down of two of our joint ventures in 2019 coupled with reductions in net income from a joint venture related to changes in pricing structure, partially offset by increases in loan originations.
Expenses
Personnel Expense. Personnel expense was $765.3 million for the year ended December 31, 2019, as compared to $681.4 million for the year ended December 31, 2018, representing an increase of $83.9 million or 12.3%. The increase between periods was primarily the result of an increase in commissions, salaries and benefits expense as a result of the increase in headcount associated with the growth of our lending operation to support increased loan origination volumes. As of December 31, 2019, we had 6,592 employees, as compared to 5,228 employees as of December 31, 2018, representing a 26.1% year-over-year increase.
Marketing and Advertising Expense. Marketing and advertising expense was $187.9 million for the year ended December 31, 2019, as compared to $190.8 million for the year ended December 31, 2018, representing a decrease of $2.9 million or 1.5%. The decrease between periods was primarily the result of reductions in direct mail campaigns, advertising, internet marketing and other marketing expenses, partially offset by increases in acquired leads.
Direct Origination Expense. Direct origination expense was $93.5 million for the year ended December 31, 2019, as compared to $83.0 million for the year ended December 31, 2018, representing an increase of $10.5 million or 12.6%. The increase between periods was primarily the result of increased underwriting, credit reports, appraisals, loan documents and other loan origination costs associated with increased loan origination volumes during the period.
General and Administrative Expense. General and administrative expense was $100.5 million for the year ended December 31, 2019, as compared to $95.9 million for the year ended December 31, 2018, representing an increase of $4.6 million or 4.8%. The increase between periods was primarily the result of an increase of $2.4 million in contingent consideration liability during the year ended December 31, 2019, as compared to a $4.9 million reduction in contingent consideration in the comparable period in 2018. The increase in contingent consideration during 2019 was primarily attributable to an increase in Mortgage Master’s estimated pre-tax earnings over the earn-out period, which is a key assumption in the calculation of the contingent consideration
118
Table of Contents
amount. The increase was partially offset by reductions in data and communication expense, professional services and consulting expense.
Occupancy Expense. Occupancy expense were $37.2 million for the year ended December 31, 2019, as compared to $38.3 million for the year ended December 31, 2018, representing a decrease of $1.1 million or 2.9%. The decrease between periods was primarily the result of $1.1 million in sublease income for the year ended December 31, 2019, compared to zero for the year ended December 31, 2018.
Depreciation and Amortization. Depreciation and amortization was $37.4 million for the year ended December 31, 2019, as compared to $36.3 million for the year ended December 31, 2018, representing an increase of $1.1 million or 3.1%. The increase between periods was the result of increased property and equipment through technology hardware upgrades and internally developed software associated with the growth of our lending business.
Subservicing Expense. Subservicing expense was $41.4 million for the year ended December 31, 2019, as compared to $50.4 million for the year ended December 31, 2018, representing a decrease of $9.0 million or 17.9%. The decrease between periods was the result of the decrease of $10.9 billion in the average UPB of our servicing portfolio, which resulted from a decrease in servicing-retained loan sales and bulk sales of servicing rights during 2019. Our average servicing portfolio decreased to $30.1 billion for the year ended December 31, 2019, as compared to $41.0 billion for the year ended December 31, 2018.
Other Interest Expense. Other interest expense was $41.3 million for the year ended December 31, 2019, as compared to $41.6 million for the year ended December 31, 2018, representing a decrease of $0.3 million or 0.8%. The decrease between periods was the result of the decrease in interest rates between periods, partially offset by an increase in outstanding debt obligations including additional interest expense from our Convertible Debt and an increase in financing lease obligations.
Provision for Income Taxes. Provision for income taxes was a benefit of $1.7 million for the year ended December 31, 2019, as compared to a benefit of $0.5 million for the year ended December 31, 2018, representing an increase of $1.3 million or 268.2%. The increase in benefit of income taxes was related to a reduction in the liability for uncertain tax position due to lapse of statute of limitations in the amount of $1.8 million and $0.6 million for the years ended December 31, 2019 and 2018, respectively.
Year Ended December 31, 2018 Compared to Year Ended December 31, 2017
Net loss was $102.9 million for the year ended December 31, 2018, a decrease of $131.2 million, compared to net income of $28.4 million for the year ended December 31, 2017. Total originations were $33.0 billion for the year ended December 31, 2018, as compared to $35.2 billion for the year ended December 31, 2017, representing a decrease of $2.2 billion or 6.1%. Of the total originations for the year ended December 31, 2018, our Retail and Partner Channels originated $24.1 billion and $8.9 billion , respectively, as compared to $27.1 billion and $8.1 billion, respectively, for the year ended December 31, 2017. Our revenue and net income was also impacted by a reduction in IRLCs and mortgage loan originations across certain business channels. Our operating results were negatively influenced by a less attractive mortgage loan origination market during the year ended December 31, 2018, during which interest rates rose steadily throughout 2018 which impacted margins, as well as IRLC and mortgage loan origination volumes.
Revenues
Net Interest Income. Net interest income was $17.3 million for the year ended December 31, 2018, as compared to $16.7 million for the year ended December 31, 2017, representing an increase of $0.5 million or 3.3%. The increase between periods was comprised of:
| • | an increase of $31.2 million or 34.4% in interest income resulting primarily from the $548.1 million increase in average balances of LHFS from $1.7 billion for the year ended December 31, 2017 to |
119
Table of Contents
| $2.2 billion for the year ended December 31, 2018. The increase in average loan balances was a result of increases in the average holding time of loans on the consolidated balance sheet as loan originations decreased in 2018. The increase in yield on LHFS was due to the increases in market interest rates throughout 2018. |
| • | an increase in interest expense of $30.7 million or 41.4% resulting primarily from the $609.5 million increase in average warehouse and other lines of credit between periods from $1.7 billion for the year ended December 31, 2017 to $2.3 billion for the year ended December 31, 2018. The increase in average balances was also accompanied with an increase in the cost of warehouse and other lines of credit balances between periods. The increase in average warehouse and other lines of credit balance was a result of increased utilization resulting from the aforementioned increase in holding periods for loans on our balance sheet between periods. The increase in cost on warehouse and other lines of credit was due to the increases in market interest rates throughout 2018. |
Gain on Origination and Sale of Loans, Net. Gain on origination and sale of loans, net, was $799.6 million for the year ended December 31, 2018, as compared to $1.01 billion for the year ended December 31, 2017, representing a decrease of $212.2 million or 21.0%. The decrease was primarily attributable to the decrease in IRLCs and loan originations during the period from $54.6 billion and $35.2 billion, respectively, during the year ended December 31, 2017 to $50.4 billion and $33.0 billion, respectively, during the year ended December 31, 2018. The components of gain on origination and sale of loans, net, are as follows:
| Year Ended December 31, |
||||||||
| 2018 | 2017 | |||||||
| Premium from loan sales |
$ | 496,488 | $ | 878,319 | ||||
| Servicing rights |
343,118 | 371,751 | ||||||
| Unrealized losses from derivative assets and liabilities—IRLCs |
(31,326 | ) | 6,440 | |||||
| Unrealized losses from Hedging Instruments |
(27,147 | ) | (10,455 | ) | ||||
| Realized gains (losses) from Hedging Instruments |
95,063 | (32,239 | ) | |||||
| Discount points, rebates and lender paid costs |
(83,393 | ) | (222,197 | ) | ||||
| Mark to market gain on loans held for sale |
3,481 | 21,404 | ||||||
| Provision for (recovery of) loan loss obligation for loans sold |
3,280 | (1,232 | ) | |||||
|
|
|
|
|
|||||
| $ | 799,564 | $ | 1,011,791 | |||||
|
|
|
|
|
|||||
Changes in the components of gain on origination and sale of loans, net, during the year ended December 31, 2018 and 2017 were comprised of the following:
| • | $496.5 million in net premiums realized upon the sale of loans to investors for the year ended December 31, 2018, as compared to $878.3 million for the year ended December 31, 2017, representing a decrease of $381.8 million or 43.5%. This increase is a result of the increase in loans sold between periods. During the year ended December 31, 2018, loans sold decreased $1.8 billion or 5.1% to $32.8 billion from $34.5 billion for the year ended December 31, 2017; |
| • | $343.1 million in retained servicing rights from loans sold to investors on a servicing-retained basis for the year ended December 31, 2018, as compared to $371.8 million for the year ended December 31, 2017, representing a decrease of $28.6 million or 7.7%, which was driven by a decrease in volume of loans sold on a servicing-retained basis to $26.8 billion during the year ended December 31, 2018, as compared to $31.7 billion for the year ended December 31, 2017, partially offset by an increase in estimated servicing multiples from 3.8x as of December 31, 2017 to 3.9x as of December 31, 2018 based on changes in prepayment speeds. During the years ended December 31, 2018 and 2017, prepayment speeds remained generally stable. At December 31, 2018, the weighted average |
120
Table of Contents
| prepayment speed of our servicing portfolio was 10.9%, compared to 11.0% at December 31, 2017 and 10.4% at December 31, 2016; |
| • | $31.3 million of unrealized losses from IRLCs for the year ended December 31, 2018, as compared to $6.4 million of unrealized gains for the year ended December 31, 2017, representing a decrease in unrealized gains of $37.8 million or 586.4%. The decrease was primarily due to increases in market interest rates during 2018 which led to the $4.2 billion or 7.8% decrease in volume of IRLCs to $50.4 billion during the year ended December 31, 2018 as compared to $54.6 billion during the year ended December 31, 2017; |
| • | $67.9 million of net realized and unrealized gains from Hedging Instruments for the year ended December 31, 2018, as compared to $42.7 million of realized and unrealized losses for the year ended December 31, 2017. The increase in unrealized and realized gain was primarily due to the overall increase in market interest rates in 2018, offset by the decrease in volume during the year ended December 31, 2018 as compared to the year ended December 31, 2017; |
| • | $83.4 million of rebates paid to borrowers and lender paid costs, net of discount points collected from borrowers for the origination of loans for the year ended December 31, 2018, as compared to $222.2 million for the year ended December 31, 2017, representing a decrease of $138.8 million or 62.5%; |
| • | $3.5 million of fair value gains on LHFS for the year ended December 31, 2018, as compared to $21.4 million for the year ended December 31, 2017. The decrease was primarily attributable to an increasing interest rate environment for the year ended December 31, 2018, as compared to the year ended December 31, 2017; and |
| • | $3.3 million of provision for loan loss obligations recorded for loans sold during the year ended December 31, 2018, as compared to a recovery of loan loss obligations of $1.2 million for the year ended December 31, 2017, an increase of $4.5 million or 366.2%. The provision for loan loss obligations recorded was based on loan sale volumes of $32.8 billion for the year ended December 31, 2018, as compared to $34.5 billion for the year ended December 31, 2017. The recovery of loan loss provision in 2017 was the result of updating model assumptions for frequency and severity related to loss experience. |
Origination Income, Net. Origination income, net, was $153.0 million for the year ended December 31, 2018, as compared to $159.2 million for the year ended December 31, 2017, representing a decrease of $6.1 million or 3.9%. The decrease in origination income, net, between periods was primarily the result of a decrease in loan origination and other loan fees attributable to the reduction in loan origination volumes.
Servicing Income. Servicing income was $141.2 million for the year ended December 31, 2018, as compared to $115.5 million for the year ended December 31, 2017, representing an increase of $25.7 million or 22.3%. The increase in servicing income between periods was the result of an increase of $1.7 billion in the average UPB of our servicing portfolio, which resulted from an increase in servicing-retained loan sales. Our average servicing portfolio increased to $41.0 billion for the year ended December 31, 2018, as compared to $39.3 billion for the year ended December 31, 2017.
Change in Fair Value of Servicing Rights, Net. Change in fair value of servicing rights, net was a loss of $51.5 million for the year ended December 31, 2018, as compared to a loss of $88.7 million for the year ended December 31, 2017, representing a decrease in loss of $37.2 million or 42.0%. The decrease in losses was the result of:
| • | $20.5 million in fair value gains, net of hedging losses, on servicing rights for the year ended December 31, 2018, as compared to $22.2 million in fair value losses, net of hedging gains for the year ended December 31, 2017, primarily due to the increase in interest rates during the year ended December 31, 2018; |
121
Table of Contents
| • | $71.0 million in realized losses resulting from increases in fallout and decay of the portfolio during the year ended December 31, 2018 as a result of increases in the servicing portfolio, compared to $68.9 million during the year ended December 31, 2017. During the years ended December 31, 2018 and 2017, prepayment speeds remained generally stable. At December 31, 2018, the weighted average prepayment speed of our servicing portfolio was 10.9%, compared to 11.0% at December 31, 2017 and 10.4% at December 31, 2016; and |
| • | $1.1 million in realized losses on sales of servicing rights associated with the sale of $34.8 billion in UPB during the year ended December 31, 2018, as compared to a $2.4 million gain associated with the sale of $8.0 billion in UPB during the year ended December 31, 2017. |
Other Income. Other income was $54.8 million for the year ended December 31, 2018, as compared to $58.5 million for the year ended December 31, 2017, representing a decrease of $3.7 million or 6.4%. The decrease between periods was primarily the result of reductions in title and escrow fees driven by lower overall loan originations between periods. The decrease was partially offset by the increase in income from our investments in joint ventures of $1.7 million to $15.1 million for the year ended December 31, 2018, as compared to $13.3 million for the year ended December 31, 2017 attributable to an increase in joint venture loan originations.
Expenses
Personnel Expense. Personnel expense was $681.4 million for the year ended December 31, 2018, as compared to $726.6 million for the year ended December 31, 2017, representing a decrease of $45.2 million or 6.2%. The decrease between periods was primarily the result of a decrease in commissions, salaries and benefits expense as a result of the decrease in headcount associated with the reductions in origination volume between periods. As of December 31, 2018, we had 5,228 employees, as compared to 6,460 employees as of December 31, 2017, representing a 19.1% year-over-year decrease.
Marketing and Advertising Expense. Marketing and advertising expense was $190.8 million for the year ended December 31, 2018, as compared to $216.0 million for the year ended December 31, 2017, representing a decrease of $25.2 million or 11.7%. The decrease between periods was primarily the result of reductions in direct mail campaigns, advertising, internet marketing and other marketing expenses associated with lower origination volume between periods, partially offset by increases in acquired leads.
Direct Origination Expense. Direct origination expense was $83.0 million for the year ended December 31, 2018, as compared to $76.2 million for the year ended December 31, 2017, representing an increase of $6.8 million or 8.9%. The increase between periods was primarily the result of increased credit reports and appraisal costs associated with lower pull-through rates on IRLCs related to the increasing market interest rates in 2018, partially offset by a decrease in loan documentation, notary and other loan origination costs associated with decreased loan origination volumes during the period.
General and Administrative Expense. General and administrative expense was $95.9 million for the year ended December 31, 2018, as compared to $95.2 million for the year ended December 31, 2017, representing an increase of $0.6 million or 0.7%. The increase in general and administrative expense is related to continued investments in our proprietary technology and infrastructure and data and communication expense. Additionally, the increase between periods was attributable to a reduction of $4.9 million in contingent consideration during the year ended December 31, 2018, as compared to a $15.7 million reduction in contingent consideration in the comparable period in 2017. The decrease in contingent consideration during 2018 and 2017 was attributable to a decrease in Mortgage Master’s estimated pre-tax earnings over the earn-out period, which is a key assumption in the calculation of the contingent consideration amount. These increases were partially offset by reductions of $3.9 million in travel and entertainment expenses, and $7.3 million in professional services and consulting expenses.
122
Table of Contents
Occupancy Expense. Occupancy expense was $38.3 million for the year ended December 31, 2018, as compared to $31.7 million for the year ended December 31, 2017, representing an increase of $6.7 million or 21.0%. The increase between periods was due to additional expansion of our corporate and retail offices.
Depreciation and Amortization. Depreciation and amortization was $36.3 million for the year ended December 31, 2018, as compared to $31.9 million for the year ended December 31, 2017, representing an increase of $4.4 million or 13.9%. The increase between periods was due to increased property and equipment expenses related to technology hardware upgrades and internally developed software, as well as the acquisition of furniture and fixtures and leasehold improvements associated with the expansion of office space with the growth of our lending business.
Subservicing Expense. Subservicing expense was $50.4 million for the year ended December 31, 2018, as compared to $36.4 million for the year ended December 31, 2017, representing an increase of $14.0 million or 38.5%. The increase between periods was the result of the increased balance of our servicing portfolio. Our average servicing portfolio increased to $41.0 billion for the year ended December 31, 2018 as compared to $39.3 billion for the year ended December 31, 2017.
Other Interest Expense. Other interest expense was $41.6 million for the year ended December 31, 2018, as compared to $29.2 million for the year ended December 31, 2017, representing an increase of $12.5 million or 42.8%. The increase in interest expense between periods was the result of increases in outstanding debt obligations including, (i) a $90.0 million increase in borrowings related to our master repurchase agreement to finance GNMA servicing rights (“GNMA MSR Facility”), (ii) a $65.0 million increase in borrowings under our unsecured term loan facility (“Unsecured Term Loan”), and (iii) an $8.0 million increase related to the master repurchase agreement to finance securities (“Securities Financing”) entered into in July 2018 coupled with increases in interest rates throughout 2018. The increases in borrowings and interest rates were partially offset by a (i) $38.0 million decrease in our Original Secured Credit Facility, (ii) a $30.0 million decrease in borrowings under our Second Secured Credit Facility, and (iii) a $15.0 million decrease in borrowings under our variable funding note (“GMSR VFN”) secured by GNMA servicing rights.
Provision for Income Taxes. Provision for income taxes was a benefit of $0.5 million for the year ended December 31, 2018, as compared to an expense of $1.4 million for the year ended December 31, 2017, representing a decrease of $1.9 million or 133.1%. The increase in benefit of income taxes was related to a reduction in the liability for uncertain tax position due to lapse of statute of limitations in the amount of $0.6 million for the year ended December 31, 2018. The provision for income taxes in 2017 was related to income generated from our settlement service entities.
Description of Certain Components of Consolidated Balance Sheets
Loans Held for Sale, at Fair Value. Loans held for sale, at fair value, are primarily fixed and variable rate, 15- to 30-year term first-lien loans that are secured by residential property. All loans are reflected at fair value.
Derivative Assets and Liabilities, at Fair Value. Derivative assets and liabilities, at fair value, represent the fair value of IRLCs and Hedging Instruments, which may be positive or negative. We do not use derivative financial instruments for purposes other than in support of our risk management activities.
Servicing Rights, at Fair Value. Servicing rights, at fair value, represent the value of a contract that obligates us to service mortgage loans on behalf of the purchaser of the loan in exchange for servicing fees and the right to collect certain ancillary income from the borrower. We recognize servicing rights at our estimate of the fair value of the contract to service the loans.
Warehouse and Other Lines of Credit. Warehouse lines and other lines of credit represent debt that is used to fund, and is secured by mortgage loans. Warehouse Lines are repaid using proceeds from the sale of loans. Warehouse Lines carry base interest rates and may include annual facility fees, commitment fees and non-usage fees.
123
Table of Contents
Debt obligations. Debt obligations consist of secured credit facilities, unsecured term loan, and convertible debt. Secured credit facilities are used for working capital purposes and to finance servicing rights and carry base interest rates plus a margin. Our unsecured term loan has a base interest rate plus a margin. Our Convertible Debt accrues interest at fixed rates that change over time and is used for working capital needs and general corporate purposes.
Loans Eligible for Repurchase/Liability for Loans Eligible for Repurchase. For certain loans guaranteed by Ginnie Mae, we (as the servicer) have the unilateral right to repurchase any individual loan in a Ginnie Mae securitization pool if that loan meets defined criteria, including being delinquent greater than 90 days. Once we have the unilateral right to repurchase the delinquent loan, we have effectively gained control over the loan and must re-recognize the loan on our consolidated balance sheet and establish a corresponding liability regardless of our intent to repurchase the loan.
Financial Condition
The following table sets forth our consolidated balance sheet data as of the dates indicated:
| December 31, | ||||||||||||
| (Dollars in thousands) |
September 30, 2020 |
2019 | 2018 | |||||||||
| (Unaudited) | ||||||||||||
| ASSETS |
||||||||||||
| Cash and cash equivalents |
$ | 637,511 | $ | 73,301 | $ | 105,685 | ||||||
| Restricted cash |
70,387 | 44,195 | 8,307 | |||||||||
| Accounts receivable, net |
118,400 | 121,046 | 130,473 | |||||||||
| Loans held for sale, at fair value |
4,888,364 | 3,681,840 | 2,295,451 | |||||||||
| Derivative assets, at fair value |
722,149 | 131,228 | 73,439 | |||||||||
| Servicing rights, at fair value |
780,451 | 447,478 | 412,953 | |||||||||
| Trading securities |
— | — | 25,086 | |||||||||
| Property and equipment, net |
76,250 | 80,897 | 90,954 | |||||||||
| Operating lease right-of-use assets |
56,449 | 61,693 | — | |||||||||
| Prepaid expenses and other assets |
57,610 | 52,653 | 49,675 | |||||||||
| Loans eligible for repurchase |
1,184,015 | 197,812 | 183,814 | |||||||||
| Investments in joint ventures |
16,773 | 17,030 | 17,001 | |||||||||
| Goodwill and intangible assets, net |
42,954 | 43,338 | 43,955 | |||||||||
|
|
|
|
|
|
|
|||||||
| Total assets |
$ | 8,651,313 | $ | 4,952,511 | $ | 3,436,793 | ||||||
|
|
|
|
|
|
|
|||||||
| LIABILITIES, REDEEMABLE UNITS AND UNITHOLDERS’ EQUITY |
||||||||||||
| Warehouse and other lines of credit |
$ | 4,601,062 | $ | 3,466,567 | $ | 2,126,640 | ||||||
| Accounts payable, accrued expenses and other liabilities |
375,957 | 196,102 | 167,177 | |||||||||
| Derivative liabilities, at fair value |
59,432 | 9,977 | 32,575 | |||||||||
| Liability for loans eligible for repurchase |
1,184,015 | 197,812 | 183,814 | |||||||||
| Operating lease liability |
72,590 | 80,257 | — | |||||||||
| Financing lease obligations |
18,258 | 33,816 | 29,803 | |||||||||
| Debt obligations, net |
706,478 | 592,095 | 547,893 | |||||||||
|
|
|
|
|
|
|
|||||||
| Total liabilities |
7,017,792 | 4,576,626 | 3,087,902 | |||||||||
| Redeemable units and unitholders’ equity |
1,633,521 | 375,885 | 348,891 | |||||||||
|
|
|
|
|
|
|
|||||||
| Total liabilities, redeemable units and unitholders’ equity |
$ | 8,651,313 | $ | 4,952,511 | $ | 3,436,793 | ||||||
|
|
|
|
|
|
|
|||||||
124
Table of Contents
September 30, 2020 Compared to December 31, 2019
Assets
Cash and Cash Equivalents. Cash and cash equivalents were $637.5 million as of September 30, 2020, as compared to $73.3 million as of December 31, 2019, representing an increase of $564.2 million or 769.7%. The increase between periods was primarily the result of net income generated in the nine months ended September 30, 2020 from increased loan origination and sale volumes and net proceeds from warehouse borrowing and other lines of credit and debt obligations, partially offset by the redemption of Class I Common Units, dividends, and distributions.
Restricted Cash. Restricted cash was $70.4 million as of September 30, 2020, as compared to $44.2 million as of December 31, 2019 representing an increase of $26.2 million or 59.3%. The increase between periods was primarily the result of increases in restricted cash pledged as collateral for our Warehouse Lines.
Accounts Receivable, Net. Accounts receivable, net, was $118.4 million as of September 30, 2020, as compared to $121.0 million as of December 31, 2019, representing a decrease of $2.6 million or 2.2%. The decrease between periods was primarily the result of a decrease in receivables as a result of decreases in loan principal and interest receivable from loan sales due to reduced holding periods on our LHFS, partially offset by an increase in receivables from hedging activities.
Loans Held for Sale, at Fair Value. Loans held for sale, at fair value, were $4.9 billion as of September 30, 2020, as compared to $3.7 billion as of December 31, 2019, representing an increase of $1.2 billion or 32.8%. The increase during the nine months ended September 30, 2020 was primarily the result of originations of loans totaling $63.4 billion, offset by $62.2 billion in sales. At September 30, 2020, loans held for sale included valuation gains of $190.6 million compared to $76.4 million at December 31, 2019.
Derivative Assets, at Fair Value. Derivative assets, at fair value, were $722.1 million as of September 30, 2020, as compared to $131.2 million as of December 31, 2019, representing an increase of $590.9 million or 450.3%. The increase between periods was primarily the result of a $592.2 million increase in IRLCs, offset by a $1.3 million decrease in Hedging Instruments entered into as a result of increased loan commitments associated with the growth in our lending operation. At September 30, 2020, derivative assets included IRLCs with fair values and notional amounts of $722.1 million and $30.3 billion, respectively, compared to $129.9 million and $8.5 billion, respectively, at December 31, 2019.
Servicing Rights, at Fair Value. Servicing rights, at fair value, were $780.5 million as of September 30, 2020, as compared to $447.5 million as of December 31, 2019, representing an increase of $333.0 million or 74.4%. The increase between periods was primarily the result of $574.8 million in capitalized servicing rights from the sale of loans on a servicing retained basis, partially offset by a $112.1 million decrease in estimated fair value due to the decreasing interest rate environment, a $9.6 million decrease in servicing rights from the sale of $194.0 million in UPB of servicing rights, and a $120.5 million decrease due to principal amortization and prepayments during the nine months ended September 30, 2020.
Property and Equipment, Net. Property and equipment, net, was $76.3 million as of September 30, 2020, as compared to $80.9 million as of December 31, 2019, representing a decrease of $4.6 million or 5.7%. The decrease between periods was primarily the result of depreciation of $26.7 million, partially offset by additions of $19.6 million consisting primarily of internally developed software cost associated with the expansion of our proprietary technology, capital expenditures associated with the growth of our company and additional property and equipment.
Operating lease right-of-use assets. Operating lease right-of-use assets were $56.4 million as of September 30, 2020, as compared to $61.7 million as of December 31, 2019, representing a decrease of $5.2 million or 8.5%. The decrease between periods was related to amortization of $19.2 million, offset by operating lease right-of-use assets obtained in exchange for operating lease liabilities totaling $14.0 million.
125
Table of Contents
Prepaid Expenses and Other Assets. Prepaid expenses and other assets were $57.6 million as of September 30, 2020, as compared to $52.7 million as of December 31, 2019, representing an increase of $5.0 million or 9.4%. The increase between periods was primarily due to a $5.1 million increase in servicing advances as a result of the growth in our servicing portfolio between periods.
Loans Eligible for Repurchase. Loans eligible for repurchase were $1.2 billion as of September 30, 2020, as compared to $197.8 million as of December 31, 2019, representing an increase of $986.2 million or 498.6%. The increase between periods is due to the increase in Ginnie Mae serviced loans that were 90 days or more delinquent at September 30, 2020, which is attributable to both the increase in our Ginnie Mae servicing portfolio and increases in delinquency within the portfolio due to impact of the global pandemic on the economy.
Investments in Joint Ventures. Investments in joint ventures were $16.8 million as of September 30, 2020, as compared to $17.0 million as of December 31, 2019, representing a decrease of $0.3 million or 1.5%. The decrease between periods was primarily the result of earnings from joint ventures totaling $6.7 million, offset by distributions and return of capital from joint ventures of $6.6 million and $0.3 million, respectively.
Goodwill and Intangible Assets, Net. Goodwill was $40.7 million as of September 30, 2020 and December 31, 2019. Intangible assets, net, were $2.2 million as of September 30, 2020, as compared to $2.6 million as of December 31, 2019, representing a decrease of $0.4 million or 14.8%. The decrease between periods was the result of $0.4 million in amortization expense during the nine months ended September 30, 2020 associated with intangible assets from prior acquisitions.
Liabilities, Redeemable Units and Unitholders’ Equity
Warehouse and Other Lines of Credit. Warehouse and other lines of credit were $4.6 billion as of September 30, 2020, as compared to $3.5 billion as of December 31, 2019, representing an increase of $1.1 billion or 32.7%. The increase between periods was primarily the result of loan originations outpacing sales by $1.2 billion during the nine months ended September 30, 2020. For the nine months ended September 30, 2020, we originated and sold $63.4 billion and $62.2 billion, respectively, in loans. Our borrowing capacity under our Warehouse Lines increased to $5.5 billion at September 30, 2020 from $5.1 billion at December 31, 2019.
Accounts Payable, Accrued Expenses and Other Liabilities. Accounts payable, accrued expenses and other liabilities were $376.0 million as of September 30, 2020, as compared to $196.1 million as of December 31, 2019, representing an increase of $179.9 million or 91.7%. The increase between periods was primarily the result of a $146.9 million increase in accrued compensation and benefits associated with the increase in employees and a $19.4 million increase in contingent consideration related to the earnout liability associated with the Mortgage Master acquisition. Additionally, there was a $9.9 million increase in our loan repurchase reserve based on the increase in loan sale volume during the period.
Derivative Liabilities, at Fair Value. Derivative liabilities, at fair value, were $59.4 million as of September 30, 2020, as compared to $10.0 million as of December 31, 2019, representing an increase of $49.5 million or 495.7%. The increase is primarily related to increases in the notional value and fair value of forward loan sale commitments. At September 30, 2020, the notional value and fair value of forward loan sale commitments was $40.1 billion and $57.6 million, compared to $7.9 billion and $7.0 million at December 31, 2019. The increase is primarily due to the growth of our IRLC pipeline and LHFS at September 30, 2020 as compared to December 31, 2019.
Liability for Loans Eligible for Repurchase. Liability for loans eligible for repurchase was $1.2 billion as of September 30, 2020, as compared to $197.8 million as of December 31, 2019, representing an increase of $986.2 million or 498.6%. The increase between periods is due to the increase in Ginnie Mae serviced loans that were 90 days or more delinquent at September 30, 2020, which is attributable to both the increase in our Ginnie
126
Table of Contents
Mae servicing portfolio and increases in delinquency within the portfolio due to impact of the global pandemic on the economy.
Operating lease liability. Operating lease liabilities were $72.6 million as of September 30, 2020, as compared to $80.3 million as of December 31, 2019, representing a decrease of $7.7 million or 9.6%. The decrease between periods is related to cash payments for operating leases of $25.5 million, offset by new operating lease liabilities incurred of $14.0 million and interest accretion of $3.9 million.
Financing Lease Obligations. Financing lease obligations were $18.3 million as of September 30, 2020, as compared to $33.8 million as of December 31, 2019, representing a decrease of $15.6 million or 46.0%. The decrease between periods was primarily the result of payments under financing lease obligations of $18.0 million, partially offset by $2.5 million of purchases of equipment under financing leases to help facilitate our current and future growth of our business.
Debt Obligations. Debt obligations were $706.5 million as of September 30, 2020, as compared to $592.1 million as of December 31, 2019, representing an increase of $114.4 million or 19.3%. The increase between periods was primarily the result of the following changes in outstanding balances:
| • | Original Secured Credit Facility increased $107.0 million from $43.0 million at December 31, 2019 to $150.0 million at September 30, 2020 primarily resulting from an increase in borrowing capacity from $50.0 million to $150.0 million and increased draws on the facility; |
| • | Second Secured Credit Facility decreased $17.9 million from $37.9 million at December 31, 2019 to $20.0 million at September 30, 2020 related to net paydowns on the facility; and |
| • | Convertible Debt increased $25.0 million to $75.0 million at September 30, 2020 as a result of borrowing capacity being increased from $50.0 million to $75.0 million during the period and the resulting additional draw of $25.0 million. |
Redeemable Units and Unitholders’ Equity. Total redeemable units were $104.2 million and $138.5 million at September 30, 2020 and December 31, 2019, respectively. The $34.3 million or 24.8% decrease in redeemable units was related to the redemption of all 1,190,093 Class I Common Units during the period. In May 2020, the Company entered into an agreement to redeem all of its Class I Common Units for $65.3 million. The Company paid $38.4 million in May 2020 and $26.9 million in July 2020 to redeem the Class I Common Units.
Total unitholders’ equity was $1.5 billion and $237.4 million at September 30, 2020 and December 31, 2019, respectively. The $1.3 billion or 544.2% increase was primarily attributable to (i) net income of $1.5 billion; (ii) equity-based compensation of $7.6 million; partially offset by (iii) a $31.0 million decrease in retained earnings related to the excess of the aforementioned $65.3 million redemption of Class I Common Units over the $34.3 million redeemable unit value; and (iv) dividends and distributions totaling $150.4 million.
December 31, 2019 Compared to December 31, 2018
Assets
Cash and Cash Equivalents. Cash and cash equivalents were $73.3 million as of December 31, 2019, as compared to $105.7 million as of December 31, 2018, representing a decrease of $32.4 million or 30.6%. The decrease between periods was primarily the result of cash used to post as collateral and haircuts for Warehouse Lines of credit associated with the increase in LHFS at December 31, 2019 as compared to December 31, 2018. Additionally, cash decreased as a result of an increase in our investment in MSR. Partially offsetting the decrease was an increase in cash from additional borrowings from debt obligations as well as net income generated in the year ended December 31, 2019 of $34.4 million.
Restricted Cash. Restricted cash was $44.2 million as of December 31, 2019, as compared to $8.3 million as of December 31, 2018 representing an increase of $35.9 million or 432.0%. The increase between periods was primarily the result of increases in restricted cash pledged as collateral for our Warehouse Lines.
127
Table of Contents
Accounts Receivable, Net. Accounts receivable, net, was $121.0 million as of December 31, 2019, as compared to $130.5 million as of December 31, 2018, representing a decrease of $9.4 million or 7.2%. The decrease between periods was primarily the result of a decrease in holdback receivables from fewer bulk sales of servicing rights in 2019 compared to 2018 as well as a reduction in escrow and holdback receivables from loan sales. Partially offsetting the decrease was an increase in receivables for loan origination, loan principal and interest and settlement services related to the increase in LHFS at December 31, 2019 as compared to December 31, 2018.
Loans Held for Sale, at Fair Value. Loans held for sale, at fair value, were $3.68 billion as of December 31, 2019, as compared to $2.30 billion as of December 31, 2018, representing an increase of $1.39 billion or 60.4%. The increase between periods was primarily the result of increased loan originations. For the year ended December 31, 2019, we originated and sold $45.3 billion and $43.5 billion in mortgage loans, respectively. At December 31, 2019, loans held for sale included valuation gains of $76.4 million compared to $60.2 million at December 31, 2018.
Derivative Assets, at Fair Value. Derivative assets, at fair value, were $131.2 million as of December 31, 2019, as compared to $73.4 million as of December 31, 2018, representing an increase of $57.8 million or 78.7%. The increase between periods was primarily the result of a $68.9 million increase in IRLCs, partially offset by an $11.0 million decrease in Hedging Instruments entered into as a result of increased loan commitments associated with the growth in our lending operation. At December 31, 2019, derivative assets included IRLCs with fair values and notional amounts of $129.9 million and $8.5 billion, respectively, compared to $61.0 million and $2.9 billion at December 31, 2018.
Servicing Rights, at Fair Value. Servicing rights, at fair value, were $447.5 million as of December 31, 2019, as compared to $413.0 million as of December 31, 2018, representing an increase of $34.5 million or 8.4%. The increase between periods was primarily the result of $334.2 million in capitalized servicing rights from the sale of loans on a servicing retained basis, partially offset by a $51.1 million decrease in estimated fair value due to the decreasing interest rate environment, a $162.2 million decrease in servicing rights from the sale of $12.5 billion in UPB of servicing rights, and $85.4 million in principal amortization and prepayments during the year ended December 31, 2019.
Trading Securities. Trading securities were zero as of December 31, 2019, as compared to $25.1 million as of December 31, 2018, representing a decrease of $25.1 million or 100.0%. The decrease between periods was the result of the sale of the trading securities portfolio.
Property and Equipment, Net. Property and equipment, net, was $80.9 million as of December 31, 2019, as compared to $91.0 million as of December 31, 2018, representing a decrease of $10.1 million or 11.1%. The decrease between periods was primarily the result of depreciation of $36.8 million, partially offset by additions of $11.0 million related to the capitalization of internally developed software costs, $12.0 million in acquisitions of computer hardware and $3.7 million in capital expenditures associated with the expansion of our proprietary technology and growth of our lending platform.
Operating lease right-of-use assets. Operating lease right-of-use assets were $61.7 million as of December 31, 2019, as compared to zero as of December 31, 2018. The $61.7 million increase between periods was related to the adoption of the new lease accounting standard on January 1, 2019. As a result of the adoption, we recognized $71.9 million in operating lease right-of-use assets. Additionally, during the year ended December 31, 2019 we recognized $13.7 million of new operating lease right-of-use assets in exchange for operating lease liabilities, offset by $23.9 million in amortization. There was no similar activity during the year ended December 31, 2018.
Prepaid Expenses and Other Assets. Prepaid expenses and other assets were $52.7 million as of December 31, 2019, as compared to $49.7 million as of December 31, 2018, representing an increase of
128
Table of Contents
$3.0 million or 6.0%. The increase between periods was primarily the result of increases in prepaid expenses associated with the growth of our origination platform and servicing portfolio.
Loans Eligible for Repurchase. Loans eligible for repurchase were $197.8 million as of December 31, 2019, as compared to $183.8 million as of December 31, 2018, representing an increase of $14.0 million or 7.6%. The increase between periods was due to the increase in Ginnie Mae serviced loans that were 90 days or more delinquent as of December 31, 2019, which was attributable to the increase in our Ginnie Mae servicing portfolio.
Investments in Joint Ventures. Investments in joint ventures were $17.0 million as of December 31, 2019 and 2018. During the year ended December 31, 2019, earnings from joint ventures were $12.9 million, offset by distributions from joint ventures of $12.9 million.
Goodwill and Intangible Assets, Net. Goodwill was $40.7 million as of December 31, 2019 and December 31, 2018. Intangible assets, net, were $2.6 million as of December 31, 2019, as compared to $3.2 million as of December 31, 2018, representing a decrease of $0.6 million or 19.2%. The decrease between periods was the result of $0.6 million in amortization expense during the year ended December 31, 2019 associated with intangible assets acquired in the iMortgage, Mortgage Master and CUSA acquisitions.
Liabilities, Redeemable Units and Unitholders’ Equity
Warehouse and Other Lines of Credit. Warehouse and other lines of credit were $3.5 billion as of December 31, 2019, as compared to $2.1 billion as of December 31, 2018, representing an increase of $1.3 billion or 63.0%. The increase between periods was primarily the result of increased loan originations across all of our channels. For the year ended December 31, 2019, we originated and sold $45.3 billion and $43.5 billion, respectively, in loans. We increased our borrowing capacity with existing lenders under our Warehouse Lines to $5.1 billion during the year ended December 31, 2019 as compared to $4.3 billion at December 31, 2018.
Accounts Payable, Accrued Expenses and Other Liabilities. Accounts payable, accrued expenses and other liabilities were $196.1 million as of December 31, 2019, as compared to $167.2 million as of December 31, 2018, representing an increase of $28.9 million or 17.3%. The increase between periods was primarily the result of a $32.3 million increase in accrued compensation and benefits associated with the increase in employees and an increase of $20.7 million in accounts payable related to the growth in our businesses. Partially offsetting the increases were decreases in deferred rent related to the adoption of the new lease accounting standard on January 1, 2019 and decreases in other accrued liabilities.
Derivative Liabilities, at Fair Value. Derivative liabilities, at fair value, were $10.0 million as of December 31, 2019, as compared to $32.6 million as of December 31, 2018, representing a decrease of $22.6 million or 69.4%. The decrease was primarily related to declining market interest rates at the end of 2018, as compared to a relatively flat market interest rate environment at the end of 2019. Although notional amounts for our forward loan sale commitments increased year over year, the interest rate declines experienced at the end of 2018 resulted in a larger hedge liability. At December 31, 2019, the notional value and fair value of forward loan sale commitments was $7.9 billion and $7.0 million, compared to $4.1 billion and $32.0 million at December 31, 2018.
Liability for Loans Eligible for Repurchase. Liability for loans eligible for repurchase was $197.8 million as of December 31, 2019, as compared to $183.8 million as of December 31, 2018, representing an increase of $14.0 million or 7.6%. The increase between periods was due to the increase in Ginnie Mae serviced loans that were 90 days or more delinquent at December 31, 2019, which was attributable to the increase in our Ginnie Mae servicing portfolio.
129
Table of Contents
Operating lease liability. Operating lease liability was $80.3 million as of December 31, 2019, as compared to zero as of December 31, 2018. The $80.3 million increase between periods was related to the adoption of the new lease accounting standard on January 1, 2019. As a result of the adoption, we recognized a $94.9 million operating lease liability. Additionally, during the year ended December 31, 2019 we recognized $13.7 million of new operating lease liabilities. Additionally, during the year ended December 31, 2019, operating lease liabilities were reduced by $34.0 million in cash payments for operating leases, offset by $5.6 million of interest accretion. There was no similar activity during the year ended December 31, 2018.
Financing Lease Obligations. Financing lease obligations were $33.8 million as of December 31, 2019, as compared to $29.8 million as of December 31, 2018, representing an increase of $4.0 million or 13.5%. The increase between periods was primarily the result of $7.8 million in proceeds from the financing of previously acquired assets and $14.2 million of purchases of equipment under financing leases to help facilitate the current and future growth of our business, partially offset by payments under financing lease obligations of $18.0 million.
Debt Obligations. Debt obligations were $592.1 million as of December 31, 2019, as compared to $547.9 million as of December 31, 2018, representing an increase of $44.2 million or 8.1%. The increase between periods was primarily the result of the Company entering into an agreement for the Convertible Debt of $50.0 million in August 2019, partially offset by the payoff of the Company’s $8.0 million Securities Financing in May 2019.
Redeemable Units and Unitholders’ Equity. Total redeemable units were $138.5 million at both December 31, 2019 and 2018. There was no activity in redeemable units during the year ended December 31, 2019. Total unitholders’ equity was $237.4 million as of December 31, 2019, as compared to $210.4 million as of December 31, 2018. The $27.0 million or 12.8% increase in unitholders’ equity between periods was primarily the result of $34.4 million of net income generated and $0.2 million in equity-based compensation, partially offset by $7.6 million in dividend payments to our Class I Common unitholders.
Liquidity and Capital Resources
Liquidity
Our liquidity reflects our ability to meet our current obligations (including our operating expenses and, when applicable, the retirement of our debt and margin calls relating to our Hedging Instruments, Warehouse Lines and Secured Credit Facilities), fund new originations and purchases, meet servicing requirements, and make investments as we identify them. We forecast the need to have adequate liquid funds available to operate and grow our business. As of September 30, 2020, unrestricted cash and cash equivalents were $637.5 million and committed and uncommitted available capacity under our Warehouse Lines was $878.9 million.
We fund substantially all of the mortgage loans we close through borrowings under our Warehouse Lines. Given the broad impact of the COVID-19 pandemic on the financial markets, our future ability to borrow money to fund our current and future loan production is unknown. Our mortgage origination liquidity could also be affected as our lenders reassess their exposure to the mortgage origination industry and either curtail access to uncommitted mortgage warehouse financing capacity or impose higher costs to access such capacity. Our liquidity may be further constrained as there may be less demand by investors to acquire our mortgage loans in the secondary market. Even if such demand exists, we face a substantially higher repurchase risk as a result of the COVID-19 pandemic stemming from our clients inability to repay the underlying loans. In response to the COVID-19 pandemic, we have increased our cash position total loan funding capacity with our current lending partners.
As a servicer, we are required to advance principal and interest to the investor for up to four months on GSE backed mortgages and longer on other government agency backed mortgages on behalf of clients who have
130
Table of Contents
entered a forbearance plan. As of September 30, 2020, approximately 3.4%, or $2.6 billion UPB, of our servicing portfolio was in active forbearance. While these advance requirements may be significant at higher levels of forbearance, we believe we are very well-positioned in terms of our liquidity. We will continue evaluating the capital markets as well, which would further supplement our liquidity should the need arise.
Sources and Uses of Cash
Our primary sources of liquidity have been as follows: (i) funds obtained from our Warehouse Lines; (ii) proceeds from other financing arrangements described under “—Debt Obligations” below; (iii) proceeds received from the sale and securitization of loans; (iv) proceeds from the sale of servicing rights; (v) loan fees from the origination of loans; (vi) servicing fees; (vii) title and escrow fees from settlement services, (viii) real estate referral fees, and (ix) interest payments from LHFS.
Our primary uses of funds for liquidity have included the following: (i) funding mortgage loans; (ii) funding loan origination costs; (iii) payment of Warehouse Line haircuts required at loan origination; (iv) payment of interest expense on Warehouse Lines; (v) payment of interest expense under other financing arrangements described under “—Debt Obligations” below; (vi) payment of operating expenses; (vii) repayment of Warehouse Lines; (viii) repayment of other financing arrangements described under “—Debt Obligations” below; (ix) funding of servicing advances; (x) margin calls on Warehouse Lines or Hedging Instruments; (xi) payment of distributions and other amounts due to the holders of our common units; (xii) repurchases of loans under representation and warranty breaches; (xiii) earnout payments from acquisitions, and (ix) costs relating to subservicing.
We rely on the secondary mortgage market as a source of long-term capital to support our mortgage lending operations. Approximately 87% of the mortgage loans that we originated during the nine months ended September 30, 2020 were sold in the secondary mortgage market to Fannie Mae or Freddie Mac or, in the case of MBS guaranteed by Ginnie Mae, are mortgage loans insured or guaranteed by the FHA or VA. We also sell loans to many private investors.
At this time, we believe that there are no material market trends that would affect our access to long-term or short-term borrowings sufficient to maintain our current operations, or that would likely cause us to cease to be in compliance with applicable covenants for our indebtedness or that would inhibit our ability to fund our loan operations and capital commitments for the next twelve months. However, should those trends change, we believe we could retain less or sell additional servicing rights, scale back growth or take other actions to mitigate any significant increase in demands on our liquidity.
Cash Flows
The following table summarizes the net cash provided by (used in) operating activities, investing activities and financing activities for the periods indicated:
| Nine Months Ended September 30, | Year Ended December 31, | |||||||||||||||||||
| (Dollars in thousands) |
2020 | 2019 | 2019 | 2018 | 2017 | |||||||||||||||
| Statement of Cash Flows Data: |
||||||||||||||||||||
| Net cash used in operating activities |
$ | (418,143 | ) | $ | (943,339 | ) | $ | (1,497,380 | ) | $ | (428,788 | ) | $ | (482,363 | ) | |||||
| Net cash (used in) provided by investing activities |
(13,302 | ) | 152,076 | 141,090 | 503,135 | (122,963 | ) | |||||||||||||
| Net cash provided by (used in) financing activities |
1,021,847 | 756,558 | 1,359,794 | (56,943 | ) | 587,572 | ||||||||||||||
Operating Activities
During the nine months ended September 30, 2020, net cash used in operating activities was $418.1 million, compared to $943.3 million during the nine months ended September 30, 2019. The $525.2 million decrease in
131
Table of Contents
cash used in operating activities during the nine months ended September 30, 2020 was primarily driven by a $1.4 billion increase in net income, driven by the $1.6 billion increase in gain on origination and sale of loans. During the nine months ended September 30, 2020 there was a net $960.3 million increase in cash provided due to proceeds from loan sales and principal repayments in excess of loan originations during the period as we originated $63.4 billion and $29.3 billion, respectively, in loans and sold $62.2 billion and $28.1 billion, respectively, in loans. The increase in cash resulting from proceeds from loan sales and principal repayments in excess of loan originations was partially offset by a $356.5 million increase in fair value losses and a $40.9 million increase in payments to investors for loan repurchases between periods.
During the year ended December 31, 2019, net cash used in operating activities was $1.5 billion, compared to $428.8 million during the year ended December 31, 2018. The $1.1 billion increase in cash used in operating activities during 2019 was primarily driven by a net $1.6 billion increase in cash used from loan originations in excess of proceeds from loan sales and principal repayments during the period. During the years ended December 31, 2019 and December 31, 2018, we originated $45.3 billion and $33.0 billion, respectively, in loans and sold $43.5 billion and $32.8 billion, respectively, in loans. Partially offsetting the cash used was an increase in net income of $137.3 million, an $82.6 million decrease in fair value losses, a $61.3 million decrease in payments to investors for loan repurchases and a $110.4 million reduction in purchases of consumer loans to zero during the year ended December 31, 2019.
During the year ended December 31, 2018, net cash used in operating activities was $428.8 million, compared to $482.4 million during the year ended December 31, 2017. The $53.6 million decrease in cash used in operating activities during 2018 was primarily driven by a net $522.5 million increase in cash provided from proceeds from loan sales and principal repayments in excess of originations during the period. During the years ended December 31, 2018 and December 31, 2017, we originated $33.0 billion and $35.2 billion, respectively, in loans and sold $32.8 billion and $34.5 billion, respectively, in loans. Offsetting the cash provided from the net proceeds from cash sales was a $131.2 million reduction in net income, a $42.4 million increase in fair value losses, a $141.9 million increase in payments to investors for loan repurchases, a $25.0 million increase in trading securities, and $110.4 million in purchases of consumer loans.
Investing Activities
During the nine months ended September 30, 2020, net cash flows used in investing activities was $13.3 million as compared to $152.1 million provided by investing activities during the nine months ended September 30, 2019. The decrease in net cash flows (used in) provided by investing activities during the nine months ended September 30, 2020 was primarily driven by lower servicing rights sales activity between periods. During the nine months ended September 30, 2020, proceeds from the sale of $194.0 million of servicing rights totaled $6.0 million, compared to sales of $9.3 billion in servicing rights with proceeds totaling $161.9 million. Also contributing to the decrease in new cash flows provided by investing activities was a $9.8 million increase in purchases of property and equipment to $19.6 million for the nine months ended September 30, 2020.
During the year ended December 31, 2019, net cash flows provided by investing activities was $141.1 million, compared to $503.1 million during the year ended December 31, 2018. The $362.0 million decrease in net cash flows provided by investing activities during the year ended December 31, 2019 was primarily driven by lower servicing rights sales activity between periods. During the year ended December 31, 2019, proceeds from the sale of $12.5 billion of servicing rights totaled $153.5 million, compared to sales of $34.8 billion in servicing rights with proceeds totaling $425.2 million. Additionally, a $118.7 million reduction in proceeds from payments and sales of consumer loans contributed to the decrease in net cash flows provided by investing activities between periods. Partially offsetting the decrease was a $28.2 million decrease in purchases of property and equipment to $12.6 million as compared to $40.8 million for the prior period.
During the year ended December 31, 2018, net cash flows provided by investing activities was $503.1 million, compared to $123.0 million used in investing activities during the year ended December 31,
132
Table of Contents
2017. The $626.1 million increase in net cash flows provided by investing activities during the year ended December 31, 2018 was primarily driven by higher servicing rights sales activity between periods. During the year ended December 31, 2018, proceeds from the sale of $34.8 billion of servicing rights totaled $425.2 million, compared to sales of $8.0 billion in servicing rights with proceeds totaling $86.5 million. Additionally, there was a $118.7 million increase in proceeds from principal payments and sales of consumer loans, a $118.7 million decrease in purchases of consumer loans and a $50.5 million reduction in payments made to employees for loans to zero during the year ended December 31, 2018.
Financing Activities
During the nine months ended September 30, 2020, cash provided by financing activities was $1.0 billion, compared to $756.6 million during the nine months ended September 30, 2019. The $265.3 million increase in cash provided by financing activities during the nine months ended September 30, 2020 was primarily driven by a $360.6 million increase in net proceeds on Warehouse Lines and $121.2 million increase in net proceeds from debt obligations, net of issuance costs paid and repayments, partially offset by a $151.8 million increase in dividends and distributions, a $12.3 million increase in payments for contingent consideration, $38.4 million paid to redeem Class I Common Units and a $6.0 million increase in payments on financing lease obligations.
During the year ended December 31, 2019, cash provided by financing activities was $1.4 billion, compared to $56.9 million used in financing activities during the year ended December 31, 2018. The $1.4 billion increase in cash provided by financing activities during the year ended December 31, 2019 was primarily driven by a $1.5 billion increase in net proceeds from borrowings on Warehouse Lines, partially offset by a $33.6 million decrease in proceeds, net of issuance costs and repayments on debt obligations, an $18.7 million decrease in proceeds from financing lease transactions and a $4.3 million increase in payments on financing lease obligations.
During the year ended December 31, 2018, cash used in financing activities was $56.9 million, compared to $587.6 million provided by financing activities during the year ended December 31, 2017. The $644.5 million decrease in cash provided financing activities during the year ended December 31, 2018 was primarily driven by a $485.3 million decrease in net proceeds from borrowings on Warehouse Lines, a $224.2 million decrease in proceeds from debt obligations, net of issuance costs and repayments, and a $3.7 million increase in payments on financing lease obligations. Offsetting these uses of cash was a $26.5 million increase in proceeds from financing lease transactions, a $7.1 million decrease in distributions to noncontrolling interests and a $31.0 million decrease in dividend distributions.
Warehouse Lines
We finance most of our loan originations on a short-term basis using our Warehouse Lines. Under our Warehouse Lines, we agree to transfer certain loans to our counterparties against the transfer of funds by them, with a simultaneous agreement by the counterparties to transfer the loans back to us at the date loans are sold, or on demand by us, against the transfer of funds from us. We typically repurchase the loans within 10 to 15 days of funding. Our Warehouse Lines are short-term borrowings which mature in less than one year with the exception of our securitization facilities which have terms of two years. We utilize both committed and uncommitted loan funding facilities and we evaluate our needs under these facilities based on forecasted volume of loan originations and sales.
As of September 30, 2020, we had $5.5 billion of capacity under our Warehouse Lines with maturities staggered throughout 2020 and 2021. As of September 30, 2020, we maintained Warehouse Lines with thirteen counterparties. As of September 30, 2020, we had $4.6 billion of borrowings outstanding under these facilities and $878.9 million of additional availability under our facilities.
When we draw on the Warehouse Lines, we must pledge eligible loan collateral and make a capital investment, or “haircut,” upon financing the loans, which is generally determined by the type of collateral
133
Table of Contents
provided and the warehouse line terms. Our Warehouse Line providers require a haircut based on product types and the market value of the loans. The haircuts are normally recovered from sales proceeds. With the expected future increase in loan origination volumes, we will be required to use additional capital for haircuts and increase our restricted cash balances with our warehouse lenders. As of September 30, 2020, we had $6.2 million in restricted cash posted as additional collateral with our warehouse lenders, as compared to $4.4 million as of December 31, 2019. Additionally, as of September 30, 2020, we had $41.0 million in restricted cash posted as additional collateral for our securitization facilities, as compared to zero as of December 31, 2019
The table below summarizes our Warehouse Lines and their expiration dates as of September 30, 2020:
| Outstanding Balance | ||||||||||||||||||||||||||||
| (Dollars in thousands) |
Committed Amount |
Uncommitted Amount |
Total Facility Amount |
Expiration Date |
September 30, 2020 |
December 31, 2019 |
December 31, 2018 |
|||||||||||||||||||||
| Facility 1(1) |
$ | 1,000,000 | $ | — | $ | 1,000,000 | 10/30/2020 | $ | 1,138,019 | $ | 637,148 | $ | 193,436 | |||||||||||||||
| Facility 2(2) |
— | 600,000 | 600,000 | 9/27/2021 | 459,655 | 308,890 | 165,831 | |||||||||||||||||||||
| Facility 3 |
— | 225,000 | 225,000 | 4/20/2021 | 139,338 | 124,646 | 124,217 | |||||||||||||||||||||
| Facility 4(3) |
— | 400,000 | 400,000 | 7/9/2021 | 334,732 | 166,090 | 107,285 | |||||||||||||||||||||
| Facility 5 |
— | 340,000 | 340,000 | 1/6/2021 | 260,113 | 239,541 | 217,316 | |||||||||||||||||||||
| Facility 6(4) |
— | 200,000 | 200,000 | N/A | 1,396 | 668 | 35,738 | |||||||||||||||||||||
| Facility 7(5) |
100,000 | 500,000 | 600,000 | 10/31/2020 | 500,806 | 458,115 | 231,910 | |||||||||||||||||||||
| Facility 8(6) |
— | 500,000 | 500,000 | 5/5/2021 | 482,366 | 599,396 | 231,309 | |||||||||||||||||||||
| Facility 9(7) |
200,000 | — | 200,000 | 10/25/2020 | 200,000 | 197,874 | — | |||||||||||||||||||||
| Facility 10(8) |
300,000 | — | 300,000 | 5/14/2021 | 300,000 | 295,244 | — | |||||||||||||||||||||
| Facility 11(8) |
300,000 | — | 300,000 | 10/23/2021 | 300,000 | 295,043 | 285,000 | |||||||||||||||||||||
| Facility 12 |
— | 500,000 | 500,000 | N/A | 257,426 | 143,912 | 300,000 | |||||||||||||||||||||
| Facility 13(9) |
— | 350,000 | 350,000 | 8/25/2021 | 227,211 | — | — | |||||||||||||||||||||
| Facility 14(10) |
— | — | — | N/A | — | — | 200,538 | |||||||||||||||||||||
| Facility 15(11) |
— | — | — | N/A | — | — | 34,060 | |||||||||||||||||||||
|
|
|
|
|
|
|
|
|
|
|
|
|
|||||||||||||||||
| Total |
$ | 1,900,000 | $ | 3,615,000 | $ | 5,515,000 | $ | 4,601,062 | $ | 3,466,567 | $ | 2,126,640 | ||||||||||||||||
|
|
|
|
|
|
|
|
|
|
|
|
|
|||||||||||||||||
| (1) | The total facility is available both to fund loan originations and also provide liquidity under a gestation facility to finance recently sold MBS up to the MBS settlement date. In October 2020, the expiration date was extended to October 2021. At September 30, 2020, we received a temporary approval to borrow in excess of the total facility amount. |
| (2) | In addition to the $600.0 million Warehouse Line, the lender provides a separate gestation facility to finance recently sold MBS up to the MBS settlement date. |
| (3) | In addition to the $334.7 million outstanding balance secured by mortgage loans, the Company has $20.0 million outstanding to finance servicing rights included within debt obligations in the consolidated balance sheets. |
| (4) | In addition to the $200.0 million Warehouse Line, the lender provides a separate gestation facility to finance recently sold MBS up to the MBS settlement date. |
| (5) | In addition to the $600.0 million Warehouse Line, the lender provides a separate gestation facility to finance recently sold MBS up to the MBS settlement date. In October 2020, the expiration date was extended to October 2021. In November 2020, this facility was increased to $800.0 million. |
| (6) | In December 2020, this facility was increased to $1.5 billion. In addition to the $482.4 million outstanding balance secured by mortgage loans, the Company has $15.0 million outstanding to finance servicing rights included within debt obligations in the consolidated balance sheets. |
| (7) | Securitization backed by a revolving warehouse facility to finance newly originated first-lien fixed rate mortgage loans. In October 2020, the Company paid off this facility. |
| (8) | Securitization backed by a revolving warehouse facility to finance newly originated first-lien fixed and adjustable rate mortgage loans. |
134
Table of Contents
| (9) | This facility is available both to fund loan originations and also provide gestation liquidity to finance recently sold MBS up to the MBS settlement date. |
| (10) | In December 2019, the facility was paid-off and subsequently canceled at the Company’s request. |
| (11) | The facility was used to finance consumer loans. The facility expired and all collateral cash flows were used to pay interest and remaining principal outstanding. |
Interest on our Warehouse Lines varies by facility and depends on the type of loan that is being financed or the period of time that a loan is transferred to our warehouse line counterparty. As of September 30, 2020, interest expense under our Warehouse Lines was generally based on 30-day LIBOR plus a margin and in some cases a minimum interest rate and certain commitment and utilization fees apply.
Under our Warehouse Lines, interest is payable monthly in arrears or on the repurchase date of a loan, and outstanding principal is payable upon receipt of loan sale proceeds or on the repurchase date of a loan. Outstanding principal related to a particular loan must also be repaid after the expiration of a contractual period of time or, if applicable, upon the occurrence of certain events of default with respect to the underlying loan.
Our Warehouse Lines require us to comply with various financial covenants including tangible net worth, liquidity, leverage ratios and net income. As of September 30, 2020, we were in compliance with all of our warehouse lending covenants.
Although these financial covenants limit the amount of indebtedness that we may incur and affect our liquidity through minimum cash reserve requirements, we believe that these covenants currently provide us with sufficient flexibility to successfully operate our business and obtain the financing necessary to achieve that purpose.
Debt Obligations
Secured Credit Facilities
Original Secured Credit Facility. We entered into a $25.0 million revolving secured credit facility (the “Original Secured Credit Facility”) in October 2014 to finance servicing rights and for other working capital needs and general corporate purposes. We entered into subsequent amendments with the lender both increasing and decreasing the size of the facility. At September 30, 2020, capacity under the facility was $150.0 million. The Original Secured Credit Facility is secured by servicing rights, matures in June 2021 and accrues interest at a base rate per annum of 30-day LIBOR plus a margin per annum. As of September 30, 2020, the outstanding balance under the Original Secured Credit Facility was $150.0 million. We have pledged $274.0 million in fair value of servicing rights as collateral to secure outstanding advances under the Original Secured Credit Facility. Advances for servicing rights are determined using a borrowing base formula calculated against the fair market value of the pledged servicing rights. Under the Original Secured Credit Facility, we are required to satisfy certain financial covenants, including minimum tangible net worth, minimum liquidity, maximum leverage and debt service coverage. As of September 30, 2020, we were in compliance with all such covenants.
Second Secured Credit Facility. We amended one of its Warehouse Line facilities to provide a $50.0 million sub-limit to finance servicing rights and for other working capital needs and general corporate purposes (the “Second Secured Credit Facility”) in May 2015. As of September 30, 2020, total capacity under the Warehouse Line facility was $400.0 million and is available to fund a combination of loans and servicing rights, subject to a $100.0 million sub-limit to finance servicing rights. As of September 30, 2020, $20.0 million was outstanding under the Second Secured Credit Facility. We have pledged $217.0 million in fair value of servicing rights as collateral to secure outstanding advances related to the sub-limit. Advances for servicing rights are determined using a borrowing base formula calculated against the fair market value of the pledged servicing rights. In July 2020, the Second Secured Credit Facility was increased to $100.0 million and the maturity date was extended to July 2021. The Second Secured Credit Facility accrues interest at a base rate per annum of 30-day LIBOR plus a
135
Table of Contents
margin per annum. If the Second Secured Credit Facility is not renewed or extended at the expiration date, we have the option to convert the outstanding principal balance to a term loan that accrues interest at a base rate per annum of 30-day LIBOR plus 5.75% and is due two years from the conversion date (“Term Loan”). The Term Loan requires monthly principal and interest payments based on a five year amortization period. Under the Second Secured Credit Facility, we are required to satisfy certain financial covenants, including minimum tangible net worth, minimum liquidity, maximum leverage and profitability requirements. As of September 30, 2020, we were in compliance with all such covenants.
GMSR Trust. We entered into a master repurchase agreement with one of our wholly-owned subsidiaries, loanDepot GMSR Master Trust (“GMSR Trust”) in August 2017 to finance Ginnie Mae mortgage servicing rights (the “GNMA MSRs”) owned by us (the “GNMA MSR Facility”) pursuant to the terms of a base indenture (the “GNMA MSR Indenture”). We pledged participation certificates representing beneficial interests in GNMA MSRs to the GMSR Trust. We are party to an acknowledgment agreement with Ginnie Mae whereby we may, from time to time pursuant to the terms of any supplemental indenture, issue to institutional investors variable funding notes or one or more series of term notes, in each case secured by the participation certificates relating to the GNMA MSRs held by the GMSR Trust.
GMSR VFN. In August 2017, we, through the GMSR Trust, issued a variable funding note (the “GMSR VFN”) in the initial amount of $65.0 million. The maximum amount of the GMSR VFN is $150.0 million. The GMSR VFN is secured by GNMA MSRs and bears interest at 30-day LIBOR plus a margin per annum. We amended the GMSR VFN in September 2018 to amend certain terms and extend the maturity date to September 2020. We amended the GMSR VFN to extend the maturity date to October 2021. At September 30, 2020, there was $15.0 million in GMSR VFN outstanding. Under this facility, we are required to satisfy certain financial covenants. As of September 30, 2020, we were in compliance with all such covenants.
GMSR Term Notes. In November 2017, we, through the GMSR Trust, issued an aggregate principal amount of $110.0 million in secured term notes (the “GMSR Term Notes”). The GMSR Term Notes were secured by certain participation certificates relating to GNMA MSRs pursuant to the GNMA MSR Facility. In October 2018, the GMSR Trust was amended and restated for the purpose of issuing the Series 2018-GT1 Term Notes (“Term Notes”). The Term Notes accrue interest at 30-day LIBOR plus a margin per annum and mature in October 2023 or, if extended pursuant to the terms of the related indenture supplement, October 2025 (unless earlier redeemed in accordance with their terms). We issued $200.0 million in Term Notes and used the proceeds to pay off $110.0 million in outstanding GMSR Term Notes. At September 30, 2020, there was $198.5 million in Term Notes outstanding, net of $1.5 million in deferred financing costs. Under this facility, we are required to satisfy certain financial covenants. As of September 30, 2020, we were in compliance with all such covenants.
Advance Receivables Trust. In September 2020, through our indirect-wholly owned subsidiary loanDepot Agency Advance Receivables Trust (the “Advance Receivables Trust”), we entered into a variable funding note facility for the financing of servicing advance receivables with respect to residential mortgage loans serviced by us on behalf of Fannie Mae and Freddie Mac. Pursuant to an indenture, the Advance Receivables Trust issued up to $130.0 million in variable funding notes (the “2020-VF1 Notes”). The 2020-VF1 Notes accrue interest at 30-day LIBOR plus a margin per annum and mature in September 2021 (unless earlier redeemed in accordance with their terms). The 2020-VF1 Notes are secured by loanDepot.com, LLC’s rights to reimbursement for advances made pursuant to Fannie Mae and Freddie Mac requirements. There were no borrowings under the Advance Receivables Trust as of September 30, 2020. Under this facility, we are required to satisfy certain financial covenants including minimum levels of tangible net worth and liquidity and maximum levels of consolidated leverage. As of September 30, 2020, we were in compliance with all such covenants
Unsecured Term Loan
In August 2017, we entered into an agreement which refinanced a $150.0 million unsecured term loan facility (the “Unsecured Term Loan”), increasing the balance to $250.0 million which matures in August 2022
136
Table of Contents
and accrues interest at a rate of 30-day LIBOR plus a margin per annum. As of September 30, 2020, $248.8 million was outstanding under the Unsecured Term Loan, net of $1.2 million in deferred financing cost. We use amounts borrowed under the Unsecured Term Loan for working capital needs and general corporate purposes. Under the Unsecured Term Loan, we are required to satisfy certain financial covenants, including minimum tangible net worth, maximum leverage, and minimum cash balance. As of September 30, 2020, we were in compliance with all such covenants. Interest expense from this credit agreement is recorded to other interest expense. We may prepay the loan in any amount subsequent to the second anniversary, however, a prepayment premium will apply to the principal prepaid from the second to the fourth anniversary of the loan’s closing. This prepayment premium may be waived under certain circumstances. The Unsecured Term Loan was repaid in October 2020.
Convertible Debt
In August 2019, we entered into an agreement for a convertible debt facility of $50.0 million (the “Convertible Debt”) secured by our LLC interests in our subsidiaries and all the assets thereof. The Convertible Debt matures in August 2022 and accrues interest at a rate of 14.00% per annum prior to the second anniversary and at a rate of 16.00% per annum thereafter. In March 2020, we entered into an amendment to increase the Convertible Debt to $75.0 million. We use amounts borrowed under the Convertible Debt for working capital needs and general corporate purposes. We may prepay the Convertible Debt at any time prior to the maturity date. As of September 30, 2020, $74.8 million was outstanding under the Convertible Debt, net of $0.2 million in deferred financing costs. The Convertible Debt is convertible into the Company’s equity securities concurrently with the closing of a qualified equity financing transaction or during the 90 day period following the stated maturity date. The right to convert is forfeited if the outstanding balance is paid in full before the qualified equity finance transaction or the stated maturity date. Under the Convertible Debt agreement, we are required to satisfy certain financial covenants including minimum levels of tangible net worth and liquidity and maximum levels of consolidated leverage on a monthly basis. As of September 30, 2020, we were in compliance with all such covenants. The Convertible Debt was repaid in October 2020.
Senior Notes
In October 2020, we issued $500.0 million in aggregate principal amount of 6.50% senior unsecured notes due 2025 (the “Senior Notes”). The Senior Notes will mature on November 1, 2025. Interest on the Senior Notes accrues at a rate of 6.50% per annum, payable semi-annually in arrears on May 1 and November 1 of each year. At any time prior to November 1, 2022, we may redeem some or all of the Senior Notes at a price equal to 100% of the principal amount of the Senior Notes, plus accrued and unpaid interest, if any, to, but not including, the date of redemption plus a make-whole premium. We may also redeem the Senior Notes at our option, in whole or in part, at any time on or after November 1, 2022 at various redemption prices. In addition, subject to certain conditions at any time prior to November 1, 2022, we may redeem up to 40% of the principal amount of the Senior Notes with the proceeds of certain equity offerings at a redemption price of 106.50% of the principal amount of the Senior Notes, together with accrued and unpaid interest, if any, to, but not including, the date of redemption.
Financing Lease Transactions
We lease certain equipment under agreements that are classified as financing leases. The cost of equipment under financing leases, net of accumulated amortization, is included in property and equipment, net in our consolidated balance sheets. Financing lease obligations have lease terms which are one to five years at an effective interest rate generally between 2.79% and 10.50%. The transactions have been accounted for as financing arrangements, wherein the property remains on our books and continues to be depreciated. We have the option to purchase the leased equipment at the end of the leases.
Interest expense incurred on financing leases during the nine months ended September 30, 2020 and 2019 was $0.6 million and $0.9 million, respectively, and is included in other interest expense in the consolidated
137
Table of Contents
statements of operations. At September 30, 2020, we decreased our financing lease obligations to $18.3 million as compared to $33.8 million at December 31, 2019.
Margin Calls
Our Warehouse Lines, secured credit facilities, and certain derivative financial instruments contain margin call provisions that, under specific market conditions and terms, require us to transfer cash or, in some instances, additional assets in an amount sufficient to eliminate any margin deficit. Under our Warehouse Lines, secured credit facilities and certain derivative financial instruments, a margin deficit will generally result from any decline in the market value (as determined by the applicable lender) of the assets subject to the related financing agreement. Upon notice from the applicable lender, we will generally be required to satisfy the margin call on the day of such notice or within one business day thereafter, depending on the timing of the notice.
Contractual Obligations and Commitments
Our estimated contractual obligations as of September 30, 2020 are as follows:
| Payments Due by Period(1) | ||||||||||||||||||||
| (Dollars in thousands) |
Total | Less than 1 Year |
1-3 years | 3-5 Years | More than 5 Years |
|||||||||||||||
| Warehouse lines |
$ | 4,601,062 | $ | 4,301,602 | $ | 300,000 | $ | — | $ | — | ||||||||||
| Secured credit facilities |
385,000 | 170,000 | 15,000 | 200,000 | — | |||||||||||||||
| Unsecured term loan |
250,000 | — | 250,000 | — | — | |||||||||||||||
| Convertible debt |
75,000 | — | 75,000 | — | — | |||||||||||||||
| Operating lease obligations(2) |
81,736 | 29,006 | 37,611 | 15,098 | 21 | |||||||||||||||
| Financing lease obligations(3) |
18,483 | 13,678 | 4,805 | — | — | |||||||||||||||
|
|
|
|
|
|
|
|
|
|
|
|||||||||||
| Total contractual obligations |
$ | 5,411,281 | $ | 4,513,746 | $ | 682,416 | $ | 215,098 | $ | 21 | ||||||||||
|
|
|
|
|
|
|
|
|
|
|
|||||||||||
| (1) | Table does not include contingent consideration associated with the acquisition of Mortgage Master in January 2015, which in September 2020, the Company entered into an agreement to settle the contingent consideration liability for $32.4 million comprised of payments of $10.8 million in September 2020 and $21.6 million in October 2020. |
| (2) | Represents lease obligations for office space under non-cancelable operation lease agreements. |
| (3) | Represents lease obligations for equipment under non-cancelable financing lease agreements. |
In addition to the above contractual obligations, we also had commitments to originate loans of $30.4 billion as of September 30, 2020. Commitments to originate loans do not necessarily reflect future cash requirements as some commitments are expected to expire without being drawn upon and, therefore, those commitments have been excluded from the table above.
Off-Balance Sheet Arrangements
As of September 30, 2020, we were party to mortgage loan participation purchase and sale agreements, pursuant to which we have access to uncommitted facilities that provide liquidity for recently sold MBS up to the MBS settlement date. These facilities, which we refer to as gestation facilities, are a component of our financing strategy and are off-balance sheet arrangements.
Critical Accounting Policies and Estimates
We prepare our consolidated financial statements in accordance with GAAP, which requires us to make judgments, estimates and assumptions that affect: (i) the reported amounts of our assets and liabilities; (ii) the
138
Table of Contents
disclosure of our contingent assets and liabilities at the end of each reporting period; and (iii) the reported amounts of revenues and expenses during each reporting period. We continually evaluate these judgments, estimates and assumptions based on our own historical experience, knowledge and assessment of current business and other conditions and our expectations regarding the future based on available information which together form our basis for making judgments about matters that are not readily apparent from other sources. Since the use of estimates is an integral component of the financial reporting process, our actual results could differ from those estimates. Some of our accounting policies require a higher degree of judgment than others in their application.
When reading our consolidated financial statements, you should consider our selection of critical accounting policies, the judgment and other uncertainties affecting the application of such policies and the sensitivity of reported results to changes in conditions and assumptions. We believe the following accounting policies involve the most significant judgments and estimates used in the preparation of our consolidated financial statements.
Loans Held for Sale
Loans that are intended to be sold in the foreseeable future, including residential mortgage loans, are reported as LHFS. We account for LHFS under the fair value option. Fair value of LHFS is typically calculated using observable market information, including pricing from actual market transactions or observable market prices from other loans that have similar collateral, credit, and interest rate characteristics. Gains or losses from the sale of loans are recognized based upon the difference between the selling price and fair value of the related loans upon the sale of such loans.
In order to facilitate the origination and sale of loans, we have entered into various agreements with warehouse lenders. These agreements are in the form of loan participations and repurchase agreements with banks and other financial institutions. LHFS are considered sold when we surrender control over the financial assets and those financial assets are legally isolated from us in the event of our bankruptcy. We account for all repurchase agreements as secured borrowings.
Servicing Rights
Servicing rights are assets that are created when the loan is sold and we retain the right to service the loan. Servicing of loans includes payment processing, remittance of funds to investors, collection of delinquent payments, and, in the case of mortgage loans, payment of taxes and insurance and disposition of foreclosed properties. In return for these services, we receive servicing fee income and ancillary fee income. The servicing rights are initially recorded at fair value, which is estimated by using a valuation model that calculates the present value of estimated future net servicing cash flows. The valuation model incorporates assumptions that market participants would use in estimating future net servicing income, including estimates of the cost of servicing, the discount rate, the float value, the inflation rate, estimated prepayment speeds and default rates. We use a dynamic model to estimate the fair value of our servicing rights.
We have elected to account for the measurement of servicing rights using the fair value method, whereby the servicing rights are initially recorded on our balance sheet at fair value with subsequent changes in fair value recorded in earnings during the period in which the changes in fair value occur. We believe that accounting for servicing rights at fair value best reflects the impact of current market conditions on our servicing rights, and our investors and other users of our financial statements will have greater insight into management’s views as to the value of our servicing rights at each reporting date. The fair value of the servicing rights is assessed at each reporting date using the methods described above.
Fair Value of Financial Instruments
We use fair value measurements in fair value disclosures and to record certain assets and liabilities at fair value on a recurring basis (such as servicing rights, IRLCs, LHFS and Hedging Instruments). We have elected
139
Table of Contents
fair value accounting for servicing rights and LHFS, as permitted under current accounting guidance, to more closely align our accounting with our interest rate risk management strategies.
When observable market prices do not exist for our financial instruments, we estimate fair value primarily by using cash flow and other valuation models. Our valuation models may include adjustments, such as market liquidity and credit quality, where appropriate. Valuations of products using models or other techniques are sensitive to assumptions used for the significant inputs. The process for determining fair value using unobservable inputs, such as discount rates, prepayment speeds, default rates and cost of servicing, is generally more subjective and involves a higher degree of management judgment and assumptions than the measurement of fair value using observable inputs. These judgments and assumptions may have a significant effect on our measurements of fair value, and the use of different judgments and assumptions, as well as changes in market conditions, could have a material effect on our statements of operations as well as our balance sheets.
Loan Repurchase Reserve
Loans sold to investors by us and which met investor and Agency underwriting guidelines at the time of sale may be subject to repurchase or indemnification in the event of specific default by the borrower or subsequent discovery that underwriting standards were not met. In limited circumstances, the full risk of loss on loans sold is retained to the extent the liquidation of the underlying collateral is insufficient.
We establish a reserve for loan repurchases and indemnifications related to various representations and warranties that reflect management’s estimate of losses for loans for which we could have a repurchase obligation, whether or not we currently service those loans, based on a combination of factors. Such factors include the type of loan, the channel from which it came, LTV and other loan-related specifics. The process for determining the measurement of the liability involves certain unobservable inputs such as estimated repurchase demand and repurchases, and loss severity and is generally subjective and involves a high degree of management judgment and assumptions. These judgments and assumptions may have a significant effect on our measurements of the liability, and the use of different judgments and assumptions, as well as changes in market conditions, could have a material effect on our statements of operations as well as our balance sheets.
Derivative Financial Instruments
We enter into derivative instruments to serve the financial needs of our customers and to reduce our risk exposure to fluctuations in interest rates. For example, we enter into IRLCs with certain customers to originate residential mortgage loans at specified interest rates and within a specified period of time. IRLCs on loans that are intended to be sold are accounted for as derivatives, with changes in fair value recorded in the consolidated statement of operations as part of gain on origination and sale of loans, net. The fair value of an IRLC is based upon changes in the fair value of the underlying loans estimated to be realizable upon sale into the secondary market. In estimating the fair value of an IRLC, we also adjust the fair value of the underlying loan to reflect the estimated percentage of commitments that will result in a closed loan; our estimate of this percentage will primarily vary based on the age of the underlying commitment, the underlying loan’s current status in the origination process and changes in loan interest rates.
The primary factor influencing the probability that a loan will fund within the terms of the IRLC, prior to a loan package being submitted to underwriting, is the change, if any, in interest rates subsequent to the commitment date. In general, the probability of funding increases if interest rates rise and decreases if interest rates fall. This is due primarily to the relative attractiveness of current interest rates compared to the applicant’s committed rate. Once a loan package is submitted to underwriting, the current status of the loan in the origination process is the primary factor influencing the probability that a loan will fund within the terms of the IRLC. Additionally, the probability that a loan will fund within the terms of the IRLC is influenced by the source of the application, age of the application, purpose of the loan (purchase or non-purchase) and the application approval rate.
140
Table of Contents
We manage the interest rate risk associated with our outstanding IRLCs and LHFS by entering into derivative financial instruments. For exchange-traded contracts, fair value is based on quoted market prices. For non-exchange traded contracts, fair value is based on dealer quotes, pricing models, and discounted cash flow methodologies. Fair value estimates also take into account counterparty credit risk and our own credit standing.
Equity-Based Compensation
The Company’s 2009 Incentive Equity Plan, 2012 Incentive Equity Plan, and 2015 Incentive Equity Plan (collectively, the “Plans”) provide for awards of various classes of Common Units, as described in the Plans. The Company uses the grant-date fair value of equity awards to determine the compensation cost associated with each award. Grant-date fair value is determined using the Black-Scholes pricing model adjusted for unique characteristics of the specific awards. Compensation cost for service-based equity awards is recognized on a straight-line basis over the requisite service period, which is generally the vesting period. Compensation cost for awards with only service conditions that have graded vesting schedules is recognized on a straight-line basis over the requisite service period for the entire award such that compensation cost recognized at any date is at least equal to the portion of the grant-date value of the award that is vested at that date. Expense is reduced for actual forfeitures as they occur. The cost of equity-based compensation is recorded to personnel expense.
LD Holdings granted 1,227,342,174 Class X common units during the nine months ended September 30, 2020. In connection with the modification of Class V Units for Class X Units (see Note 14 – Equity-Based Compensation to the unaudited consolidated financial statements of LD Holdings appearing elsewhere in this prospectus), during the nine months ended September 30, 2020, LD Holdings recognized $6.4 million in share-based compensation expense based on the market value of the units at the modification date. Total share-based compensation expense for the nine months ended September 30, 2020 was $7.7 million. Historically for all periods prior to our initial public offering, given the absence of a public trading market for our common units, and in accordance with the American Institute of Certified Public Accountants Practice Guide, Valuation of Privately-Held-Company Equity Securities Issued as Compensation, or AICPA Guide, we exercised reasonable judgment and considered numerous objective and subjective factors to determine the best estimate of the fair value of our common units including:
| • | contemporaneous valuations performed by unrelated third-party specialists; |
| • | our actual operating and financial performance; |
| • | relevant precedent transactions involving our common equity; |
| • | likelihood of achieving a liquidity event, such as an initial public offering or a sale of our company given prevailing market conditions and the nature and history of our business; |
| • | market multiples of comparable companies in our industry; |
| • | stage of development; |
| • | industry information such as market size and growth; |
| • | illiquidity of stock-based awards involving securities in a private company; and |
| • | macroeconomic conditions, including the economic impacts of COVID-19 and the severe dislocation in the mortgage industry during the first half of 2020. |
In valuing our Class X common units prior to our initial public offering, we determined the fair value of equity of our Company using both the income approach and market approach valuation methods. The income approach estimates value was based on the expectation of future cash flows that a company will generate based on the information available at that time. These future cash flows are discounted to their present values using a discount rate based on the cost of capital. The market approach estimates value based on a comparison of the subject company to comparable public companies in a similar line of business. From the comparable companies, a representative market value multiple is determined and then applied to the subject company’s financial results
141
Table of Contents
to estimate the fair value of equity of the subject company. The resulting fair value is then applied to our equity waterfall to determine an implied fair value of the Class X common units. A discount for lack of marketability was also applied to the unit fair value.
Application of these valuation approaches involves the use of estimates, judgment, and assumptions that are highly complex and subjective, such as those regarding our expected future revenue, expenses and future cash flows, discount rates, market multiples, the selection of comparable companies, and the probability of possible future events. Changes in any or all of these estimates and assumptions or the relationships between those assumptions impact our valuations as of each valuation date and may have a material impact on the valuation of our common units.
The Company obtains third-party valuation reports to support the grant-date fair value of equity awards issued. The valuations are performed as close to the grant dates as practicable. The grant date fair value of an equity award is based on the fair value of equity determined in the third-party valuation, which is then used to determine the value of one membership unit of the applicable class under the Company’s LLC agreement at the time of the grant. Application of the valuation approaches to determine the fair value of our equity as a private company involve the use of estimates, judgment, and assumptions that are highly complex and subjective, such as those regarding our expected future revenue, expenses and cash flows along with discount rates, marketability discounts, the selection of peer comparable company market multiples and the probability of possible future events. Changes in any or all of these estimates and assumptions or the relationships between those assumptions impact our valuations as of each valuation date and may have a material impact on the valuation of our common units.
On June 5, 2020, we granted 1,227,342,174 Class X Units at a fair value of $0.0167 per unit, which was calculated based on a fair value of equity of $548 million determined by a third-party valuation. The valuation performed was based on the Company being privately-held and utilized the assumptions noted above, including our forecasted income for an ongoing period based on the best information available to management at the time. At the grant date, there was significant volatility in our business, mortgage markets and the broader economy as the impacts of the Covid-19 pandemic were still being evaluated and assessed. Since this valuation was completed, we have experienced significant growth in loan originations, margins and comparable peer company market multiples as well as suppressed operating expense levels and efficiencies and normalization of our remote workforce.
The forecasted financial performance and assumptions that would be used in a valuation of our equity using the same method would be significantly different today. For example, our forecast of income for the fiscal year 2020 and 2021 would have increased significantly if we had known at the grant date that the forecasted size of the total mortgage market for 2021 would increase by 71% in January 2021 or that the elevated gain on sale margins that we experienced in April and May 2020 would be sustained through the third quarter of 2020 and normalize at something higher than historical levels during the fourth quarter of 2020 and into 2021. Additionally, the expansion of our comparable peer companies in the public market and the increased levels at which those companies are trading at today, has significantly increased the market multiples that would be used in a valuation of our equity today as compared to June 5, 2020. All of these changes in forecasts and assumptions have resulted in a higher fair value of equity and thus, a significant increase in the value of one Class X Unit. Using the conversion ratios outlined in Reorganization Transactions at LD Holdings on page 81, the value of one Class X unit would be $0.68 as compared to $0.01627 at June 5, 2020.
If we were to recognize a higher total equity valuation at the initial valuation date, the Company may have recognized incremental compensation expense related to the grant of the Class X Units. For example, if there was a $0.01 incremental increase in the fair value of a Class X Unit, we would have expected to recognize $4.7 million of additional compensation expense.
142
Table of Contents
Recent Accounting Pronouncements
Refer to Note 2 – Recent Accounting Pronouncements to the consolidated financial statements included elsewhere in this prospectus for a discussion of recently issued accounting guidance.
Quantitative and Qualitative Disclosures About Market Risk
In the normal course of business, we are exposed to various risks which can affect our business, results and operations. The primary market risks to which we are exposed include interest rate risk, credit risk, prepayment risk and inflation risk.
We manage our interest rate risk and the price risk associated with changes in interest rates pursuant to the terms of an Interest Rate Risk Management Policy which (i) quantifies our interest rate risk exposure, (ii) lists the derivatives eligible for use as Hedging Instruments and (iii) establishes risk and liquidity tolerances.
Interest Rate Risk
Our principal market exposure is to interest rate risk as our business is subject to variability in results of operations due to fluctuations in interest rates. We anticipate that interest rates will remain our primary benchmark for market risk for the foreseeable future. Changes in interest rates affect our assets and liabilities measured at fair value, including LHFS, IRLCs, servicing rights and Hedging Instruments. In a declining interest rate environment, we would expect our results of operations to be positively impacted by higher loan origination volumes and loan margins. However, we would expect our results of operations to be negatively impacted by higher actual and projected loan prepayments related to our loan servicing portfolio and a decrease in the value of our servicing rights. As interest rates decline, our LHFS and IRLCs generally increase in value while our Hedging Instruments utilized to hedge against interest rate risk decrease in value. In a rising interest rate environment, we would expect a negative impact on the results of operations of our production activities and a positive impact on the results of operations of our servicing activities (principally through an increase in the fair value of our servicing rights). As interest rates increase, our LHFS and IRLCs generally decrease in value while our Hedging Instruments typically increase in value. The interaction between the results of operations of our various activities is a core component of our overall interest rate risk strategy. See “—Sensitivity Analysis” for tabular analysis on the impact of changes in interest rates on our financial assets and liabilities measured at fair value.
IRLCs represent an agreement to extend credit to a potential customer, whereby the interest rate on the loan is set prior to funding. Our LHFS, which are held in inventory awaiting sale into the secondary market, and our IRLCs, are subject to changes in interest rates from the date of the commitment through the sale of the loan into the secondary market. Accordingly, we are exposed to interest rate risk and related price risk during the period from the date of the lock commitment through (i) the lock commitment cancellation or expiration date, or (ii) the date of sale into the secondary mortgage market. Loan commitments generally range between 15 and 60 days; and our average holding period of the loan from funding to sale was 14.4 days during the nine months ended September 30, 2020.
We manage the interest rate risk associated with our outstanding IRLCs, LHFS and servicing rights by entering into Hedging Instruments. Management expects these Hedging Instruments will experience changes in fair value opposite to changes in fair value of the IRLCs and LHFS, thereby reducing earnings volatility. We take into account various factors and strategies in determining the portion of IRLCs, LHFS and servicing rights that we want to economically hedge. Our expectation of how many of our IRLCs will ultimately close is a key factor in determining the notional amount of Hedging Instruments used in hedging the position. See “Risk factors—Risks Related to Our Business—Our hedging strategies may not be successful in mitigating our risks associated with changes in interest rates.”
143
Table of Contents
Credit Risk
We are subject to credit risk in connection with our loan sale transactions. While our contracts vary, we provide representations and warranties to purchasers and insurers of the mortgage loans sold that typically are in place for the life of the loan. In the event of a breach of these representations and warranties, we may be required to repurchase a mortgage loan or indemnify the purchaser, and any subsequent loss on the mortgage loan may be borne by us. The representations and warranties require adherence to applicable origination and underwriting guidelines (including those of Fannie Mae, Freddie Mac and Ginnie Mae), including but not limited to the validity of the lien securing the loan, property eligibility, borrower credit, income and asset requirements and compliance with applicable federal, state and local law.
We record a provision for losses relating to such representations and warranties as part of our loan sale transactions. The level of the liability for losses from representations and warranties is difficult to estimate and requires considerable management judgment. The level of loan repurchase losses is dependent on economic factors, trends in property values, investor repurchase demand strategies and other external conditions that may change over the lives of the underlying loans. We evaluate the adequacy of our liability for losses from representations and warranties based on our loss experience and our assessment of incurred losses relating to loans that we have previously sold and which remain outstanding at the balance sheet date. As our portfolio of loans sold subject to representations and warranties grows and as economic fundamentals change, such adjustments can be material. However, we believe that our current estimates adequately approximate the losses incurred on our sold loans subject to such representations and warranties.
Additionally, we are exposed to credit risk associated with our customers from our LHFS as well as credit risks related to our counterparties including our subservicer, Hedging Instrument counterparties and other significant vendors. Our ability to operate profitably is dependent on both our access to capital to finance our assets and our ability to profitably originate, sell and service loans. Our ability to hold loans pending sale and/or securitization depends, in part, on the availability to us of adequate financing lines of credit at suitable interest rates and favorable advance rates.
In general, we manage such risk by selecting only counterparties that we believe to be financially strong, dispersing the risk among multiple counterparties, placing contractual limits on the amount of unsecured credit extended to any single counterparty and entering into netting agreements with the counterparties, as appropriate. During the nine months ended September 30, 2020 and 2019, we incurred no losses due to nonperformance by any of our counterparties.
Prepayment Risk
Prepayment risk is affected by interest rates (and their inherent risk) and borrowers’ actions relative to their underlying loans. To the extent that the actual prepayment speed on the loans underlying our servicing rights differs from what we projected when we initially recognized them and when we measured fair value as of the end of each reporting period, the carrying value of our investment in servicing rights will be affected. In general, an increase in prepayment expectations will decrease our estimates of the fair value of the servicing right, thereby reducing expected servicing income. We monitor the servicing portfolio to identify potential refinancings and the impact that would have on associated servicing rights.
Inflation Risk
Almost all of our assets and liabilities are interest rate sensitive in nature. As a result, interest rates and other factors will influence our performance more than inflation. Changes in interest rates do not necessarily correlate with inflation rates or changes in inflation rates. Additionally, our financial statements are prepared in accordance with GAAP and our activities and balance sheet are measured with reference to historical cost and/or fair value without considering inflation.
144
Table of Contents
Sensitivity Analysis
Our total market risk is influenced by various factors including market volatility and the liquidity of capital markets. There are certain limitations inherent in the sensitivity analysis presented, including (i) the necessity to conduct the analysis based on a single point in time, (ii) the inability to include or fully anticipate the complex market reactions that normally would arise from the market shifts modeled, (iii) the accuracy of various models and assumptions used, including prepayment forecasts and discount rates and (iv) the inability to include other factors that would affect our overall financial performance in such scenarios, including operational adjustments made by management to account for changing circumstances.
We used September 30, 2020 market rates on our instruments to perform the sensitivity analysis on our financial assets and liabilities measured at fair value. The interest rate sensitivity analysis assumes instantaneous, parallel shifts in interest rate yield curves. These sensitivities are hypothetical and presented for illustrative purposes only. Changes in fair value based on variations in assumptions generally cannot be extrapolated because the relationship of the change in fair value may not be linear.
The following tables summarize the estimated change in fair value of our financial assets and liabilities measured at fair value as of September 30, 2020, given hypothetical parallel shifts in interest rates:
| As of September 30, 2020 | ||||||||||||||||||||||||||||
| Shift in interest rates |
Down 75 bps |
Down 50 bps |
Down 25 bps |
0 | Up 25 bps |
Up 50 bps |
Up 75 bps |
|||||||||||||||||||||
| ($ in thousands) | ||||||||||||||||||||||||||||
| Fair value: |
||||||||||||||||||||||||||||
| IRLCs |
$ | 1,179,808 | $ | 1,081,032 | $ | 946,879 | $ | 721,658 | $ | 557,665 | $ | 291,205 | $ | (19,374 | ) | |||||||||||||
| LHFS |
4,966,784 | 4,946,403 | 4,920,154 | 4,888,364 | 4,848,138 | 4,800,878 | 4,747,931 | |||||||||||||||||||||
|
|
|
|
|
|
|
|
|
|
|
|
|
|
|
|||||||||||||||
| Servicing rights |
661,105 | 687,517 | 732,992 | 776,993 | 820,339 | 858,601 | 892,543 | |||||||||||||||||||||
| Derivative assets and liabilities (excluding IRLCs) |
(336,078 | ) | (266,591 | ) | (175,803 | ) | (58,941 | ) | 112,613 | 342,372 | 599,058 | |||||||||||||||||
|
|
|
|
|
|
|
|
|
|
|
|
|
|
|
|||||||||||||||
| Total |
$ | 6,471,619 | $ | 6,448,361 | $ | 6,424,222 | $ | 6,328,074 | 6,338,755 | $ | 6,293,056 | $ | 6,220,158 | |||||||||||||||
|
|
|
|
|
|
|
|
|
|
|
|
|
|
|
|||||||||||||||
| Change in fair value (%): |
||||||||||||||||||||||||||||
| IRLCs |
63.5 | % | 49.8 | % | 31.2 | % | — | % | (22.7 | )% | (59.6 | )% | (102.7 | )% | ||||||||||||||
| LHFS |
1.6 | 1.2 | 0.7 | — | (0.8 | ) | (1.8 | ) | (2.9 | ) | ||||||||||||||||||
| Servicing rights |
(14.9 | ) | (11.5 | ) | (5.7 | ) | — | 5.6 | 10.5 | 14.9 | ||||||||||||||||||
| Derivative assets and liabilities (excluding IRLCs) |
(470.2 | ) | (352.3 | ) | (198.3 | ) | — | 291.1 | 680.9 | 1116.4 | ||||||||||||||||||
| Total |
2.3 | 1.9 | 1.5 | — | 0.2 | (0.6 | ) | (1.7 | ) | |||||||||||||||||||
145
Table of Contents
Our Company
loanDepot is a customer-centric, technology-empowered residential mortgage platform with a widely recognized consumer brand. We launched our business in 2010 to disrupt the legacy mortgage industry and make obtaining a mortgage a positive experience for consumers. We have built a leading technology platform, designed around the consumer that has redefined the mortgage process. Our digital-first approach has allowed us to become one of the fastest-growing, at-scale mortgage originators in the U.S. We are the second largest retail-focused non-bank mortgage originator and the fifth largest overall retail originator, according to Inside Mortgage Finance. We originated $79.4 billion of loans for the twelve months ended September 30, 2020 and experienced 116% year-over-year origination volume growth for the nine months ended September 30, 2020.
Consumer-facing industries continue to be disrupted by technological innovation. The mortgage industry is no different with consumers expecting increased levels of convenience and speed. The residential mortgage market in the U.S. is massive—with approximately $11.0 trillion of mortgages outstanding as of September 30, 2020—and is largely served by legacy mortgage originators, which require consumers to navigate time-consuming and paper-based processes to apply for and obtain mortgage loans. mello®, our proprietary end-to-end technology platform, combined with our differentiated data analytics capabilities and nationally recognized consumer brand, uniquely positions us to capitalize on the ongoing shift towards at-scale, digitally-enabled platforms.
Our innovative culture and contemporary consumer brand represent key differentiators for loanDepot. We have fostered an entrepreneurial mindset and relentlessly deliver an exceptional experience to our customers. Our guiding principle is to delight our customers by exceeding their expectations. This has allowed us to achieve a Net Promoter Score (NPS) of 74 for the period between September 2017 and November 2020. We believe that we are one of only two non-banks with a nationally-recognized consumer brand in the U.S. retail mortgage origination industry. Since the Company’s launch in 2010, we have invested over $1.2 billion in marketing and the promotion of our brand, and we believe there are significant barriers-to-entry in creating a brand comparable to ours.
mello® drives streamlined customer experiences and operational efficiency throughout the entire lifecycle of a mortgage loan, including fully digital capabilities for customer acquisition, application, processing, and servicing. Our front-end interface is intuitive and user-friendly, driving high customer engagement and lower acquisition costs. We have nearly doubled our consumer direct conversion rates year-over-year for the nine months ended September 30, 2020 and our customer acquisition cost declined by 52% to $767 for the three months ended September 30, 2020 from $1,585 for the year ended December 31, 2017. Additionally, our customer acquisition cost declined by 33% to $890 for the nine months ended September 30, 2020 from $1,323 for the nine months ended September 30, 2019. We define customer acquisition cost as our marketing and advertising expense divided by closings per period. mello® also powers our back-end technology, automating and streamlining numerous functions for our customers, team members and partners. This has allowed us to reduce speed to funding loans by 12% between 2016 and the nine months ended September 30, 2020, thus enhancing the customer experience while driving increased profitability.
mello® Platform
We built mello®, our disruptive, proprietary, and innovative technology platform, from the ground up to function across all aspects of our business, including lead generation, originations, data integration, processing, closing, and servicing. mello® creates a simple and intuitive user interface on the front-end while also integrating data from our vendors and internal data sources, providing our business with optimal efficiency. Through the use of machine learning algorithms, mello® applies intelligent logic-based underwriting parameters to automatically determine and validate loans and reduce cycle times.
146
Table of Contents
Differentiated Contact Strategy—Lead Generation and Customer-Specific Matching
Our marketing technology applications are designed to process leads from a variety of sources and intelligently score and route leads at high volumes in real-time. Our models analyze the propensity that a lead will result in a funding dictating the optimal marketing spend to maximize profitability of a lead. Our proprietary systems utilize a rich customer dataset and advanced algorithms to determine the most optimal loan products to offer a customer before making contact, matching the customer with a compatible mortgage professional based on capacity as well as the mortgage professional’s state licenses, product expertise, and other attributes. Our proprietary marketing technology, along with our differentiated strategy, maximizes consumer engagement and provides a significant competitive advantage in converting leads and reducing staff cost.
Streamlined Data Integration & Connectivity
Receiving and efficiently utilizing various forms and sources of data is a key function of mello®. Through it, our proprietary technology is designed to seamlessly integrate with leading technology partners. This allows us to optimize execution with real-time access to customer, credit, interest rate market, property and other data required to price, sell, and underwrite mortgages. We employ automated document and intelligent character recognition technology to transform documents into flexible and functional data attributes. These functions allow us to eliminate processes that would otherwise require time intensive and inefficient tasks from our team members.
Our technology platform is fully integrated with our sales team providing enhanced efficiency for our team while also streamlining our back-end operations and infrastructure. For example, we built our digital validation integration into the front-end applications to provide dynamic pricing based on the loan’s digital profile, and direct the underwriting process accordingly. Adoption of these tools by our team members has been rapid, as 87% of our conforming rate or term refinances and 70% for total funded loans utilized at least one digital validation component for the three months ended September 30, 2020. This result reflects our ability to develop intuitive and interactive user interfaces that accommodate the workflow of our mortgage professionals.
Digital Validation Adoption Rate: % of Funded Loans
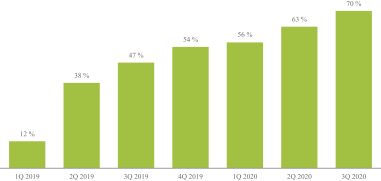
Intelligent Loan Underwriting & Funding:
Our centralized and logic-intensive loan underwriting system utilizes machine learning algorithms to drive efficiencies in validating loan attributes to their program guidelines. Our system automatically creates underwriting conditions based on the selected loan program and known borrower circumstances, and interprets verified source data to streamline decision-making. This functionality not only streamlines loans that contain all their required validations, it also allows us to identify issues more quickly and accelerates our ability to communicate with our customers to request additional information. Simultaneously to applying underwriting criteria to applications, our underwriting system also facilitates automated quality and compliance audits.
147
Table of Contents
As part of our continuous innovation culture, we are refining our underwriting technology and are able to process loans in a way that is starkly different from the industry standard. Instead of utilizing a linear, homogeneous, department-to-department workflow, our loans take the optimal choice of an unlimited set of possible workflows depending on the successive requirements of the loan. An effective illustration of this variety of underwriting paths is the difference in underwriting cycle timelines experienced by loans with different digitally-validated attributes. Loans with one or more digital validation attributes bypass various stages in the underwriting workflow, resulting in substantially decreased cycle times.
| Average Cycle Time Reductions - Digital Validation Loans |
||||
| Auto-Validation Category |
Cycle Time Reduction | |||
| Income Only |
3.1 days | |||
| Assets Only |
4.9 days | |||
| Appraisal Waiver Only |
3.6 days | |||
| Income and Assets |
7.5 days | |||
| Appraisal Waiver and Assets |
7.5 days | |||
| Appraisal Waiver and Income |
6.0 days | |||
| Appraisal Waiver, Assets, and Income |
10.7 days | |||
Advanced Data and Analytics Capabilities:
We are a data driven company. We utilize data from lead acquisition, digital marketing, in-market relationships, and our servicing portfolio to identify and acquire new customers and retain our existing customers. During the last twelve months, we have analyzed, enriched, and optimized more than 9 million customer leads with a deep understanding of each potential customer’s financial profile and needs. We also maintain mello DataMart, an extensive proprietary data warehouse of over 38 million contacts generated over our ten-year history. Our predictive analytics, machine learning and artificial intelligence drive optimized lead performance.
Retail and Partner Strategies
We leverage our brand, technology and data to serve customers across our two interconnected strategies: Retail and Partner. Our Retail strategy focuses on directly reaching consumers through a combination of digital marketing and more than 2,000 digitally-empowered licensed mortgage professionals. In our Partner strategy, we have established deep relationships with mortgage brokers, realtors, joint ventures with home builders, and other referral partners. These partnerships are valuable origination sources with lower customer acquisition costs. Our technology is a key component of the value proposition to these partner relationships, allowing us to integrate directly into our partners’ native systems. We maintain integrated referral relationships with several leading brands, including a partnership with one of the 10 largest U.S. retail banks by total assets. During 2019, our Retail strategy produced 72% of our origination volume, with our Partner strategy representing the remaining 28%.
148
Table of Contents
Our digital-first approach across our Retail and Partner strategies leverages the power of mello® to create a streamlined experience for consumers. Our predictive models route leads to the right loan officer at the right time to optimize the consumer’s experience and best serve their needs. Based on each consumer’s needs and preferences, leads are directed to in-house or in-market loan officers, team members at our centralized operations locations, or our digital self-service platform. Our in-market loan officers are able to leverage their long-term relationships as well as our proprietary mello® platform and loanDepot brand, driving improved profitability per loan officer.
Retail
Consumer Direct: We launched our first channel, consumer direct, in 2010 and have invested in technology and marketing capabilities to create a highly efficient origination platform. Our consumer direct platform leverages our centralized operations centers and proprietary algorithms to provide customers with a rate quote within seconds. Many of our customers choose to complete the mortgage application process themselves and are able to do so digitally with minimal or no human interaction. While customers are capable of end-to-end application processes completely online, we offer real-time assistance from our sales force when needed. Our consumer direct channel utilizes a proprietary algorithm to match leads with the sales force member best-suited for the customer’s needs and ensures that the sales force member has the appropriate licenses needed to process the application. Regardless of whether a customer prefers to apply themselves or with someone guiding them along the way, our consumer direct channel facilitates a streamlined and user-friendly experience. Mortgages originated through our digital marketing and call center operations tend to be predominantly refinance focused.
In-Market Loan Officers: We launched our in-market loan officer channel through our acquisition of iMortgage in October 2013 and grew the channel through our acquisition of Mortgage Master in January 2015. We originate loans in this channel through our dedicated in-market loan officers across the United States. Through our localized in-market strategy, we have been able to cover 75% of the U.S. population with a nationwide network of nearly 1,400 in-market mortgage professionals. Our loan officers are responsible for sourcing, engaging, and maintaining local customer relationships through real estate agents, builders, and other contacts. Our loan officers thrive within our network as our technology platform also serves as a prioritization and potential lead generation tool for customers in their geographies. Our in-market loan officer network cultivates originations that have allowed us to develop deep, long-term relationships. This network of local mortgage professionals provides a steady stream of purchase originations for our platform and is highly complementary to our consumer direct channel, enabling us to satisfy customers both digitally, through our call center, or via in-person interactions.
Partner
Joint Ventures: We have established joint ventures with several industry partners, including national home builders and affinity partners. Our joint venture relationships serve to lower acquisitions costs compared to the
149
Table of Contents
consumer direct channel and yield an attractive margin to the business. Our relationship with home builders in this channel helps to deliver a high percentage of purchase originations to our platform.
Integrated Referral Partners: Through integrated referral partners, we are able to source originations directly through our partner’s existing customer interactions and user interface. These integrated referral sources allow us to expand our reach and provide our services to our partners’ large customer bases. We maintain integrated referral relationships with several leading brands, including a partnership with one of the 10 largest U.S. retail banks by total assets.
Wholesale: After proving the value of our differentiated model in Retail strategy, we expanded our services to an independent broker network. Our wholesale network utilizes the same infrastructure and technology that powers our Retail strategy to provide the same customer-centric approach to our independent broker’s customers. These broker partners leverage our platform to market products and assist customers throughout the loan application process. The wholesale channel operates as a business-to-business model providing industry-leading fulfillment services and trusts in our high quality of customer service. Applications submitted on behalf of a broker are uploaded to our underwriting system and processed with the same unrivaled efficiency that helped us gain an industry-leading net promoter score.
Products
We have a broad loan product suite including conventional agency-conforming loans, conventional prime jumbo loans, FHA & VA loans, and home equity loans.
| i) | Conventional Agency-Conforming loans: our conventional Agency-conforming loans meet the general underwriting guidelines established by Fannie Mae and Freddie Mac, and may be modified through special arrangements we have with both GSEs. |
| ii) | Conventional prime jumbo loans: comprised of our proprietary “Jumbo Advantage” product, and other white label products, these loans generally conform to the underwriting guidelines of the GSEs but exceed the maximum loan size allowed for single unit properties. |
| iii) | FHA & VA loans: FHA loans are federal assistance residential mortgage loans that insure the lender against default on the loan. VA loans are federal assistance residential mortgage loans for eligible U.S. veterans and their surviving spouses that are guaranteed against default by the U.S. government. |
| iv) | Home equity loans: we originate certain home equity loans that are designed to provide homeowners access to efficient capital by accessing the equity that borrowers have accumulated in their homes. |
Ancillary Business
Settlement Services. LD Settlement Services, LLC, a wholly-owned subsidiary of the Issuer, is our captive title and escrow business, which we acquired in 2016. Title insurance is one of the most significant pieces of a real estate transaction, with vast potential to be digitized and better integrated with our lending operation.
Real Estate Services. mello Home Services, LLC is our captive real estate referral business started in 2018. A large portion of our purchase-oriented customer leads have not yet selected a realtor, thus affording us the opportunity to provide a more integrated customer service between the two key home-buying functions, as well as capture ancillary revenue in a RESPA-compliant manner.
Insurance Services. melloInsurance Services, LLC is captive insurance broker formed in 2019 to sell homeowners and other consumer insurance policies to LD customers. Our purchase mortgage customers typically do not have a homeowners insurance quote when they apply for a loan with us, presenting the opportunity to offer the product with high capture rates. We launched melloInsurance Services in the third quarter of 2020.
150
Table of Contents
Marketing Strategy
Our national brand along with our expertise in digital marketing, big data and marketing analytics, not only drives new customer acquisition, but also maximizes retention and customer lifetime value. We leverage these capabilities to “recapture” existing customers for subsequent refinance and purchase transactions. Our recapture rates are among the highest in the industry—for the nine months ended September 30, 2020, our organic refinance consumer direct recapture rate was 61%—highlighting the efficacy of our marketing efforts and the strength of our customer relationships. This compares to an industry average refinance recapture rate of only 18% for the three months ended September 30, 2020 according to Black Knight Mortgage Monitor. In addition, we achieved an overall organic recapture rate of 47% for the nine months ended September 30, 2020. Our recapture originations have lower customer acquisition costs than originations to new customers, positively impacting our profit margins.
We engage in multiple targeted direct marketing strategies among our Retail and Partner strategies enhancing our customer acquisition effectiveness. We utilize online lead aggregators to acquire quality customer leads in bulk at attractive prices. Our organic digital marketing approach employ various digital strategies such as SEO, pay-per-click, banner advertising and organic content to generate organic online leads. We employ targeted direct marketing strategies including direct mailing to broaden our reach of consumers. In situations where we have an existing customer relationship, we use data-driven marketing campaigns to generate new business from customers in our servicing portfolio. We are also able to leverage our mortgage professionals’ and partners’ existing and newly-developed relationships with customers and referral partners to generate origination volume.
Servicing
Prior to 2012, we sold substantially all the MSRs associated with our residential mortgage loan products. In 2012, we began to retain a portion of this servicing in order to complement our origination business. Servicing consists of collecting loan payments, remitting principal and interest payments to investors, managing escrow funds for the payment of mortgage-related expenses, such as taxes and insurance, performing loss mitigation activities on behalf of investors and otherwise administering our mortgage loan servicing portfolio in compliance with state and federal regulations.
Since beginning to retain substantial balances of MSRs in 2012, our retention strategy has changed based on market conditions and internal financial policy. During the years ended December 31, 2019 and 2018, we retained servicing rights on 47% and 73% of mortgages sold, respectively. For the nine months ended September 30, 2020 we have retained servicing rights on 86% of loans sold. We service loans on behalf of investors or owners of the underlying mortgages, and because we do not generally hold loans for investment purposes, our loss exposure is limited to investor guidelines regarding the servicing of delinquent loans.
As of September 30, 2020, we serviced $77.2 billion in UPB of residential mortgage loans for more than 272,000 of our customers. As of September 30, 2020, our $77.2 billion in servicing UPB was comprised of 36% government, 63% agency and 1% other 81% of our owned MSR portfolio was associated with FICO scores above 680.
We currently engage third parties as sub-servicers, which allows us to generate revenue in an operationally efficient manner while fulfilling our primary objective of maintaining ongoing relationships with our customers, and was advantageous in terms of managing start-up costs associated with the segment. We are currently developing a proprietary mortgage servicing platform and we intend to transition all of our servicing to our own proprietary platform.
In addition to fees we earn from servicing the loans, we also derive value from the ability to “recapture” the subsequent refinance or purchase mortgage business of borrowers in the servicing portfolio. The value of the recapture business is comprised of both the gain on sale revenue from the new origination, which is also achieved with significantly reduced marketing expenses compared to a non-recapture unit, as well as the avoidance of the reduction in the balance of the servicing portfolio that would otherwise occur.
151
Table of Contents
Risk Management
Our experienced, cycle-proven management team understands the importance of risk management to ensure business continuity over time, employing a rigid and technically-derived set of principles and policies to guide their decision making and strategy with respect to the company’s financial affairs. Our risk management objectives include maintaining adequate capital to satisfy regulatory and agency requirements, holding adequate liquidity to fund our business through both normal and stressed environments, mitigating credit risk exposure, and managing towards attractive long-term risk-adjusted returns on capital.
As part of our risk management practices, we proactively hedge the interest rate risk on our MSR portfolio and have averaged greater than 91% effectiveness since 2018. Derivatives instruments utilized by the Company primarily include AOT, TBA MBS, and out-of-the-money put options on 10-year treasury futures to hedge interest rate risk.
MSR Valuation Changes and Offsetting Hedge
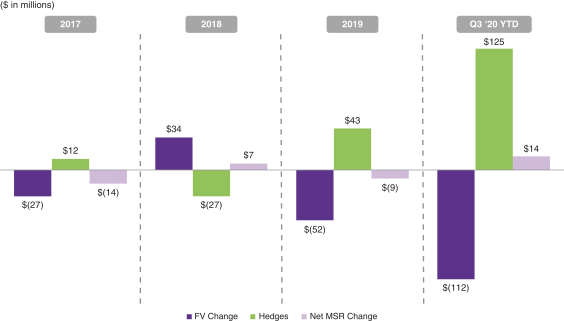
Our dedicated capital markets team has significant experience with residential mortgage loan products. Consisting of over 200 team members as of September 30, 2020, the team actively manages the pooling and sale of loans into the secondary market as well as hedging of the company’s whole-loans, origination pipeline and MSRs. Since our inception, we have experienced a very low repurchase rate and have maintained a strong reputation with the agencies and other loan investors. We have generated a consistently strong gain on sale on originated loans, which we believe is attributable to the high-quality loans generated from our loan origination process and business model, combined with our experienced management and capital markets teams. Our comprehensive pipeline hedging strategy, combined with our secondary marketing expertise, facilitates these consistently strong gain on sale margins over a wide range of interest rate environments.
Liquidity is very important to the overall success of our business and is primarily managed by our treasury and capital markets teams. We have historically maintained liquidity levels that are designed to allow us to fund our loan origination business, manage our day-to-day operations and protect us against foreseeable market risks. Our sources of liquidity include loan funding warehouse facilities, MSR facilities, off-balance sheet gestation facilities, as well as cash on hand. As of September 30, 2020, we had $637.5 million of cash and cash
152
Table of Contents
equivalents, along with $5.5 billion of loan funding capacity across 13 credit facilities, of which $4.6 billion was outstanding. Of our $5.5 billion loan funding capacity, 15% of our facilities have original maturity dates of two years or longer, which reduces the risk of refinancing. As of September 30, 2020, our warehouse line available balance was $879 million, providing for significant liquidity.
Opportunities for Growth and Our Financial Advantage
We have significantly increased our originations market share from 1.0% in 2014 to 2.6% for the first nine months of 2020, and our strong consumer brand and proprietary technology platform have positioned us to continue gaining additional share. Our Retail and Partner strategies have led to a balanced mix of purchase and refinance mortgages, with purchase originations representing 41% of total originations in 2019. We have a well-defined plan to accelerate this growth by expanding upon our technological and brand advantages, growing our market share in both purchase and refinance markets, and further increasing customer retention and lifetime value. Secular demographic and housing market tailwinds provide further support for our competitive advantages.
Our platform and technology create a significant financial advantage. Our brand effectiveness and marketing capabilities optimize our customer acquisition costs, and our automation reduces unnecessary expenses throughout the origination process. We are able to scale quickly and efficiently which allows us to grow both transaction volume and profitability. During the COVID-19 pandemic, our technology platform and culture enabled us to hire, train and onboard over 3,500 new team members remotely. Our growth and profitability during the last nine months is further evidence of the scalability of our platform and validates the investments we have made in our brand and our technology. For the nine months ended September 30, 2020, we generated $63.4 billion in originations (116% year-over-year growth), $3.0 billion in revenue (227% year-over-year growth), $1,465.9 million in net income and $1,085.9 million in adjusted net income, making us one of the fastest-growing and most profitable companies in our industry.
Market Opportunity
Largest consumer asset class in the United States
According to the Federal Reserve, residential mortgages represent the largest segment of the broader U.S. consumer finance market. One-to-four family residential mortgage origination volume is expected to be $2.7 trillion in 2021 according to Fannie Mae. According to the Mortgage Bankers Association (the “MBA”), there was approximately $11.0 trillion of residential mortgage debt outstanding in the U.S. as of September 30, 2020, which is forecasted to increase to $12.2 trillion by the end of 2022 according to the MBA. The chart below presents the total U.S. one-to-four family residential mortgage originations and forecasts for the periods indicated.
One-to-Four Family Mortgage Originations
($ in trillions)
Source: Historicals per MBA. Mortgage Forecast per Fannie Mae as of November 2020.
153
Table of Contents
Technology-enabled disruptors continue to capture market share in an industry that remains highly fragmented
Technology-enabled disruptors continue to gain share in the highly fragmented residential mortgage origination market. We more than doubled our market share since 2014 while other technology-enabled non-banks have also grown share as consumers increasingly prefer technology-driven mortgage solutions. Independent technology-enabled disruptors, by better serving the needs of consumers as compared with legacy providers, are well positioned to capitalize on the broader shift in the mortgage market from banks to non-banks—from 2008 through the nine months ended September 30, 2020, non-banks increased their share of the top 50 mortgage originators from 22% to 69% according to Inside Mortgage Finance. The mortgage origination market remains highly fragmented with the top five originators representing only 26% of total originators in the nine months ended September 30, 2020 according to Inside Mortgage Finance. This fragmentation leaves a significant opportunity for market participants with scaled consumer brands and disruptive technology to continue to consolidate share.
High barriers of entry for building a scaled and innovative contemporary mortgage company
The barriers to building a technology-driven, contemporary mortgage company with a nationally-recognized brand are significant. In order to reach a 2.6% market share for the nine months ended September 30, 2020, we have invested over $1.2 billion over the course of more than 10 years in marketing and promotion of our brand. Our significant focus on brand has let to the strong growth in our cumulative marketing and promotion investment, which was $24 million by 2011. We have accumulated more than 10 years of proprietary data on consumer behavior that we use to optimize our marketing efforts and the customer experience. We have assembled a management team with a unique combination of skillsets that we believe is difficult for competitors to replicate. These skillsets include a deep understanding of the mortgage industry, technology development, digital marketing, and data capture and analytics. Our scale and widely recognized brand leads to a virtuous cycle of growth, increased data, and further investments in our brand and technology platform.
The challenging nature of building a technology-enabled residential mortgage platform that provides exceptional customer experiences is evidenced by the large differential between the NPS scores of technology-focused disruptors compared to the rest of our industry. We believe we are one of only two contemporary, non-bank retail mortgage originators operating at scale in the United States. Both we and our largest competitor have net promoter scores that exceed 70. Increasing consumer demands for higher quality experiences creates a significant opportunity for contemporary mortgage brands to continue gaining market share.
Numerous secular tailwinds supporting continued market growth
Historically low 30-year fixed mortgage rates are continuing to drive strong demand for both purchase and refinance mortgages. The Federal Reserve forecasts that the federal funds rate will remain below 0.25% through 2022. At current market rates, over 95% of existing mortgages are “in-the-money” (meaning borrowers are able to benefit from refinancing their mortgage), representing total industry refinance opportunity of over $10 trillion based on management estimates. These factors have led Fannie Mae to forecast $1.1 trillion in mortgage refinance origination volume in 2021.
Additionally, housing market growth has been supported by the growth of the millennial demographic. Millennials now represent 73% of first time home buyers according to the National Association of Realtors. This demographic shift has helped drive a steady growth in purchase originations over time, increasing every year since 2011.
154
Table of Contents
Our Strengths
Innovative Workplace and Customer-Centric Culture
Since our founding in 2010, we have fostered a culture focused on continuous innovation and customer-centricity. Our innovation-oriented culture has driven us to transform and simplify the mortgage process, while leveraging our vast data capabilities to provide a superior customer experience. Our approach has resulted in our industry-leading platform that is disrupting the mortgage industry by combining cutting-edge proprietary technology, mortgage industry expertise, marketing capabilities, and data analytics in a way that is fundamentally different from legacy mortgage providers.
Our commitment to customer service permeates our entire organization and is a central component in team member training and mentorship across the company. We utilize an innovative approach to provide daily customer feedback to our team members. We provide our team members dashboards that push daily customer feedback to ensure continued improvement in the experience for our consumers. Our founder, Chairman, and CEO, Anthony Hsieh, also fosters an open door environment and hosts intimate CEO Connect forums, during which team members have a dialogue around innovation and customer experiences. We treat recruiting, onboarding, training and retaining team members as one of our “primary business lines,” to identify, mentor, and promote the best talent.
Our relentless focus on and success in delivering exceptional customer experiences is evidenced by our NPS score of 74 for the period between September 2017 and November 2020. As further evidence of this commitment, our initial inbound customer contact answer time is generally answered in as little as one second. These metrics demonstrate our commitment to putting our customers’ needs first.
Well-recognized Brand and Data-Driven Marketing Capabilities
Since our founding in 2010, we have invested over $1.2 billion in marketing and the promotion of a leading, contemporary consumer brand—we believe we have the second most recognized consumer brand among non-bank mortgage originators, with more brand momentum than any other company. We have a multi-faceted marketing strategy, which includes both lead aggregation and a vast media presence. Our media strategy includes traditional elements including television, display advertisement, and published media as well as a significant social media presence and other contemporary approaches. We have proven our ability to build a strong brand based on the quality of our business and our commitment to excellent customer service. We believe that this approach to brand-building allows us to amplify our brand through both traditional elements in addition to our wide following on social media, published media coverage, and earned media mentions.
Recently, we introduced national television campaigns that feature our passionate team members and showcase our customer-centric culture. Our “Home Means Everything” television campaign was launched on May 4, 2020 and generated more than 3.5 billion impressions through October 31, 2020. This has helped drive our continued growth in national brand awareness among consumers. We also had approximately 1.5 million visits to loandepot.com in the month of October 2020. Our nationally recognized loanDepot brand has increased our ability to generate customer leads and has helped us become the second largest retail-focused non-bank mortgage originator with a 2.6% market share for the nine months ended September 30, 2020. We believe that our focus on providing a superior consumer experience is the best way for us to continue building our brand and extend the lifetime value for our customers.
The loanDepot brand is supported by our innovative, data science-based approach to marketing and customer acquisition, powered by our proprietary technology. We analyzed, enriched, and optimized more than 9 million new customer leads during the last twelve months ended September 30, 2020, and have compiled a database of more than 38 million customer leads since our inception. Our innovative platform is highly scalable and we leverage our machine learning and predictive analytics capabilities to match the customer with the right
155
Table of Contents
loan officer, the right product, at the right time. We efficiently route leads to in-house and in-market loan officers based on a variety of factors, including readiness to purchase, geographic and behavioral data, as well as product fit. We are highly effective in engaging customers by phone, email, and text messaging. We interact and build relationships with our customers through our multi-channel social media presence. Our marketing approach leads to higher customer satisfaction, while lowering customer acquisition costs, which averaged $767 per loan for the three months ended September 30, 2020, representing a 52% decrease from $1,585 in 2017. Additionally, our customer acquisition cost declined by 33% to $890 for the nine months ended September 30, 2020 from $1,323 for the nine months ended September 30, 2019.
Our focus on brand loyalty, extensive data resources and analytics, and proactive marketing capabilities allow us to continue enhancing the customer experience beyond the initial loan origination. Our organic refinance consumer direct recapture rate of 61% for the first nine months of 2020, which measures our ability to “recapture” subsequent refinance mortgage business of borrowers from our servicing portfolio, is more than three times the industry average of 18% and highlights the efficacy of our marketing and data analytics efforts and the strength of our customer relationships. Additionally, our brand and marketing efforts represent significant value for our in-market loan officers, who also receive centrally-sourced leads from our servicing portfolio and direct marketing efforts, and thus do not have to rely solely on personal relationships, as is the case with legacy originators who are exclusively in-market focused.
End-to-End Proprietary Technology Drives Growth, Efficiencies and a Differentiated Customer Experience
Our fully-integrated, proprietary mello® technology platform has been developed over the last 10-plus years as a purpose-built, next-generation platform to streamline the entire mortgage lifecycle by providing a seamless and efficient experience for our customers, team members and partners. We have spent over $400.0 million on our technology since inception and currently have a dedicated team of over 300 technology professionals focused on continuously improving our platform. mello® enables us to deliver superior results through optimized lead generation and analytics, our best-in-class front-end interface, efficient loan fulfillment and enhanced customer lifecycle engagement.
Analyze, Enrich and Optimize Leads: Our machine-learning-based models and analytics drive lead generation and optimization. We have generated 43 million enriched leads with data from at least one enrichment vendor. We have a massively scalable lead generation and ingestion engine with billions of data enrichment points. Our platform is able to utilize 9.9 billion data enrichment points in a matter of milliseconds. Our machine learning programs utilize sophisticated algorithms to drive dynamic marketing campaigns and optimize our ability to reach prospective high value consumers, resulting in an average cost per loan associated with our mortgage variable expenses of $3,582, representing a 8% decrease from $3,909 in 2017 to the three months ended September 30, 2020. We are able to route our approximately 23,000 leads per day to the ideal loan officers holding the applicable license who can respond within seconds. Our ability to use analytically-driven routing to match customers and loan officers is unparalleled in the industry and has led to our consumer direct conversion rates nearly doubling year-over-year for the nine months ended September 30, 2020. Our average monthly closings per licensed loan officer increased 89% to 10.7 for the three months ended September 30, 2020 from 5.7 for the year ended December 31, 2017. Additionally, average monthly closings per licensed loan officer increased 66% to 8.8 for the nine months ended September 30, 2020 from 5.3 for the nine months ended September 30, 2019.
Front-end Consumer Experience: We have created a customized front-end experience to offer an efficient and user-friendly interface across mobile, web, and person-to-person interactions, enabling us to deliver industry-leading customer service to every borrower, regardless of channel and customer preferences and needs. No matter the level of our consumer’s technological background, we are able to deliver a best-in-class customer experience through the breadth of our user interface platform. Our loan officers are constantly engaging with customers. We have made more than 1 billion total customer calls since inception, and average more than 375,000 unique calls per day.
156
Table of Contents
Loan Fulfillment and Execution: Our end-to-end loan execution solutions are designed to deliver efficiencies across our organization, reducing the time to close a loan, lowering fulfillment costs, and driving a superior customer experience. With mello®, completing a mortgage process has never been simpler. Our data-first approach is focused on automatically collecting key inputs and data in lieu of requiring additional documents. We have automated condition population and condition clearance approaches that drive increased efficiency. Our nearly fully paperless underwriting process and data-first integration with third-party data providers has increased our data integrity for every loan. Paired with our proprietary artificial intelligence software, we are able to engage in over 5,000 discrete intelligent actions on every loan file. We have automated task-triggers based on the consumer data provided delivering increased visibility to our consumers.
Customer Lifecycle Engagement: Our proprietary marketing technology, along with our differentiated strategy, maximizes consumer engagement throughout the customer life cycle. Our predictive models route leads to the right loan officer at the right time to optimize the consumer’s experience and best serve their needs. Through automated notifications, streamlined processes, and numerous communication mediums, our customers experience a revolutionary mortgage experience that saves time, is transparent, and is optimized to exceed their rising expectations. Our technology triggers real-time prompts for specific client interactions and engagement based on individual user behavior. We utilize machine learning-based predictive modeling to target borrowers who qualify for loan modifications and refinancing transactions, offer complementary home services to customers, improve our product fit and pricing engine, and expedite loan processing.
Retail and Partner Strategies Powered by Single Proprietary Technology Platform Leading to Best-in-Class Efficiency
Our digital-first approach across our Retail and Partner strategies is powered by our single proprietary technology platform, mello®. In our Retail strategy, mello® routes leads to the right loan officer at the right time to optimize the consumer’s experience and best serve their needs. Based on each consumer’s needs and preferences, leads are directed to in-market loan officers or team members at our centralized operations. For our Partner strategy, mello® provides seamless technology experience and fulfillment services to brokers and joint venture partners. Our single proprietary technology has led to superior user experiences and higher efficiencies for our platform.
We believe our ability to leverage our mello® technology platform will allow us to grow share through our Retail and Partner strategies that will continue to generate enhanced returns and allow us to further invest in our brand, marketing and technology, creating a virtuous cycle that will allow us to consistently deliver above market growth and attractive returns to our shareholders.
Experienced, Founder-Led Management Team with Industry-Leading Skillsets
Anthony Hsieh, our founder, Chairman and CEO, is recognized as continuously disrupting the existing mortgage and lending model and driving the evolution of the industry as a whole. A self-made entrepreneur, Hsieh founded loanDepot in 2010 with a commitment to responsible lending and a goal of exceeding customer expectations. This timing was courageous, as many lenders left the industry following the 2008 economic crisis.
Prior to founding loanDepot, Hsieh successfully established two other innovative mortgage companies. In 2002, he established HomeLoanCenter.com, the first online lender to offer a full spectrum of home loan products in all 50 states. HomeLoanCenter.com featured live interest rate quotes and loan offerings that were tailored to borrower needs and credit profiles. Hsieh continued to lead the business for three years after merging with IAC/Interactive subsidiary LendingTree in 2004. In 1989, Hsieh acquired a mortgage brokerage company which he transformed into LoansDirect.com, taking advantage of the upswell of activity surrounding the debut of internet-based commerce. The company remained one of the most profitable and successful mortgage lenders through the 1990s, and was acquired by E*TRADE Financial in 2001.
Hsieh’s vision and leadership is well-recognized. He was named Asian Real Estate Association of America Person of the Year in 2017 and the 2018 Executive of the Year by LendIt Fintech. In addition, Hsieh has been an
157
Table of Contents
important national voice for the lending industry, having appeared on Fox News, CNBC and Bloomberg TV, among other national outlets.
At loanDepot, we have assembled a senior management team with an outstanding vision, passion for innovation, focus on the customer, and mortgage industry expertise. The loanDepot executive team has on average more than 25 years of industry experience; many of these individuals, as well as other members of the broader team, have worked with Hsieh for years, and notably, were side by side with him at the advent of the digital mortgage, giving the overall team a unique and decisive advantage in today’s marketplace.
The loanDepot team is deep and diverse, with unparalleled experience in building and running successful technology-empowered consumer-driven businesses. They also possess exceptional expertise across a variety of disciplines, including technology platform development, customer acquisition and marketing, data analytics, brand building, mortgage originations, and capital markets. This team, led by Hsieh, has a proven track record of building and managing best-in-class businesses.
High-Growth, Profitable Financial Profile
We believe our brand, platform and technology create a significant financial advantage. Our brand effectiveness and marketing capabilities optimize our customer acquisition investments and our automation reduces unnecessary costs across the origination process. We can scale quickly and efficiently which allows us to grow both transaction volume and profitability.
For the nine months ended September 30, 2020, we generated $3.0 billion in adjusted revenue and $1,085.9 million in adjusted net income. We have grown originations from $29.3 billion in the first nine months of 2019 to $63.4 billion in the first nine months of 2020, representing 116% growth—the fourth highest growth rate over this period among the top 15 mortgage lenders, according to Inside Mortgage Finance. We have organically grown our high-quality servicing portfolio from $30.6 billion at September 30, 2019 to $77.2 billion at September 30, 2020, representing 153% growth—the third highest growth rate over the period among the top 50 mortgage servicers, according to Inside Mortgage Finance.
Our Strategies for Growth
We have demonstrated our ability to grow our business and market share, having grown from a de novo start-up in 2010 to the second largest non-bank retail originator in the U.S. with a 2.6% share of a $11.0 trillion mortgage market as of September 30, 2020. We believe that we are well positioned to continue our market share growth through both our Retail strategy, where we have invested in our team members and technology to enable rapid scaling, and our Partner strategy, where independent brokers, in addition to joint venture and integrated referral partners, increasingly choose to work with us based on our reputation for excellent customer service and seamless user experiences. Our growth has accelerated in recent quarters as our long-term investments in brand marketing and innovative technology have helped us achieve industry-leading growth and profitability.
158
Table of Contents
One-to-Four Family Mortgage Originations
($ in trillions)
Source: Market share per MBA volumes.
We believe that continuing to make these investments will allow us to grow market share, increase customer retention and deliver enhanced returns that will ultimately enable a virtuous cycle of further investment and returns. We intend to grow by executing on the following key strategies:
Expand Upon Our Already Significant Top-of-Funnel Reach
Our continued investments in building a significant top-of-funnel reach supported by advanced data analytics will allow us to grow market share in any economic environment. Our platform attracts customers through a variety of means including: digital leads, affiliate relationships, brand recognition, social media engagement, local in-market relationships, and existing customer retention.
Our technology and data analytics have allowed us to cultivate an increasing number of leads with higher lead conversion over time. We have analyzed, enriched and optimized more than nine million leads during the last twelve months ended September 30, 2020, a 14% increase since 2017. Our mello® technology takes in these leads and ingests billions of data enrichment points resulting in better data segmentation and lead routing becoming a more efficient customer acquisition tool. Our conversion rates in consumer direct have nearly doubled year-over-year for the nine months ended September 30, 2020.
We are able to increase our reach through joint venture and integrated referral partners, including one of the ten largest U.S. retail banks, that provide exclusive leads to our origination platform. Our partners are valuable sources of high-quality customers and our technology enables us to source customers directly from within a partner’s customer portal, amongst other highly integrated functionality. We are able to effectively leverage the traffic provided from these relationships to broaden our reach and expand upon our brand.
159
Table of Contents
Client Leads by Year (in millions)
Continue to Grow our Brand Leveraging Our Marketing Capabilities
We believe the loanDepot brand is one of only two nationally-scaled non-bank mortgage brands in the U.S., representing a distinguished and long-lasting advantage over other market participants.
We plan to continue to enhance our brand through investments in digital marketing, our social media presence and traditional media advertising, as well as continued development of our data science capabilities. Our “Home Means Everything” television marketing campaign represents a significant opportunity to build upon our strong momentum, reach a large potential customer base, and continue to increase our brand awareness. The campaign continues to run nationwide and we believe we will generate more than 5 billion impressions in the fourth quarter.
We intend to continue to actively manage our social media presence and loanDepot.com website traffic, which have historically generated high levels of consumer engagement. From May to October of 2020, we increased our daily number of website users by 41% with approximately 1.5 million website visits in October 2020. We believe our social media engagement is industry-leading. The number of loanDepot.com average daily sessions have increased 69% year-over-year for the nine months ended September 30, 2020 and from March 20 to September 20 of 2020 our average social media follower growth was 11.7% across platforms.
Expand Upon our Data Analytics Advantage
We have invested in building out a leading technology platform that leverages data science, artificial intelligence and machine learning. We will continue to invest significantly in these capabilities to further enhance the customer experience throughout the lifecycle of a loan, reduce the costs of acquiring customers and processing new loans and increase customer retention.
Machine learning and AI processes work best with large amounts of data, and large amounts of data are incomprehensible without the power harvested through machine learning and AI. Our proprietary data warehouse, mello DataMart, presents a unique and growing advantage boosted by our over 38 million unique individuals and nearly 100 million consumer interactions captured. Through these data points, we are able to refine our lead generation capabilities, which allow us to route approximately 90% of our leads within 5 seconds to optimize execution.
melloMarket360 is a market intelligence platform that we have developed to provide loan officers with up-to-date information on real estate activity in their area and market intelligence on competing loan officer productivity. melloMarket360 leverages real estate mortgage data and analytics across realtors, builders and originators in local communities, allowing loan officers to research every aspect of their market and tailor their
160
Table of Contents
sales and marketing approach to match consumer demand. Our melloMarket360 technology helps loan officers prepare for meetings with realtors, add value to existing realtor relationships, and develop new relationships with builders. In addition to enhancing productivity of our existing loan officers, melloMarket360 has become a powerful recruitment tool for loanDepot to attract talented new loan officers who can leverage our resources to significantly increase their productivity. Over time, loanDepot’s reservoir of data will continue to expand, and the melloMarket360 platform will become even more powerful and easier to use.
melloClear, our proprietary underwriting engine, helps decrease our labor capacity utilization by approximately 55%. We believe that our underwriting capabilities will continuously improve as we increase data integrations with technology partners and agencies to automate inputs, such as income, employment, and asset verification, and enhance processing speeds. Through continued investment and innovation, we are well positioned to attract new customers, recruit top loan officers to our platform, and increase the efficiency in which we meet all users’ needs.
Leverage our Local Presence to Profitably Take Share in Varying Market Environments
We offer our customers the opportunity to interact with both our digital-first online resources and our in-market, relationship-based loan officers. Our network of in-market loan officers has helped us build a strong presence in the purchase market, which accounted for 41% of our total originations in 2019. Homebuyers—even younger generations—overwhelmingly prefer the high-touch, personalized service provided by local mortgage professionals. According to a 2019 Ellie Mae study, 79% of millennial and 78% of generation X consumers reported meeting with their lender in person “often” or “sometimes”. Our partnerships with builders, realtors and other companies close to the home-buying decision also serve as a consistent source of purchase volume.
| Steady Purchase Volume Growth
|
Increase Customer Retention and Lifetime Value
We expect to drive higher customer retention and lifetime value by leveraging our technology-driven marketing capabilities, data and customer service to attract repeat customers for refinance transactions and loanDepot’s ancillary homeowner services, which include settlement services, real estate broker services, and insurance services.
Our expertise in marketing, predictive analytics, and continuous customer engagement enable us to proactively identify our customers who may benefit from a refinance transaction. Our ability to market effectively to our existing customers is further supported by our growing servicing portfolio. In 2012, we made the strategic decision to begin retaining the servicing on a portion of our loan originations, and our servicing portfolio reached $77.2 billion in unpaid principal balance (“UPB”), representing over 272,000 customers, as of September 30, 2020. During the nine months ended September 30, 2020, we retained servicing on 86% of loans sold.
161
Table of Contents
| Industry-Leading Recapture Rates
|
Owning the customer relationship across the mortgage lifecycle, including originations, servicing, and ancillary products, strengthens our customer relationships and provides us with better data to market new products and services to our existing customers. We have one of the highest organic refinance consumer direct recapture rates in our industry at 61% in our consumer direct for the nine months ended September 30, 2020, as compared to the industry-average of 18% for the three months ended September 30, 2020. As a natural evolution of our strategy, we intend to move our servicing operations from a sub-servicer relationship to our in-house servicing platform, further strengthening customer relationships and further increasing recapture rates. We believe that we will continue to deliver strong customer retention and generate attractive lifetime values by providing services across the homeowner ecosystem and throughout the lifecycle of a mortgage loan.
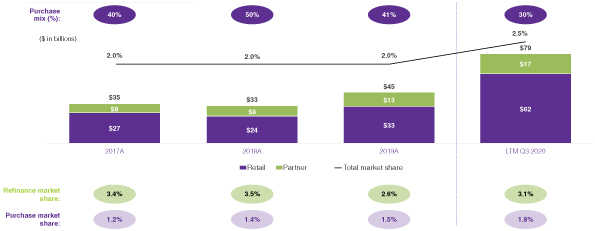
Our Infrastructure
Compliance
We operate within a complex area of the financial services industry, and our business requires a significant compliance and regulatory infrastructure. Since launching our business in 2010, we have developed an operating platform designed to meet the needs of today’s compliance and regulatory environment. We leverage our proprietary technology and automated systems which are designed to ensure that all processes operate in a compliant manner. We believe our use of innovative, purpose-built technology helps reduce errors and ensures standardized compliant processes.
We employ an in-house team of lawyers and other professionals dedicated to legal, regulatory and compliance related matters. Our compliance functions sit independently of our production operations from a reporting perspective, which allows for autonomy. However, our compliance department also works alongside the production areas of our organization on a day-to-day basis, which enables our compliance function and
162
Table of Contents
business units to collaborate and work more efficiently. We regularly and proactively engage with our regulators to stay ahead of regulatory trends. In addition, we utilize third-party verification and internal audit procedures to ensure compliance on fundamental issues. We view our infrastructure and culture of compliance to be a competitive advantage, as it enables us to leverage our platform and rapidly scale our business while minimizing, as much as possible, compliance risk.
Joint Ventures
In conjunction with our various joint ventures, we entered into various agreements to provide services to the joint ventures for which they receive and pay fees. Services for which we earn fees comprise loan processing and administrative services (legal, accounting, human resources, data processing and management information, assignment processing, post-closing, underwriting, facilities management, quality control, management consulting, risk management, promotions, public relations, advertising and compliance with credit agreements). We also originate eligible mortgage loans referred to us by the joint ventures for which LDLLC pays the joint ventures a broker fee.
| Nine months ended September 30, |
Year ended December 31, | |||||||||||||||
| ($ in thousands) | 2020 | 2019 | 2018 | 2017 | ||||||||||||
| Loan processing and administrative services fee income |
$ | 10,017 | $ | 9,909 | $ | 7,464 | $ | 6,350 | ||||||||
| Loan origination broker fees expense |
55,323 | 75,420 | 75,060 | 66,466 | ||||||||||||
| Receivables from joint ventures |
$ | 1,571 | $ | 3,582 | $ | 1,439 | $ | 1,243 | ||||||||
Competition
As a technology-enabled platform that provides multiple mortgage loan and real estate services products, we compete with other lenders and market participants across a variety of industry segments, including banks and other “originate-to-hold” lenders, non-bank lenders, and other financial institutions, as well as traditional and technology-oriented platforms across the broader real estate and mortgage industry.
We believe that the principal factors that generally determine competitive advantage within our market include:
| • | ease and quickness of the loan application, underwriting and approval processes; |
| • | overall customer experience, including transparency throughout each step of the transaction; |
| • | brand recognition and trust; |
| • | product selection; and |
| • | effectiveness of customer acquisition. |
We believe we compete favorably on the basis of our proprietary technology, diversified customer acquisition model and origination channels, scale, brand and broad suite of products.
Supervision and Regulation
We describe below the material elements of the regulatory and supervisory framework applicable to us. Statutes, regulations and policies that affect mortgage lending and servicing are continually under review by Congress and state legislatures and federal and state regulatory agencies, and a change in them, including changes in how they are interpreted or implemented, could have a material effect on our business. The regulatory and supervisory framework applicable to originators, lenders and facilitators in the mortgage loan markets is generally intended to protect consumers and not investors in such companies.
163
Table of Contents
Supervision and Enforcement
Because we are not a depository institution, we generally do not benefit from federal preemption of state mortgage lending, loan servicing or debt collection licensing and regulatory requirements. Accordingly, we must comply with state licensing requirements in all of the states in which we conduct business. We are licensed as a loan originator in all 50 states and the District of Columbia and also are licensed as a loan servicer and loan broker in a number of states and jurisdictions in which such licenses are required. We are also subject to an extensive framework of state laws in the jurisdictions in which we do business, and to periodic audits and examinations conducted by the state regulators to ensure compliance with those laws. From time to time, we receive requests from state regulators and other agencies for records, documents and information regarding our policies, procedures and practices related to our loan origination, loan facilitation, loan servicing and debt collection operations. State attorneys general, state licensing regulators, and state and local consumer protection offices have authority to investigate consumer complaints and to commence investigations and other formal and informal proceedings regarding our operations and activities.
We are also subject to supervision and enforcement activity by federal government entities. Under the Dodd-Frank Act, the CFPB was established in 2011 to ensure, among other things, that consumers receive clear and accurate disclosures regarding financial products and to protect consumers from hidden fees and unfair, deceptive or abusive acts or practices. The CFPB has broad supervisory and enforcement powers with regard to nonbanking companies, such as us, that engage in the origination and servicing of mortgage loans. As an approved originator and servicer of loans that are guaranteed by FHA and VA and loans that are sold to Fannie Mae and Freddie Mac, our operations also may be reviewed by these, and other, entities with whom we do business. We are also subject to oversight by the Federal Trade Commission, HUD and FHFA.
Federal, State and Local Regulation
Our business is highly regulated. Regulatory and legal requirements are subject to change and may become more restrictive, making our compliance more complex or expensive or otherwise restricting our ability to conduct our business as it is now conducted. Changes in these regulatory and legal requirements, including changes in their enforcement, could materially and adversely affect our business and our financial condition, liquidity and results of operations. We are subject to extensive federal laws and regulations as well as to numerous state-specific laws and regulations. We are also subject to judicial and administrative decisions that impose requirements and restrictions on our business.
The U.S. federal, state and local laws, rules and regulations to which we are subject, among other things:
| • | limit certain practices related to loan officer compensation; |
| • | impose licensing obligations and financial requirements on us; |
| • | limit the interest rates, finance charges and other fees that we may charge or pay; |
| • | regulate the use of credit reports and the reporting of credit information; |
| • | impose underwriting requirements; |
| • | mandate disclosures and notices to consumers; |
| • | mandate maintenance and retention of loan records; |
| • | mandate the collection and reporting of statistical data regarding applications for, originations of and purchases of mortgage loans; |
| • | regulate any direct consumer marketing techniques and practices; |
| • | require us to safeguard public and non-public information about our customers and regulate the sharing of such non-public personal information with third parties and affiliates; |
| • | regulate our privacy and cybersecurity obligations; |
164
Table of Contents
| • | regulate our servicing practices, including but not limited to collection and foreclosure practices, the manner and timing for responding to consumer complaints, and the administration of escrow accounts; |
| • | require us to take precautions against money-laundering and doing business with certain government-designated parties, such as suspected terrorists and parties engaged in narcotics trafficking; |
| • | regulate the method by which appraisals are ordered and reviewed and our interaction with appraisers; and |
| • | mandate the terms and conditions under which we must offer and approve loan modification programs for our servicing customers. |
| • | In particular, we are required to comply with: |
| • | Title V of the GLBA and Regulation P, which requires initial and periodic communication with consumers on privacy matters and the maintenance of privacy regarding certain consumer data in our possession; |
| • | the Fair Debt Collection Practices Act (“FDCPA”), which regulates the timing and content of communications on debt collections; |
| • | the TILA and Regulation Z, which, in conjunction with the RESPA under the TILA-RESPA Integrated Disclosure Rule, require certain disclosures be made to mortgagors regarding terms of mortgage financing, including but not limited to information designed to promote consumer understanding of the cost of a loan, expressed in terms of an annual percentage rate, and other credit terms including the disclosure of the number, amount and due dates or periods of scheduled repayments; TILA and Regulation Z also include the rules on loan officer compensation, require special disclosures and treatment for certain high-cost loans, require certain disclosures in connection with the servicing, assumption or refinancing of mortgage loans, provide for consumers’ right to rescind loans under certain circumstances, contain rules with respect to the ordering and review of appraisals and interaction with appraisers, and provide rules requiring a determination of the consumer’s ability to repay certain mortgage loans and providing either a safe harbor or rebuttable presumption of compliance for certain qualified mortgage loans; |
| • | the FCRA and Regulation V, which collectively regulate the use and reporting of information related to the credit history of consumers and provides a national legal standard for lenders in sharing information with affiliates and certain third parties and in providing firm offers of credit to consumers; |
| • | the ECOA and Regulation B, which prohibit discrimination on the basis of age, race and certain other characteristics in the extension of credit and requires that in certain circumstances, creditors provide appraisal-related disclosures and copies of appraisals to borrowers; |
| • | the Homeowners Protection Act, which requires the cancellation of mortgage insurance once certain equity levels are reached; |
| • | the Home Mortgage Disclosure Act and Regulation C, which require public reporting of certain loan data; |
| • | the Fair Housing Act, which prohibits discrimination in housing on the basis of race, sex, national origin, and certain other characteristics; |
| • | the SCRA, which provides certain legal protections and relief to members of the military; |
| • | RESPA and Regulation X, which governs the actions of servicers related to escrow accounts, transfers, and other customer communications, and prohibits certain practices, such as giving or accepting a fee, kickback, or anything of value in exchange for referrals of settlement service business; |
| • | Regulation AB under the Securities Act, which requires registration, reporting and disclosure for MBS; |
165
Table of Contents
| • | the Secure and Fair Enforcement for Mortgage Licensing Act, commonly known as the SAFE Act, which is designed to enhance consumer protection and reduce fraud by requiring states to establish minimum standards for the licensing and registration of state licensed mortgage loan originators; |
| • | the CCPA, which provides California consumers with new privacy rights and increases the privacy and security obligations of entities handling certain personal information of such consumers; |
| • | the Telephone Consumer Protection Act, which prohibits telemarketers, banks, debt collectors, and other companies from using an automatic dialer or robocalls to call people either at home or on their cell phones without their consent; |
| • | Dodd-Frank Act provisions prohibiting unfair, deceptive or abusive acts or practices; and |
| • | certain other provisions of the Dodd-Frank Act, which, as discussed elsewhere, is extensive in scope and authorizes the CFPB to engage in rulemaking activity and to enforce compliance with federal consumer financial laws, including TILA, RESPA, and the FDCPA. |
In addition, various federal, state and local laws have been enacted that are designed to discourage predatory lending and servicing practices. HOEPA, which amended TILA, in particular prohibits inclusion of certain provisions in residential loans that have mortgage rates or origination costs in excess of prescribed levels and requires that borrowers be given certain disclosures prior to origination. The Dodd-Frank Act amended HOEPA to enhance its protections. Some states have enacted, or may enact, similar laws or regulations, which in some cases impose restrictions and requirements greater than those in HOEPA. Also, under the anti-predatory lending laws of some states, the origination of certain residential loans, including loans that are not classified as “high cost” loans under applicable law, must satisfy a net tangible benefits test with respect to the related borrower. This test may be highly subjective and open to interpretation. As a result, a court may determine that a residential loan, for example, does not meet the test even if the related originator reasonably believed that the test was satisfied. Failure of residential loan originators or servicers to comply with these laws, to the extent any of their residential loans are or become part of our mortgaged-related assets, could subject us, as a servicer or as an assignee or purchaser, in the case of acquired loans, to monetary penalties and could result in the borrowers rescinding the affected residential loans. Lawsuits have been brought in various states making claims against originators, servicers, assignees and purchasers of high cost loans for violations of state law. Named defendants in these cases have included numerous participants within the secondary mortgage market. If our loans are found to have been originated in violation of predatory or abusive lending laws, we could incur losses, which could materially and adversely impact our results of operations, financial condition and business.
We are subject to compliance with the Uniting and Strengthening America by Providing Appropriate Tools Required to Intercept and Obstruct Terrorism Act of 2001 (commonly known as the PATRIOT Act), which is intended to strengthen the ability of U.S. law enforcement agencies and intelligence communities to work together to combat terrorism on a variety of fronts, and are required to establish anti-money laundering programs and file suspicious activity reports under the Bank Secrecy Act of 1970.
Some states have special rules that govern mortgage loan servicing practices, such as California’s Homeowner’s Bill or Rights. Failure to comply with these rules can result in delays or rescission of foreclosure, and subject the servicer to penalties and damages.
Other Laws
We are subject to various other laws, including employment laws related to hiring practices and termination of employees, health and safety laws, environmental laws and other federal, state and local laws in the jurisdictions in which we operate.
166
Table of Contents
Employees
As of September 30, 2020, we had 8,614 employees, all of whom are based in the United States. As of September 30, 2020, we also employed 1,398 full-time contractors and no part-time contractors. None of our employees are represented by a labor union and we consider our employee relations to be good.
Facilities and Real Estate
Our corporate headquarters are located at Towne Centre Plaza, 26632, 26642 and 26672 Towne Centre Drive, Foothill Ranch, California 92610, in a three building development totaling 144,398 square feet of leased office space. This location houses our corporate office, our largest sales and processing team, our support services, and operations, as well as our administrative offices.
We lease eleven additional facilities: one in Lake Forest, California; two in Irvine, California one in Franklin, Tennessee; two in Scottsdale, Arizona one in Chandler, Arizona; one in Walpole, Massachusetts; one in Southfield, Michigan; and two in Plano, Texas. Our Lake Forest location is primarily operations, support services, and settlement services, our Irvine locations are primarily sales and operations, and technology, our Franklin and Southfield locations are primarily sales offices, our Arizona locations and our Walpole location houses some of our sales, processing and operations employees, and our Plano locations include employees from nearly all aspects of our business, including our servicing department. In addition, we lease over 240 licensed sales office locations, in most states across the United States.
None of our leases extend beyond 10 years and the financial commitments are immaterial to the scope of our operations.
Intellectual Property
As of September 30, 2020, we hold 27 registered United States trademarks and 34 United States trademark applications, including with respect to the name “loanDepot,” “mello” and other logos and various additional designs and word marks relating to the “loanDepot” name, as well as seven United States patent applications. We do not otherwise rely on any registered copyrights or other forms of registered intellectual property. Our other intellectual property rights consist of unregistered copyrights, trade secrets, proprietary know-how and technological innovations that we have developed to maintain our competitive position.
Legal Proceedings
From time to time, we and certain of our subsidiaries are involved in various lawsuits in state or federal courts regarding violations of state or federal statutes, regulations or common law related to matters arising out of the ordinary course of business. We are not currently subject to any other material legal proceedings. See “Risk factors—Risks related to our business—We face litigation and legal proceedings that could have a material adverse effect on our revenues, financial condition, cash flows and results of operations.”
167
Table of Contents
Executive Officers and Directors
The following table sets forth information as to persons who serve as loanDepot, Inc.’s executive officers and directors. Biographical information for each of the executive officers and directors can be found below. The positions referenced in the biographies represent the final positions held. The number of directors which shall constitute the board of directors of loanDepot, Inc. will initially be fixed at seven directors, of whom five will be serving upon completion of the offering. We are in the process of identifying additional directors to join our board of directors.
| Name |
Age | Position(s) | ||||
| Anthony Hsieh |
55 | Chairman, Chief Executive Officer and Director | ||||
| Patrick Flanagan |
56 | Chief Financial Officer | ||||
| Jeff Walsh |
57 | Senior Executive Vice President, Chief Revenue Officer | ||||
| Jeff DerGurahian |
44 | Executive Vice President, Capital Markets | ||||
| John C. Dorman |
69 | Director | ||||
| Dawn Lepore |
65 | Director | ||||
| Brian P. Golson |
50 | Director | ||||
| Andrew C. Dodson |
43 | Director | ||||
Background of Our Executive Officers and Directors
Anthony Hsieh. Mr. Hsieh founded LDLLC and has served as Chairman and Chief Executive Officer since its formation in December 2009. He has been Chairman and Chief Executive Officer of loanDepot, Inc. since its formation in November 2020. Mr. Hsieh has more than 30 years of experience in the lending industry. Prior to starting LDLLC, he was instrumental in the development and success of many mortgage lending firms. In 2002, Mr. Hsieh founded HomeLoanCenter.com, the first national online lender to offer a full spectrum of mortgage loan products featuring live interest-rate quotes and loan offerings tailored to borrowers’ needs and credit profiles. He continued to lead the business for three years after it merged with IAC/Interactive subsidiary, LendingTree in 2004. In 1989, he acquired a mortgage brokerage company and transformed it into LoansDirect.com just as the internet sector was taking off. It became one of the most profitable and successful mortgage lenders throughout the 1990’s before it was acquired by E*TRADE Financial in 2001. Mr. Hsieh’s executive leadership experience and extensive knowledge of our business qualify him to serve as a member of our board of directors.
Patrick Flanagan. Mr. Flanagan was appointed Chief Financial Officer of LDLLC in December 2019, and joined the company in June 2017. Mr. Flanagan was appointed Chief Financial Officer of loanDepot, Inc. in January 2021. He has more than three decades of experience in the investment management, mortgage banking and fintech spaces, throughout which he has managed the origination, acquisition and servicing of more than $300 billion in residential mortgage and residential real estate assets. Prior to joining LD Holdings, he served as Executive Vice President at Carrington Mortgage Services from May 2016 to May 2017. From February 2015 until April 2016, he was a consultant at Waterfall Asset Management (“Waterfall Asset”). Prior to joining Waterfall Asset, he served as Chief Executive Officer and founder of Cove Financial from August 2009 until December 2014. Mr. Flanagan earned his undergraduate degree from Monmouth College.
Jeff Walsh. Mr. Walsh was appointed Senior Executive Vice President and Chief Revenue Officer of loanDepot, Inc. on the date of this prospectus and has served as Senior Executive Vice President and Chief Revenue Officer of LDLLC since December 2019. He joined LDLLC in 2012 as Executive Vice president of Operations, where he oversaw the growth and production of various departments including Processing, Human Resources, Vendor Management and Escrow. Mr. Walsh has more than 20 years of industry experience as well as an extensive background in both sales and operations for Wholesale and Retail Lending. Prior to coming to LDLLC, he served as chief operating officer of Ameriquest Mortgage Company (“Ameriquest”) where he led operations to increase sales production, developed proprietary modeling systems for collections and loss mitigation and transformed the company’s technology platforms. During his tenure at Ameriquest, he also commanded strategic operations and supervised loan operations including Human Resources, Accounting, and
168
Table of Contents
IT. Mr. Walsh also served as president of Town and Country Credit. He has completed extensive leadership and management training, including executive-development programs at Kenan-Flagler Business School at the University of North Carolina and the Center for Creative Leadership in Colorado Springs, Colorado. He attended West Valley College in Saratoga, California and San Jose College for his undergraduate studies.
Jeff DerGurahian. Mr. DerGurahian was appointed Executive Vice President, Capital Markets of loanDepot, Inc. at its formation in November 2020 and has served as Executive Vice President and Chief Capital Markets Officer of LDLLC since joining us in May 2012. He oversees our secondary marketing and capital markets efforts including investor relations, loan trading, hedging, pricing strategies, servicing, post-closing operations and product development. Prior to joining LDLLC, Mr. DerGurahian served for nine years as Executive Vice President of Capital Markets for Prospect Mortgage, LLC (formerly MetroCities Mortgage), and was a Hedge Manager for Tuttle Risk Management Services before joining Prospect Mortgage. Mr. DerGurahian holds a bachelor’s degree in Finance from the University of Virginia.
John C. Dorman. Mr. Dorman was appointed as a director of LDLLC in July 2015 and as a director of loanDepot, Inc. as of the date of this prospectus. Mr. Dorman served as a director of Online Resources Corporation, a developer and supplier of electronic payment services, from May 2009 until it was sold to ACI Worldwide, Inc. in March 2013, and as its Chairman from June 2010 until the sale. Mr. Dorman previously served as Co-Chairman of Online Resources Corporation from January 2010 to June 2010, and as Interim Chief Executive Officer from April 2010 to June 2010. From October 1998 to August 2003, he served as Chief Executive Officer of Digital Insight Corporation, a provider of software-as-a-service for online banking and bill payment for financial institutions, and served on the board of directors of Digital Insight until the company was acquired in 2007 by Intuit, Inc. Mr. Dorman served as Senior Vice President of the Global Financial Services Division of Oracle Corporation from August 1997 to October 1998; and Chairman and Chief Executive Officer of Treasury Services Corporation, a provider of modeling and analysis software for financial institutions, from 1983 to 1997. Mr. Dorman also serves on the boards of directors of CoreLogic, Inc. (NYSE: CLGX) and DeepDyve, Inc. Mr. Dorman earned a B.A. in Business Administration and Philosophy from Occidental College and an M.B.A. in Finance from the University of Southern California. Mr. Dorman’s extensive business and financial management experience qualify him to serve as a member of our board of directors.
Dawn Lepore. Ms. Lepore was appointed as a director of LDLLC in July 2015 and as a director of loanDepot, Inc. as of the date of this prospectus. Ms. Lepore served as Interim Chief Executive Officer of Prosper Marketplace, Inc., an online peer-to-peer lending platform, from March 2012 to January 2013, and as Chairman and Chief Executive Officer of drugstore.com, inc., an online retailer of health and beauty care products, from October 2004 until its sale to Walgreen Co. in June 2011. Prior to joining drugstore.com, Ms. Lepore held various leadership positions during her 21 years with The Charles Schwab Company, an investment services firm that provides brokerage, banking and investment-related services to consumers and businesses. Ms. Lepore also serves on the boards of directors of Accolade, Inc. (NASDAQ: ACCD) and RealNetworks, Inc. (NASDAQ: RNWK). Ms. Lepore previously served on the boards of directors of Coupons.com from February 2012 to November 2017, AOL Inc. from November 2012 to June 2015, The TJX Companies, Inc. from June 2013 to June 2014, eBay Inc. from December 1999 to January 2013, The New York Times Company from 2008 to 2011, drugstore.com, inc. from 2004 to 2011 and Wal-Mart Stores Inc. from 2001 to 2004. Ms. Lepore earned a B.A. from Smith College. Ms. Lepore’s extensive operational background and experience as an executive and director at a diverse range of online consumer, internet technology and retail companies qualify her to serve as a member of our board of directors.
Brian P. Golson. Mr. Golson was appointed as a director of LDLLC in December 2009 and as a director of loanDepot, Inc. as of the date of this prospectus. Mr. Golson is the Co-CEO and Managing Partner at Parthenon Capital and has been with Parthenon Capital since 2002. Prior to joining Parthenon Capital, Mr. Golson was the Chief Financial Officer and Vice President of Operations for Everdream, a software company sold to Dell providing outsourced IT infrastructure management. Mr. Golson also held leadership positions with Prometheus Partners, a middle-market private equity fund focused on recurring revenue service businesses, and GE Capital
169
Table of Contents
where he focused on acquisitions and divestitures of financial services and insurance businesses. Mr. Golson also serves on the boards of directors of Bluesnap, eTix, BillingTree, PayRoc, Edge, eSec Lending, ICD, Periscope Holdings and DaySmart. Mr. Golson earned a Bachelor of Arts in Economics from the University of North Carolina, Chapel Hill and a Master of Business Administration from the Harvard Business School.
Andrew C. Dodson. Mr. Dodson was appointed as a director of LDLLC in December 2009 and as a director of loanDepot, Inc. as of the date of this prospectus. Mr. Dodson is a Managing Partner at Parthenon Capital and has been with Parthenon Capital since 2005. Prior to joining Parthenon Capital, Mr. Dodson was a consultant with Bain & Co from 2004 to 2005. where he focused on mergers and acquisitions, cost control and corporate strategy for middle market technology companies. Mr. Dodson was also a financial analyst for Enron Corporation in the company’s retail group and worked for Trilogy, Inc., an enterprise software company, where he focused primarily in business development. Mr. Dodson also serves on the boards of directors of EdgeCo Holdings, Envysion, ICD, Millennium Trust and Venbrook. Mr. Dodson earned a Bachelor of Arts from Duke University and a Master of Business Administration from the Harvard Business School.
Board Composition
The number of directors which shall constitute the board of directors of loanDepot, Inc. will initially be fixed at seven directors, of whom five will be serving upon completion of the offering. Vacancies on our board of directors shall be filled solely by a majority of the directors then in office, even if less than a quorum, or by a sole remaining director. Upon the completion of the offering, our board of directors will be divided into three classes, each serving staggered, three-year terms:
| • | our Class I directors will be Dawn Lepore and an independent director to be named following the offering, and their terms will expire at the first annual meeting of stockholders following the completion of the offering; |
| • | our Class II directors will be Andrew Dodson and a director to be named by Anthony Hsieh following the offering pursuant to the Stockholders Agreement and their terms will expire at the second annual meeting of stockholders following the completion of this offering; and |
| • | our Class III directors will be Anthony Hsieh, Brian Golson and John Dorman and their terms will expire at the third annual meeting of stockholders following the completion of this offering. |
As a result, only one class of directors will be elected at each annual meeting of stockholders, with the other classes continuing for the remainder of their respective terms.
Effective upon the completion of the offering, we will enter into a stockholders agreement with the Parthenon Stockholders and Hsieh Stockholders (and their respective permitted transferees thereunder party thereto from time to time). Pursuant to the stockholders agreement, the Parthenon Stockholders will have (i) the right to designate two nominees for election to our board of directors so long as such group owns at least 15% of the total voting power of our common stock, and (ii) otherwise one nominee for election to our board of directors so long as such group owns at least 5% of the total voting power of our common stock. Additionally, the Hsieh Stockholders, will have (i) the right to designate two nominees for election to our board of directors so long as such group owns at least 5% of the total voting power of our common stock, and (ii) upon the Parthenon Stockholders’ ceasing to own more than 15% of the total voting power of our common stock, the Hsieh Stockholders shall have the right to designate an additional nominee to the our board of directors so long as (a) such nominee is independent under the NYSE listing standards and (b) the Hsieh Stockholders own greater than 25% of the total voting power of our common stock. We will agree to take certain actions to support those nominees for election and include the nominees in the relevant proxy statements. Brian P. Golson and Andrew C. Dodson are the initial designated nominees of the Parthenon Stockholders. Anthony Hsieh is the sole initial designated nominee of the Hsieh Stockholders. Additionally, the Hsieh Stockholders will be entitled to recommend the Class I board seat that will remain vacant upon consummation of this offering until such seat is filled. The Parthenon Stockholders and the Hsieh Stockholders will each additionally agree to take all necessary action, including voting their respective shares of common stock, to cause the election of the directors nominated by such other group in accordance with the terms of the stockholders agreement, and will each be entitled to
170
Table of Contents
propose the replacement for any of its board designees whose board service ceases for any reason. The stockholders agreement also provides for certain restrictions and rights with respect to transfer and sale of our Class A Common Stock (including Class A Common Stock received following an exchange of Holdco Units and shares of Class B and Class C Common Stock pursuant to the Holdings LLC Agreement) by the parties to the stockholders agreement. See “Certain Relationships and Related Party Transactions—Stockholders Agreement.”
Our board of directors has undertaken a review of the independence of each director. Based on information provided by each director concerning his or her background, employment, and affiliations, our board of directors has determined that John C. Dorman and Dawn Lepore do not have a relationship that would interfere with the exercise of independent judgment in carrying out the responsibilities of a director and that each of these directors is “independent” as that term is defined under the applicable rules and regulations of the SEC and the listing standards of the NYSE. In making these determinations, our board of directors considered the current and prior relationships that each non-employee director has with our Company and all other facts and circumstances our board of directors deemed relevant in determining their independence, including the beneficial ownership of our capital stock by each non-employee director, and the transactions involving them described in the section titled “Certain Relationships and Related Party Transactions.”
Controlled Company
Upon completion of this offering, we will be a “controlled company” under the NYSE’s corporate governance standards. As a controlled company, exemptions under the standards will free us from the obligation to comply with certain corporate governance requirements, including the requirements:
| • | that a majority of our board of directors consists of “independent directors,” as defined under the NYSE listing standards; |
| • | that we have a nominating and corporate governance committee that is composed entirely of independent directors with a written charter addressing the committee’s purpose and responsibilities; |
| • | that we have a compensation committee that is composed entirely of independent directors with a written charter addressing the committee’s purpose and responsibilities; and |
| • | for an annual performance evaluation of the nominating and corporate governance committee and compensation committee. |
Because we intend to avail ourselves of the “controlled company” exception under NYSE rules, we may choose to rely upon these exemptions. These exemptions, however, do not modify the independence requirements for our audit committee, and we intend to comply with the requirements of Rule 10A-3 of the Exchange Act, and the rules of the NYSE within the applicable time frame. These rules require that our audit committee be composed of at least three members, a majority of whom must be independent within 90 days of the effective date of the registration statement of which this prospectus forms a part, and all of whom must be independent within one year of the effective date of the registration statement of which this prospectus forms a part.
Board Committees
In connection with the completion of this offering, our board of directors will have three standing committees: an audit committee, a compensation committee and a governance and nominating committee. Each of the committees will report to the board of directors as they deem appropriate, and as the board of directors may request. The expected composition, duties and responsibilities of these committees are set forth below. In the future, our board of directors may establish other committees, as it deems appropriate, to assist it with its responsibilities.
Audit Committee
The audit committee will provide assistance to the board of directors in fulfilling its legal and fiduciary obligations in matters involving our accounting, auditing, financial reporting, internal control and legal compliance functions by approving the services performed by our independent registered public accounting firm
171
Table of Contents
and reviewing their reports regarding our accounting practices and systems of internal accounting controls. The audit committee will also oversee the audit efforts of our independent registered public accounting firm and takes those actions as it deems necessary to satisfy itself that the independent registered public accounting firm is independent of management. Upon completion of this offering, our audit committee will consist of John Dorman (Chair), Dawn Lepore and Andrew Dodson. The SEC rules and the NYSE rules require us to have one independent audit committee member upon the listing of our Class A Common Stock on the NYSE, a majority of independent directors on the audit committee within 90 days of the effective date of the registration statement of which this prospectus forms a part and all independent audit committee members within one year of the effective date of the registration statement of which this prospectus forms a part. Our board of directors has affirmatively determined that John Dorman and Dawn Lepore meet the definition of “independent directors” for purposes of serving on an audit committee under applicable SEC and NYSE rules, and, to the extent applicable, we intend to comply with these independence requirements within the time periods specified. In addition, John Dorman will qualify as our “audit committee financial expert,” as such term is defined in Item 407 of Regulation S-K. Our board of directors will adopt a new written charter for the audit committee, which will be available on the Investor Relations section of our website at www.loandepot.com upon the completion of this offering. The information on our website is not intended to form a part of or be incorporated by reference into this prospectus.
Compensation Committee
After completion of the offering, the compensation committee will determine our general compensation policies and the compensation provided to our directors and officers. The compensation committee will also review and determine bonuses for our officers and other employees. In addition, the compensation committee will review and determine or recommend to the board of directors equity-based compensation for our directors, officers, employees and consultants and will administer our equity incentive plans. Our compensation committee will also oversee our corporate compensation programs. As a controlled company, we may rely upon the exemption from the NYSE requirement that we have a compensation committee composed entirely of independent directors. Upon completion of this offering, our compensation committee will consist of Dawn Lepore (Chair), John Dorman and an individual selected by Anthony Hsieh pursuant to the Stockholders Agreement. Our board of directors will adopt a new written charter for the compensation committee, which will be available on the Investor Relations section of our website at www.loandepot.com upon the completion of this offering. The information on our website is not intended to form a part of or be incorporated by reference into this prospectus.
Governance and Nominating Committee
After completion of the offering, the governance and nominating committee will be responsible for making recommendations to the board of directors regarding candidates for directorships and the size and composition of the board. In addition, the governance and nominating committee will be responsible for overseeing our corporate governance guidelines and reporting and making recommendations to the board of directors concerning corporate governance matters. As a controlled company, we will rely upon the exemption from the NYSE requirement that we have a nominating and corporate governance committee composed entirely of independent directors. Upon completion of the offerings, our governance and nominating committee will consist of John Dorman (Chair), Dawn Lepore and an individual selected by Anthony Hsieh pursuant to the Stockholders Agreement. Our board of directors will adopt a written charter for the governance and nominating committee, which will be available on the Investor Relations section of our website at www.loandepot.com upon the completion of this offering. The information on our website is not intended to form a part of or be incorporated by reference into this prospectus.
Role of Our Board of Directors in Risk Oversight
One of the key functions of our board of directors is informed oversight of our risk management process. Our board of directors will administer this oversight function directly through our board of directors as a whole, as well as through various standing committees of our board of directors that will address risks inherent in their respective areas of oversight. In particular, our board of directors is responsible for monitoring and assessing strategic risk exposure, and our audit committee will have the responsibility to consider and discuss our major
172
Table of Contents
financial risk exposures and the steps our management has taken to monitor and control these exposures. The audit committee will also have the responsibility to review with management the process by which risk assessment and management is undertaken, monitor compliance with legal and regulatory requirements, and review with our independent auditors the adequacy and effectiveness of our internal controls over financial reporting. Our governance and nominating committee will be responsible for periodically evaluating the Company’s corporate governance policies and system in light of the governance risks that the Company faces and the adequacy of the Company’s policies and procedures designed to address such risks. Our compensation committee will assess and monitor whether any of our compensation policies and programs are reasonably likely to have a material adverse effect on the Company.
Compensation Committee Interlocks and Insider Participation
No interlocking relationship exists between our board of directors or compensation committee and the board of directors or compensation committee of any other entity, nor has any interlocking relationship existed in the past.
Codes of Ethics
Our board of directors will adopt a general code of ethics that applies to all of our employees, officers and directors effective upon the completion of the offering. In addition, our board of directors will adopt a code of ethics for executive officers and principal accounting personnel that applies to our principal executive officer, principal financial and accounting officer and other designated members of our management effective upon the completion of the offering. At that time, the full text of our codes of ethics will be available on the Investor Relations section of our website at www.loandepot.com. We intend to disclose future amendments to certain provisions of our codes of ethics, or waivers of certain provisions as they relate to our directors and executive officers, at the same location on our website or otherwise as required by applicable law. The information on our website is not intended to form a part of or be incorporated by reference into this prospectus.
Corporate Governance Guidelines
Our board of directors will adopt corporate governance guidelines in accordance with the corporate governance rules of the NYSE that serve as a flexible framework within which our board of directors and its committees operate. These guidelines will cover a number of areas including board membership criteria and director qualifications, director responsibilities, board agenda, meeting of independent directors, committee responsibilities and assignments, board member access to management and independent advisors, director communications with third parties, director compensation, director orientation and continuing education, evaluation of senior management and management succession planning. A copy of our corporate governance guidelines will be posted on our website.
173
Table of Contents
Compensation Discussion and Analysis
The purpose of this compensation discussion and analysis section is to provide information about the material elements of compensation that are paid, awarded to, or earned by, our “named executive officers,” who consist of our principal executive officer, principal financial officer, and the two other most highly compensated executive officers. For fiscal year 2020, our named executive officers were:
| • | Anthony Hsieh, Chairman and Chief Executive Officer; |
| • | Patrick Flanagan, Chief Financial Officer; |
| • | Jeff Walsh, Senior Executive Vice President, Chief Revenue Officer; and |
| • | Jeff DerGurahian, Executive Vice President, Capital Markets. |
Historical Compensation Decisions
Our compensation approach is necessarily tied to our stage of development. Prior to this offering, we were a privately-held company. As a result, we have not been subject to any stock exchange listing or SEC rules requiring a majority of our board of directors to be independent or relating to the formation and functioning of board committees, including audit, compensation and nominating committees. Most, if not all, of our prior compensation policies and determinations, including those made for fiscal year 2020, have been the product of negotiations between the named executive officers and our Chief Executive Officer and board of directors.
Compensation Philosophy and Objectives
Upon completion of this offering, our compensation committee will review and recommend to our board of directors that the compensation of our named executive officers be approved and our compensation committee will oversee and administer our executive compensation programs and initiatives. As we gain experience as a public company, we expect that the specific direction, emphasis and components of our executive compensation program will continue to evolve. For example, over time we may reduce our reliance upon subjective determinations made by our Chief Executive Officer and/or compensation committee in favor of a more empirically-based approach that involves benchmarking against peer companies. Accordingly, the compensation paid to our named executive officers for fiscal year 2020 is not necessarily indicative of how we will compensate our named executive officers after this offering.
We have strived to create an executive compensation program that balances short-term versus long-term payments and awards, cash payments versus equity awards and fixed versus contingent payments and awards in ways that we believe are most appropriate to motivate our executive officers. Our executive compensation program is designed to:
| • | attract and retain talented and experienced executives in our industry; |
| • | reward executives whose knowledge, skills and performance are critical to our success; |
| • | align the interests of our executive officers and stockholders by motivating executive officers to increase stockholder value and rewarding executive officers when stockholder value increases; |
| • | ensure fairness among the executive management team by recognizing the contributions each executive makes to our success; |
| • | foster a shared commitment among executives by aligning their individual goals with the goals of the executive management team and our company; and |
| • | compensate our executives in a manner that incentivizes them to manage our business to meet our long-range objectives. |
174
Table of Contents
Historically, compensation amounts have been highly individualized, resulting from arm’s length negotiations and have been based on a variety of informal factors including, in addition to the factors listed above, our financial condition and available resources, our need for that particular position to be filled and the compensation levels of our other executive officers, each as of the time of the applicable compensation decision. In addition, we informally considered the competitive market for corresponding positions within comparable geographic areas and companies of similar size and stage of development operating in our industry.
This informal consideration was based on the general knowledge possessed by our Chief Executive Officer and board of directors regarding the compensation given to some of the executive officers of other companies in our industry through informal discussions with recruiting firms, research and informal benchmarking against their personal knowledge of the competitive market. As a result, historically our Chief Executive Officer and board of directors have applied their subjective discretion to make compensation decisions and did not formally benchmark executive compensation against a particular set of comparable companies or use a formula to set the compensation for our executives in relation to survey data.
Our board of directors, and in certain cases, in consultation with our Chief Executive Officer, previously made compensation decisions for our executive officers and after thorough discussion of various factors, including any informal knowledge or data they may have had, would set the compensation for each executive officer on an individual basis. We anticipate that the compensation committee will more formally benchmark executive compensation against a peer group of comparable companies in the future. We also anticipate that the compensation committee may make adjustments in executive compensation levels in the future as a result of this more formal benchmarking process.
To achieve our compensation objectives moving forward, upon the completion of the offering, the compensation committee expects to work with Korn Ferry, an independent compensation consultant, to implement new compensation strategies that are appropriate to align a substantial portion of our executive’s overall compensation to key strategic financial and operational goals that are appropriate for a public company in our industry.
Compensation Committee Procedures
The compensation committee will meet outside the presence of all of our executive officers, including our named executive officers, to consider appropriate compensation for our Chief Executive Officer. For all other named executive officers, the compensation committee will meet outside the presence of all executive officers except our Chief Executive Officer. Going forward, our Chief Executive Officer will review annually each other named executive officer’s performance with the compensation committee and recommend appropriate base salary, cash performance awards and grants of long-term equity incentive awards for all other executive officers. Based upon the recommendations of our Chief Executive Officer and in consideration of the objectives described above and the principles described below, the compensation committee will approve the annual compensation packages of our executive officers other than our Chief Executive Officer. The compensation committee also will annually analyze our Chief Executive Officer’s performance and determine his base salary, cash performance awards and grants of long-term equity incentive awards based on its assessment of his performance with input from any consultants engaged by the compensation committee.
In order to ensure that we continue to remunerate our executives appropriately, the compensation committee has retained Korn Ferry as its independent compensation consultant to review its policies and procedures with respect to executive compensation in connection with this offering. Korn Ferry will assist the compensation committee by providing comparative market data on compensation practices and programs based on an analysis of peer competitors and by providing guidance on industry best practices. The compensation committee retains the right to modify or terminate its relationship with Korn Ferry or select other outside advisors to assist the compensation committee in carrying out its responsibilities.
175
Table of Contents
Mitigation of Risk
The Company has determined that any risks arising from its compensation programs and policies are not reasonably likely to have a material adverse effect on the Company. The Company’s compensation programs and policies mitigate risk by combining performance-based, long-term compensation elements with payouts that are highly correlated to the value delivered to stockholders. The combination of performance measures for annual bonuses and the equity compensation programs, as well as the multiyear vesting schedules for equity awards encourage employees to maintain both a short and a long-term view with respect to Company performance.
Elements of Compensation
Our current executive compensation program, which was set by our board of directors, consists of the following components:
| • | base salary; |
| • | annual cash incentive awards linked to our overall performance; |
| • | periodic grants of long-term equity-based compensation; |
| • | other executive benefits and perquisites; and |
| • | employment agreements and offer letters, which contain termination benefits. |
We combine these elements in order to formulate compensation packages that provide competitive pay, reward the achievement of financial, operational and strategic objectives and align the interests of our executive officers and other senior personnel with those of our stockholders.
Base Salary
The primary component of compensation of our executive officers has historically been base salary. The base salary established for each of our executive officers is intended to reflect each individual’s responsibilities, experience, prior performance and other discretionary factors deemed relevant by our Chief Executive Officer and board of directors. Base salary is also designed to provide our executive officers with steady cash flow during the course of the fiscal year that is not contingent on short-term variations in our corporate performance. Our Chief Executive Officer and board of directors determine market level compensation for base salaries based on our executives’ experience in the industry with reference to the base salaries of similarly situated executives in other companies of similar size and stage of development operating in our industry. This determination is informal and based primarily on the general knowledge of our Chief Executive Officer and board of directors practices within our industry and such base salaries have been periodically reviewed and adjusted by our Chief Executive Officer and board of directors. The base salaries paid to our named executive officers in fiscal year 2020 are set forth in the section “Summary Compensation Table” below.
On April 22, 2018, Mr. Hsieh voluntarily reduced his base salary for an indefinite period due to the Company’s performance. On March 28, 2020, Mr. Hsieh’s base salary reduction was reversed and his base salary was increased to $500,000.
Annual Cash Bonus
Historically, we have incentivized our executive officers, including our named executive officers, with annual cash bonuses that are intended to reward the achievement of corporate and individual performance objectives. Our board of directors has determined the target bonus opportunity for each named executive officer in consultation with the Chief Executive Officer.
In fiscal year 2020, our board of directors established the target percentage amounts for the cash bonuses for each of our named executive officers. For fiscal year 2020, Messrs. Hsieh, Flanagan, Walsh, and DerGurahian
176
Table of Contents
were eligible to receive annual target cash bonuses of 100%, 200%, 400% and 100%, respectively, of their fiscal year 2020 base salaries, which resulted in bonuses of $7,500,000 for Mr. Hsieh, $2,400,000 for Mr. Flanagan, $6,000,000 for Mr. Walsh, and $2,400,000 for Mr. DerGurahian. These bonuses will be paid in the first quarter of 2021.
We also provided a special one-time discretionary bonus to our named executive officers in fiscal year 2020. For additional information, please see footnote (1) of the section captioned “Summary Compensation Table” below.
Historical Long-Term Equity-Based Compensation
Prior to the offering, we have historically awarded equity-based compensation in the form of Class Z Common Units of LDLLC (such units “Class Z Units”), Class Y Common Units of LDLLC (“Class Y Units”), Class X Common Units of LDLLC (“Class X Units”), Class W Common Units of LDLLC (“Class W Units”), and/or Class V Common Units of LDLLC (“Class V Units”), in each case, that are intended to constitute “profits interests” for U.S. federal income tax purposes, and represent the right to share in any increase in the equity value of the company that exceeds a specified threshold (collectively, the “Incentive Units”). Following the 2018 restructuring of the Company pursuant to which LD Holdings became the principal owner of LDLLC, all of the Incentive Units of LDLLC were exchanged for substantially similar equity of LD Holdings, and Incentive Units granted after January 1, 2019 were Incentive Units of LD Holdings. The Incentive Units generally time-vest over a four or five year period, subject to the grantee’s continued employment with the Company on the applicable vesting date. Any unvested Incentive Units will generally be forfeited upon an Incentive Unit holder terminating their employment with the Company for any reason or no reason at all. A more detailed description of the vesting terms with regards to the Class X Units and Class V Units granted to our named executive officers can be found in “Narrative Disclosure to Summary Compensation Table and Grants of Plan-Based Awards Table — Current Offer Letters and Employment Agreements with Named Executive Officers” below.
In general, our board of directors previously considered an executive officer’s current position with our Company, the size of the executive officer’s total compensation package and the amount of existing vested and unvested equity awards, if any, then held by the executive officer. As a private company, no formal benchmarking efforts were made by our board of directors with respect to the size of equity grants made to executive officers and, in general, the determination process was very informal. Historically, our Chief Executive Officer and our board of directors have made all equity grant decisions with respect to our executive officers, and we anticipate that, upon completion of this offering, the compensation committee will, subject to approval by the board of directors as deemed necessary by the compensation committee, determine the size and terms and conditions of equity grants to our executive officers in accordance with the terms of the applicable incentive equity program and will approve them on an individual basis.
We granted 213,137,186 Class X Units in exchange for 61,715,807 Class V Units (collectively, the “Exchanged Units”) and an additional 114,415,949 Class X Units to our named executive officers during 2020. Such Class V Units were then subsequently cancelled for no further consideration. The exchange for new grants and the additional grants were made to ensure that our equity-based compensation continues to align the interests of our named executive officers with the success of the Company. For a discussion of the vesting and other material terms of the Incentive Units, see “Narrative Disclosure to Summary Compensation Table and Grants of Plan-Based Awards Table — Incentive Unit Awards” below.
2021 Equity Incentive Plan
Effective upon the completion of this offering, we will implement the loanDepot, Inc. 2021 Omnibus Incentive Plan. Our 2021 Omnibus Incentive Plan will allow for the grant of equity incentives, such as grants of stock options, restricted stock, restricted stock units and stock appreciation rights. For more information relating to our 2021 Omnibus Incentive Plan, see “2021 Omnibus Incentive Plan” below. In connection with this offering,
177
Table of Contents
we will be making an equity incentive grant of under the 2021 Omnibus Incentive Plan to Messrs. Hsieh, Walsh, and DerGurahian. For more information relating to our grant under the 2021 Omnibus Incentive Plan to Messrs. Hsieh, Walsh, and DerGurahian, see “Recent Changes to Executive Compensation” below.
Other Executive Benefits and Perquisites
We provide the following benefits to our executive officers on the same basis as other eligible employees:
| • | health, dental and vision insurance; |
| • | vacation, paid holidays and sick days; |
| • | life insurance and supplemental life insurance; |
| • | short-term and long-term disability; and |
| • | a 401(k) plan with matching contributions. |
We believe these benefits are generally consistent with those offered by other companies and specifically with those companies with which we compete for employees.
In 2020, as a result of the COVID-19 pandemic, commencing in August 2020, we also made monthly rental payments for an apartment that our Chief Executive Officer generally used as temporary office space. We will continue making these rent payments through the expiration of the lease on February 28, 2021 but do not anticipate renewing such lease. For additional information, please see footnote (4) of the section captioned “Summary Compensation Table” below.
Employment Agreements and Severance Benefits
We previously entered into an employment agreement and offer letters (as applicable) with our named executive officers, which were in effect in 2020 and provide for certain severance entitlements in connection with a qualifying termination. The terms of the existing employment agreement and offer letters with our named executive officers are described in the section captioned “Narrative Disclosure to Summary Compensation Table and Grants of Plan Based Award Tables – Current Offer Letters and Employment Agreements with Named Executive Officers.”
In connection with this offering, we will be entering into new employment agreements with our named executive officers, the terms of which are described in the section captioned “Recent Changes to Executive Compensation.”
Tax and Accounting Considerations
Section 280G of the Internal Revenue Code
Section 280G of the Code disallows a tax deduction with respect to “excess parachute payments” to certain executive officers of companies that undergo a change in control. In addition, Section 4999 of the Code imposes a 20% excise tax penalty on the individual receiving the “excess parachute payment.” Parachute payments are compensation that is linked to or triggered by a change in control and may include, but are not limited to, bonus payments, severance payments, certain fringe benefits, and payments and acceleration of vesting from long-term incentive plans or programs and other equity-based compensation. “Excess parachute payments” are parachute payments that excess a threshold determined under Section 280G of the Internal Revenue Code based on an executive officer’s prior compensation. In approving compensation arrangements for our named executive officers in the future, we expect that the board of directors will consider all elements of the cost to us of providing such compensation, including the potential impact of Section 280G of the Code. However, the board of directors may, in its judgment, authorize compensation arrangements that could give rise to loss of deductibility
178
Table of Contents
of Section 280G of the Code and the imposition of excise taxes under Section 4999 of the Code when it believes that such arrangements are appropriate to attract and retain executive talent. We do not provide for excise tax gross-ups to our executive officers and do not expect to do so in the future.
Section 409A Considerations
Another section of the Code, Section 409A, affects the manner by which deferred compensation opportunities are offered to our employees because Section 409A requires, among other things, that “non-qualified deferred compensation” be structured in a manner that limits employees’ abilities to accelerate or further defer certain kinds of deferred compensation. We intend to operate our existing compensation arrangements that are covered by Section 409A in accordance with the applicable rules thereunder, and we will continue to review and amend our compensation arrangements where necessary to comply with Section 409A.
Accounting for Stock-Based Compensation
We follow Financial Accounting Standards Board Accounting Standards Codification Topic 718, or ASC 718, for our equity-based compensation awards. ASC 718 requires companies to calculate the grant date “fair value” of their equity-based awards using a variety of assumptions. ASC 718 also requires companies to recognize the compensation cost of their equity-based awards in their income statements over the period that an associate is required to render service in exchange for the award. Future grants of stock options, restricted stock, restricted stock units and other equity-based awards under our equity incentive award plans will be accounted for under ASC 718. We anticipate that the compensation committee will regularly consider the accounting implications of significant compensation decisions, especially in connection with decisions that relate to our equity incentive award plans and programs. As accounting standards change, we may revise certain programs to appropriately align accounting expenses of our equity awards with our overall executive compensation philosophy and objectives.
Stockholder Say-on-Pay and Say-on Frequency Vote
Our stockholders will have their first opportunity to cast an advisory vote to approve our named executive officers’ compensation at our next annual meeting of stockholders and to determine the frequency of these advisory votes. In the future, we intend to consider the outcome of the say-on-pay and say-on-frequency votes when making compensation decisions regarding our named executive officers.
Summary Compensation Table
The following table sets forth certain information with respect to compensation for the fiscal years ended December 31, 2020, December 31, 2019, and December 31, 2018.
| Name and Principal Position |
Year | Salary ($) |
Bonus ($)(1) |
Stock Awards ($)(2) |
Non-Equity Incentive Plan Compensation ($)(3) |
All Other Compensation ($)(4) |
Total ($) |
|||||||||||||||||||||
| Anthony Hsieh (5) |
2020 | 408,994 | (6) | 42,500,000 | — | 7,500,000 | 27,975 | 50,436,969 | ||||||||||||||||||||
| 2019 | 5,148 | — | 1,250,000 | — | 1,255,148 | |||||||||||||||||||||||
| 2018 | 138,573 | — | — | — | 138,573 | |||||||||||||||||||||||
| Patrick Flanagan |
2020 | 439,231 | (6) | 12,600,000 | 1,687,785 | 2,400,000 | 9,025 | 17,136,041 | ||||||||||||||||||||
| 2019 | 400,000 | — | 714,950 | 8,400 | 1,123,350 | |||||||||||||||||||||||
| 2018 | 400,000 | 177,146 | 250,171 | 6,859 | 834,176 | |||||||||||||||||||||||
| Jeff Walsh |
2020 | 601,437 | (6) | 9,000,000 | 2,843,699 | 6,000,000 | 9,025 | 18,454,161 | ||||||||||||||||||||
| 2019 | 423,077 | — | 1,890,000 | 8,400 | 2,321,477 | |||||||||||||||||||||||
| 2018 | 400,000 | — | 750,000 | 8,250 | 1,158,250 | |||||||||||||||||||||||
| Jeff DerGurahian |
2020 | 450,001 | (6) | 12,600,000 | 797,806 | 2,400,000 | 2,639 | 16,250,446 | ||||||||||||||||||||
| 2019 | 361,298 | — | 318,750 | 2,055 | 682,103 | |||||||||||||||||||||||
| 2018 | 351,192 | — | 131,250 | 1,865 | 484,307 | |||||||||||||||||||||||
179
Table of Contents
| (1) | The amounts reported in this column reflect special one-time discretionary bonuses. Our board of directors and our CEO participated in the determination of the special bonus allocations. |
| (2) | The amounts reported in this column reflect the aggregate dollar amounts recognized for Incentive Units for financial statement reporting purposes for each respective fiscal year (disregarding any estimate of forfeitures related to service-based vesting conditions) in accordance with FASB ASC 718. See note 20 to our audited consolidated financial statements included elsewhere in this prospectus. The amounts included in that column include the following: |
| Name |
Year | Class V Unit (#) |
Class V Unit ($) |
Class X Unit (#) |
Class X Unit ($) |
|||||||||||||||
| Anthony Hsieh |
2020 | — | — | — | — | |||||||||||||||
| 2019 | — | — | — | — | ||||||||||||||||
| 2018 | — | — | — | — | ||||||||||||||||
| Patrick Flanagan |
2020 | — | — | 103,736,000 | 1,687,785 | |||||||||||||||
| 2019 | — | — | — | — | ||||||||||||||||
| 2018 | 18,925,879 | 177,146 | — | — | ||||||||||||||||
| Jeff Walsh |
2020 | — | — | 174,781,728 | 2,843,699 | |||||||||||||||
| 2019 | — | — | — | — | ||||||||||||||||
| 2018 | — | — | — | — | ||||||||||||||||
| Jeff DerGurahian |
2020 | — | — | 49,035,407 | 797,806 | |||||||||||||||
| 2019 | — | — | — | — | ||||||||||||||||
| 2018 | — | — | — | — | ||||||||||||||||
| (3) | The amounts reported in this column represent annual cash bonuses to our named executive officers earned during each respective fiscal year, as further described below under “Narrative Disclosure to Summary Compensation Table and Grants of Plan-Based Awards Table — Current Offer Letters and Employment Agreements with Named Executive Officers.” |
| (4) | This column includes 401(k) Plan contributions for eligible employees and other personal benefits. The amounts included in that column include the following: |
| Name |
Year | 401(k) Match(a) |
Other Personal Benefits |
|||||||||
| Anthony Hsieh |
2020 | — | 27,975 | (b) | ||||||||
| 2019 | — | — | ||||||||||
| 2018 | — | — | ||||||||||
| Patrick Flanagan |
2020 | 8,550 | 475 | (c) | ||||||||
| 2019 | 8,400 | — | ||||||||||
| 2018 | 6,859 | — | ||||||||||
| Jeff Walsh |
2020 | 8,550 | 475 | (c) | ||||||||
| 2019 | 8,400 | — | ||||||||||
| 2018 | 8250 | — | ||||||||||
| Jeff DerGurahian |
2020 | 2,164 | 475 | (c) | ||||||||
| 2019 | 2,055 | — | ||||||||||
| 2018 | 1,865 | — | ||||||||||
| (a) | Reflects amounts of contributions to the 401(k) Plan for eligible employees. |
| (b) | Reflects a onetime $475 work from home stipend and $27,500 in rental payments for an apartment located in Newport Beach, CA generally used as temporary office space for Mr. Hsieh. The Company made monthly rental payments of $5,500 from August, 2020 through the end of the year. The lease on |
180
Table of Contents
| the apartment expires on February 28, 2021, and the Company does not anticipate renewing the lease. The Company did not pay for any other fees or expenses related to the apartment other than the monthly rental payments. |
| (c) | Reflects a onetime $475 work from home stipend. |
| (5) | Mr. Hsieh also serves as the Chairman of our board of directors but does not receive any additional compensation for his service as a director. |
| (6) | Represents the aggregate total of base salary along with payout of unused floating holidays and/or accrued but unused vacation during 2020 (“Accrued Holidays”). The total base salary and Accrued Holidays for each executive in 2020 were as follows: |
| Name |
Base Salary ($) |
Accrued Holidays ($) |
||||||
| Anthony Hsieh |
397,455 | 11,539 | ||||||
| Patrick Flanagan |
403,077 | 36,154 | ||||||
| Jeff Walsh |
503,846 | 97,591 | ||||||
| Jeff DerGurahian |
377,885 | 72,116 | ||||||
2020 Grants of Plan-Based Awards
The following table sets forth certain information with respect to grants of plan-based awards for the year ended December 31, 2020 with respect to our named executive officers.
| Name |
Grant Date |
Estimated Future Payouts Under Non-Equity Incentive Plan Awards(1) |
All Other Stock Awards: Number of Shares of Stock or Units (#)(2) |
Grant Date Fair Value of Stock and Option Awards ($)(3) |
||||||||||||||||||||
| Threshold ($) |
Target ($) |
Maximum ($) |
||||||||||||||||||||||
| Anthony Hsieh |
||||||||||||||||||||||||
| Bonus |
1/10/20 | — | 7,500,000 | — | ||||||||||||||||||||
| Class X Units |
— | — | — | |||||||||||||||||||||
| Patrick Flanagan |
||||||||||||||||||||||||
| Bonus |
1/10/20 | — | 2,400,000 | — | ||||||||||||||||||||
| Class X Units |
6/5/20 | 103,736,000 | (3) | 1,687,785 | (5) | |||||||||||||||||||
| Jeff Walsh |
||||||||||||||||||||||||
| Bonus |
1/10/20 | — | 6,000,000 | — | ||||||||||||||||||||
| Class X Units |
6/5/20 | 174,781,728 | (4) | 2,843,699 | (6) | |||||||||||||||||||
| Jeff DerGurahian |
||||||||||||||||||||||||
| Bonus |
1/10/20 | — | 2,400,000 | — | ||||||||||||||||||||
| Class X Units |
6/5/20 | 49,035,407 | 797,806 | |||||||||||||||||||||
| (1) | The amounts reported in this column reflect the target bonus award opportunities to our named executive officers in 2020. We do not have a threshold or maximum payout with respect to our cash incentive award opportunities. The actual amounts earned by each of our executive officer in 2020 are set forth in the section titled “Summary Compensation Table” under the column “Bonus.” |
| (2) | Represents the number of Class X Units granted in 2020 that are subject to the vesting conditions set forth below in the section titled “Narrative Disclosure to Summary Compensation Table and Grants of Plan- |
181
Table of Contents
| Based Awards Table — Incentive Unit Awards — Class X Units” and “Narrative Disclosure to Summary Compensation Table and Grants of Plan-Based Awards Table — Incentive Unit Awards — Class V Units.” |
| (3) | Represents the aggregate grant date fair values, respectively, of Class X Units granted in 2020. The methodology to determine their value is described in further detail in the section titled “Summary Compensation Table” under footnote (2). |
| (4) | Represents a grant of 71,045,729 Exchanged Units, and a grant of an additional 32,690,271 Class X Units. |
| (5) | Represents a grant of 142,091,457 Exchanged Units, and a grant of an additional 32,690,271 Class X Units. |
| (6) | Represents the aggregate value of $1,155,914 of Exchanged Units and $531,871 of Class X Units. |
| (7) | Represents the aggregate value of $2,311,828 of Exchanged Units and $531,871 of Class X Units. |
Narrative Disclosure to Summary Compensation Table and Grants of Plan-Based Awards Table
Current Offer Letters and Employment Agreements with Named Executive Officers
We have entered into an employment agreement with Mr. Hsieh and an offer letter with each of Messrs. Flanagan, Walsh, and DerGurahian. The material terms of the employment agreement and the offer letters are summarized below. These summaries are qualified by reference to the actual text of the agreements, which will be filed as exhibits to the registration statement of which this prospectus forms a part.
Mr. Hsieh
Mr. Hsieh previously entered into an employment agreement with the Company, dated December 30, 2009, (the “Hsieh Agreement”). The Hsieh Agreement provides for an initial two-year term and automatically renews for a successive one-year period unless either party provides written notice of at least 30 days prior to the end of the applicable renewable period. Mr. Hsieh is entitled to receive a minimum annual base salary of $350,000, subject to annual review by the Company’s board of directors, and is eligible to participate in the Company’s equity incentive programs. Mr. Hsieh is also eligible to participate in any bonus pool established by the board of directors and in the manner determined by the board of directors as can participate in the Company’s employee and fringe benefit plans as may be in effect from time to time on the same basis as other similarly situated executives of the Company generally.
On April 22, 2018, Mr. Hsieh voluntarily reduced his base salary for an indefinite period due to the Company’s performance. This reduction in salary amounted to Mr. Hsieh having a new annualized salary of $4,779 in 2018 and $5,148 in 2019. On March 28, 2020, Mr. Hsieh’s base salary reduction was reversed and his base salary was increased to $500,000.
For a description of the payments and benefits Mr. Hsieh would be entitled to receive under the Hsieh Agreement in connection with a qualifying termination, see the section “Potential Payments Upon a Termination or Change in Control” below.
Mr. Flanagan
Mr. Flanagan previously entered into an offer letter with the Company, dated May 17, 2017 (the “Flanagan Letter”). The Flanagan Letter provides for at-will employment without a specified term. Mr. Flanagan is entitled to receive an annual base salary of $400,000 and is eligible to participate in the Company’s equity incentive programs and the Company’s other employee and fringe benefits plans, as may be in effect from time to time. Mr. Flanagan is also eligible to receive an annual discretionary bonus with a minimum annual bonus amount of $250,000 and a target bonus equal to $800,000.
For a description of the payments and benefits Mr. Flanagan would be entitled to receive under the Flanagan Letter in connection with a qualifying termination, see the section “Potential Payments Upon a Termination or Change in Control” below.
182
Table of Contents
Mr. Walsh
Mr. Walsh previously entered into an offer letter with the Company, dated October 22, 2012 (the “Walsh Letter”). The Walsh Letter provides for at-will employment without a specified term. Mr. Walsh is entitled to receive an annual base salary of $300,000 and is eligible to participate in the Company’s equity incentive programs and the Company’s other employee and fringe benefits plans, as may be in effect from time to time. Mr. Walsh is also eligible to receive eligible to receive an annual discretionary bonus based on individual and Company performance with a target bonus equal to $600,000. On September 27, 2019, Mr. Walsh entered into a letter of understanding to the Company pursuant to which Mr. Walsh’s base salary was increased to $500,000 and increased his annual target bonus amount to $2,100,000, of which $1,000,000 was guaranteed to be paid in 2019.
Mr. DerGurahian
Mr. DerGurahian previously entered into an offer letter with the Company, dated April 25, 2012 (the “DerGurahian Letter”). The DerGurahian Letter provides for at-will employment without a specified term. Mr. DerGurahian is entitled to receive an annual base salary of $320,000 and is eligible to participate in the Company’s equity incentive programs and the Company’s other employee and fringe benefits plans, as may be in effect from time to time. Mr. DerGurahian is also entitled to an annual bonus based on individual and Company performance with a target bonus equal to $320,000. The DerGurahian Letter also provided for a reimbursement of up to $80,000 in relocation expenses. On March 8, 2018, Mr. DerGurahian’s annual base salary was increased to $375,000.
For a description of the payments and benefits Mr. DerGuriahian would be entitled to receive under the DerGurahian Letter in connection with a qualifying termination, see the section “Potential Payments Upon a Termination or Change in Control” below.
Incentive Unit Awards
We have granted Incentive Units pursuant to unit grant agreements for the Incentive Units with PCP Managers, L.P. Class Z Units were granted under the LDLLC 2009 Incentive Equity Plan (the “2009 Equity Plan”), Class Y Units were granted under the LDLLC 2012 Incentive Equity Plan (the “2012 Equity Plan”), Class W Units and Class X Units were granted pursuant to the LDLLC 7th Amended and Restated LLC Agreement, dated December 31, 2015 (the “LLC Agreement”), and the Class V Units were granted under the LDLLC 2015 Incentive Equity Plan (the “2015 Equity Plan”). Following the 2018 restructuring of the Company pursuant to which LD Holdings became the principal owner of LDLLC, all of the Incentive Units of LDLLC were exchanged for substantially similar equity of LD Holdings, and Incentive Units granted after January 1, 2019 were Incentive Units of LD Holdings.
As profits interests, the Incentive Units have no value for tax purposes on the date of grant, but instead are designed to gain value only after LDLLC has realized a certain level of returns for the holders of LDLLC’s common units. Holders of Incentive Units are generally entitled to participate in any pro rata distributions together with the holders of the common units in the proportions set forth in the LLC Agreement based on their respective sharing percentages, provided that no Incentive Unit is entitled to any portion of a distribution until the “return threshold” (as defined in the LLC Agreement) with respect to such unit has been realized and such Incentive Unit has vested. The threshold value of each Incentive Unit is set forth in the LLC Agreement, and is subject to the terms provided in the 2009 Equity Plan, 2012 Equity Plan, LLC Agreement, and 2015 Equity Plan, respectively.
183
Table of Contents
The following is a summary of the material terms of the Incentive Units granted to each of our named executive officers that were outstanding during the 2020 fiscal year:
Class X Units
Class X Units were granted to Messrs. Hsieh and DerGurahian on May 20, 2015, to Mr. Walsh on May 21, 2015 (collectively, the “2015 Class X Units”), to Messrs. DerGurahian, Walsh, and Flanagan on June 5, 2020 (the “2020 Class X Units”), and are generally subject to specific return thresholds pursuant to their respective agreements and the LD Holdings LLC Agreement. The 2015 Class X Units held by Mr. Hsieh are split into two groups, the “first grant units” and the “new grant units” (each as defined in Mr. Hsieh’s 2015 Class X Unit Grant Agreement), and are subject to the following vesting schedule: (i) 100% of the first grant units vest on May 20, 2015 (the “2015 Class X Vesting Commencement Date”) and (ii)(A) 50.74368% of the new grant units vest on the 2015 Class X Vesting Commencement Date (B) 1.48225% of the new grant units vest on the last day of each calendar month commencing on the first full calendar month following the 2015 Class X Vesting Commencement Date (C) 0.79813% of the new grant units vest on the last day of each calendar month commencing on the first full calendar month following the second anniversary of the 2015 Class X Vesting Commencement Date (D) 0.34206% of the new grant units vest on the last day of each of the next 11 calendar months commencing on the first full calendar month following the third anniversary of the 2015 Class X Vesting Commencement Date (E) 0.3428% of the new grant units vest on May 31, 2019 such that 100% of the new grant units became vested on May 31, 2019.
The 2015 Class X Units held by Mr. DerGurahian are split into three groups, the “first grant units” the “second grant units” and the “new grant units” (each as defined in Mr. DerGurahian’s 2015 Class X Unit Grant Agreement), and are subject to the following vesting schedule: (i)(A) 60.008% of the first grant units vest on 2015 Class X Vesting Commencement Date and (B) 1.667% of the first grant units vest on the last day of each calendar month commencing on the first full calendar month following 2015 Class X Vesting Commencement Date such that 100% of the first grant units became vested on May 31, 2017, and (ii)(A) 48.339% of the second grant units vest on the 2015 Class X Vesting Commencement Date, (B) 1.667% of the second grant units vest on the last day of each calendar month commencing on the first full calendar month following the 2015 Class X Vesting Commencement Date, and (C) 1.667% of the new grant units vest on December 24, 2017, such that 100% of the second grant units became vested on December 24, 2017, and (iii)(A) 20% of new grant units vest on the first anniversary of the 2015 Class X Vesting Commencement Date and (B) 1.667% of the new grant units vest on the last day of each calendar month commencing on the first full calendar month following the first anniversary of the 2015 Class X Vesting Commencement Date such that 100% of the new grant units became fully vested on May 31, 2020.
The 2015 Class X Units held by Mr. Walsh are split into two groups, the “first grant units” the “new grant units” (each as defined in Mr. Walsh’s Class X Unit Grant Agreement), and are subject to the following vesting schedule: (i)(A) 48.339% of the first grant units vest on May 21, 2015 (the “Walsh Vesting Commencement Date”), (B) 1.667% of the first grant units vest on the last day of each calendar month commencing on the first full calendar month following the Walsh Vesting Commencement Date, and (C) 1.667% of the new grant units vest on December 24, 2017, such that 100% of the first grant units became vested on December 24, 2017, and (iii)(A) 20% of new grant units vest on the first anniversary of the Walsh Vesting Commencement Date and (B) 1.667% of the new grant units vest on the last day of each calendar month commencing on the first full calendar month following the first anniversary of the Walsh Vesting Commencement Date such that 100% of the new grant units became vested on May 31, 2020.
The 2020 Class X Units held by Messrs. DerGurahian, Walsh, and Flanagan are subject to the following vesting schedule: (i) 20% of the 2020 Class X Units will vest on May 1, 2021, and (ii) 1.667% of the 2020 Class X Units vest on the last day of each calendar month commencing on the first full calendar month following May 1, 2021 such that 100% of the Class X Units will be vested on May 1, 2025.
184
Table of Contents
In order for the Class X Units to vest on any applicable vesting date, the named executive officer must have been continuously employed with the Company from the date of grant through such applicable vesting date. If a named executive officer’s employment with the Company is terminated for any reason other than in connection with a “sale of the Company” (as defined in the LLC Agreement), such that the named executive officer becomes an employee of the acquiring or successor entity to the Company, all unvested Class X Units will be forfeited. If the named executive officer is terminated for “cause” (as defined in each respective Class X Unit Grant Agreement), both vested and unvested Class X Units will be forfeited. In the event of the named executive officer’s termination of employment, we will have the option to purchase some or all of the named executive officers vested Class X Units for the fair market value of such Class X Units on the date of repurchase.
For a description of the acceleration of the Class X Units in connection with a sale of the Company, see the section “Potential Payments Upon a Termination or Change in Control” below.
Class V Units
Class V Units were granted to Mr. Flanagan on October 1, 2018 and to Mr. Walsh on June 1, 2017, and are generally subject to specific return thresholds pursuant to their respective agreements and the Holdings LLC Agreement. The Class V Units held by Mr. Flanagan are subject to the following vesting schedule: (i) 23.334% of the Class V Units will vest on October 1, 2018, and (ii) 1.667% of the Class V Units vest on the last day of each calendar month commencing on the first full calendar month following October 1, 2018 such that 100% of the Class V Units will be vested on July 31, 2022.
The Class V Units held by Mr. Walsh are subject to the following vesting schedule: (i) 48.335% of the Class V Units will vest on June 1, 2017, and (ii) 1.667% of the Class V Units vest on the last day of each calendar month commencing with June 2017 such that 100% of the Class V Units became vested on December 31, 2019.
In order for the Class V Units to vest on any applicable vesting date, the named executive officer must have been continuously employed with the Company from the date of grant through such applicable vesting date. If a named executive officer’s employment with the Company is terminated for any reason other than in connection with a sale of the Company, such that the named executive officer becomes an employee of the acquiring or successor entity to the Company, all unvested Class V Units will be forfeited. If the named executive officer is terminated for “cause” (as defined in each respective Class V Unit Grant Agreement), both vested and unvested Class V Units will be forfeited. In the event of the named executive officer’s termination of employment, we will have the option to purchase some or all of the named executive officers vested Class V Units for the fair market value of such Class V Units on the repurchase date.
All outstanding Class V Units were exchanged for 2020 Class X Units (the “Exchanged Units”) on June 5, 2020, and the outstanding Class V Units were subsequently cancelled for no additional consideration. The Exchanged Units are subject to the same terms and conditions (including, without limitation, the vesting provisions and repurchase provisions) of the Class V Units.
For a description of the acceleration of the Class V Units in connection with a sale of the Company, see the section “Potential Payments Upon a Termination or Change in Control” below.
As part of the Reorganization Transactions and in connection with the completion of this offering, any outstanding Incentive Units will be equitably adjusted and replaced with a single new class of LLC Units. Immediately after such conversion is effected, each holder of LLC Units will exchange such LLC Units on a one-for-one basis for Holdco Units as described under “Organizational Structure.” Following the completion of this offering and the replacement of the Incentive Units, no further awards will be granted under the 2009 Equity Plan, the 2012 Equity Plan, the LLC Agreement, or the 2015 Equity Plan and each of these plans will be terminated.
185
Table of Contents
Recent Changes to Executive Compensation
New Employment Agreements with Named Executive Officers
In connection with and prior to the closing of this offering, we will enter into new employment agreements with our named executives officers that will be effective upon the closing of this offering. The material terms of these employment agreements are summarized below and are qualified by reference to the actual text of the agreements, which will be filed as exhibits to the registration statement of which this prospectus forms a part.
The new employment agreements with our named executive officers provide for initial three-year terms and automatically renew for successive one-year periods unless either party provides written notice of at least 60 days prior to the end of the applicable renewable period. The employment agreements provide for at-will employment, meaning that either party may terminate the employment agreements and their employment thereunder at any time, for any reason or no reason. The employment agreements provide for base salary, an annual performance bonus with a target bonus based on a percentage of the named executive officer’s base salary, standard benefits, and eligibility to participate in our equity incentive plans. Amounts paid under the performance bonus are to be determined by our board of directors (or a committee thereof) in its sole discretion, and payment is contingent on our named executive’s officer’s continued employee through the bonus payment date. The employment agreements subject each named executive officer to customary confidentiality, non-competition, non-solicitation and non-disparagement covenants.
Under the terms of the new employment agreements, our named executive officers will receive the following base salaries and target annual bonuses: a base salary of $850,000 and bonus target of 250% for Mr. Hsieh; a base salary of $600,000 and bonus target of 150% for Mr. Flannagan; a base salary of $750,000 and bonus target of 200% for Mr. Walsh; and a base salary of $600,000 and bonus target of 150% of for Mr. DerGurahian.
For a description of the payments and benefits our named executive officers would be entitled to receive under these new employment agreements in connection with a qualifying termination, see the section “Potential Payments Upon a Termination or Change in Control” below.
New Equity Incentive Grants
In connection with this offering and a previous bonus discussions with Messrs. Hsieh, Walsh, and DerGurahian, we will be granting equity awards in the form of fully vested restricted stock units to Messrs. Hsieh, Walsh, and DerGurahian under our 2021 Omnibus Incentive Plan, which will be settled on the first business day following the six-month anniversary of this offering. The grants to Messrs. Hsieh, Walsh, and DerGurahian will be as follows: 1,059,500 restricted stock units to Mr. Hsieh, 185,250 restricted stock units to Mr. Walsh, and 165,750 restricted stock units to Mr. DerGurahian.
186
Table of Contents
Outstanding Equity Awards At 2020 Fiscal Year End
The following table sets forth certain information with respect to outstanding Incentive Units of our named executive officers as of December 31, 2020 with respect to the named executive officer. The market value of the Incentive Units in the following table is the fair value of such Incentive Unit at December 31, 2020.
| Name |
Number of Shares or Units of Stock That Have Not Vested (#)(1) |
Market Value of Shares or Units of Stock That Have Not Vested ($)(2) |
||||||
| Anthony Hsieh |
||||||||
| Class X Units |
— | — | ||||||
| Class V Units |
— | — | ||||||
| Patrick Flanagan |
||||||||
| Class X Units |
56,363,418 | (3) | 917,033 | (5) | ||||
| Class V Units |
— | — | ||||||
| Jeff Walsh |
||||||||
| Class X Units |
32,690,271 | (4) | 531,871 | |||||
| Class V Units |
— | — | ||||||
| Jeff DerGurahian |
||||||||
| Class X Units |
49,035,407 | (4) | 797,806 | |||||
| Class V Units |
— | — | ||||||
| (1) | Represents the number of unvested Incentive Units that are subject to the vesting conditions set forth above in the section titled “Narrative Disclosure to Summary Compensation Table and Grants of Plan-Based Awards Table — Incentive Unit Awards.” |
| (2) | The market value of our Incentive Units as of that date is not determinable. Accordingly, we cannot calculate the market value of the unvested Incentive Units as of that date. The values reflect the grant date fair values calculated in accordance with FASB ASC Topic 718. Assumptions used in the valuation of equity-based awards are discussed in Note 20, to our audited consolidated financial statements as of and for the year ended December 31, 2020, which are included elsewhere in this prospectus. |
| (3) | Represents the aggregate of 23,673,147 Exchanged Units and 32,690,271 2020 Class X Units. 1.667% of the outstanding Exchanged Units vest on the last day of each calendar month with 100% of the Exchanged Units vesting on July 31, 2022. 20% of the 2020 Class X Units will vest on May 1, 2021, and 1.667% of the 2020 Class X Units vest on the last day of each calendar month commencing on the first full calendar month following May 1, 2021 such that 100% of the Class X Units will be vested on May 1, 2025. |
| (4) | Represents 2020 Class X Units. 20% of the 2020 Class X Units will vest on May 1, 2021, and 1.667% of the 2020 Class X Units vest on the last day of each calendar month commencing on the first full calendar month following May 1, 2021 such that 100% of the Class X Units will be vested on May 1, 2025. |
| (5) | Represents the aggregate sum of $385,162 of Exchanged Units and $531,871 of 2020 Class X Units. |
187
Table of Contents
Options Exercised and Stock Vested
The Company does not issue stock options to any of its employees. The following table sets forth certain information with respect to the vesting of Incentive Units during the fiscal year ended December 31, 2020 with respect to our named executive officers.
| Stock Awards | ||||||||
| Name |
Number of Shares Acquired on Vesting (#) |
Value Realized on Vesting ($)(1) |
||||||
| Anthony Hsieh |
||||||||
| Class X Units |
— | — | ||||||
| Class V Units |
— | — | ||||||
| Patrick Flanagan |
||||||||
| Class X Units |
47,372,582 | (2) | 1,687,785 | |||||
| Class V Units |
1,577,472 | (3) | 14,765 | |||||
| Jeff Walsh |
||||||||
| Class X Units |
143,421,038 | (4) | 2,311,828 | |||||
| Class V Units |
— | — | ||||||
| Jeff DerGurahian |
||||||||
| Class X Units |
5,023,884 | 0 | ||||||
| Class V Units |
— | — | ||||||
| (1) | The market value of our Incentive Units as of that date is not determinable. Accordingly, we cannot calculate the market value of the unvested Incentive Units as of that date. The values reflect the grant date fair values calculated in accordance with FASB ASC Topic 718. Assumptions used in the valuation of equity-based awards are discussed in Note 20, to our audited consolidated financial statements as of and for the year ended December 31, 2020, which are included elsewhere in this prospectus. |
| (2) | Represents 47,372,582 Exchanged Units, of which 39,082,256 immediately vested upon grant because such Exchange Units were replacing 10,411,126 previously vested Class V Units. |
| (3) | Represents Class V Units that vested prior to being exchanged for Exchange Units on June 5, 2020. |
| (4) | Represents the aggregate total of 1,329,581 2015 Class X Units and 142,091,457 Exchanged Units. The 142,091,457 Exchanged Units immediately vested upon grant because such Exchange Units were replacing 42,789,928 previously vested Class V Units. |
Pension Benefits
Our named executive officers did not participate in or have account balances in qualified or nonqualified defined benefit plans sponsored by us. Our board of directors or compensation committee may elect to adopt qualified or nonqualified benefit plans in the future if it determines that doing so is in our best interest.
Nonqualified Deferred Compensation
Our named executive officers did not participate in or have account balances in nonqualified defined contribution plans or other nonqualified deferred compensation plans maintained by us. Our board of directors or compensation committee may elect to provide our executive officers and other employees with nonqualified defined contribution or other nonqualified deferred compensation benefits in the future if it determines that doing so is in our best interest.
188
Table of Contents
Potential Payments Upon a Termination or Change in Control
Severance Benefits Under Current Employment Agreements
Pursuant to the Hsieh Agreement, in the event of Mr. Hsieh’s termination of employment by the Company without “cause,” or by Mr. Hsieh for “good reason” (as such terms are defined in the Hsieh Agreement), Mr. Hsieh will be entitled to receive, subject to his timely execution of a general release of claims: (i) any unpaid base salary and benefits through the date of termination; (ii) an amount equal to his then-current annual base salary, payable in equal installments over the twelve-month period following such termination; and (iii) a lump sum payment equal to a pro-rated portion of his annual bonus for the year of termination. Mr. Hsieh is also subject to the following restrictive covenants: (i) non-solicitation of employees and consultants during employment and for one year thereafter, (ii) perpetual confidentiality, and (iii) perpetual non-disparagement.
Pursuant to the Flanagan Letter, in the event Mr. Flanagan is terminated by the Company without “cause” or Mr. Flanagan terminates his employment for “good reason” (as such terms are defined in the Flanagan Letter), Mr. Flanagan will be entitled to receive, subject to his timely execution of a general release of claims, an amount equal to his then-current annual base salary for twelve-month period following the date of termination.
Pursuant to the DerGurahian Letter, in the event Mr. DerGurahian is terminated by the Company without “cause” (as defined in DerGurahian Letter), Mr. DerGurahian will be entitled to receive, subject to his timely execution of a general release of claims, an amount equal to his then-current annual base salary for a period of 6-months following the date of termination.
Accelerated Vesting of Equity Awards
Upon a sale of the Company, any outstanding and unvested Class X Units or Exchanged Units will accelerate and vest provided that the named executive officer holding such Class X Units or Exchanged Units has maintained continuous employment with the Company from the grant date through the date of the sale of the Company.
Severance Benefits under New Employment Agreements
In the event Mr. Hsieh’s employment is terminated by the Company without “cause” or by Mr. Hsieh for “good reason” not in connection with a “change in control” (each as defined in the new employment agreements), Mr. Hsieh will be entitled to, subject to their execution and non-revocation of a release of claims, (i) a lump sum payment equal to 24 months of base salary, (ii) a pro-rata annual bonus based on the actual achievement of the performance objectives for the fiscal year in which termination occurs, (iii) the earned, but unpaid portion of annual bonus for the prior fiscal year (if applicable) and (iv) the payment or reimbursement of healthcare premiums through the earlier of (A) 24 months following Mr. Hsieh’s date of termination and (B) the date Mr. Hsieh becomes eligible for another healthcare plan.
If Mr. Hsieh’s employment is terminated by the Company without “cause” or by Mr. Hsieh for “good reason” during the period beginning 3 months prior to a change in control and ending 12 months after a change in control, then Mr. Hsieh will be entitled to (i) a lump sum payment equal to 3x the sum of Mr. Hsieh base salary plus target bonus (ii) the payment or the reimbursements of healthcare premiums through the earlier of (A) 36 months following Mr. Hsieh’s date of termination and (B) the date Mr. Hsieh becomes eligible for another healthcare plan, and (iii) the full accelerated vesting of any unvested equity awards held by Mr. Hsieh, with any performance-based vesting criteria being deemed earned at the greater of target or actual performance through the date of the change in control.
In the event Messrs. Flanagan, Walsh, or DerGurahian’s employment is terminated by the Company without “cause” or by the named executive officer for “good reason” not in connection with a “change in control” (each as defined in the new employment agreements), each named executive officers will be entitled to, subject to their
189
Table of Contents
execution and non-revocation of a release of claims, (i) a lump sum payment equal to 12 months of the named executive officer’s base salary and (ii) the payment or reimbursement of healthcare premiums through the earlier of (A) 12 months following the named executive officer’s date of termination and (B) the date the named executive officer becomes eligible for another healthcare plan.
If Messrs. Flanagan, Walsh, or DerGurahian’s employment is terminated by the Company without “cause” or by the named executive officer for “good reason” during the period beginning 3 months prior to a change in control and ending 12 months after a change in control, then the same severance benefits will apply, except that (i) the lump sum payment will instead be equal to 1.5x the named executive officer’s base salary and target bonus, (ii) the named executive officer will be entitled to a pro-rata annual bonus based on the actual achievement of the performance objectives for the fiscal year in which termination occurs, (iii) the named executive officer will be entitled to the earned, but unpaid portion of annual bonus for the prior fiscal year (if applicable) (iv) the healthcare premiums will instead be through the earlier of (A) 18 months following the named executive officer’s date of termination and (B) the date the named executive officer becomes eligible for another healthcare plan, and (v) any unvested equity awards held by the named executive officer shall immediately vest, with any performance-based vesting criteria being deemed earned at the greater of target or actual performance through the date of the change in control.
In the event any payment provided to any of our named executive officers would implicate Section 280G of the Code, the named executive officer would receive either (i) payment of the full amounts set forth in the new employment agreements or otherwise to which the named executive officer is entitled or (ii) payment of such lesser amount that does not trigger excise taxes under Section 280G of the Code, whichever results in the named executive officer receiving a higher amount after taking into account all federal, state and local income, excise and employment taxes.
The new employment agreements also subject our named executive officers to the following restrictive covenants: (i) non-solicitation of employees and customers during employment and for 24 months thereafter, (ii) employment term non-competition, (iii) perpetual confidentiality, (iv) assignment of work-product and other intellectual property, (v) perpetual and mutual non-disparagement.
The following table sets forth quantitative estimates of the benefits that would have accrued to each of our named executive officers if his employment had been terminated without cause on December 31, 2020. Amounts below reflect potential payments pursuant to the current employment agreement and offer letters for such named executive officers, and not the new arrangements that will be entered into in connection with this offering.
| Name |
Cash Severance Benefits(1) ($) |
Value of Accelerated Equity Awards ($) |
Total ($) |
|||||||||
| Anthony Hsieh |
500,000 | — | 500,000 | |||||||||
| Patrick Flanagan |
400,000 | — | 400,000 | |||||||||
| Jeff Walsh |
— | — | — | |||||||||
| Jeff DerGurahian |
187,500 | — | 187,500 | |||||||||
| (1) | Represents a payment of 12 months of base salary for Messrs. Hsieh, and Flanagan and 6 months of base salary for Mr. DerGurahian. |
190
Table of Contents
The following table sets forth quantitative estimates of the benefits that would have accrued to each of our named executive officers if his employment had been terminated without cause or for good reason upon a change in control on December 31, 2020. Amounts below reflect potential payments pursuant to the current employment agreement, offer letters, and equity awards for such named executive officers, and not the new arrangements that will be entered into in connection with this offering.
| Name |
Cash Severance Benefits ($)(1) |
Value of Accelerated Equity Awards(2) ($) |
Total ($) |
|||||||||
| Anthony Hsieh |
500,000 | — | 500,000 | |||||||||
| Patrick Flanagan |
400,000 | 917,033 | (3) | 1,317,033 | ||||||||
| Jeff Walsh |
— | 531,871 | (4) | 531,871 | ||||||||
| Jeff DerGurahian |
187,500 | 797,806 | (5) | 985,306 | ||||||||
| (1) | Represents a payment of 12 months of base salary for Messrs. Hsieh, and Flanagan and 6 months of base salary for Mr. DerGurahian. |
| (2) | The market value of our Incentive Units as of that date is not determinable. Accordingly, we cannot calculate the market value of the unvested Incentive Units as of that date. The values reflect the grant date fair values calculated in accordance with FASB ASC Topic 718. Assumptions used in the valuation of equity-based awards are discussed in Note 20, to our audited consolidated financial statements as of and for the year ended December 31, 2020, which are included elsewhere in this prospectus. |
| (3) | Represents the accelerated vesting of 23,673,147 Exchanged Units valued at $385,162 and 32,690,271 2020 Class X Units valued at $531,871. |
| (4) | Represents the accelerated vesting of 32,690,271 2020 Class X Units. |
| (5) | Represents the accelerated vesting of 49,035,407 2020 Class X Units. |
Director Compensation
To date, we have not provided cash compensation to directors for their services as directors or members of committees of the board of directors. We have reimbursed and will continue to reimburse our non-employee directors for their reasonable expenses incurred in attending meetings of our board of directors and committees of the board of directors.
Our board of directors has adopted a compensation program for our non-employee directors, or the “Independent Director Compensation Policy.” The Independent Director Compensation Policy became effective as of the date of this prospectus. Pursuant to the Independent Director Compensation Policy, each member of our board of directors who is not our employee will receive the following cash compensation for board services, as applicable:
| • | $250,000 per year for service as a board member, 50% of which will be paid in cash and 50% shall be issued in restricted stock units that vest in quarterly installments, subject to such director’s continued service on the board of directors through such date of vesting. The number of restricted shares granted will be equal to $125,000 on the date of grant; |
| • | $25,000 per year for service as chairperson of the audit committee; and |
Each of directors will be expected to sit on up to two committees for no additional consideration. Any director who sits on more than two committees (other than any special committee) will be provided with an additional $25,000 in annual cash compensation.
191
Table of Contents
Limitations of Liability and Indemnification Matters
We will adopt provisions in our amended and restated certificate of incorporation that limit the liability of our directors for monetary damages for breach of their fiduciary duties, except for liability that cannot be eliminated under the Delaware General Corporation Law. Delaware law provides that directors of a corporation will not be personally liable for monetary damages for breach of their fiduciary duties as directors, except liability for any of the following:
| • | any breach of their duty of loyalty to the corporation or its stockholders; |
| • | acts or omissions not in good faith or that involve intentional misconduct or a knowing violation of law; |
| • | unlawful payments of dividends or unlawful stock repurchases or redemptions as provided in Section 174 of the Delaware General Corporation Law; or |
| • | any transaction from which the director derived an improper personal benefit. |
This limitation of liability does not apply to liabilities arising under the federal securities laws and does not affect the availability of equitable remedies such as injunctive relief or rescission.
Pay Ratio
As a result of the rules adopted by the SEC under the Dodd-Frank Act, we are required to disclose the ratio of the annual total compensation of our CEO to the annual total compensation of our median employee, using certain permitted methodologies. To determine our CEO pay ratio and our median employee, we took the following steps:
| • | We identified our median employee utilizing data as of December 31, 2020 (the “Determination Date”) by examining the total amount of compensation as reflected in our payroll records and as reported to the Internal Revenue Service on Form W-2 and Schedule K-1 for 2020 (“total compensation”) for all individuals, excluding our CEO, who were employed by us on the Determination Date. Total compensation was calculated using the same methodology we used for our named executive officers as set forth in “Summary Compensation Table.” We included all employees, whether employed on a full-time, part-time, seasonal or temporary basis. |
| • | We did not make any material assumptions, adjustments, or estimates with respect to total compensation. We did not annualize the compensation for any employees. |
| • | We included non-U.S. employees by converting their total compensation to U.S. Dollars from the applicable local currency. |
| • | We believe the use of total compensation for all employees is a consistently applied compensation measure because the SEC released guidance providing that compensation determined based on the Company’s tax and/or payroll records is an appropriate consistently applied compensation measure. |
| • | After identifying the median employee based on total compensation, we calculated annual total compensation for that employee using the same methodology we used for our named executive officer as set forth in the Summary Compensation Table in this proxy statement. The annual total compensation of our median employee for 2020 was $48,431. |
| • | The annual total compensation of our CEO for 2020 was $50,436,969. |
Our pay ratio may not be comparable to the CEO pay ratios presented by other companies. We believe our methodology most accurately reflects the incentives provided to our executives and employees in their roles at the Company. Based on the methodology described above, for 2020, the ratio of the annual total compensation of our CEO to the annual total compensation of the median employee (other than our CEO) is 1,041:1.
192
Table of Contents
2021 Omnibus Incentive Plan
In connection with the offering, we will adopt the loanDepot, Inc. 2021 Omnibus Incentive Plan (the “2021 Omnibus Incentive Plan”). The 2021 Omnibus Incentive Plan provides for grants of stock options, stock appreciation rights, restricted stock, performance awards, other stock-based awards, including LTIP Units, as described below, and other cash-based awards. Directors, officers and other employees of us and our subsidiaries, as well as others performing consulting or advisory services for us, are eligible for grants under the 2021 Omnibus Incentive Plan. The purpose of the 2021 Omnibus Incentive Plan is to provide incentives that will attract, retain and motivate high performing officers, directors, employees and consultants by providing them with appropriate incentives and rewards either through a proprietary interest in our long-term success or compensation based on their performance in fulfilling their personal responsibilities. Set forth below is a summary of the material terms of the 2021 Omnibus Incentive Plan. For further information about the 2021 Omnibus Incentive Plan, we refer you to the complete copy of the 2021 Omnibus Incentive Plan, which is attached as an exhibit to the registration statement, of which this prospectus is a part.
Administration of the 2021 Omnibus Incentive Plan
The 2021 Omnibus Incentive Plan is administered by the compensation committee of our board of directors. Among the compensation committee’s powers is to determine the form, amount and other terms and conditions of awards; clarify, construe or resolve any ambiguity in any provision of the 2021 Omnibus Incentive Plan or any award agreement; amend the terms of outstanding awards; and adopt such rules, forms, instruments and guidelines for administering the 2021 Omnibus Incentive Plan as it deems necessary or proper. The compensation committee has authority to administer and interpret the 2021 Omnibus Incentive Plan, to grant discretionary awards under the 2021 Omnibus Incentive Plan, to determine the persons to whom awards will be granted, to determine the types of awards to be granted, to determine the terms and conditions of each award, to determine the number of shares of common stock to be covered by each award, to make all other determinations in connection with the 2021 Omnibus Incentive Plan and the awards thereunder as the compensation committee deems necessary or desirable and to delegate authority under the 2021 Omnibus Incentive Plan to our executive officers.
Available Shares
The aggregate number of shares of Class A common stock which may be issued or used for reference purposes under the 2021 Omnibus Incentive Plan or with respect to which awards may be granted may not exceed 14,123,387 shares (including any LTIP Units, which may be granted under the 2021 Omnibus Incentive Plan not including 2,207,649 vested restricted stock units of Class A common stock to be granted to employees in connection with the offering), which amount shall be increased on the first day of each fiscal year during the term of the 2021 Omnibus Incentive Plan commencing with the 2022 fiscal year by 2% of the total number of shares of common stock outstanding on the last day of the immediately preceding fiscal year or a lesser amount determined by our board of directors. The number of shares available for issuance under the 2021 Omnibus Incentive Plan may be subject to adjustment in the event of a reorganization, stock split, merger or similar change in the corporate structure or the outstanding shares of Class A common stock. In the event of any of these occurrences, we may make any adjustments we consider appropriate to, among other things, the number and kind of shares, options or other property available for issuance under the plan or covered by grants previously made under the plan. The shares available for issuance under the 2021 Omnibus Incentive Plan may be, in whole or in part, either authorized and unissued shares of our Class A common stock or shares of Class A common stock held in or acquired for our treasury. In general, if awards under the 2021 Omnibus Incentive Plan are for any reason cancelled, or expire or terminate unexercised, the shares covered by such awards may again be available for the grant of awards under the 2021 Omnibus Incentive Plan. With respect to stock appreciation rights and options settled in Class A common stock, upon settlement, only the number of shares of Class A common stock delivered to a participant will count against the aggregate and individual share limitations. If any shares of
Class A common stock are withheld to satisfy tax withholding obligations on an award issued under the 2021
193
Table of Contents
Omnibus Incentive Plan, the number of shares of Class A common stock withheld shall again be available for purposes of awards under the 2021 Omnibus Incentive Plan. Any award under the 2021 Omnibus Incentive Plan settled in cash shall not be counted against the foregoing maximum share limitations.
The aggregate grant date fair value (computed as of the date of grant in accordance with applicable financial accounting rules) of all types of awards granted under the 2021 Omnibus Incentive Plan to any individual non-employee director in any fiscal year (excluding any stock dividends payable in respect of outstanding awards), when combined with other compensation received for such year fiscal year in connection with service as a director, may not exceed $600,000 increased to $1,000,000 in the fiscal year of his or her initial service as a Non-Employee Director.
Additionally, in the event that a company acquired by the Company or any subsidiary or with which the Company or any subsidiary combines has shares available under a pre-existing plan approved by its stockholders and not adopted in contemplation of such acquisition or combination, the shares available for grant pursuant to the terms of such pre-existing plan (as adjusted, to the extent appropriate, using the exchange ratio or other adjustment or valuation ratio or formula used in such acquisition or combination to determine the consideration payable to the holders of common stock of the entities party to such acquisition or combination) may be used for awards under the 2021 Omnibus Incentive Plan and shall not reduce the shares of Class A common stock authorized for grant under the 2021 Omnibus Incentive Plan; provided that awards using such available shares of Class A common stock shall not be made after the date awards or grants could have been made under the terms of the pre-existing plan, absent the acquisition or combination, and shall only be made to individuals who were not employed by or providing services to the Company or its subsidiaries immediately prior to such acquisition or combination.
Eligibility for Participation
Members of our board of directors, as well as employees of, and consultants to, us or any of our subsidiaries and affiliates are eligible to receive awards under the 2021 Omnibus Incentive Plan.
Award Agreement
Awards granted under the 2021 Omnibus Incentive Plan are evidenced by award agreements that provide the terms, conditions and limitations for such awards as determined by the compensation committee in its sole discretion.
Stock Options
The compensation committee may grant nonqualified stock options to eligible individuals and incentive stock options only to eligible employees. The compensation committee will determine the number of shares of our Class A common stock subject to each option, the term of each option, which may not exceed ten years, or five years in the case of an incentive stock option granted to a ten percent stockholder, the exercise price, the vesting schedule, if any, and the other material terms of each option. No incentive stock option or nonqualified stock option may have an exercise price less than the fair market value of a share of our Class A common stock at the time of grant or, in the case of an incentive stock option granted to a ten percent stockholder, 110% of such share’s fair market value. Options will be exercisable at such time or times and subject to such terms and conditions as determined by the compensation committee at grant and the exercisability of such options may be accelerated by the compensation committee.
Stock Appreciation Rights
The compensation committee may grant stock appreciation rights, which we refer to as SARs, either with a stock option, which may be exercised only at such times and to the extent the related option is exercisable, which
194
Table of Contents
we refer to as a Tandem SAR, or independent of a stock option, which we refer to as a Non-Tandem SAR. A SAR is a right to receive a payment in shares of our Class A common stock or cash, as determined by the compensation committee, equal in value to the excess of the fair market value of one share of our Class A common stock on the date of exercise over the exercise price per share established in connection with the grant of the SAR. The term of each SAR may not exceed ten years. The exercise price per share covered by a SAR will be the exercise price per share of the related option in the case of a Tandem SAR and will be the fair market value of our Class A common stock on the date of grant in the case of a Non-Tandem SAR. The compensation committee may also grant limited SARs, either as Tandem SARs or Non-Tandem SARs, which may become exercisable only upon the occurrence of a change in control, as defined in the 2021 Omnibus Incentive Plan, or such other event as the compensation committee may designate at the time of grant or thereafter.
Restricted Stock
The compensation committee may award shares of restricted stock. Except as otherwise provided by the compensation committee upon the award of restricted stock, the recipient generally has the rights of a stockholder with respect to the shares, including the right to receive dividends, the right to vote the shares of restricted stock and, conditioned upon full vesting of shares of restricted stock, the right to tender such shares, subject to the conditions and restrictions generally applicable to restricted stock or specifically set forth in the recipient’s restricted stock agreement. The payment of dividends, if any, will be deferred until the expiration of the applicable restriction period unless otherwise determined by the compensation committee at the time of the award.
Recipients of restricted stock are required to enter into a restricted stock agreement with us that states the restrictions to which the shares are subject, which may include satisfaction of pre-established performance goals, and the criteria or date or dates on which such restrictions will lapse.
If the grant of restricted stock or the lapse of the relevant restrictions is based on the attainment of performance goals, the compensation committee will establish for each recipient the applicable performance goals, formulae or standards and the applicable vesting percentages with reference to the attainment of such goals or satisfaction of such formulae or standards while the outcome of the performance goals are substantially uncertain. Such performance goals may incorporate provisions for disregarding, or adjusting for, changes in accounting methods, corporate transactions, including, without limitation, dispositions and acquisitions, and other similar events or circumstances.
Other Stock-Based Awards
The compensation committee may, subject to limitations under applicable law, make a grant of such other stock-based awards, including, without limitation, performance units, dividend equivalent units, stock equivalent units, restricted stock units and deferred stock units under the 2021 Omnibus Incentive Plan that are payable in cash or denominated or payable in or valued by shares of our Class A common stock or factors that influence the value of such shares. The compensation committee may determine the terms and conditions of any such other awards, which may include the achievement of certain minimum performance goals and/or a minimum vesting period.
LTIP Units
The compensation committee may, subject to the provisions of the Holdings LLC Agreement, grant awards of equity-based awards, valued by reference to shares of publicly traded common stock of loanDepot, Inc., consisting of Holdco Units in LD Holdings and an equal number of shares of Class B common stock of loanDepot, Inc., which will be referred to as “LTIP Units.” LTIP Units may be subject to any vesting conditions as the compensation committee may decide, similar to any other more typical equity incentive program, such as restricted stock. Holders of LTIP Units will have the right to exchange such units for shares of Class A common
195
Table of Contents
stock of loanDepot, Inc. on a one-for-one basis, subject to customary conversion rate adjustments for stock splits, stock dividends and reclassifications. Any Holdco Units exchanged under the exchange provisions described above will thereafter be owned by loanDepot, Inc. Any shares of Class B common stock exchanged will be cancelled. See “Organizational Structure.” Each LTIP Unit awarded will be equivalent to an award of one share of Class A common stock of loanDepot, Inc. for purposes of reducing the number of shares of Class A common stock available under the 2021 Omnibus Incentive Plan on a one-for-one basis.
Other Cash-Based Awards
The compensation committee may grant awards payable in cash. Cash-based awards will be in such form, and dependent on such conditions, as the compensation committee will determine, including, without limitation, being subject to the satisfaction of vesting conditions or awarded purely as a bonus and not subject to restrictions or conditions. If a cash-based award is subject to vesting conditions, the compensation committee may accelerate the vesting of such award in its discretion.
Performance Awards
The compensation committee may grant a performance award to a participant payable upon the attainment of specific performance goals established by the compensation committee in its sole discretion. If the performance award is payable in cash, it may be paid upon the attainment of the relevant performance goals either in cash or in shares of restricted stock, based on the then current fair market value of such shares, as determined by the compensation committee. Based on service, performance and/or other factors or criteria, the compensation committee may, at or after grant, accelerate the vesting of all or any part of any performance award.
Change in Control
In connection with a change in control, as defined in the 2021 Omnibus Incentive Plan, the compensation committee may accelerate vesting of outstanding awards under the 2021 Omnibus Incentive Plan. In addition, such awards may be, in the discretion of the committee, (1) assumed and continued or substituted in accordance with applicable law, (2) purchased by us for an amount equal to the excess of the price of a share of our Class A common stock paid in a change in control over the exercise price of the awards, or (3) cancelled if the price of a share of our Class A common stock paid in a change in control is less than the exercise price of the award. The compensation committee may also provide for accelerated vesting or lapse of restrictions of an award at any time.
Stockholder Rights
Except as otherwise provided in the applicable award agreement, and with respect to an award of restricted stock, a participant has no rights as a stockholder with respect to shares of our Class A common stock covered by any award until the participant becomes the record holder of such shares.
Amendment and Termination
Notwithstanding any other provision of the 2021 Omnibus Incentive Plan, our board of directors may at any time amend any or all of the provisions of the 2021 Omnibus Incentive Plan, or suspend or terminate it entirely, retroactively or otherwise, subject to stockholder approval in certain instances; provided, however, that, unless otherwise required by law or specifically provided in the 2021 Omnibus Incentive Plan, the rights of a participant with respect to awards granted prior to such amendment, suspension or termination may not be adversely affected without the consent of such participant.
196
Table of Contents
Transferability
Awards granted under the 2021 Omnibus Incentive Plan generally are nontransferable, other than by will or the laws of descent and distribution, except that the committee may provide for the transferability of nonqualified stock options at the time of grant or thereafter to certain family members.
Recoupment of Awards
The 2021 Omnibus Incentive Plan provides that awards granted under the 2021 Omnibus Incentive Plan are subject to any recoupment policy that we may have in place or any obligation that we may have regarding the clawback of “incentive-based compensation” under the Exchange Act, or under any applicable rules and regulations promulgated by the SEC.
Effective Date and Term
The 2021 Omnibus Incentive Plan will be effective on the date specified in the 2021 Omnibus Incentive Plan. No award will be granted under the 2021 Omnibus Incentive Plan on or after the 10-year anniversary of the earlier of the date on which the 2021 Omnibus Incentive Plan is adopted by the board of directors or the date of stockholder approval. Any award outstanding under the 2021 Omnibus Incentive Plan at the time of termination will remain in effect until such award is exercised or has expired in accordance with its terms.
197
Table of Contents
CERTAIN RELATIONSHIPS AND RELATED PARTY TRANSACTIONS
Shareholder Notes
During the year ended December 31, 2017, certain unitholders entered into promissory note agreements (“Shareholder Notes”) secured by Common Units and Incentive Units, as applicable, owned by their respective unitholders. The Shareholder Notes, with a balance of $53.4 million, $52.7 million, $51.4 million and 50.5 million as of June 30, 2020, December 31, 2019, 2018 and 2017, respectively, accrue interest at a rate of 2.50% per annum compounded annually or, in the event of default, accrue interest at a rate of 4.50% per annum and are included in accounts receivable, net on the consolidated balance sheet. The Shareholder Notes are due in full on the earliest to occur of (a) the fifth anniversary of the date of the Shareholder Notes, and, generally, (b) a Public Offering or a Sale of LD Holdings as such terms were defined in the LLC Agreement of LD Holdings that was in effect at the date of the Shareholder Notes. As of June 30, 2020, December 31, 2019, 2018 and 2017, $46.0 million of the outstanding Shareholder Notes were secured by Common Units and Incentive Units, as applicable,. The Shareholder Notes were fully satisfied in November of 2020.
Other Related Party Transactions
LD Holdings paid travel and promotional fees of $0 million, $0 million, $0.2 million and $0.6 million to an entity controlled by a Unitholder of LD Holdings during the nine months ended September 30, 2020 and the years ended December 31, 2019, 2018 and 2017, respectively. LD Holdings paid management fees of $0.8 million, $0.7 million $0.7 million, $0.9 million and $1.1 million to a Unitholder of LD Holdings during the nine months ended September 30, 2020 and 2019 and the years ended December 31, 2019, 2018 and 2017, respectively. LD Holdings employed certain employees that provided services to a Unitholder whose salaries totaled $0.2 million the nine months ended September 30, 2020 and 2019 and $0.2 million for the years ended December 31, 2019, 2018 and 2017, respectively.
Procedures with Respect to Review and Approval of Related Person Transactions
From time to time, we may do business with certain companies affiliated with Parthenon Capital. The board of directors has not adopted a formal written policy for the review and approval of transactions with related parties. However, as a matter of practice, the board of directors reviews and approves transactions with related parties as appropriate.
Reorganization Transactions
Prior to and in connection with the consummation of this offering, we will consummate the Reorganization Transactions described under “Organizational Structure” pursuant to the agreements filed as exhibits to the registration statement of which this prospectus forms a part.
Registration Rights Agreement
Effective upon consummation of the offering, we will enter into a registration rights agreement pursuant to which we may be required to register the sale of shares of our Class A Common Stock held by the Parthenon Stockholders and Hsieh Stockholders. The registration rights agreement will also require us to make available and keep effective shelf registration statements permitting sales of shares into the market from time to time over an extended period. In addition, the Parthenon Stockholders and the Hsieh Stockholders will have the ability to exercise certain demand registration rights and/or piggyback registration rights in connection with registered offerings requested by any of such holders or initiated by us.
Effective upon the completion of the offering, we will enter into a stockholders agreement with the Parthenon Stockholders and Hsieh Stockholders (and their respective permitted transferees thereunder party
198
Table of Contents
thereto from time to time). Pursuant to the stockholders agreement, the Parthenon Stockholders will have (i) the right to designate two nominees for election to our board of directors so long as such group owns at least 15% of the total voting power of our common stock, and (ii) otherwise one nominee for election to our board of directors so long as such group owns at least 5% of the total voting power of our common stock. Additionally, the Hsieh Stockholders, will have (i) the right to designate two nominees for election to our board of directors so long as such group owns at least 5% of the total voting power of our common stock, and (ii) upon the Parthenon Stockholders’ ceasing to own more than 15% of the total voting power of our common stock, the Hsieh Stockholders shall have the right to designate an additional nominee to the our board of directors so long as (a) such nominee is independent under the NYSE listing standards and (b) the Hsieh Stockholders own greater than 25% of the total voting power of our common stock. We will agree to take certain actions to support those nominees for election and include the nominees in the relevant proxy statements. Brian P. Golson and Andrew C. Dodson are the initial designated nominees of the Parthenon Stockholders. Anthony Hsieh is the sole initial designated nominee of the Hsieh Stockholders. Additionally, the Hsieh Stockholders will be entitled to recommend the Class I board seat that will remain vacant upon consummation of this offering until such seat is filled. The Parthenon Stockholders and the Hsieh Stockholders will each additionally agree to take all necessary action, including voting their respective shares of common stock, to cause the election of the directors nominated by such other group in accordance with the terms of the stockholders agreement, and will each be entitled to propose the replacement for any of its board designees whose board service ceases for any reason.
Tax Receivable Agreement
The Continuing LLC Members may from time to time (subject to the terms of the Holdings LLC Agreement regarding exchange rights) exchange an equal number of Holdco Units and shares of Class B and Class C Common Stock for cash or for shares of Class A Common Stock of loanDepot, Inc. on a one-for-one basis, at our election. LD Holdings (and each of its subsidiaries classified as a partnership for federal income tax purposes) intends to make an election under Section 754 of the Code effective for the taxable year in which this offering is completed and each subsequent taxable year in which an exchange of Holdco Units and shares of Class B and Class C Common Stock for shares of Class A Common Stock occurs. Our purchase of Holdco Units from the Exchanging Members in connection with this offering and the exchanges of Holdco Units and shares of Class B and Class C Common Stock for shares of Class A Common Stock are expected to result, with respect to loanDepot, Inc., in increases in the tax basis of the assets of LD Holdings that otherwise would not have been available. These increases in tax basis may reduce the amount of tax that loanDepot, Inc. would otherwise be required to pay in the future. These increases in tax basis may also decrease gains (or increase losses) on future dispositions of certain assets to the extent tax basis is allocated to those assets.
We will enter into a tax receivable agreement with the Parthenon Stockholders, Parthenon affiliates owning Holdco Units and, following the completion of the offering, certain of the Continuing LLC Members, as part of the consideration received by such Continuing LLC Members in exchange for the sale of Holdco Units to loanDepot, Inc., that will provide for the payment from time to time by loanDepot, Inc. to such parties or their permitted assignees of 85% of the amount of the benefits, if any, that loanDepot, Inc. realizes or under certain circumstances (such as a change of control) is deemed to realize as a result of (i) the aforementioned increases in tax basis, (ii) any incremental tax basis adjustments attributable to payments made pursuant to the tax receivable agreement and (iii) any deemed interest deductions arising from payments made by us under the tax receivable agreement. These payment obligations are obligations of loanDepot, Inc. and not of LD Holdings. For purposes of the tax receivable agreement, subject to certain exceptions noted below, the benefit deemed realized by loanDepot, Inc. generally will be computed by comparing the actual income tax liability of loanDepot, Inc. (calculated with certain assumptions) to the amount of such taxes that loanDepot, Inc. would have been required to pay had there been no increase to the tax basis of the assets of LD Holdings as a result of our purchase of Holdco Units from the Exchanging Members in connection with this offering and the exchanges of Holdco Units and had loanDepot, Inc. not derived any tax benefits in respect of payments made under the tax receivable agreement. The term of the tax receivable agreement will continue until all such tax benefits have been utilized or deemed utilized or expired, unless we materially breach any of our material obligations under the agreement,
199
Table of Contents
elect an early termination of the agreement or undergo a change of control. Estimating the amount of payments that may be made under the tax receivable agreement is by its nature imprecise, insofar as the calculation of amounts payable depends on a variety of factors. The actual increase in tax basis, as well as the amount and timing of any payments under the tax receivable agreement, will vary depending upon a number of factors, including:
| • | the timing of any subsequent exchanges of Holdco Units—for instance, the increase in any tax deductions will vary depending on the fair value, which may fluctuate over time, of the depreciable or amortizable assets of LD Holdings at the time of each exchange; |
| • | the price of shares of our Class A Common Stock at or around the time of the exchange—the increase in any tax deductions, as well as the tax basis increase in other assets, of LD Holdings is affected by the price of shares of our Class A Common Stock at the time of the exchange; |
| • | the extent to which such exchanges are taxable—if an exchange is not taxable for any reason, increased deductions will not be available; |
| • | the amount and timing of our income—loanDepot, Inc. generally will be required to pay 85% of the deemed benefits as and when deemed realized; and |
| • | the allocation of basis increases among the assets of LD Holdings and certain tax elections affecting depreciation. |
Assuming no material changes in the relevant tax law and that we earn sufficient taxable income to realize all tax benefits that are subject to the tax receivable agreement, we expect that the tax savings associated with the purchase of Holdco Units from the Exchanging Members in connection with future exchanges of Holdco Units and Class B Common Stock as described above would aggregate to approximately $1068.7 million over 15 years from the date of this offering based on an initial public offering price of $20.00 per share of our Class A Common Stock, which is the midpoint of the estimated price range set forth on the cover page of this prospectus, and assuming all future exchanges would occur one year after this offering. Under such scenario, we would be required to pay to the Parthenon Stockholders, Parthenon affiliates owning Holdco Units and certain of the Continuing LLC Members or their permitted assignees approximately 85% of such amount, or approximately $908.4 million, over the 15 year period from the date of this offering. We note, however, that the analysis set forth above assumes no material changes in the relevant tax law. We are not able to predict the specific effect of such future tax legislation on this analysis.
If LD Holdings does not have taxable income, loanDepot, Inc. generally is not required to make payments under the tax receivable agreement for that taxable year because no benefit actually will have been realized. Nevertheless, any tax benefits that do not result in realized benefits in a given tax year likely will generate tax attributes that may be utilized to generate benefits in previous or future tax years and the utilization of such tax attributes will result in payments under the tax receivable agreement. We expect that the payments that we may make under the tax receivable agreement will be substantial. There may be a material negative effect on our liquidity if, as a result of timing discrepancies or otherwise, (a) the payments under the tax receivable agreement exceed the actual benefits we realize in respect of the tax attributes subject to the tax receivable agreement and/or (b) distributions to loanDepot, Inc. by LD Holdings are not sufficient to permit loanDepot, Inc. to make payments under the tax receivable agreement after it has paid its taxes and other obligations. loanDepot, Inc.’s obligations pursuant to the tax receivable agreement will rank pari passu with its other general trade credit obligations. The payments under the tax receivable agreement are not conditioned upon any recipient’s continued ownership of us or LD Holdings. The Parthenon Stockholders, Parthenon affiliates owning Holdco Units and certain of the Continuing LLC Members will receive payments under the tax receivable agreement until such time that they validly assign or otherwise transfer their rights to receive such payments.
200
Table of Contents
The effects of the tax receivable agreement on our consolidated balance sheet upon purchase or exchange of Holdco Units are as follows:
| • | we will record an increase in deferred tax assets for the estimated income tax effects of the increase in the tax basis of the assets owned by loanDepot, Inc. based on enacted federal, state and local income tax rates at the date of the exchange or purchase. To the extent we estimate that we will not realize the full benefit represented by the deferred tax asset, based on an analysis of expected future earnings, we will reduce the deferred tax asset with a valuation allowance; |
| • | we will record an increase in liabilities for 85% of the estimated realizable tax benefit resulting from (i) the increase in the tax basis of the purchased or exchanged interests as noted above and (ii) certain other tax benefits subject to the tax receivable agreement; and |
| • | we will record an increase to additional paid-in capital in an amount equal to the difference between the increase in deferred tax assets and the increase in liability due to the Parthenon Stockholders and certain of the Continuing LLC Members under the tax receivable agreement. The amounts to be recorded for both the deferred tax assets and the liability for our obligations under the tax receivable agreement have been estimated. All of the effects of changes in any of our estimates after the date of the exchange or purchase will be included in our net income. Similarly, the effect of subsequent changes in the enacted tax rates will be included in net income. |
Payments under the tax receivable agreement will be based on the tax reporting positions that we determine in accordance with the tax receivable agreement. Although we do not currently anticipate that the IRS would have a basis for a successful challenge with respect to a tax basis increase, we will not be reimbursed for any payments previously made under the tax receivable agreement if the IRS subsequently disallows part or all of the tax benefits that gave rise to such prior payments, although future payments under the tax receivable agreement will be reduced on account of such disallowances. As a result, in certain circumstances, payments could be made under the tax receivable agreement that are significantly in excess of the benefits that we actually realize in respect of (a) the increases in tax basis resulting from our purchases or exchanges of Holdco Units (b) any incremental tax basis adjustments attributable to payments made pursuant to the tax receivable agreement and (c) any deemed interest deductions arising from our payments under the tax receivable agreement. Decisions made by the Parthenon Stockholders and the Continuing LLC Members in the course of running our business, such as with respect to mergers, asset sales, other forms of business combinations or other changes in control, may influence the timing and amount of payments that we are required to make under the tax receivable agreement. For example, the earlier disposition of assets following an exchange or acquisition transaction generally will accelerate payments under the tax receivable agreement and increase the present value of such payments, and the disposition of assets before an exchange or acquisition transaction will increase the Parthenon Stockholders’ and the Continuing LLC Members’ tax liability without giving rise to any obligations to make payments under the tax receivable agreement. Payments generally are due under the tax receivable agreement within a specified period of time following the filing of our tax return for the taxable year with respect to which the payment obligation arises, although interest on such payments will begin to accrue at a rate of LIBOR (or, in the absence of LIBOR, the Secured Overnight Financing Rate) plus 500 basis points from the due date (without extensions) of such tax return.
Additionally the tax receivable agreement will provide that (1) in the event that we materially breach any of our material obligations under the agreement, whether as a result of failure to make any payment, failure to honor any other material obligation required thereunder or by operation of law as a result of the rejection of the agreements in a bankruptcy or otherwise, (2) if, at any time, we elect an early termination of the agreement, or (3) upon a change of control of the Company, our (or our successor’s) obligations under the agreements (with respect to all Holdco Units, whether or not such units have been exchanged or acquired before or after such election) would accelerate and become payable in a lump sum amount equal to the present value of the anticipated future tax benefits calculated based on certain assumptions. These assumptions will include the assumptions that (i) we (or our successor) will have sufficient taxable income to fully utilize the deductions
201
Table of Contents
arising from the increased tax deductions and tax basis and other benefits subject to the tax receivable agreement, (ii) we (or our successor) will utilize any loss carryovers generated by the increased tax deductions as quickly as allowable by law, and (iii) LD Holdings and its subsidiaries will sell certain nonamortizable assets (and realize certain related tax benefits) no later than a specified date. As a result of the foregoing, if we materially breach a material obligation under the agreement, experience a change of control, or if we elect to terminate the agreement early, we would be required to make an immediate lump sum payment equal to the present value of the anticipated future tax savings, which payment may be made significantly in advance of the actual realization of such future tax savings. In these situations, our obligations under the tax receivable agreement could have a substantial negative impact on our liquidity. There can be no assurance that we will be able to fund or finance our obligations under the tax receivable agreement.
Additionally, the obligation to make tax receivable payments based on these assumptions upon a change of control may deter potential acquirors, which could negatively affect our stockholders’ potential returns.
If we were to elect to terminate the tax receivable agreement immediately after this offering, based on an initial public offering price of $20.00 per share of our Class A Common Stock, which is the midpoint of the estimated price range set forth on the cover page of this prospectus, we estimate that we would be required to pay approximately $961.6 million in the aggregate under the tax receivable agreement.
Reserved Share Program
At our request, an affiliate of BofA Securities, Inc., a participating underwriter, has reserved for sale, at the initial public offering price, up to 5% of the Class A common stock offered by this prospectus for sale to certain of our directors, officers and employees through a directed share program. See “Underwriting—Reserved Share Program” for more information.
Indemnification Agreements
We intend to enter into indemnification agreements with each of our current directors and executive officers. These agreements will require us to indemnify these individuals to the fullest extent permitted under Delaware law against liabilities that may arise by reason of their service to us, and to advance expenses incurred as a result of any proceeding against them as to which they could be indemnified. We also intend to enter into indemnification agreements with our future directors and executive officers.
Policies and Procedures With Respect to Related Party Transactions
Upon the closing of this offering, we intend to adopt policies and procedures whereby our audit committee will be responsible for reviewing and approving related party transactions. In addition, our general code of ethics will require that all of our employees and directors inform the Company of any material transaction or relationship that comes to their attention that could reasonably be expected to create a conflict of interest. Further, at least annually, each director and executive officer will complete a detailed questionnaire that asks questions about any business relationship that may give rise to a conflict of interest and all transactions in which we are involved and in which the executive officer, a director or a related person has a direct or indirect material interest.
Aircraft and Boat Arrangements with North American Charters and JLSSAA LLC
We charter private aircraft and a boat owned by North American Charters, Inc. (“NA Charters”) and JLSSAA LLC (“JLSSAA”), companies controlled by Anthony Hsieh, which from time-to-time also leases the boat to third parties unaffiliated with us. We use the charter services mainly for the purposes of business travel for our executive officers and directors. For the years ended December 31, 2020, 2019, 2018 and 2017, we incurred expenses to NA Charters and JLSSAA of approximately $0.0 million, $0.2 million, $0.2 million and
202
Table of Contents
$0.6 million, respectively, for the use of the aircraft and boat. These charges included only allocated costs based on business usage. Mr. Hsieh pays for all unallocated expenses and any expenses related to his personal travel or mixed-use travel (travel in which a non-business passenger is also on the aircraft or boat). The charter services were arranged through arms-length dealings and the rates paid by us were at or below market price.
Limited Liability Company Agreement of LD Holdings
As a result of the Reorganization Transactions, loanDepot, Inc. will hold a significant equity interest in LD Holdings and will be entitled to appoint the board of managers of LD Holdings. Accordingly, loanDepot, Inc. will operate and control all of the business and affairs of LD Holdings and, through LD Holdings and its operating entity subsidiaries, conduct our business.
The Holdings LLC Agreement will provide for Holdco Units. Under the Holdings LLC Agreement, the board of managers of LD Holdings has the right to determine when distributions (other than tax distributions) will be made to unitholders of LD Holdings and the amount of any such distributions. If a distribution with respect to Holdco Units is authorized, such distribution will be made to the holders of Holdco Units pro rata based on their holdings of Holdco Units. Under the terms of the Holdings LLC Agreement, all of the Holdco Units received by the Continuing LLC Members in the Reorganization Transactions will be subject to restrictions on disposition. Additionally, consistent with the terms of the applicable underlying unit grant agreements executed at the time of original grant, Holdco Units received by the Continuing LLC Members will be subject to vesting and forfeiture on the same basis as the units which were exchanged for the Holdco Units.
The holders of Holdco Units, including loanDepot, Inc., will incur U.S. federal, state and local income taxes on their proportionate share of any taxable income of LD Holdings. Net profits and net losses of LD Holdings will generally be allocated to the holders of Holdco Units (including loanDepot, Inc.) pro rata in accordance with their respective share of the net profits and net losses of LD Holdings. The Holdings LLC Agreement will provide for cash distributions, which we refer to as “tax distributions,” based on certain assumptions, to the holders of Holdco Units (including loanDepot, Inc.) pro rata based on their Holdco Units. Generally, these tax distributions to holders of Holdco Units will be an amount equal to our estimate of the taxable income of LD Holdings, net of taxable losses, allocable per Holdco Unit multiplied by an assumed tax rate equal to the highest effective marginal combined U.S. federal, state and local income tax rate prescribed for an individual or corporation resident in California (based on the character and source of the taxable income actually recognized). However, because tax distributions will be determined based on the holder of Holdco Units who is allocated the largest amount of taxable income on a per unit basis, LD Holdings may be required to make tax distributions that, in the aggregate, may exceed the amount of taxes that LD Holdings would have paid if it were taxed on its net income at the assumed rate. Any distributions will be subject to available cash and applicable law.
In addition, in certain circumstances, to the extent that tax distributions made to loanDepot, Inc. exceed the actual tax liability to which loanDepot, Inc. is subject from time to time, such “excess” tax distributions will be contributed to and used by LD Holdings and its operating entity subsidiaries for working capital, liquidity and other operating needs.
Under the Holdings LLC Agreement, the Continuing LLC Members (or certain permitted transferees thereof) will have the right, subject to the terms of the Holdings LLC Agreement, to exchange their Holdco Units (together with a corresponding number of shares of Class B Common Stock or Class C Common Stock, as applicable) for cash or shares of our Class A Common Stock on a one-for-one basis (at our election), subject to customary conversion rate adjustments for stock splits, stock dividends, reclassifications and other similar transactions. The Holdings LLC Agreement will provide that as a general matter a Continuing LLC Member will not have the right to exchange Holdco Units if we determine that such exchange would be prohibited by law or regulation or would violate other agreements with us to which the Continuing LLC Member may be subject. We may impose additional restrictions on exchange that we determine to be necessary or advisable so that LD Holdings is not treated as a “publicly traded partnership” for U.S. federal income tax purposes. As a Continuing LLC Member exchanges Holdco Units for shares of Class A Common Stock, the number of Holdco Units held
203
Table of Contents
by loanDepot, Inc. is correspondingly increased as it acquires the exchanged Holdco Units, and a corresponding number of shares of Class B Common Stock or Class C Common Stock, as applicable, are cancelled.
Blocker Tax Refund
In connection with the merger of Parthenon Blocker into the Company, the Company will agree to pay to the Parthenon Stockholders certain tax refunds payable to Parthenon Blocker, which are expected to consist of up to $3.5 million of excess federal and state income tax payments previously paid by Parthenon Blocker.
204
Table of Contents
PRINCIPAL AND SELLING STOCKHOLDERS
The following table sets forth information regarding the beneficial ownership of our Class A Common Stock and Holdco Units as of September 30, 2020, for:
| • | each beneficial owner of more than 5% of any class of our outstanding shares; |
| • | each of our named executive officers; |
| • | each of our directors; |
| • | all of our executive officers, directors as a group; and |
| • | each selling stockholder. |
The number of shares of our Class A Common Stock beneficially owned and percentages of beneficial ownership before the offering set forth below are based on (i) the number of shares of Class A Common Stock and Holdco Units (together with the corresponding shares of Class B or Class C Common Stock) to be issued and outstanding immediately prior to the consummation of the Offering Transactions after giving effect to the Reorganization Transactions and (ii) an assumed initial public offering price of $20.00 per share, which is the midpoint of the estimated price range set forth on the cover page of this prospectus. The number of shares of our Class A Common Stock beneficially owned and percentages of beneficial ownership after the offering set forth below are based on (i) the number of shares of Class A Common Stock and Holdco Units (together with the corresponding shares of Class B or Class C Common Stock) to be issued and outstanding after the Offering Transactions, including the use of proceeds from our sale of Class A Common stock to purchase Holdco Units and shares of Class B or Class C Common Stock from the Exchanging Members, and (ii) an assumed initial public offering price of $20.00 per share, which is the midpoint of the estimated price range set forth on the cover page of this prospectus. The table does not reflect any shares of our Class A common stock that may be purchased in this offering by directors, executive officers or beneficial holders of more than 5% of our outstanding common stock, through our Reserved Share Program described in “Underwriting—Reserved Share Program.”
205
Table of Contents
Beneficial ownership is determined in accordance with SEC rules. These rules generally attribute beneficial ownership of securities to persons who possess sole or shared voting power or investment power with respect to such securities or have the right to acquire such voting power or investment power within 60 days. Except as otherwise indicated, all persons listed below have sole voting and investment power with respect to the shares beneficially owned by them, subject to applicable community property laws. The table set forth below reflects the inclusion of both vested and unvested Holdco Units. Except as otherwise indicated, the address for each beneficial owner listed in the table below is c/o loanDepot.com, LLC, 26642 Towne Centre Drive, Foothill Ranch, California 92610.
| Class A Common Stock Beneficially Owned after giving effect to the Reorganization Transactions (on a fully exchanged and converted basis) (1) (2) |
Class D Common Stock Beneficially Owned after giving effect to the Reorganization Transactions (on a fully exchanged and converted basis) (1) (3) |
Combined Voting Power (4) | ||||||||||||||||||||||||||||||||||||||||||||||||||||||||||
| Before This Offering |
After This Offering |
After This Offering & Option Exercise |
Before This Offering |
After This Offering |
After This Offering & Option Exercise |
Before This Offering |
After This Offering |
After This Offering & Option Exercise |
||||||||||||||||||||||||||||||||||||||||||||||||||||
| Name of Beneficial Owner |
# | % | # | % | # | % | # | % | # | % | # | % | % | % | % | |||||||||||||||||||||||||||||||||||||||||||||
| Entities affiliated with Parthenon Capital(5) |
123,739,895 | 38.1 | % | 117,989,623 | 36.3 | % | 117,127,083 | 36.0 | % | 120,290,882 | 37.3 | % | 114,700,882 | 35.5 | % | 113,862,382 | 35.3 | % | 38.3 | % | 37.9 | % | 37.9 | % | ||||||||||||||||||||||||||||||||||||
| Executive Officers and Directors: |
||||||||||||||||||||||||||||||||||||||||||||||||||||||||||||
| Anthony Hsieh(6) |
131,433,210 | 40.4 | % | 125,374,846 | 38.6 | % | 124,466,092 | 38.3 | % | — | — | — | — | — | — | 61.6 | % | 61.1 | % | 61.0 | % | |||||||||||||||||||||||||||||||||||||||
| Patrick Flanagan(7) |
— | — | — | — | — | — | — | — | — | — | * | |||||||||||||||||||||||||||||||||||||||||||||||||
| Jeff Walsh(7) |
— | — | — | — | — | — | — | — | — | — | * | |||||||||||||||||||||||||||||||||||||||||||||||||
| Jeffrey DerGurahian(7) |
— | — | — | — | — | — | — | — | — | — | * | |||||||||||||||||||||||||||||||||||||||||||||||||
| Brian Golson(8) |
— | — | — | — | — | — | — | — | — | — | * | |||||||||||||||||||||||||||||||||||||||||||||||||
| Andrew Dodson(8) |
— | — | — | — | — | — | — | — | — | — | * | |||||||||||||||||||||||||||||||||||||||||||||||||
| John Dorman(7) |
— | — | — | — | — | — | — | — | — | — | * | |||||||||||||||||||||||||||||||||||||||||||||||||
| Dawn Lepore(7) |
— | — | — | — | — | — | — | — | — | — | * | |||||||||||||||||||||||||||||||||||||||||||||||||
| Executive Officers and Directors as a group (9 persons) |
131,433,210 | 40.4 | % | 125,374,846 | 38.6 | % | 124,466,092 | 38.3 | % | — | — | — | — | — | — | 61.6 | % | 61.1 | % | 61.0 | % | |||||||||||||||||||||||||||||||||||||||
| 1. | Each holder of Class C common stock and Class D common stock is entitled to 5 votes per share and each holder of Class A common stock and Class B common stock is entitled to one vote per share on all matters submitted to our stockholders for a vote. Our Class B common stock and Class C common stock do not have any of the economic rights (including rights to dividends and distributions upon liquidation) associated with our Class A common stock and Class D common stock. |
| 2. | The numbers of shares of Class A common stock beneficially owned and percentages of beneficial ownership set forth in the table assume that (a) all Holdings Units (together with the corresponding shares of Class C common stock) have been exchanged for shares of Class D common stock and (b) all shares of Class D common stock have been converted into shares of Class A common stock. |
| 3. | The numbers of shares of Class D common stock beneficially owned and percentages of beneficial ownership set forth in the table assume that all Holdings Units held by Parthenon Stockholders have been exchanged for shares of Class D common stock on a one-for-one basis. |
| 4. | Percentage of voting power represents voting power with respect to all shares of our Class A common stock, Class B common stock, Class C common stock and Class D common stock voting together as a single class (subject to class-specific weightings) and as calculated on a fully diluted basis (includes vested and unvested units). See “Description of Capital Stock.” Mr. Hsieh’s Combined Voting Power reflects voting agreement with Management TMIs, resulting in Voting Power in excess of his share count (which includes shares held directly and indirectly in the Company). |
| 5. | Includes 123,739,895 shares of Class D common stock owned by the Parthenon Stockholders. Parthenon Investors III, L.P., Parthenon Investors IV, L.P., PCap Associates, Parthenon Capital Partners Fund, L.P., PCP Managers, L.P., and Parthenon Capital Partners Fund II, LP, which are collectively referred to herein as the Parthenon Stockholders. PCP Managers |
206
Table of Contents
| GP, LLC is the general partner of PCP Managers, L.P., which is the managing member of PCap III, LLC, which is the managing member of PCap Partners III, LLC, which is the general partner of Parthenon Investors III, L.P. and also the managing partner of PCap Associates. PCP Managers, L.P. is also the general partner of each of Parthenon Capital Partners Fund, L.P., Parthenon Capital Partners Fund II, LP, PCP Managers, L.P. and PCP Partners IV, L.P., which is the general partner of Parthenon Investors IV, L.P. Brian P. Golson is a Managing Partner of PCP Managers GP, LLC and also serves as a Co-CEO and a Managing Partner at Parthenon Capital, an affiliate of each of the Parthenon Stockholders. Andrew C. Dodson serves as a Managing Partner at Parthenon Capital. Each of the above listed persons may be deemed to beneficially own the securities owned of record by the Parthenon Stockholders. However, each expressly disclaims beneficial ownership of such securities, except to the extent of his or its pecuniary interest therein. The address of the foregoing persons is c/o Parthenon Capital Partners, Four Embarcadero Center, Suite 3610, San Francisco, California 94111. |
| 6. | Mr. Hsieh’s holdings consists of (i) 8,307,632 shares of Class C common stock held by The JLSSAA Family Trust, (ii) 4,445,303 shares of Class C common stock held by JLSA, LLC, (iii) 50,218,161 shares of Class C common stock held by Trilogy Mortgage Holdings, Inc. , (iv) 67,403, 782 shares of Class C common stock held by Trilogy Management Investors Six, LLC, and 1,058,332 shares of Class C common stock held directly. Mr. Hsieh is deemed to have beneficial ownership and voting and investment power over the securities held by JLSA, LLC and Trilogy Mortgage Holdings, Inc. |
| 7. | Except for affiliates of Anthony Hsieh, common stock held for the benefit of other Named Executive Officers or Directors are done so through intermediate holding entities, namely Trilogy Management Investors Six, LLC (“TMI 6”), Trilogy Management Investors Seven, LLC (“TMI 7”), and Trilogy Management Investors Eight, LLC (“TMI 8”). These entities (collectively “Management TMIs” are controlled and managed by Mr. Hsieh, who holds an economic interest in TMI 6 only. |
| 8. | Mr. Golson and Mr. Dodson are each affiliated with Parthenon Capital and its affiliates. Messrs. Golson and Dodson disclaim ownership of the securities reported by Parthenon Capital and its affiliates, to the extent of their pecuniary interest therein. The address of the foregoing persons is c/o Parthenon Capital Partners, Four Embarcadero Center, Suite 3610, San Francisco, California 94111. |
207
Table of Contents
The following is a description of the material terms of our amended and restated certificate of incorporation and amended and restated bylaws that will be in effect upon consummation of the offering. We refer you to our amended and restated certificate of incorporation and amended and restated bylaws, copies of which have been filed as exhibits to the registration statement of which this prospectus forms a part.
Authorized Capitalization
Upon completion of the offering, our authorized capital stock will consist of 2,500,000,000 shares of Class A Common Stock, par value $0.001 per share, of which 17,207,649 shares will be issued and outstanding, 2,500,000,000 shares of Class B Common Stock, par value $0.001 per share, of which 0 shares will be issued and outstanding, 2,500,000,000 shares of Class C Common Stock, par value $0.001 per share, of which 193,091,469 shares will be issued and outstanding, 2,500,000,000 shares of Class D Common Stock, par value $0.001 per share, of which 114,700,882 shares will be issued and outstanding, and 50,000,000 shares of preferred stock, par value $0.01 per share, none of which will be issued and outstanding.
Unless our board of directors determines otherwise, we will issue all shares of our capital stock in uncertificated form.
Common Stock
We have four classes of common stock: Class A, Class B, Class C and Class D. The Class A Common Stock, Class B Common Stock, Class C Common Stock and Class D Common Stock will generally vote together as a single class on all matters submitted to a vote of stockholders, except as otherwise required by applicable law.
Class A Common Stock
Holders of shares of our Class A Common Stock are entitled to one vote for each share held of record on all matters on which stockholders are entitled to vote generally, including the election or removal of directors elected by our stockholders generally. The holders of our Class A Common Stock do not have cumulative voting rights in the election of directors.
Holders of shares of our Class A Common Stock are entitled to receive dividends when, as and if declared by our board of directors out of funds legally available therefor, subject to any statutory or contractual restrictions on the payment of dividends and to any restrictions on the payment of dividends imposed by the terms of any outstanding preferred stock. Dividends may not be declared or paid in respect of Class A Common Stock unless they are declared or paid in the same amount in respect of Class D Common Stock, and vice versa. With respect to stock dividends, holders of Class A Common Stock must receive Class A Common Stock.
Upon our liquidation, dissolution or winding up and after payment in full of all amounts required to be paid to creditors and to the holders of preferred stock having liquidation preferences, if any, the holders of shares of our common stock will be entitled to receive, pari passu, an amount per share equal to the par value thereof and thereafter the holders of shares of our Class A and Class D Common Stock will be entitled to share ratably our remaining assets available for distribution.
All shares of our Class A Common Stock that will be outstanding upon the completion of this offering will be fully paid and non-assessable. The Class A Common Stock will not be subject to further calls or assessments by us. Holders of shares of our Class A Common Stock do not have preemptive, subscription, redemption or conversion rights. There will be no redemption or sinking fund provisions applicable to the Class A Common Stock. The rights, powers, preferences and privileges of our Class A Common Stock will be subject to those of the holders of any shares of our preferred stock or any other series or class of stock we may authorize and issue in the future.
208
Table of Contents
Class B Common Stock
Holders of shares of our Class B Common Stock are entitled to one vote for each share held of record on all matters on which stockholders are entitled to vote generally, including the election or removal of directors elected by our stockholders generally, with the number of shares of Class B Common Stock held by each holder being equivalent to the number of Holdco Units held by such holder. The holders of our Class B Common Stock do not have cumulative voting rights in the election of directors.
Holders of shares of our Class B Common Stock are not entitled to receive dividends. Other than their par value, holders of our Class B Common Stock are not entitled to receive a distribution upon our liquidation, dissolution or winding up.
All shares of our Class B Common Stock that will be outstanding upon completion of this offering will be fully paid and non-assessable. The Class B Common Stock will not be subject to further calls or assessments by us. Holders of shares of our Class B Common Stock do not have preemptive, subscription, redemption or conversion rights. There will be no redemption or sinking fund provisions applicable to the Class B Common Stock. The rights, powers, preferences and privileges of our Class B Common Stock will be subject to those of the holders of any shares of our preferred stock or any other series or class of stock we may authorize and issue in the future.
Additional shares of Class B Common Stock will only be issued in the future to the extent necessary to maintain a one-to-one ratio between the number of shares of Class B Common Stock issued to the Continuing LLC Members and the number of related Holdco Units held by the Continuing LLC Members. Shares of Class B Common Stock will be cancelled on a one-for-one basis if we, at the election of a Continuing LLC Member, redeem the related Holdco Units held by such Continuing LLC Member and issue Class A Common Stock to the Continuing LLC Member in connection therewith pursuant to the terms of the Holdings LLC Agreement. Our Class B Common Stock is non-transferable, other than in connection with a transfer of the related Holdco Units to a permitted transferee under the Holdings LLC Agreement, in which case a like number of shares of Class B Common Stock must be transferred to the permitted transferee.
Class C Common Stock
Holders of shares of our Class C Common Stock are entitled to five votes for each share held of record on all matters on which stockholders are entitled to vote generally, including the election or removal of directors elected by our stockholders generally, with the number of shares of Class C Common Stock held by each holder being equivalent to the number of Holdco Units held by such holder. The holders of our Class C Common Stock do not have cumulative voting rights in the election of directors.
Holders of shares of our Class C Common Stock are not entitled to receive dividends. Other than their par value, holders of our Class C Common Stock are not entitled to receive a distribution upon our liquidation, dissolution or winding up.
The Class C common stock will not be subject to further calls or assessments by us. Holders of shares of our Class C common stock do not have preemptive, subscription, redemption or conversion rights.
All shares of our Class C Common Stock that will be outstanding upon completion of this offering will be fully paid and non-assessable. The Class C Common Stock will not be subject to further calls or assessments by us.
Holders of shares of our Class C Common Stock do not have preemptive, subscription, redemption or conversion rights. There will be no redemption or sinking fund provisions applicable to the Class C Common Stock. The rights, powers, preferences and privileges of our Class C Common Stock will be subject to those of the holders of any shares of our preferred stock or any other series or class of stock we may authorize and issue in the future.
209
Table of Contents
Shares of Class C Common Stock will only be issued in the future to the extent necessary to maintain a one- to-one ratio between the number of shares of Class C Common Stock issued to the Continuing LLC Members and the number of related Holdco Units held by the Continuing LLC Members. Shares of Class C Common Stock will be cancelled on a one-for-one basis if we, at the election of a Continuing LLC Member, redeem the related Holdco Units held by such Continuing LLC Member and issue Class A Common Stock or, at the election of the Continuing LLC Member pursuant to the terms of the Holdings LLC Agreement. Our Class C common stock is non-transferable, other than in connection with a transfer of the related Holdco Units to a permitted transferee under the Holdings LLC Agreement, in which case a like number of shares of Class C common stock must be transferred to the permitted transferee.
Each share of Class C Common Stock and accompanying Holdco Unit will automatically convert into one share of Class A Common Stock immediately prior to any sale or other transfer of such share by a Continuing LLC Member or any of its affiliates or permitted transferees to a non-permitted transferee.
Upon the completion of this offering, certain of the Continuing LLC Members will own 100% of our outstanding Class C Common Stock with the number of shares of Class C Common Stock held by any such Continuing LLC Member being equivalent to the number of Holdco Units held by such Continuing LLC Member, as the case may be.
Five years from the date of this offering, all shares of our Class C Common Stock will convert on a one-to-one basis into shares of our Class B Common Stock.
Class D Common Stock
Holders of shares of our Class D Common Stock are entitled to five votes for each share held of record on all matters on which stockholders are entitled to vote generally, including the election or removal of directors elected by our stockholders generally. The holders of our Class D Common Stock do not have cumulative voting rights in the election of directors.
Holders of shares of our Class D Common Stock are entitled to receive dividends when, as and if declared by our board of directors out of funds legally available therefor, subject to any statutory or contractual restrictions on the payment of dividends and to any restrictions on the payment of dividends imposed by the terms of any outstanding preferred stock. Dividends may not be declared or paid in respect of Class D Common Stock unless they are declared or paid in the same amount in respect of Class A Common Stock, and vice versa. With respect to stock dividends, holders of Class D Common Stock must receive Class D Common Stock.
Upon our liquidation, dissolution or winding up and after payment in full of all amounts required to be paid to creditors and to the holders of preferred stock having liquidation preferences, if any, the holders of shares of our Class D Common Stock and Class A Common Stock will be entitled to share ratably our remaining assets available for distribution.
All shares of our Class D Common Stock that will be outstanding at the time of the completion of the offering will be fully paid and non-assessable. The Class D Common Stock will not be subject to further calls or assessments by us. Holders of shares of our Class D Common Stock do not have preemptive, subscription, redemption or conversion rights. There will be no redemption or sinking fund provisions applicable to the Class D Common Stock. The rights, powers, preferences and privileges of our Class D Common Stock will be subject to those of the holders of any shares of our preferred stock or any other series or class of stock we may authorize and issue in the future.
210
Table of Contents
Upon the completion of this offering, the Parthenon Stockholders will own 100% of our outstanding Class D Common Stock.
Shares of Class D Common Stock may be exchanged at any time, at the option of the holder, for newly issued shares of Class A Common Stock, on a one-for-one basis (in which case their shares of Class D Common Stock will be cancelled on a one-for-one basis upon any such issuance).
Each share of Class D Common Stock will automatically convert into one share of Class A common stock immediately prior to any sale or other transfer of such share by a holder or its permitted transferees to a non-permitted transferee.
Five years from the date of this offering, all shares of our Class D Common Stock will convert on a one-to-one basis into shares of our Class A Common Stock.
Preferred Stock
Our amended and restated certificate of incorporation authorizes our board of directors to establish one or more series of preferred stock and to determine, with respect to any series of preferred stock, the terms and rights of that series, including:
| • | the designation of the series; |
| • | the number of shares of the series which our board may, except where otherwise provided in the preferred stock designation, increase or decrease, but not below the number of shares then outstanding; |
| • | whether dividends, if any, will be cumulative or non-cumulative and the dividend rate of the series; |
| • | the dates at which dividends, if any, will be payable; |
| • | the redemption rights and price or prices, if any, for shares of the series; |
| • | the terms and amounts of any sinking fund provided for the purchase or redemption of shares of the series; |
| • | the amounts payable on shares of the series in the event of any voluntary or involuntary liquidation, dissolution or winding up of the affairs of our company, or upon any distribution of assets of our company; |
| • | whether the shares of the series will be convertible into shares of any other class or series, or any other security, of our company or any other corporation, and, if so, the specification of the other class or series or other security, the conversion price or prices or rate or rates, any rate adjustments, the date or dates as of which the shares will be convertible and all other terms and conditions upon which the conversion may be made; |
| • | the preferences and special rights, if any, of the series and the qualifications and restrictions, if any, of the series; |
| • | the voting rights, if any, of the holders of the series; and |
| • | such other rights, powers and preferences with respect to the series as our board of directors may deem advisable. |
Authorized but Unissued Capital Stock
Delaware law does not require stockholder approval for any issuance of authorized shares. However, the listing requirements of the NYSE, which would apply if and for so long as our Class A Common Stock is listed on the NYSE, require stockholder approval of certain issuances. These additional shares may be used for a
211
Table of Contents
variety of corporate purposes, including future public offerings, to raise additional capital or to facilitate acquisitions. One of the effects of the existence of unissued and unreserved capital stock may be to enable our board of directors to issue shares to persons friendly to current management, which issuance could render more difficult or discourage an attempt to obtain control of our company by means of a merger, tender offer, proxy contest or otherwise, and thereby protect the continuity of our management and possibly deprive the stockholders of opportunities to sell their shares of Class A Common Stock at prices higher than prevailing market prices.
Anti–Takeover Effects of Certain Provisions of Delaware Law and Our Amended and Restated Certificate of Incorporation, Amended and Restated Bylaws and Stockholders Agreement
Certain provisions of our amended and restated certificate of incorporation and amended and restated bylaws as well as our stockholders agreement, which are summarized in the following paragraphs, may have an anti-takeover effect and may delay, defer or prevent a tender offer or takeover attempt that a stockholder might consider in its best interest, including those attempts that might result in a premium over the market price for the shares held by stockholders.
Authorized but Unissued Shares; Undesignated Preferred Stock
The authorized but unissued shares of our common stock will be available for future issuance without stockholder approval except as required by law or by any stock exchange on which our common stock may be listed. These additional shares may be utilized for a variety of corporate purposes, including future public offerings to raise additional capital, acquisitions and employee benefit plans. In addition, our board of directors may authorize, without stockholder approval, the issuance of undesignated preferred stock with voting rights or other rights or preferences designated from time to time by our board of directors. The existence of authorized but unissued shares of common stock or preferred stock may enable our board of directors to render more difficult or to discourage an attempt to obtain control of us by means of a merger, tender offer, proxy contest or otherwise.
No Cumulative Voting
The DGCL provides that stockholders are not entitled to the right to cumulate votes in the election of directors unless our certificate of incorporation provides otherwise. Our amended and restated certificate of incorporation will prohibit cumulative voting.
Stockholder Action by Written Consent and Calling of Special Meetings of Stockholders
Our amended and restated certificate of incorporation will provide that stockholder action can be taken only at an annual or special meeting of stockholders and cannot be taken by written consent in lieu of a meeting. Our amended and restated certificate of incorporation and bylaws will also provide that, except as otherwise required by law, special meetings of the stockholders can be called only pursuant to a resolution adopted by a majority of the total number of directors that we would have if there were no vacancies or by the chairman of our board of directors. Stockholders will not be permitted to call a special meeting or to require the board of directors to call a special meeting.
Advance Notice Requirements for Stockholder Proposals and Director Nominations
Our amended and restated bylaws will establish advance notice procedures with respect to stockholder proposals and the nomination of candidates for election as directors. In order for any matter to be “properly brought” before a meeting, a stockholder will have to comply with advance notice requirements and provide us with certain information. Our amended and restated bylaws allow the chairman of the meeting of stockholders to adopt rules and regulations for the conduct of meetings which may have the effect of precluding the conduct of certain business at a meeting if the rules and regulations are not followed.
212
Table of Contents
These provisions may defer, delay or discourage a potential acquirer from conducting a solicitation of proxies to elect the acquirer’s own slate of directors or otherwise attempting to obtain control of our company.
Classified Board of Directors
Our amended and restated certificate of incorporation will provide that our board of directors will be divided into three classes of directors, with the classes as nearly equal in number as possible. As a result, approximately one-third of our board of directors will be elected each year. The classification of directors will have the effect of making it more difficult for stockholders to change the composition of our board of directors.
Removal of Directors; Vacancies
Our amended and restated certificate of incorporation will provide that directors may only be removed from office only for cause and only upon the affirmative vote of at least 50% of the voting power of our outstanding shares of common stock entitled to vote in the election of directors. In addition, our amended and restated certificate of incorporation will provide that any newly-created directorship on the board of directors that results from an increase in the number of directors and any vacancy occurring on the board of directors shall be filled solely by a majority of the directors then in office, even if less than a quorum, or by a sole remaining director.
Stockholders Agreement
Effective upon the completion of the offering, we will enter into a stockholders agreement with the Parthenon Stockholders and Hsieh Stockholders (and their respective permitted transferees thereunder party thereto from time to time). Pursuant to the stockholders agreement, the Parthenon Stockholders will have (i) the right to designate two nominees for election to our board of directors so long as such group owns at least 15% of the total voting power of our common stock, and (ii) otherwise one nominee for election to our board of directors so long as such group owns at least 5% of the total voting power of our common stock. Additionally, the Hsieh Stockholders, will have (i) the right to designate two nominees for election to our board of directors so long as such group owns at least 5% of the total voting power of our common stock, and (ii) upon the Parthenon Stockholders’ ceasing to own more than 15% of the total voting power of our common stock, the Hsieh Stockholders shall have the right to designate an additional nominee to the our board of directors so long as (a) such nominee is independent under the NYSE listing standards and (b) the Hsieh Stockholders own greater than 25% of the total voting power of our common stock. We will agree to take certain actions to support those nominees for election and include the nominees in the relevant proxy statements. Brian P. Golson and Andrew C. Dodson are the initial designated nominees of the Parthenon Stockholders. Anthony Hsieh is the sole initial designated nominee of the Hsieh Stockholders. Additionally, the Hsieh Stockholders will be entitled to recommend the Class I board seat that will remain vacant upon consummation of this offering until such seat is filled. The Parthenon Stockholders and the Hsieh Stockholders will each additionally agree to take all necessary action, including voting their respective shares of common stock, to cause the election of the directors nominated by such other group in accordance with the terms of the stockholders agreement, and will each be entitled to propose the replacement for any of its board designees whose board service ceases for any reason. The stockholders agreement also provides for certain restrictions and rights with respect to transfer and sale of our Class A Common Stock (including Class A Common Stock received following an exchange of Holdco Units and shares of Class B and Class C Common Stock pursuant to the Holdings LLC Agreement) by the parties to the stockholders agreement. The board member designation rights will have the effect of making it more difficult for stockholders to change the composition of our board of directors.
Amendment to Certificate of Incorporation and Bylaws
Our amended and restated certificate of incorporation and amended and restated bylaws provide that the board of directors is expressly authorized to make, alter, amend, change, add to, rescind or repeal, in whole or in part, our bylaws without a stockholder vote in any matter not inconsistent with the laws of the State of Delaware or our amended and restated certificate of incorporation. In addition to any other vote otherwise required by law,
213
Table of Contents
any amendment, alteration, change, or repeal of our amended and restated bylaws by our stockholders will require the affirmative vote of at least 662/3% of the voting power of our outstanding shares of common stock, voting as a single class.
Additionally, the DGCL provides generally that the affirmative vote of a majority of the outstanding shares entitled to vote thereon, voting together as a single class, is required to amend a corporation’s certificate of incorporation, unless the certificate of incorporation requires a greater percentage. Our amended and restated certificate of incorporation will provide that the following provisions in our amended and restated certificate of incorporation may be amended, altered, repealed or rescinded only by the affirmative vote of the holders of at least 662/3% in voting power of all the then outstanding shares of our stock entitled to vote thereon, voting together as a single class:
| • | the provision requiring a 662/3% supermajority vote for stockholders to amend our amended and restated bylaws and provisions relating to amendments of our amended and restated certificate of incorporation; |
| • | the provisions providing for a classified board of directors (the range of the size of the board, election and term of our directors); |
| • | the provisions regarding resignation and removal of directors; |
| • | the provisions regarding competition and corporate opportunities; |
| • | the provisions regarding entering into business combinations with interested stockholders; |
| • | the provisions regarding stockholder action by written consent; |
| • | the provisions regarding calling special meetings of stockholders; |
| • | the provisions regarding filling vacancies on our board of directors and newly created directorships; |
| • | the provisions eliminating monetary damages for breaches of fiduciary duty by a director; and |
| • | the provision regarding forum selection. |
The combination of the classification of our board of directors, the lack of cumulative voting and the supermajority voting requirements makes it more difficult for our existing stockholders to replace our board of directors as well as for another party to obtain control of us by replacing our board of directors. Because our board of directors has the power to retain and discharge our officers, these provisions could also make it more difficult for existing stockholders or another party to effect a change in management.
These provisions may have the effect of deterring hostile takeovers or delaying or preventing changes in control of us or our management, such as a merger, reorganization or tender offer. These provisions are intended to enhance the likelihood of continued stability in the composition of our board of directors and its policies and to discourage certain types of transactions that may involve an actual or threatened acquisition of the Company. These provisions are designed to reduce our vulnerability to an unsolicited acquisition proposal. The provisions are also intended to discourage certain tactics that may be used in proxy fights. However, such provisions could have the effect of discouraging others from making tender offers for our shares and, as a consequence, they also may inhibit temporary fluctuations in the market price of our Class A common stock that often result from actual or rumored hostile takeover attempts.
Business Combinations
We have opted out of Section 203 of the DGCL; however, our amended and restated certificate of incorporation will contain similar provisions providing that we may not engage in certain “business
214
Table of Contents
combinations” with any “interested stockholder” for a three-year period following the time that the stockholder became an interested stockholder, unless:
| • | prior to such time, our board of directors approved either the business combination or the transaction which resulted in the stockholder becoming an interested stockholder; |
| • | upon consummation of the transaction that resulted in the stockholder becoming an interested stockholder, the interested stockholder owned at least 85% of our voting stock outstanding at the time the transaction commenced, excluding certain shares; or |
| • | at or subsequent to that time, the business combination is approved by our board of directors and by the affirmative vote of holders of at least 662/3% of our outstanding voting stock that is not owned by the interested stockholder. |
Generally, a “business combination” includes a merger, asset or stock sale or other transaction resulting in a financial benefit to the interested stockholder. Subject to certain exceptions, an “interested stockholder” is a person who, together with that person’s affiliates and associates, owns, or within the previous three years owned, 15% or more of our outstanding voting stock. For purposes of this section only, “voting stock” has the meaning given to it in Section 203 of the DGCL.
Under certain circumstances, this provision will make it more difficult for a person who would be an “interested stockholder” to effect various business combinations with us for a three-year period. This provision may encourage companies interested in acquiring us to negotiate in advance with our board of directors because the stockholder approval requirement would be avoided if our board of directors approves either the business combination or the transaction which results in the stockholder becoming an interested stockholder. These provisions also may have the effect of preventing changes in our board of directors and may make it more difficult to accomplish transactions which stockholders may otherwise deem to be in their best interests.
Our amended and restated certificate of incorporation will provide that Parthenon Capital and its affiliates, and any of their respective direct or indirect transferees and any group as to which such persons are a party, will not constitute “interested stockholders” for purposes of this provision.
Indemnification and Limitations on Directors’ Liability
Section 145 of the DGCL grants each Delaware corporation the power to indemnify any person who is or was a director, officer, employee or agent of a corporation, against expenses, including attorneys’ fees, judgments, fines and amounts paid in settlement actually and reasonably incurred by him or her in connection with any threatened, pending or completed action, suit or proceeding, whether civil, criminal, administrative or investigative, other than an action by or in the right of the corporation, by reason of serving or having served in any such capacity, if he or she acted in good faith in a manner reasonably believed to be in, or not opposed to, the best interests of the corporation, and, with respect to any criminal action or proceeding, had no reasonable cause to believe his or her conduct was unlawful. A Delaware corporation may similarly indemnify any such person in actions by or in the right of the corporation if he or she acted in good faith in a manner reasonably believed to be in, or not opposed to, the best interests of the corporation, except that no indemnification may be made in respect of any claim, issue or matter as to which the person shall have been adjudged to be liable to the corporation unless and only to the extent that the Delaware Court of Chancery or the court in which the action was brought determines that, despite adjudication of liability, but in view of all of the circumstances of the case, the person is fairly and reasonably entitled to indemnity for expenses which the Delaware Court of Chancery or other court shall deem proper.
Section 102(b)(7) of the DGCL enables a corporation in its certificate of incorporation, or an amendment thereto, to eliminate or limit the personal liability of a director to the corporation or its stockholders for monetary damages for violations of the director’s fiduciary duty as a director, except (i) for any breach of the director’s
215
Table of Contents
duty of loyalty to the corporation or its stockholders, (ii) for acts or omissions not in good faith or which involve intentional misconduct or a knowing violation of law, (iii) pursuant to Section 174 of the DGCL (providing for director liability with respect to unlawful payment of dividends or unlawful stock purchases or redemptions) or (iv) for any transaction from which a director derived an improper personal benefit. Our amended and restated certificate of incorporation will provide for such limitation of liability.
Our amended and restated certificate of incorporation and bylaws will indemnify our directors and officers to the full extent permitted by the DGCL and our amended and restated certificate of incorporation also allows our board of directors to indemnify other employees. This indemnification will extend to the payment of judgments in actions against officers and directors and to reimbursement of amounts paid in settlement of such claims or actions and may apply to judgments in favor of the corporation or amounts paid in settlement to the corporation. This indemnification will also extend to the payment of attorneys’ fees and expenses of officers and directors in suits against them where the officer or director acted in good faith and in a manner he or she reasonably believed to be in, or not opposed to, the best interests of the Company, and, with respect to any criminal action or proceeding, he or she had no reasonable cause to believe his or her conduct was unlawful. This right of indemnification is not exclusive of any right to which the officer or director may be entitled as a matter of law and shall extend and apply to the estates of deceased officers and directors.
We maintain a directors’ and officers’ insurance policy. The policy insures directors and officers against unindemnified losses arising from certain wrongful acts in their capacities as directors and officers and reimburses us for those losses for which we have lawfully indemnified the directors and officers. The policy contains various exclusions that are normal and customary for policies of this type.
We believe that the limitation of liability and indemnification provisions in our amended and restated certificate of incorporation, bylaws and insurance policies are necessary to attract and retain qualified directors and officers. However, these provisions may discourage derivative litigation against directors and officers, even though an action, if successful, might benefit us and other stockholders. Furthermore, a stockholder’s investment may be adversely affected to the extent we pay the costs of settlement and damage awards against directors and officers as required or allowed by these limitation of liability and indemnification provisions.
At present, there is no pending litigation or proceeding involving any of our directors, officers, employees or agents as to which indemnification is sought from us, nor are we aware of any threatened litigation or proceeding that may result in an indemnification claim.
Corporate Opportunity
Our amended and restated certificate of incorporation will provide that we renounce any interest or expectancy in, or in being offered an opportunity to participate in, any business opportunity that may from time to time be presented to Anthony Hsieh or the Parthenon Stockholders or any of their officers, directors, agents, stockholders, members, partners, affiliates and subsidiaries (other than us and our subsidiaries) and that may be a business opportunity for Anthony Hsieh or Parthenon Capital, even if the opportunity is one that we might reasonably have pursued or had the ability or desire to pursue if granted the opportunity to do so; provided, that, with respect to Anthony Hsieh, only to the extent that such business is not a Core Business. A “Core Business” is a business in which the Company engages in a material respect and any business in which the Company is actively contemplating, at a senior executive level, engaging in a material respect, in each case, at the time of determination. No such person will be liable to us for breach of any fiduciary or other duty, as a director or officer or otherwise, by reason of the fact that such person, acting in good faith, pursues or acquires any such business opportunity, directs any such business opportunity to another person or fails to present any such business opportunity, or information regarding any such business opportunity, to us unless, in the case of any such person who is our director or officer, any such business opportunity is expressly offered to such director or officer solely in his or her capacity as our director or officer. Neither Parthenon Capital nor any of its representatives has any duty to refrain from engaging directly or indirectly in the same or similar business activities or lines of business as us or any of our subsidiaries.
216
Table of Contents
Choice of Forum
Our amended and restated certificate of incorporation will provide that, unless we select or consent in writing to the selection of another forum, the Court of Chancery of the State of Delaware (or, if the Court of Chancery does not have jurisdiction, another state court or a federal court located within the State of Delaware) shall be the exclusive forum for any complaints asserting any “internal corporate claims,” which include claims in the right of our company (i) that are based upon a violation of a duty by a current or former director, officer, employee, or stockholder in such capacity or (ii) as to which the DGCL confers jurisdiction upon the Court of Chancery. Further, unless we select or consent to the selection of an alternative forum, the federal district courts of the United States shall be the exclusive forum for the resolution of any complaint asserting a cause of action arising under the Securities Act. Our exclusive forum provision will not apply to suits brought to enforce any liability or duty created by the Exchange Act, and investors cannot waive compliance with the federal securities laws and the rules and regulations thereunder. Any person or entity purchasing or otherwise acquiring an interest in any shares of our capital stock shall be deemed to have notice of and to have consented to the forum provisions in our amended and restated certificate of incorporation. Although we believe these provisions will benefit us by providing increased consistency in the application of Delaware law for the specified types of actions and proceedings, the provisions may have the effect of discouraging lawsuits against our directors, officers, employees and agents. The enforceability of similar exclusive forum provisions in other companies’ certificates of incorporation has been challenged in legal proceedings, and it is possible that, in connection with one or more actions or proceedings described above, a court could rule that this provision in our amended and restated certificate of incorporation is inapplicable or unenforceable.
Transfer Agent and Registrar
The transfer agent and registrar for our Class A Common Stock will be American Stock Transfer & Trust Company, LLC.
Listing
We intend to list our Class A Common Stock on the NYSE under the symbol “LDI”.
217
Table of Contents
SHARES ELIGIBLE FOR FUTURE SALE
Prior to the offering, there has been no public market for our Class A Common Stock. No prediction can be made as to the effect, if any, future sales of shares, or the availability for future sales of shares, will have on the market price of our Class A Common Stock prevailing from time to time. The sale of substantial amounts of our Class A Common Stock in the public market, or the perception that such sales could occur, could harm the prevailing market price of our Class A Common Stock.
Currently, 1,000 shares of our single class of common stock, par value $0.001 per share, are outstanding and owned by LD Holdings. In connection with the offering, all 1,000 shares of such common stock held by LD Holdings will be cancelled. In connection with this offering, we will issue 114,700,882 shares of Class D Common Stock to the Parthenon Stockholders. Upon consummation of the offering, we will have outstanding 17,207,649 shares of Class A Common Stock (or a maximum of 19,457,649 shares of Class A Common Stock if the underwriters exercise their option to purchase additional shares) and 193,091,469 shares of Class B or Class C Common Stock (or 191,679,969 shares of Class B or Class C Common Stock if the underwriters exercise their option to purchase additional shares in full). The shares of Class A Common Stock sold in the offering will be freely tradable without restriction or further registration under the Securities Act, except for any Class A Common Stock held by our “affiliates,” as defined in Rule 144, which would be subject to the limitations and restrictions described below. All of the other outstanding 2,207,649 shares of Class A Common Stock will be restricted securities that may not be sold in the absence of registration under the Securities Act unless an exemption from registration is available, including the exemption provided by Rule 144, and all are subject to the 180-day lock-up restrictions described below.
In addition, pursuant to certain provisions of the Holdings LLC Agreement, the Continuing LLC Members can from time to time exchange an equal number of Holdco Units and shares of Class B or Class C Common Stock for shares of loanDepot, Inc. Class A Common Stock on a one-for-one basis, subject to customary conversion rate adjustments for stock splits, stock dividends and reclassifications. Upon consummation of the offering, the Continuing LLC Members will hold 193,091,469 Holdco Units (or Holdco Units if the underwriters exercise their option to purchase additional shares in full), all of which will be exchangeable together with an equal number of shares of Class B or Class C Common Stock for shares of our Class A Common Stock. The shares of Class A Common Stock we issue upon such exchanges would be “restricted securities” as defined in Rule 144 unless we register such issuances.
In addition, 14,123,387 shares of Class A Common Stock may be granted under our 2021 Omnibus Incentive Plan (including any LTIP Units, which may be granted thereunder) not including the 2,207,649 vested restricted stock units of Class A common stock to be granted to employees in connection with the offering, which amount shall be increased on the first day of each fiscal year during the term of the 2021 Omnibus Incentive Plan commencing with the 2022 fiscal year by 2% of the total number of shares of common stock outstanding on the last day of the immediately preceding fiscal year or a lesser amount determined by our board of directors. See “Executive Compensation—2021 Omnibus Incentive Plan.” We intend to file one or more registration statements on Form S-8 under the Securities Act to register Class A Common Stock issued or reserved for issuance under our 2021 Omnibus Incentive Plan. Any such Form S-8 registration statement will automatically become effective upon filing. Accordingly, shares registered under such registration statement will be available for sale in the open market, unless such shares are subject to vesting restrictions with us or the lock-up restrictions described below.
Lock-Up of Our Class A Common Stock
We, all of our directors and officers and substantially all of the holders of our outstanding stock and stock options, including all of the selling stockholders, have agreed with the underwriters, subject to certain exceptions described below, not to (i) offer, pledge, sell, contract to sell, sell any option or contract to purchase, purchase
218
Table of Contents
any option or contract to sell, grant any option, right or warrant to purchase, lend or otherwise transfer or dispose of, directly or indirectly, any shares of Class A Common Stock or any securities convertible into or exercisable or exchangeable for shares of Class A Common Stock, (ii) file any registration statement with the SEC relating to the offering of any shares of Class A Common Stock or any securities convertible into or exercisable or exchangeable for Class A Common Stock, or (iii) enter into any swap or other arrangement that transfers to another, in whole or in part, any of the economic consequences of ownership of the Class A Common Stock, whether owned directly by such member (including holding as a custodian) or with respect to which such member has beneficial ownership within the rules and regulations of the SEC, during the period from the date of this prospectus continuing through the date 180 days after the date of this prospectus, except with the prior written consent of Goldman Sachs & Co. LLC, BofA Securities, Inc., Credit Suisse Securities (USA) LLC and Morgan Stanley & Co. LLC. Currently, the underwriters have no current intention to release the aforementioned holders of our Class A Common Stock from the lock-up restrictions described above.
Our lock-up agreement will provide for certain exceptions. See “Underwriting.”
Rule 144
The shares of Class A Common Stock to be issued upon exchange of the Holdco Units and other shares of Class A Common Stock not sold in this offering will be, when issued, “restricted” securities under the meaning of Rule 144 under the Securities Act, and may not be sold in the absence of registration under the Securities Act unless an exemption from registration is available, including the exemption provided by Rule 144.
In general, under Rule 144 under the Securities Act, a person (or persons whose shares are aggregated) who is not deemed to have been an “affiliate” of ours at any time during the three months preceding a sale, and who has held restricted securities within the meaning of Rule 144 for at least six months (including any period of consecutive ownership of preceding non-affiliated holders) would be entitled to sell those securities, subject only to the availability of current public information about us. As defined in Rule 144, an “affiliate” of an issuer is a person that directly, or indirectly, through one or more intermediaries, controls, or is under common control with LD Holdings. A non-affiliated person who has held restricted securities within the meaning of Rule 144 for at least one year would be entitled to sell those securities without regard to the provisions of Rule 144.
A person (or persons whose securities are aggregated) who is deemed to be an affiliate of ours and who has held restricted securities within the meaning of Rule 144 for at least six months would be entitled to sell within any three-month period a number of securities that does not exceed the greater of one percent of the then outstanding shares of securities of such class or the average weekly trading volume of securities of such class during the four calendar weeks preceding such sale. Such sales are also subject to certain manner of sale provisions, notice requirements and the availability of current public information about us (which requires that we are current in our periodic reports under the Exchange Act).
219
Table of Contents
U.S. FEDERAL TAX CONSIDERATIONS FOR NON-U.S. HOLDERS
The following is a summary of material U.S. federal income tax consequences to non-U.S. holders, as defined below, of the purchase, ownership and disposition of shares of our Class A Common Stock. This summary deals only with non-U.S. holders of shares of Class A Common Stock that purchase the shares in the offering and will hold such shares as capital assets (generally, property held for investment) within the meaning of section 1221 of the Code.
For purposes of this discussion, a “non-U.S. holder” is a beneficial owner of shares of our Class A Common Stock that, for U.S. federal income tax purposes, is not a partnership and is not any of the following:
| • | an individual who is a citizen or resident of the United States; |
| • | a corporation (or any other entity treated as a corporation for U.S. federal income tax purposes) created or organized in or under the laws of the United States, any state thereof or the District of Columbia; |
| • | an estate the income of which is subject to U.S. federal income taxation regardless of its source; or |
| • | a trust if it (1) is subject to the primary supervision of a court within the United States and one or more U.S. persons have the authority to control all substantial decisions of the trust or (2) has a valid election in effect under applicable U.S. Treasury regulations to be treated as a U.S. person for U.S. federal income tax purposes. |
This summary is based upon provisions of the Code, U.S. Treasury regulations promulgated under the Code, rulings and other administrative pronouncements, and judicial decisions, all as of the date hereof. These authorities are subject to different interpretations and may be changed, perhaps retroactively, so as to result in U.S. federal income tax consequences different from those summarized below. We cannot assure you that a change in law, including the possibility of major tax legislation in 2021 and later years, possibly with retroactive application, will not significantly alter the tax considerations described in this summary. This summary does not address all aspects of U.S. federal income taxation and does not deal with non-U.S., state, local, alternative minimum, gift and estate, or other tax considerations, including the Medicare tax on certain investment income, that may be relevant to non-U.S. holders in light of their particular circumstances. In addition, this summary does not describe the U.S. federal income tax consequences applicable to you if you are subject to special treatment under U.S. federal income tax laws (including if you are a U.S. expatriate or U.S. expatriated entity or subject to the U.S. anti-inversion rules, a bank or other financial institution, an insurance company, a tax-exempt entity, a broker, dealer, or trader in securities, commodities or currencies, a regulated investment company, a real estate investment trust, a “controlled foreign corporation,” a “passive foreign investment company,” a partnership or other pass-through entity for U.S. federal income tax purposes (or an investor in such a pass-through entity), a corporation that accumulates earnings to avoid U.S. federal income tax, a person who acquired shares of our common stock as compensation or otherwise in connection with the performance of services, or a person who has acquired shares of our common stock as part of a straddle, hedge, conversion transaction, synthetic security or other integrated investment, or risk reduction transaction).
We have not sought and do not plan to seek any rulings from the U.S. Internal Revenue Service, or the IRS, regarding the statements made and the conclusions reached in this summary. There can be no assurance that the IRS or a court will not take positions concerning the tax consequences of the ownership or disposition of shares of our Class A Common Stock that differ from those discussed in this summary.
If any entity or arrangement treated as a partnership for U.S. federal income tax purposes holds shares of our Class A Common Stock, the tax treatment of a partner generally will depend upon the status of the partner and the activities of the partner and the partnership. If you are a partner of a partnership holding shares of our Class A Common Stock, you should consult your tax advisors.
220
Table of Contents
This summary is for general information only and is not intended to constitute a complete description of all U.S. federal income tax consequences for non-U.S. holders relating to the purchase, ownership and disposition of shares of our Class A Common Stock. If you are considering the purchase of shares of our Class A Common Stock, you should consult your tax advisors concerning the particular U.S. federal income tax consequences to you of the purchase, ownership and disposition of shares of our Class A Common Stock, as well as the consequences to you arising under U.S. tax laws other than the federal income tax law discussed in this summary or under the laws of any other applicable taxing jurisdiction in light of your particular circumstances.
Dividends
Distributions of cash or property (other than certain stock distributions) with respect to our Class A Common Stock will generally constitute dividends for U.S. federal income tax purposes to the extent paid from our current or accumulated earnings and profits, as determined under U.S. federal income tax principles. To the extent any such distributions exceed both our current and our accumulated earnings and profits, such excess amount will be allocated ratably among each share of common stock with respect to which the distribution is paid and will first be treated as a tax-free return of capital reducing your adjusted tax basis in our Class A Common Stock, but not below zero, and thereafter will be treated as gain from the sale or other taxable disposition of such stock, the treatment of which is discussed under “—Gain on Disposition of Shares of Class A Common Stock.” Your adjusted tax basis in a share of our Class A Common Stock is generally your purchase price for such share, reduced by the amount of any such prior tax-free returns of capital (but not below zero).
Dividends paid to a non-U.S. holder generally will be subject to a U.S. withholding tax at a 30% rate, or such lower rate as may be specified by an applicable income tax treaty. A non-U.S. holder of shares of our Class A Common Stock who wishes to claim the benefit of an applicable treaty rate and avoid backup withholding, as discussed below, for dividends generally will be required (a) to properly complete IRS Form W-8BEN or W-8BEN-E (or other applicable form) and certify under penalty of perjury that such holder is not a U.S. person as defined under the Code and is eligible for treaty benefits, or (b) if such holder’s shares of our Class A Common Stock are held through certain foreign intermediaries or foreign partnerships, satisfy the relevant certification requirements of applicable U.S. Treasury regulations. This certification must be provided to us or our paying agent prior to the payment to you of any dividends and must be updated periodically, including upon a change in circumstances that makes any information on such certificate incorrect.
Dividends paid to a non-U.S. holder that are effectively connected with the conduct of a trade or business within the United States by such non-U.S. holder (and, if required by an applicable income tax treaty, are attributable to a U.S. permanent establishment) generally will not be subject to the aforementioned withholding tax, provided certain certification and disclosure requirements are satisfied (including providing a properly completed IRS Form W-8ECI or other applicable IRS Form W-8). Instead, such dividends generally will be subject to U.S. federal income tax on a net income basis at applicable graduated individual or corporate rates in generally the same manner as if the non-U.S. holder were a U.S. person as defined under the Code, unless an applicable income tax treaty provides otherwise. A non-U.S. holder that is treated as a corporation for U.S. federal income tax purposes may be subject to an additional “branch profits tax” at a 30% rate (or such lower rate as may be specified by an applicable income tax treaty) on earnings and profits attributable to dividends that are effectively connected with its conduct of a U.S. trade or business (and, if an income tax treaty applies, are attributable to its U.S. permanent establishment), subject to adjustments.
A non-U.S. holder of shares of our Class A Common Stock eligible for a reduced rate of U.S. withholding tax pursuant to an income tax treaty may obtain a refund of any excess amounts withheld by timely filing an appropriate claim for refund with the IRS.
221
Table of Contents
Gain on Disposition of Shares of Class A Common Stock
Subject to the discussions below on backup withholding and Foreign Account Tax Compliance Act (“FATCA”), any gain realized by a non-U.S. holder on the sale or other disposition of shares of our Class A Common Stock generally will not be subject to U.S. federal income tax unless:
| • | the gain is effectively connected with a trade or business of the non-U.S. holder in the United States (and, if required by an applicable income tax treaty, is attributable to a U.S. permanent establishment); |
| • | the non-U.S. holder is an individual who is present in the United States for 183 days or more in the taxable year of such sale or other disposition, and certain other conditions are met; or |
| • | we are or have been a U.S. real property holding corporation for U.S. federal income tax purposes at any time during the shorter of the five-year period ending on the date of the disposition or the period that the non-U.S. holder held shares of our common stock, and certain other conditions are met. |
In the case of a non-U.S. holder described in the first bullet point above, any net gain derived from the disposition generally will be subject to U.S. federal income tax under graduated U.S. federal income tax rates on a net income basis in generally the same manner as if the non-U.S. holder were a U.S. person as defined under the Code, unless an applicable income tax treaty provides otherwise. Additionally, a non-U.S. holder that is a corporation may be subject to a branch profits tax equal to 30% of its effectively connected earnings and profits attributable to such gain (or, if an income tax treaty applies, at such lower rate as may be specified by the treaty on its gains attributable to its U.S. permanent establishment), subject to adjustments. Except as otherwise provided by an applicable income tax treaty, an individual non-U.S. holder described in the second bullet point above will be subject to a 30% tax on any gain derived from the disposition, which may be offset by certain U.S. source capital losses provided that the non-U.S. holder has timely filed U.S. federal income tax returns with respect to such losses, even though the individual is not considered a resident of the United States under the Code. With respect to the third bullet point above, we believe we are not and, although no assurance can be given, do not anticipate becoming a U.S. real property holding corporation for U.S. federal income tax purposes. If we are, or become, a U.S. real property holding corporation, then, as long as our Class A Common Stock is regularly traded on an established securities market, a non-U.S. holder will generally not be subject to U.S. federal income tax on the disposition of our common stock so long as the non-U.S. holder has not held more than 5% (actually or constructively) of our total outstanding common stock at any time during the shorter of the five-year period preceding the date of such disposition or such non-U.S. holder’s holding period. You should consult your own tax advisor about the consequences that could result if we are, or become, a U.S. real property holding corporation.
Information Reporting and Backup Withholding
The amount of dividends paid to each non-U.S. holder, and the tax withheld with respect to such dividends generally will be reported annually to the IRS and to each such holder, regardless of whether withholding was reduced or eliminated by an applicable tax treaty. Copies of the information returns reporting such dividends and withholding may also be made available to the tax authorities in the country in which the non-U.S. holder resides or is established under the provisions of an applicable income tax treaty or agreement.
A non-U.S. holder generally will be subject to backup withholding (currently at a rate of 24%) for dividends paid to such non-U.S. holder on shares of our Class A Common Stock unless such holder certifies under penalty of perjury (usually on an IRS Form W-8BEN or W-8BEN-E) that it is a non-U.S. holder (and the payor does not have actual knowledge or reason to know that such holder is a U.S. person as defined under the Code), or such holder otherwise establishes an exemption. Information reporting and, depending on the circumstances, backup withholding will apply to the proceeds of a sale of shares of our Class A Common Stock within the United States or conducted through certain U.S.-related financial intermediaries, unless the beneficial owner certifies under penalty of perjury that it is a non-U.S. holder (and the payor does not have actual knowledge or reason to know that the beneficial owner is a United States person as defined under the Code), or such owner otherwise establishes an exemption.
222
Table of Contents
Backup withholding is not an additional tax. Any amounts withheld under the backup withholding rules may be allowed as a refund or a credit against a non-U.S. holder’s U.S. federal income tax liability provided the required information is timely furnished to the IRS.
Foreign Account Tax Compliance Act
Legislation and administrative guidance, commonly known as “FATCA,” generally imposes a withholding tax of 30% on any dividends on our Class A Common Stock paid to certain “foreign financial institutions,” as specifically defined under such rules (and including where such entity is acting as an intermediary), and generally including a non-U.S. investment vehicle, unless such institution enters into an agreement with the U.S. government to, among other things, collect and provide to the U.S. tax authorities substantial information regarding U.S. account holders of such institution (which includes certain equity and debt holders of such institution, as well as certain account holders that are foreign entities with U.S. owners) or another exception applies. Absent any applicable exception, FATCA will also generally impose a withholding tax of 30% on any dividends on our Class A Common Stock paid to a foreign entity that is not a foreign financial institution unless such entity provides the withholding agent with either a certification that such entity does not have any substantial U.S. owners or a certification identifying the substantial U.S. owners of the entity, which generally includes any U.S. person who directly or indirectly owns more than 10% of the entity, and meets certain other specified requirements. As initially enacted, beginning on January 1, 2019 a withholding tax of 30% would have also applied to the gross proceeds of a disposition of our Class A Common Stock paid to a foreign financial institution or to a non-financial foreign entity unless the reporting and certification requirements described above had been met or another exception applied. However, the United States Treasury Department has subsequently issued proposed Treasury regulations that, when finalized, will provide for the repeal of the 30% withholding tax that would have applied to all payments of gross proceeds from the sale, exchange or other disposition of our Class A Common Stock. In the preamble to the proposed regulations, the government provided that taxpayers may rely upon these proposed regulations until the issuance of final regulations takes place. An intergovernmental agreement between the United States and an applicable foreign country may modify these requirements. Under certain circumstances, a non-U.S. holder of our Class A Common Stock may be eligible for refunds or credits of such taxes, and a non-U.S. holder might be required to file a U.S. federal income tax return to claim such refunds or credits. Investors are encouraged to consult with their tax advisors regarding the possible implications of FATCA on their investment in our Class A Common Stock.
THE SUMMARY OF MATERIAL U.S. FEDERAL INCOME TAX CONSIDERATIONS FOR NON-U.S. HOLDERS ABOVE IS INCLUDED FOR GENERAL INFORMATION PURPOSES ONLY. POTENTIAL PURCHASERS OF OUR CLASS A COMMON STOCK ARE URGED TO CONSULT THEIR TAX ADVISORS TO DETERMINE THE U.S. FEDERAL, STATE, LOCAL AND NON-U.S. INCOME AND OTHER TAX AND TAX TREATY CONSIDERATIONS OF PURCHASING, OWNING AND DISPOSING OF OUR CLASS A COMMON STOCK.
223
Table of Contents
Under the terms and subject to the conditions in an underwriting agreement dated the date of this prospectus, the underwriters named below, for whom Goldman Sachs & Co. LLC, BofA Securities, Inc., Credit Suisse Securities (USA) LLC and Morgan Stanley & Co. LLC are acting as representatives, have severally agreed to purchase, and the selling stockholders have agreed to sell to them, the number of shares indicated below:
| Underwriters |
Number of Shares |
|||
| Goldman Sachs & Co. LLC |
||||
| BofA Securities, Inc. |
||||
| Credit Suisse Securities (USA) LLC |
||||
| Morgan Stanley & Co. LLC |
||||
| Barclays Capital Inc. |
||||
| Citigroup Global Markets Inc. |
||||
| Jefferies LLC |
||||
| UBS Securities LLC |
||||
| JMP Securities LLC |
||||
| Nomura Securities International, Inc. |
||||
| Piper Sandler & Co. |
||||
| Raymond James & Associates, Inc. |
||||
| William Blair & Company, L.L.C. |
||||
| AmeriVet Securities, Inc. |
||||
|
|
|
|||
| Total |
15,000,000 | |||
The underwriters and the representatives are collectively referred to as the “underwriters” and the “representatives,” respectively. The underwriters are offering the shares of Class A Common Stock subject to their acceptance of the shares from the selling stockholders and subject to prior sale. The underwriters may offer and sell shares of Class A Common Stock through certain of their affiliates or other registered broker-dealers or selling agents. The underwriting agreement provides that the obligations of the several underwriters to pay for and accept delivery of the shares of Class A Common Stock offered by this prospectus are subject to the approval of certain legal matters by their counsel and to certain other conditions. The underwriters are obligated to take and pay for all of the shares of Class A Common Stock offered by this prospectus if any such shares are taken. However, the underwriters are not required to take or pay for the shares covered by the underwriters’ option to purchase additional shares described below.
The underwriters initially propose to offer part of the shares of Class A Common Stock directly to the public at the offering price listed on the cover page of this prospectus and part to certain dealers. After the initial offering of the shares of Class A Common Stock, the offering price and other selling terms may from time to time be varied by the representatives.
We and the selling stockholders have granted to the underwriters an option, exercisable for 30 days from the date of this prospectus, to purchase up to 2,250,000 additional shares of Class A Common Stock at the public offering price listed on the cover page of this prospectus, less underwriting discounts and commissions. To the extent the option is exercised, each underwriter will become obligated, subject to certain conditions, to purchase about the same percentage of the additional shares of Class A Common Stock as the number listed next to the underwriter’s name in the preceding table bears to the total number of shares of Class A Common Stock listed next to the names of all underwriters in the preceding table. The underwriters reserve the right to withdraw, cancel or modify offers to the public and to reject orders in whole or part.
224
Table of Contents
The following table shows the per share and total public offering price, underwriting discounts and commissions, and proceeds before expenses to the selling stockholders. These amounts are shown assuming both no exercise and full exercise of the underwriters’ option to purchase up to an additional 2,250,000 shares of Class A Common Stock.
| Per Share |
Total | |||||||||||
| No Exercise |
Full Exercise |
|||||||||||
| Public offering price |
$ | $ | $ | |||||||||
| Underwriting discounts and commissions to be paid by: |
||||||||||||
| Us |
$ | $ | $ | |||||||||
| Selling stockholders |
$ | $ | $ | |||||||||
| Proceeds, before expenses, to us |
$ | $ | $ | |||||||||
| Proceeds, before expenses, to selling stockholders |
$ | $ | $ | |||||||||
The estimated offering expenses payable by us, exclusive of the underwriting discounts and commissions and financial advisory services fee (further disclosed herein), are approximately $8.7 million. We have agreed to reimburse the underwriters for expenses relating to clearance of this offering with the Financial Industry Regulatory Authority up to $60,000.
The underwriters have informed us that they do not intend sales to discretionary accounts to exceed 5% of the total number of shares of Class A Common Stock offered by them.
We intend to list our Class A Common Stock on the NYSE under the trading symbol “LDI”.
We, all of our directors and officers and substantially all of the holders of our outstanding stock and stock options, including all of the selling stockholders, have agreed that, without the prior written consent of Goldman Sachs & Co. LLC, BofA Securities, Inc., Credit Suisse Securities (USA) LLC and Morgan Stanley & Co. LLC, on behalf of the underwriters, we and they will not, during the period ending 180 days after the date of this prospectus (the “restricted period”):
| • | offer, pledge, sell, contract to sell, sell any option or contract to purchase, purchase any option or contract to sell, grant any option, right or warrant to purchase, lend or otherwise transfer or dispose of, directly or indirectly, any shares of Class A Common Stock or any securities convertible into or exercisable or exchangeable for shares of Class A Common Stock, including Class B Common Stock , Class C Common Stock, Class D Common Stock and units of LD Holdings or otherwise publicly announce any intention to engage in or cause any of the foregoing actions or activities; or |
| • | enter into any hedging, swap or other arrangement that transfers or is designed to transfer to another, in whole or in part, any of the economic consequences of ownership of the Class A Common Stock or such other securities whether any such transaction described above is to be settled by delivery of Class A Common Stock or such other securities, in cash or otherwise or otherwise, publicly announce any intention to engage in or cause any of the foregoing transactions or arrangements. In addition, we and each such person agrees that, without the prior written consent of Goldman Sachs & Co. LLC, BofA Securities, Inc., Credit Suisse Securities (USA) LLC and Morgan Stanley & Co. LLC on behalf of the underwriters, we or such other person will not, during the restricted period, make any demand for, or exercise any right with respect to, the registration of any shares of Class A Common Stock or any security convertible into or exercisable or exchangeable for Class A Common Stock. |
225
Table of Contents
The restrictions described in the immediately preceding paragraph do not apply to certain transactions, subject in certain cases to various conditions (such as no filing requirements and the transfer of the lock-up restrictions) by our directors, officers, selling stockholders and other holders of our outstanding stock and stock options, including, but not limited to:
| (a) | the establishment of a trading plan pursuant to Rule 10b5-1 under the Exchange Act for the transfer of Class A Common Stock, provided that such plan does not provide for the transfer of Class A Common Stock during the restricted period; |
| (b) | transfers in connection with the Reorganization Transactions on the terms described under “Organizational Structure—Reorganization Transactions at LD Holdings” and “—Offering Transactions” in this prospectus prior to the completion of this offering; |
| (c) | transfers pursuant to an order of a court or regulatory agency; |
| (d) | the exchange of any units of LD Holdings and a corresponding number of shares of Class B Common Stock or Class C Common Stock, as the case may be, into or for shares of Class A Common Stock pursuant to the limited liability company agreement of LD Holdings (or separate agreement governing such exchange) described in this prospectus; |
| (e) | any exchange of shares of Class D Common Stock for Class A Common Stock; provided that the shares of Class A Common Stock issued in exchange for shares of Class D Common Stock shall continue to be subject to the restrictions set forth herein; or |
| (f) | Class A Common Stock to be sold pursuant to this offering. |
| (g) | transactions relating to securities acquired from the underwriters in this offering (other than any issuer-directed shares of Class A Common Stock purchased by any officer or director of us, or LD Holdings) or acquired in open market transactions after the completion of this offering; |
| (h) | transfers (i) in the case of a corporation or partnership or limited liability company or other business entity, to another corporation, partnership, limited liability company or other business entity that controls, is controlled by or is under common control with the transferor, (ii) in the case of a trust, to a trustor or beneficiary of the trust or (iii) not involving a change in beneficial ownership; |
| (i) | distributions to limited partners, members or stockholders of the security holder; |
| (j) | the receipt from us or LD Holdings upon the vesting of stock awards or the exercise of options or warrants issued pursuant to our or LD Holdings’ equity incentive plans or the transfer to us or LD Holdings upon a vesting event of our or LD Holdings’ securities or upon the exercise of options or warrants to purchase our or LD Holdings’ securities (including settlement of restricted stock units), in each case on a “cashless” or “net exercise” basis or to cover tax withholding obligations of the recipient in connection with such vesting or exercise, insofar as such stock award, option or warrant was outstanding on the date of the underwriting agreement and would, by its terms, expire during the restricted period (except that the requirement of expiration during the restricted period shall not apply to stock awards that by their terms are automatically paid or settled upon vesting); |
| (k) | the transfer to us or LD Holdings, pursuant to agreements under which we or LD Holdings has the option to repurchase such shares or securities or a right of first refusal, as described in this prospectus, with respect to transfers of such shares or securities; |
| (l) | in the case of an individual, the transfer that occurs by operation of law pursuant to a qualified domestic order or in connection with a divorce settlement; |
| (m) | the sale of shares of Class A Common Stock to the underwriters pursuant to the underwriting agreement, and any transfer to us or LD Holdings made on or about the closing date of this offering in consideration for cash from our proceeds from this offering, on the terms described in this prospectus; |
| (n) | any transfer pursuant to a bona fide third-party tender offer, merger, consolidation or other similar transaction made to all holders of the Class A Common Stock or such other securities involving a “change |
226
Table of Contents
| of control” (as defined below) of us following this offering approved by the our board of directors; provided that all of the security holder’s shares of Class A Common Stock or any security convertible into or exercisable or exchangeable for shares of Class A Common Stock subject to the lock-up that are not so transferred, sold, tendered or otherwise disposed of remain subject to the lock-up; and provided further, that in the event that the tender offer, merger, consolidation or other such transaction is not completed, the Class A Common Stock or such other securities owned by the security holder shall remain subject to the terms of this agreement. For purposes of this clause, “change of control” shall mean the consummation of any bona fide third-party tender offer, merger, consolidation or other similar transaction the result of which is that any “person” (as defined in Section 13(d)(3) of the Exchange Act), or group of persons, other than us, becomes the beneficial owner (as defined in Rules 13d-3 and 13d-5 of the Exchange Act) of a majority of the total voting power of the voting stock of ours; |
| (o) | transfers to the security holder’s affiliates or to any investment fund or other entity controlled or managed by the security holder; provided that in the case of any transfer or distribution pursuant to this clause, any such transfer or distribution shall not involve a disposition for value; |
| (p) | transfers from an executive officer to us or LD Holdings upon death, disability or termination of employment of such executive officer; |
| (q) | transfers to a nominee or custodian of a person or entity to whom a disposition or transfer would be permissible under clauses (b), (c) and (i); or |
| (r) | transfers (i) as a bona fide gift, including to charitable organizations, or by will or intestacy or (ii) to an immediate family member or to a trust, or other entity formed for estate planning purposes, formed for the benefit of the security holder or of an immediate family member of the security holder. Goldman Sachs & Co. LLC, BofA Securities, Inc., Credit Suisse Securities (USA) LLC and Morgan Stanley & Co. LLC, in their sole discretion, may release the Class A Common Stock and other securities subject to the lock-up agreements described above in whole or in part at any time. |
In addition, the restrictions in the foregoing do not apply to certain transactions, subject in certain cases to various conditions (such as no filing requirements and the transfer of the lock-up restrictions) solely by us, including, but not limited to:
| (a) | issuances by us or LD Holdings upon the exercise of an option or warrant or the conversion of a security outstanding on the date of this prospectus of which the underwriters have been advised in writing; |
| (b) | issuances by us or LD Holdings of any options and other awards granted under an equity incentive plan described in this prospectus (and issuances by us or LD Holdings upon the exercise thereof under any plan described in this prospectus); |
| (c) | the filing by us of any registration statement on Form S-8 or a successor form thereto relating to the shares of Class A Common Stock or any securities convertible into or exercisable or exchangeable for Class A Common Stock granted pursuant to or reserved for issuance under an equity incentive plan or employee stock purchase plan described in this prospectus; or |
| (d) | issuances in connection with the acquisition of the business, property or other assets of, or a majority or controlling portion of the equity of, or a business combination, a joint venture, commercial relationship or other strategic transactions with, another entity in connection with such transaction by us or any of our subsidiaries, provided that the aggregate number of securities (on an as-converted, as-exercised or as-exchanged basis) issued or issuable pursuant to this clause does not exceed 10% of the number of shares of Class A Common Stock outstanding immediately after the offering of the Class A Common Stock pursuant to this prospectus determined on a fully-diluted basis and assuming that all outstanding Holdco Units in LD Holdings that are exchangeable for shares of Class A Common Stock are so exchanged. |
In order to facilitate the offering of the Class A Common Stock, the underwriters may engage in transactions that stabilize, maintain or otherwise affect the price of the Class A Common Stock. Specifically, the underwriters
227
Table of Contents
may sell more shares than they are obligated to purchase under the underwriting agreement, creating a short position. A short sale is covered if the short position is no greater than the number of shares available for purchase by the underwriters under the option to purchase additional shares. The underwriters can close out a covered short sale by exercising the option to purchase additional shares or purchasing shares in the open market. In determining the source of shares to close out a covered short sale, the underwriters will consider, among other things, the open market price of shares compared to the price available under the option to purchase additional shares. The underwriters may also sell shares in excess of the option to purchase additional shares, creating a naked short position. The underwriters must close out any naked short position by purchasing shares in the open market. A naked short position is more likely to be created if the underwriters are concerned that there may be downward pressure on the price of the Class A Common Stock in the open market after pricing that could adversely affect investors who purchase in this offering. As an additional means of facilitating this offering, the underwriters may bid for, and purchase, shares of Class A Common Stock in the open market to stabilize the price of the Class A Common Stock. These activities may raise or maintain the market price of the Class A Common Stock above independent market levels or prevent or retard a decline in the market price of the Class A Common Stock. The underwriters are not required to engage in these activities and may end any of these activities at any time.
We, the selling stockholders and the several underwriters have agreed to indemnify each other against certain liabilities, including liabilities under the Securities Act.
A prospectus in electronic format may be made available on websites maintained by one or more underwriters, or selling group members, if any, participating in this offering. The representative may agree to allocate a number of shares of Class A Common Stock to underwriters for sale to their online brokerage account holders. Internet distributions will be allocated by the representative to underwriters that may make internet distributions on the same basis as other allocations.
The underwriters and their respective affiliates are full service financial institutions engaged in various activities, which may include securities trading, commercial and investment banking, financial advisory, investment management, investment research, principal investment, hedging, financing and brokerage activities. Certain of the underwriters and their respective affiliates have, from time to time, performed, and may in the future perform, various financial advisory and investment banking services for us, for which they received or will receive customary fees and expenses.
In addition, affiliates of Bank of America, N.A., Credit Suisse, Barclays Bank PLC, Jefferies and UBS Bank USA currently provide us, and together with Goldman Sachs & Co. LLC, Morgan Stanley, Citigroup and Nomura, may provide us in the future, borrowing capacity under loan funding facilities and a mortgage gestation facility. Furthermore, from time to time, Goldman Sachs & Co. LLC, Bank of America, N.A., Credit Suisse, Morgan Stanley, Citigroup, UBS Bank USA, Nomura and Raymond James or their respective affiliates purchase loans from us in the secondary market.
In addition, in the ordinary course of their various business activities, the underwriters and their respective affiliates may make or hold a broad array of investments and actively trade debt and equity securities (or related derivative securities), currencies, credit default swaps and other financial instruments (including bank loans) for their own account and for the accounts of their customers and may at any time hold long and short positions in such securities and instruments. Such investment and securities activities may involve our securities and instruments. The underwriters and their respective affiliates may also make investment recommendations or publish or express independent research views in respect of such securities or instruments and may at any time hold, or recommend to clients that they acquire, long or short positions in such securities and instruments.
Pursuant to an engagement letter agreement, we retained FTP Securities LLC (“FT Partners”), a FINRA member, to provide certain financial advisory services in connection with this offering. We agreed to pay FT Partners, simultaneously with or prior to the consummation of this offering, a fee equal to 1% of the gross
228
Table of Contents
proceeds of this offering. If the proceeds of this offering are less than $200 million, in the event within 36 months of this offering we complete one or more follow-on offerings, we agreed to pay FT Partners a fee of 1% of such follow-on offering proceeds until the fees for this offering and such follow-on offerings equal $2 million in total. We also agreed to reimburse FT Partners for reasonable and documented travel and other out-of-pocket expenses up to a maximum of $100,000 and have provided indemnification of FT Partners pursuant to the engagement agreement. FT Partners is not acting as an underwriter and has no contact with any public or institutional investor on behalf of us or the underwriters. In addition, FT Partners will not underwrite or purchase any of our common shares in this offering or otherwise participate in any such undertaking.
Pricing of the Offering
Prior to this offering, there has been no public market for our Class A Common Stock. The initial public offering price was determined by negotiations between the selling stockholders and the representatives. Among the factors considered in determining the initial public offering price were our future prospects and those of our industry in general, our sales, earnings and certain other financial and operating information in recent periods, and the price-earnings ratios, price-sales ratios, market prices of securities, and certain financial and operating information of companies engaged in activities similar to ours.
Reserved Share Program
At our request, an affiliate of BofA Securities, Inc., a participating underwriter, has reserved for sale, at the initial public offering price, up to 5% of the Class A common stock offered by this prospectus for sale to certain of our directors, officers and employees through a reserved share program, or Reserved Share Program. If these persons purchase reserved shares of Class A common stock, it will reduce the number of shares of Class A common stock available for sale to the general public. Any reserved shares of Class A common stock that are not so purchased will be offered by the underwriters to the general public on the same terms as the other shares of Class A common stock offered by this prospectus. Any shares sold in the Reserved Share Program to a party who has entered into a lock-up agreement shall be subject to the provisions of such lock-up agreement.
Selling Restrictions
Canada
(A) Resale Restrictions
The distribution of shares in Canada is being made only in the provinces of Ontario, Quebec, Alberta and British Columbia on a private placement basis exempt from the requirement that we prepare and file a prospectus with the securities regulatory authorities in each province where trades of these securities are made. Any resale of the shares in Canada must be made under applicable securities laws which may vary depending on the relevant jurisdiction, and which may require resales to be made under available statutory exemptions or under a discretionary exemption granted by the applicable Canadian securities regulatory authority. Purchasers are advised to seek legal advice prior to any resale of the securities.
(B) Representations of Canadian Purchasers
By purchasing shares in Canada and accepting delivery of a purchase confirmation, a purchaser is representing to us and the dealer from whom the purchase confirmation is received that:
| • | the purchaser is entitled under applicable provincial securities laws to purchase the shares without the benefit of a prospectus qualified under those securities laws as it is an “accredited investor” as defined under National Instrument 45-106—Prospectus Exemptions, |
| • | the purchaser is a “permitted client” as defined in National Instrument 31-103—Registration Requirements, Exemptions and Ongoing Registrant Obligations, |
229
Table of Contents
| • | where required by law, the purchaser is purchasing as principal and not as agent, and |
| • | the purchaser has reviewed the text above under Resale Restrictions. |
(C) Conflicts of Interest
Canadian purchasers are hereby notified that the underwriters are relying on the exemption set out in section 3A.3 or 3A.4, if applicable, of National Instrument 33-105—Underwriting Conflicts from having to provide certain conflict of interest disclosure in this document.
(D) Statutory Rights of Action
Securities legislation in certain provinces or territories of Canada may provide a purchaser with remedies for rescission or damages if the prospectus (including any amendment thereto) such as this document contains a misrepresentation, provided that the remedies for rescission or damages are exercised by the purchaser within the time limit prescribed by the securities legislation of the purchaser’s province or territory. The purchaser of these securities in Canada should refer to any applicable provisions of the securities legislation of the purchaser’s province or territory for particulars of these rights or consult with a legal advisor.
(E) Enforcement of Legal Rights
All of our directors and officers as well as the experts named herein may be located outside of Canada and, as a result, it may not be possible for Canadian purchasers to effect service of process within Canada upon us or those persons. All or a substantial portion of our assets and the assets of those persons may be located outside of Canada and, as a result, it may not be possible to satisfy a judgment against us or those persons in Canada or to enforce a judgment obtained in Canadian courts against us or those persons outside of Canada.
(F) Taxation and Eligibility for Investment
Canadian purchasers of shares should consult their own legal and tax advisors with respect to the tax consequences of an investment in the shares in their particular circumstances and about the eligibility of the shares for investment by the purchaser under relevant Canadian legislation.
European Economic Area
In relation to each Member State of the European Economic Area (each a “Relevant State”), no shares have been offered or will be offered pursuant to the offering to the public in that Relevant State prior to the publication of a prospectus in relation to the shares which has been approved by the competent authority in that Relevant State or, where appropriate, approved in another Relevant State and notified to the competent authority in that Relevant State, all in accordance with the Prospectus Regulation, except that offers of shares may be made to the public in that Relevant State at any time under the following exemptions under the Prospectus Regulation:
| a) | to any legal entity which is a qualified investor as defined under Article 2 of the Prospectus Regulation; |
| b) | to fewer than 150 natural or legal persons (other than qualified investors as defined under Article 2 of the Prospectus Regulation), subject to obtaining the prior consent of the Representatives for any such offer; or |
| c) | in any other circumstances falling within Article 1(4) of the Prospectus Regulation, |
provided that no such offer of shares shall require us or any underwriter to publish a prospectus pursuant to Article 3 of the Prospectus Regulation or supplement a prospectus pursuant to Article 23 of the Prospectus Regulation and each person who initially acquires any shares or to whom any offer is made will be deemed to have represented, acknowledged and agreed to and with each of the underwriters and us that it is a “qualified
230
Table of Contents
investor” within the meaning of Article 2(e) of the Prospectus Regulation. In the case of any shares being offered to a financial intermediary as that term is used in the Prospectus Regulation, each such financial intermediary will be deemed to have represented, acknowledged and agreed that the shares acquired by it in the offer have not been acquired on a non-discretionary basis on behalf of, nor have they been acquired with a view to their offer or resale to, persons in circumstances which may give rise to an offer of any shares to the public other than their offer or resale in a Relevant State to qualified investors as so defined or in circumstances in which the prior consent of the underwriters has been obtained to each such proposed offer or resale. For the purposes of this provision, the expression an “offer to the public” in relation to the shares in any Relevant State means the communication in any form and by any means of sufficient information on the terms of the offer and any shares to be offered so as to enable an investor to decide to purchase or subscribe for any shares, and the expression “Prospectus Regulation” means Regulation (EU) 2017/1129.
United Kingdom
No shares have been offered or will be offered pursuant to the offering to the public in the United Kingdom prior to the publication of a prospectus in relation to the shares which has been approved by the Financial Conduct Authority, except that the shares may be offered to the public in the United Kingdom at any time:
| (a) | to any legal entity which is a qualified investor as defined under Article 2 of the U.K. Prospectus Regulation; |
| (b) | to fewer than 150 natural or legal persons (other than qualified investors as defined under Article 2 of the U.K. Prospectus Regulation), subject to obtaining the prior consent of the Representatives for any such offer; or |
| (c) | in any other circumstances falling within Section 86 of the FSMA. |
provided that no such offer of the shares shall require us or any underwriter to publish a prospectus pursuant to Section 85 of the FSMA or supplement a prospectus pursuant to Article 23 of the U.K. Prospectus Regulation. For the purposes of this provision, the expression an “offer to the public” in relation to the shares in the United Kingdom means the communication in any form and by any means of sufficient information on the terms of the offer and any shares to be offered so as to enable an investor to decide to purchase or subscribe for any shares and the expression “U.K. Prospectus Regulation” means Regulation (EU) 2017/1129 as it forms part of domestic law by virtue of the European Union (Withdrawal) Act 2018. In addition, in the United Kingdom, this document is being distributed only to, and is directed only at, and any offer subsequently made may only be directed at persons who are “qualified investors” (as defined in the U.K. Prospectus Regulation) (i) who have professional experience in matters relating to investments falling within Article 19(5) of the Financial Services and Markets Act 2000 (Financial Promotion) Order 2005, as amended, or the “Order,” and/or (ii) who are high net worth companies (or persons to whom it may otherwise be lawfully communicated) falling within Article 49(2)(a) to (e) of the Order (all such persons together being referred to as “relevant persons”) or otherwise in circumstances which have not resulted and will not result in an offer to the public of the shares in the United Kingdom within the meaning of the Financial Services and Markets Act 2000. In the United Kingdom, any investment or investment activity to which this document relates is only available to, and will be engaged in with, relevant persons. Any person in the UK who is not a relevant person must not act on or rely upon this document or any of its contents.
Japan
The securities have not been and will not be registered under the Financial Instruments and Exchange Law of Japan (Law No. 25 of 1948, as amended) and, accordingly, will not be offered or sold, directly or indirectly, in Japan, or for the benefit of any Japanese Person or to others for re-offering or resale, directly or indirectly, in Japan or to any Japanese Person, except in compliance with all applicable laws, regulations and ministerial guidelines promulgated by relevant Japanese governmental or regulatory authorities in effect at the relevant time. For the purposes of this paragraph, “Japanese Person” shall mean any person resident in Japan, including any corporation or other entity organized under the laws of Japan.
231
Table of Contents
Switzerland
This document is not intended to constitute an offer or solicitation to purchase or invest in the shares described herein. The shares may not be publicly offered, directly or indirectly, in Switzerland within the meaning of the Swiss Financial Services Act (“FinSA”) and will not be listed or admitted to trading on the SIX Swiss Exchange or on any trading venue (exchange or multilateral trading facility) in Switzerland. Neither this document nor any other offering or marketing material relating to the shares constitutes a prospectus as such term is understood pursuant to the FinSA, and neither this document nor any other offering or marketing material relating to the shares may be publicly distributed or otherwise made publicly available in Switzerland.
Dubai International Financial Centre
This prospectus relates to an Exempt Offer in accordance with the Offered Securities Rules of the Dubai Financial Services Authority (“DFSA”). This prospectus is intended for distribution only to persons of a type specified in the Offered Securities Rules of the DFSA. It must not be delivered to, or relied on by, any other person. The DFSA has no responsibility for reviewing or verifying any documents in connection with Exempt Offers. The DFSA has not approved this prospectus nor taken steps to verify the information set forth herein and has no responsibility for the prospectus. The shares to which this prospectus relates may be illiquid and/or subject to restrictions on their resale. Prospective purchasers of the shares offered should conduct their own due diligence on the shares. If you do not understand the contents of this prospectus you should consult an authorized financial advisor.
Australia
No placement document, prospectus, product disclosure statement or other disclosure document has been lodged with the Australian Securities and Investments Commission (“ASIC”), in relation to the offering. This prospectus does not constitute a prospectus, product disclosure statement or other disclosure document under the Corporations Act 2001 (the “Corporations Act”), and does not purport to include the information required for a prospectus, product disclosure statement or other disclosure document under the Corporations Act.
Any offer in Australia of the shares may only be made to persons (the “Exempt Investors”) who are “sophisticated investors” (within the meaning of section 708(8) of the Corporations Act), “professional investors” (within the meaning of section 708(11) of the Corporations Act) or otherwise pursuant to one or more exemptions contained in section 708 of the Corporations Act so that it is lawful to offer the shares without disclosure to investors under Chapter 6D of the Corporations Act.
The shares applied for by Exempt Investors in Australia must not be offered for sale in Australia in the period of 12 months after the date of allotment under the offering, except in circumstances where disclosure to investors under Chapter 6D of the Corporations Act would not be required pursuant to an exemption under section 708 of the Corporations Act or otherwise or where the offer is pursuant to a disclosure document which complies with Chapter 6D of the Corporations Act. Any person acquiring shares must observe such Australian on-sale restrictions.
This prospectus contains general information only and does not take account of the investment objectives, financial situation or particular needs of any particular person. It does not contain any securities recommendations or financial product advice. Before making an investment decision, investors need to consider whether the information in this prospectus is appropriate to their needs, objectives and circumstances, and, if necessary, seek expert advice on those matters.
Hong Kong
The shares may not be offered or sold in Hong Kong by means of any document other than (i) in circumstances which do not constitute an offer to the public within the meaning of the Companies Ordinance
232
Table of Contents
(Cap. 32, Laws of Hong Kong), or (ii) to “professional investors” within the meaning of the Securities and Futures Ordinance (Cap. 571, Laws of Hong Kong) and any rules made thereunder, or (iii) in other circumstances which do not result in the document being a “prospectus” within the meaning of the Companies Ordinance (Cap. 32, Laws of Hong Kong) and no advertisement, invitation or document relating to the shares may be issued or may be in the possession of any person for the purpose of issue (in each case whether in Hong Kong or elsewhere), which is directed at, or the contents of which are likely to be accessed or read by, the public in Hong Kong (except if permitted to do so under the laws of Hong Kong) other than with respect to shares which are or are intended to be disposed of only to persons outside Hong Kong or only to “professional investors” within the meaning of the Securities and Futures Ordinance (Cap. 571, Laws of Hong Kong) and any rules made thereunder.
Singapore
This prospectus has not been registered as a prospectus with the Monetary Authority of Singapore. Accordingly, this prospectus and any other document or material in connection with the offer or sale, or invitation for subscription or purchase, of the shares may not be circulated or distributed, nor may the shares be offered or sold, or be made the subject of an invitation for subscription or purchase, whether directly or indirectly, to persons in Singapore other than (i) to an institutional investor under Section 274 of the Securities and Futures Act, Chapter 289 of Singapore (the “SFA”), (ii) to a relevant person pursuant to Section 275(1), or any person pursuant to Section 275(1A), and in accordance with the conditions specified in Section 275 of the SFA or (iii) otherwise pursuant to, and in accordance with the conditions of, any other applicable provision of the SFA, in each case subject to compliance with conditions set forth in the SFA.
Where the shares are subscribed or purchased under Section 275 of the SFA by a relevant person which is:
| • | shares, debentures and shares of shares and debentures of that corporation or the beneficiaries’ rights and interest (howsoever described) in that trust shall not be transferred within six months after that corporation or that trust has acquired the shares pursuant to an offer made under Section 275 of the SFA except: |
| • | to an institutional investor (for corporations, under Section 274 of the SFA) or to a relevant person defined in Section 275(2) of the SFA, or to any person pursuant to an offer that is made on terms that such shares, debentures and shares of shares and debentures of that corporation or such rights and interest in that trust are acquired at a consideration of not less than S$200,000 (or its equivalent in a foreign currency) for each transaction, whether such amount is to be paid for in cash or by exchange of securities or other assets, and further for corporations, in accordance with the conditions specified in Section 275 of the SFA; |
| • | where no consideration is or will be given for the transfer; or where the transfer is by operation of law. |
233
Table of Contents
Certain legal matters in connection with the offering, including the validity of the shares of Class A Common Stock offered hereby, will be passed upon for us by Kirkland & Ellis LLP, New York, New York. The underwriters are represented by Davis Polk & Wardwell LLP, New York, New York.
The financial statement of loanDepot, Inc. at November 6, 2020, included in this Prospectus and Registration Statement has been audited by Ernst & Young LLP, independent registered public accounting firm, as set forth in their report thereon appearing elsewhere herein, and is included in reliance upon such report given on the authority of such firm as experts in accounting and auditing.
The consolidated financial statements of LD Holdings Group, LLC and Subsidiaries at December 31, 2019 and 2018, and for each of the three years in the period ended December 31, 2019, included in this Prospectus and Registration Statement have been audited by Ernst & Young LLP, independent registered public accounting firm, as set forth in their report thereon appearing elsewhere herein, and are included in reliance upon such report given on the authority of such firm as experts in accounting and auditing.
234
Table of Contents
WHERE YOU CAN FIND MORE INFORMATION
We have filed with the SEC a registration statement on Form S-1 under the Securities Act with respect to the shares of Class A Common Stock offered by this prospectus. This prospectus, which constitutes a part of the registration statement, does not contain all of the information set forth in the registration statement, some of which is contained in exhibits to the registration statement as permitted by the rules and regulations of the SEC. For further information with respect to us and our Class A Common Stock, we refer you to the registration statement, including the exhibits filed as a part of the registration statement. Statements contained in this prospectus concerning the contents of any contract or any other document are not necessarily complete. If a contract or document has been filed as an exhibit to the registration statement, please see the copy of the contract or document that has been filed. Each statement in this prospectus relating to a contract or document filed as an exhibit is qualified in all respects by the filed exhibit. The SEC maintains an Internet website that contains reports, proxy statements and other information about issuers, like us, that file electronically with the SEC. The address of that website is www.sec.gov.
As a result of this offering, we will become subject to the information and reporting requirements of the Exchange Act and, in accordance with this law, will file periodic reports, proxy statements and other information with the SEC. We also maintain a website at www.loandepot.com. Upon completion of this offering, you may access these materials free of charge as soon as reasonably practicable after they are electronically filed with, or furnished to, the SEC. Information contained on our website is not a part of this prospectus and the inclusion of our website address in this prospectus is an inactive textual reference only.
235
Table of Contents
INDEX TO CONSOLIDATED FINANCIAL STATEMENTS
| Audited Financial Statement of loanDepot, Inc. |
||||
| F-2 | ||||
| F-3 | ||||
| F-4 | ||||
| Unaudited Consolidated Financial Statements of LD Holdings Group LLC and subsidiaries |
||||
| Consolidated Balance Sheets as of September 30, 2020 and December 31, 2019 |
F-5 | |||
| Consolidated Statements of Operations for the nine months ended September 30, 2020 and 2019 |
F-7 | |||
| Consolidated Statements of Unitholders’ Equity for the nine months ended September 30, 2020 and 2019 |
F-8 | |||
| Consolidated Statements of Cash Flows for the nine months ended September 30, 2020 and 2019 |
F-9 | |||
| F-11 | ||||
| Audited Consolidated Financial Statements of LD Holdings Group LLC and subsidiaries |
||||
| F-51 | ||||
| Consolidated Balance Sheets as of December 31, 2019 and 2018 |
F-52 | |||
| Consolidated Statements of Operations for the years ended December 31, 2019, 2018 and 2017 |
F-54 | |||
| F-55 | ||||
| Consolidated Statements of Cash Flows for the years ended December 31, 2019, 2018 and 2017 |
F-56 | |||
| F-58 | ||||
F-1
Table of Contents
Report of Independent Registered Public Accounting Firm
The Board of Directors and Shareholder of loanDepot, Inc.
We have audited the accompanying balance sheet of loanDepot, Inc. (the “Company”) as of November 6, 2020. This balance sheet is the responsibility of the Company’s management. Our responsibility is to express an opinion on this balance sheet based on our audit.
We conducted our audit in accordance with the standards of the Public Company Accounting Oversight Board (United States). Those standards require that we plan and perform the audit to obtain reasonable assurance about whether the balance sheet is free of material misstatement. An audit also includes examining, on a test basis, evidence supporting the amounts and disclosures in the balance sheet, assessing the accounting principles used and significant estimates made by management, and evaluating the overall presentation of the balance sheet. We believe that our audit provides a reasonable basis for our opinion.
In our opinion, the balance sheet referred to above presents fairly, in all material respects, the financial position of loanDepot, Inc. at November 6, 2020, in conformity with U.S. generally accepted accounting principles.
/s/ Ernst & Young LLP
We have served as the Company’s auditor since 2020.
Los Angeles, California
November 9, 2020
F-2
Table of Contents
loanDepot, Inc.
| November 6, 2020 |
||||
| Assets: |
||||
| Current assets: |
||||
| Cash and cash equivalents |
$ | 10 | ||
|
|
|
|||
| Total assets |
$ | 10 | ||
|
|
|
|||
| Commitments and contingencies |
||||
| Stockholders’ equity: |
||||
| Common stock, $0.01 par value, 1,000 shares authorized, issued and outstanding |
$ | 10 | ||
|
|
|
|||
| Total stockholder’s equity |
$ | 10 | ||
|
|
|
|||
See accompanying notes to balance sheet.
F-3
Table of Contents
loanDepot, Inc.
NOTE 1 - ORGANIZATION AND BACKGROUND
loanDepot, Inc. (“we” or “our”) was incorporated in Delaware on November 6, 2020. Pursuant to a reorganization into a holding company structure, we will be a holding company and our principal asset will be a
controlling equity interest in loanDepot Holdings LLC (“LD Holdings”), which holds all of the equity interest in loanDepot.com, LLC (“LDLLC”). Through our ability to appoint the board of managers of LD Holdings, we will operate and control all of the business and affairs of LD Holdings, and through LD Holdings and its subsidiaries, conduct our business.
Basis of Presentation
The balance sheet has been prepared in accordance with U.S. generally accepted accounting principles.
Statements of income, stockholders’ equity and cash flows have not been presented because we have not engaged in any business or other activities except in connection with our formation.
NOTE 2 - SUMMARY OF SIGNIFICANT ACCOUNTING POLICIES
Cash and Cash Equivalents
Cash and cash equivalents includes cash on hand and other highly liquid investments purchased with a
remaining maturity of 90 days or less at the date of acquisition. Cash and cash equivalents are carried at fair value, which approximates carrying value.
Income Taxes
We are treated as a subchapter C corporation, and therefore, are subject to both federal and state income taxes. LD Holdings and LDLLC continue to be recognized as a limited liability company, a pass-through entity for income tax purposes.
NOTE 3 - STOCKHOLDERS’ EQUITY
On November 6, 2020, we were authorized to issue 1,000 shares of common stock, $0.01 par value. On November 6, 2020, we issued 1,000 shares for $10.00, all of which are owned by LD Holdings.
NOTE 4 - SUBSEQUENT EVENTS
We have evaluated subsequent events through November 9, 2020, the date on which our audited balance sheet was available to be issued.
F-4
Table of Contents
LD Holdings Group LLC and Subsidiaries
(Dollars in thousands)
| September 30, 2020 |
December 31, 2019 |
|||||||
| (Unaudited) | ||||||||
| ASSETS |
||||||||
| Cash and cash equivalents |
$ | 637,511 | $ | 73,301 | ||||
| Restricted cash |
70,387 | 44,195 | ||||||
| Accounts receivable, net |
118,400 | 121,046 | ||||||
| Loans held for sale, at fair value (includes $791,522 and $807,599 pledged to creditors in securitization trusts at September 30, 2020 and December 31, 2019, respectively) |
4,888,364 | 3,681,840 | ||||||
| Derivative assets, at fair value |
722,149 | 131,228 | ||||||
| Servicing rights, at fair value (includes $286,133 and $281,255 pledged to creditors in securitization trusts at September 30, 2020 and December 31, 2019, respectively) |
780,451 | 447,478 | ||||||
| Property and equipment, net |
76,250 | 80,897 | ||||||
| Operating lease right-of-use assets |
56,449 | 61,693 | ||||||
| Prepaid expenses and other assets |
57,610 | 52,653 | ||||||
| Loans eligible for repurchase |
1,184,015 | 197,812 | ||||||
| Investments in joint ventures |
16,773 | 17,030 | ||||||
| Goodwill and intangible assets, net |
42,954 | 43,338 | ||||||
|
|
|
|
|
|||||
| Total assets |
$ | 8,651,313 | $ | 4,952,511 | ||||
|
|
|
|
|
|||||
| LIABILITIES, REDEEMABLE UNITS AND UNITHOLDERS’ EQUITY |
||||||||
| Warehouse and other lines of credit |
$ | 4,601,062 | $ | 3,466,567 | ||||
| Accounts payable, accrued expenses and other liabilities |
375,957 | 196,102 | ||||||
| Derivative liabilities, at fair value |
59,432 | 9,977 | ||||||
| Liability for loans eligible for repurchase |
1,184,015 | 197,812 | ||||||
| Operating lease liability |
72,590 | 80,257 | ||||||
| Financing lease obligations |
18,258 | 33,816 | ||||||
| Debt obligations, net |
706,478 | 592,095 | ||||||
|
|
|
|
|
|||||
| Total liabilities |
7,017,792 | 4,576,626 | ||||||
| Commitments and contingencies (Note 15) |
||||||||
See accompanying notes to the unaudited consolidated financial statements
F-5
Table of Contents
LD Holdings Group LLC and Subsidiaries
CONSOLIDATED BALANCE SHEETS – CONTINUED
(Dollars in thousands)
| September 30, 2020 |
December 31, 2019 |
|||||||
| (Unaudited) | ||||||||
| Redeemable units: |
||||||||
| Class I Units (par value zero and $18.7 million; zero and 1,190,093 units authorized and issued/outstanding at September 30, 2020 and December 31, 2019, respectively) |
$ | — | $ | 34,280 | ||||
| Class A Units (par value $26.9 million; 269,000 units authorized and issued/outstanding at September 30, 2020 and December 31, 2019, respectively) |
26,900 | 26,900 | ||||||
| Class B Units (par value $5.0 million; 50,000 units authorized and issued/outstanding at September 30, 2020 and December 31, 2019, respectively) |
5,000 | 5,000 | ||||||
| Class P Units (par value $12.5 million; 12,500 units authorized and issued/outstanding at September 30, 2020 and December 31, 2019, respectively) |
12,500 | 12,500 | ||||||
| Class P-2 Units (par value $20.0 million; 19,800 units authorized and issued/outstanding at September 30, 2020 and December 31, 2019, respectively) |
19,800 | 19,800 | ||||||
| Class P-3 Units (par value $40.0 million; 40,000 units authorized and issued/outstanding at September 30, 2020 and December 31, 2019, respectively) |
40,000 | 40,000 | ||||||
| Class Z-1 Units (no par value; 44,502 units authorized and issued/outstanding at September 30, 2020 and December 31, 2019, respectively) |
— | — | ||||||
|
|
|
|
|
|||||
| Total redeemable units |
104,200 | 138,480 | ||||||
| Unitholders’ equity: |
||||||||
| Class Z-2 Units (no par value; 83,189 units authorized and issued/outstanding at September 30, 2020 and December 31, 2019, respectively) |
— | — | ||||||
| Class Z-3 Units (no par value; 133,789 units authorized and issued/outstanding at September 30, 20200 and December 31, 2019, respectively) |
— | — | ||||||
| Class Z-4 Units (no par value; 268,239 units authorized and issued/outstanding at September 30, 2020 and December 31, 2019, respectively) |
— | — | ||||||
| Class Y Units (no par value; 14,567 units authorized and issued/outstanding at September 30, 2020 and December 31, 2019, respectively) |
— | — | ||||||
| Class W Units (no par value; 10,000 units authorized and issued/outstanding at September 30, 2020 and December 31, 2019, respectively) |
— | — | ||||||
| Class X Units (no par value; 3,961,976,096 and 2,785,758,179 units authorized and issued/outstanding at September 30, 2020 and December 31, 2019, respectively) |
— | — | ||||||
| Class V Units (no par value; 88,841,961 and 337,942,529 units authorized and issued/outstanding at September 30, 2020 and December 31, 2019, respectively) |
— | — | ||||||
| Additional paid-in capital |
25,664 | 18,021 | ||||||
| Retained earnings |
1,503,657 | 219,384 | ||||||
|
|
|
|
|
|||||
| Total unitholders’ equity |
1,529,321 | 237,405 | ||||||
|
|
|
|
|
|||||
| Total liabilities, redeemable units and unitholders’ equity |
$ | 8,651,313 | $ | 4,952,511 | ||||
|
|
|
|
|
|||||
See accompanying notes to the unaudited consolidated financial statements
F-6
Table of Contents
LD Holdings Group LLC and Subsidiaries
CONSOLIDATED STATEMENTS OF OPERATIONS
(Dollars in thousands)
(Unaudited)
| Nine Months Ended September 30, |
||||||||
| 2020 | 2019 | |||||||
| REVENUES: |
||||||||
| Interest income |
$ | 98,149 | $ | 86,493 | ||||
| Interest expense |
(88,881 | ) | (89,550 | ) | ||||
|
|
|
|
|
|||||
| Net interest income (expense) |
9,268 | (3,057 | ) | |||||
| Gain on origination and sale of loans, net |
2,873,455 | 788,054 | ||||||
| Origination income, net |
167,554 | 107,850 | ||||||
| Servicing fee income |
121,520 | 85,022 | ||||||
| Change in fair value of servicing rights, net |
(216,132 | ) | (100,051 | ) | ||||
| Other income |
58,115 | 44,022 | ||||||
|
|
|
|
|
|||||
| Total net revenues |
3,013,780 | 921,840 | ||||||
| EXPENSES: |
||||||||
| Personnel expense |
1,022,734 | 525,948 | ||||||
| Marketing and advertising expense |
173,628 | 133,799 | ||||||
| Direct origination expense |
88,627 | 61,786 | ||||||
| General and administrative expense |
120,565 | 67,708 | ||||||
| Occupancy expense |
29,437 | 27,691 | ||||||
| Depreciation and amortization |
27,122 | 27,285 | ||||||
| Subservicing expense |
52,154 | 28,736 | ||||||
| Other interest expense |
32,117 | 30,392 | ||||||
|
|
|
|
|
|||||
| Total expenses |
1,546,384 | 903,345 | ||||||
|
|
|
|
|
|||||
| Income before income taxes |
1,467,396 | 18,495 | ||||||
| Income taxes |
1,457 | 288 | ||||||
|
|
|
|
|
|||||
| Net income |
$ | 1,465,939 | $ | 18,207 | ||||
|
|
|
|
|
|||||
See accompanying notes to the unaudited consolidated financial statements
F-7
Table of Contents
LD Holdings Group LLC and Subsidiaries
CONSOLIDATED STATEMENTS OF UNITHOLDERS’ EQUITY
(Dollars in thousands)
(Unaudited)
| Class Z-2 | Class Z-3 | Class Z-4 | Class Y | Class W | Class X | Class V | Additional paid-in capital |
Retained Earnings |
Total Equity |
|||||||||||||||||||||||||||||||||||||||||||||||||||||||||||
| Shares | Amount | Shares | Amount | Shares | Amount | Shares | Amount | Shares | Amount | Shares | Amount | Shares | Amount | |||||||||||||||||||||||||||||||||||||||||||||||||||||||
| Nine Months Ended September 30, 2019: |
||||||||||||||||||||||||||||||||||||||||||||||||||||||||||||||||||||
| Balance at December 31, 2018 |
83 | $ | — | 134 | $ | — | 268 | $ | — | 15 | $ | — | 10 | $ | — | 2,791,898 | $ | — | 421,493 | $ | — | $ | 17,830 | $ | 192,581 | $ | 210,411 | |||||||||||||||||||||||||||||||||||||||||
| Repurchase |
— | $ | — | — | $ | — | — | $ | — | — | $ | — | — | $ | — | — | $ | — | — | $ | — | $ | — | $ | (5 | ) | $ | (5 | ) | |||||||||||||||||||||||||||||||||||||||
| Equity-based compensation |
— | — | — | — | — | — | — | — | — | — | — | — | — | — | 238 | — | 238 | |||||||||||||||||||||||||||||||||||||||||||||||||||
| Dividends |
— | — | — | — | — | — | — | — | — | — | — | — | — | — | — | (6,128 | ) | (6,128 | ) | |||||||||||||||||||||||||||||||||||||||||||||||||
| Net income |
— | — | — | — | — | — | — | — | — | — | — | — | — | — | — | 18,207 | 18,207 | |||||||||||||||||||||||||||||||||||||||||||||||||||
|
|
|
|
|
|
|
|
|
|
|
|
|
|
|
|
|
|
|
|
|
|
|
|
|
|
|
|
|
|
|
|
|
|
|
|||||||||||||||||||||||||||||||||||
| Balance at September 30, 2019 |
83 | $ | — | 134 | $ | — | 268 | $ | — | 15 | $ | — | 10 | $ | — | 2,791,898 | $ | — | 421,493 | $ | — | $ | 18,068 | $ | 204,655 | $ | 222,723 | |||||||||||||||||||||||||||||||||||||||||
|
|
|
|
|
|
|
|
|
|
|
|
|
|
|
|
|
|
|
|
|
|
|
|
|
|
|
|
|
|
|
|
|
|
|
|||||||||||||||||||||||||||||||||||
| Nine Months Ended September 30, 2020: |
||||||||||||||||||||||||||||||||||||||||||||||||||||||||||||||||||||
| Balance at December 31, 2019 |
83 | $ | — | 134 | $ | — | 268 | $ | — | 15 | $ | — | 10 | $ | — | 2,785,758 | $ | — | 337,943 | $ | — | $ | 18,021 | $ | 219,384 | $ | 237,405 | |||||||||||||||||||||||||||||||||||||||||
| Redemptions |
— | — | — | — | — | — | — | — | — | — | — | — | — | — | — | (31,028 | ) | (31,028 | ) | |||||||||||||||||||||||||||||||||||||||||||||||||
| Repurchase |
— | — | — | — | — | — | — | — | — | — | — | — | — | — | — | (220 | ) | (220 | ) | |||||||||||||||||||||||||||||||||||||||||||||||||
| Forfeitures |
— | — | — | — | — | — | — | — | — | — | (29,811 | ) | — | (30,002 | ) | — | — | — | — | |||||||||||||||||||||||||||||||||||||||||||||||||
| Equity-based compensation |
— | — | — | — | — | — | — | — | — | — | 1,206,029 | — | (219,099 | ) | — | 7,643 | — | 7,643 | ||||||||||||||||||||||||||||||||||||||||||||||||||
| Dividends |
— | — | — | — | — | — | — | — | — | — | — | — | — | — | — | (150,418 | ) | (150,418 | ) | |||||||||||||||||||||||||||||||||||||||||||||||||
| Net income |
— | — | — | — | — | — | — | — | — | — | — | — | — | — | — | 1,465,939 | 1,465,939 | |||||||||||||||||||||||||||||||||||||||||||||||||||
|
|
|
|
|
|
|
|
|
|
|
|
|
|
|
|
|
|
|
|
|
|
|
|
|
|
|
|
|
|
|
|
|
|
|
|||||||||||||||||||||||||||||||||||
| Balance at September 30, 2020 |
83 | $ | — | 134 | $ | — | 268 | $ | — | 15 | $ | — | 10 | $ | — | 3,961,976 | $ | — | 88,842 | $ | — | $ | 25,664 | $ | 1,503,657 | $ | 1,529,321 | |||||||||||||||||||||||||||||||||||||||||
|
|
|
|
|
|
|
|
|
|
|
|
|
|
|
|
|
|
|
|
|
|
|
|
|
|
|
|
|
|
|
|
|
|
|
|||||||||||||||||||||||||||||||||||
See accompanying notes to the unaudited consolidated financial statements
F-8
Table of Contents
LD Holdings Group LLC and Subsidiaries
CONSOLIDATED STATEMENTS OF CASH FLOWS
(Dollars in thousands)
(Unaudited)
| Nine Months Ended September 30, |
||||||||
| 2020 | 2019 | |||||||
| CASH FLOWS FROM OPERATING ACTIVITIES |
||||||||
| Net income |
$ | 1,465,939 | $ | 18,207 | ||||
| Adjustments to reconcile net income to net |
||||||||
| Depreciation and amortization expense |
27,122 | 27,285 | ||||||
| Amortization of debt issuance costs |
4,765 | 4,177 | ||||||
| Amortization of operating lease right-of-use assets |
19,215 | 15,432 | ||||||
| Gain on origination and sale of loans |
(2,256,438 | ) | (668,176 | ) | ||||
| Loss (gain) on sale of servicing rights |
3,074 | (2,767 | ) | |||||
| Increase in trading securities |
— | (6,406 | ) | |||||
| Fair value change in trading securities |
— | (426 | ) | |||||
| Provision for loss obligation on sold loans and servicing rights |
10,446 | 12,670 | ||||||
| Fair value change in derivative assets |
(587,935 | ) | (119,549 | ) | ||||
| Fair value change in derivative liabilities |
49,455 | (27,112 | ) | |||||
| Premium (paid) received on derivatives |
(2,986 | ) | 28,389 | |||||
| Fair value change in loans held for sale |
(114,173 | ) | (3,621 | ) | ||||
| Fair value change in servicing rights |
232,598 | 119,585 | ||||||
| Equity compensation |
7,643 | 238 | ||||||
| Change in fair value of contingent consideration |
32,650 | 189 | ||||||
| Originations of loans |
(63,183,309 | ) | (29,008,960 | ) | ||||
| Proceeds from sales of loans |
63,874,371 | 28,697,767 | ||||||
| Proceeds from principal payments |
43,307 | 85,285 | ||||||
| Payments to investors for loan repurchases |
(150,274 | ) | (109,340 | ) | ||||
| Disbursements from joint ventures |
6,633 | 9,119 | ||||||
| Changes in operating assets and liabilities: |
||||||||
| Other changes in operating assets and liabilities |
99,754 | (15,325 | ) | |||||
|
|
|
|
|
|||||
| Net cash used in operating activities |
(418,143 | ) | (943,339 | ) | ||||
|
|
|
|
|
|||||
| CASH FLOWS FROM INVESTING ACTIVITIES |
||||||||
| Purchase of property and equipment |
(19,625 | ) | (9,856 | ) | ||||
| Proceeds from sale of servicing rights |
6,023 | 161,932 | ||||||
| Return of capital from joint ventures |
300 | — | ||||||
|
|
|
|
|
|||||
| Net cash flows (used in) provided by investing activities |
(13,302 | ) | 152,076 | |||||
|
|
|
|
|
|||||
See accompanying notes to the unaudited consolidated financial statements.
F-9
Table of Contents
LD Holdings Group LLC and Subsidiaries
CONSOLIDATED STATEMENTS OF CASH FLOWS - CONTINUED
(Dollars in thousands)
(Unaudited)
| Nine Months Ended September 30, |
||||||||
| 2020 | 2019 | |||||||
| CASH FLOWS FROM FINANCING ACTIVITIES |
||||||||
| Proceeds from borrowings on warehouse lines of credit |
$ | 63,014,591 | $ | 28,285,806 | ||||
| Repayment of borrowings on warehouse lines of credit |
(61,880,096 | ) | (27,511,934 | ) | ||||
| Proceeds from debt obligations |
169,100 | 146,200 | ||||||
| Payments on debt obligations |
(55,000 | ) | (155,740 | ) | ||||
| Payments of debt issuance costs |
(4,503 | ) | (2,088 | ) | ||||
| Payments for contingent consideration |
(13,268 | ) | (961 | ) | ||||
| Proceeds from financing lease transactions |
— | 7,816 | ||||||
| Payments on financing lease obligation |
(18,025 | ) | (12,044 | ) | ||||
| Redemption of Class I Common Units |
(38,400 | ) | — | |||||
| Payments on repurchase of units |
(220 | ) | (5 | ) | ||||
| Dividend distributions |
(152,332 | ) | (492 | ) | ||||
|
|
|
|
|
|||||
| Net cash provided by financing activities |
1,021,847 | 756,558 | ||||||
|
|
|
|
|
|||||
| Net change in cash and cash equivalents and restricted cash |
590,402 | (34,705 | ) | |||||
| Cash and cash equivalents and restricted cash at beginning of the period |
117,496 | 113,993 | ||||||
|
|
|
|
|
|||||
| Cash and cash equivalents and restricted cash at end of the period |
$ | 707,898 | $ | 79,288 | ||||
|
|
|
|
|
|||||
| SUPPLEMENTAL DISCLOSURES OF CASH FLOW INFORMATION |
||||||||
| Cash paid during the period for: |
||||||||
| Interest |
$ | 128,091 | $ | 53,488 | ||||
| Income taxes |
196 | — | ||||||
| Supplemental disclosure of noncash investing and financing activities |
||||||||
| Purchase of equipment under financing leases |
$ | 2,468 | $ | 10,187 | ||||
| Operating lease
right-of-use assets received in exchange for lease |
13,971 | 76,549 | ||||||
See accompanying notes to the unaudited consolidated financial statements
F-10
Table of Contents
LD Holdings Group LLC and Subsidiaries
NOTES TO CONSOLIDATED FINANCIAL STATEMENTS
(Unaudited)
NOTE 1 – DESCRIPTION OF BUSINESS, PRESENTATION AND SUMMARY OF SIGNIFICANT ACCOUNTING POLICIES
Nature of Operations
LD Holdings Group LLC and its subsidiaries (collectively referred to herein as “LD Holdings” or the “Company”) provides residential mortgage loans and related services associated with these activities such as servicing of loans and settlement services for real estate transactions. The Company derives income primarily from gains from the sale of loans to investors, income from loan servicing, and fees charged for settlement services related to the origination and sale of loans. The Company was formed as a Delaware limited liability company on October 16, 2015. The Company operates under the LD Holdings Group LLC Second Amended and Restated Limited Liability Company Agreement (the “LLC Agreement”) dated December 31, 2018. The LLC Agreement was amended and restated on October 1, 2020.
Consolidation and Basis of Presentation
The Company’s consolidated financial statements include loanDepot.com, LLC (“loanDepot”), loanDepot’s controlled consolidated subsidiary LD Escrow, Inc. (“LD Escrow”), LD Settlement Services, LLC (“LDSS”), mello Holdings, LLC (“MH”), Artemis Management LLC (“ART”) and consolidated variable interest entities (“VIEs”) in which the Company is the primary beneficiary. loanDepot engages in the originating, financing, selling and servicing of residential mortgage loans, and engages in title, escrow and settlement services for mortgage loan transactions. Other entities that the Company does not consolidate, but for which it has significant influence over operating and financial policies, are accounted for using the equity method.
During the first six months of 2020, LD Escrow completed the transition of its operations to LDSS and LD Escrow has ceased operations as a title and escrow service provider.
The Company’s consolidated financial statements are prepared in accordance with generally accepted accounting principles in the United States of America (“GAAP”) as codified in the Financial Accounting Standards Board’s (“FASB”) Accounting Standards Codification (the “Codification”). All intercompany accounts and transactions have been eliminated in consolidation. Certain prior period amounts have been reclassified to conform to the current year’s presentation.
Summary of Significant Accounting Policies
A description of the Company’s significant accounting policies applied in the preparation of the accompanying consolidated financial statements follows.
Use of Estimates
The preparation of financial statements in conformity with GAAP requires management to make estimates and assumptions that affect the reported amounts of assets and liabilities and disclosure of contingent assets and liabilities at the date of the financial statements and the reported amounts of income and expenses during the reporting period. Management has made significant estimates in certain areas, including determining the fair value of loans held for sale, servicing rights, derivative assets and derivative liabilities, awards granted under the incentive equity plan, assets acquired and liabilities assumed in business combinations, and determining the loan loss obligation on sold loans. Actual results could differ from those estimates.
F-11
Table of Contents
Reportable Segments
The Company’s organizational structure is currently comprised of one operating segment. This determination is based on the organizational structure, which reflects how the chief operating decision maker evaluates the performance of the business. The Company’s chief operating decision maker evaluates the performance of our divisions that comprise our one segment based on the measurement of income before income taxes.
Cash and Cash Equivalents
All highly liquid investments with an original maturity of three months or less are considered to be cash equivalents. As of September 30, 2020 and December 31, 2019, all amounts recorded in cash and cash equivalents represent cash held in banks, with the exception of insignificant amounts of petty cash held on hand.
Restricted Cash
Cash balances that have restrictions as to the Company’s ability to withdraw funds are considered restricted cash. Restricted cash is the result of the terms of the Company’s warehouse lines of credit and debt obligations. In accordance with the terms of the warehouse lines of credit and debt obligations, the Company is required to maintain cash balances with the lender as additional collateral for the borrowings.
Fair Value
Assets and liabilities measured at fair value are categorized based on whether the inputs are observable in the market and the degree that the inputs are observable. The categorization of assets and liabilities measured at fair value within the valuation hierarchy is based on the lowest level of input that is significant to the fair value measurement. The hierarchy is prioritized into three levels (with Level 3 being the lowest) defined as follows:
| • | Level 1 - Quoted prices in active markets for identical assets or liabilities that the Company has the ability to access. |
| • | Level 2 - Prices determined or determinable using other significant observable inputs. Observable inputs are inputs that other market participants would use in pricing an asset or liability and are developed based on market data obtained from sources independent of the Company. These may include quoted prices for similar assets and liabilities, interest rates, prepayment speeds, credit risk and other inputs. |
| • | Level 3 - Prices determined using significant unobservable inputs. In situations where quoted prices or observable inputs are unavailable (for example, when there is little or no market activity), unobservable inputs may be used. Unobservable inputs reflect the Company’s own assumptions about the factors that market participants would use in pricing the asset or liability, and are based on the best information available in the circumstances. |
The fair value option provides an option to elect fair value as an alternative measurement for selected financial assets, financial liabilities, unrecognized firm commitments, and written loan commitments not previously carried at fair value. The Company has elected the fair value option on loans held for sale and servicing rights. Elections were made to mitigate income statement volatility caused by differences in the measurement basis of elected instruments with derivative financial instruments that are carried at fair value.
Loans Held for Sale, at Fair Value
Management has elected to account for loans held for sale (“LHFS”) at fair value, with changes in fair value recognized in current period income, to more timely reflect the Company’s performance. All changes in fair value, including changes arising from the passage of time, are recognized as a component of gain on origination and sale of loans, net. The Company classifies LHFS as “Level 2” fair value financial instruments.
F-12
Table of Contents
Sale Recognition
The Company recognizes transfers of loans held for sale as sales when it surrenders control over the loans. Control over transferred assets is deemed to be surrendered when (i) the assets have been isolated from the Company, (ii) the transferee has the right (free of conditions that constrain it from taking advantage of that right) to pledge or exchange the transferred assets, and (iii) the Company does not maintain effective control over the transferred assets through either (a) an agreement that entitles and obligates the Company to repurchase or redeem them before their maturity or (b) the ability to unilaterally cause the holder to return specific assets.
Interest Income and Expense Recognition
Interest income on loans held for sale is recognized using their contractual interest rates. Interest income recognition is suspended for loans when they become 90 days delinquent, or when, in management’s opinion, a full recovery of interest and principal becomes doubtful. Interest income recognition is resumed when the loan becomes contractually current. When loans are placed on non-accrual status, all interest previously accrued but not collected is reversed against current period interest income. Interest income on non-accrual loans is subsequently recognized only to the extent cash is received.
Interest expense on warehouse and other lines of credit, debt obligations, and other types of borrowings is recognized using their contractual rates. Interest expense includes the amortization of expenses incurred in connection with financing activities over the term of the related borrowings.
Origination Income, net Recognition
Origination income, net, reflects the fees earned, net of lender credits paid from originating loans. Origination income includes loan origination fees, processing fees, underwriting fees and other fees collected from the borrower at the time of funding, as well as the platform licensing fee income received from personal loan products. Lender credits typically include rebates or concessions to borrowers for certain loan origination costs.
Securitizations and Variable Interest Entities
The Company is involved in several types of securitization and financing transactions that utilize special-purpose entities (SPEs). A SPE is an entity that is designed to fulfill a specified limited need of the sponsor. The Company’s principal use of SPEs is to obtain liquidity by securitizing certain of its financial and non-financial assets. SPEs involved in the Company’s securitization and other financing transactions are often considered VIEs. VIEs are entities that have a total equity investment at risk that is insufficient to permit the entity to finance its activities without additional subordinated financial support, whose equity investors at risk lack the ability to control the entity’s activities, or is structured with non-substantive voting rights.
Securitization transactions are accounted for either as sales or secured borrowings. The Company may retain economic interests in the securitized and sold assets, which are generally retained in the form of subordinated interests, residual interests, and/or servicing rights.
In order to conclude whether or not a VIE is required to be consolidated, careful consideration and judgment must be given to the Company’s continuing involvement with the VIE. In circumstances where the Company has a variable interest along with the power to direct the activities of the entity that most significantly impact the entity’s performance or meet other criteria, the Company would conclude to consolidate the entity, which would also preclude the Company from recording an accounting sale on the transaction. In the case of a consolidated VIE, the accounting reflects a secured borrowing (e.g., the securitized loans or assets and the related debt are reported on the Company’s consolidated balance sheets).
F-13
Table of Contents
In transactions where the Company does not meet the consolidation guidance (i.e. the Company is not determined to be the primary beneficiary of the VIE or other factors), the Company must determine whether or not it achieves a sale for accounting purposes. In order to achieve a sale for accounting purposes, the assets being transferred must be legally isolated, not be constrained by restrictions from further transfer, and be deemed to be beyond the Company’s control. If the Company were to fail any of the three criteria for sale accounting, the accounting would be consistent with the preceding paragraph (i.e., a secured borrowing). Refer to Note 8 – Variable Interest Entities for discussion on VIEs.
Whether on- or off-balance sheet, the investors in the securitization trusts have no recourse to the Company’s assets outside of protections afforded through customary market representation and warranty repurchase provisions.
Derivative Financial Instruments
Derivative financial instruments are recognized as assets or liabilities and are measured at fair value. The Company accounts for derivatives as free-standing derivatives and does not designate any derivative financial instruments for hedge accounting. All derivative financial instruments are recognized on the consolidated balance sheets at fair value with changes in the fair values being reported in current period earnings.
The Company enters into commitments to originate loans held for sale, at specified interest rates, with customers who have applied for residential mortgage loans and meet certain credit and underwriting criteria. These interest rate lock commitments (“IRLCs”) meet the definition of a derivative financial instrument and are recorded at fair value with changes in fair value recognized in current period earnings. Unrealized gains and losses on the IRLCs are recorded as derivative assets and derivative liabilities, respectively, and are measured based on the value of the underlying loan, quoted MBS prices, estimates of the fair value of the servicing rights and an estimate of the probability that the loan will fund within the terms of the interest rate lock commitment, net of estimated costs.
The Company is exposed to price risk related to its loans held for sale, IRLCs and servicing rights. The Company bears price risk from the time a commitment to originate a loan is made to a borrower or to purchase a loan from a third-party, to the time the loan is sold. During this period, the Company is exposed to losses if mortgage interest rates rise because the value of the IRLC or the loan held for sale decreases. Reductions in the value of these assets affect income primarily through change in fair value. Servicing rights are accounted for at fair value and the Company is exposed to losses on servicing rights if mortgage interest rates decline. Reductions in the value of servicing rights affect income primarily through changes in fair value.
The Company manages the price risk created by IRLCs and loans held for sale by entering into forward sale agreements to sell the loans and by the purchase and sale of mortgage-backed securities (“MBS”) trades and options on Treasury futures. Such agreements are also accounted for as derivative financial instruments. Forward sale agreements and options are included in derivative assets, at fair value and derivative liabilities, at fair value on the consolidated balance sheets. The Company classifies IRLCs as “Level 3” financial statement items, and the derivative financial instruments it acquires to manage the risks created by IRLCs and loans held for sale as “Level 2” fair value financial statement items. The Company manages the risk created by servicing rights by hedging the fair value of servicing rights with interest rate swap futures and options on Treasury bond future contracts. The Company classifies the interest rate swap futures and options on Treasury bond futures contracts as “Level 1” financial statement items. The Company does not use derivative financial instruments for purposes other than in support of its risk management activities.
Changes in fair value of derivatives hedging IRLCs and loans held for sale at fair value are included in gain on origination and sale of loans, net on the consolidated statements of operations. Changes in fair value of servicing rights hedging are included in change in fair value of servicing rights, net on the consolidated statements of operations.
F-14
Table of Contents
The Company has master netting arrangements with certain counterparties of derivative instruments and warehouse lines. Under these master netting arrangements, the Company can offset the fair value of the derivative instrument against the fair value of the LHFS collateralizing the warehouse line, thereby netting the increase or decrease in the fair value of the derivative instruments against the increase or decrease in the fair value of the LHFS. The Company’s policy is to present such arrangements on the associated assets and liabilities on a gross basis in the consolidated balance sheets.
Servicing Rights
Servicing rights arise from contractual agreements between the Company and investors (or their agents) in mortgage securities and mortgage loans. Under these contracts, the Company performs loan servicing functions in exchange for fees and other remuneration. Servicing functions typically include, among other responsibilities, collecting and remitting loan payments; responding to borrower inquiries; accounting for principal and interest; holding custodial (impound) funds for payment of property taxes and insurance premiums; counseling delinquent mortgagors; and supervising the acquisition of real estate in settlement of loans and property disposition. The Company utilizes a sub-servicer to service its loan servicing portfolio. The Company is required to make servicing advances on behalf of borrowers and investors to cover delinquent balances for property taxes, insurance premiums and other costs. Advances are made in accordance with servicing agreements and are recoverable upon collection from the borrower or foreclosure of the underlying loans. The Company periodically reviews the receivable for collectability and amounts are written-off when deemed uncollectible. As of September 30, 2020 and December 31, 2019, the Company had $28.6 million and $23.5 million, respectively, in outstanding servicing advances included in prepaid expenses and other assets.
When the Company sells a loan on a servicing-retained basis, it recognizes a servicing asset at fair value based on the present value of future cash flows generated by the servicing asset retained in the sale. The Company has made the election to carry its servicing rights at fair value.
The value of the servicing rights is derived from the net positive cash flows associated with the servicing contracts. The Company receives a servicing fee monthly on the remaining outstanding principal balances of the loans subject to the servicing contracts. The servicing fees are collected from the monthly payments made by the mortgagors. The Company is contractually entitled to receive other remuneration including rights to various mortgagor-contracted fees such as late charges, collateral reconveyance charges and loan prepayment penalties, and the Company is generally entitled to retain the interest earned on funds held pending remittance related to its collection of mortgagor payments. The Company also generally has the right to solicit the mortgagors for other products and services as well as for new mortgages for those considering refinancing or purchasing a new home.
The Company is exposed to fair value risk related to its servicing rights. Servicing rights generally decline in fair value when market mortgage interest rates decrease. Decreasing market mortgage interest rates normally encourage increased mortgage refinancing activity. Increased refinancing activity reduces the life of the loans underlying the servicing rights, thereby reducing their value. Reductions in the value of these assets affect income primarily through change in fair value.
The fair value of servicing rights is difficult to determine because servicing rights are not actively traded in observable stand-alone markets. The Company uses a discounted cash flow approach to estimate the fair value of servicing rights. This approach consists of projecting servicing cash flows. The inputs used in the Company’s discounted cash flow model are based on market factors, which management believes are consistent with assumptions and data used by market participants valuing similar servicing rights. The key inputs used in the valuation of servicing rights include mortgage prepayment speeds, cost to service the loans and discount rates. These inputs can, and generally do, change from period to period as market conditions change. Considerable judgment is required to estimate the fair values of servicing rights and the exercise of such judgment can significantly affect the Company’s income. Therefore, the Company classifies its servicing rights as “Level 3” fair value financial statement items.
F-15
Table of Contents
Servicing Fee Income
The Company receives servicing fee income from its servicing portfolio. Servicing fee income is recognized on an accrual basis and is recorded to servicing fee income. The Company’s subservicing expenses are recorded to subservicing expense.
Change in Fair Value of Servicing Rights, net
Unrealized gains (losses) resulting from changes in the fair value of servicing rights are recorded to change in fair value of servicing rights, net. Realized and unrealized hedging gains (losses) associated with interest rate swap futures and options on Treasury bond future contracts used to hedge interest rate risk on servicing rights are recorded in changes in fair value of servicing rights, net. Realized gains (losses) from the sale of servicing rights are also included in change in fair value of servicing rights, net.
Sale Recognition
The Company recognizes sales of servicing rights to a purchaser as sales when (i) the Company has received approval from the investor, if required, (ii) the purchaser is currently approved as a servicer and is not at risk of losing approval status, (iii) if the portion of the sales price has been financed, an adequate nonrefundable down payment has been received and the note receivable from the purchaser provides full recourse to the purchaser, and (iv) any temporary servicing performed by the Company for a short period of time is compensated in accordance with a subservicing contract that provides adequate compensation. Additionally, the Company recognizes sales of servicing rights as sales if title passes, if substantially all risks and rewards of ownership have irrevocably passed to the purchaser and any protection provisions retained by the Company are minor and can be reasonably estimated. In addition, if a sale is recognized and only minor protection provisions exist, a liability is accrued for the estimated obligation associated with those provisions.
Trading Securities, at Fair Value
The Company accounts for trading securities at fair value, with changes in fair value recognized in current period income in other income. Other income includes net realized and unrealized gains and losses on trading securities. Trading securities may be pledged as collateral to secure debt obligations and are held for liquidity purposes.
Accounts Receivable, net
Accounts receivable are stated amounts due from customers or from investors for loans sold, net of an allowance for doubtful accounts. Accounts receivable that are outstanding longer than the contractual payment terms are considered past due. The Company establishes a reserve for all amounts due from borrowers and investors that are over 150 days old. There was $0.4 million and $1.3 million in allowance for credit losses at September 30, 2020 and December 31, 2019, respectively. The Company writes off accounts receivable when management deems them uncollectible. There were $0.4 million and $0.6 million of accounts receivable write-offs during the nine months ended September 30, 2020 and 2019, respectively.
Property and Equipment
Property and equipment are recorded at cost and depreciated over their estimated useful lives using the straight-line method. Leasehold improvements are capitalized and amortized over the lesser of the life of the lease or the estimated useful life of the asset. Useful lives for purposes of computing depreciation are as follows:
| Years | ||||
| Leasehold improvements |
2-15 | |||
| Furniture and equipment |
5-7 | |||
| Computer software |
3-5 | |||
F-16
Table of Contents
Expenditures that materially increase the asset life are capitalized, while ordinary maintenance and repairs are charged to operations as incurred. When assets are sold or retired, the cost and related accumulated depreciation are removed from the accounts and any resulting gains or losses are included in earnings.
Leases
The Company determines if an arrangement contains a lease at contract inception and recognizes operating lease right-of-use (“ROU”) assets and corresponding operating lease liability based on the present value of lease payments over the lease term, except leases with initial terms less than or equal to 12 months. While the operating leases may include options to extend the term, these options are not included when calculating the operating lease right-of-use asset and lease liability unless the Company is reasonably certain it will exercise such options. Most of the leases do not provide an implicit rate and, therefore, the Company determines the present value of lease payments by using the Company’s incremental borrowing rate. Leases with an initial term of 12 months or less are not recorded in the consolidated balance sheets. The Company’s lease agreements include both lease and non-lease components (such as common area maintenance), which are generally included in the lease and are accounted for together with the lease as a single lease component. Certain of the Company’s lease agreements permit it to sublease leased assets. Sublease income is included as a component of lease expense.
Operating lease ROU assets are regularly reviewed for impairment under the long-lived asset impairment guidance in ASC Subtopic 360-10, Property, Plant and Equipment - Overall.
Goodwill and Other Intangible Assets
Business combinations are accounted for using the acquisition method of accounting. Acquired intangible assets are recognized and reported separately from goodwill. Goodwill represents the excess cost of acquisition over the fair value of net assets acquired.
Intangible assets with finite lives are amortized over their estimated lives using the straight-line method. On an annual basis, during the fourth quarter, the Company evaluates whether there has been a change in the estimated useful life or if certain impairment indicators exist.
Goodwill must be allocated to reporting units and tested for impairment. Goodwill is tested for impairment at least annually, during the fourth quarter, and more frequently if events or circumstances, such as adverse changes in the business climate, indicate there may be justification for conducting an interim test. Impairment testing is performed at the reporting unit level.
In testing goodwill for impairment, the Company first assesses qualitative factors to determine whether it is more likely than not that the fair value of a reporting unit is less than its carrying amount. In making this assessment, the Company considers all relevant events and circumstances. These include, but are not limited to, macroeconomic conditions, industry and market considerations and the reporting unit’s overall financial performance. If the Company concludes, based on its qualitative assessment, that it is more likely than not that the fair value of the reporting unit is at least equal to its carrying amount, then the Company concludes that the goodwill of the reporting unit is not impaired and no further testing is performed. However, if the Company determines, based on its qualitative assessment, that it is more likely than not that the fair value of a reporting unit is less than its carrying amount, then the Company will perform the quantitative goodwill impairment test. At the Company’s option, it may, in any given period, bypass the qualitative assessment and proceed directly to the quantitative approach.
The quantitative assessment begins with a comparison of the fair value of a reporting unit to its carrying amount, including goodwill. If the fair value of the reporting unit is less than its carrying amount, an impairment loss shall be recognized in an amount equal to the difference, limited to the total amount of goodwill for the reporting unit. No impairment was recorded during the nine months ended September 30, 2020 and 2019.
F-17
Table of Contents
Long-Lived Assets
The Company periodically assesses long-lived assets, including property and equipment, for recoverability when events or changes in circumstances indicate that their carrying amount may not be recoverable. If management identifies an indicator of impairment, it assesses recoverability by comparing the carrying amount of the asset to the sum of the undiscounted cash flows expected to result from the use and the eventual disposal of the asset. An impairment loss is recognized when the carrying amount is not recoverable and is measured as the excess of carrying value over fair value. No such impairment was recorded during the nine months ended September 30, 2020 and 2019.
Loan Loss Obligation on Loans Sold
When the Company sells loans to investors, the risk of loss or default by the borrower is generally transferred to the investor. However, the Company is required by these investors to make certain representations relating to credit information, loan documentation and collateral. These representations and warranties may extend through the contractual life of the mortgage loan. Subsequent to the sale, if underwriting deficiencies, borrower fraud or documentation defects are discovered in individual mortgage loans, the Company may be obligated to repurchase the respective mortgage loan or indemnify the investors for any losses from borrower defaults if such deficiency or defect cannot be cured within the specified period following discovery.
In the case of early loan payoffs and early defaults on certain loans, the Company may be required to repay all or a portion of the premium initially paid by the investor on loans. The estimated obligation associated with early loan payoffs and early defaults is calculated based on historical loss experience.
The obligation for losses related to the representations and warranties and other provisions discussed above is recorded based upon an estimate of losses. Because the Company does not service all of the loans it sells, it does not maintain nor have access to the current balances and loan performance data with respect to all of the individual loans previously sold to investors. However, the Company uses industry-available prepayment data and historical and projected loss frequency and loss severity ratios to estimate its exposure to losses on loans previously sold. Given current general industry trends in mortgage loans as well as housing prices, market expectations around losses related to the Company’s obligations could vary significantly from the obligation recorded as of the balance sheet date. The Company records a provision for loan losses, included in gain on origination and sale of loans, net in the consolidated statements of operations, to establish the loan repurchase reserve for sold loans which is reflected in accounts payable and accrued expenses on the consolidated balance sheets.
Income Taxes
The Company is a limited liability company (“LLC”). Under federal and applicable state laws, taxes based on income of an LLC treated as a partnership are payable by the LLC’s members individually and not at the entity level. Additionally, the Company is subject to annual state LLC franchise taxes and state LLC fees. These taxes and fees are included in general and administrative expenses.
The Company’s provision for income taxes at the consolidated level include federal, state and local taxes for LD Escrow and American Coast Title Company, Inc. (“ACT”), two wholly-owned subsidiaries that are both C corporations, for the nine months ended September 30, 2020 and 2019.
Income taxes are accounted for under the asset and liability method. Under this method, deferred tax assets and liabilities are recognized for future tax consequences attributable to differences between the consolidated financial statement carrying amounts of existing assets and liabilities and their respective tax bases. Deferred tax assets and liabilities are measured using enacted tax rates for the periods in which the differences are expected to reverse. The effect on deferred tax assets and liabilities of a change in tax rates is recognized in income in the period that includes the change.
F-18
Table of Contents
The Company evaluates tax positions taken or expected to be taken in the course of preparing the Company’s tax returns to determine whether the tax positions are “more-likely-than-not” of being sustained by the applicable tax authority. Tax positions deemed to meet the more-likely than-not threshold of being sustained would be recorded as a tax benefit in the current period. The Company has reviewed all open tax years (2015—2020) in each respective jurisdiction and concluded that it has a tax liability resulting from unrecognized tax benefits relating to uncertain income tax positions.
Redeemable Units
In accordance with the guidance in FASB ASC Topic 480, Distinguishing Liabilities from Equity, outstanding Class I, A, B, P, P-2, P-3 and Z-1 Redeemable Units were classified outside of permanent equity and within temporary equity due to their associated redemption features and liquidation preferences. In a liquidation event, the Redeemable Units have preference over the Units classified as permanent equity to any proceeds from a liquidation event at amounts described for each Unit Class. Proceeds include cash or the issuance of stock to Unitholders in a qualified public offering. A liquidation event includes (i) the sale or disposition of substantially all of the Company’s assets, (ii) a merger or consolidation in which the stockholders of the Company prior to the transaction no longer hold at least 50 percent of the voting power of the merged or consolidated entity, (iii) a liquidation, dissolution, or winding up of the Company, or (iv) a qualified public offering. Upon a qualified public offering each Unit would receive proceeds (cash or shares of stock) at the applicable liquidation preference proportional to its value in the overall Company.
Equity-Based Compensation
The Company’s 2009 Incentive Equity Plan, 2012 Incentive Equity Plan, and 2015 Incentive Equity Plan (collectively, the “Plans”) provide for awards of various classes of Common Units, as described in the Plans. The Company uses the grant-date fair value of equity awards to determine the compensation cost associated with each award. Grant-date fair value is determined using the Black-Scholes pricing model adjusted for unique characteristics of the specific awards. Compensation cost for service-based equity awards is recognized on a straight-line basis over the requisite service period, which is generally the vesting period. Compensation cost for awards with only service conditions that have graded vesting schedules is recognized on a straight-line basis over the requisite service period for the entire award such that compensation cost recognized at any date is at least equal to the portion of the grant-date value of the award that is vested at that date. Expense is reduced for actual forfeitures as they occur. The cost of equity-based compensation is recorded to personnel expense.
Advertising
Advertising costs are expensed in the period incurred and principally represent online advertising costs, including fees paid to search engines, distribution partners, master service agreements with brokers, and desk rental agreements with realtors. Advertising expense amounted to $173.6 million and $133.8 million for the nine months ended September 30, 2020 and 2019, respectively. Prepaid advertising expenses are capitalized and recognized during the period the expenses are incurred. As of September 30, 2020 and December 31, 2019, capitalized advertising expense totaled $13 thousand and $0.9 million, respectively, recorded in prepaid expenses and other assets.
Concentration of Risk
The Company has concentrated its credit risk for cash by maintaining deposits in several financial institutions, which may at times exceed amounts covered by insurance provided by the Federal Deposit Insurance Corporation (FDIC). The Company has not experienced any losses in such accounts and believes it is not exposed to any significant credit risk related to cash.
Due to the nature of the mortgage lending industry, changes in interest rates may significantly impact revenue from originating mortgages and subsequent sales of loans to investors, which are the primary source of
F-19
Table of Contents
income for the Company. The Company originates mortgage loans on property located throughout the United States, with loans originated for property located in California totaling approximately 30% of total loan originations for the nine months ended September 30, 2020.
The Company sells mortgage loans to various third-party investors. Three investors accounted for 36%, 30%, and 20% of the Company’s loan sales for the nine months ended September 30, 2020. No other investors accounted for more than 5% of the loan sales for the nine months ended September 30, 2020.
The Company funds loans through warehouse lines of credit. As of September 30, 2020, 25% and 11% of the Company’s warehouse lines were payable to two separate lenders.
NOTE 2 – RECENT ACCOUNTING PRONOUNCEMENTS
In June 2016, the FASB issued ASU 2016-13, “Financial Instruments-Credit Losses (Topic 326): Measurement of Credit Losses on Financial Instruments.” ASU 2016-13 replaces the existing measurement of the allowance for credit losses that is based on an incurred loss accounting model with an expected loss model, which requires the Company to use a forward-looking expected credit loss model for accounts receivable, loans and other financial instruments that are measured on the amortized cost basis. The majority of the Company’s financial assets are measured at fair value and therefore, not subject to the requirements of ASU 2016-13. The adoption of the amendments in ASU 2016-13 on January 1, 2020 did not have a significant effect on the Company’s allowance for credit losses on its assets subject to ASU 2016-13 due to the assets’ relatively short-term lives.
In August 2018, the FASB issued ASU No. 2018-13, “Fair Value Measurement (Topic 820): Disclosure Framework - Changes to the Disclosure Requirements for Fair Value Measurement.” This ASU was issued to improve the effectiveness of disclosure requirements on a narrow set of concepts relating to fair value measurements. The ASU is effective for all entities for fiscal years beginning after December 15, 2019, including interim periods therein. Early adoption is permitted for any eliminated or modified disclosures. The Company adopted this guidance on January 1, 2020, and the adoption of this ASU did not have a material impact on the Company’s consolidated financial statements as the changes were limited to existing disclosure which were already aligned with the updates.
In September 2018, the FASB issued ASU 2018-15, “Intangibles - Goodwill and Other - Internal-Use Software (Subtopic 350-40): Customer’s Accounting for Implementation Costs Incurred in a Cloud Computing Arrangement That Is a Service Contract.” ASU 2018-15 was issued to align the requirements for capitalizing implementation costs incurred in a hosting arrangement that is a service contract with the requirements for capitalizing implementation costs incurred to develop or obtain internal-use software (and hosting arrangements that include an internal use software license). The ASU was effective for public business entities for fiscal years beginning after December 15, 2019, and interim periods within those fiscal years. The adoption of this guidance on January 1, 2020 did not have a significant effect on the Company’s consolidated financial statements given that (1) the changes under the ASU generally align with our existing accounting treatment of implementation costs incurred in a hosting arrangement that is a service contract and (2) the Company has not incurred a material amount of implementation costs in a hosting arrangement.
In December 2019, FASB issued ASU 2019-12, “Income Taxes (Topic 740): Simplifying the Accounting for Income Taxes.” The amendments in ASU 2019-12 simplify the accounting for income taxes by removing certain exceptions to the general principles in ASC Topic 740, Income Taxes. The amendments also improve consistent application of and simplify GAAP for other areas of Topic 740 by clarifying and amending existing guidance. This ASU is effective for public business entities for fiscal years and interim periods beginning after December 15, 2020. The Company does not expect the adoption of this ASU to have a material impact on its consolidated financial statements.
F-20
Table of Contents
In March 2020, the FASB issued ASU 2020-04, “Reference Rate Reform (Topic 848): Facilitation of the Effects of Reference Rate Reform on Financial Reporting,” which provides optional guidance for a limited period of time to ease the potential burden in accounting for (or recognizing the benefits of) reference rate reform on financial reporting. The amendments in ASU 2020-04 are elective and apply to all entities, subject to meeting certain criteria, that have contract, hedging relationships, and other transactions that reference London Interbank Offered Rate (LIBOR) or another reference rate expected to be discontinued because of reference rate reform. This guidance is effective upon issuance and allows application to contract changes as early as January 1, 2020. The Company is in the process of reviewing its warehouse and other lines of credit and debt obligations that use LIBOR as the reference rate and is currently evaluating the potential impact that the adoption of this ASU will have on the consolidated financial statements.
NOTE 3 – FAIR VALUE
The Company’s consolidated financial statements include assets and liabilities that are measured based on their estimated fair values. The application of fair value estimates may be on a recurring or nonrecurring basis depending on the accounting principles applicable to the specific asset or liability and whether management has elected to carry the item at its estimated fair value as discussed in the following paragraphs.
Financial Statement Items Measured at Fair Value on a Recurring Basis
The Company enters into interest rate lock commitments (“IRLCs”) with prospective borrowers, which are commitments to originate loans at a specified interest rate. The IRLCs are recorded as a component of derivative assets and liabilities on the consolidated balance sheets with changes in fair value being recorded in current earnings as a component of gain on origination and sale of loans, net.
IRLCs for loans to be sold to investors are economically hedged using mandatory or assignment of trades (“AOT”), best efforts sale commitments or options on U.S. treasury futures. The Company estimates the fair value of the IRLCs based on quoted agency to be announced mortgage-backed securities (“TBA MBS”) prices, its estimate of the fair value of the servicing rights it expects to receive in the sale of the loans and the probability that the mortgage loan will fund or be purchased (the “pull-through rate”) and estimated transformative costs. The pull-through rate is based on the Company’s own experience and is a significant unobservable input used in the fair value measurement of these instruments and results in the classification of these instruments as Level 3. Significant changes in the pull-through rate of the IRLCs, in isolation, could result in significant changes in fair value measurement. At September 30, 2020 and December 31, 2019, there was $30.4 billion and $8.9 billion, respectively, of IRLCs notional value outstanding.
LHFS to be sold to investors are also hedged using mandatory trades or AOTs, best efforts sale commitments or put options. The LHFS are valued at the best execution value based on the underlying characteristics of the loan, which is either based off of the TBA MBS market, or investor pricing, based on product, note rate and term. The most significant data inputs used in this valuation include, but are not limited to, loan type, underlying loan amount, note rate, loan program, and expected sale date of the loan. The valuations for LHFS are adjusted at the loan level to consider the servicing release premium and loan level pricing adjustments specific to each loan. LHFS, excluding impaired loans, are classified as Level 2. LHFS measured at fair value that become impaired are transferred from Level 2 to Level 3. Changes in the fair value of the LHFS are recorded in current earnings as a component of Gain on origination and sale of loans, net.
As described above, the Company economically hedges the changes in fair value of IRLCs and LHFS caused by changes in interest rates by using mandatory trades or AOTs, best efforts forward delivery commitments, and put options. These instruments are considered derivative instruments and are recorded at fair value as a component of derivative assets, at fair value or derivative liabilities, at fair value on the consolidated balance sheets. The changes in fair value for these hedging instruments are recorded in current earnings as a component of gain on origination and sale of loans, net.
F-21
Table of Contents
Mandatory trades are valued using inputs related to characteristics of the TBA MBS stratified by product, coupon, and settlement date. These derivatives are classified as Level 2. As of September 30, 2020 and December 31, 2019, there was $40.7 billion and $13.7 billion, respectively, of unsettled mandatory trade notional value outstanding.
Best efforts forward delivery commitments are valued using investor pricing considering the current base loan price. An anticipated loan funding probability is applied to value best efforts commitments hedging IRLCs, which results in the classification of these contracts as Level 3. The current base loan price and the anticipated loan funding probability are the most significant assumptions affecting the value of the best efforts commitments. The best efforts forward delivery commitments hedging LHFS are classified as Level 2; such contracts are transferred from Level 3 to Level 2 at the time the underlying loan is originated. As of September 30, 2020 and December 31, 2019, the balance of best effort forward delivery commitments was not material.
The Company also purchases out-of-the-money put options on 10-year treasury futures to economically hedge interest rate risk. Risk of loss associated with the put options is limited to the premium paid for the option. These put options are actively traded in a liquid market and thus, these instruments are considered to be valued with Level 1 inputs.
The fair value of the servicing rights is based on applying the inputs to calculate the net present value of estimated servicing rights income. Significant inputs in the valuation of the servicing rights include discount rates, prepayment speeds and the cost of servicing. These inputs are predominantly Level 3 in nature as they utilize certain significant unobservable inputs including prepayment rate, default rate and discount rate assumptions. Changes in the fair value of servicing rights occur primarily due to realization of expected cash flows as well as the changes in valuation inputs and assumptions. If prepayments occur at a rate greater than the Company’s estimate, the fair value of the servicing rights will decrease accordingly.
The fair value estimate for contingent consideration was determined by the Company using the annual earnout computation according to the asset purchase agreement including current pretax earnings less prior period pretax losses and estimated earnout in the likelihood and timing of a liquidity event. As of September 30, 2020 and December 31, 2019, the fair value of contingent consideration was $21.8 million and $2.4 million, respectively.
The following table presents the carrying amount and estimated fair value of financial instruments included in the consolidated financial statements:
| September 30, 2020 | ||||||||||||||||
| Carrying Amount |
Estimated Fair Value | |||||||||||||||
| (Dollars in thousands) |
Level 1 | Level 2 | Level 3 | |||||||||||||
| Assets |
||||||||||||||||
| Cash and cash equivalents |
$ | 637,511 | $ | 637,511 | $ | — | $ | — | ||||||||
| Restricted cash |
70,387 | 70,387 | — | — | ||||||||||||
| Loans held for sale, at fair value |
4,888,364 | — | 4,888,364 | — | ||||||||||||
| Derivative assets, at fair value (1) |
722,149 | — | 75 | 722,074 | ||||||||||||
| Servicing rights, at fair value |
780,451 | — | — | 780,451 | ||||||||||||
| Loans eligible for repurchase |
1,184,015 | — | 1,184,015 | — | ||||||||||||
| Liabilities |
||||||||||||||||
| Warehouse and other lines of credit |
$ | 4,601,062 | $ | — | $ | 4,601,062 | $ | — | ||||||||
| Derivative liabilities, at fair value (2) |
59,432 | 1,459 | 57,557 | 416 | ||||||||||||
| Servicing rights, at fair value (3) |
3,458 | — | — | 3,458 | ||||||||||||
| Contingent consideration (3) |
21,756 | — | — | 21,756 | ||||||||||||
| Debt obligations: |
||||||||||||||||
| Secured credit facilities |
382,867 | — | 385,000 | — | ||||||||||||
| Unsecured term loan |
248,786 | — | — | 250,000 | ||||||||||||
| Convertible note |
74,825 | — | — | 75,000 | ||||||||||||
| Liability for loans eligible for repurchase |
1,184,015 | — | 1,184,015 | — | ||||||||||||
F-22
Table of Contents
| (1) | Amounts include interest rate lock commitments, forward sales contracts, put options and interest rate swap futures. |
| (2) | Amounts include forward sales contracts and interest rate lock commitments. |
| (3) | Included in accounts payable, accrued expenses and other liabilities in the accompanying consolidated balance sheets. |
| December 31, 2019 | ||||||||||||||||
| Carrying Amount |
Estimated Fair Value | |||||||||||||||
| (Dollars in thousands) |
Level 1 | Level 2 | Level 3 | |||||||||||||
| Assets |
||||||||||||||||
| Cash and cash equivalents |
$ | 73,301 | $ | 73,301 | $ | — | $ | — | ||||||||
| Restricted cash |
44,195 | 44,195 | — | — | ||||||||||||
| Loans held for sale, at fair value |
3,681,840 | — | 3,681,840 | — | ||||||||||||
| Derivative assets, at fair value (1) |
131,228 | — | 1,345 | 129,883 | ||||||||||||
| Servicing rights, at fair value |
447,478 | — | — | 447,478 | ||||||||||||
| Loans eligible for repurchase |
197,812 | — | 197,812 | — | ||||||||||||
| Liabilities |
||||||||||||||||
| Warehouse and other lines of credit |
$ | 3,466,567 | $ | — | $ | 3,466,567 | $ | — | ||||||||
| Derivative liabilities, at fair value (2) |
9,977 | 1,316 | 6,987 | 1,674 | ||||||||||||
| Servicing rights, at fair value (3) |
3,035 | — | — | 3,035 | ||||||||||||
| Contingent consideration (3) |
2,374 | — | — | 2,374 | ||||||||||||
| Debt obligations: |
||||||||||||||||
| Secured credit facilities |
294,049 | — | 295,900 | — | ||||||||||||
| Unsecured term loan |
248,289 | — | — | 250,000 | ||||||||||||
| Convertible note |
49,757 | — | — | 50,000 | ||||||||||||
| Liability for loans eligible for repurchase |
197,812 | — | 197,812 | — | ||||||||||||
| (1) | Amounts include interest rate lock commitments, forward sales contracts, put options and interest rate swap futures. |
| (2) | Amounts include forward sales contracts and interest rate lock commitments. |
| (3) | Included in accounts payable, accrued expenses and other liabilities in the accompanying consolidated balance sheets. |
The following presents the Company’s assets and liabilities that are measured at fair value on a recurring basis:
| September 30, 2020 | ||||||||||||||||
| Recurring Fair Value Measurements of Assets (Liabilities) Using: | ||||||||||||||||
| (Dollars in thousands) |
Quoted Market Prices in Active Markets for Identical Assets (Level 1) |
Significant Other Observable Inputs (Level 2) |
Significant Unobservable Inputs (Level 3) |
Total Fair Value Measurements |
||||||||||||
| Loans held for sale |
$ | — | $ | 4,888,364 | $ | — | $ | 4,888,364 | ||||||||
| Interest rate lock commitments, net (1) |
— | — | 721,658 | 721,658 | ||||||||||||
| Servicing rights—assets |
— | — | 780,451 | 780,451 | ||||||||||||
| Forward sales contracts—assets (2) |
— | 75 | — | 75 | ||||||||||||
| Servicing rights—liabilities |
— | — | (3,458 | ) | (3,458 | ) | ||||||||||
| Interest rate swap futures—liabilities (2) |
(531 | ) | — | — | (531 | ) | ||||||||||
| Forward sales contracts—liabilities (3) |
— | (57,557 | ) | — | (57,557 | ) | ||||||||||
| Put options on treasuries—liabilities (2) |
(928 | ) | — | — | (928 | ) | ||||||||||
| Contingent consideration (4) |
— | — | (21,756 | ) | (21,756 | ) | ||||||||||
|
|
|
|
|
|
|
|
|
|||||||||
| Total, net |
$ | (1,459 | ) | $ | 4,830,882 | $ | 1,476,895 | $ | 6,306,318 | |||||||
|
|
|
|
|
|
|
|
|
|||||||||
F-23
Table of Contents
| (1) | Includes $0.4 million of IRLC liabilities. Amounts included in derivative assets, at fair value and derivative liabilities, at fair value on the consolidated balance sheet. |
| (2) | Amounts included in derivative assets, at fair value on the consolidated balance sheet. |
| (3) | Amounts included in derivative liabilities, at fair value on the consolidated balance sheet. |
| (4) | In September 2020, the Company entered into an agreement to pay off the contingent consideration liability for $32.4 million comprised of payments of $10.8 million in September 2020 and $21.6 million in October 2020. |
| December 31, 2019 | ||||||||||||||||
| Recurring Fair Value Measurements of Assets (Liabilities) Using: | ||||||||||||||||
| (Dollars in thousands) |
Quoted Market Prices in Active Markets for Identical Assets (Level 1) |
Significant Other Observable Inputs (Level 2) |
Significant Unobservable Inputs (Level 3) |
Total Fair Value Measurements |
||||||||||||
| Loans held for sale |
$ | — | $ | 3,681,840 | $ | — | $ | 3,681,840 | ||||||||
| Interest rate lock commitments, net (1) |
— | — | 128,208 | 128,208 | ||||||||||||
| Servicing rights—assets |
— | — | 447,478 | 447,478 | ||||||||||||
| Forward sales contracts—assets (2) |
— | 1,345 | — | 1,345 | ||||||||||||
| Servicing rights—liabilities |
— | — | (3,035 | ) | (3,035 | ) | ||||||||||
| Interest rate swap futures (2) |
(1,316 | ) | — | — | (1,316 | ) | ||||||||||
| Forward sales contracts—liabilities (3) |
— | (6,987 | ) | — | (6,987 | ) | ||||||||||
| Contingent consideration (4) |
— | — | (2,374 | ) | (2,374 | ) | ||||||||||
|
|
|
|
|
|
|
|
|
|||||||||
| Total, net |
$ | (1,316 | ) | $ | 3,676,198 | $ | 570,277 | $ | 4,245,159 | |||||||
|
|
|
|
|
|
|
|
|
|||||||||
| (1) | Includes $1.7 million of IRLC liabilities. Amounts included in derivative assets, at fair value and derivative liabilities, at fair value on the consolidated balance sheet. |
| (2) | Amounts included in derivative assets, at fair value on the consolidated balance sheet. |
| (3) | Amounts included in derivative liabilities, at fair value on the consolidated balance sheet. |
| (4) | In September 2020, the Company entered into an agreement to pay off the contingent consideration liability for $32.4 million comprised of payments of $10.8 million in September 2020 and $21.6 million in October 2020. |
The following presents the changes in the Company’s assets and liabilities that are measured at fair value on a recurring basis using significant unobservable inputs (Level 3):
| Nine Months Ended September 30, 2020 | ||||||||||||
| (Dollars in thousands) |
Interest Rate Lock Commitments(1) |
Servicing Rights, net(2) |
Contingent Consideration |
|||||||||
| Balance at beginning of period |
$ | 128,208 | $ | 444,443 | $ | (2,374 | ) | |||||
| Total net gains or losses included in earnings (realized and unrealized) |
2,635,861 | 342,170 | (32,650 | ) | ||||||||
| Sales and settlements |
||||||||||||
| Purchases |
— | — | — | |||||||||
| Sales |
— | (9,620 | ) | — | ||||||||
| Settlements |
(1,580,842 | ) | — | 13,268 | ||||||||
| Transfers of IRLCs to closed loans |
(461,569 | ) | — | — | ||||||||
|
|
|
|
|
|
|
|||||||
| Balance at end of period |
$ | 721,658 | $ | 776,993 | $ | (21,756 | ) | |||||
|
|
|
|
|
|
|
|||||||
| (1) | Interest rate lock commitments include both assets and liabilities and are shown net. |
| (2) | Balance is net of $3.5 million servicing liability at September 30, 2020 |
F-24
Table of Contents
| Nine Months Ended September 30, 2019 | ||||||||||||
| (Dollars in thousands) |
Interest Rate Lock Commitments (1) |
Servicing Rights, net (2) |
Contingent Consideration |
|||||||||
| Balance at beginning of period |
$ | 60,466 | $ | 408,989 | $ | (961 | ) | |||||
| Total net gains or losses included in earnings (realized and unrealized) |
709,507 | 86,160 | (189 | ) | ||||||||
| Sales and settlements |
||||||||||||
| Purchases |
— | — | — | |||||||||
| Sales |
— | (148,234 | ) | — | ||||||||
| Settlements |
(448,788 | ) | — | 961 | ||||||||
| Transfers of IRLCs to closed loans |
(167,915 | ) | — | — | ||||||||
|
|
|
|
|
|
|
|||||||
| Balance at end of period |
$ | 153,270 | $ | 346,915 | $ | (189 | ) | |||||
|
|
|
|
|
|
|
|||||||
| (1) | Interest rate lock commitments include both assets and liabilities and are shown net. |
| (2) | Balance is net of $2.6 million servicing rights liability at September 30, 2019. |
The following presents the gains and losses included in earnings for the nine months ended September 30, 2020 and 2019 relating to the Company’s assets and liabilities that are measured at fair value on a recurring basis using significant unobservable inputs (Level 3):
| Nine Months Ended September 30, 2020 | ||||||||||||
| (Dollars in thousands) |
Interest Rate Lock Commitments (1) |
Servicing Rights, net (2) |
Contingent Consideration (3) |
|||||||||
| Total net gains (losses) included in earnings |
$ | 593,450 | $ | 342,170 | $ | (32,650 | ) | |||||
|
|
|
|
|
|
|
|||||||
| Change in unrealized gains (losses) relating to assets and liabilities still held at period end |
$ | 721,658 | $ | 457,478 | $ | (32,650 | ) | |||||
|
|
|
|
|
|
|
|||||||
| (1) | Gains (losses) included in gain on origination and sale of loans, net. |
| (2) | Includes $574.8 million in gains included in gain on origination and sale of loans, net and $232.6 million in losses included in change in fair value of servicing rights, net, for the nine months ended September 30, 2020. |
| (3) | Gains (losses) included in general and administrative expense. |
| Nine Months Ended September 30, 2019 | ||||||||||||
| (Dollars in thousands) |
Interest Rate Lock Commitments (1) |
Servicing Rights, net (2) |
Contingent Consideration (3) |
|||||||||
| Total net (losses) gains included in earnings |
$ | 92,804 | $ | 86,160 | $ | (189 | ) | |||||
|
|
|
|
|
|
|
|||||||
| Change in unrealized gains relating to assets and liabilities still held at period end |
$ | 153,270 | $ | 106,334 | $ | (189 | ) | |||||
|
|
|
|
|
|
|
|||||||
| (1) | Gains (losses) included in gain on origination and sale of loans, net. |
| (2) | Includes $205.7 million in gains included in gain on origination and sale of loans, net and $119.6 million in losses included in change in fair value of servicing rights, net, for the nine months ended September 30, 2019. |
| (3) | Gains (losses) included in general and administrative expense. |
F-25
Table of Contents
The following table presents quantitative information about the valuation techniques and unobservable inputs applied to Level 3 fair value measurements for financial instruments measured at fair value on a recurring basis:
| September 30, 2020 |
December 31, 2019 |
|||||||||||||||
| Unobservable Input |
Range of inputs |
Weighted Average |
Range of inputs | Weighted Average |
||||||||||||
| IRLCs: |
||||||||||||||||
| Pull-through rate |
1.0% - 99.9% | 73.3% | 2.4% - 99.9% | 67.6% | ||||||||||||
| Servicing rights: |
||||||||||||||||
| Discount rate |
5.0% - 10.0% | 6.3% | 5.0% - 10.0% | 7.2% | ||||||||||||
| Prepayment rate |
14.9% - 34.8% | 15.6% | 11.8% - 26.1% | 13.3% | ||||||||||||
| Cost to service (per loan) |
$71 - $137 | $96 | $71 - $121 | $103 | ||||||||||||
Financial Statement Items Measured at Fair Value on a Nonrecurring Basis
The Company did not have any material assets or liabilities that were recorded at fair value on a non-recurring basis as of September 30, 2020 and December 31, 2019.
Fair Value of Financial Instruments Carried at Amortized Cost
Financial instruments were either recorded at fair value or the carrying value approximated fair value. For financial instruments that were not recorded at fair value, including cash and cash equivalents, restricted cash, accounts receivable, accounts payable, and accrued expenses and other liabilities, their carrying values approximated fair value due to the short-term nature of such instruments.
The Company’s warehouse lines of credit bear interest at a rate that is periodically adjusted based on a market index. The carrying value of warehouse lines of credit approximates fair value.
The Company’s Secured Credit Facility stated rate of interest per annum is 30-day LIBOR plus a margin, and was the same as the market rate for this instrument as of September 30, 2020 and December 31, 2019. The carrying value of this Secured Credit Facility approximates fair value as of September 30, 2020 and December 31, 2019.
The Company’s $75.0 million Second Secured Credit Facility to finance servicing rights accrues interest at a base rate per annum of 30-day LIBOR plus a margin, and was the same as the market rate for this instrument as of September 30, 2020 and December 31, 2019. The carrying value of the Second Secured Credit Facility approximates fair value as of September 30, 2020 and December 31, 2019.
The Company’s $250.0 million Unsecured Term Loan accrues interest at a base rate per annum of 30-day LIBOR plus a margin, and was the same as the market rate for this instrument as of September 30, 2020 and December 31, 2019. The carrying value of the Second Unsecured Term Loan approximates fair value as of September 30, 2020 and December 31, 2019.
NOTE 4 – BALANCE SHEET NETTING
Certain derivatives, loan warehouse and repurchase agreements are subject to master netting arrangements or similar agreements. In certain circumstances the Company may elect to present certain financial assets, liabilities, and related collateral subject to master netting arrangements in a net position on the consolidated balance sheets. The Company did not meet these requirements, accordingly it does not report any of these financial assets or liabilities on a net basis, and presents them on a gross basis on the consolidated balance sheets.
F-26
Table of Contents
The table below represents financial assets and liabilities that are subject to master netting arrangements or similar agreements categorized by financial instrument, together with corresponding financial instruments and corresponding collateral received or pledged.
| September 30, 2020 | ||||||||||||||||||||||||
| Gross amounts of recognized assets (liabilities) |
Gross amounts offset in consolidated balance sheet |
Net amounts of assets (liabilities) presented in consolidated balance sheet |
Gross amounts not offset in consolidated balance sheet |
Net amount | ||||||||||||||||||||
| (Dollars in thousands) |
Financial instruments |
Cash collateral (received) pledged |
||||||||||||||||||||||
| Assets |
||||||||||||||||||||||||
| Forward delivery contracts |
$ | 32,919 | $ | (32,844 | ) | $ | 75 | $ | — | $ | — | $ | 75 | |||||||||||
|
|
|
|
|
|
|
|
|
|
|
|
|
|||||||||||||
| Total Assets |
$ | 32,919 | $ | (32,844 | ) | $ | 75 | $ | — | $ | — | $ | 75 | |||||||||||
|
|
|
|
|
|
|
|
|
|
|
|
|
|||||||||||||
| Liabilities |
||||||||||||||||||||||||
| Forward delivery contracts |
$ | (90,401 | ) | $ | 32,844 | $ | (57,557 | ) | $ | — | $ | — | $ | (57,557 | ) | |||||||||
| Put options on treasuries |
(928 | ) | — | (928 | ) | — | — | (928 | ) | |||||||||||||||
| Interest rate swap futures |
(531 | ) | — | (531 | ) | — | — | (531 | ) | |||||||||||||||
| Warehouse lines of credit |
(4,601,062 | ) | — | (4,601,062 | ) | 4,805,413 | 6,205 | 210,556 | ||||||||||||||||
| Debt obligations |
(385,000 | ) | — | (385,000 | ) | 777,113 | 12,589 | 404,702 | ||||||||||||||||
|
|
|
|
|
|
|
|
|
|
|
|
|
|||||||||||||
| Total Liabilities |
$ | (5,077,922 | ) | $ | 32,844 | $ | (5,045,078 | ) | $ | 5,582,526 | $ | 18,794 | $ | 556,242 | ||||||||||
|
|
|
|
|
|
|
|
|
|
|
|
|
|||||||||||||
| December 31, 2019 | ||||||||||||||||||||||||
| Gross amounts of recognized assets (liabilities) |
Gross amounts offset in consolidated balance sheet |
Net amounts of assets (liabilities) presented in consolidated balance sheet |
Gross amounts not offset in consolidated balance sheet |
Net amount | ||||||||||||||||||||
| (Dollars in thousands) |
Financial instruments |
Cash collateral (received) pledged |
||||||||||||||||||||||
| Assets |
||||||||||||||||||||||||
| Forward delivery contracts |
$ | 9,881 | $ | (8,536 | ) | $ | 1,345 | $ | — | $ | (339 | ) | $ | 1,006 | ||||||||||
|
|
|
|
|
|
|
|
|
|
|
|
|
|||||||||||||
| Total Assets |
$ | 9,881 | $ | (8,536 | ) | $ | 1,345 | $ | — | $ | (339 | ) | $ | 1,006 | ||||||||||
|
|
|
|
|
|
|
|
|
|
|
|
|
|||||||||||||
| Liabilities |
||||||||||||||||||||||||
| Forward delivery contracts |
$ | (15,523 | ) | $ | 8,536 | $ | (6,987 | ) | $ | — | $ | — | $ | (6,987 | ) | |||||||||
| Interest rate swap futures |
(1,316 | ) | — | (1,316 | ) | — | — | (1,316 | ) | |||||||||||||||
| Warehouse lines of credit |
(3,466,567 | ) | — | (3,466,567 | ) | 3,633,066 | 4,352 | 170,851 | ||||||||||||||||
| Debt obligations |
(295,900 | ) | — | (295,900 | ) | 439,063 | 35,330 | 178,493 | ||||||||||||||||
|
|
|
|
|
|
|
|
|
|
|
|
|
|||||||||||||
| Total Liabilities |
$ | (3,779,306 | ) | $ | 8,536 | $ | (3,770,770 | ) | $ | 4,072,129 | $ | 39,682 | $ | 341,041 | ||||||||||
|
|
|
|
|
|
|
|
|
|
|
|
|
|||||||||||||
The Company has entered into agreements with counterparties, which include netting arrangements whereby the counterparties are entitled to settle their positions on a net basis. In certain circumstances, the Company is required to provide certain counterparties collateral against derivative financial instruments, warehouse lines of credit or debt obligations. As of September 30, 2020 and December 31, 2019, counterparties held $6.2 million and $4.4 million, respectively, of the Company’s cash and cash equivalents in margin accounts as collateral (which is classified as restricted cash on the Company’s consolidated balance sheets).
F-27
Table of Contents
NOTE 5 – LOANS HELD FOR SALE, AT FAIR VALUE
The following table represents the unpaid principal balance of LHFS by product type of loan as of September 30, 2020 and December 31, 2019:
| September 30, 2020 |
December 31, 2019 |
|||||||||||||||
| (Dollars in thousands) |
Amount | % | Amount | % | ||||||||||||
| Conforming - fixed |
$ | 3,824,060 | 81 | % | $ | 2,553,986 | 71 | % | ||||||||
| Conforming - ARM |
36,407 | 1 | 35,345 | 1 | ||||||||||||
| Government - fixed |
694,545 | 15 | 527,755 | 15 | ||||||||||||
| Government - ARM |
59,737 | 1 | 47,900 | 1 | ||||||||||||
| Other - residential mortgage loans |
80,274 | 2 | 436,934 | 12 | ||||||||||||
| Consumer loans |
2,740 | — | 3,492 | — | ||||||||||||
|
|
|
|
|
|
|
|
|
|||||||||
| 4,697,763 | 100 | % | 3,605,412 | 100 | % | |||||||||||
| Fair value adjustment |
190,601 | 76,428 | ||||||||||||||
|
|
|
|
|
|||||||||||||
| Total |
$ | 4,888,364 | $ | 3,681,840 | ||||||||||||
|
|
|
|
|
|||||||||||||
A summary of the changes in the balance of loans held for sale is as follows:
| Nine Months Ended September 30, |
||||||||
| (Dollars in thousands) |
2020 | 2019 | ||||||
| Balance at beginning of period |
$ | 3,681,840 | $ | 2,295,451 | ||||
| Origination and purchase of loans |
63,183,309 | 29,008,961 | ||||||
| Sales |
(62,192,701 | ) | (28,235,361 | ) | ||||
| Repurchases |
145,049 | 93,990 | ||||||
| Principal payments |
(43,306 | ) | (85,286 | ) | ||||
| Fair value gain |
114,173 | 3,646 | ||||||
|
|
|
|
|
|||||
| Balance at end of period |
$ | 4,888,364 | $ | 3,081,401 | ||||
|
|
|
|
|
|||||
Gain on origination and sale of loans, net is comprised of the following components:
| Nine Months Ended September 30, |
||||||||
| (Dollars in thousands) |
2020 | 2019 | ||||||
| Premium from loan sales |
$ | 2,125,730 | $ | 664,327 | ||||
| Servicing rights |
574,768 | 205,745 | ||||||
| Unrealized gains from derivative assets and liabilities |
519,465 | 123,302 | ||||||
| Realized losses from derivative assets and liabilities |
(372,029 | ) | (149,354 | ) | ||||
| Discount points, rebates and lender paid costs |
(72,031 | ) | (52,543 | ) | ||||
| Mark to market gain on loans held for sale |
114,173 | 3,621 | ||||||
| Provision for loan loss obligation for loans sold |
(16,621 | ) | (7,044 | ) | ||||
|
|
|
|
|
|||||
| $ | 2,873,455 | $ | 788,054 | |||||
|
|
|
|
|
|||||
The Company had $22.3 million and $21.5 million of loans held for sale on non-accrual status as of September 30, 2020 and December 31, 2019, respectively.
F-28
Table of Contents
Continuing Involvement in Loans Sold through Servicing Arrangements
Loans eligible for repurchase represents certain mortgage loans sold pursuant to Government National Mortgage Association (“Ginnie Mae”) programs where the Company, as servicer, has the unilateral option to repurchase the loan if certain criteria are met, including if a loan is greater than 90 days delinquent. Regardless of whether the repurchase option has been exercised, the Company must recognize eligible loans and a corresponding repurchase liability in its consolidated balance sheets.
The balances of Ginnie Mae serviced loans that were 90 or more days past due at September 30, 2020 and December 31, 2019 totaled $1.18 billion and $197.8 million, respectively, and represent loans that the Company is eligible to repurchase from Ginnie Mae guaranteed securitizations as part of its contractual obligations as the servicer of the loans. The terms of the Ginnie Mae MBS program allow, but do not require, the Company to repurchase mortgage loans when the borrower has made no payments for three consecutive months. As a result of this right, the Company records the loans in loans eligible for repurchase and records a corresponding liability in liability for loans eligible for repurchase on its consolidated balance sheets.
NOTE 6 – SERVICING RIGHTS, AT FAIR VALUE
The outstanding principal balance of the servicing portfolio was comprised of the following:
| (Dollars in thousands) |
September 30, 2020 |
December 31, 2019 |
||||||
| Conventional |
$ | 49,747,418 | $ | 14,250,476 | ||||
| Government |
27,424,580 | 22,085,650 | ||||||
|
|
|
|
|
|||||
| Total servicing portfolio |
$ | 77,171,998 | $ | 36,336,126 | ||||
|
|
|
|
|
|||||
A summary of the unpaid principal balance underlying servicing rights is as follows:
| (Dollars in thousands) |
September 30, 2020 |
December 31, 2019 |
||||||
| Current loans |
$ | 74,587,742 | $ | 35,706,264 | ||||
| Loans 30 - 89 days delinquent |
891,361 | 328,040 | ||||||
| Loans 90 or more days delinquent or in foreclosure |
1,692,895 | 301,822 | ||||||
|
|
|
|
|
|||||
| Total servicing portfolio (1) |
$ | 77,171,998 | $ | 36,336,126 | ||||
|
|
|
|
|
|||||
| (1) | At September 30, 2020, 3.4% of the servicing portfolio was in forbearance as a result of payment relief efforts afforded to borrowers as a result of the Coronavirus Aid, Relief, and Economic Security Act and other regulatory guidance. |
A summary of the changes in the balance of servicing rights is as follows:
| Nine Months Ended September 30, |
||||||||
| (Dollars in thousands) |
2020 | 2019 | ||||||
| Balance at beginning of period |
$ | 444,443 | $ | 408,989 | ||||
| Additions |
574,768 | 205,745 | ||||||
| Sales proceeds, net |
(9,620 | ) | (148,234 | ) | ||||
| Changes in fair value: |
||||||||
| Due to changes in valuation inputs or assumptions |
(112,059 | ) | (64,602 | ) | ||||
| Other changes in fair value |
(120,539 | ) | (54,983 | ) | ||||
|
|
|
|
|
|||||
| Balance at end of period (1) |
$ | 776,993 | $ | 346,915 | ||||
|
|
|
|
|
|||||
F-29
Table of Contents
| (1) | Balance is net of $3.5 million and $2.6 million servicing rights liability at September 30, 2020 and 2019, respectively. |
The following is a summary of the components of loan servicing fee income as reported in the Company’s consolidated statements of operations:
| Nine Months Ended September 30, |
||||||||
| (Dollars in thousands) |
2020 | 2019 | ||||||
| Contractual servicing fees |
$ | 112,917 | $ | 70,446 | ||||
| Late, ancillary and other fees |
8,603 | 14,576 | ||||||
|
|
|
|
|
|||||
| $ | 121,520 | $ | 85,022 | |||||
|
|
|
|
|
|||||
The following is a summary of the components of changes in fair value of servicing rights, net as reported in the Company’s consolidated statements of operations:
| Nine Months Ended September 30, |
||||||||
| (Dollars in thousands) |
2020 | 2019 | ||||||
| Changes in fair value: |
||||||||
| Due to changes in valuation inputs or assumptions |
$ | (112,059 | ) | $ | (64,602 | ) | ||
| Other changes in fair value |
(120,539 | ) | (54,983 | ) | ||||
| Realized gains (losses) on sales of servicing rights |
(2,549 | ) | (3,823 | ) | ||||
| Net gain from derivatives hedging servicing rights |
19,015 | 23,357 | ||||||
|
|
|
|
|
|||||
| Changes in fair value of servicing rights, net |
$ | (216,132 | ) | $ | (100,051 | ) | ||
|
|
|
|
|
|||||
The table below illustrates hypothetical changes in fair values of servicing rights, caused by assumed immediate changes to key assumptions that are used to determine fair value.
| Servicing Rights Sensitivity Analysis (Dollars in thousands) |
September 30, 2020 |
December 31, 2019 |
||||||
| Fair Value of Servicing Rights, net |
$ | 776,993 | $ | 444,443 | ||||
| Change in Fair Value from adverse changes: |
||||||||
| Discount Rate: |
||||||||
| Increase 1% |
(30,019 | ) | (17,750 | ) | ||||
| Increase 2% |
(57,457 | ) | (33,553 | ) | ||||
| Cost of Servicing: |
||||||||
| Increase 10% |
(8,795 | ) | (5,542 | ) | ||||
| Increase 20% |
(17,345 | ) | (10,484 | ) | ||||
| Prepayment Speed: |
||||||||
| Increase 10% |
(48,104 | ) | (18,059 | ) | ||||
| Increase 20% |
(92,130 | ) | (34,227 | ) | ||||
Sensitivities are hypothetical changes in fair value and cannot be extrapolated because the relationship of changes in assumptions to changes in fair value may not be linear. Also, the effect of a variation in a particular assumption is calculated without changing any other assumption, whereas a change in one factor may result in changes to another. Accordingly, no assurance can be given that actual results would be consistent with the results of these estimates. As a result, actual future changes in servicing rights values may differ significantly from those displayed above.
F-30
Table of Contents
NOTE 7 – DERIVATIVE FINANCIAL INSTRUMENTS AND HEDGING ACTIVITIES
Derivatives instruments utilized by the Company primarily include IRLCs, AOT, TBA MBS, and out-of-the-money put options on 10-year treasury futures to hedge interest rate risk. See Note 3 - Fair Value for further details on derivatives.
The following summarizes the Company’s outstanding derivative instruments:
| Fair Value | ||||||||||||||
| (Dollars in thousands) |
Notional | Balance Sheet Location |
Asset | Liability | ||||||||||
| September 30, 2020: | ||||||||||||||
| Interest rate lock commitments - assets |
$ | 30,269,263 | Derivative asset, at fair value |
$ | 722,074 | $ | — | |||||||
| Interest rate lock commitments - liabilities |
158,873 | Derivative liabilities, at fair value |
— | (416 | ) | |||||||||
| Forward sales contracts - assets |
541,943 | Derivative asset, at fair value |
75 | — | ||||||||||
| Forward sales contracts - liabilities |
40,109,232 | Derivative liabilities, at fair value |
— | (57,557 | ) | |||||||||
| Put options on treasuries - assets |
— | Derivative asset, at fair value |
— | — | ||||||||||
| Put options on treasuries - liabilities |
24,403 | Derivative liabilities, at fair value |
— | (928 | ) | |||||||||
| Interest rate swap futures - assets |
— | Derivative asset, at fair value |
— | — | ||||||||||
| Interest rate swap futures - liabilities |
2,075 | Derivative liabilities, at fair value |
— | (531 | ) | |||||||||
|
|
|
|
|
|
|
|||||||||
| Total derivative financial instruments |
$ | 71,105,789 | $ | 722,149 | $ | (59,432 | ) | |||||||
|
|
|
|
|
|
|
|||||||||
| Fair Value | ||||||||||||||
| (Dollars in thousands) |
Notional | Balance Sheet Location |
Asset | Liability | ||||||||||
| December 31, 2019: | ||||||||||||||
| Interest rate lock commitments - assets |
$ | 8,476,366 | Derivative asset, at fair value |
$ | 129,883 | $ | — | |||||||
| Interest rate lock commitments - liabilities |
423,009 | Derivative liabilities, at fair value |
— | (1,674 | ) | |||||||||
| Forward sales contracts - assets |
5,829,039 | Derivative asset, at fair value |
1,345 | — | ||||||||||
| Forward sales contracts - liabilities |
7,867,153 | Derivative liabilities, at fair value |
— | (6,987 | ) | |||||||||
| Put options on treasuries - assets |
— | Derivative asset, at fair value |
— | — | ||||||||||
| Put options on treasuries - liabilities |
14,260 | Derivative liabilities, at fair value |
— | — | ||||||||||
| Interest rate swap futures - assets |
— | Derivative asset, at fair value |
— | — | ||||||||||
| Interest rate swap futures - liabilities |
1,000 | Derivative liabilities, at fair value |
— | (1,316 | ) | |||||||||
|
|
|
|
|
|
|
|||||||||
| Total derivative financial instruments |
$ | 22,610,827 | $ | 131,228 | $ | (9,977 | ) | |||||||
|
|
|
|
|
|
|
|||||||||
Because many of the Company’s current derivative agreements are not exchange-traded, the Company is exposed to credit loss in the event of nonperformance by the counterparty to the agreements. The Company controls this risk through credit monitoring procedures including financial analysis, dollar limits and other monitoring procedures. The notional amount of the contracts does not represent the Company’s exposure to credit loss.
The following summarizes the realized and unrealized net gains and (losses) on derivative financial instruments and the consolidated statements of operations line items where such gains and losses were included:
| (Dollars in thousands) | Nine Months Ended September 30, |
|||||||||
| Derivative instrument |
Statements of Operations Location |
2020 | 2019 | |||||||
| Interest rate lock commitments, net |
Gain on origination and sale of loans, net | $ | 593,450 | $ | 92,804 | |||||
| Forward sales contracts (1) |
Gain on origination and sale of loans, net | (423,870 | ) | (116,221 | ) | |||||
| Put options on treasuries |
Gain on origination and sale of loans, net | (16,404 | ) | (2,635 | ) | |||||
| Put options on treasuries |
Change in fair value of servicing rights, net | (1,259 | ) | — | ||||||
| Interest rate swap futures |
Change in fair value of servicing rights, net | 20,274 | 23,357 | |||||||
|
|
|
|
|
|||||||
| Total realized and unrealized gains (losses) on derivative financial instruments |
$ | 172,191 | $ | (2,695 | ) | |||||
|
|
|
|
|
|||||||
| (1) | Amounts include pair-off settlements. |
F-31
Table of Contents
NOTE 8 – VARIABLE INTEREST ENTITIES
Mortgage loans are primarily sold to the Federal National Mortgage Association (“FNMA”) or Federal Home Loan Mortgage Corporation (“FHLMC”) or transferred into pools of Government National Mortgage Association (“GNMA”) mortgage-backed securities (“MBS”) (collectively, the Government-Sponsored Entities, or “GSEs”). The Company also sells mortgage loans to non-GSE third parties. The Company has continuing involvement in mortgage loans sold through servicing arrangements and the liability for loan indemnifications and repurchases under the representations and warranties it makes to the investors and insurers of the loans it sells. The Company is exposed to interest rate risk through its continuing involvement with mortgage loans sold, including servicing rights, as the value of the asset fluctuates as changes in interest rates impact borrower prepayment.
All loans are sold on a non-recourse basis; however, certain representations and warranties have been made that are customary for loan sale transactions, including eligibility characteristics of the mortgage loans and underwriting responsibilities, in connection with the sales of these assets.
Loans held for sale are considered sold when the Company surrenders control over the financial assets and such financial assets are legally isolated from the Company in the event of bankruptcy. If the sale criteria are not met, the transfer is recorded as a secured borrowing in which the assets remain on the balance sheet and the proceeds from the transaction are recognized as a liability.
Securitizations
The Company originates and services mortgage loans. Mortgage loans are primarily sold to GSEs who then securitize these loans as previously discussed. The Company executes private-label securitizations to finance mortgage loans and mortgage servicing rights. The associated securitization entities are consolidated on the consolidated balance sheets.
In executing a securitization transaction, the Company sell assets (financial and non-financial) to a wholly-owned, bankruptcy-remote SPE, which then transfers the financial assets to a separate, transaction-specific SPE for cash, and other retained interests. The securitization entity is funded through the issuance of beneficial interests in the securitized assets. The beneficial interests take the form of either notes or trust certificates, which are sold to investors and/or retained by the Company. These beneficial interests are collateralized by the transferred assets and entitle the investors to specified cash flows generated from the underlying assets. In addition to providing a source of liquidity and cost-efficient funding, securitizing these assets also reduces the Company’s credit exposure to the borrowers beyond any economic interest the Company may retain.
Each securitization is governed by various legal documents that limit and specify the activities of the securitization entity. The securitization entity is generally allowed to acquire the financial assets, to issue beneficial interests to investors to fund the acquisition of the assets, and to enter into derivatives or other yield maintenance contracts to hedge or mitigate certain risks related to the assets or beneficial interests of the entity. A servicer, who is generally the Company, is appointed pursuant to the underlying legal documents to service the assets the securitization entity holds and the beneficial interests it issues. Servicing functions include, but are not limited to, general collection activity on current and noncurrent accounts, loss mitigation efforts including repossession and sale of collateral, as well as preparing and furnishing statements summarizing the asset and beneficial interest performance. These servicing responsibilities constitute continued involvement in the transferred assets.
Cash flows from the assets transferred into the securitization entity represent the sole source for payment of distributions on the beneficial interests issued by the securitization entity and for payments to the parties that perform services for the securitization entity, such as the servicer or the trustee.
The Company holds retained beneficial interests in the securitizations including, but not limited to, subordinated securities and residuals; and other residual interests. These retained interests may represent a form
F-32
Table of Contents
of significant continuing economic interests. Certain of these retained interests provide credit enhancement to the trust as they may absorb credit losses or other cash shortfalls.
The Company holds certain conditional repurchase options specific to securitizations that allow it to repurchase assets from the securitization entity. The majority of the securitizations provide the Company, as servicer, with a call option that allows us to repurchase the remaining transferred financial assets or redeem outstanding beneficial interests at the Company’s discretion once the asset pool reaches a predefined level, which represents the point where servicing becomes burdensome (a clean-up call option). The repurchase price is typically the discounted securitization balance of the assets plus accrued interest when applicable. The Company generally has discretion regarding when or if it will exercise these options, but would do so only when it is in the Company’s best interest.
Other than customary representation and warranty provisions, these securitizations are nonrecourse to the Company, thereby transferring the risk of future credit losses to the extent the beneficial interests in the securitization entities are held by third parties. Representation and warranty provisions generally require the Company to repurchase assets or indemnify the investor or other party for incurred losses to the extent it is determined that the assets were ineligible or were otherwise defective at the time of sale. The Company did not provide any non-contractual financial support to these entities during nine months ended September 30, 2020 and 2019.
Consolidation of Variable Interest Entities
The determination of whether the assets and liabilities of the VIEs are consolidated in the consolidated balance sheets or not consolidated in the consolidated balance sheets depends on the terms of the related transaction and the Company’s continuing involvement (if any) with the VIE. The Company is deemed the primary beneficiary and therefore consolidates VIEs for which it has both (a) the power, through voting rights or similar rights, to direct the activities that most significantly impact the VIE’s economic performance, and (b) benefits, as defined, from the VIE. The Company determines whether it holds a significant variable interest in a VIE based on a consideration of both qualitative and quantitative factors regarding the nature, size, and form of its involvement with the VIE. The Company assesses whether it is the primary beneficiary of a VIE on an ongoing basis.
The Company is generally determined to be the primary beneficiary in VIEs established for its securitization activities when it has a controlling financial interest in the VIE, primarily due to its servicing activities and because it holds a beneficial interest in the VIE that could be potentially significant (in certain cases). The consolidated VIEs included in the consolidated balance sheets represent separate entities with which the Company is involved. The third-party investors in the obligations of consolidated VIEs have legal recourse only to the assets of the VIEs and do not have such recourse to the Company, except for the customary representation and warranty provisions. In addition, the cash flows from the assets are restricted only to pay such liabilities. Thus, the Company’s economic exposure to loss from outstanding third-party financing related to consolidated VIEs is limited to the carrying value of the consolidated VIE assets. Generally, all assets of consolidated VIEs, presented below based upon the legal transfer of the underlying assets in order to reflect legal ownership, are restricted for the benefit of the beneficial interest holders.
The nature, purpose, and activities of nonconsolidated VIEs currently encompass the Company’s use of joint venture entities with home builders, real estate brokers and commercial real estate companies to provide loan origination services and real estate settlement services to the customers referred to the joint ventures by the Company’s joint venture partners. The Company is generally not determined to be the primary beneficiary in its joint venture VIEs because it does not have the power, through voting rights or similar rights, to direct the activities that most significantly impact the economic performance of the VIE. The Company does not consolidate these entities because it does not meet the VIE guidance for consolidation, primarily because the Company does not have the power, through voting rights or similar rights, to direct the activities that most significantly impact the VIE’s economic performance.
F-33
Table of Contents
The Company’s pro rata share of net earnings of joint ventures was $6.7 million and $9.2 million for the nine months ended September 30, 2020 and 2019, respectively. The following table presents the Company’s involvement in consolidated and nonconsolidated VIEs in which the Company holds variable interests.
| September 30, 2020 | ||||||||||||
| (Dollars in thousands) |
Net carrying amount of total assets |
Carrying amount of total liabilities |
Maximum exposure to loss in non- consolidated VIEs |
|||||||||
| Consolidated variable interest entities |
||||||||||||
| Mortgage loans & restricted cash |
$ | 832,489 | $ | 800,000 | N/A | |||||||
| GNMA mortgage servicing rights |
286,133 | 213,517 | N/A | |||||||||
|
|
|
|
|
|||||||||
| $ | 1,118,622 | $ | 1,013,517 | |||||||||
|
|
|
|
|
|||||||||
| Non-consolidated variable interest entities |
||||||||||||
| Joint Ventures |
$ | 10,229 | $ | 8,254 | $ | 16,773 | ||||||
| December 31, 2019 | ||||||||||||
| (Dollars in thousands) |
Net carrying amount of total assets |
Carrying amount of total liabilities |
Maximum exposure to loss in non- consolidated VIEs |
|||||||||
| Consolidated variable interest entities |
||||||||||||
| Mortgage loans |
$ | 807,599 | $ | 800,000 | N/A | |||||||
| GNMA mortgage servicing rights |
281,255 | 213,149 | N/A | |||||||||
|
|
|
|
|
|||||||||
| $ | 1,088,854 | $ | 1,013,149 | |||||||||
|
|
|
|
|
|||||||||
| Non-consolidated variable interest entities |
||||||||||||
| Joint Ventures |
$ | 15,113 | $ | 12,716 | $ | 17,030 | ||||||
NOTE 9 – WAREHOUSE AND OTHER LINES OF CREDIT
At September 30, 2020, the Company is a party to 13 lines of credit with lenders providing $5.5 billion of warehouse and revolving credit facilities. The warehouse and revolving credit facilities are used to fund, and are secured by, residential mortgage loans held for sale. Interest expense from warehouse and revolving lines of credit is recorded to interest expense.
In October 2018, the Company issued notes through a securitization facility (“2018 Securitization Facility”) backed by a revolving warehouse line of credit. The 2018 Securitization Facility is secured by newly originated, first-lien, fixed rate residential mortgage loans eligible for purchase by the GSEs as well as non-GSE eligible jumbo mortgage loans. The 2018 Securitization Facility issued $300.0 million in notes and certificates that bear interest at 30-day LIBOR plus a margin. The 2018 Securitization Facility will terminate on the earlier of (i) the two-year anniversary of the initial purchase date, (ii) upon the Company exercising its right to optional prepayment in full and (iii) the date of the occurrence and continuance of an event of default. In October 2019, the Company repaid $100.0 million in notes and certificates of the 2018 Securitization Facility. In October 2020, the Company repaid the remaining $200.0 million in notes and certificates.
In May 2019, the Company issued notes through a new securitization facility (“2019-1 Securitization Facility”) backed by a revolving warehouse line of credit. The 2019-1 Securitization Facility is secured by newly originated, first-lien, fixed rate or adjustable rate, residential mortgage loans which are originated in accordance with the criteria of Fannie Mae or Freddie Mac for the purchase of mortgage loans or in accordance with the criteria of Ginnie Mae for the guarantee of securities backed by mortgage loans. The 2019-1 Securitization Facility issued $300.0 million in notes and certificates that bear interest at 30-day LIBOR plus a margin. The
F-34
Table of Contents
2019-1 Securitization Facility will terminate on the earlier of (i) the two-year anniversary of the initial purchase date, (ii) upon the Company exercising its right to optional prepayment in full and (iii) the date of the occurrence and continuance of an event of default.
In October 2019, the Company issued notes through an additional securitization facility (“2019-2 Securitization Facility” or collectively with the 2018 Securitization Facility and the 2019-1 Securitization Facility discussed above, the “Securitization Facilities”) backed by a revolving warehouse line of credit. The 2019-2 Securitization Facility is secured by newly originated, first-lien, fixed rate or adjustable rate, residential mortgage loans which are originated in accordance with the criteria of Fannie Mae or Freddie Mac for the purchase of mortgage loans or in accordance with the criteria of Ginnie Mae for the guarantee of securities backed by mortgage loans. The 2019-2 Securitization Facility issued $300.0 million in notes and certificates that bear interest at 30-day LIBOR plus a margin. The 2019-2 Securitization Facility will terminate on the earlier of (i) the two-year anniversary of the initial purchase date, (ii) upon the Company exercising its right to optional prepayment in full and (iii) the date of the occurrence and continuance of an event of default.
The warehouse and revolving lines of credit are repaid using proceeds from the sale of loans. The base interest rates on the Company’s warehouse lines bear interest at 30-day LIBOR plus a margin. Some of the lines carry additional fees in the form of annual facility fees charged on the total line amount, commitment fees charged on the committed portion of the line and non-usage fees charged when monthly usage falls below a certain utilization percentage. The weighted average interest rate at September 30, 2020 totaled 2.50%. The Company’s warehouse lines are scheduled to expire in 2020 and 2021 under one year terms and all lines are subject to renewal based on an annual credit review conducted by the lender. The Company’s Securitization Facilities’ notes have two year terms and are due October 25, 2020, May 14, 2021 and October 23, 2021.
The base interest rates for all warehouse lines of credit are subject to increase based upon the characteristics of the underlying loans collateralizing the lines of credit, including, but not limited to product type and number of days held for sale. Certain of the warehouse line lenders require the Company, at all times, to maintain cash accounts with minimum required balances. As of September 30, 2020 and December 31, 2019, there was $6.2 million and $4.4 million, respectively, held in these accounts which are recorded as a component of restricted cash on the consolidated balance sheets.
Under the terms of these warehouse lines, the Company is required to maintain various financial and other covenants. These financial covenants include, but are not limited to, maintaining (i) minimum tangible net worth, (ii) minimum liquidity, (iii) a minimum current ratio, (iv) a maximum distribution requirement, (v) a maximum leverage ratio, (vi) pre-tax net income requirements and (vii) a maximum warehouse capacity ratio. As of September 30, 2020, the Company was in compliance with all warehouse lending related covenants.
F-35
Table of Contents
The following table presents certain information on warehouse borrowings at September 30, 2020 and December 31, 2019:
| Outstanding Balance | ||||||||||||||||
| (Dollars in thousands) |
Facility Amount |
September 30, 2020 |
December 31, 2019 |
Expiration Date |
||||||||||||
| Facility 1 (1) |
$ | 1,000,000 | $ | 1,138,019 | $ | 637,148 | 10/30/2020 | |||||||||
| Facility 2 (2) |
600,000 | 459,655 | 308,890 | 9/27/2021 | ||||||||||||
| Facility 3 |
225,000 | 139,338 | 124,646 | 4/20/2021 | ||||||||||||
| Facility 4 (3) |
400,000 | 334,732 | 166,090 | 7/9/2021 | ||||||||||||
| Facility 5 |
340,000 | 260,113 | 239,541 | 1/6/2021 | ||||||||||||
| Facility 6 (4) |
200,000 | 1,396 | 668 | N/A | ||||||||||||
| Facility 7 (5) |
600,000 | 500,806 | 458,115 | 10/31/2020 | ||||||||||||
| Facility 8 (6) |
500,000 | 482,366 | 599,396 | 5/5/2021 | ||||||||||||
| Facility 9 (7) |
200,000 | 200,000 | 197,874 | 10/25/2020 | ||||||||||||
| Facility 10 (8) |
300,000 | 300,000 | 295,244 | 5/14/2021 | ||||||||||||
| Facility 11 (8) |
300,000 | 300,000 | 295,043 | 10/23/2021 | ||||||||||||
| Facility 12 |
500,000 | 257,426 | 143,912 | N/A | ||||||||||||
| Facility 13 (9) |
350,000 | 227,211 | — | 8/25/2021 | ||||||||||||
|
|
|
|
|
|
|
|||||||||||
| Total |
$ | 5,515,000 | $ | 4,601,062 | $ | 3,466,567 | ||||||||||
|
|
|
|
|
|
|
|||||||||||
| (1) | The total facility is available both to fund loan originations and also provide liquidity under a gestation facility to finance recently sold MBS up to the MBS settlement date. In October 2020, the expiration date was extended to October 2021. The Company received a temporary approval to borrow in excess of the total facility amount. |
| (2) | In addition to the $600.0 million Warehouse Line, the lender provides a separate gestation facility to finance recently sold MBS up to the MBS settlement date. |
| (3) | In addition to the $334.7 million outstanding balance secured by mortgage loans, the Company has $20.0 million outstanding to finance servicing rights. |
| (4) | In addition to the $200.0 million Warehouse Line, the lender provides a separate gestation facility to finance recently sold MBS up to the MBS settlement date. |
| (5) | In addition to the $600.0 million Warehouse Line, the lender provides a separate gestation facility to finance recently sold MBS up to the MBS settlement date. In October 2020, the expiration date was extended to October 2021. In November 2020, this facility was increased to $800.0 million. |
| (6) | In December 2020, this facility was increased to $1.5 billion. In addition to the $482.4 million outstanding balance secured by mortgage loans, the Company has $15.0 million outstanding to finance servicing rights included within debt obligations in the consolidated balance sheets. |
| (7) | Securitization backed by a revolving warehouse facility to finance newly originated first-lien fixed rate mortgage loans. In October 2020, the Company paid off this facility. |
| (8) | Securitization backed by a revolving warehouse facility to finance newly originated first-lien fixed and adjustable rate mortgage loans. |
| (9) | This facility is available both to fund loan originations and also provide gestation liquidity to finance recently sold MBS up to the MBS settlement date. |
The following table presents certain information on warehouse borrowings:
| Nine Months Ended September 30, |
||||||||
| (Dollars in thousands) |
2020 | 2019 | ||||||
| Maximum outstanding balance during the period |
$ | 4,622,250 | $ | 3,488,324 | ||||
| Average balance outstanding during the period |
3,433,434 | 2,441,442 | ||||||
| Collateral pledged (loans held for sale) |
4,805,413 | 3,056,145 | ||||||
| Weighted average interest rate during the period |
2.65 | % | 4.17 | % | ||||
F-36
Table of Contents
NOTE 10 – DEBT OBLIGATIONS
Secured Credit Facilities
Original Secured Credit Facility. The Company entered into a $25.0 million revolving secured credit facility (the “Original Secured Credit Facility”) in October 2014 to finance servicing rights and for other working capital needs and general corporate purposes. The Company has entered into subsequent amendments with the lender both increasing and decreasing the size of the facility. At September 30, 2020, capacity under the facility was $150.0 million. The Original Secured Credit Facility is secured by servicing rights, matures in June 2021 and accrues interest at a base rate per annum of 30-day LIBOR plus a margin per annum. As of September 30, 2020, the outstanding balance under the Original Secured Credit Facility was $150.0 million. The Company has pledged $274.0 million in fair value of servicing rights as collateral to secure outstanding advances under the Original Secured Credit Facility. Advances for servicing rights are determined using a borrowing base formula calculated against the fair market value of the pledged servicing rights. Under the Original Secured Credit Facility, the Company is required to satisfy certain financial covenants, including minimum tangible net worth, minimum liquidity, maximum leverage and debt service coverage. As of September 30, 2020, the Company was in compliance with all such covenants.
Second Secured Credit Facility. The Company amended one of its Warehouse Line facilities to provide a $50.0 million sub-limit to finance servicing rights and for other working capital needs and general corporate purposes (the “Second Secured Credit Facility”) in May 2015. As of September 30, 2020, total capacity under the Warehouse Line facility was $400.0 million and is available to fund a combination of loans and servicing rights, subject to a $100.0 million sub-limit to finance servicing rights. As of September 30, 2020, $20.0 million was outstanding under the Second Secured Credit Facility. The Company has pledged $217.0 million in fair value of servicing rights as collateral to secure outstanding advances related to the sub-limit. Advances for servicing rights are determined using a borrowing base formula calculated against the fair market value of the pledged servicing rights. In July 2020, the Second Secured Credit Facility was increased to $100.0 million and the maturity date was extended to July 2021. The Second Secured Credit Facility accrues interest at a base rate per annum of 30-day LIBOR plus a margin per annum. If the Second Secured Credit Facility is not renewed or extended at the expiration date, the Company has the option to convert the outstanding principal balance to a term loan that accrues interest at a base rate per annum of 30-day LIBOR plus 5.75% and is due two years from the conversion date (“Term Loan”). The Term Loan requires monthly principal and interest payments based on a five year amortization period. Under the Second Secured Credit Facility, the Company is required to satisfy certain financial covenants, including minimum tangible net worth, minimum liquidity, maximum leverage and profitability requirements. As of September 30, 2020, the Company was in compliance with all such covenants.
GMSR Trust. The Company entered into a master repurchase agreement with one of its wholly-owned subsidiaries, loanDepot GMSR Master Trust (“GMSR Trust”) in August 2017 to finance Ginnie Mae mortgage servicing rights (the “GNMA MSRs”) owned by the Company (the “GNMA MSR Facility”) pursuant to the terms of a base indenture (the “GNMA MSR Indenture”). The Company pledged participation certificates representing beneficial interests in GNMA MSRs to the GMSR Trust. The Company is party to an acknowledgment agreement with Ginnie Mae whereby we may, from time to time pursuant to the terms of any supplemental indenture, issue to institutional investors variable funding notes or one or more series of term notes, in each case secured by the participation certificates relating to the GNMA MSRs held by the GMSR Trust.
GMSR VFN. In August 2017, the Company, through the GMSR Trust, issued a variable funding note (the “GMSR VFN”) in the initial amount of $65.0 million. The maximum amount of the GMSR VFN is $150.0 million. The GMSR VFN is secured by GNMA MSRs and bears interest at 30-day LIBOR plus a margin per annum. The Company amended the GMSR VFN in September 2018 to amend certain terms and extend the maturity date to September 2020. The Company amended the GMSR VFN to extend the maturity date to October 2021. At September 30, 2020, there was $15.0 million in GMSR VFN outstanding. Under this facility, the Company is required to satisfy certain financial covenants. As of September 30, 2020, the Company was in compliance with all such covenants.
F-37
Table of Contents
GMSR Term Notes. In November 2017, the Company, through the GMSR Trust, issued an aggregate principal amount of $110.0 million in secured term notes (the “GMSR Term Notes”). The GMSR Term Notes were secured by certain participation certificates relating to GNMA MSRs pursuant to the GNMA MSR Facility. In October 2018, the GMSR Trust was amended and restated for the purpose of issuing the Series 2018-GT1 Term Notes (“Term Notes”). The Term Notes accrue interest at 30-day LIBOR plus a margin per annum and mature in October 2023 or, if extended pursuant to the terms of the related indenture supplement, October 2025 (unless earlier redeemed in accordance with their terms). The Company issued $200.0 million in Term Notes and used the proceeds to pay off $110.0 million in outstanding GMSR Term Notes. At September 30, 2020, there was $198.5 million in Term Notes outstanding, net of $1.5 million in deferred financing costs. Under this facility, the Company is required to satisfy certain financial covenants. As of September 30, 2020, the Company was in compliance with all such covenants.
Advance Receivables Trust. In September 2020, the Company, through its indirect-wholly owned subsidiary loanDepot Agency Advance Receivables Trust (the “Advance Receivables Trust”), entered into a variable funding note facility for the financing of servicing advance receivables with respect to residential mortgage loans serviced by it on behalf of Fannie Mae and Freddie Mac. Pursuant to an indenture, the Advance Receivables Trust issued up to $130.0 million in variable funding notes (the “2020-VF1 Notes”). The 2020-VF1 Notes accrue interest at 30-day LIBOR plus a margin per annum and mature in September 2021 (unless earlier redeemed in accordance with their terms). The 2020-VF1 Notes are secured by loanDepot.com, LLC’s rights to reimbursement for advances made pursuant to Fannie Mae and Freddie Mac requirements. There were no borrowings under the Advance Receivables Trust as of September 30, 2020. Under this facility, the Company is required to satisfy certain financial covenants including minimum levels of tangible net worth and liquidity and maximum levels of consolidated leverage. As of September 30, 2020, the Company was in compliance with all such covenants.
Unsecured Term Loan
In August 2017, the Company entered into an agreement which refinanced a $150.0 million unsecured term loan facility (the “Unsecured Term Loan”), increasing the balance to $250.0 million which matures in August 2022 and accrues interest at a rate of 30-day LIBOR plus a margin per annum. As of September 30, 2020, $248.8 million was outstanding under the Unsecured Term Loan, net of $1.2 million in deferred financing cost. The Company uses amounts borrowed under the Unsecured Term Loan for working capital needs and general corporate purposes. Under the Unsecured Term Loan, the Company is required to satisfy certain financial covenants, including minimum tangible net worth, maximum leverage, and minimum cash balance. As of September 30, 2020, the Company was in compliance with all such covenants. Interest expense from this credit agreement is recorded to other interest expense. The Company may prepay the loan in any amount subsequent to the second anniversary, however, a prepayment premium will apply to the principal prepaid from the second to the fourth anniversary of the loan’s closing. This prepayment premium may be waived under certain circumstances. The Unsecured Term Loan was repaid in October 2020.
Convertible Debt
In August 2019, the Company entered into an agreement for a convertible debt facility of $50.0 million (the “Convertible Debt”) secured by the Company’s LLC interests in its subsidiaries and all the assets thereof. The Convertible Debt matures in August 2022 and accrues interest at a rate of 14.00% per annum prior to the second anniversary and at a rate of 16.00% per annum thereafter. In March 2020, the Company entered into an amendment to increase the Convertible Debt to $75.0 million. The Company uses amounts borrowed under the Convertible Debt for working capital needs and general corporate purposes. The Company may prepay the Convertible Debt at any time prior to the maturity date. As of September 30, 2020, $74.8 million was outstanding under the Convertible Debt, net of $0.2 million in deferred financing costs. The Convertible Debt is convertible into the Company’s equity securities concurrently with the closing of a qualified equity financing transaction or during the 90 day period following the stated maturity date. The right to convert is forfeited if the outstanding
F-38
Table of Contents
balance is paid in full before the qualified equity finance transaction or the stated maturity date. Under the Convertible Debt agreement, the Company is required to satisfy certain financial covenants including minimum levels of tangible net worth and liquidity and maximum levels of consolidated leverage on a monthly basis. As of September 30, 2020, the Company was in compliance with all such covenants. The Convertible Debt was repaid in October 2020.
Securities Financing
The Company entered into a master repurchase agreement to finance securities (“Securities Financing”) in July 2018. The Securities Financing has an advance rate between 50% and 60% based on the class of security and accrues interest at a rate of 30-day LIBOR plus a margin annually. The Securities Financing was paid-off in May 2019.
Interest Expense
Interest expense on all debt obligations with variable rates is paid based on 30-day LIBOR plus a margin ranging from 2.80% - 6.25%.
NOTE 11 – INCOME TAXES
Income taxes for the Company at the consolidated level include federal, state and local taxes for LD Escrow and ACT. For the nine months ended September 30, 2020 and 2019, both LD Escrow and ACT had a federal statutory rate of 21%. The effective tax rate of ACT for the nine months ended September 30, 2020 was 27.8%, and includes recurring items such as state income taxes (net of federal benefit), permanently non-deductible items, and tax benefit for net operating losses. The effective tax rate of ACT for the nine months ended September 30, 2019 was 19.1%, and includes recurring items such as state income taxes (net of federal benefit), permanently non-deductible tax items, tax benefit for net operating losses, and true-up adjustments for income taxes payable. For the nine months ended September 30, 2019, LD Escrow recorded no income tax expense due to experiencing losses before income taxes.
Deferred income taxes arise from temporary differences between the tax basis of assets and liabilities and their reported amounts in the financial statements, which will result in taxable or deductible amounts in the future. Changes in tax laws and rates may affect recorded deferred tax assets and liabilities and the Company’s effective tax rate in the future. Deferred income taxes are measured using the applicable tax rates that are expected to apply in the year when the asset is realized or the liability is settled, based on the tax rates that have been enacted at the reporting date. The Company measured its deferred tax assets and liabilities at September 30, 2020 and December 31, 2019 using a federal tax rate of 21%. The Company establishes a valuation allowance when it is more-likely-than-not that some portion or all of the deferred tax assets will not be realized. As of September 30, 2020, the Company does not have a valuation allowance on any deferred tax assets as the Company believes it is more-likely-than-not that the Company will realize the benefits of the deferred tax assets.
ACT fully utilized the federal net operating losses in 2020 on their 2019 federal tax return.
As of September 30, 2020 and December 31, 2019, LD Escrow had a liability of $0.3 million and $0.3 million, respectively, for unrecognized tax benefits related to various federal and state income tax matters excluding interest, penalties and related tax benefits.
The Company accounts for interest and penalties associated with income tax obligations as a component of income tax expense.
NOTE 12 – RELATED PARTY TRANSACTIONS
During the year ended December 31, 2017, certain unitholders entered into promissory note agreements (“Shareholder Notes”) secured by Common Units owned by their respective unitholders. The Shareholder Notes,
F-39
Table of Contents
with a balance of $53.7 million and $52.7 million as of September 30, 2020 and December 31, 2019, respectively, accrue interest at a rate of 2.50% per annum compounded annually or, in the Event of Default, accrue interest at a rate of 4.50% per annum and are included in accounts receivable, net on the consolidated balance sheet. The Shareholder Notes are due in full on the earliest to occur of (a) the fifth anniversary of the date of the notes, and, generally, (b) a Public Offering or a Sale of the Company as such terms were defined in the LLC Agreement that was in effect at the date of the Shareholder Notes. At September 30, 2020 and December 31, 2019, $46.0 million of the outstanding shareholder notes were secured by Class A Common Units.
In conjunction with its various joint ventures, the Company entered into various agreements to provide services to the joint ventures for which it receives and pays fees. Services for which the Company earns fees comprise loan processing and administrative services (legal, accounting, human resources, data processing and management information, assignment processing, post-closing, underwriting, facilities management, quality control, management consulting, risk management, promotions, public relations, advertising and compliance with credit agreements). The Company also originates eligible mortgage loans referred to it by the joint ventures for which the Company pays the joint ventures a broker fee.
Fees earned, costs incurred and receivables from joint ventures were as follows:
| Nine Months Ended September 30, |
||||||||
| (Dollars in thousands) |
2020 | 2019 | ||||||
| Loan processing and administrative services fee income |
$ | 10,017 | $ | 6,636 | ||||
| Loan origination broker fees expense |
55,323 | 52,578 | ||||||
| (Dollars in thousands) |
September 30, 2020 |
December 31, 2019 |
||||||
| Receivables from joint ventures |
$ | 1,571 | $ | 3,582 | ||||
The Company paid management fees of $0.8 million and $0.7 million to a Unitholder of the Company during the nine months ended September 30, 2020 and 2019, respectively. The Company employed certain employees that provided services to a Unitholder whose salaries totaled $0.2 million and $0.2 million for the nine months ended September 30, 2020 and 2019, respectively.
NOTE 13 – REDEEMABLE UNITS AND UNITHOLDERS’ EQUITY
Redeemable Units and Unitholders’ Equity
Class I Common Units
The Class I Common Units have no voting rights. A total of zero and 1,190,093 Class I Common Units were authorized, issued and outstanding as of September 30, 2020 and December 31, 2019, respectively. Upon and after an initial Public Offering, the Class I Common Unitholders were entitled to receive 25% of the net primary proceeds (as defined) from an initial Public Offering multiplied by 25%; provided, however, that the result of this formula shall equal a minimum of $35 million and a maximum of $63.5 million. Prior to an initial Public Offering, the Class I Common Unitholders were entitled to receive the following. In the event an iMortgage Capital Event occurs (i.e. the sale of the iMortgage division or the financing or refinancing of the iMortgage Assets as defined in the LLC Agreement) or if a sale of the Company occurred that was greater than or equal to $200 million, then the Class I Common Unitholders were entitled to receive $83.5 million plus any outstanding amounts payable under the LLC Agreement. If a sale of the Company occurred that was less than $200 million, then the Class I Common Unitholders were entitled to receive an amount that was equal to (i) the net proceeds (as defined) from one or more Third Parties to the Company from the Sale of the Company or Public Offering, as applicable, multiplied by (ii) eighty percent, multiplied by (iii) the percentage resulting from dividing (A) the Pre-Tax iMortgage Income during the Measuring Period, by (B) the Pre-Tax Company Income during the
F-40
Table of Contents
Measuring Period. In the event the required distributions were not made, the Class I Common Unitholders were entitled to certain Class I Dividend Payments, as defined, until the amounts owed were satisfied.
In May 2020, the Company entered into an agreement to redeem all of its Class I Common Units for $65.3 million. The Company paid $38.4 million in May 2020 and $26.9 million in July 2020 to redeem the Class I Common Units.
Class A Common Units
Class A Common Units are voting Units and holders are entitled to one vote per Class A Common Unit, unless designated as non-voting upon grant. Class A Common Units have a liquidation preference, equal to the aggregate Capital Contribution made for the Class A Common Units, over all other common unit classes except classes I, J and K. As of September 30, 2020 and December 31, 2019, the liquidation preference of the Class A Common Units was $26.9 million. There were 269,000 Class A Common Units authorized and outstanding as of September 30, 2020 and December 31, 2019, respectively.
Class B Common Units
Class B Common Units have no voting rights. Class B Common Units have a liquidation preference subordinate to Class A Common Units. As of September 30, 2020 and December 31, 2019 the liquidation preference of the Class B Common Units was $5.0 million. There were 50,000 Class B Common Units authorized and outstanding as of September 30, 2020 and December 31, 2019, respectively.
Class P Common Units
Class P Common Units have no voting rights. Class P Common Units have a liquidation preference subordinate to Class B Common Units and are pari pasu with the Class P-2 Common Units described below. These Class P Common Units carry a liquidation preference of $12.5 million. There were 12,500 Class P Common Units authorized and outstanding as of September 30, 2020 and December 31, 2019. Class P Common Unitholders have the right to receive distributions equal to the liquidation preference pari pasu with the Class P-2 Common Units once the Class A and Class B Common Unitholders have received distributions equal to 1.5 times the amount contributed by the Class A and Class B Common Unitholders. Then, subsequent to the distributions to the Class A, Class B and Class Z-1 Common Units (as described below), the Class P Common Unitholders have the right to receive distributions, to the extent distributions were authorized by the board of directors, equal to the greater of (a) 225% of the amount contributed by the Class P Common Unitholders or (b) a 20% per annum return on the amount contributed by the Class P Common Unitholders. Upon the sale of the Company, the Class P Common Unitholders have the right to increase this distribution based upon a formula described in the LLC Agreement. Upon an initial public offering (“IPO”), the Class P Common Unitholders have the right to have the Company redeem the Class P Common Units at a redemption price equal to the distributions that the Class P Common Unitholder would receive from the IPO. The holders of the Class P Common Units also have the right to convert the Class P Common Units to the common shares sold in the IPO at a price equal to 87.2% of the public offering price. The Company also has the right, upon an IPO, to obligate the conversion of the Class P Common Units into common shares sold in the IPO.
Class P-2 Common Units
Class P-2 Common Units have no voting rights. Class P-2 Common Units have a liquidation preference subordinate to Class B Common Units and are pari pasu with the Class P Common Units described above. These Class P-2 Common Units carry a liquidation preference of $19.8 million. There were 19,800 Class P-2 Common Units authorized and outstanding as of September 30, 2020 and December 31, 2019. Class P-2 Common Unitholders have the right to receive distributions equal to the liquidation preference pari pasu with the
F-41
Table of Contents
Class P Common Units once the Class A and Class B Common Unitholders received distributions equal to 1.5 times the amount contributed by the Class A and Class B Common Unitholders. Then, subsequent to the distributions to the Class A, Class B and Class Z-1 Common Units (as described below), the Class P-2 Common Unitholders have the right to receive distributions, to the extent distributions were authorized by the board of directors, equal to the greater of (a) 125% of the amount contributed by the Class P-2 Common Unitholders if the Company successfully completed an IPO during 2015 or the Company met or exceeded the 2015 operating budget metric of $110.0 million pre-tax, net income or (b) 165% if the Company did not complete an IPO during 2015 or met or exceeded the 2015 operating budget metric of $110.0 million pre-tax, net income or (c) a 20% per annum return on the amount contributed by the Class P-2 Common Unitholders. Upon the sale of the Company, the Class P-2 Common Unitholders have the right to increase this distribution based upon a formula described in the LLC Agreement. Upon an IPO, the Class P-2 Common Unitholders have the right to have the Company redeem the Class P-2 Common Units at a redemption price equal to the distributions that the Class P-2 Common Unitholder would receive from the IPO. The holders of the Class P-2 Common Units also have the right to convert the Class P-2 Common Units to the common shares sold in the IPO at a price equal to 87.5% of the public offering price. The Company also has the right, upon an IPO, to obligate the conversion of the Class P-2 Common Units into common shares sold in the IPO.
Class P-3 Common Units
Class P-3 Common Units have no voting rights. Class P-3 Common Units have a liquidation preference subordinate to the Class P, P-2 and Z-1 Common Units. These Class P-3 Common Units carry a liquidation preference of $96.0 million. There were 40,000 Class P-3 Common Units authorized and outstanding as of September 30, 2020 and December 31, 2019. Class P-3 Common Unitholders have the right to receive distributions once the Class P, P-2 and Z-1 Common Units receive all distributions to which the Class P, P-2 and Z-1 Common Units were entitled. Upon the sale of the Company wherein the Pre-Money Valuation is less than or equal to $1.3 billion, then the Class P-3 Common Unitholders will receive an amount equal to their liquidation preference. Upon the sale of the Company wherein the Pre-Money Valuation is greater than $1.3 billion, then the Class P-3 Common Unitholders will receive an amount equal to their liquidation preference multiplied by a fraction, the numerator of which is the Pre-Money Valuation and the denominator of which is $1.3 billion. Upon an Offering Event, the Class P-3 Common Unitholders have the right to elect to have such Class P-3 Common Unit either (A) redeemed for an amount in cash equal to the Class P-3 Return Balance of such Class P-3 Common Unit multiplied by a fraction, the numerator of which is the Pre-Money Valuation, and the denominator of which is $1.3 billion; or (B) converted or exchanged into equity securities of the Public Offering Entity, with each Class P-3 Common Unit converting or exchanging into such equity securities based on the following ratio: one to a fraction, the numerator of which is the Class P-3 Return Balance of such Class P-3 Common Unit, and the denominator of which is the lower of $1.3 billion and the Pre-Money Valuation.
Class J and Class K Common Units
Holders of Class J and Class K Common Units are eligible to receive distributions, in a proportionate share with Class I Common Units, subject to certain return thresholds as defined and set forth in the corresponding grant, purchase or other agreement pursuant to which such Class J and Class K Common Units were issued. There were no Class J or Class K Common Units grants as of September 30, 2020 and December 31, 2019.
Class Z, Class Y, Class X, Class W and Class V Common Units
Class Z, Class Y, Class X, Class W and Class V Common Units have no voting rights and may be issued to existing or new employees, officers, directors, consultants or other service providers of the Company or any of its subsidiaries. Holders of Class Z, Class Y, Class X, Class W and Class V Common Units are eligible to receive distributions, in a proportionate share with Class A Common Units and Class B Common Units, subject to certain return thresholds as defined and set forth in the corresponding grant, purchase or other agreement pursuant to which such Class Z, Class Y, Class X, Class W and Class V Common Units were issued.
F-42
Table of Contents
The Company has granted the following Class Z, Class Y, Class X, Class W, and Class V Common Units:
| • | Class Z-1 Common Units: Holders of Class Z-1 Common Units are not eligible to receive distributions until distributions were made to the holders of Class P and P-2 Common Units received distributions equal to the liquidation preference of the Class P and P-2 Common Units (“Class Z-1 Minimum Threshold”). Once the Class Z-1 Minimum Threshold is reached, the holders of Class Z-1 Common Units will share in distributions with Class A Common Unit and Class B Common Unitholders at a ratio of 85% Class A and Class B Common Unit and 15% Class Z-1 Common Units until the Class A Common Unit and Class B Common Unitholders receive distributions equal to 2.5 times the aggregate capital contribution made for said Common Units (“Class Z-1 Maximum Threshold”). No further distributions will be made to the holders of Class Z-1 Common Units once the Class Z-1 Maximum Threshold is reached. There were 44,502 Class Z-1 Common Units authorized and outstanding as of September 30, 2020 and December 31, 2019. |
| • | Class Z-2 Common Units: Holders of Class Z-2 Common Units are not eligible to receive distributions until all distributions had been made to the holders of Class P and P-2 Common Units and holders of Class Z-1 Common Units have received their distributions as described above (“Class Z-2 Minimum Threshold”). Once the Class Z-2 Minimum Threshold is reached, the holders of Class Z-2 Common Units will share in distributions with Class A Common Unit and Class B Common Unitholders at a ratio of 75% Class A and Class B Common Unit and 25% Class Z-2 Common Units until the Class A Common Unit and Class B Common Unitholders receive distributions equal to 3.5 times the aggregate capital contribution made for said Common Units (“Class Z-2 Maximum Threshold”). No further distributions will be made to the holders of Class Z-2 Common Units once the Class Z-2 Maximum Threshold is reached. There were 83,189 Class Z-2 Common Units authorized and outstanding as of September 30, 2020 and December 31, 2019. |
| • | Class Z-3 Common Units: Holders of Class Z-3 Common Units are not eligible to receive distributions until distributions have been made to the holders of Class A Common Units and Class B Common Units equal to 3.5 times the aggregate capital contribution made in exchange for the Class A Common Units and Class B Common Units (“Class Z-3 Minimum Threshold”). Once the Class Z-3 Minimum Threshold is reached, the holders of Class Z-3 Common Units will share in distributions with Class A Common Unit and Class B Common Unitholders at a ratio of 65% Class A and Class B Common Unit and 35% Class Z-3 Common Units until the Class A Common Unit and Class B Common Unitholders receive distributions equal to 4.5 times the aggregate capital contribution made for said Common Units (“Class Z-3 Maximum Threshold”). No further distributions will be made to the holders of Class Z-3 Common Units once the Class Z-3 Maximum Threshold is reached. There were 133,789 Class Z-3 Common Units authorized and outstanding as of September 30, 2020 and December 31, 2019. |
| • | Class Z-4, Class Y, Class X, and Class W Common Units: Holders of Class Z-4 and Class Y Common Units are not eligible to receive distributions until distributions have been made to the holders of Class A Common Units and Class B Common Units equal to 4.5 times the aggregate capital contribution made in exchange for the Class A Common Units and Class B Common Units (“Class Z-4 Minimum Threshold”). Once the Class Z-4 Minimum Threshold is reached, the holders of Class Z-4 and Class Y Common Units will share in distributions with Class A Common Unit and Class B Common Unitholders at a ratio of 50% Class A and Class B Common Unit and 50% Class Z-4 and Class Y Common Units until the Class A and Class B Common Unitholders receive distributions equal to 8.0 times the aggregate capital contributions made for said Common Units. |
Then, the holders of Class Z-4, Class Y and Class X Common Units will share in distributions with Class A Common Units and Class B Common Unitholders at a ratio of 50% Class A and Class B Common Units and 50% Class Z-4, Class Y and Class X Common Units until the Class A and Class B Common Unitholders receive distributions equal to 14.265 times the aggregate capital contributions made for said Common Units.
F-43
Table of Contents
Then, the holders of Class W will share in distributions with Class A Common Unitholders and Class B Common Unitholders at a ratio of 50% Class A and Class B Common Units and 50% Class W Common Units until the Class W holders had received $2 million.
Then, the holders of Class Z-4, Class Y and Class X Common Units will share in distributions with Class A Common Unitholders and Class B Common Unitholders at a ratio of 50% Class A and Class B Common Units and 50% Class Z-4, Class Y and Class X Common Units.
| • | There were 268,239 Class Z-4 Common Units authorized and outstanding as of September 30, 2020 and December 31, 2019. As of September 30, 2020 and December 31, 2019, the Company had authorized and outstanding 14,567 of Class Y Common Units and no additional Class Y Common Units were held in reserve for future issuance. As of September 30, 2020 and December 31, 2019, the Company had authorized, issued and granted 3,961,976,096 and 2,785,758,179 of Class X Common Units, respectively, and no additional Class X Common Units were held in reserve for future issuance. As of September 30, 2020 and December 31, 2019 the Company had authorized, issued and granted 10,000 of Class W Common Units and no additional Class W Common Units were held in reserve for future issuance. As of September 30, 2020 and December 31, 2019, the Company had authorized, issued and granted 88,841,961 and 337,942,529 Class V Common Units, respectively, and no additional Class V Common Units were held in reserve for future issuance. During the nine months ended September 30, 2020, 219,098,855 Class V units were exchanged for 631,851,581 Class X Units (See Note 15 - Equity-Based Compensation for information regarding the modification of these awards). |
All classes of units were entitled to receive distributions equal to their estimated tax liability. These distributions had priority over distributive rights granted to any class of units and do not factor into the distributions for the purposes of calculating the minimum thresholds for the Class Z, Class Y, Class X, Class W and Class V Common Units. The liability of Unitholders or Members of the LLC Agreement for debts, liabilities and losses of the Company is limited to their share of Company assets.
In accordance with the Company’s operating agreement, all classes of units are entitled to receive distributions equal to their estimated tax liability. In September 2020, the Company distributed $147.0 million to its unitholders based on their estimated tax liability.
NOTE 14 – EQUITY-BASED COMPENSATION
The Company’s 2009 Incentive Equity Plan, 2012 Incentive Equity Plan, and 2015 Incentive Equity Plan (collectively, the “Plans”) provide for the granting of Class Z, Class Y, Class X, and Class W Common Units to employees, managers, consultants and advisors of the Company and its subsidiaries. The number of Class Z, Class Y, Class X, and Class W Common Units which may be granted or sold under the Plans shall not exceed, in the aggregate, 567,370 Class Z Common Units (of which 48,882 shall be Class Z-1 Common Units and 92,333 shall be Class Z-2 Common Units, 149,154 shall be Class Z-3 Common Units and 277,000 shall be Class Z-4 Common Units) and 41,391 Class Y Common Units; provided that, to the extent any Class Z and Class Y Common Units (i) expire, (ii) are canceled, terminated or forfeited in any manner, or (iii) are repurchased by the Company, then in each case such Common Units shall again be available for issuance and sale under the Plans.
Participants receiving grants or purchasing Class Z, Class Y, Class X, or Class W Common Units pursuant to the Plans are required to become a party to the Limited Liability Company Agreement. No Common Units shall be issued after the tenth anniversary of the adoption of the Plans. In addition, the LLC Agreement also allows and provides for the issuance of Common Units.
The Company granted 1,227,342,174 Class X Common Units during the nine months ended September 30, 2020, and there were no grants of any other class of Common Units during the nine months ended September 30, 2019.
F-44
Table of Contents
The unit grants typically vest 20% on the one year anniversary of the grant and 1.667% each month thereafter, and are subject to accelerated vesting upon the sale of the Company.
| Nine Months Ended September 30, |
||||||||||||||||
| 2020 | 2019 | |||||||||||||||
| Shares | Weighted Average Grant Date Fair Value |
Shares | Weighted Average Grant Date Fair Value |
|||||||||||||
| Unvested - beginning of period |
100,679,480 | $ | 0.006 | 257,789,340 | $ | 0.030 | ||||||||||
| Granted |
1,227,342,174 | 0.016 | — | — | ||||||||||||
| Vested |
(533,303,418 | ) | 0.016 | (76,092,953 | ) | 0.004 | ||||||||||
| Forfeited/Cancelled |
(75,670,919 | ) | 0.013 | (48,506,920 | ) | 0.008 | ||||||||||
|
|
|
|
|
|||||||||||||
| Unvested - end of period |
719,047,317 | 0.016 | 133,189,467 | 0.006 | ||||||||||||
|
|
|
|
|
|||||||||||||
| Nine Months Ended September 30, |
||||||||
| 2020 | 2019 | |||||||
| Units Granted: |
||||||||
| Class X Common Units |
1,227,342,174 | — | ||||||
|
|
|
|
|
|||||
| Total |
1,227,342,174 | — | ||||||
|
|
|
|
|
|||||
Total compensation expense associated with the Class Z, Class Y, Class X, Class W and Class V Common Units was $7.6 million and $0.2 million for the nine months ended September 30, 2020 and 2019, respectively. In connection with the modification of Class V Units for Class X Units (see Note 14 - Redeemable Units and Unitholders’ Equity), during the nine months ended September 30, 2020 the Company recognized $6.4 million in share-based compensation expense based on the market value of the units at the modification date.
At September 30, 2020 and December 31, 2019, the total unrecognized compensation cost related to unvested unit grants was $10.6 million and $1.1 million, respectively. This cost is expected to be recognized over the next 4.8 years.
The following assumptions were used for the grants:
| Nine Months Ended September 30, | ||||||
| (Dollars in thousands) |
2020 | 2019 | ||||
| Risk-free interest rate |
0.30 | % | N/A | |||
| Expected life |
1.7 years | N/A | ||||
| Expected volatility |
160 - 175% | N/A | ||||
The risk-free interest rate is the U.S. Treasury yield curve in effect at the time of grant based on the expected life of the unit grants. The expected life of the units granted represents the period of time the unit grants are expected to be outstanding. The expected volatility is based on the historical volatility of a public peer group of Companies’ stock price in the most recent period that is equal to the expected term of the unit grants being valued.
NOTE 15 – COMMITMENTS AND CONTINGENCIES
Operating Leases
The Company is obligated under various non-cancelable operating leases, which are subject to rent escalation clauses, for its office facilities and equipment that expire at various times through 2025. The following
F-45
Table of Contents
is a schedule of future minimum lease payments for operating leases with initial terms in excess of one year as of September 30, 2020:
| (Dollars in thousands) |
Amount | |||
| 2020 |
$ | 7,933 | ||
| 2021 |
27,509 | |||
| 2022 |
20,924 | |||
| 2023 |
12,650 | |||
| 2024 |
9,033 | |||
| Thereafter |
3,687 | |||
|
|
|
|||
| Total operating lease payments |
81,736 | |||
| Less: Amount representing interest |
(9,146 | ) | ||
|
|
|
|||
| Operating lease liability |
$ | 72,590 | ||
|
|
|
|||
Rent expense for operating leases was $24.4 million and $22.6 million for the nine months ended September 30, 2020 and 2019, respectively. Rent expense is included in occupancy expense on the consolidated statements of operations.
The Company subleases certain leased premises. Sublease income is recorded as a reduction to rent expense and totaled $1.1 million and $0.7 million for the nine months ended September 30, 2020 and 2019, respectively.
Escrow Services
In conducting its operations, the Company, through its wholly-owned subsidiaries, LD Escrow and ACT, routinely hold customers’ assets in escrow pending completion of real estate financing transactions. These amounts are maintained in segregated bank accounts and are offset with the related liabilities resulting in no amounts reported in the accompanying consolidated balance sheets. In the fourth quarter of 2019, LD Escrow transitioned its operations to LDSS. The balances held for the Company’s customers totaled $316.9 million and $113.8 million at September 30, 2020 and December 31, 2019, respectively. The Company earned $24.8 million and $16.5 million in fees from escrow related services for the nine months ended September 30, 2020 and 2019, respectively. Escrow fees are included in other income on the consolidated statements of operations.
Legal Proceedings
The Company is a defendant in or a party to a number of legal actions or proceedings that arise in the ordinary course of business. These matters include actions alleging improper lending practices, improper servicing, quiet title actions, improper foreclosure practices, violations of consumer protection laws, etc. and on account of consumer bankruptcies. In many of these actions, the Company may not be the real party of interest (because the Company is not the servicer of the loan or the holder of the note) but it may appear in the pleadings because it is in the chain of title to property over which there may be a dispute. Such matters are turned over to the servicer of the loan for those loans the Company does not service. In other cases, such as lien avoidance cases brought in bankruptcy, the Company is insured by title insurance and the case is turned over to the title insurer who tenders our defense. In some of these actions and proceedings, claims for monetary damages are asserted against the Company. In view of the inherent difficulty of predicting the outcome of such legal actions and proceedings, the Company generally cannot predict what the eventual outcome of the pending matters will be, what the timing of the ultimate resolution of these matters will be, or what the eventual loss related to each pending matter may be, if any.
The Company seeks to resolve all litigation and regulatory matters in the manner management believes is in the best interest of the Company and contests liability, allegations of wrongdoing and, where applicable, the amount of damages or scope of any penalties or other relief sought as appropriate in each pending matter. On at least a quarterly basis, the Company assesses its liabilities and contingencies in connection with outstanding legal and regulatory proceedings utilizing the latest information available. Any estimated loss is subject to significant
F-46
Table of Contents
judgment and is based upon currently available information, a variety of assumptions, and known and unknown uncertainties. Where available information indicates that it is probable a liability has been incurred and the Company can reasonably estimate the amount of the loss, an accrued liability is established. The actual costs of resolving these proceedings may be substantially higher or lower than the amounts accrued.
The Company is defending two putative Telephone Consumer Protection Act (“TCPA”) class actions. The Company denies the allegations in these cases and is vigorously defending both matters. The Company intends to a file dispositive motions, which, if granted, would result in a finding of no liability and dismissal of the actions. In the second matter, the Company intends to file a motion to defeat class certification, which, if granted, may result in a nominal individual settlement. Given the lawsuits are at the early stages, the Company is unable to estimate a range of possible loss with any degree of reasonable certainty.
The Company has recorded reserves of $2.1 million as of September 30, 2020 related to settlements of four separate legal matters in which the Company has determined the loss is probable and estimable under GAAP. The ultimate outcome of the other legal proceedings is uncertain and the amount of any future potential loss is not considered probable or estimable. The Company will incur defense costs and other expenses in connection with these legal proceedings. If the final resolution of any legal proceedings is unfavorable, it could have a material adverse effect on the Company’s business and financial condition.
Based on the Company’s current understanding of these pending legal actions and proceedings, management does not believe that judgments or settlements arising from pending or threatened legal matters, individually or in the aggregate, will have a material adverse effect on the consolidated financial position, operating results or cash flows of the Company. However, given the nature of such matters, an estimate of the amount or range of loss in excess of accrued amounts cannot be made and unfavorable resolution could affect the consolidated financial position, results of operations or cash flows for the years in which they are resolved.
Compliance Matters
During the fourth quarter of 2019, an increase in mortgage originations resulted in an increase in title orders and loan settlements creating personnel and operational pressures within the Company. The Company increased staffing, adjusted schedules and enhanced processes, but still experienced constraints in order to meet settlement timelines. Specifically, there was an increase in the number of days between receipt of funds from the originating lender and the disbursement of those funds to the payoffs on the loan transaction. A review was initiated in order to refund affected consumers any overage in per diem charges due to the delay based on loan program and property state requirements. The review is in the final stages and all refunds are to be remitted to affected consumers during 2020. As a result of this event and in order to prevent recurrence, the Company has decreased the number of states in which they accept orders in order to manage pipelines and routinely review key performance indicators along with pipeline estimates from their customers.
Regulatory Requirements
The Company is subject to various capital requirements by the U.S. Department of Housing and Urban Development (“HUD”); lenders of the warehouse lines of credit; and secondary markets investors. Failure to maintain minimum capital requirements could result in the inability to participate in HUD-assisted mortgage insurance programs, to borrow funds from warehouse line lenders or to sell or service mortgage loans. As of September 30, 2020 and December 31, 2019, the Company was in compliance with its selling and servicing capital requirements.
Commitments to Extend Credit
The Company enters into IRLCs with customers who have applied for residential mortgage loans and meet certain credit and underwriting criteria. These commitments expose the Company to market risk if interest rates
F-47
Table of Contents
change and the loan is not economically hedged or committed to an investor. The Company is also exposed to credit loss if the loan is originated and not sold to an investor and the customer does not perform. The collateral upon extension of credit typically consists of a first deed of trust in the mortgagor’s residential property. Commitments to originate loans do not necessarily reflect future cash requirements as some commitments are expected to expire without being drawn upon. Total commitments to originate loans as of September 30, 2020 and December 31, 2019 approximated $30.43 billion and $8.90 billion, respectively. These loan commitments are treated as derivatives and are carried at fair value (See Note 7—Derivative Financial Instruments and Hedging Activities).
Loan Repurchase Reserve
When the Company sells mortgage loans, it makes customary representations and warranties to the purchasers about various characteristics of each loan such as the origination and underwriting guidelines, including but not limited to the validity of the lien securing the loan, property eligibility, borrower credit, income and asset requirements, and compliance with applicable federal, state and local law. The Company’s whole loan sale agreements generally require it to repurchase loans if the Company breached a representation or warranty given to the loan purchaser. Additionally, the Company has repurchase obligations for personal loans facilitated through its banking relationship in the case where personal identification fraud is discovered at the inception of the loan.
The Company’s loan repurchase reserve for sold loans is reflected in accounts payable and accrued expenses. There have been charge-offs associated with early payoffs, early payment defaults and losses related to representations, warranties and other provisions for the nine months ended September 30, 2020 and 2019.
The activity related to the loan loss obligation for sold loans is as follows:
| Nine Months Ended September 30, |
||||||||
| (Dollars in thousands) |
2020 | 2019 | ||||||
| Balance at beginning of period |
$ | 17,677 | $ | 18,301 | ||||
| Provision for loan losses |
16,621 | 7,044 | ||||||
| Payments, realized losses and other |
(6,747 | ) | (6,135 | ) | ||||
|
|
|
|
|
|||||
| Balance at end of period |
$ | 27,551 | $ | 19,210 | ||||
|
|
|
|
|
|||||
NOTE 16 – REGULATORY CAPITAL AND LIQUIDITY REQUIREMENTS
The Company, through certain subsidiaries, is required to maintain minimum net worth, liquidity and other financial requirements specified in certain of its selling and servicing agreements, including:
| • | Ginnie Mae single-family issuers. The eligibility requirements include net worth of $2.5 million plus 0.35% of outstanding Ginnie Mae single-family obligations and a liquidity requirement equal to the greater of $1.0 million or 0.10% of outstanding Ginnie Mae single-family securities. |
| • | Fannie Mae and Freddie Mac. The eligibility requirements for seller/servicers include tangible net worth of $2.5 million plus 0.25% of the Company’s total single-family servicing portfolio, excluding loans subserviced for others and a liquidity requirement equal to 0.35% of the aggregate UPB serviced for the agencies plus 2.0% of total nonperforming agency servicing UPB in excess of 6% basis points. |
| • | HUD. The eligibility requirements include a minimum adjusted net worth of $1,000,000 plus 1% of the total volume in excess of $25,000,000 of FHA Single Family Mortgages originated, underwritten, serviced, and/or purchased during the prior fiscal year, up to a maximum required adjusted net worth of $2,500,000 |
| • | Fannie Mae, Freddie Mac and Ginnie Mae. The Company is also required to hold a ratio of Adjusted/Tangible Net Worth to Total Assets greater than 6%. |
F-48
Table of Contents
To the extent that these requirements are not met, the Company may be subject to a variety of regulatory actions which could have a material adverse impact on our results of operations and financial condition. The most restrictive of the minimum net worth and capital requirements require the Company to maintain a minimum adjusted net worth balance of $94.3 million as of September 30, 2020. As of September 30, 2020, the Company was in compliance with the net worth, liquidity and other financial requirements of its selling and servicing requirements.
NOTE 17 – REVENUE RECOGNITION
On January 1, 2019, the Company adopted ASC 606 by applying the modified retrospective method. Results for reporting periods beginning after January 1, 2019 are presented under ASC 606. Timing of recognition of the Company’s revenue was not impacted by the adoption of ASC 606.
Disaggregation of Revenue
| Nine Months Ended September 30, |
||||||||
| (Dollars in thousands) |
2020 | 2019 | ||||||
| Revenue Stream |
||||||||
| Other income: |
||||||||
| In scope of Topic 606: |
||||||||
| Direct title insurance premiums |
$ | 22,879 | $ | 11,579 | ||||
| Escrow and sub escrow fees |
24,805 | 16,522 | ||||||
| Default and foreclosure services |
872 | 1,583 | ||||||
| Out of scope of Topic 606: |
||||||||
| Income from Joint Ventures |
6,677 | 9,186 | ||||||
| Other |
2,882 | 5,152 | ||||||
|
|
|
|
|
|||||
| Total other income |
$ | 58,115 | $ | 44,022 | ||||
|
|
|
|
|
|||||
Direct title insurance premiums, escrow and sub escrow fees, and default and foreclosure service revenues are within the scope of ASC Topic 606.
Direct title insurance premiums are based on a percentage of the gross title premiums charged by the title insurance provider and is recognized net as revenue when the Company is legally or contractually entitled to collect the premium. Revenue is recognized at the point-in-time upon the closing of the underlying real estate transaction as the earnings process is considered complete. Cash is typically collected at the closing of the underlying real estate transaction.
Escrow and sub escrow fees are primarily associated with managing the closing of real estate transactions including the processing of funds on behalf of the transaction participants, gathering and recording the required closing documents, and providing other related activities. Escrow and sub escrow fees are recognized as revenue when the closing process is complete or when the Company is legally or contractually entitled to collect the fee. Revenue is primarily recognized at a point-in-time upon closing of the underlying real estate transaction or completion and billing of services. Cash is typically collected at the closing of the underlying real estate transaction.
Default and foreclosure service revenues are associated with foreclosure title searches, tax searches, title updates, deed recordings and other related services. Fees vary by service and are recognized as revenue when the service is complete and billed or when the Company is entitled to collect the fee.
NOTE 18 – SUBSEQUENT EVENTS
In October 2020, the Company executed the Third Amended and Restated Limited Liability Company Agreement which included the redemption in full of all of the outstanding Class P Common Units and Class P-2 Common Units.
F-49
Table of Contents
In October 2020, the Company declared profit distributions of $175.0 million to certain of its unitholders, as allowed under the Company’s operating agreement, and included liquidating distributions to the Class P Common Units and Class P-2 Common Units.
In October 2020, the Company issued $500 million in aggregate principal amount of 6.50% senior unsecured notes due 2025.
In October 2020, the Company paid off the $75.0 million Convertible Debt.
In October 2020, the Company paid off the $250.0 million Unsecured Term Loan.
In October 2020, the Company issued notes through an additional securitization facility (“2020-1 Securitization Facility”) backed by a revolving warehouse line of credit. The 2020-1 Securitization Facility is secured by newly originated, first-lien, fixed-rate or adjustable-rate, residential mortgage loans which are originated in accordance with the criteria of Fannie Mae and Freddie Mac for the purchase of mortgage loans or in accordance with the criteria of Ginnie Mae for the guarantee of securities backed by mortgage loans. The 2020-1 Securitization Facility issued $600.0 million in notes and certificates that bear interest at 30-day LIBOR plus a margin. The 2020-1 Securitization Facility will terminate on the earlier of (i) the two-year anniversary of the initial purchase date, (ii) upon the Company exercising its right to optional prepayment in full and (iii) the date of the occurrence and continuance of an event of default.
In October 2020, the Company paid off $200.0 million in notes and certificates of the 2018 Securitization Facility.
In November 2020, the Company declared profit distributions of $278.8 million to certain of its unitholders as allowed under the Company’s operating agreement. This distribution satisfied the $53.8 million of outstanding Shareholder Notes (see Note 12 - Related Parties) and the remaining $225.0 million was distributed in cash.
In December 2020, the Company distributed $71.1 million to its unitholders based on their estimated tax liability. In accordance with the Company’s operating agreement, all classes of units are entitled to receive distributions equal to their estimated tax liability.
In December 2020, the Company issued notes through a new securitization facility (“2020-2 Securitization Facility”) backed by a revolving warehouse line of credit. The 2020-2 Securitization Facility is secured by newly originated, first-lien, fixed rate residential mortgage loans eligible for purchase by the GSEs or in accordance with the criteria of Ginnie Mae for the guarantee of securities backed by mortgage loans. The 2020-2 Securitization Facility issued $500.0 million in notes and certificates that bear interest at 30-day LIBOR plus a margin. The 2020-2 Securitization Facility will terminate on the earlier of (i) the three year anniversary of the initial purchase date, (ii) upon the Company exercising its right to optional prepayment in full and (iii) the date of the occurrence and continuance of an event of default.
At the time of issuance of this report, the direct and indirect impacts that the COVID-19 pandemic and recent market volatility may have on the Company’s financial statements are uncertain. The Company is unaware of any known material risk to the stability of its financial statements caused by these uncertainties and the effect they may have on the Company’s customers and counterparties.
General standards of accounting for, and disclosures of, events that occur after the balance sheet date, but before the financial statements are issued or available to be issued are established by Subsequent Events ASC 855. In accordance with ASC 855, the Company has evaluated subsequent events from the date of these consolidated financial statements on September 30, 2020 through the issuance of these consolidated financial statements.
F-50
Table of Contents
Report of Independent Registered Public Accounting Firm
To the Unitholders and the Board of Directors of LD Holdings Group, LLC
Opinion on the Financial Statements
We have audited the accompanying consolidated balance sheets of LD Holdings Group, LLC and Subsidiaries (the Company) as of December 31, 2019 and 2018, the related consolidated statements of operations, unitholders’ equity and noncontrolling interests, and cash flows for each of the three years in the period ended December 31, 2019, and the related notes (collectively referred to as the “consolidated financial statements”). In our opinion, the consolidated financial statements present fairly, in all material respects, the financial position of the Company at December 31, 2019 and 2018, and the results of its operations and its cash flows for each of the three years in the period ended December 31, 2019, in conformity with U.S. generally accepted accounting principles.
Basis for Opinion
These financial statements are the responsibility of the Company’s management. Our responsibility is to express an opinion on the Company’s financial statements based on our audits. We are a public accounting firm registered with the Public Company Accounting Oversight Board (United States) (PCAOB) and are required to be independent with respect to the Company in accordance with the U.S. federal securities laws and the applicable rules and regulations of the Securities and Exchange Commission and the PCAOB.
We conducted our audits in accordance with the standards of the PCAOB. Those standards require that we plan and perform the audit to obtain reasonable assurance about whether the financial statements are free of material misstatement, whether due to error or fraud. The Company is not required to have, nor were we engaged to perform, an audit of its internal control over financial reporting. As part of our audits we are required to obtain an understanding of internal control over financial reporting but not for the purpose of expressing an opinion on the effectiveness of the Company’s internal control over financial reporting. Accordingly, we express no such opinion.
Our audits included performing procedures to assess the risks of material misstatement of the financial statements, whether due to error or fraud, and performing procedures that respond to those risks. Such procedures included examining, on a test basis, evidence regarding the amounts and disclosures in the financial statements. Our audits also included evaluating the accounting principles used and significant estimates made by management, as well as evaluating the overall presentation of the financial statements. We believe that our audits provide a reasonable basis for our opinion.
/s/ Ernst & Young LLP
We have served as the Company’s auditor since 2015.
Los Angeles, California
November 9, 2020
F-51
Table of Contents
LD Holdings Group, LLC and Subsidiaries
($ in thousands)
| December 31, | ||||||||
| 2019 | 2018 | |||||||
| ASSETS |
||||||||
| Cash and cash equivalents |
$ | 73,301 | $ | 105,685 | ||||
| Restricted cash |
44,195 | 8,307 | ||||||
| Accounts receivable, net |
121,046 | 130,473 | ||||||
| Loans held for sale, at fair value (includes $807,599 and $609,883 pledged to creditors in securitization trusts, respectively) |
3,681,840 | 2,295,451 | ||||||
| Derivative assets, at fair value |
131,228 | 73,439 | ||||||
| Servicing rights, at fair value (includes $281,255 and $281,950 pledged to creditors in securitization trusts, respectively) |
447,478 | 412,953 | ||||||
| Trading securities, at fair value (pledged to creditors in securitization trusts) |
— | 25,086 | ||||||
| Property and equipment, net |
80,897 | 90,954 | ||||||
| Operating lease right-of-use assets |
61,693 | — | ||||||
| Prepaid expenses and other assets |
52,653 | 49,675 | ||||||
| Loans eligible for repurchase |
197,812 | 183,814 | ||||||
| Investments in joint ventures |
17,030 | 17,001 | ||||||
| Goodwill and intangible assets, net |
43,338 | 43,955 | ||||||
|
|
|
|
|
|||||
| Total assets |
$ | 4,952,511 | $ | 3,436,793 | ||||
|
|
|
|
|
|||||
| LIABILITIES, REDEEMABLE UNITS AND UNITHOLDERS’ EQUITY |
||||||||
| Warehouse and other lines of credit |
$ | 3,466,567 | $ | 2,126,640 | ||||
| Accounts payable, accrued expenses and other liabilities |
196,102 | 167,177 | ||||||
| Derivative liabilities, at fair value |
9,977 | 32,575 | ||||||
| Liability for loans eligible for repurchase |
197,812 | 183,814 | ||||||
| Operating lease liability |
80,257 | — | ||||||
| Financing lease obligations |
33,816 | 29,803 | ||||||
| Debt obligations, net |
592,095 | 547,893 | ||||||
|
|
|
|
|
|||||
| Total liabilities |
4,576,626 | 3,087,902 | ||||||
| Commitments and contingencies (Note 23) |
||||||||
See accompanying notes to the consolidated financial statements.
F-52
Table of Contents
LD Holdings Group, LLC and Subsidiaries
CONSOLIDATED BALANCE SHEETS - CONTINUED
($ in thousands)
| December 31, 2019 |
December 31, 2018 |
|||||||
| Redeemable units: |
||||||||
| Class I Units (par value $18.7 million; 1,190,093 units and no units authorized and issued/outstanding at December 31, 2019 and 2018) |
$ | 34,280 | $ | 34,280 | ||||
| Class A Units (par value $26.9 million; 269,000 units authorized and issued/outstanding at December 31, 2019 and 2018) |
26,900 | 26,900 | ||||||
| Class B Units (par value $5.0 million; 50,000 units authorized and issued/outstanding at December 31, 2019 and 2018, respectively) |
5,000 | 5,000 | ||||||
| Class P Units (par value $12.5 million; 12,500 units authorized and issued/outstanding at December 31, 2019 and 2018, respectively) |
12,500 | 12,500 | ||||||
| Class P-2 Units (par value $20.0 million; 19,800 units authorized and issued/outstanding at December 31, 2019 and 2018, respectively) |
19,800 | 19,800 | ||||||
| Class P-3 Units (par value $40.0 million; 40,000 units authorized and issued/outstanding at December 31, 2019 and 2018, respectively) |
40,000 | 40,000 | ||||||
| Class Z-1 Units (no par value; 44,502 units authorized and issued/outstanding at December 31, 2019 and 2018, respectively) |
— | — | ||||||
|
|
|
|
|
|||||
| Total redeemable units |
138,480 | 138,480 | ||||||
| Unitholders’ equity: |
||||||||
| Class Z-2 Units (no par value; 83,189 units authorized and issued/outstanding at December 31, 2019 and 2018, respectively) |
— | — | ||||||
| Class Z-3 Units (no par value; 133,789 units authorized and issued/outstanding at December 31, 2019 and 2018, respectively) |
— | — | ||||||
| Class Z-4 Units (no par value; 268,239 units authorized and issued/outstanding at December 31, 2019 and 2018, respectively) |
— | — | ||||||
| Class Y Units (no par value; 14,567 units issued/outstanding at December 31, 2019 and 2018, respectively) |
— | — | ||||||
| Class W Units (no par value; 10,000 units authorized and issued/outstanding at December 31, 2019 and 2018, respectively) |
— | — | ||||||
| Class X Units (no par value; 2,785,758,179 and 2,791,897,853 units authorized and issued/outstanding at December 31, 2019 and 2018, respectively) |
— | — | ||||||
| Class V Units (no par value; 337,942,529 and 421,491,869 units authorized and issued/outstanding at December 31, 2019 and 2018, respectively) |
— | — | ||||||
| Additional paid-in capital |
18,021 | 17,830 | ||||||
| Retained earnings |
219,384 | 192,581 | ||||||
|
|
|
|
|
|||||
| Total unitholders’ equity |
237,405 | 210,411 | ||||||
|
|
|
|
|
|||||
| Total liabilities, redeemable units and unitholders’ equity |
$ | 4,952,511 | $ | 3,436,793 | ||||
|
|
|
|
|
|||||
See accompanying notes to the consolidated financial statements.
F-53
Table of Contents
LD Holdings Group, LLC and Subsidiaries
CONSOLIDATED STATEMENTS OF OPERATIONS
($ in thousands)
| Year ended December 31, | ||||||||||||
| 2019 | 2018 | 2017 | ||||||||||
| REVENUES: |
||||||||||||
| Interest income |
$ | 127,569 | $ | 122,079 | $ | 90,842 | ||||||
| Interest expense |
(130,344 | ) | (104,784 | ) | (74,093 | ) | ||||||
|
|
|
|
|
|
|
|||||||
| Net interest (expense) income |
(2,775 | ) | 17,295 | 16,749 | ||||||||
| Gain on origination and sale of loans, net |
1,125,853 | 799,564 | 1,011,791 | |||||||||
| Origination income, net |
149,500 | 153,036 | 159,184 | |||||||||
| Servicing fee income |
118,418 | 141,195 | 115,486 | |||||||||
| Change in fair value of servicing rights, net |
(119,546 | ) | (51,487 | ) | (88,701 | ) | ||||||
| Other income |
65,681 | 54,750 | 58,470 | |||||||||
|
|
|
|
|
|
|
|||||||
| Total net revenues |
1,337,131 | 1,114,353 | 1,272,979 | |||||||||
| EXPENSES: |
||||||||||||
| Personnel expense |
765,256 | 681,378 | 726,616 | |||||||||
| Marketing and advertising expense |
187,880 | 190,777 | 216,012 | |||||||||
| Direct origination expense |
93,531 | 83,033 | 76,232 | |||||||||
| General and administrative expense |
100,493 | 95,864 | 95,236 | |||||||||
| Occupancy expense |
37,209 | 38,309 | 31,655 | |||||||||
| Depreciation and amortization |
37,400 | 36,279 | 31,861 | |||||||||
| Subservicing expense |
41,397 | 50,433 | 36,403 | |||||||||
| Other interest expense |
41,294 | 41,624 | 29,158 | |||||||||
|
|
|
|
|
|
|
|||||||
| Total expenses |
1,304,460 | 1,217,697 | 1,243,173 | |||||||||
|
|
|
|
|
|
|
|||||||
| Income (loss) before income taxes |
32,671 | (103,344 | ) | 29,806 | ||||||||
| Income tax (benefit) expense |
(1,749 | ) | (475 | ) | 1,436 | |||||||
|
|
|
|
|
|
|
|||||||
| Net income (loss) |
34,420 | (102,869 | ) | 28,370 | ||||||||
| Net income attributable to noncontrolling interests |
— | 7,515 | 7,515 | |||||||||
|
|
|
|
|
|
|
|||||||
| Net income (loss) attributable to LD Holdings Group, LLC |
$ | 34,420 | $ | (110,384 | ) | $ | 20,855 | |||||
|
|
|
|
|
|
|
|||||||
See accompanying notes to the consolidated financial statements.
F-54
Table of Contents
LD Holdings Group, LLC and Subsidiaries
CONSOLIDATED STATEMENTS OF UNITHOLDERS’ EQUITY AND NONCONTROLLING INTERESTS
($ and shares in thousands)
| Class Z-2 | Class Z-3 | Class Z-4 | Class Y | Class W | Class X | Class V | Additional paid-in capital |
Retained Earnings |
Total LD Holdings Group, LLC Unit- holders’ Equity |
Non- controlling Interests |
Total Unit- holders’ Equity |
|||||||||||||||||||||||||||||||||||||||||||||||||||||||||||||||||
| Shares | Amount | Shares | Amount | Shares | Amount | Shares | Amount | Shares | Amount | Shares | Amount | Shares | Amount | |||||||||||||||||||||||||||||||||||||||||||||||||||||||||||||||
| Balance at December 31, 2016 |
83 | $ | — | 134 | $ | — | 268 | $ | — | 15 | $ | — | 10 | $ | — | 2,809,574 | $ | — | 72,125 | $ | — | $ | 13,082 | $ | 319,907 | $ | 332,989 | $ | 34,280 | $ | 367,269 | |||||||||||||||||||||||||||||||||||||||||||||
| Issuance |
— | — | — | — | — | — | — | — | — | — | — | — | 241,745 | — | — | — | — | — | — | |||||||||||||||||||||||||||||||||||||||||||||||||||||||||
| Repurchase |
— | — | — | — | — | — | — | — | — | — | — | — | (56 | ) | — | — | (50 | ) | (50 | ) | — | (50 | ) | |||||||||||||||||||||||||||||||||||||||||||||||||||||
| Forfeitures |
— | — | — | — | — | — | — | — | — | — | (5,761 | ) | — | (21,313 | ) | — | — | — | — | — | — | |||||||||||||||||||||||||||||||||||||||||||||||||||||||
| Equity-based compensation |
— | — | — | — | — | — | — | — | — | — | — | — | — | — | 2,680 | — | 2,680 | — | 2,680 | |||||||||||||||||||||||||||||||||||||||||||||||||||||||||
| Dividends |
— | — | — | — | — | — | — | — | — | — | — | — | — | — | — | (37,140 | ) | (37,140 | ) | — | (37,140 | ) | ||||||||||||||||||||||||||||||||||||||||||||||||||||||
| Distribution to noncontrolling interests |
— | — | — | — | — | — | — | — | — | — | — | — | — | — | — | — | — | (7,515 | ) | (7,515 | ) | |||||||||||||||||||||||||||||||||||||||||||||||||||||||
| Net income |
— | — | — | — | — | — | — | — | — | — | — | — | — | — | — | 20,855 | 20,855 | 7,515 | 28,370 | |||||||||||||||||||||||||||||||||||||||||||||||||||||||||
|
|
|
|
|
|
|
|
|
|
|
|
|
|
|
|
|
|
|
|
|
|
|
|
|
|
|
|
|
|
|
|
|
|
|
|
|
|
|
|||||||||||||||||||||||||||||||||||||||
| Balance at December 31, 2017 |
83 | $ | — | 134 | $ | — | 268 | $ | — | 15 | $ | — | 10 | $ | — | 2,803,813 | $ | — | 292,501 | $ | — | $ | 15,762 | $ | 303,572 | $ | 319,334 | $ | 34,280 | $ | 353,614 | |||||||||||||||||||||||||||||||||||||||||||||
|
|
|
|
|
|
|
|
|
|
|
|
|
|
|
|
|
|
|
|
|
|
|
|
|
|
|
|
|
|
|
|
|
|
|
|
|
|
|
|||||||||||||||||||||||||||||||||||||||
| Issuances |
— | $ | — | — | $ | — | — | $ | — | — | $ | — | — | $ | — | — | $ | — | 204,577 | $ | — | $ | — | $ | — | $ | — | $ | — | $ | — | |||||||||||||||||||||||||||||||||||||||||||||
| Repurchase |
— | — | — | — | — | — | — | — | — | — | (4,149 | ) | — | (5,808 | ) | — | — | (76 | ) | (76 | ) | — | (76 | ) | ||||||||||||||||||||||||||||||||||||||||||||||||||||
| Forfeitures |
— | — | — | — | — | — | — | — | — | — | (7,766 | ) | — | (69,777 | ) | — | — | — | — | — | — | |||||||||||||||||||||||||||||||||||||||||||||||||||||||
| Equity-based compensation |
— | — | — | — | — | — | — | — | — | — | — | — | — | — | 2,068 | — | 2,068 | — | 2,068 | |||||||||||||||||||||||||||||||||||||||||||||||||||||||||
| Dividends |
— | — | — | — | — | — | — | — | — | — | — | — | — | — | — | (531 | ) | (531 | ) | — | (531 | ) | ||||||||||||||||||||||||||||||||||||||||||||||||||||||
| Corporate reorganization |
— | — | — | — | — | — | — | — | — | — | — | — | — | — | — | — | — | (34,280 | ) | (34,280 | ) | |||||||||||||||||||||||||||||||||||||||||||||||||||||||
| Distributions to noncontrolling interests |
— | — | — | — | — | — | — | — | — | — | — | — | — | — | — | — | — | (7,515 | ) | (7,515 | ) | |||||||||||||||||||||||||||||||||||||||||||||||||||||||
| Net loss |
— | — | — | — | — | — | — | — | — | — | — | — | — | — | — | (110,384 | ) | (110,384 | ) | 7,515 | (102,869 | ) | ||||||||||||||||||||||||||||||||||||||||||||||||||||||
|
|
|
|
|
|
|
|
|
|
|
|
|
|
|
|
|
|
|
|
|
|
|
|
|
|
|
|
|
|
|
|
|
|
|
|
|
|
|
|||||||||||||||||||||||||||||||||||||||
| Balance at December 31, 2018 |
83 | $ | — | 134 | $ | — | 268 | $ | — | 15 | $ | — | 10 | $ | — | 2,791,898 | $ | — | 421,493 | $ | — | $ | 17,830 | $ | 192,581 | $ | 210,411 | $ | — | $ | 210,411 | |||||||||||||||||||||||||||||||||||||||||||||
|
|
|
|
|
|
|
|
|
|
|
|
|
|
|
|
|
|
|
|
|
|
|
|
|
|
|
|
|
|
|
|
|
|
|
|
|
|
|
|||||||||||||||||||||||||||||||||||||||
| Repurchase |
— | $ | — | — | $ | — | — | $ | — | — | $ | — | — | $ | — | — | $ | — | (22,217 | ) | $ | — | $ | — | $ | (5 | ) | $ | (5 | ) | $ | — | $ | (5 | ) | |||||||||||||||||||||||||||||||||||||||||
| Forfeitures |
— | — | — | — | — | — | — | — | — | — | (6,140 | ) | — | (61,333 | ) | — | — | — | — | — | — | |||||||||||||||||||||||||||||||||||||||||||||||||||||||
| Equity-based compensation |
— | — | — | — | — | — | — | — | — | — | — | — | — | — | 191 | — | 191 | — | 191 | |||||||||||||||||||||||||||||||||||||||||||||||||||||||||
| Dividends |
— | — | — | — | — | — | — | — | — | — | — | — | — | — | — | (7,612 | ) | (7,612 | ) | — | (7,612 | ) | ||||||||||||||||||||||||||||||||||||||||||||||||||||||
| Net income |
— | — | — | — | — | — | — | — | — | — | — | — | — | — | — | 34,420 | 34,420 | — | 34,420 | |||||||||||||||||||||||||||||||||||||||||||||||||||||||||
|
|
|
|
|
|
|
|
|
|
|
|
|
|
|
|
|
|
|
|
|
|
|
|
|
|
|
|
|
|
|
|
|
|
|
|
|
|
|
|||||||||||||||||||||||||||||||||||||||
| Balance at December 31, 2019 |
83 | $ | — | 134 | $ | — | 268 | $ | — | 15 | $ | — | 10 | $ | — | 2,785,758 | $ | — | 337,943 | $ | — | $ | 18,021 | $ | 219,384 | $ | 237,405 | $ | — | $ | 237,405 | |||||||||||||||||||||||||||||||||||||||||||||
|
|
|
|
|
|
|
|
|
|
|
|
|
|
|
|
|
|
|
|
|
|
|
|
|
|
|
|
|
|
|
|
|
|
|
|
|
|
|
|||||||||||||||||||||||||||||||||||||||
See accompanying notes to the consolidated financial statements.
F-55
Table of Contents
LD Holdings Group, LLC and Subsidiaries
CONSOLIDATED STATEMENTS OF CASH FLOWS
($ in thousands)
| Year ended December 31, | ||||||||||||
| 2019 | 2018 | 2017 | ||||||||||
| CASH FLOWS FROM OPERATING ACTIVITIES |
||||||||||||
| Net income (loss) |
$ | 34,420 | $ | (102,869 | ) | $ | 28,370 | |||||
| Adjustments to reconcile net income (loss) to net cash used in operating activities: |
||||||||||||
| Depreciation and amortization expense |
37,400 | 36,279 | 31,861 | |||||||||
| Amortization of debt issuance costs |
5,572 | 5,259 | 2,978 | |||||||||
| Amortization of operating lease right-of-use assets |
23,935 | — | — | |||||||||
| Gain on origination and sale of loans |
(1,034,851 | ) | (851,276 | ) | (995,634 | ) | ||||||
| Gain on sale of servicing rights |
(2,718 | ) | (9,807 | ) | (1,592 | ) | ||||||
| Decrease (increase) in trading securities |
25,511 | (24,950 | ) | — | ||||||||
| Fair value change in trading securities |
(426 | ) | (136 | ) | — | |||||||
| Provision for loss obligation on sold loans and servicing rights |
14,746 | 7,604 | 399 | |||||||||
| Fair value change in derivative assets |
(84,058 | ) | 48,466 | 8,608 | ||||||||
| Fair value change in derivative liabilities |
(22,598 | ) | 23,536 | (9,132 | ) | |||||||
| Premium received (paid) on derivatives |
26,269 | (17,757 | ) | (712 | ) | |||||||
| Fair value change in loans held for sale |
(13,996 | ) | (3,481 | ) | (21,404 | ) | ||||||
| Fair value change in servicing rights |
136,502 | 36,881 | 95,664 | |||||||||
| Equity compensation |
191 | 2,068 | 2,680 | |||||||||
| Change in fair value of contingent consideration |
2,374 | (4,881 | ) | (15,731 | ) | |||||||
| Originations of loans |
(44,947,450 | ) | (32,575,334 | ) | (34,754,747 | ) | ||||||
| Proceeds from sales of loans |
44,300,254 | 33,312,118 | 35,172,202 | |||||||||
| Proceeds from principal payments |
109,694 | 107,311 | 48,533 | |||||||||
| Payments to investors for loan repurchases |
(153,315 | ) | (214,628 | ) | (72,773 | ) | ||||||
| Purchase of consumer loans |
— | (110,356 | ) | — | ||||||||
| Disbursements from joint ventures |
12,736 | 14,908 | 15,247 | |||||||||
| Changes in operating assets and liabilities: |
||||||||||||
| Other changes in operating assets and liabilities |
32,428 | (107,743 | ) | (17,180 | ) | |||||||
|
|
|
|
|
|
|
|||||||
| Net cash used in operating activities |
(1,497,380 | ) | (428,788 | ) | (482,363 | ) | ||||||
|
|
|
|
|
|
|
|||||||
| CASH FLOWS FROM INVESTING ACTIVITIES |
||||||||||||
| Purchase of property and equipment |
(12,551 | ) | (40,772 | ) | (39,865 | ) | ||||||
| Proceeds from sale of servicing rights |
153,491 | 425,243 | 86,541 | |||||||||
| Purchase of servicing rights |
— | — | — | |||||||||
| Purchase of consumer loans |
— | — | (118,664 | ) | ||||||||
| Proceeds from principal payments and sales of consumer loans |
— | 118,664 | — | |||||||||
| Payments made to employees for employee loans |
— | — | (50,490 | ) | ||||||||
| Cash paid, net of cash received for acquisitions, net |
— | — | (455 | ) | ||||||||
| Return of capital from joint ventures |
150 | — | — | |||||||||
|
|
|
|
|
|
|
|||||||
| Net cash flows provided by (used in) investing activities |
141,090 | 503,135 | (122,933 | ) | ||||||||
|
|
|
|
|
|
|
|||||||
F-56
Table of Contents
LD Holdings Group, LLC and Subsidiaries
CONSOLIDATED STATEMENTS OF CASH FLOWS - CONTINUED
($ in thousands)
| Year ended December 31, | ||||||||||||
| 2019 | 2018 | 2017 | ||||||||||
| CASH FLOWS FROM FINANCING ACTIVITIES |
||||||||||||
| Proceeds from borrowings on warehouse lines of credit |
$ | 44,140,738 | $ | 31,574,269 | $ | 34,020,357 | ||||||
| Repayment of borrowings on warehouse lines of credit |
(42,800,811 | ) | (31,706,294 | ) | (33,667,094 | ) | ||||||
| Proceeds from debt obligations |
238,600 | 348,490 | 580,500 | |||||||||
| Payments on debt obligations |
(195,740 | ) | (269,554 | ) | (275,718 | ) | ||||||
| Payments of debt issuance costs |
(4,238 | ) | (6,716 | ) | (8,387 | ) | ||||||
| Payments for contingent consideration |
(961 | ) | (3,692 | ) | (7,827 | ) | ||||||
| Proceeds from financing lease transactions |
7,816 | 26,518 | — | |||||||||
| Payments on financing lease obligations |
(17,993 | ) | (13,720 | ) | (9,971 | ) | ||||||
| Payments on repurchase of units |
(5 | ) | (76 | ) | — | |||||||
| Distributions to noncontrolling interests |
— | — | (7,098 | ) | ||||||||
| Dividend distributions |
(7,612 | ) | (6,168 | ) | (37,190 | ) | ||||||
|
|
|
|
|
|
|
|||||||
| Net cash provided by (used in) financing activities |
1,359,794 | (56,943 | ) | 587,572 | ||||||||
|
|
|
|
|
|
|
|||||||
| Net change in cash and cash equivalents and restricted cash |
3,504 | 17,404 | (17,724 | ) | ||||||||
|
|
|
|
|
|
|
|||||||
| Cash and cash equivalents and restricted cash at beginning of the year |
113,992 | 96,588 | 114,312 | |||||||||
|
|
|
|
|
|
|
|||||||
| Cash and cash equivalents and restricted cash at end of the year |
$ | 117,496 | $ | 113,992 | $ | 96,588 | ||||||
|
|
|
|
|
|
|
|||||||
| SUPPLEMENTAL DISCLOSURES OF CASH FLOW INFORMATION |
||||||||||||
| Cash paid during the period for: |
||||||||||||
| Interest |
$ | 159,749 | $ | 142,696 | $ | 95,834 | ||||||
| Income taxes |
4,036 | 699 | 1,262 | |||||||||
| Supplemental disclosure of noncash investing and financing activities |
||||||||||||
| Operating lease right-of-use assets received in exchange for lease liabilities |
$ | 85,628 | $ | — | $ | — | ||||||
| Purchase of equipment under financing leases |
14,190 | — | 4,935 | |||||||||
| Acquisitions: |
||||||||||||
| Fair value of assets acquired |
— | — | 1,590 | |||||||||
| Less: Fair value of liabilities assumed |
— | — | (348 | ) | ||||||||
| Net assets acquired |
— | — | 1,242 | |||||||||
See accompanying notes to the consolidated financial statements.
F-57
Table of Contents
LD Holdings Group, LLC and Subsidiaries
NOTES TO CONSOLIDATED FINANCIAL STATEMENTS
($ in thousands, unless otherwise indicated)
NOTE 1 – DESCRIPTION OF BUSINESS, PRESENTATION AND SUMMARY OF SIGNIFICANT ACCOUNTING POLICIES
Nature of Operations
LD Holdings Group, LLC and its subsidiaries (collectively referred to herein as “LD Holdings” or the “Company”) provides mortgage and other consumer loans and related services associated with these activities such as servicing of loans and settlement services for real estate transactions. The Company derives income primarily from gains from the sale of loans to investors, income from loan servicing, and fees charged for settlement services related to the origination and sale of loans. The Company was formed as a Delaware corporation on October 16, 2015 and had no operations or activities until December 31, 2017 (see Reorganization, below). The Company operates under the LD Holdings Group LLC Limited Liability Company Agreement (the “LLC Agreement”) dated December 31, 2018.
Consolidation and Basis of Presentation
The Company’s consolidated financial statements include loanDepot.com, LLC (“loanDepot”), its controlled consolidated subsidiaries LD Escrow, Inc. (“LD Escrow”), LD Settlement Services, LLC (“LDSS”), mello Holdings, LLC (“MH”), Artemis Management LLC (“ART”) and consolidated variable interest entities (“VIEs”) in which the Company is the primary beneficiary. loanDepot engages in the originating, financing, selling and servicing of residential mortgage and consumer loans, and engages in title, escrow and settlement services for mortgage loan transactions. Other entities that the Company does not consolidate, but for which it has significant influence over operating and financial policies, are accounted for using the equity method.
On March 1, 2018, loanDepot’s interest in ART was transferred to LD Holdings. On December 31, 2018, the Company exchanged and converted the Class I Units of loanDepot held by each Class I Unitholder into substantially similar equity securities of LD Holdings.
The Company’s consolidated financial statements are prepared in accordance with generally accepted accounting principles in the United States of America (“GAAP”) as codified in the Financial Accounting Standards Board’s (“FASB”) Accounting Standards Codification (the “Codification”). All intercompany accounts and transactions have been eliminated in consolidation. Certain prior period amounts have been reclassified to conform to the current year’s presentation.
Summary of Significant Accounting Policies
A description of the Company’s significant accounting policies applied in the preparation of the accompanying consolidated financial statements follows.
Use of Estimates
The preparation of financial statements in conformity with GAAP requires management to make estimates and assumptions that affect the reported amounts of assets and liabilities and disclosure of contingent assets and liabilities at the date of the financial statements and the reported amounts of income and expenses during the reporting period. Management has made significant estimates in certain areas, including determining the fair value of loans held for sale, servicing rights, derivative assets and derivative liabilities, awards granted under the incentive equity plan, assets acquired and liabilities assumed in business combinations, and determining the loan loss obligation on sold loans. Actual results could differ from those estimates.
F-58
Table of Contents
Reportable Segments
The Company’s organizational structure is currently comprised of one operating segment. This determination is based on the organizational structure, which reflects how the chief operating decision maker evaluates the performance of the business. The Company’s chief operating decision maker evaluates the performance of our divisions that comprise our one segment based on the measurement of income before income taxes.
Cash and Cash Equivalents
All highly liquid investments with an original maturity of three months or less are considered to be cash equivalents. As of December 31, 2019 and 2018, all amounts recorded in cash and cash equivalents represent cash held in banks, with the exception of insignificant amounts of petty cash held on hand.
Restricted Cash
Cash balances that have restrictions as to the Company’s ability to withdraw funds are considered restricted cash. Restricted cash is the result of the terms of the Company’s warehouse lines of credit and debt obligations. In accordance with the terms of the warehouse lines of credit and debt obligations, the Company is required to maintain cash balances with the lender as additional collateral for the borrowings.
Fair Value
Assets and liabilities measured at fair value are categorized based on whether the inputs are observable in the market and the degree that the inputs are observable. The categorization of assets and liabilities measured at fair value within the valuation hierarchy is based on the lowest level of input that is significant to the fair value measurement. The hierarchy is prioritized into three levels (with Level 3 being the lowest) defined as follows:
| • | Level 1 - Quoted prices in active markets for identical assets or liabilities that the Company has the ability to access. |
| • | Level 2 - Prices determined or determinable using other significant observable inputs. Observable inputs are inputs that other market participants would use in pricing an asset or liability and are developed based on market data obtained from sources independent of the Company. These may include quoted prices for similar assets and liabilities, interest rates, prepayment speeds, credit risk and other inputs. |
| • | Level 3 - Prices determined using significant unobservable inputs. In situations where quoted prices or observable inputs are unavailable (for example, when there is little or no market activity), unobservable inputs may be used. Unobservable inputs reflect the Company’s own assumptions about the factors that market participants would use in pricing the asset or liability, and are based on the best information available in the circumstances. |
The fair value option provides an option to elect fair value as an alternative measurement for selected financial assets, financial liabilities, unrecognized firm commitments, and written loan commitments not previously carried at fair value. The Company has elected the fair value option on loans held for sale and servicing rights. Elections were made to mitigate income statement volatility caused by differences in the measurement basis of elected instruments with derivative financial instruments that are carried at fair value.
Loans Held for Sale, at Fair Value
Management has elected to account for loans held for sale (“LHFS”) at fair value, with changes in fair value recognized in current period income, to more timely reflect the Company’s performance. All changes in fair value, including changes arising from the passage of time, are recognized as a component of Gain on origination and sale of loans, net. The Company classifies LHFS as “Level 2” fair value financial instruments.
F-59
Table of Contents
Sale Recognition
The Company recognizes transfers of loans held for sale as sales when it surrenders control over the loans. Control over transferred assets is deemed to be surrendered when (i) the assets have been isolated from the Company, (ii) the transferee has the right (free of conditions that constrain it from taking advantage of that right) to pledge or exchange the transferred assets, and (iii) the Company does not maintain effective control over the transferred assets through either (a) an agreement that entitles and obligates the Company to repurchase or redeem them before their maturity or (b) the ability to unilaterally cause the holder to return specific assets.
Interest Income and Expense Recognition
Interest income on loans held for sale is recognized using their contractual interest rates. Interest income recognition is suspended for loans when they become 90 days delinquent, or when, in management’s opinion, a full recovery of interest and principal becomes doubtful. Interest income recognition is resumed when the loan becomes contractually current. When loans are placed on non-accrual status, all interest previously accrued but not collected is reversed against current period interest income. Interest income on non-accrual loans is subsequently recognized only to the extent cash is received.
Interest expense on warehouse and other lines of credit, debt obligations, and other types of borrowings is recognized using their contractual rates. Interest expense includes the amortization of expenses incurred in connection with financing activities over the term of the related borrowings.
Origination Income, net Recognition
Origination income, net, reflects the fees earned, net of lender credits paid from originating loans. Origination income includes loan origination fees, processing fees, underwriting fees and other fees collected from the borrower at the time of funding, as well as the platform licensing fee income received from personal loan products. Lender credits typically include rebates or concessions to borrowers for certain loan origination costs.
Securitizations and Variable Interest Entities
The Company is involved in several types of securitization and financing transactions that utilize special-purpose entities (SPEs). A SPE is an entity that is designed to fulfill a specified limited need of the sponsor. The Company’s principal use of SPEs is to obtain liquidity by securitizing certain of its financial and non-financial assets. SPEs involved in the Company’s securitization and other financing transactions are often considered VIEs. VIEs are entities that have a total equity investment at risk that is insufficient to permit the entity to finance its activities without additional subordinated financial support, whose equity investors at risk lack the ability to control the entity’s activities, or is structured with non-substantive voting rights.
Securitization transactions are accounted for either as sales or secured borrowings. The Company may retain economic interests in the securitized and sold assets, which are generally retained in the form of subordinated interests, residual interests, and/or servicing rights.
In order to conclude whether or not a VIE is required to be consolidated, careful consideration and judgment must be given to the Company’s continuing involvement with the VIE. In circumstances where the Company has a variable interest along with the power to direct the activities of the entity that most significantly impact the entity’s performance or meet other criteria, the Company would conclude to consolidate the entity, which would also preclude the Company from recording an accounting sale on the transaction. In the case of a consolidated VIE, the accounting reflects a secured borrowing (e.g., the securitized loans or assets and the related debt are reported on the Company’s consolidated balance sheets).
In transactions where the Company does not meet the consolidation guidance (i.e. the Company is not determined to be the primary beneficiary of the VIE or other factors), the Company must determine whether or
F-60
Table of Contents
not it achieves a sale for accounting purposes. In order to achieve a sale for accounting purposes, the assets being transferred must be legally isolated, not be constrained by restrictions from further transfer, and be deemed to be beyond the Company’s control. If the Company were to fail any of the three criteria for sale accounting, the accounting would be consistent with the preceding paragraph (i.e., a secured borrowing). Refer to Note 11 – Variable Interest Entities for discussion on VIEs.
Whether on- or off-balance sheet, the investors in the securitization trusts have no recourse to the Company’s assets outside of protections afforded through customary market representation and warranty repurchase provisions.
Derivative Financial Instruments
Derivative financial instruments are recognized as assets or liabilities and are measured at fair value. The Company accounts for derivatives as free-standing derivatives and does not designate any derivative financial instruments for hedge accounting. All derivative financial instruments are recognized on the consolidated balance sheets at fair value with changes in the fair values being reported in current period earnings.
The Company enters into commitments to originate loans held for sale, at specified interest rates, with customers who have applied for residential mortgage loans and meet certain credit and underwriting criteria. These interest rate lock commitments (“IRLCs”) meet the definition of a derivative financial instrument and are recorded at fair value with changes in fair value recognized in current period earnings. Unrealized gains and losses on the IRLCs are recorded as derivative assets and derivative liabilities, respectively, and are measured based on the value of the underlying loan, quoted MBS prices, estimates of the fair value of the servicing rights and an estimate of the probability that the loan will fund within the terms of the interest rate lock commitment, net of estimated costs.
The Company is exposed to price risk related to its loans held for sale, IRLCs and servicing rights. The Company bears price risk from the time a commitment to originate a loan is made to a borrower or to purchase a loan from a third-party, to the time the loan is sold. During this period, the Company is exposed to losses if mortgage interest rates rise because the value of the IRLC or the loan held for sale decreases. Reductions in the value of these assets affect income primarily through change in fair value. Servicing rights are accounted for at fair value and the Company is exposed to losses on servicing rights if mortgage interest rates decline. Reductions in the value of servicing rights affect income primarily through changes in fair value.
The Company manages the price risk created by IRLCs and loans held for sale by entering into forward sale agreements to sell the loans and by the purchase and sale of mortgage-backed securities (“MBS”) trades and options on Treasury futures. Such agreements are also accounted for as derivative financial instruments. Forward sale agreements and options are included in derivative assets, at fair value and derivative liabilities, at fair value on the consolidated balance sheets. The Company classifies IRLCs as “Level 3” financial statement items, and the derivative financial instruments it acquires to manage the risks created by IRLCs and loans held for sale as “Level 2” fair value financial statement items. The Company manages the risk created by servicing rights by hedging the fair value of servicing rights with interest rate swap futures and options on Treasury bond future contracts. The Company classifies the interest rate swap futures and options on Treasury bond futures contracts as “Level 1” financial statement items. The Company does not use derivative financial instruments for purposes other than in support of its risk management activities.
Changes in fair value of derivatives hedging IRLCs and loans held for sale at fair value are included in gain on origination and sale of loans, net on the consolidated statements of operations. Changes in fair value of servicing rights hedging are included in changes in fair value of servicing rights, net on the consolidated statements of operations.
The Company has master netting arrangements with certain counterparties of derivative instruments and warehouse lines. Under these master netting arrangements, the Company can offset the fair value of the
F-61
Table of Contents
derivative instrument against the fair value of the LHFS collateralizing the warehouse line, thereby netting the increase or decrease in the fair value of the derivative instruments against the increase or decrease in the fair value of the LHFS. The Company’s policy is to present such arrangements on the associated assets and liabilities on a gross basis in the consolidated balance sheets.
Servicing Rights
Servicing rights arise from contractual agreements between the Company and investors (or their agents) in mortgage securities and mortgage loans. Under these contracts, the Company performs loan servicing functions in exchange for fees and other remuneration. Servicing functions typically include, among other responsibilities, collecting and remitting loan payments; responding to borrower inquiries; accounting for principal and interest; holding custodial (impound) funds for payment of property taxes and insurance premiums; counseling delinquent mortgagors; supervising the acquisition of real estate in settlement of loans and property disposition. The Company utilizes a sub-servicer to service its loan servicing portfolio. The Company is required to make servicing advances on behalf of borrowers and investors to cover delinquent balances for property taxes, insurance premiums and other costs. Advances are made in accordance with servicing agreements and are recoverable upon collection from the borrower or foreclosure of the underlying loans. The Company periodically reviews the receivable for collectability and amounts are written-off when deemed uncollectible. As of December 31, 2019 and 2018, the Company had $23.5 million and $24.6 million, respectively, in outstanding servicing advances included in prepaid expenses and other assets.
When the Company sells a loan on a servicing-retained basis, it recognizes a servicing asset at fair value based on the present value of future cash flows generated by the servicing asset retained in the sale. The Company has made the election to carry its servicing rights at fair value.
The value of the servicing rights is derived from the net positive cash flows associated with the servicing contracts. The Company receives a servicing fee monthly on the remaining outstanding principal balances of the loans subject to the servicing contracts. The servicing fees are collected from the monthly payments made by the mortgagors. The Company is contractually entitled to receive other remuneration including rights to various mortgagor-contracted fees such as late charges, collateral reconveyance charges and loan prepayment penalties, and the Company is generally entitled to retain the interest earned on funds held pending remittance related to its collection of mortgagor payments. The Company also generally has the right to solicit the mortgagors for other products and services as well as for new mortgages for those considering refinancing or purchasing a new home.
The Company is exposed to fair value risk related to its servicing rights. Servicing rights generally decline in fair value when market mortgage interest rates decrease. Decreasing market mortgage interest rates normally encourage increased mortgage refinancing activity. Increased refinancing activity reduces the life of the loans underlying the servicing rights, thereby reducing their value. Reductions in the value of these assets affect income primarily through change in fair value.
The fair value of servicing rights is difficult to determine because servicing rights are not actively traded in observable stand-alone markets. The Company uses a discounted cash flow approach to estimate the fair value of servicing rights. This approach consists of projecting servicing cash flows. The inputs used in the Company’s discounted cash flow model are based on market factors, which management believes are consistent with assumptions and data used by market participants valuing similar servicing rights. The key inputs used in the valuation of servicing rights include mortgage prepayment speeds, cost to service the loans and discount rates. These inputs can, and generally do, change from period to period as market conditions change. Considerable judgment is required to estimate the fair values of servicing rights and the exercise of such judgment can significantly affect the Company’s income. Therefore, the Company classifies its servicing rights as “Level 3” fair value financial statement items.
F-62
Table of Contents
Servicing Fee Income
The Company receives servicing fee income from its servicing portfolio. Servicing fee income is recognized on an accrual basis and is recorded to servicing fee income. The Company’s subservicing expenses are recorded to subservicing expense.
Change in Fair Value of Servicing Rights, net
Unrealized gains (losses) resulting from changes in the fair value of servicing rights are recorded to change in fair value of servicing rights, net. Realized and unrealized hedging gains (losses) associated with interest rate swap futures and options on Treasury bond future contracts used to hedge interest rate risk on servicing rights are recorded in changes in fair value of servicing rights, net. Realized gains (losses) from the sale of servicing rights are also included in change in fair value of servicing rights, net.
Sale Recognition
The Company recognizes sales of servicing rights to a purchaser as sales when (i) the Company has received approval from the investor, if required, (ii) the purchaser is currently approved as a servicer and is not at risk of losing approval status, (iii) if the portion of the sales price has been financed, an adequate nonrefundable down payment has been received and the note receivable from the purchaser provides full recourse to the purchaser, and (iv) any temporary servicing performed by the Company for a short period of time is compensated in accordance with a subservicing contract that provides adequate compensation. Additionally, the Company recognizes sales of servicing rights as sales if title passes, if substantially all risks and rewards of ownership have irrevocably passed to the purchaser and any protection provisions retained by the Company are minor and can be reasonably estimated. In addition, if a sale is recognized and only minor protection provisions exist, a liability is accrued for the estimated obligation associated with those provisions.
Trading Securities, at Fair Value
The Company accounts for trading securities at fair value, with changes in fair value recognized in current period income in other income. Other income includes net realized and unrealized gains and losses on trading securities. Trading securities may be pledged as collateral to secure debt obligations and are held for liquidity purposes.
Accounts Receivable, net
Accounts receivable are stated amounts due from customers or from investors for loans sold, net of an allowance for doubtful accounts. Accounts receivable that are outstanding longer than the contractual payment terms are considered past due. The Company establishes a reserve for all amounts due from borrowers and investors that are over 150 days old. There was $1.3 million and $0.4 million in allowance for doubtful accounts at December 31, 2019 and 2018, respectively. The Company writes off accounts receivable when management deems them uncollectible. There were $1.0 million, $1.0 million and $1.2 million of accounts receivable write-offs during the years ended December 31, 2019, 2018 and 2017, respectively.
Property and Equipment
Property and equipment are recorded at cost and depreciated over their estimated useful lives using the straight-line method. Leasehold improvements are capitalized and amortized over the lesser of the life of the lease or the estimated useful life of the asset. Useful lives for purposes of computing depreciation are as follows:
| Years | ||
| Leasehold improvements |
2-15 | |
| Furniture and equipment |
5-7 | |
| Computer software |
3-5 |
F-63
Table of Contents
Expenditures that materially increase the asset life are capitalized, while ordinary maintenance and repairs are charged to operations as incurred. When assets are sold or retired, the cost and related accumulated depreciation are removed from the accounts and any resulting gains or losses are included in earnings.
Leases
The Company determines if an arrangement contains a lease at contract inception and recognize operating lease right-of-use (“ROU”) assets and corresponding operating lease liability based on the present value of lease payments over the lease term, except leases with initial terms less than or equal to 12 months. While the operating leases may include options to extend the term, these options are not included when calculating the operating lease right-of-use asset and lease liability unless the Company is reasonably certain it will exercise such options. Most of the leases do not provide an implicit rate and, therefore, the Company determines the present value of lease payments by using the Company’s incremental borrowing rate. Leases with an initial term of 12 months or less are not recorded in the consolidated balance sheets. The Company’s lease agreements include both lease and non-lease components (such as common area maintenance), which are generally included in the lease and are accounted for together with the lease as a single lease component. Certain of the Company’s lease agreements permit it to sublease leased assets. Sublease income is included as a component of lease expense.
Operating lease ROU assets are regularly reviewed for impairment under the long-lived asset impairment guidance in ASC Subtopic 360-10, Property, Plant and Equipment—Overall.
Goodwill and Other Intangible Assets
Business combinations are accounted for using the acquisition method of accounting. Acquired intangible assets are recognized and reported separately from goodwill. Goodwill represents the excess cost of acquisition over the fair value of net assets acquired.
Intangible assets with finite lives are amortized over their estimated lives using the straight-line method. On an annual basis, during the fourth quarter, the Company evaluates whether there has been a change in the estimated useful life or if certain impairment indicators exist.
Goodwill must be allocated to reporting units and tested for impairment. Goodwill is tested for impairment at least annually during the fourth quarter, and more frequently if events or circumstances, such as adverse changes in the business climate, indicate there may be justification for conducting an interim test. Impairment testing is performed at the reporting unit level.
In testing goodwill for impairment, the Company first assesses qualitative factors to determine whether it is more likely than not that the fair value of a reporting unit is less than its carrying amount. In making this assessment, the Company considers all relevant events and circumstances. These include, but are not limited to, macroeconomic conditions, industry and market considerations and the reporting unit’s overall financial performance. If the Company concludes, based on its qualitative assessment, that it is more likely than not that the fair value of the reporting unit is at least equal to its carrying amount, then the Company concludes that the goodwill of the reporting unit is not impaired and no further testing is performed. However, if the Company determines, based on its qualitative assessment, that it is more likely than not that the fair value of a reporting unit is less than its carrying amount, then the Company will perform the quantitative goodwill impairment test. At the Company’s option, it may, in any given period, bypass the qualitative assessment and proceed directly to the quantitative approach.
The quantitative assessment begins with a comparison of the fair value of a reporting unit to its carrying amount, including goodwill. If the fair value of the reporting unit is less than its carrying amount, an impairment loss shall be recognized in an amount equal to the difference, limited to the total amount of goodwill for the reporting unit. No impairment was recorded during the years ended December 31, 2019, 2018 and 2017.
F-64
Table of Contents
Long-Lived Assets
The Company periodically assesses long-lived assets, including property and equipment, for recoverability when events or changes in circumstances indicate that their carrying amount may not be recoverable. If management identifies an indicator of impairment, it assesses recoverability by comparing the carrying amount of the asset to the sum of the undiscounted cash flows expected to result from the use and the eventual disposal of the asset. An impairment loss is recognized when the carrying amount is not recoverable and is measured as the excess of carrying value over fair value. No such impairment was recorded during the years ended December 31, 2019, 2018 and 2017.
Loan Loss Obligation on Loans Sold
When the Company sells loans to investors, the risk of loss or default by the borrower is generally transferred to the investor. However, the Company is required by these investors to make certain representations relating to credit information, loan documentation and collateral. These representations and warranties may extend through the contractual life of the mortgage loan. Subsequent to the sale, if underwriting deficiencies, borrower fraud or documentation defects are discovered in individual mortgage loans, the Company may be obligated to repurchase the respective mortgage loan or indemnify the investors for any losses from borrower defaults if such deficiency or defect cannot be cured within the specified period following discovery.
In the case of early loan payoffs and early defaults on certain loans, the Company may be required to repay all or a portion of the premium initially paid by the investor on loans. The estimated obligation associated with early loan payoffs and early defaults is calculated based on historical loss experience.
The obligation for losses related to the representations and warranties and other provisions discussed above is recorded based upon an estimate of losses. Because the Company does not service all of the loans it sells, it does not maintain nor have access to the current balances and loan performance data with respect to all of the individual loans previously sold to investors. However, the Company uses industry-available prepayment data and historical and projected loss frequency and loss severity ratios to estimate its exposure to losses on loans previously sold. Given current general industry trends in mortgage loans as well as housing prices, market expectations around losses related to the Company’s obligations could vary significantly from the obligation recorded as of the balance sheet date. The Company records a provision for loan losses, included in gain on origination and sale of loans, net in the consolidated statements of operations, to establish the loan repurchase reserve for sold loans which is reflected in accounts payable and accrued expenses on the consolidated balance sheets.
Income Taxes
The Company is a limited liability company (“LLC”). Under federal and applicable state laws, taxes based on income of an LLC treated as a partnership are payable by the LLC’s members individually and not at the entity level. Additionally, the Company is subject to annual state LLC franchise taxes and state LLC fees. These taxes and fees are included in general and administrative expenses.
The Company’s provision for income taxes at the consolidated level include federal, state and local taxes for LD Escrow and American Coast Title Company, Inc. (“ACT”), two wholly-owned subsidiaries that are both C corporations, for the years ended December 31, 2019 and 2018.
Income taxes are accounted for under the asset and liability method. Under this method, deferred tax assets and liabilities are recognized for future tax consequences attributable to differences between the consolidated financial statement carrying amounts of existing assets and liabilities and their respective tax bases. Deferred tax assets and liabilities are measured using enacted tax rates for the periods in which the differences are expected to reverse. The effect on deferred tax assets and liabilities of a change in tax rates is recognized in income in the period that includes the change.
F-65
Table of Contents
The Company evaluates tax positions taken or expected to be taken in the course of preparing the Company’s tax returns to determine whether the tax positions are “more-likely-than-not” of being sustained by the applicable tax authority. Tax positions deemed to meet the more-likely than-not threshold of being sustained would be recorded as a tax benefit in the current period. The Company has reviewed all open tax years (2015 - 2019) in each respective jurisdiction and concluded that it has a tax liability resulting from unrecognized tax benefits relating to uncertain income tax positions.
Redeemable Units
In accordance with the guidance in FASB ASC Topic 480, Distinguishing Liabilities from Equity, outstanding Class I, A, B, P, P-2, P-3 and Z-1 Redeemable Units were classified outside of permanent equity and within temporary equity due to their associated redemption features and liquidation preferences. In a liquidation event, the Redeemable Units have preference over the Units classified as permanent equity to any proceeds from a liquidation event at amounts described for each Unit Class. Proceeds include cash or the issuance of stock to Unitholders in a qualified public offering. A liquidation event includes (i) the sale or disposition of substantially all of the Company’s assets, (ii) a merger or consolidation in which the stockholders of the Company prior to the transaction no longer hold at least 50 percent of the voting power of the merged or consolidated entity, (iii) a liquidation, dissolution, or winding up of the Company, or (iv) a qualified public offering. Upon a qualified public offering each Unit would receive proceeds (cash or shares of stock) at the applicable liquidation preference proportional to its value in the overall Company.
Noncontrolling Interests
Through December 31, 2018, noncontrolling interests represented Class I Common Units in loanDepot.com, LLC (the “Class I Common Units”) held by the minority owners in loanDepot.com, LLC that the Company consolidated in its financial statements. On December 31, 2018 the Company exchanged the Class I Common Units held by the minority owners in loanDepot.com LLC for Class I Common Units in the Company.
Equity-Based Compensation
The Company’s 2009 Incentive Equity Plan, 2012 Incentive Equity Plan, and 2015 Incentive Equity Plan (collectively, the “Plans”) provide for awards of various classes of Common Units, as described in the Plans. The Company uses the grant-date fair value of equity awards to determine the compensation cost associated with each award. Grant-date fair value is determined using the Black-Scholes pricing model adjusted for unique characteristics of the specific awards. Compensation cost for service-based equity awards is recognized on a straight-line basis over the requisite service period, which is generally the vesting period. Compensation cost for awards with only service conditions that have graded vesting schedules is recognized on a straight-line basis over the requisite service period for the entire award such that compensation cost recognized at any date is at least equal to the portion of the grant-date value of the award that is vested at that date. Expense is reduced for actual forfeitures as they occur. The cost of equity-based compensation is recorded to personnel expense.
Advertising
Advertising costs are expensed in the period incurred and principally represent online advertising costs, including fees paid to search engines, distribution partners, master service agreements with brokers, and desk rental agreements with realtors. Advertising expense amounted to $187.9 million, $190.8 million and $216.0 million for the years ended December 31, 2019, 2018 and 2017, respectively. Prepaid advertising expenses are capitalized and recognized during the period the expenses are incurred. As of December 31, 2019 and 2018, capitalized advertising expense totaled $0.9 million and none, respectively, recorded in prepaid expenses and other assets.
F-66
Table of Contents
Concentration of Risk
The Company has concentrated its credit risk for cash by maintaining deposits in several financial institutions, which may at times exceed amounts covered by insurance provided by the Federal Deposit Insurance Corporation (FDIC). The Company has not experienced any losses in such accounts and believes it is not exposed to any significant credit risk related to cash.
Due to the nature of the mortgage lending industry, changes in interest rates may significantly impact revenue from originating mortgages and subsequent sales of loans to investors, which are the primary source of income for the Company. The Company originates mortgage loans on property located throughout the United States, with loans originated for property located in California totaling approximately 21% of total loan originations for the year ended December 31, 2019.
The Company sells mortgage loans to various third-party investors. Four investors accounted for 26%, 17%, 11% and 11% of the Company’s loan sales for the year ended December 31, 2019. No other investors accounted for more than 5% of the loan sales for the year ended December 31, 2019.
The Company funds loans through warehouse lines of credit. As of December 31, 2019, 18% and 17% of the Company’s warehouse lines were payable to two separate lenders.
NOTE 2 – RECENT ACCOUNTING PRONOUNCEMENTS
The Financial Accounting Standards Board (“FASB”) issued Accounting Standards Update (“ASU”) Nos. 2014-09, 2016-08, 2016-10, 2016-12, and 2016-20, collectively implemented as FASB Accounting Standards Codification Topic 606 (“ASC 606”) “Revenue from Contracts with Customers”, provides guidance for revenue recognition. ASC 606 core principle requires a company to recognize revenue when it transfers promised goods or services to customers in an amount that reflects consideration to which the company expects to be entitled in exchange for those goods or services. The standard also clarifies the principal versus agent considerations, providing the evaluation must focus on whether the entity has control of the goods or services before they are transferred to the customer. The new standard permits the use of either the modified retrospective or full retrospective transition method. The Company’s revenue is generated from gains from the sale of loans to investors, income from loan servicing, and fees charged for settlement services related to the origination and sale of loans. Origination revenue is comprised of fee income earned at origination of a loan, interest income earned for the period the loans are held, and gain on sale on loans upon disposition of the loan. Servicing fee income is comprised of servicing fees and other ancillary fees in connection with Company’s mortgage servicing rights. Settlement service revenue is comprised of income earned from providing title, escrow and settlement services for real estate transactions. The Company performed a review of the new guidance as compared to its current accounting policies, and evaluated all services rendered to its customers as well as underlying contracts to determine the impact of this standard to its revenue recognition process. The majority of services rendered by the Company in connection with originations and servicing are not within the scope of ASC 606. However, the Company identified settlement services revenues that are within the scope of FASB ASC 606 and the impact upon adoption was not materially different from the previous revenue recognition processes. On January 1, 2018, the Company adopted ASC 606 by applying the modified retrospective method. Timing of recognition of the Company’s revenue was not impacted by the adoption of ASC 606 and therefore there was no cumulative effect adjustment to the Company’s consolidated financial statements.
In January 2016, the FASB issued ASU 2016-01, “Recognition and Measurement of Financial Assets and Financial Liabilities.” This update revises an entity’s accounting related to the classification and measurement of investments in equity securities (except those accounted for under the equity method of accounting or those that result in consolidation of the investee), changes the presentation of certain fair value changes relating to instrument specific credit risk for financial liabilities, requires public business entities to use the exit price notion when measuring the fair value of financial instruments for disclosure purposes, requires separate presentation of
F-67
Table of Contents
financial assets and financial liabilities by measurement category and form of financial asset (i.e., securities or loans and receivables), and eliminates the requirement for public business entities to disclose the method(s) and significant assumptions used to estimate the fair value that is required to be disclosed for financial instruments measured at amortized cost. The Company adopted this guidance on January 1, 2018, and the adoption of this ASU did not have a material impact on the Company’s consolidated financial statements.
In February 2016, the FASB issued ASU 2016-02, “Leases (Topic 842)”, and subsequent amendments to the initial guidance: ASU 2017-13, ASU 2018-10, ASU 2018-11, ASU 2018-20 and ASU 2019-01 (collectively, Topic 842). This update revises an entity’s accounting for operating leases by a lessee, among other changes, and requires a lessee to recognize a liability to make lease payments and an asset representing its right to use the underlying asset for the lease term in the statement of financial position. The distinction between finance and operating leases has not changed and the update does not significantly change the effect of finance and operating leases on the statement of comprehensive income and the statement of cash flows. Additionally, this update requires both qualitative and specific quantitative disclosures. This update is effective for public companies for annual periods beginning after December 15, 2018 and interim periods thereafter. The Company adopted the update on January 1, 2019 using the modified retrospective approach and did not adjust amounts reported in the prior comparative periods. The Company elected to apply the package of practical expedients which permits entities to not reassess: (i) whether any expired or existing contracts contain a lease; (ii) lease classification for any expired or existing leases; and (iii) whether initial direct costs for any existing leases qualify for capitalization under the amended guidance. The Company also elected not to include short-term leases (leases with initial terms of 12 months or less) in the consolidated balance sheets.
Upon adoption, the Company recognized operating lease right-of-use assets of $71.9 million and a corresponding operating lease liability $94.9 million, net of a reclassification of $23.1 million of deferred rent from accounts payable and accrued expenses. The Company did not adjust amounts reported in the prior comparative period. At the adoption date, ASU 2016-02 did not have any effect on the Company’s consolidated statements of operations, unitholders’ equity and noncontrolling interests or cash flows.
In June 2016, the FASB issued ASU 2016-13, “Financial Instruments-Credit Losses (Topic 326): Measurement of Credit Losses on Financial Instruments.” ASU 2016-13 replaces the existing measurement of the allowance for credit losses that is based on an incurred loss accounting model with an expected loss model, which requires the Company to use a forward-looking expected credit loss model for accounts receivable, loans and other financial instruments that are measured on the amortized cost basis. The majority of the Company’s financial assets are measured at fair value and therefore, not subject to the requirements of ASU 2016-13. The adoption of the amendments in ASU 2016-13 on January 1, 2020 did not have a significant effect on the Company’s allowance for credit losses on its assets subject to ASU 2016-13 due to the assets’ relatively short-term lives.
In August and November 2016, the FASB issued ASU 2016-15, “Classification of Certain Cash Receipts and Cash Payments,” and ASU 2016-18, “Statement of Cash Flows (Topic 230) Restricted Cash” to address eight specific cash flow issues and is intended to reduce diversity in practice in how entities present and classify certain cash receipts and cash payments in the statement of cash flows. ASU 2016-15 addresses the following eight cash flow classification issues: (1) debt prepayment or debt extinguishment costs, (2) settlement of zero-coupon debt instruments or other debt instruments with coupon interest rates that are insignificant in relation to the effective interest rate of the borrowing, (3) contingent consideration payments made after a business combination, (4) proceeds from the settlement of life insurance claims, (5) proceeds from the settlement of corporate owned life insurance policies, including bank-owned life insurance policies, (6) distributions received from equity method investees, (7) beneficial interests in securitization transactions and (8) separately identifiable cash flows and application of the predominance principle. ASU 2016-18 addresses the classification and presentation of changes in restricted cash on the statement of cash flows. This new standard requires that the statement of cash flows explains the change during the period in the total of cash, cash equivalents, and amounts generally described as restricted cash or restricted cash equivalents. Entities will also be required to reconcile
F-68
Table of Contents
such total to amounts on the balance sheet and disclose the nature of the restrictions. The Company adopted this guidance on January 1, 2018 with restricted cash presented with cash and cash equivalents on the Company’s consolidated statements of cash flows for all periods presented.
In August 2017, the FASB issued ASU No. 2017-12, “Derivatives and Hedging (Topic 815): Targeted Improvements to Accounting for Hedging Activities.” This ASU improves certain aspects of the hedge accounting model including making more risk management strategies eligible for hedge accounting and simplifying the assessment of hedge effectiveness. ASU 2017-12 is effective for all annual periods beginning after December 15, 2018 and interim periods within those fiscal years. Early adoption is permitted and requires a prospective adoption with a cumulative-effect adjustment to retained earnings as of the beginning of the fiscal year of adoption for existing hedging relationships. The Company adopted this guidance on January 1, 2019, and the adoption of this ASU did not have a material impact on the Company’s consolidated financial statements.
In August 2018, the FASB issued ASU No. 2018-13, “Fair Value Measurement (Topic 820): Disclosure Framework - Changes to the Disclosure Requirements for Fair Value Measurement.” This ASU was issued to improve the effectiveness of disclosure requirements on a narrow set of concepts relating to fair value measurements. The ASU is effective for all entities for fiscal years beginning after December 15, 2019, including interim periods therein. Adoption of this ASU is not expected to have a material impact on the Company’s consolidated financial statements given that the changes were limited to existing disclosure which were already aligned with the updates.
In September 2018, the FASB issued ASU 2018-15, “Intangibles - Goodwill and Other - Internal-Use Software (Subtopic 350-40): Customer’s Accounting for Implementation Costs Incurred in a Cloud Computing Arrangement That Is a Service Contract.” ASU 2018-15 was issued to align the requirements for capitalizing implementation costs incurred in a hosting arrangement that is a service contract with the requirements for capitalizing implementation costs incurred to develop or obtain internal-use software (and hosting arrangements that include an internal use software license). The ASU was effective for public business entities for fiscal years beginning after December 15, 2019, and interim periods within those fiscal years. The Company adopted this guidance on January 1, 2020, and the adoption of this ASU did not have a material impact on the Company’s consolidated financial statements given that (1) the changes under the ASU generally align with our existing accounting treatment of implementation costs incurred in a hosting arrangement that is a service contract and (2) the Company has not incurred a material amount of implementation costs in a hosting arrangement.
In December 2019, FASB issued ASU 2019-12, “Income Taxes (Topic 740): Simplifying the Accounting for Income Taxes”. The amendments in ASU 2019-12 simplify the accounting for income taxes by removing certain exceptions to the general principles in ASC Topic 740, Income Taxes. The amendments also improve consistent application of and simplify GAAP for other areas of Topic 740 by clarifying and amending existing guidance. This ASU is effective for public business entities for fiscal years and interim periods beginning after December 15, 2020. The Company does not expect the adoption of this ASU to have a material impact on its consolidated financial statements.
In March 2020, the FASB issued ASU 2020-04, “Reference Rate Reform (Topic 848): Facilitation of the Effects of Reference Rate Reform on Financial Reporting,” which provides optional guidance for a limited period of time to ease the potential burden in accounting for (or recognizing the benefits of) reference rate reform on financial reporting. The amendments in ASU 2020-04 are elective and apply to all entities, subject to meeting certain criteria, that have contract, hedging relationships, and other transactions that reference London Interbank Offered Rate (LIBOR) or another reference rate expected to be discontinued because of reference rate reform. This guidance is effective upon issuance and allows application to contract changes as early as January 1, 2020. The Company is in the process of reviewing its warehouse and other lines of credit and debt obligations that use LIBOR as the reference rate and is currently evaluating the potential impact that the adoption of this ASU will have on the consolidated financial statements.
F-69
Table of Contents
NOTE 3 – BUSINESS COMBINATIONS
Acquisition of American Coast Title Company, Inc.
On November 10, 2016, the Company and LDSS entered into a Stock Purchase Agreement (“SPA”) with ACT which provides escrow, title and settlement services to properties in California. The consummation of the ACT acquisition was contingent upon California regulatory approval which was received in June 2017. The ACT acquisition was accounted for under the acquisition method of accounting pursuant to FASB Accounting Standards Codification (“ASC”) 805, Business Combinations.
Pursuant to the Stock Purchase Agreement and subject to the terms and conditions contained therein, the purchase price consisted of $1.3 million in cash paid at closing, purchase price adjustment of $92 thousand which was paid in September 2017, deferred and incentive consideration estimated at $749 thousand, and earn-out consideration estimated at $192 thousand (“ACT Contingent Consideration”). Deferred and incentive consideration is payable over a two year period. The ACT Contingent Consideration consists of an earn-out amount over a two year period. The earn-out amount is equal to 22.5% of ACT’s Adjusted Gross Revenue, as defined in the SPA, over a two year period commencing on July 1, 2017 and ending on June 30, 2019 (“Earn-Out”). The Earn-Out is payable 90 days after the first and second anniversary of the June 30, 2017 closing date. The Earn-Out is subject to a cap of $4.0 million (“Earn-Out Cap”) based on the total CUSA and ACT earn-out payments. The fair value of the ACT Contingent Consideration was estimated to be $192 thousand as of June 30, 2017 and was estimated using a calibrated Monte-Carlo simulation. The fair value was primarily based on (i) the Company’s estimate of ACT’s adjusted gross revenues over the relevant earn-out period, (ii) a volatility factor of 35.0% and (iii) a discount rate of 10.0%.
| Consideration paid: |
||||
| Cash |
$ | 1,302 | ||
| Working capital adjustment |
92 | |||
| Deferred and incentive consideration |
749 | |||
| Contingent consideration |
192 | |||
|
|
|
|||
| $ | 2,335 | |||
|
|
|
|||
| Assets acquired: |
||||
| Cash |
$ | 909 | ||
| Restricted cash |
30 | |||
| Accounts receivable |
140 | |||
| Property and equipment |
35 | |||
| Prepaids and other assets |
469 | |||
| Trademarks and trade name |
1 | |||
| Non-compete agreements |
6 | |||
|
|
|
|||
| 1,590 | ||||
| Liabilities assumed: |
||||
| Accrued liabilities |
(348 | ) | ||
|
|
|
|||
| Net assets acquired |
1,242 | |||
|
|
|
|||
| Goodwill |
$ | 1,093 | ||
|
|
|
The acquired assets and assumed liabilities, both tangible and intangible, were recorded at their fair values as of the acquisition date. The Company made significant estimates and exercised significant judgment in estimating the fair values of the acquired assets and assumed liabilities. The fair value of all assets acquired and liabilities assumed are based on information that was available as of the acquisition date. The application of the acquisition method of accounting resulted in goodwill of $1.1 million. Prior to the end of measurement period in 2018, the Company adjusted the balance of the deferred tax asset created from the acquisition which increased
F-70
Table of Contents
goodwill from the acquisition to $1.4 million at December 31, 2018. The expenses were comprised of legal and professional fees. The results of ACT’s operations are included in the accompanying consolidated statements of operations subsequent to the acquisition date.
NOTE 4 – FAIR VALUE
The Company’s consolidated financial statements include assets and liabilities that are measured based on their estimated fair values. The application of fair value estimates may be on a recurring or nonrecurring basis depending on the accounting principles applicable to the specific asset or liability and whether management has elected to carry the item at its estimated fair value as discussed in the following paragraphs.
Financial Statement Items Measured at Fair Value on a Recurring Basis
The Company enters into interest rate lock commitments (“IRLCs”) with prospective borrowers, which are commitments to originate loans at a specified interest rate. The IRLCs are recorded as a component of derivative assets and liabilities on the consolidated balance sheets with changes in fair value being recorded in current earnings as a component of gain on origination and sale of loans, net.
IRLCs for loans to be sold to investors are economically hedged using mandatory or assignment of trades (“AOT”), best efforts sale commitments or options on U.S. treasury futures. The Company estimates the fair value of the IRLCs based on quoted agency to be announced mortgage-backed securities (“TBA MBS”) prices, its estimate of the fair value of the servicing rights it expects to receive in the sale of the loans and the probability that the mortgage loan will fund or be purchased (the “pull-through rate”) and estimated transformative costs. The pull-through rate is based on the Company’s own experience and is a significant unobservable input used in the fair value measurement of these instruments and results in the classification of these instruments as Level 3. Significant changes in the pull-through rate of the IRLCs, in isolation, could result in significant changes in fair value measurement. At December 31, 2019 and 2018, there was $8.9 billion and $3.0 billion, respectively, of IRLCs notional value outstanding.
LHFS to be sold to investors are also hedged using mandatory trades or AOTs, best efforts sale commitments or put options. The LHFS are valued at the best execution value based on the underlying characteristics of the loan, which is either based off of the TBA MBS market, or investor pricing, based on product, note rate and term. The most significant data inputs used in this valuation include, but are not limited to, loan type, underlying loan amount, note rate, loan program, and expected sale date of the loan. The valuations for LHFS are adjusted at the loan level to consider the servicing release premium and loan level pricing adjustments specific to each loan. LHFS, excluding impaired loans, are classified as Level 2. LHFS measured at fair value that become impaired are transferred from Level 2 to Level 3. Changes in the fair value of the LHFS are recorded in current earnings as a component of Gain on origination and sale of loans, net.
As described above, the Company economically hedges the changes in fair value of IRLCs and LHFS caused by changes in interest rates by using mandatory trades or AOTs, best efforts forward delivery commitments, and put options. These instruments are considered derivative instruments and are recorded at fair value as a component of derivative assets, at fair value or derivative liabilities, at fair value on the consolidated balance sheets. The changes in fair value for these hedging instruments are recorded in current earnings as a component of gain on origination and sale of loans, net.
Mandatory trades are valued using inputs related to characteristics of the TBA MBS stratified by product, coupon, and settlement date. These derivatives are classified as Level 2. As of December 31, 2019 and 2018, there was $13.7 billion and $5.9 billion, respectively, of unsettled mandatory trade notional value outstanding.
Best efforts forward delivery commitments are valued using investor pricing considering the current base loan price. An anticipated loan funding probability is applied to value best efforts commitments hedging IRLCs,
F-71
Table of Contents
which results in the classification of these contracts as Level 3. The current base loan price and the anticipated loan funding probability are the most significant assumptions affecting the value of the best efforts commitments. The best efforts forward delivery commitments hedging LHFS are classified as Level 2; such contracts are transferred from Level 3 to Level 2 at the time the underlying loan is originated. As of December 31, 2019 and 2018, the balance of best effort forward delivery commitments was not material.
The Company also purchases out-of-the-money put options on 10-year treasury futures to economically hedge interest rate risk. Risk of loss associated with the put options is limited to the premium paid for the option. These put options are actively traded in a liquid market and thus, these instruments are considered to be valued with Level 1 inputs.
The fair value of the servicing rights is based on applying the inputs to calculate the net present value of estimated servicing rights income. Significant inputs in the valuation of the servicing rights include discount rates, prepayment speeds and the cost of servicing. These inputs are predominantly Level 3 in nature as they utilize certain significant unobservable inputs including prepayment rate, default rate and discount rate assumptions. Changes in the fair value of servicing rights occur primarily due to realization of expected cash flows as well as the changes in valuation inputs and assumptions. If prepayments occur at a rate greater than the Company’s estimate, the fair value of the servicing rights will decrease accordingly.
The fair value of trading securities are classified as Level 2 as quoted market prices in less active markets are used to determine the fair value.
The fair value estimate for contingent consideration was determined by the Company using the annual earnout computation according to the asset purchase agreement including current pretax earnings less prior period pretax losses and estimated earnout in the likelihood and timing of a liquidity event. As of December 31, 2019 and 2018, the fair value of contingent consideration was $2.4 million and $1.0 million, respectively
The following table presents the carrying amount and estimated fair value of financial instruments included in the consolidated financial statements:
| December 31, 2019 | ||||||||||||||||
| Carrying Amount |
Estimated Fair Value | |||||||||||||||
| Level 1 | Level 2 | Level 3 | ||||||||||||||
| Assets |
||||||||||||||||
| Cash and cash equivalents |
$ | 73,301 | $ | 73,301 | $ | — | $ | — | ||||||||
| Restricted cash |
44,195 | 44,195 | — | — | ||||||||||||
| Loans held for sale, at fair value |
3,681,840 | — | 3,681,840 | — | ||||||||||||
| Derivative assets, at fair value (1) |
131,228 | — | 1,345 | 129,883 | ||||||||||||
| Servicing rights, at fair value |
447,478 | — | — | 447,478 | ||||||||||||
| Loans eligible for repurchase |
197,812 | — | 197,812 | — | ||||||||||||
| Liabilities |
||||||||||||||||
| Warehouse and other lines of credit |
$ | 3,466,567 | $ | — | $ | 3,466,567 | $ | — | ||||||||
| Derivative liabilities, at fair value (2) |
9,977 | 1,316 | 6,987 | 1,674 | ||||||||||||
| Servicing rights, at fair value (3) |
3,035 | — | — | 3,035 | ||||||||||||
| Contingent consideration (3) |
2,374 | — | — | 2,374 | ||||||||||||
| Debt obligations: |
||||||||||||||||
| Secured credit facilities |
294,049 | — | 295,900 | — | ||||||||||||
| Unsecured term loan |
248,289 | — | — | 250,000 | ||||||||||||
| Convertible note |
49,757 | — | — | 50,000 | ||||||||||||
| Liability for loans eligible for repurchase |
197,812 | — | 197,812 | — | ||||||||||||
| (1) | Amounts include interest rate lock commitments, forward sales contracts, put options and interest rate swap futures. |
F-72
Table of Contents
| (2) | Amounts include forward sales contracts and interest rate lock commitments. |
| (3) | Included in accounts payable, accrued expenses and other liabilities in the accompanying consolidated balance sheets. |
| December 31, 2018 | ||||||||||||||||
| Carrying Amount |
Estimated Fair Value | |||||||||||||||
| Level 1 | Level 2 | Level 3 | ||||||||||||||
| Assets |
||||||||||||||||
| Cash and cash equivalents |
$ | 105,685 | $ | 105,685 | $ | — | $ | — | ||||||||
| Restricted cash |
8,307 | 8,307 | — | — | ||||||||||||
| Loans held for sale, at fair value |
2,295,451 | — | 2,295,451 | — | ||||||||||||
| Derivative assets, at fair value (1) |
73,439 | 5,963 | 6,483 | 60,993 | ||||||||||||
| Servicing rights, at fair value |
412,953 | — | — | 412,953 | ||||||||||||
| Trading securities |
25,086 | — | 25,086 | — | ||||||||||||
| Loans eligible for repurchase |
183,814 | — | 183,814 | — | ||||||||||||
| Liabilities |
||||||||||||||||
| Warehouse and other lines of credit |
$ | 2,126,640 | $ | — | $ | 2,126,640 | $ | — | ||||||||
| Derivative liabilities, at fair value (2) |
32,575 | — | 32,048 | 527 | ||||||||||||
| Servicing rights, at fair value (3) |
3,964 | — | — | 3,964 | ||||||||||||
| Contingent consideration (3) |
961 | — | — | 961 | ||||||||||||
| Debt obligations: |
||||||||||||||||
| Secured credit facilities |
300,265 | — | 303,040 | — | ||||||||||||
| Unsecured term loan |
247,627 | — | — | 250,000 | ||||||||||||
| Liability for loans eligible for repurchase |
183,814 | — | 183,814 | — | ||||||||||||
| (1) | Amounts include interest rate lock commitments, forward sales contracts and put options. |
| (2) | Amounts include forward sales contracts, interest rate swap futures and interest rate lock commitments. |
| (3) | Included in accounts payable, accrued expenses and other liabilities in the accompanying consolidated balance sheets. |
The following presents the Company’s assets and liabilities that are measured at fair value on a recurring basis:
| December 31, 2019 | ||||||||||||||||
| Recurring Fair Value Measurements of Assets (Liabilities) Using: | ||||||||||||||||
| Quoted Market Prices in Active Markets for Identical Assets (Level 1) |
Significant Other Observable Inputs (Level 2) |
Significant Unobservable Inputs (Level 3) |
Total Fair Value Measurements |
|||||||||||||
| Loans held for sale |
$ | — | $ | 3,681,840 | $ | — | $ | 3,681,840 | ||||||||
| Interest rate lock commitments, net (1) |
— | — | 128,208 | 128,208 | ||||||||||||
| Servicing rights - assets |
— | — | 447,478 | 447,478 | ||||||||||||
| Forward sales contracts - assets (2) |
— | 1,345 | — | 1,345 | ||||||||||||
| Servicing rights - liabilities |
— | — | (3,035 | ) | (3,035 | ) | ||||||||||
| Interest rate swap futures (2) |
(1,316 | ) | — | — | (1,316 | ) | ||||||||||
| Forward sales contracts - liabilities (3) |
— | (6,987 | ) | — | (6,987 | ) | ||||||||||
| Contingent consideration |
— | — | (2,374 | ) | (2,374 | ) | ||||||||||
|
|
|
|
|
|
|
|
|
|||||||||
| Total, net |
$ | (1,316 | ) | $ | 3,676,198 | $ | 570,277 | $ | 4,245,159 | |||||||
|
|
|
|
|
|
|
|
|
|||||||||
| (1) | Includes $1.7 million of IRLC liabilities. Amounts included in derivative assets, at fair value and derivative liabilities, at fair value on the consolidated balance sheet. |
F-73
Table of Contents
| (2) | Amounts included in derivative assets, at fair value on the consolidated balance sheet. |
| (3) | Amounts included in derivative liabilities, at fair value on the consolidated balance sheet. |
| December 31, 2018 | ||||||||||||||||
| Recurring Fair Value Measurements of Assets (Liabilities) Using: | ||||||||||||||||
| Quoted Market Prices in Active Markets for Identical Assets (Level 1) |
Significant Other Observable Inputs (Level 2) |
Significant Unobservable Inputs (Level 3) |
Total Fair Value Measurements |
|||||||||||||
| Loans held for sale |
$ | — | $ | 2,295,451 | $ | — | $ | 2,295,451 | ||||||||
| Trading securities |
— | 25,086 | — | 25,086 | ||||||||||||
| Interest rate lock commitments, net (1) |
— | — | 60,466 | 60,466 | ||||||||||||
| Servicing rights - assets |
— | — | 412,953 | 412,953 | ||||||||||||
| Forward sales contracts - assets (2) |
— | 6,483 | — | 6,483 | ||||||||||||
| Put options on treasuries - assets (2) |
67 | — | — | 67 | ||||||||||||
| Servicing rights - liabilities |
— | — | (3,964 | ) | (3,964 | ) | ||||||||||
| Interest rate swap futures (2) |
5,896 | — | — | 5,896 | ||||||||||||
| Forward sales contracts - liabilities (3) |
— | (32,048 | ) | — | (32,048 | ) | ||||||||||
| Contingent consideration |
— | — | (961 | ) | (961 | ) | ||||||||||
|
|
|
|
|
|
|
|
|
|||||||||
| Total, net |
$ | 5,963 | $ | 2,294,972 | $ | 468,494 | $ | 2,769,429 | ||||||||
|
|
|
|
|
|
|
|
|
|||||||||
| (1) | Includes $0.5 million of IRLC liabilities. Amounts included in derivative assets, at fair value and derivative liabilities, at fair value on the consolidated balance sheet. |
| (2) | Amounts included in derivative assets, at fair value on the consolidated balance sheet. |
| (3) | Amounts included in derivative liabilities, at fair value on the consolidated balance sheet. |
The following presents the changes in the Company’s assets and liabilities that are measured at fair value on a recurring basis using significant unobservable inputs (Level 3):
| Year Ended December 31, 2019 | ||||||||||||
| Interest Rate Lock Commitments(1) |
Servicing Rights, net |
Contingent Consideration |
||||||||||
| Balance at beginning of period |
$ | 60,466 | $ | 408,989 | $ | (961 | ) | |||||
| Total net gains or losses included in earnings (realized and unrealized) |
957,418 | 200,392 | (2,374 | ) | ||||||||
| Sales and settlements |
||||||||||||
| Purchases |
— | — | — | |||||||||
| Sales |
— | (164,938 | ) | — | ||||||||
| Settlements |
(655,644 | ) | — | 961 | ||||||||
| Transfers of IRLCs to closed loans |
(234,032 | ) | — | — | ||||||||
|
|
|
|
|
|
|
|||||||
| Balance at end of period |
$ | 128,208 | $ | 444,443 | $ | (2,374 | ) | |||||
|
|
|
|
|
|
|
|||||||
F-74
Table of Contents
| (1) | Interest rate lock commitments include both assets and liabilities and are shown net. |
| Year Ended December 31, 2018 | ||||||||||||
| Interest Rate Lock Commitments (1) |
Servicing Rights, net |
Contingent Consideration |
||||||||||
| Balance at beginning of period |
$ | 91,793 | $ | 528,911 | $ | (9,534 | ) | |||||
| Total net gains or losses included in earnings (realized and unrealized) |
646,564 | 316,044 | 4,881 | |||||||||
| Sales and settlements |
||||||||||||
| Purchases |
— | — | — | |||||||||
| Sales |
— | (435,966 | ) | — | ||||||||
| Settlements |
(485,359 | ) | — | 3,692 | ||||||||
| Transfers of IRLCs to closed loans |
(192,532 | ) | — | — | ||||||||
|
|
|
|
|
|
|
|||||||
| Balance at end of period |
$ | 60,466 | $ | 408,989 | $ | (961 | ) | |||||
|
|
|
|
|
|
|
|||||||
| (1) | Interest rate lock commitments include both assets and liabilities and are shown net. |
| Year Ended December 31, 2017 | ||||||||||||
| Interest Rate Lock Commitments (1) |
Servicing Rights, net |
Contingent Consideration |
||||||||||
| Balance at beginning of period |
$ | 85,353 | $ | 340,070 | $ | (32,900 | ) | |||||
| Contingent consideration attributable to Closing USA acquisition |
— | — | (192 | ) | ||||||||
| Total net gains or losses included in earnings (realized and unrealized) |
802,498 | 277,674 | 15,731 | |||||||||
| Sales and settlements |
||||||||||||
| Purchases |
— | 5 | — | |||||||||
| Sales |
— | (88,838 | ) | — | ||||||||
| Settlements |
(587,112 | ) | — | 7,827 | ||||||||
| Transfers of IRLCs to closed loans |
(208,946 | ) | — | — | ||||||||
|
|
|
|
|
|
|
|||||||
| Balance at end of period |
$ | 91,793 | $ | 528,911 | $ | (9,534 | ) | |||||
|
|
|
|
|
|
|
|||||||
| (1) | Interest rate lock commitments include both assets and liabilities and are shown net. |
The following presents the gains and losses included in earnings for the years ended December 31, 2019, 2018 and 2017 relating to the Company’s assets and liabilities that are measured at fair value on a recurring basis using significant unobservable inputs (Level 3):
| Year Ended December 31, 2019 | ||||||||||||
| Interest Rate Lock Commitments (1) |
Servicing Rights, net (2) |
Contingent Consideration (3) |
||||||||||
| Total net gains (losses) included in earnings |
$ | 67,742 | $ | 200,392 | $ | (2,374 | ) | |||||
|
|
|
|
|
|
|
|||||||
| Change in unrealized gains (losses) relating to assets and liabilities still held at period end |
$ | 128,208 | $ | 229,979 | $ | (2,374 | ) | |||||
|
|
|
|
|
|
|
|||||||
F-75
Table of Contents
| (1) | Gains (losses) included in gain on origination and sale of loans, net. |
| (2) | Includes $334.2 million in gains included in gain on origination and sale of loans, net and $133.8 million in losses included in change in fair value of servicing rights, net. |
| (3) | Gains (losses) included in general and administrative expense. |
| Year Ended December 31, 2018 | ||||||||||||
| Interest Rate Lock Commitments (1) |
Servicing Rights, net (2) |
Contingent Consideration (3) |
||||||||||
| Total net (losses) gains included in earnings |
$ | (31,327 | ) | $ | 316,044 | $ | 4,881 | |||||
|
|
|
|
|
|
|
|||||||
| Change in unrealized gains relating to assets and liabilities still held at period end |
$ | 60,466 | $ | 211,677 | $ | 4,881 | ||||||
|
|
|
|
|
|
|
|||||||
| (1) | Gains (losses) included in gain on origination and sale of loans, net. |
| (2) | Includes $343.1 million in gains included in gain on origination and sale of loans, net and $27.1 million in losses included in change in fair value of servicing rights, net. |
| (3) | Gains (losses) included in general and administrative expense. |
| Year Ended December 31, 2017 | ||||||||||||
| Interest Rate Lock Commitments (1) |
Servicing Rights, net (2) |
Contingent Consideration (3) |
||||||||||
| Total net gains included in earnings |
$ | 6,440 | $ | 277,674 | $ | 15,731 | ||||||
|
|
|
|
|
|
|
|||||||
| Change in unrealized gains relating to assets and liabilities still held at period end |
$ | 91,793 | $ | 280,969 | $ | 15,731 | ||||||
|
|
|
|
|
|
|
|||||||
| (1) | Gains (losses) included in gain on origination and sale of loans, net. |
| (2) | Includes $371.8 million in gains included in gain on origination and sale of loans, net and $94.1 million in losses included in change in fair value of servicing rights, net. |
| (3) | Gains (losses) included in general and administrative expense. |
The following table presents quantitative information about the valuation techniques and unobservable inputs applied to Level 3 fair value measurements for financial instruments measured at fair value on a recurring basis:
| December 31, | ||||||||||||||||
| 2019 | 2018 | |||||||||||||||
| Range of inputs |
Weighted Average |
Range of inputs |
Weighted Average |
|||||||||||||
| Unobservable Input | ||||||||||||||||
| IRLCs: |
||||||||||||||||
| Pull-through rate |
2.4% - 99.9% | 67.6% | 8.4% - 99.9% | 69.2% | ||||||||||||
| Servicing rights: |
||||||||||||||||
| Discount rate |
5.0% - 10.0% | 7.2% | 5.8% - 11.7% | 7.7% | ||||||||||||
| Prepayment rate |
11.8% - 26.1% | 13.3% | 8.1% - 25.0% | 10.9% | ||||||||||||
| Cost to service (per loan) |
$71 - $121 | $103 | $75 - $122 | $107 | ||||||||||||
F-76
Table of Contents
Financial Statement Items Measured at Fair Value on a Nonrecurring Basis
The Company did not have any material assets or liabilities that were recorded at fair value on a non-recurring basis as of December 31, 2019 and 2018.
Fair Value of Financial Instruments Carried at Amortized Cost
Financial instruments were either recorded at fair value or the carrying value approximated fair value. For financial instruments that were not recorded at fair value, including cash and cash equivalents, restricted cash, accounts receivable, accounts payable, and accrued expenses and other liabilities, their carrying values approximated fair value due to the short-term nature of such instruments.
The Company’s warehouse lines of credit bear interest at a rate that is periodically adjusted based on a market index. The carrying value of warehouse lines of credit approximates fair value.
The Company’s Secured Credit Facility stated rate of interest per annum is 30-day LIBOR plus 3.25%, and is the same as the market rate for this instrument as of December 31, 2019 and 2018. The carrying value of this Secured Credit Facility approximates fair value as of December 31, 2019 and 2018.
The Company’s $75.0 million Second Secured Credit Facility to finance servicing rights accrues interest at a base rate per annum of 30-day LIBOR plus 3.00%, and is the same as the market rate for this instrument as of December 31, 2019 and 2018. The carrying value of the Second Secured Credit Facility approximates fair value as of December 31, 2019 and 2018.
The Company’s $250.0 million Unsecured Term Loan accrues interest at a base rate per annum of 30-day LIBOR plus 6.25%, and is the same as the market rate for this instrument as of December 31, 2019 and 2018. The carrying value of the Second Unsecured Term Loan approximates fair value as of December 31, 2019 and 2018.
NOTE 5 – BALANCE SHEET NETTING
Certain derivatives, loan warehouse and repurchase agreements are subject to master netting arrangements or similar agreements. In certain circumstances the Company may elect to present certain financial assets, liabilities, and related collateral subject to master netting arrangements in a net position on the consolidated balance sheets. The Company did not meet these requirements, accordingly does not report any of these financial assets or liabilities on a net basis, and presents them on a gross basis on the consolidated balance sheets.
F-77
Table of Contents
The table below represents financial assets and liabilities that are subject to master netting arrangements or similar agreements categorized by financial instrument, together with corresponding financial instruments and corresponding collateral received or pledged.
| December 31, 2019 | ||||||||||||||||||||||||
| Gross amounts of recognized assets (liabilities) |
Gross amounts |
Net amounts of assets (liabilities) presented in consolidated balance sheet |
Gross amounts not offset in consolidated balance sheet |
Net amount | ||||||||||||||||||||
| Financial instruments |
Cash collateral (received) pledged |
|||||||||||||||||||||||
| Assets |
||||||||||||||||||||||||
| Forward delivery contracts |
$ | 9,881 | $ | (8,536 | ) | $ | 1,345 | $ | — | $ | (339 | ) | $ | 1,006 | ||||||||||
|
|
|
|
|
|
|
|
|
|
|
|
|
|||||||||||||
| Total Assets |
$ | 9,881 | $ | (8,536 | ) | $ | 1,345 | $ | — | $ | (339 | ) | $ | 1,006 | ||||||||||
|
|
|
|
|
|
|
|
|
|
|
|
|
|||||||||||||
| Liabilities |
||||||||||||||||||||||||
| Forward delivery contracts |
$ | (15,523 | ) | $ | 8,536 | $ | (6,987 | ) | $ | — | $ | — | $ | (6,987 | ) | |||||||||
| Interest rate swap futures |
(1,316 | ) | — | (1,316 | ) | — | — | (1,316 | ) | |||||||||||||||
| Warehouse lines of credit |
(3,466,567 | ) | — | (3,466,567 | ) | 3,633,066 | 4,352 | 170,851 | ||||||||||||||||
| Debt obligations |
(295,900 | ) | — | (295,900 | ) | 439,063 | 35,330 | 178,493 | ||||||||||||||||
|
|
|
|
|
|
|
|
|
|
|
|
|
|||||||||||||
| Total Liabilities |
$ | (3,779,306 | ) | $ | 8,536 | $ | (3,770,770 | ) | $ | 4,072,129 | $ | 39,682 | $ | 341,041 | ||||||||||
|
|
|
|
|
|
|
|
|
|
|
|
|
|||||||||||||
| December 31, 2018 | ||||||||||||||||||||||||
| Gross amounts of recognized assets (liabilities) |
Gross amounts offset in consolidated balance sheet |
Net amounts of assets (liabilities) presented in consolidated balance sheet |
Gross amounts not offset in consolidated balance sheet |
Net amount | ||||||||||||||||||||
| Financial instruments |
Cash collateral (received) pledged |
|||||||||||||||||||||||
| Assets |
||||||||||||||||||||||||
| Forward delivery contracts |
$ | 6,483 | $ | — | $ | 6,483 | $ | — | $ | — | $ | 6,483 | ||||||||||||
| Put options on treasuries |
67 | — | 67 | — | — | 67 | ||||||||||||||||||
| Interest rate swap futures |
5,896 | — | 5,896 | — | — | 5,896 | ||||||||||||||||||
|
|
|
|
|
|
|
|
|
|
|
|
|
|||||||||||||
| Total Assets |
$ | 12,446 | $ | — | $ | 12,446 | $ | — | $ | — | $ | 12,446 | ||||||||||||
|
|
|
|
|
|
|
|
|
|
|
|
|
|||||||||||||
| Liabilities |
||||||||||||||||||||||||
| Forward delivery contracts |
$ | (32,048 | ) | $ | — | $ | (32,048 | ) | $ | — | $ | — | $ | (32,048 | ) | |||||||||
| Warehouse lines of credit |
(2,126,642 | ) | — | (2,126,642 | ) | 2,271,766 | 5,012 | 150,136 | ||||||||||||||||
| Debt obligations |
(295,000 | ) | — | (295,000 | ) | 427,262 | — | 132,262 | ||||||||||||||||
|
|
|
|
|
|
|
|
|
|
|
|
|
|||||||||||||
| Total Liabilities |
$ | (2,453,690 | ) | $ | — | $ | (2,453,690 | ) | $ | 2,699,028 | $ | 5,012 | $ | 250,350 | ||||||||||
|
|
|
|
|
|
|
|
|
|
|
|
|
|||||||||||||
The Company has entered into agreements with counterparties, which include netting arrangements whereby the counterparties are entitled to settle their positions on a net basis. In certain circumstances, the Company is required to provide certain counterparties collateral against derivative financial instrument, warehouse line of credit or debt obligation. As of December 31, 2019 and 2018, counterparties held $4.4 million and $5.0 million, respectively, of the Company’s cash and cash equivalents in margin accounts as collateral (which is classified as “Restricted cash” on the Company’s consolidated balance sheets).
F-78
Table of Contents
NOTE 6 – LOANS HELD FOR SALE, AT FAIR VALUE
The following table represents the unpaid principal balance of LHFS by product type of loan as of December 31, 2019 and 2018:
| December 31, | ||||||||||||||||
| 2019 | 2018 | |||||||||||||||
| Amount | % | Amount | % | |||||||||||||
| Conforming - fixed |
$ | 2,553,986 | 71 | % | $ | 686,625 | 31 | % | ||||||||
| Conforming - ARM |
35,345 | 1 | 34,391 | 1 | ||||||||||||
| Government - fixed |
527,755 | 15 | 756,985 | 34 | ||||||||||||
| Government - ARM |
47,900 | 1 | 13,187 | 1 | ||||||||||||
| Other - residential mortgage loans |
436,934 | 12 | 689,445 | 31 | ||||||||||||
| Consumer loans |
3,492 | — | 54,585 | — | ||||||||||||
|
|
|
|
|
|
|
|
|
|||||||||
| 3,605,412 | 100 | % | 2,235,218 | 100 | % | |||||||||||
| Fair value adjustment |
76,428 | 60,233 | ||||||||||||||
|
|
|
|
|
|||||||||||||
| Total |
$ | 3,681,840 | $ | 2,295,451 | ||||||||||||
|
|
|
|
|
|||||||||||||
A summary of the changes in the balance of loans held for sale is as follows:
| Year Ended December 31, | ||||||||||||
| 2019 | 2018 | 2017 | ||||||||||
| Balance at beginning of period |
$ | 2,295,451 | $ | 2,431,446 | $ | 2,062,407 | ||||||
| Origination of loans |
44,947,450 | 32,685,690 | 34,873,411 | |||||||||
| Sales |
(43,601,131 | ) | (32,908,799 | ) | (34,548,319 | ) | ||||||
| Repurchases |
133,569 | 204,769 | 71,076 | |||||||||
| Principal payments |
(109,694 | ) | (121,136 | ) | (48,533 | ) | ||||||
| Fair value gain (loss) |
16,195 | 3,481 | 21,404 | |||||||||
|
|
|
|
|
|
|
|||||||
| Balance at end of period |
$ | 3,681,840 | $ | 2,295,451 | $ | 2,431,446 | ||||||
|
|
|
|
|
|
|
|||||||
Gain on origination and sale of loans, net is comprised of the following components:
| Year Ended December 31, | ||||||||||||
| 2019 | 2018 | 2017 | ||||||||||
| Premium from loan sales |
$ | 905,257 | $ | 496,488 | $ | 878,319 | ||||||
| Servicing rights |
334,176 | 343,118 | 371,751 | |||||||||
| Unrealized gains (losses) from derivative assets and liabilities |
85,679 | (58,473 | ) | (4,015 | ) | |||||||
| Realized (losses) gains from derivative assets and liabilities |
(128,634 | ) | 95,063 | (32,239 | ) | |||||||
| Discount points, rebates and lender paid costs |
(75,948 | ) | (83,393 | ) | (222,197 | ) | ||||||
| Mark to market gain on loans held for sale |
13,996 | 3,481 | 21,404 | |||||||||
| (Provision) benefit for loan loss obligation for loans sold |
(8,673 | ) | 3,280 | (1,232 | ) | |||||||
|
|
|
|
|
|
|
|||||||
| $ | 1,125,853 | $ | 799,564 | $ | 1,011,791 | |||||||
|
|
|
|
|
|
|
|||||||
The Company had $21.5 million and none of loans held for sale on non-accrual status as of December 31, 2019 and 2018, respectively.
F-79
Table of Contents
Continuing Involvement in Loans Sold through Servicing Arrangements
Loans eligible for repurchase represents certain mortgage loans sold pursuant to Government National Mortgage Association (“Ginnie Mae”) programs where the Company, as servicer, has the unilateral option to repurchase the loan if certain criteria are met, including if a loan is greater than 90 days delinquent. Regardless of whether the repurchase option has been exercised, the Company must recognize eligible loans and a corresponding repurchase liability in its consolidated balance sheets.
The balances of Ginnie Mae serviced loans that were 90 or more days past due at December 31, 2019 and 2018 totaled $197.8 million and $183.8 million, respectively, and represent loans that the Company is eligible to repurchase from Ginnie Mae guaranteed securitizations as part of its contractual obligations as the servicer of the loans. The terms of the Ginnie Mae MBS program allow, but do not require, the Company to repurchase mortgage loans when the borrower has made no payments for three consecutive months. As a result of this right, the Company records the loans in Loans eligible for repurchase and records a corresponding liability in Liability for loans eligible for repurchase on its consolidated balance sheets.
NOTE 7 – SERVICING RIGHTS, AT FAIR VALUE
The outstanding principal balance of the servicing portfolio was comprised of the following:
| December 31, | ||||||||
| 2019 | 2018 | |||||||
| Conventional |
$ | 14,250,476 | $ | 11,369,675 | ||||
| Government |
22,085,650 | 21,446,279 | ||||||
|
|
|
|
|
|||||
| Total servicing portfolio |
$ | 36,336,126 | $ | 32,815,954 | ||||
|
|
|
|
|
|||||
A summary of the unpaid principal balance underlying servicing rights is as follows:
| December 31, | ||||||||
| 2019 | 2018 | |||||||
| Current loans |
$ | 35,706,264 | $ | 32,177,322 | ||||
| Loans 30 - 89 days delinquent |
328,040 | 299,261 | ||||||
| Loans 90 or more days delinquent or in foreclosure |
301,822 | 339,371 | ||||||
|
|
|
|
|
|||||
| Total servicing portfolio |
$ | 36,336,126 | $ | 32,815,954 | ||||
|
|
|
|
|
|||||
A summary of the changes in the balance of servicing rights is as follows:
| Year Ended December 31, | ||||||||||||
| 2019 | 2018 | 2017 | ||||||||||
| Balance at beginning of period |
$ | 408,989 | $ | 528,911 | $ | 340,070 | ||||||
| Additions |
334,176 | 343,118 | 371,757 | |||||||||
| Sales proceeds, net |
(162,220 | ) | (426,159 | ) | (87,252 | ) | ||||||
| Changes in fair value: |
||||||||||||
| Due to changes in valuation inputs or assumptions |
(51,086 | ) | 34,073 | (26,720 | ) | |||||||
| Other changes in fair value |
(85,416 | ) | (70,954 | ) | (68,944 | ) | ||||||
|
|
|
|
|
|
|
|||||||
| Balance at end of period (1) |
$ | 444,443 | $ | 408,989 | $ | 528,911 | ||||||
|
|
|
|
|
|
|
|||||||
| (1) | Balance is net of $3.0 million, $4.0 million and $1.1 million servicing rights liability at December 31, 2019, 2018 and 2017, respectively. |
F-80
Table of Contents
The following is a summary of the components of loan servicing fee income as reported in the Company’s consolidated statements of operations:
| Year Ended December 31, | ||||||||||||
| 2019 | 2018 | 2017 | ||||||||||
| Contractual servicing fees |
$ | 98,325 | $ | 126,472 | $ | 108,785 | ||||||
| Late, ancillary and other fees |
20,093 | 14,723 | 6,702 | |||||||||
|
|
|
|
|
|
|
|||||||
| $ | 118,418 | $ | 141,195 | $ | 115,487 | |||||||
|
|
|
|
|
|
|
|||||||
The following is a summary of the components of changes in fair value of servicing rights, net as reported in the Company’s consolidated statements of operations:
| Year Ended December 31, | ||||||||||||
| 2019 | 2018 | 2017 | ||||||||||
| Changes in fair value: |
||||||||||||
| Due to changes in valuation inputs or assumptions |
$ | (51,086 | ) | $ | 34,073 | $ | (26,720 | ) | ||||
| Other changes in fair value |
(85,416 | ) | (70,954 | ) | (68,944 | ) | ||||||
| Realized losses on sales of servicing rights |
(4,018 | ) | (1,077 | ) | 2,424 | |||||||
| Net gain (loss) from derivatives hedging servicing rights |
20,974 | (13,529 | ) | 4,539 | ||||||||
|
|
|
|
|
|
|
|||||||
| Changes in fair value of servicing rights, net |
$ | (119,546 | ) | $ | (51,487 | ) | $ | (88,701 | ) | |||
|
|
|
|
|
|
|
|||||||
The table below illustrates hypothetical changes in fair values of servicing rights, caused by assumed immediate changes to key assumptions that are used to determine fair value.
| December 31, | ||||||||
| Servicing Rights Sensitivity Analysis |
2019 | 2018 | ||||||
| Fair Value of Servicing Rights, net |
$ | 444,443 | $ | 408,989 | ||||
| Change in Fair Value from adverse changes: |
||||||||
| Discount Rate: |
||||||||
| Increase 1% |
(17,750 | ) | (15,594 | ) | ||||
| Increase 2% |
(33,553 | ) | (29,971 | ) | ||||
| Cost of Servicing: |
||||||||
| Increase 10% |
(5,542 | ) | (4,983 | ) | ||||
| Increase 20% |
(10,484 | ) | (9,966 | ) | ||||
| Prepayment Speed: |
||||||||
| Increase 10% |
(18,059 | ) | (10,500 | ) | ||||
| Increase 20% |
(34,227 | ) | (21,184 | ) | ||||
Sensitivities are hypothetical changes in fair value and cannot be extrapolated because the relationship of changes in assumptions to changes in fair value may not be linear. Also, the effect of a variation in a particular assumption is calculated without changing any other assumption, whereas a change in one factor may result in changes to another. Accordingly, no assurance can be given that actual results would be consistent with the results of these estimates. As a result, actual future changes in servicing rights values may differ significantly from those displayed above.
F-81
Table of Contents
NOTE 8 – TRADING SECURITIES, AT FAIR VALUE
The carrying value of a trading securities equals its fair value. The following table provides trading securities by type at December 31, 2019 and 2018:
| December 31, | ||||||||
| 2019 | 2018 | |||||||
| GNMA MBS securities |
$ | — | $ | 25,086 | ||||
The Company received mortgage-backed securities guaranteed by GNMA (“GNMA MBS”) from pooling FHA and VA government loans. The GNMA MBS are designated as trading securities. The carrying values of trading securities included net unrealized fair value gains of none and $0.6 million at December 31, 2019 and 2018, respectively.
The Company pledged trading securities at fair values of none and $25.1 million at December 31, 2019 and 2018, respectively, to a secured MSR financing facility to meet margin requirements under the terms of the facility.
NOTE 9 – DERIVATIVE FINANCIAL INSTRUMENTS AND HEDGING ACTIVITIES
Derivatives instruments utilized by the Company primarily include IRLCs, AOT, TBA MBS, and out-of-the-money put options on 10-year treasury futures to hedge interest rate risk. See Note 4 - Fair Value for further details on derivatives.
The following summarizes the Company’s outstanding derivative instruments:
| Fair Value | ||||||||||||||||
| Notional | Balance Sheet Location | Asset | Liability | |||||||||||||
| December 31, 2019: |
||||||||||||||||
| Interest rate lock commitments - assets |
$ | 8,476,366 | Derivative asset, at fair value | $ | 129,883 | $ | — | |||||||||
| Interest rate lock commitments - liabilities |
423,009 | Derivative liabilities, at fair value | — | (1,674 | ) | |||||||||||
| Forward sales contracts - assets |
5,829,039 | Derivative asset, at fair value | 1,345 | — | ||||||||||||
| Forward sales contracts - liabilities |
7,867,153 | Derivative liabilities, at fair value | — | (6,987 | ) | |||||||||||
| Put options on treasuries - assets |
— | Derivative asset, at fair value | — | — | ||||||||||||
| Put options on treasuries - liabilities |
14,260 | Derivative liabilities, at fair value | — | — | ||||||||||||
| Interest rate swap futures - assets |
— | Derivative asset, at fair value | — | — | ||||||||||||
| Interest rate swap futures - liabilities |
1,000 | Derivative liabilities, at fair value | — | (1,316 | ) | |||||||||||
|
|
|
|
|
|
|
|||||||||||
| Total derivative financial instruments |
$ | 22,610,827 | $ | 131,228 | $ | (9,977 | ) | |||||||||
|
|
|
|
|
|
|
|||||||||||
| Fair Value | ||||||||||||||||
| Notional | Balance Sheet Location | Asset | Liability | |||||||||||||
| December 31, 2018: |
||||||||||||||||
| Interest rate lock commitments - assets |
$ | 2,909,594 | Derivative asset, at fair value | $ | 60,993 | $ | — | |||||||||
| Interest rate lock commitments - liabilities |
104,989 | Derivative liabilities, at fair value | — | (527 | ) | |||||||||||
| Forward sales contracts - assets |
1,840,455 | Derivative asset, at fair value | 6,483 | — | ||||||||||||
| Forward sales contracts - liabilities |
4,053,030 | Derivative liabilities, at fair value | — | (32,048 | ) | |||||||||||
| Put options on treasuries - assets |
1,850 | Derivative asset, at fair value | 67 | — | ||||||||||||
| Put options on treasuries - liabilities |
— | Derivative liabilities, at fair value | — | — | ||||||||||||
| Interest rate swap futures - assets |
1,629 | Derivative asset, at fair value | 5,896 | — | ||||||||||||
| Interest rate swap futures - liabilities |
— | Derivative liabilities, at fair value | — | — | ||||||||||||
|
|
|
|
|
|
|
|||||||||||
| Total derivative financial instruments |
$ | 8,911,547 | $ | 73,439 | $ | (32,575 | ) | |||||||||
|
|
|
|
|
|
|
|||||||||||
F-82
Table of Contents
Because many of the Company’s current derivative agreements are not exchange-traded, the Company is exposed to credit loss in the event of nonperformance by the counterparty to the agreements. The Company controls this risk through credit monitoring procedures including financial analysis, dollar limits and other monitoring procedures. The notional amount of the contracts does not represent the Company’s exposure to credit loss.
The following summarizes the realized and unrealized net gains and (losses) on derivative financial instruments and the consolidated statements of operations line items where such gains and losses are included:
| Year Ended December 31, | ||||||||||||||||
| Derivative instrument |
Statements of Operations Location | 2019 | 2018 | 2017 | ||||||||||||
| Interest rate lock commitments, net |
Gain on origination and sale of loans, net | $ | 67,742 | $ | (28,904 | ) | $ | 6,440 | ||||||||
| Forward sales contracts (1) |
Gain on origination and sale of loans, net | (108,710 | ) | 67,326 | (38,310 | ) | ||||||||||
| Put options on treasuries |
Gain on origination and sale of loans, net | (586 | ) | 590 | (4,384 | ) | ||||||||||
| Put options on treasuries |
Servicing losses, net | — | (16 | ) | — | |||||||||||
| Interest rate swap futures |
Servicing losses, net | 20,974 | (13,513 | ) | 4,539 | |||||||||||
|
|
|
|
|
|
|
|||||||||||
| Total realized and unrealized gains (losses) on derivative financial instruments |
$ | (20,580 | ) | $ | 25,483 | $ | (31,715 | ) | ||||||||
|
|
|
|
|
|
|
|||||||||||
| (1) | Amounts include pair-off settlements. |
NOTE 10 – GOODWILL AND INTANGIBLE ASSETS, NET
The following table presents changes in the carrying amount of goodwill for the periods indicated:
| Balance at January 1, 2017 |
$ | 39,319 | ||
| ACT business combination |
1,093 | |||
|
|
|
|||
| Balance at December 31, 2017 |
$ | 40,412 | ||
| Adjustment to ACT goodwill |
324 | |||
|
|
|
|||
| Balance at December 31, 2018 |
40,736 | |||
| Change in goodwill |
— | |||
|
|
|
|||
| Balance at December 31, 2019 |
$ | 40,736 | ||
|
|
|
Prior to the end of the measurement period in 2018, the Company adjusted the balance of the deferred tax asset created from the ACT acquisition which increased goodwill from the acquisition by $324 thousand.
F-83
Table of Contents
The Company’s other intangible assets relate to its asset acquisition of iMortgage in October 2013, asset acquisition of Mortgage Master in January 2015, stock acquisition of CUSA in November 2016, and stock acquisition of ACT in June 2017. The following table presents the Company’s intangible assets, net:
| December 31, 2019 | ||||||||||||||||
| Gross carrying amount |
Accumulated amortization |
Net carrying amount |
Weighted average life (years) |
|||||||||||||
| Non compete agreements |
$ | 2,136 | $ | (2,092 | ) | $ | 44 | 0.1 | ||||||||
| Trademarks and tradename (1) |
4,001 | (1,462 | ) | 2,539 | 5.0 | |||||||||||
| Domain name |
30 | (11 | ) | 19 | 5.0 | |||||||||||
|
|
|
|
|
|
|
|||||||||||
| Total |
$ | 6,167 | $ | (3,565 | ) | $ | 2,602 | |||||||||
|
|
|
|
|
|
|
|||||||||||
| December 31, 2018 | ||||||||||||||||
| Gross carrying amount |
Accumulated amortization |
Net carrying amount |
Weighted average life (years) |
|||||||||||||
| Non compete agreements |
$ | 2,136 | $ | (1,966 | ) | $ | 170 | 0.4 | ||||||||
| Trademarks and tradename (1) |
4,001 | (974 | ) | 3,027 | 6.0 | |||||||||||
| Domain name |
30 | (8 | ) | 22 | 6.0 | |||||||||||
| Favorable (unfavorable) leases, net (2) |
300 | (315 | ) | (15 | ) | 0.4 | ||||||||||
|
|
|
|
|
|
|
|||||||||||
| Total |
$ | 6,467 | $ | (3,263 | ) | $ | 3,204 | |||||||||
|
|
|
|
|
|
|
|||||||||||
| (1) | CUSA and ACT trademarks totaling $0.1 million have indefinite lives with no amortization. |
| (2) | Includes favorable leases included in prepaid expenses and other assets and unfavorable leases included in accounts payable, accrued expenses and other liabilities in the consolidated balance sheets. |
Amortization expense for amortizing intangible assets, net is $0.6 million, $1.0 million and $1.1 million for the years ended December 31, 2019, 2018 and 2017, respectively. The remaining weighted average amortization period for these assets is 60 months as of December 31, 2019. The following is a schedule of estimated amortization expense for the next five fiscal years:
| Year ending December 31, |
||||
| 2020 |
$ | 511 | ||
| 2021 |
511 | |||
| 2022 |
491 | |||
| 2023 |
491 | |||
| 2024 |
492 | |||
|
|
|
|||
| Estimated amortization expense |
$ | 2,496 |
The Company performs its annual assessment of possible impairment of goodwill and intangible assets in December or more frequently if events and circumstances indicate that impairment may have occurred. Based on management’s analysis, the Company concluded that, as of both December 31, 2019 and 2018, the fair value of goodwill and intangible assets exceeded their respective carrying values. Thus, no impairment was recorded for goodwill or intangible assets, net.
NOTE 11 – VARIABLE INTEREST ENTITIES
Mortgage loans are primarily sold to the Federal National Mortgage Association (“FNMA”) or Federal Home Loan Mortgage Corporation (“FHLMC”) or transferred into pools of Government National Mortgage Association (“GNMA”) mortgage-backed securities (“MBS”) (collectively, the Government-Sponsored Entities,
F-84
Table of Contents
or “GSEs”). The Company also sells mortgage loans to non-GSE third parties. The Company has continuing involvement in mortgage loans sold through servicing arrangements and the liability for loan indemnifications and repurchases under the representations and warranties it makes to the investors and insurers of the loans it sells. The Company is exposed to interest rate risk through its continuing involvement with mortgage loans sold, including servicing rights, as the value of the asset fluctuates as changes in interest rates impact borrower prepayment.
All loans are sold on a non-recourse basis; however, certain representations and warranties have been made that are customary for loan sale transactions, including eligibility characteristics of the mortgage loans and underwriting responsibilities, in connection with the sales of these assets.
Loans held for sale are considered sold when the Company surrenders control over the financial assets and such financial assets are legally isolated from the Company in the event of bankruptcy. If the sale criteria are not met, the transfer is recorded as a secured borrowing in which the assets remain on the balance sheet and the proceeds from the transaction are recognized as a liability.
Securitizations
The Company originates and services mortgage loans. Mortgage loans are primarily sold to GSEs who then securitize these loans as previously discussed. The Company executes private-label securitizations to finance mortgage loans and mortgage servicing rights. The associated securitization entities are consolidated in the consolidated balance sheets.
In executing a securitization transaction, the Company sell assets (financial and non-financial) to a wholly-owned, bankruptcy-remote SPE, which then transfers the financial assets to a separate, transaction-specific SPE for cash, and other retained interests. The securitization entity is funded through the issuance of beneficial interests in the securitized assets. The beneficial interests take the form of either notes or trust certificates, which are sold to investors and/or retained by the Company. These beneficial interests are collateralized by the transferred assets and entitle the investors to specified cash flows generated from the underlying assets. In addition to providing a source of liquidity and cost-efficient funding, securitizing these assets also reduces the Company’s credit exposure to the borrowers beyond any economic interest the Company may retain.
Each securitization is governed by various legal documents that limit and specify the activities of the securitization entity. The securitization entity is generally allowed to acquire the financial assets, to issue beneficial interests to investors to fund the acquisition of the assets, and to enter into derivatives or other yield maintenance contracts to hedge or mitigate certain risks related to the assets or beneficial interests of the entity. A servicer, who is generally the Company, is appointed pursuant to the underlying legal documents to service the assets the securitization entity holds and the beneficial interests it issues. Servicing functions include, but are not limited to, general collection activity on current and noncurrent accounts, loss mitigation efforts including repossession and sale of collateral, as well as preparing and furnishing statements summarizing the asset and beneficial interest performance. These servicing responsibilities constitute continued involvement in the transferred assets.
Cash flows from the assets transferred into the securitization entity represent the sole source for payment of distributions on the beneficial interests issued by the securitization entity and for payments to the parties that perform services for the securitization entity, such as the servicer or the trustee.
The Company holds retained beneficial interests in the securitizations including, but not limited to, subordinated securities and residuals; and other residual interests. These retained interests may represent a form of significant continuing economic interests. Certain of these retained interests provide credit enhancement to the trust as they may absorb credit losses or other cash shortfalls.
F-85
Table of Contents
The Company holds certain conditional repurchase options specific to securitizations that allow us to repurchase assets from the securitization entity. The majority of the securitizations provide the Company, as servicer, with a call option that allows us to repurchase the remaining transferred financial assets or redeem outstanding beneficial interests at the Company’s discretion once the asset pool reaches a predefined level, which represents the point where servicing becomes burdensome (a clean-up call option). The repurchase price is typically the discounted securitization balance of the assets plus accrued interest when applicable. The Company generally has discretion regarding when or if it will exercise these options, but would do so only when it is in the Company’s best interest.
Other than customary representation and warranty provisions, these securitizations are nonrecourse to the Company, thereby transferring the risk of future credit losses to the extent the beneficial interests in the securitization entities are held by third parties. Representation and warranty provisions generally require the Company to repurchase assets or indemnify the investor or other party for incurred losses to the extent it is determined that the assets were ineligible or were otherwise defective at the time of sale. The Company did not provide any non-contractual financial support to these entities during 2019.
Consolidation of Variable Interest Entities
The determination of whether the assets and liabilities of the VIEs are consolidated in the consolidated balance sheets or not consolidated in the consolidated balance sheets depends on the terms of the related transaction and the Company’s continuing involvement (if any) with the VIE. The Company is deemed the primary beneficiary and therefore consolidate VIEs for which it has both (a) the power, through voting rights or similar rights, to direct the activities that most significantly impact the VIE’s economic performance, and (b) benefits, as defined, from the VIE. The Company determines whether it holds a significant variable interest in a VIE based on a consideration of both qualitative and quantitative factors regarding the nature, size, and form of its involvement with the VIE. The Company assesses whether it is the primary beneficiary of a VIE on an ongoing basis.
The Company is generally determined to be the primary beneficiary in VIEs established for its securitization activities when it has a controlling financial interest in the VIE, primarily due to its servicing activities and because it holds a beneficial interest in the VIE that could be potentially significant (in certain cases). The consolidated VIEs included in the consolidated balance sheets represent separate entities with which the Company is involved. The third-party investors in the obligations of consolidated VIEs have legal recourse only to the assets of the VIEs and do not have such recourse to the Company, except for the customary representation and warranty provisions. In addition, the cash flows from the assets are restricted only to pay such liabilities. Thus, the Company’s economic exposure to loss from outstanding third-party financing related to consolidated VIEs is limited to the carrying value of the consolidated VIE assets. Generally, all assets of consolidated VIEs, presented below based upon the legal transfer of the underlying assets in order to reflect legal ownership, are restricted for the benefit of the beneficial interest holders.
The nature, purpose, and activities of nonconsolidated VIEs entities currently encompass the Company’s use of joint venture entities with home builders, real estate brokers and commercial real estate companies to provide loan origination services and real estate settlement services to the customers referred to the joint ventures by the Company’s joint venture partners. The Company is generally not determined to be the primary beneficiary in its joint venture VIEs because it does not have the power, through voting rights or similar rights, to direct the activities that most significantly impact the joint venture VIEs’ economic performance. The Company does not consolidate these entities because it does not meet the VIE guidance for consolidation, primarily because the Company does not have the power, through voting rights or similar rights, to direct the activities that most significantly impact the VIE’s economic performance.
The Company’s pro rata share of net earnings of joint ventures is $12.9 million, $15.1 million and $13.3 million for the years ended December 31, 2019, 2018 and 2017, respectively. The following table presents
F-86
Table of Contents
the Company’s involvement in consolidated and nonconsolidated VIEs in which the Company holds variable interests.
| Year Ended December 31, 2019 | ||||||||||||
| Net carrying amount of total assets |
Carrying amount of total liabilities |
Maximum exposure to loss in non- consolidated VIEs |
||||||||||
| Consolidated variable interest entities |
||||||||||||
| Mortgage loans |
$ | 807,599 | $ | 800,000 | N/A | |||||||
| GNMA mortgage servicing rights |
281,255 | 213,149 | N/A | |||||||||
|
|
|
|
|
|||||||||
| $ | 1,088,854 | $ | 1,013,149 | |||||||||
|
|
|
|
|
|||||||||
| Non-consolidated variable interest entities |
||||||||||||
| Joint Ventures |
$ | 15,113 | $ | 12,716 | $ | 17,030 | ||||||
| Year Ended December 31, 2018 | ||||||||||||
| Net carrying amount of total assets |
Carrying amount of total liabilities |
Maximum exposure to loss in non- consolidated VIEs |
||||||||||
| Consolidated variable interest entities |
||||||||||||
| Mortgage loans |
$ | 609,883 | $ | 585,000 | N/A | |||||||
| GNMA mortgage servicing rights |
281,950 | 212,225 | N/A | |||||||||
|
|
|
|
|
|||||||||
| $ | 891,833 | $ | 797,225 | |||||||||
|
|
|
|
|
|||||||||
| Non-consolidated variable interest entities |
||||||||||||
| Joint Ventures |
$ | 15,533 | $ | 13,411 | $ | 17,001 | ||||||
| Year Ended December 31, 2017 | ||||||||||||
| Net carrying amount of total assets |
Carrying amount of total liabilities |
Maximum exposure to loss in non- consolidated VIEs |
||||||||||
| Consolidated variable interest entities |
||||||||||||
| Mortgage loans |
$ | 307,658 | $ | 282,959 | N/A | |||||||
| GNMA mortgage servicing rights |
267,435 | 137,476 | N/A | |||||||||
|
|
|
|
|
|||||||||
| $ | 575,093 | $ | 420,435 | |||||||||
|
|
|
|
|
|||||||||
| Non-consolidated variable interest entities |
||||||||||||
| Joint Ventures |
$ | 13,461 | $ | 11,290 | $ | 16,848 | ||||||
F-87
Table of Contents
NOTE 12 – ACCOUNTS RECEIVABLE, NET
Accounts receivable, net consists of the following:
| December 31, | ||||||||
| 2019 | 2018 | |||||||
| Servicing sales, net |
$ | 7,469 | $ | 22,922 | ||||
| Loan sales |
14,353 | 18,579 | ||||||
| Loan origination |
7,384 | 5,192 | ||||||
| Loan principal and interest |
16,366 | 10,849 | ||||||
| Derivatives |
1,137 | 7,321 | ||||||
| Joint ventures |
5,504 | 4,265 | ||||||
| Shareholder notes (1) |
52,895 | 51,518 | ||||||
| Settlement services |
6,795 | 2,849 | ||||||
| Servicing fee income |
1,572 | 1,136 | ||||||
| Other |
7,571 | 5,842 | ||||||
|
|
|
|
|
|||||
| $ | 121,046 | $ | 130,473 | |||||
|
|
|
|
|
|||||
| (1) | See Note 19 - Related Party Transactions for further details on Shareholder notes. |
NOTE 13 – PROPERTY AND EQUIPMENT, NET
Property and equipment, net consists of the following:
| December 31, | ||||||||
| 2019 | 2018 | |||||||
| Furniture and equipment |
$ | 111,582 | $ | 97,201 | ||||
| Computer software |
17,826 | 17,569 | ||||||
| Software development |
71,278 | 55,251 | ||||||
| Leasehold improvements |
37,195 | 36,220 | ||||||
| Work in progress |
9,618 | 14,726 | ||||||
|
|
|
|
|
|||||
| Property and equipment |
247,499 | 220,967 | ||||||
| Accumulated depreciation and amortization |
(166,602 | ) | (130,013 | ) | ||||
|
|
|
|
|
|||||
| Property and equipment, net |
$ | 80,897 | $ | 90,954 | ||||
|
|
|
|
|
|||||
The Company charged $36.8 million, $35.3 million and $30.8 million of depreciation and amortization expense related to property and equipment for the years ended December 31, 2019, 2018 and 2017, respectively, which includes assets financed under financing leases.
Capitalized computer software development costs consist of the following:
| December 31, | ||||||||
| 2019 | 2018 | |||||||
| Cost |
$ | 71,278 | $ | 55,251 | ||||
| Accumulated depreciation |
(53,503 | ) | (42,266 | ) | ||||
|
|
|
|
|
|||||
| Software development, net |
$ | 17,775 | $ | 12,985 | ||||
|
|
|
|
|
|||||
The Company charged $11.2 million, $10.2 million and $10.2 million of depreciation expense related to software development for the years ended December 31, 2019, 2018 and 2017, respectively.
F-88
Table of Contents
Future computer software development depreciation for the remaining years:
| Year ending December 31, |
||||
| 2020 |
$ | 10,168 | ||
| 2021 |
6,196 | |||
| 2022 and thereafter |
1,411 | |||
|
|
|
|||
| Total |
$ | 17,775 | ||
|
|
|
NOTE 14 – WAREHOUSE AND OTHER LINES OF CREDIT
At December 31, 2019, the Company is a party to 12 lines of credit with lenders providing $5.1 billion of warehouse and revolving credit facilities. The warehouse and revolving credit facilities are used to fund, and are secured by, residential and consumer loans held for sale. Interest expense from warehouse and revolving lines of credit is recorded to Interest expense.
In November 2017, the Company issued notes through a securitization facility (“2017 Securitization Facility”) backed by a revolving warehouse line of credit. The 2017 Securitization Facility is secured by newly originated, first-lien, fixed rate residential mortgage loans eligible for purchase by the GSEs. The 2017 Securitization Facility issued $300.0 million in notes and certificates that bear interest at 30-day LIBOR plus a margin. The Company retained $15.0 million in notes and certificates. The Company has $285.0 million in outstanding notes at December 31, 2019. In May 2019, the Company issued notes through a new securitization facility (“2019-1 Securitization Facility) backed by a revolving warehouse line of credit. The 2019-1 Securitization Facility is secured by newly originated, first-lien, fixed rate residential mortgage loans eligible for purchase by the GSEs. The 2019-1 Securitization Facility issued $300.0 million in notes and certificates that bear interest at 30-day LIBOR plus a margin. The proceeds from the 2019-1 Securitization Facility were used to payoff the $285.0 million in outstanding notes from the 2017 Securitization Facility. The 2019-1 Securitization Facility will terminate on the earlier of (i) the two-year anniversary of the initial purchase date, (ii) upon the Company exercising its right to optional prepayment in full and (iii) the date of the occurrence and continuance of an event of default.
In October 2018, the Company issued notes through an additional securitization facility (“2018 Securitization Facility” or collectively with the 2017 Securitization Facility discussed above, the “Securitization Facilities”) backed by a revolving warehouse line of credit. The 2018 Securitization Facility is secured by newly originated, first-lien, fixed rate residential mortgage loans eligible for purchase by the GSEs. The 2018 Securitization Facility issued $300.0 million in notes and certificates that bear interest at 30-day LIBOR plus a margin. The 2018 Securitization Facility will terminate on the earlier of (i) the two-year anniversary of the initial purchase date, (ii) upon the Company exercising its right to optional prepayment in full and (iii) the date of the occurrence and continuance of an event of default.
In October 2019, the Company issued notes through an additional securitization facility (“2019-2 Securitization Facility” or collectively with the 2018 Securitization Facility and the 2019-1 Securitization Facility discussed above, the “Securitization Facilities”) backed by a revolving warehouse line of credit. The 2019-2 Securitization Facility is secured by newly originated, first-lien, fixed rate residential mortgage loans eligible for purchase by the GSEs. The 2019-2 Securitization Facility issued $300.0 million in notes and certificates that bear interest at 30-day LIBOR plus a margin. The Company used $100.0 million of the proceeds to pay off $100.0 million in notes and certificates of the 2018 Securitization Facility. The 2019-2 Securitization Facility will terminate on the earlier of (i) the two-year anniversary of the initial purchase date, (ii) upon the Company exercising its right to optional prepayment in full and (iii) the date of the occurrence and continuance of an event of default.
The warehouse and revolving lines of credit are repaid using proceeds from the sale of loans. The base interest rates on the Company’s warehouse lines bear interest at 30-day LIBOR plus a margin. Some of the lines
F-89
Table of Contents
carry additional fees in the form of annual facility fees charged on the total line amount, commitment fees charged on the committed portion of the line and non-usage fees charged when monthly usage falls below a certain utilization percentage. The weighted average interest rate at December 31, 2019 totaled 3.48%. The Company’s warehouse lines are scheduled to expire in 2020 and 2021 under one year terms and all lines are subject to renewal based on an annual credit review conducted by the lender. The Company’s Securitization Facilities’ notes have two year terms and are due October 25, 2020, May 14, 2021 and October 23, 2021.
The base interest rates for all warehouse lines of credit are subject to increase based upon the characteristics of the underlying loans collateralizing the lines of credit, including, but not limited to product type and number of days held for sale. Certain of the warehouse line lenders require the Company, at all times, to maintain cash accounts with minimum required balances. As of December 31, 2019 and 2018, there was $4.4 million and $5.0 million, respectively, held in these accounts which are recorded as a component of restricted cash on the consolidated balance sheets.
Under the terms of these warehouse lines, the Company is required to maintain various financial and other covenants. These financial covenants include, but are not limited to, maintaining (i) minimum tangible net worth, (ii) minimum liquidity, (iii) a minimum current ratio, (iv) a maximum distribution requirement, (v) a maximum leverage ratio, (vi) pre-tax net income requirements and (vii) a maximum warehouse capacity ratio. As of December 31, 2019, the Company was in compliance with all warehouse lending related covenants.
The following table presents certain information on warehouse borrowings at December 31, 2019 and 2018:
| Outstanding Balance | ||||||||||||||||
| December 31, | ||||||||||||||||
| Facility Amount |
2019 | 2018 | Expiration Date |
|||||||||||||
| Facility 1 (1) |
$ | 1,100,000 | $ | 637,148 | $ | 193,436 | 10/30/2020 | |||||||||
| Facility 2 (2) |
400,000 | 308,890 | 165,831 | 1/31/2020 | ||||||||||||
| Facility 3 (3) |
225,000 | 124,646 | 124,217 | 4/21/2020 | ||||||||||||
| Facility 4 (4) |
250,000 | 166,090 | 107,285 | 7/10/2020 | ||||||||||||
| Facility 5 (5) |
270,000 | 239,541 | 217,316 | 1/11/2020 | ||||||||||||
| Facility 6 (6) |
— | — | 200,538 | 12/31/2019 | ||||||||||||
| Facility 7 (7) |
250,000 | 668 | 35,738 | N/A | ||||||||||||
| Facility 8 (8) |
800,000 | 458,115 | 231,910 | 10/12/2020 | ||||||||||||
| Facility 9 (9) |
700,000 | 599,396 | 231,309 | 4/6/2020 | ||||||||||||
| Facility 10 (10) |
200,000 | 197,874 | — | 10/25/2020 | ||||||||||||
| Facility 11 (11) |
300,000 | 295,244 | — | 5/14/2021 | ||||||||||||
| Facility 12 (11) |
300,000 | 295,043 | 285,000 | 10/23/2021 | ||||||||||||
| Facility 13 (12) |
300,000 | 143,912 | 300,000 | N/A | ||||||||||||
| Facility 14 (13) |
— | — | 34,060 | 11/30/2018 | ||||||||||||
|
|
|
|
|
|
|
|||||||||||
| Total |
$ | 5,095,000 | $ | 3,466,567 | $ | 2,126,640 | ||||||||||
|
|
|
|
|
|
|
|||||||||||
| (1) | The total facility is available both to fund loan originations and also provide liquidity under a gestation facility to finance recently sold MBS up to the MBS settlement date. In October 2020, the expiration date was extended to October 2021. |
| (2) | In addition to the $400.0 million Warehouse Line, the lender provides a separate $25.0 million gestation facility to finance recently sold MBS up to the MBS settlement date. In January 2020, the expiration date was extended to July 2020. In July 2020, the expiration date was extended to September 2020. In September 2020, this facility was increased to $600.0 million and the expiration date was extended to September 2021. |
| (3) | In April 2020, the expiration date was extended to April 2021. |
| (4) | In addition to the $166.1 million outstanding balance secured by mortgage loans, the Company has $37.9 million outstanding to finance servicing rights. In July 2020, this facility was increased to $400.0 million and the expiration date was extended to July 2021. |
F-90
Table of Contents
| (5) | In February 2020, the facility was increased to $340.0 million and the expiration date was extended to February 2021. |
| (6) | In December 2019, the facility was paid-off and subsequently canceled at the Company’s request. |
| (7) | In addition to the $250.0 million Warehouse Line, the lender provides a separate gestation facility to finance recently sold MBS up to the MBS settlement date. |
| (8) | In addition to the $800.0 million Warehouse Line, the lender provides a separate gestation facility to finance recently sold MBS up to the MBS settlement date. In October 2020, the expiration date was extended to October 2021. |
| (9) | In May 2020, the expiration date was extended to May 2021. In October 2020, this facility was increased to $1.0 billion. |
| (10) | Securitization backed by a revolving warehouse facility to finance newly originated first-lien fixed rate mortgage loans. In October 2020, the Company paid off this facility. |
| (11) | Securitization backed by a revolving warehouse facility to finance newly originated first-lien fixed rate mortgage loans. |
| (12) | In September 2020, this facility was increased to $500.0 million. |
| (13) | The facility was used to finance consumer loans. The facility expired and all collateral cash flows were used to pay interest and remaining principal outstanding. |
The following table presents certain information on warehouse borrowings:
| Year Ended December 31, | ||||||||||||
| 2019 | 2018 | 2017 | ||||||||||
| Maximum outstanding balance during the period |
$ | 4,370,205 | $ | 2,851,113 | $ | 2,618,419 | ||||||
| Average balance outstanding during the period |
2,844,290 | 2,281,781 | 1,672,281 | |||||||||
| Collateral pledged (loans held for sale) |
3,553,504 | 2,211,775 | 2,355,434 | |||||||||
| Weighted average interest rate during the period |
3.83 | % | 3.78 | % | 3.18 | % | ||||||
NOTE 15 – DEBT OBLIGATIONS
Secured Credit Facilities
The Company entered into a $25.0 million revolving secured credit facility (“Original Secured Credit Facility”) in October 2014 for working capital purposes. The Company has entered into subsequent amendments with the lender both increasing and decreasing the size of the facility. In 2017, the Original Secured Credit Facility was increased to $90.0 million and was subsequently reduced to $50.0 million at December 31, 2018. The Original Secured Credit Facility is secured by servicing rights, matures in June 2020 and accrues interest at a base rate per annum of 30-day LIBOR plus 3.25%. The Company uses amounts borrowed under the Original Secured Credit Facility to retain servicing rights and for other working capital needs and general corporate purposes. As of December 31, 2019, the outstanding balance under the Original Secured Credit Facility was $43.0 million. The Company has pledged $92.9 million in fair value of servicing rights as collateral to secure outstanding advances under the Original Secured Credit Facility. Advances for servicing rights are determined using a borrowing base formula calculated against the fair market value of the pledged servicing rights. Under the Original Secured Credit Facility, the Company is required to satisfy certain financial covenants, including minimum tangible net worth, minimum liquidity, maximum leverage and debt service coverage. As of December 31, 2019, the Company was in compliance with all such covenants.
The Company amended one of its Warehouse Line facilities to provide a $50.0 million sub-limit to finance servicing rights (“Second Secured Credit Facility”) in May 2015. As of December 31, 2019, total capacity under the Warehouse Line facility is $250.0 million and is available to fund a combination of loans and servicing
F-91
Table of Contents
rights, subject to a $75.0 million sub-limit to finance servicing rights. As of December 31, 2019, $37.9 million was outstanding under the Second Secured Credit Facility. The Company has pledged $64.9 million in fair value of servicing rights as collateral to secure outstanding advances related to the sub-limit. Advances for servicing rights are determined using a borrowing base formula calculated against the fair market value of the pledged servicing rights. The credit facility accrues interest at a base rate per annum of 30-day LIBOR plus 3.00%. If the Second Secured Credit Facility is not renewed or extended at the expiration date, the Company has the option to convert the outstanding principal balance to a term loan that accrues interest at a base rate per annum of 30-day LIBOR plus 5.75% and is due two years from the conversion date (“Term Loan”). The Term Loan requires monthly principal and interest payments based on a five year amortization period. Under the Second Secured Credit Facility, the Company is required to satisfy certain financial covenants, including minimum tangible net worth, minimum liquidity, maximum leverage and profitability requirements. As of December 31, 2019, the Company was in compliance with all such covenants.
The Company entered into a master repurchase agreement with one of its wholly-owned subsidiaries, loanDepot GMSR Master Trust (“GMSR Trust”) in August 2017 to finance GNMA MSRs (“GNMA MSR Facility”) owned by the Company. In November 2017, the Company, through the GMSR Trust, issued an aggregate principal amount of $110.0 million in secured term notes (the “GMSR Term Notes”). The GMSR Term Notes are secured by certain participation certificates relating to GNMA MSRs pursuant to the GNMA MSR Facility and bear interest at 30-day LIBOR plus a margin per annum. In October 2018, the GMSR Trust was amended and restated for the purpose of issuing the Series 2018-GT1 Term Notes (“Term Notes”). The Term Notes accrue interest at 30-day LIBOR plus a margin per annum and mature in October 2023 or, if extended pursuant to the terms of the related indenture supplement, October 2025 (unless earlier redeemed in accordance with their terms). The Company issued $200.0 million in Term Notes in October 2018 and used the proceeds to payoff $110.0 million in outstanding notes from the GNMA MSR Facility. In connection with the GNMA MSR Facility, the Company pledges participation certificates representing beneficial interests in GNMA MSRs to the GMSR Trust. The Company is party to an acknowledgment agreement with Ginnie Mae whereby the Company may, from time to time pursuant to the terms of any supplemental indenture, issue to institutional investors variable funding notes or Term Notes, in each case secured on a pari passu basis by the participation certificates relating to the GNMA MSRs held by the GMSR Trust. The maximum amount of the GNMA MSR Facility is $500.0 million. At December 31, 2019, there was $198.1 million in Term Notes outstanding, net of $1.9 million in deferred financing costs. Under this facility, the Company is required to satisfy certain financial covenants. As of December 31, 2019, the Company was in compliance with all such covenants.
In August 2017, the Company, through the GMSR Trust, issued a variable funding note (“GMSR VFN”) in the amount of $65.0 million. The GMSR VFN is secured by GNMA MSRs and bear interest at 30-day LIBOR plus a margin per annum. The Company amended the GMSR VFN in September 2018 to increase the facility size to $150.0 million and extend the maturity date to September 2020. In September 2019, the Company amended the GMSR VFN maturity date to October 2021. At December 31, 2019, there was $15.0 million in GMSR VFN outstanding. Under this facility, the Company is required to satisfy certain financial covenants. As of December 31, 2019, the Company was in compliance with all such covenants.
Unsecured Term Loan
In August 2017, the Company entered into an agreement which amended the $150.0 million unsecured term loan facility (“Unsecured Term Loan”) and increased the balance to $250.0 million which matures in August 2022 and accrues interest at a rate of 30-day LIBOR plus 6.25% per annum. As of December 31, 2019, $248.3 million was outstanding under the Term Loan, net of $1.7 million in deferred financing cost. Under the Unsecured Term Loan, the Company is required to satisfy certain financial covenants, including minimum tangible net worth, Ginnie Mae mortgage loan delinquencies, maximum leverage, and minimum cash balance. As of December 31, 2019, the Company was in compliance with all such covenants. Interest expense from this credit agreement is recorded to other interest expense. The Company may prepay the loan in any amount subsequent to the second anniversary, however, a prepayment premium will apply to the principal prepaid from the second to
F-92
Table of Contents
the fourth anniversary of the loan’s closing. This prepayment premium is waived up to a prepayment aggregate of 40% of the outstanding balance of the Unsecured Term Loan under certain circumstance defined in the agreement, including an Initial Public Offering (“IPO”) or a majority equity capital infusion event.
Convertible Debt
In August 2019, the Company entered into an agreement for a convertible debt facility of $50.0 million (“Convertible Debt”) secured by the Company’s LLC interests in its subsidiaries and all the assets thereof. The Convertible Debt matures in August 2022 and accrues interest at a rate of 14.00% per annum prior to the second anniversary and at a rate of 16.00% per annum thereafter. The Company uses amounts borrowed under the Convertible Debt for working capital needs and general corporate purposes. The Company may prepay the Convertible Debt at any time prior to the maturity date. A prepayment premium equal to the interest that would have been due on the principal amount outstanding until May 20, 2020 is assessed if the loan is prepaid before that date. As of December 31, 2019, $49.8 million was outstanding under the Convertible Debt, net of $0.2 million in deferred financing costs. The outstanding amount is convertible into the Company’s equity securities concurrently with the closing of a qualified equity financing transactions or during the 90 day period following the stated maturity date. The right to convert is forfeited if the outstanding balance is paid in full before the qualified equity finance transaction or the stated maturity date. Under the Convertible Debt agreement, the Company is required to satisfy certain financial covenants including minimum levels of tangible net worth and liquidity and maximum levels of consolidated leverage on a monthly basis. As of December 31, 2019, the Company was in compliance with all such covenants.
Securities Financing
The Company entered into a master repurchase agreement to finance securities (“Securities Financing”) in July 2018. The Securities Financing has an advance rate between 50% and 60% based on the class of security and accrues interest at a rate of 30-day LIBOR plus 3.50% to 4.00% annually. The Securities Financing was paid-off in May 2019.
Promissory Note
The Company entered into a $6.4 million promissory note (“Promissory Note”) in April 2016. The Promissory Note accrued interest at 3.75% annually and fully amortizes in 25 monthly installments equal to $277 thousand a month. The Promissory Note matured and was paid-off in April 2018.
Interest Expense
Interest expense on all debt obligations with variable rates is paid based on 30-day LIBOR plus a margin ranging from 2.80% - 6.25%.
F-93
Table of Contents
NOTE 16 – ACCOUNTS PAYABLE AND ACCRUED EXPENSES
Accounts payable and accrued expenses consist of the following:
| December 31, | ||||||||
| 2019 | 2018 | |||||||
| Accounts payable |
$ | 81,111 | $ | 60,586 | ||||
| Loan loss obligation for sold loans |
17,677 | 16,007 | ||||||
| Accrued compensation and benefits |
82,553 | 50,224 | ||||||
| Accrued pricing adjustments on sold loans |
3,826 | 1,724 | ||||||
| Contingent consideration |
2,374 | 961 | ||||||
| Deferred rent |
— | 23,083 | ||||||
| Other |
8,561 | 14,592 | ||||||
|
|
|
|
|
|||||
| $ | 196,102 | $ | 167,177 | |||||
|
|
|
|
|
|||||
NOTE 17 – INCOME TAXES
Income taxes for the Company at the consolidated level include federal, state and local taxes for LD Escrow and ACT. The tax status of ACT changed to a C corporation upon the acquisition of 100% of the capital stock effective June 30, 2017.
The components of income tax expense are as follows for the years ended December 31, 2019, 2018 and 2017:
| Year Ended December 31, | ||||||||||||
| 2019 | 2018 | 2017 | ||||||||||
| Current |
||||||||||||
| Federal |
$ | (1,809 | ) | $ | (440 | ) | $ | 1,195 | ||||
| State |
40 | 54 | 148 | |||||||||
|
|
|
|
|
|
|
|||||||
| (1,769 | ) | (386 | ) | 1,343 | ||||||||
|
|
|
|
|
|
|
|||||||
| Deferred |
||||||||||||
| Federal |
18 | (64 | ) | 106 | ||||||||
| State |
2 | (25 | ) | (13 | ) | |||||||
|
|
|
|
|
|
|
|||||||
| 20 | (89 | ) | 93 | |||||||||
|
|
|
|
|
|
|
|||||||
| Benefit for income taxes |
$ | (1,749 | ) | $ | (475 | ) | $ | 1,436 | ||||
|
|
|
|
|
|
|
|||||||
LD Escrow and ACT had a federal statutory rate of 21% for the years ended December 31, 2019 and 2018, and a federal statutory rate of 34% for the year ended December 31, 2017. The effective tax rate (benefit) of LD Escrow includes a reduction from decrease of uncertain tax position due to lapse of statute of limitations in the amount of $1.8 million and $0.6 million for the years ended December 31, 2019 and 2018, respectively. The effective tax rate (benefit) of LD Escrow for the year ended December 31, 2019 is not meaningful due to the large benefit recorded for the decrease in uncertain tax position. The effective tax rate (benefit) of LD Escrow for the year ended December 31, 2018 was (30)% and includes a true-up for prior year tax accounts. The effective tax rate of LD Escrow for the year ended December 31, 2017 includes impact of recurring items such as state income taxes (net of federal benefits), permanently non-deductible items and adjustment to deferred tax assets and liabilities to the U.S. corporate statutory rate change under Public Law No. 115-97, known as the Tax Cuts and Jobs Act (the “Tax Act”), enacted on December 22, 2017. The effective tax rate of ACT for the year ended December 31, 2019 was 30% and includes recurring items such as state income taxes (net of federal benefit) and permanently non-deductible items, and also includes a true-up for prior year tax accounts. The effective tax rate of ACT for year ended December 31, 2018 was 38% and also includes a true-up for prior year tax accounts. The
F-94
Table of Contents
effective tax rate of ACT for the year ended December 31, 2017 includes a one-time increase in the amount of $112 thousand from the impact of adjusting ACT’s deferred tax assets and liabilities to the U.S. corporate statutory rate change under the Tax Act.
Temporary differences and carryforwards that give rise to deferred tax assets and liabilities are comprised of the following:
| December 31, | ||||||||
| 2019 | 2018 | |||||||
| Deferred tax assets: |
||||||||
| Accrued vacation |
$ | 31 | $ | 29 | ||||
| Net operating losses |
10 | 50 | ||||||
| State taxes |
— | 11 | ||||||
|
|
|
|
|
|||||
| Total deferred tax assets |
41 | 90 | ||||||
|
|
|
|
|
|||||
| Deferred tax liabilities: |
||||||||
| Acquired intangible assets |
(71 | ) | (96 | ) | ||||
| Depreciation |
(1 | ) | (4 | ) | ||||
|
|
|
|
|
|||||
| Net deferred tax liabilities |
$ | (31 | ) | $ | (10 | ) | ||
|
|
|
|
|
|||||
Deferred income taxes arise from temporary differences between the tax basis of assets and liabilities and their reported amounts in the financial statements, which will result in taxable or deductible amounts in the future. Changes in tax laws and rates may affect recorded deferred tax assets and liabilities and the Company’s effective tax rate in the future. The Tax Act reduced the U.S. corporate statutory tax rate to 21% effective for tax years beginning after December 31, 2017. Deferred income taxes are measured using the applicable tax rates that are expected to apply in the year when the asset is realized or the liability is settled, based on the tax rates that have been enacted at the reporting date. The Company measured its deferred tax assets and liabilities at December 31, 2019 and 2018 using a federal tax rate of 21%. The Company establishes a valuation allowance when it is more-likely-than-not that some portion or all of the deferred tax assets will not be realized. As of December 31, 2019, the Company does not have a valuation allowance on any deferred tax assets as the Company believes it is more-likely-than-not that the Company will realize the benefits of the deferred tax assets.
ACT has unused federal net operation losses with no expiration that remain available for future periods.
As of December 31, 2019 and 2018, LD Escrow has a liability of $0.3 million and $2.1 million, respectively, for unrecognized tax benefits related to various federal and state income tax matters excluding interest, penalties and related tax benefits.
A reconciliation of the beginning and ending amount of uncertain tax positions is as follows:
| Year Ended December 31, | ||||||||||||
| 2019 | 2018 | 2017 | ||||||||||
| Balance at beginning of period |
$ | 1,655 | $ | 2,125 | $ | 2,125 | ||||||
| Increases related to positions taken during prior years |
— | — | — | |||||||||
| Increases related to positions taken during the current year |
— | — | — | |||||||||
| Decreases related to positions settled with tax authorities |
— | — | — | |||||||||
| Decreases due to a lapse of applicable statute of limitations |
(1,373 | ) | (470 | ) | — | |||||||
|
|
|
|
|
|
|
|||||||
| Balance at end of period |
$ | 282 | $ | 1,655 | $ | 2,125 | ||||||
|
|
|
|
|
|
|
|||||||
F-95
Table of Contents
Due to the lapse of statute of limitations, the Company recognized a net decrease in accrued interest and penalties related to unrecognized tax benefits of ($0.5) million and ($0.1) million for the years ended December 31, 2019 and 2018, respectively. The Company recognized a net increase in accrued interest and penalties related to unrecognized tax benefits of $0.6 million for the year ended December 31, 2017. The Company accounts for interest and penalties associated with income tax obligations as a component of income tax expense.
The Company anticipates a decrease in the remaining uncertain tax position within the next twelve months of the reporting date due to a future lapse of statute of limitations in state tax jurisdictions.
NOTE 18 – LEASES
The Company has entered in various operating leases, which expire at various dates through 2025, related to its corporate headquarters and support, sales and processing offices. The Company’s operating lease agreements have remaining terms ranging from less than one year to ten years. Certain of these operating lease agreements include options to extend the original term. The Company’s operating lease agreements do not require the Company to make variable lease payments.
| Year Ended December 31, 2019 |
||||
| Lease expense: |
||||
| Operating leases |
$ | 29,560 | ||
| Short-term leases |
430 | |||
| Sublease income |
(1,000 | ) | ||
|
|
|
|||
| Lease expense included in occupancy expense |
$ | 28,990 | ||
|
|
|
|||
| Other information: |
||||
| Cash paid for operating leases |
$ | 33,962 | ||
| Right-of-use assets obtained in exchange for lease obligations: |
||||
| Upon adoption of Topic 842 |
71,895 | |||
| New leases entered into during the year |
13,733 | |||
| Period-end: |
||||
| Operating leases: |
||||
| Weighted average remaining lease term (years) |
3.5 | |||
| Weighted average discount rate |
6.8 | % | ||
| Financing leases: |
||||
| Weighted average remaining lease term (years) |
1.6 | |||
| Weighted average discount rate |
3.8 | % | ||
Rent expense for operating leases was $30.0 million, $31.2 million and $25.5 million for the years ended December 31, 2019, 2018 and 2017, respectively. Rent expense is included in occupancy expense on the consolidated statements of operations.
F-96
Table of Contents
The following is a schedule of future minimum lease payments for operating leases with initial terms in excess of one year as of December 31, 2019:
| Year ending December 31, |
||||
| 2019 |
$ | 31,710 | ||
| 2020 |
23,654 | |||
| 2021 |
17,294 | |||
| 2022 |
9,681 | |||
| 2023 |
6,442 | |||
| Thereafter |
1,941 | |||
|
|
|
|||
| Total operating lease payments |
90,722 | |||
| Less: Imputed interest |
(10,465 | ) | ||
|
|
|
|||
| Operating lease liability |
$ | 80,257 | ||
|
|
|
As of December 31, 2019, the Company has five operating leases that have not yet commenced with aggregate undiscounted required payments of $2.3 million.
Financing Leases
The Company leases certain equipment under agreements that are classified as financing leases. The cost of equipment under financing leases, net of accumulated amortization, is included in Property and equipment, net in the consolidated balance sheets.
Minimum future lease payments under financing leases as of December 31, 2019 and for the remaining years under the financing leases are:
| Year ending December 31, |
||||
| 2020 |
$ | 22,736 | ||
| 2021 |
9,968 | |||
| 2022 |
1,976 | |||
| 2023 |
— | |||
| Thereafter |
— | |||
|
|
|
|||
| Total minimum lease payments remaining |
34,680 | |||
| Less: Amount representing interest |
(863 | ) | ||
|
|
|
|||
| $ | 33,817 | |||
|
|
|
Financing leases have lease terms which are one to five years at an effective interest rate generally between 2.79% and 15.25%. The transactions have been accounted for as financing arrangements, wherein the property remains on the Company’s books and will continue to be depreciated.
Interest expense incurred on financing leases during the years ended December 31, 2019, 2018 and 2017 was $1.1 million, $1.3 million and $1.0 million, respectively, and is included in other interest expense in the consolidated statements of operations.
The cost and accumulated depreciation of equipment held under financing leases is as follows:
| December 31, | ||||||||
| 2019 | 2018 | |||||||
| Cost |
$ | 74,352 | $ | 57,444 | ||||
| Accumulated depreciation |
(42,447 | ) | (27,497 | ) | ||||
|
|
|
|
|
|||||
| Financing lease asset, net |
$ | 31,905 | $ | 29,947 | ||||
|
|
|
|
|
|||||
F-97
Table of Contents
Depreciation of assets under financing leases totaled $19.4 million, $13.2 million and $10.3 million for the years ended December 31, 2019, 2018 and 2017, respectively, and is included as a component of depreciation and amortization expense in the consolidated statements of operations.
NOTE 19 – RELATED PARTY TRANSACTIONS
During the year ended December 31, 2017, certain unitholders entered into promissory note agreements (“Shareholder Notes”) secured by Common Units owned by their respective unitholders. The Shareholder Notes, with a balance of $52.7 million and $51.4 million as of December 31, 2019 and 2018, respectively, accrue interest at a rate of 2.50% per annum compounded annually or, in the Event of Default, accrue interest at a rate of 4.50% per annum and are included in Accounts receivable, net on the consolidated balance sheet. The Shareholder Notes are due in full on the earliest to occur of (a) the fifth anniversary of the date of the notes, and, generally, (b) a Public Offering or a Sale of the Company as such terms were defined in the LLC Agreement that was in effect at the date of the Shareholder Notes. At December 31, 2019 and 2018, $46.0 million of the outstanding shareholder notes were secured by Class A Common Units.
In conjunction with its various joint ventures, the Company entered into various agreements to provide services to the joint ventures for which it receives and pays fees. Services for which the Company earns fees comprise loan processing and administrative services (legal, accounting, human resources, data processing and management information, assignment processing, post-closing, underwriting, facilities management, quality control, management consulting, risk management, promotions, public relations, advertising and compliance with credit agreements). The Company also originates eligible mortgage loans referred to it by the joint ventures for which the Company pays the joint ventures a broker fee.
Fees earned and costs incurred from the joint ventures is as follows:
| Year Ended December 31, | ||||||||||||
| 2019 | 2018 | 2017 | ||||||||||
| Loan processing and administrative services fee income |
$ | 9,909 | $ | 7,464 | $ | 6,350 | ||||||
| Loan origination broker fees expense |
75,420 | 75,060 | 66,466 | |||||||||
| December 31, | ||||||||
| 2019 | 2018 | |||||||
| Receivables from joint ventures |
$ | 3,582 | $ | 1,439 | ||||
The Company paid travel and promotional fees of zero, $0.2 million and $0.6 million to an entity controlled by a Unitholder of the Company during the years ended December 31, 2019 and 2018 and 2017, respectively. The Company paid management fees of $0.7 million, $0.9 million and $1.1 million to a Unitholder of the Company during the years ended December 31, 2019, 2018 and 2017, respectively. The Company employed certain employees that provided services to a Unitholder whose salaries totaled $0.2 million, $0.2 million and $0.2 million for the years ended December 31, 2019, 2018 and 2017, respectively.
NOTE 20 – REDEEMABLE UNITS, UNITHOLDERS’ EQUITY AND NONCONTROLLING INTERESTS
On December 31, 2017, the Company executed the Reorganization pursuant to which all outstanding common unit classes (other than the Class I Common Units) were exchanged for and converted into substantially similar equity securities of LD Holdings. All classes of units are entitled to receive distributions equal to their estimated tax liability and other minimum thresholds pursuant to the LLC agreement. On December 31, 2018, the Company executed a reorganization pursuant to which the Class I Units of loanDepot held by each Class I Unitholder were exchanged for and converted into substantially similar equity securities of LD Holdings.
F-98
Table of Contents
Redeemable Units and Unitholders’ Equity
Class I Common Units
The Class I Common Units have no voting rights. A total of 1,190,093 Class I Common Units were authorized, issued and outstanding as of December 31, 2019 and 2018. Upon and after an initial Public Offering, the Class I Common Unitholders will receive 25% of the net primary proceeds (as defined) from an initial Public Offering multiplied by 25%; provided, however, that the result of this formula shall equal a minimum of $35 million and a maximum of $63.5 million. Prior to an initial Public Offering, the Class I Common Unitholders will be entitled to receive the following. In the event an iMortgage Capital Event occurs (i.e. the sale of the iMortgage division or the financing or refinancing of the iMortgage Assets as defined in the LLC Agreement) or if a sale of the Company occurs that is greater than or equal to $200 million, then the Class I Common Unitholders will receive $83.5 million plus any outstanding amounts payable under the LLC Agreement. If a sale of the Company occurs that is less than $200 million, then the Class I Common Unitholders will receive an amount that is equal to (i) the net proceeds (as defined) from one or more Third Parties to the Company from the Sale of the Company or Public Offering, as applicable, multiplied by (ii) eighty percent, multiplied by (iii) the percentage resulting from dividing (A) the Pre-Tax iMortgage Income during the Measuring Period, by (B) the Pre-Tax Company Income during the Measuring Period. In the event the required distributions are not made, the Class I Common Unitholders are entitled to certain Class I Dividend Payments, as defined, until the amounts owed are satisfied.
Class A Common Units
Class A Common Units are voting Units and holders are entitled to one vote per Class A Common Unit, unless designated as non-voting upon grant. Class A Common Units have a liquidation preference, equal to the aggregate Capital Contribution made for the Class A Common Units, over all other common unit classes except classes I, J and K. As of December 31, 2019 and 2018, the liquidation preference of the Class A Common Units was $26.9 million. There were 269,000 Class A Common Units authorized and outstanding as of December 31, 2019 and 2018, respectively.
Class B Common Units
Class B Common Units have no voting rights. Class B Common Units have a liquidation preference subordinate to Class A Common Units. As of December 31, 2019 and 2018 the liquidation preference of the Class B Common Units was $5.0 million. There were 50,000 Class B Common Units authorized and outstanding as of December 31, 2019 and 2018, respectively.
Class P Common Units
Class P Common Units have no voting rights. Class P Common Units have a liquidation preference subordinate to Class B Common Units and were pari pasu with the Class P-2 Common Units described below. These Class P Common Units carry a liquidation preference of $12.5 million. There were 12,500 Class P Common Units authorized and outstanding as of December 31, 2019 and 2018. Class P Common Unitholders have the right to receive distributions equal to the liquidation preference pari pasu with the Class P-2 Common Units once the Class A and Class B Common Unitholders have received distributions equal to 1.5 times the amount contributed by the Class A and Class B Common Unitholders. Then, subsequent to the distributions to the Class A, Class B and Class Z-1 Common Units (as described below), the Class P Common Unitholders have the right to receive distributions, to the extent distributions were authorized by the board of directors, equal to the greater of (a) 225% of the amount contributed by the Class P Common Unitholders or (b) a 20% per annum return on the amount contributed by the Class P Common Unitholders. Upon the sale of the Company, the Class P Common Unitholders have the right to increase this distribution based upon a formula described in the LLC Agreement. Upon an initial public offering (“IPO”), the Class P Common Unitholders have the right to have the Company redeem the Class P Common Units at a redemption price equal to the distributions that the Class P
F-99
Table of Contents
Common Unitholder would receive from the IPO. The holders of the Class P Common Units also have the right to convert the Class P Common Units to the common shares sold in the IPO at a price equal to 87.2% of the public offering price. The Company also has the right, upon an IPO, to obligate the conversion of the Class P Common Units into common shares sold in the IPO.
Class P-2 Common Units
Class P-2 Common Units have no voting rights. Class P-2 Common Units have a liquidation preference subordinate to Class B Common Units and were pari pasu with the Class P Common Units described above. These Class P-2 Common Units carry a liquidation preference of $19.8 million. There were 19,800 Class P-2 Common Units authorized and outstanding as of December 31, 2019 and 2018. Class P-2 Common Unitholders have the right to receive distributions equal to the liquidation preference pari pasu with the Class P Common Units once the Class A and Class B Common Unitholders received distributions equal to 1.5 times the amount contributed by the Class A and Class B Common Unitholders. Then, subsequent to the distributions to the Class A, Class B and Class Z-1 Common Units (as described below), the Class P-2 Common Unitholders have the right to receive distributions, to the extent distributions were authorized by the board of directors, equal to the greater of (a) 125% of the amount contributed by the Class P-2 Common Unitholders if the Company successfully completed an IPO during 2015 or the Company met or exceeded the 2015 operating budget metric of $110.0 million pre-tax, net income or (b) 165% if the Company did not complete an IPO during 2015 or meet or exceed the 2015 operating budget metric of $110 million pre-tax, net income or (c) a 20% per annum return on the amount contributed by the Class P-2 Common Unitholders. Upon the sale of the Company, the Class P-2 Common Unitholders have the right to increase this distribution based upon a formula described in the LLC Agreement. Upon an IPO, the Class P-2 Common Unitholders have the right to have the Company redeem the Class P-2 Common Units at a redemption price equal to the distributions that the Class P-2 Common Unitholder would receive from the IPO. The holders of the Class P-2 Common Units also have the right to convert the Class P-2 Common Units to the common shares sold in the IPO at a price equal to 87.5% of the public offering price. The Company also has the right, upon an IPO, to obligate the conversion of the Class P-2 Common Units into common shares sold in the IPO.
Class P-3 Common Units
Class P-3 Common Units have no voting rights. Class P-3 Common Units have a liquidation preference subordinate to the Class P, P-2 and Z-1 Common Units. These Class P-3 Common Units carry a liquidation preference of $96.0 million. There were 40,000 Class P-3 Common Units authorized and outstanding as of December 31, 2019 and 2018. Class P-3 Common Unitholders have the right to receive distributions once the Class P, P-2 and Z-1 Common Units receive all distributions to which the Class P, P-2 and Z-1 Common Units were entitled. Upon the sale of the Company wherein the Pre-Money Valuation is less than or equal to $1.3 billion, then the Class P-3 Common Unitholders will receive an amount equal to their liquidation preference. Upon the sale of the Company wherein the Pre-Money Valuation is greater than $1.3 billion, then the Class P-3 Common Unitholders will receive an amount equal to their liquidation preference multiplied by a fraction, the numerator of which is the Pre-Money Valuation and the denominator of which is $1.3 billion. Upon an Offering Event, the Class P-3 Common Unitholders have the right to elect to have such Class P-3 Common Unit either (A) redeemed for an amount in cash equal to the Class P-3 Return Balance of such Class P-3 Common Unit multiplied by a fraction, the numerator of which is the Pre-Money Valuation, and the denominator of which is $1.3 billion; or (B) converted or exchanged into equity securities of the Public Offering Entity, with each Class P-3 Common Unit converting or exchanging into such equity securities based on the following ratio: one to a fraction, the numerator of which is the Class P-3 Return Balance of such Class P-3 Common Unit, and the denominator of which is the lower of $1.3 billion and the Pre-Money Valuation.
Class J and Class K Common Units
Holders of Class J and Class K Common Units are eligible to receive distributions, in a proportionate share with Class I Common Units, subject to certain return thresholds as defined and set forth in the corresponding
F-100
Table of Contents
grant, purchase or other agreement pursuant to which such Class J and Class K Common Units were issued. There were no Class J or Class K Common Units grants as of December 31, 2019 and 2018.
Class Z, Class Y, Class X, Class W and Class V Common Units
Class Z, Class Y, Class X, Class W and Class V Common Units have no voting rights and may be issued to existing or new employees, officers, directors, consultants or other service providers of the Company or any of its subsidiaries. Holders of Class Z, Class Y, Class X, Class W and Class V Common Units are eligible to receive distributions, in a proportionate share with Class A Common Units and Class B Common Units, subject to certain return thresholds as defined and set forth in the corresponding grant, purchase or other agreement pursuant to which such Class Z, Class Y, Class X, Class W and Class V Common Units were issued.
The Company has granted the following Class Z, Class Y, Class X, Class W, and Class V Common Units:
| • | Class Z-1 Common Units: Holders of Class Z-1 Common Units are not eligible to receive distributions until distributions were made to the holders of Class P and P-2 Common Units received distributions equal to the liquidation preference of the Class P and P-2 Common Units (“Class Z-1 Minimum Threshold”). Once the Class Z-1 Minimum Threshold is reached, the holders of Class Z-1 Common Units will share in distributions with Class A Common Unit and Class B Common Unitholders at a ratio of 85% Class A and Class B Common Unit and 15% Class Z-1 Common Units until the Class A Common Unit and Class B Common Unitholders receive distributions equal to 2.5 times the aggregate capital contribution made for said Common Units (“Class Z-1 Maximum Threshold”). No further distributions will be made to the holders of Class Z-1 Common Units once the Class Z-1 Maximum Threshold is reached. There were 44,502 Class Z-1 Common Units authorized and outstanding as of December 31, 2019 and 2018. |
| • | Class Z-2 Common Units: Holders of Class Z-2 Common Units are not eligible to receive distributions until all distributions had been made to the holders of Class P and P-2 Common Units and holders of Class Z-1 Common Units have received their distributions as described above (“Class Z-2 Minimum Threshold”). Once the Class Z-2 Minimum Threshold is reached, the holders of Class Z-2 Common Units will share in distributions with Class A Common Unit and Class B Common Unitholders at a ratio of 75% Class A and Class B Common Unit and 25% Class Z-2 Common Units until the Class A Common Unit and Class B Common Unitholders receive distributions equal to 3.5 times the aggregate capital contribution made for said Common Units (“Class Z-2 Maximum Threshold”). No further distributions will be made to the holders of Class Z-2 Common Units once the Class Z-2 Maximum Threshold is reached. There were 83,189 Class Z-2 Common Units authorized and outstanding as of December 31, 2019 and 2018. |
| • | Class Z-3 Common Units: Holders of Class Z-3 Common Units are not eligible to receive distributions until distributions have been made to the holders of Class A Common Units and Class B Common Units equal to 3.5 times the aggregate capital contribution made in exchange for the Class A Common Units and Class B Common Units (“Class Z-3 Minimum Threshold”). Once the Class Z-3 Minimum Threshold is reached, the holders of Class Z-3 Common Units will share in distributions with Class A Common Unit and Class B Common Unitholders at a ratio of 65% Class A and Class B Common Unit and 35% Class Z-3 Common Units until the Class A Common Unit and Class B Common Unitholders receive distributions equal to 4.5 times the aggregate capital contribution made for said Common Units (“Class Z-3 Maximum Threshold”). No further distributions will be made to the holders of Class Z-3 Common Units once the Class Z-3 Maximum Threshold is reached. There were 133,789 Class Z-3 Common Units authorized and outstanding as of December 31, 2019 and 2018. |
| • | Class Z-4, Class Y, Class X, and Class W Common Units: Holders of Class Z-4 and Class Y Common Units are not eligible to receive distributions until distributions have been made to the holders of Class A Common Units and Class B Common Units equal to 4.5 times the aggregate capital contribution made in exchange for the Class A Common Units and Class B Common Units (“Class Z-4 |
F-101
Table of Contents
| Minimum Threshold”). Once the Class Z-4 Minimum Threshold is reached, the holders of Class Z-4 and Class Y Common Units will share in distributions with Class A Common Unit and Class B Common Unitholders at a ratio of 50% Class A and Class B Common Unit and 50% Class Z-4 and Class Y Common Units until the Class A and Class B Common Unitholders receive distributions equal to 8.0 times the aggregate capital contributions made for said Common Units. |
Then, the holders of Class Z-4, Class Y and Class X Common Units will share in distributions with Class A Common Units and Class B Common Unitholders at a ratio of 50% Class A and Class B Common Units and 50% Class Z-4, Class Y and Class X Common Units until the Class A and Class B Common Unitholders receive distributions equal to 14.265 times the aggregate capital contributions made for said Common Units.
Then, the holders of Class W will share in distributions with Class A Common Unit and Class B Common Unitholders at a ratio of 50% Class A and Class B Common Unit and 50% Class W Common Units until the Class W holders had received $2 million.
Then, the holders of Class Z-4, Class Y and Class X Common Units will share in distributions with Class A Common Unit and Class B Common Unitholders at a ratio of 50% Class A and Class B Common Unit and 50% Class Z-4, Class Y and Class X Common Units.
| • | There were 268,239 Class Z-4 Common Units authorized and outstanding as of December 31, 2019 and 2018. As of December 31, 2019 and 2018, the Company has authorized and outstanding 14,567 of Class Y Common Units and no additional Class Y Common Units were held in reserve for future issuance. As of December 31, 2019 and 2018, the Company had authorized, issued and granted 2,785,758,179 and 2,791,897,853 of Class X Common Units, respectively, and no additional Class X Common Units were held in reserve for future issuance. As of December 31, 2019 and 2018 the Company has authorized, issued and granted 10,000 of Class W Common Units and no additional Class W Common Units were held in reserve for future issuance. As of December 31, 2019 and 2018, the Company had authorized, issued and granted 337,942,529 and 421,491,869 Class V Common Units, respectively, and no additional Class V Common Units were held in reserve for future issuance. |
All classes of units were entitled to receive distributions equal to their estimated tax liability. These distributions had priority over distributive rights granted to any class of units and do not factor into the distributions for the purposes of calculating the minimum thresholds for the Class Z, Class Y, Class X, Class W and Class V Common Units. The liability of Unitholders or Members of the LLC Agreement for debts, liabilities and losses of the Company is limited to their share of Company assets.
NOTE 21 – EQUITY-BASED COMPENSATION
The Company’s 2009 Incentive Equity Plan, 2012 Incentive Equity Plan, and 2015 Incentive Equity Plan (collectively, the “Plans”) provide for the granting of Class Z, Class Y, Class X, and Class W Common Units to employees, managers, consultants and advisors of the Company and its subsidiaries. The number of Class Z, Class Y, Class X, and Class W Common Units which may be granted or sold under the Plans shall not exceed, in the aggregate, 567,370 Class Z Common Units (of which 48,882 shall be Class Z-1 Common Units and 92,333 shall be Class Z-2 Common Units, 149,154 shall be Class Z-3 Common Units and 277,000 shall be Class Z-4 Common Units) and 41,391 Class Y Common Units; provided that, to the extent any Class Z and Class Y Common Units (i) expire, (ii) are canceled, terminated or forfeited in any manner, or (iii) are repurchased by the Company, then in each case such Common Units shall again be available for issuance and sale under the Plans.
Participants receiving grants or purchasing Class Z, Class Y, Class X, or Class W Common Units pursuant to the Plans are required to become a party to the Limited Liability Company Agreement. No Common Units shall be issued after the tenth anniversary of the adoption of the Plans. In addition, the LLC Agreement also allows and provides for the issuance of Common Units.
F-102
Table of Contents
The Company granted 204,577,011 and 201,768,442 Class V Common Units to employees of the Company during the years ended December 31, 2018 and 2017. There were no grants during the year ended December 31, 2019.
The unit grants typically vest 20% on the one year anniversary of the grant and 1.667% each month thereafter, and are subject to accelerated vesting upon the sale of the Company.
| Year Ended December 31, | ||||||||||||||||||||||||
| 2019 | 2018 | 2017 | ||||||||||||||||||||||
| Shares | Weighted Average Grant Date Fair Value |
Shares | Weighted Average Grant Date Fair Value |
Shares | Weighted Average Grant Date Fair Value |
|||||||||||||||||||
| Unvested - beginning of period |
257,789,340 | $ | 0.030 | 298,748,358 | $ | 0.030 | 414,857,928 | $ | 0.020 | |||||||||||||||
| Granted |
— | — | 204,577,011 | 0.009 | 201,768,442 | 0.017 | ||||||||||||||||||
| Vested |
(89,639,924 | ) | 0.004 | (167,992,694 | ) | 0.009 | (290,747,327 | ) | 0.009 | |||||||||||||||
| Forfeited/Cancelled |
(67,469,936 | ) | 0.008 | (77,543,335 | ) | 0.007 | (27,130,685 | ) | 0.013 | |||||||||||||||
|
|
|
|
|
|
|
|
|
|||||||||||||||||
| Unvested - end of period |
100,679,480 | 0.006 | 257,789,340 | 0.030 | 298,748,358 | 0.030 | ||||||||||||||||||
|
|
|
|
|
|
|
|
|
|||||||||||||||||
| Year Ended December 31, | ||||||||||||
| 2019 | 2018 | 2017 | ||||||||||
| Units Granted: |
||||||||||||
| Class V Common Units |
— | 204,577,011 | 201,768,442 | |||||||||
|
|
|
|
|
|
|
|||||||
| Total |
— | 204,577,011 | 201,768,442 | |||||||||
|
|
|
|
|
|
|
|||||||
The compensation expense associated with the Class Z, Class Y, Class X, Class W and Class V Common Units was $0.2 million, $2.1 million and $2.7 million for the years ended December 31, 2019, 2018 and 2017, respectively. At December 31, 2019 and 2018, the total unrecognized compensation cost related to unvested unit grants was $1.1 million and $2.5 million, respectively. This cost is expected to be recognized over the next 3.5 years.
The following assumptions were used for the grants:
| Year Ended December 31, | ||||||
| 2019 | 2018 | 2017 | ||||
| Risk-free interest rate |
N/A | 0.90% - 2.7% | 0.90% - 1.3% | |||
| Expected life |
N/A | 1.2 - 1.5 years | 1.2 - 1.5 years | |||
| Expected volatility |
N/A | 150.0% - 205.0% | 150.0% - 175.0% | |||
The risk-free interest rate is the U.S. Treasury yield curve in effect at the time of grant based on the expected life of the unit grants. The expected life of the units granted represents the period of time the unit grants are expected to be outstanding. The expected volatility is based on the historical volatility of a public peer group of Companies’ stock price in the most recent period that is equal to the expected term of the unit grants being valued.
NOTE 22 – EMPLOYEE BENEFIT PLAN
The Company’s employees are eligible to participate in a defined contribution plan (“401(k) Plan”). The Company matches 50% of participant contributions, up to 6% of each participant’s total eligible gross compensation. Matching contributions totaled approximately $10.7 million, $10.2 million and $10.6 million for the years ended December 31, 2019, 2018 and 2017, respectively.
F-103
Table of Contents
NOTE 23 – COMMITMENTS AND CONTINGENCIES
Escrow Services
In conducting its operations, the Company, through its wholly-owned subsidiaries, LD Escrow and ACT, routinely hold customers’ assets in escrow pending completion of real estate financing transactions. These amounts are maintained in segregated bank accounts and are offset with the related liabilities resulting in no amounts reported in the accompanying consolidated balance sheets. In the fourth quarter of 2019, LD Escrow transitioned its operations to LDSS. The balances held for the Company’s customers totaled $113.8 million and $25.6 million at December 31, 2019 and 2018, respectively. The Company earned $25.8 million, $10.0 million and $17.4 million in fees from escrow related services for the years ended December 31, 2019, 2018 and 2017, respectively. Escrow fees are included in other income on the consolidated statements of operations.
Legal Proceedings
The Company is a defendant in or a party to a number of legal actions or proceedings that arise in the ordinary course of business. In some of these actions and proceedings, claims for monetary damages are asserted against the Company. In view of the inherent difficulty of predicting the outcome of such legal actions and proceedings, the Company generally cannot predict what the eventual outcome of the pending matters will be, what the timing of the ultimate resolution of these matters will be, or what the eventual loss related to each pending matter may be, if any.
The Company seeks to resolve all litigation and regulatory matters in the manner management believes is in the best interest of the Company and contests liability, allegations of wrongdoing and, where applicable, the amount of damages or scope of any penalties or other relief sought as appropriate in each pending matter. On at least a quarterly basis, the Company assesses its liabilities and contingencies in connection with outstanding legal and regulatory proceedings utilizing the latest information available. Any estimated loss is subject to significant judgment and is based upon currently available information, a variety of assumptions, and known and unknown uncertainties. Where available information indicates that it is probable a liability has been incurred and the Company can reasonably estimate the amount of the loss, an accrued liability is established. The actual costs of resolving these proceedings may be substantially higher or lower than the amounts accrued.
Based on the Company’s current understanding of these pending legal actions and proceedings, management does not believe that judgments or settlements arising from pending or threatened legal matters, individually or in the aggregate, will have a material adverse effect on the consolidated financial position, operating results or cash flows of the Company. However, unfavorable resolution could affect the consolidated financial position, results of operations or cash flows for the years in which they are resolved.
Compliance Matters
During the fourth quarter of 2019, an increase in mortgage originations resulted in an increase in title orders and loan settlements creating personnel and operational pressures within the Company. The Company increased staffing, adjusted schedules and enhanced processes, but still experienced constraints in order to meet settlement timelines. Specifically, there was an increase in the number of days between receipt of funds from the originating lender and the disbursement of those funds to the payoffs on the loan transaction. A review was initiated in order to refund affected consumers any overage in per diem charges due to the delay based on loan program and property state requirements. The review is in the final stages and all refunds are to be remitted to affected consumers during 2020. As a result of this event and in order to prevent recurrence, the Company has decreased the number of states in which they accept orders in order to manage pipelines and routinely review key performance indicators along with pipeline estimates from their customers.
Regulatory Requirements
The Company is subject to various capital requirements by the U.S. Department of Housing and Urban Development (“HUD”); lenders of the warehouse lines of credit; and secondary markets investors. Failure to
F-104
Table of Contents
maintain minimum capital requirements could result in the inability to participate in HUD-assisted mortgage insurance programs, to borrow funds from warehouse line lenders or to sell or service mortgage loans. As of December 31, 2019 and 2018, the Company was in compliance with its selling and servicing capital requirements.
Commitments to Extend Credit
The Company enters into IRLCs with customers who have applied for residential mortgage loans and meet certain credit and underwriting criteria. These commitments expose the Company to market risk if interest rates change and the loan is not economically hedged or committed to an investor. The Company is also exposed to credit loss if the loan is originated and not sold to an investor and the customer does not perform. The collateral upon extension of credit typically consists of a first deed of trust in the mortgagor’s residential property. Commitments to originate loans do not necessarily reflect future cash requirements as some commitments are expected to expire without being drawn upon. Total commitments to originate loans as of December 31, 2019 and 2018 approximated $8.9 billion and $3.0 billion, respectively. These loan commitments are treated as derivatives and are carried at fair value (See Note 9 - Derivative Financial Instruments and Hedging Activities).
Loan Repurchase Reserve
When the Company sells mortgage loans, it makes customary representations and warranties to the purchasers about various characteristics of each loan such as the origination and underwriting guidelines, including but not limited to the validity of the lien securing the loan, property eligibility, borrower credit, income and asset requirements, and compliance with applicable federal, state and local law. The Company’s whole loan sale agreements generally require it to repurchase loans if the Company breached a representation or warranty given to the loan purchaser. Additionally, the Company has repurchase obligations for personal loans facilitated through its banking relationship in the case where personal identification fraud is discovered at the inception of the loan.
The Company’s loan repurchase reserve for sold loans is reflected in Accounts payable and accrued expenses. There have been charge-offs associated with early payoffs, early payment defaults and losses related to representations, warranties and other provisions for the years ended December 31, 2019, 2018 and 2017.
The activity related to the loan loss obligation for sold loans is as follows:
| Year Ended December 31, | ||||||||||||
| 2019 | 2018 | 2017 | ||||||||||
| Balance at beginning of period |
$ | 18,301 | $ | 23,576 | $ | 22,891 | ||||||
| Provision for (reversal of) loan losses |
8,674 | (3,280 | ) | 1,228 | ||||||||
| Payments, realized losses and other |
(9,298 | ) | (1,995 | ) | (543 | ) | ||||||
|
|
|
|
|
|
|
|||||||
| Balance at end of period |
$ | 17,677 | $ | 18,301 | $ | 23,576 | ||||||
|
|
|
|
|
|
|
|||||||
NOTE 24 – REGULATORY CAPITAL AND LIQUIDITY REQUIREMENTS
The Company, through certain subsidiaries, is required to maintain minimum net worth, liquidity and other financial requirements specified in certain of its selling and servicing agreements, including:
| • | Ginnie Mae single-family issuers. The eligibility requirements include net worth of $2.5 million plus 0.35% of outstanding Ginnie Mae single-family obligations and a liquidity requirement equal to the greater of $1.0 million or 0.10% of outstanding Ginnie Mae single-family securities. |
| • | Fannie Mae and Freddie Mac. The eligibility requirements for seller/servicers include tangible net worth of $2.5 million plus 0.25% of the Company’s total single-family servicing portfolio, excluding loans subserviced for others and a liquidity requirement equal to 0.35% of the aggregate UPB serviced for the agencies plus 2.0% of total nonperforming agency servicing UPB in excess of 6% basis points. |
F-105
Table of Contents
| • | HUD. The eligibility requirements include a minimum adjusted net worth of $1,000,000 plus 1% of the total volume in excess of $25,000,000 of FHA Single Family Mortgages originated, underwritten, serviced, and/or purchased during the prior fiscal year, up to a maximum required adjusted net worth of $2,500,000 |
| • | Fannie Mae, Freddie Mac and Ginnie Mae. The Company is also required to hold a ratio of Adjusted/Tangible Net Worth to Total Assets greater than 6%. |
To the extent that these requirements are not met, the Company may be subject to a variety of regulatory actions which could have a material adverse impact on our results of operations and financial condition. The most restrictive of the minimum net worth and capital requirements require the Company to maintain a minimum adjusted net worth balance of $76.7 million as of December 31, 2019. As of December 31, 2019, the Company was in compliance with the net worth, liquidity and other financial requirements of its selling and servicing requirements.
NOTE 25 – REVENUE RECOGNITION
On January 1, 2018, the Company adopted ASC 606 by applying the modified retrospective method. Results for reporting periods beginning after January 1, 2018 are presented under ASC 606. Timing of recognition of the Company’s revenue was not impacted by the adoption of ASC 606.
Disaggregation of Revenue
| Year Ended December 31, | ||||||||||||
| Revenue Stream |
Income Statement Classification | 2019 | 2018 | |||||||||
| Other income: |
||||||||||||
| In scope of Topic 606: |
||||||||||||
| Direct title insurance premiums |
Other income | $ | 18,907 | $ | 12,585 | |||||||
| Escrow and sub escrow fees |
Other income | 25,811 | 22,838 | |||||||||
| Default and foreclosure services |
Other income | 1,904 | 832 | |||||||||
| Out of scope of Topic 606: |
||||||||||||
| Income from Joint Ventures |
Other income | 12,915 | 15,061 | |||||||||
| Other |
Other income | 6,144 | 3,434 | |||||||||
|
|
|
|
|
|||||||||
| Total other income |
$ | 65,681 | $ | 54,750 | ||||||||
|
|
|
|
|
|||||||||
Direct title insurance premiums, escrow and sub escrow fees, and default and foreclosure service revenues are within the scope of ASC Topic 606.
Direct title insurance premiums are based on a percentage of the gross title premiums charged by the title insurance provider and is recognized net as revenue when the Company is legally or contractually entitled to collect the premium. Revenue is recognized at the point-in-time upon the closing of the underlying real estate transaction as the earnings process is considered complete. Cash is typically collected at the closing of the underlying real estate transaction.
Escrow and sub escrow fees are primarily associated with managing the closing of real estate transactions including the processing of funds on behalf of the transaction participants, gathering and recording the required closing documents, and providing other related activities. Escrow and sub escrow fees are recognized as revenue when the closing process is complete or when the Company is legally or contractually entitled to collect the fee. Revenue is primarily recognized at a point-in-time upon closing of the underlying real estate transaction or completion and billing of services. Cash is typically collected at the closing of the underlying real estate transaction.
F-106
Table of Contents
Default and foreclosure service revenues are associated with foreclosure title searches, tax searches, title updates, deed recordings and other related services. Fees vary by service and are recognized as revenue when the service is complete and billed or when the Company is entitled to collect the fee.
NOTE 26 – SUBSEQUENT EVENTS
In March 2020, the Company entered into an amendment to increase the Original Secured Credit Facility to $75.0 million.
In March 2020, the Company entered into an amendment to increase the Convertible Debt to $75.0 million. In October 2020, the Company repaid its $75.0 million Convertible Debt facility.
In May 2020, the Company entered into an agreement to redeem all of its Class I Common Units for $65.3 million. The Company paid $38.4 million in May 2020 and $26.9 million in July 2020 to redeem the Class I Common Units.
In July 2020, the Company entered into an agreement to increase the Second Secured Credit Facility to $100.0 million and extend the maturity to July 2021.
In August 2020, the Company entered into a $350.0 million uncommitted repurchase facility. This facility is available both to fund loan originations and also provide gestation liquidity to finance recently sold MBS up to the MBS settlement date.
The facility bears interest at 30-day LIBOR plus interest spreads based upon the characteristics of the underlying loans collateralizing the lines of credit, including, but not limited to product type and number of days held for sale. Under the terms of the facility, the Company is required to maintain various financial and other covenants. The facility matures in August 2021.
In September 2020, the Company entered into a $130.0 million servicing advance facility. This facility is available to fund servicing advances on behalf of borrowers and investors to cover delinquent principal and interest payments, property taxes, insurance premiums and other costs. The facility bears interest at 30-day LIBOR plus an interest spread. Under the terms of the facility, the Company is required to maintain various financial and other covenants. The facility matures in September 2021.
In September 2020, the Company made $147.0 million of tax distributions to certain unitholders as required under the Company’s operating agreement, which reduced our tangible net worth.
In September 2020, the Company entered into an agreement to pay off the earnout liability associated with the Mortgage Master acquisition for $32.4 million.
In September 2020, the Company entered into an agreement to increase the Original Secured Credit Facility to $150.0 million.
In October 2020, the Company declared profit distributions of $175.0 million to certain of its unitholders as allowed under the Company’s operating agreement.
In October 2020, the Company issued $500 million in aggregate principal amount of 6.50% senior unsecured notes due 2025.
In October 2020, the Company paid off the $75.0 million Convertible Debt.
In October 2020, the Company paid off the $250.0 million Unsecured Term Loan.
F-107
Table of Contents
In October 2020, the Company issued notes through an additional securitization facility (“2020-1 Securitization Facility” backed by a revolving warehouse line of credit. The 2020-1 Securitization Facility is secured by newly originated, first-lien, residential mortgage loans eligible for purchase by Fannie Mae and Freddie Mac for the purchase of mortgage loans or in accordance with the criteria of Ginnie Mae for the guarantee of securities backed by mortgage loans. The 2020-1 Securitization Facility issued $600.0 million in notes and certificates that bear interest at 30-day LIBOR plus a margin. The 2020-1 Securitization Facility will terminate on the earlier of (i) the two-year anniversary of the initial purchase date, (ii) upon the Company exercising its right to optional prepayment in full and (iii) the date of the occurrence and continuance of an event of default.
In October 2020, the Company paid off $200.0 million in notes and certificates of the 2018 Securitization Facility.
In November 2020, the Company declared profit distributions of $278.8 million to certain of its unitholders as allowed under the Company’s operating agreement. This distribution satisfied the $53.8 million of outstanding Shareholder Notes (see Note 19 - Related Parties) and the remaining $225.0 million was distributed in cash.
At the time of issuance of this report, the direct and indirect impacts that the COVID-19 pandemic and recent market volatility may have on the Company’s financial statements are uncertain. The Company is unaware of any known material risk to the stability of its financial statements caused by these uncertainties and the effect they may have on the Company’s customers and counterparties.
General standards of accounting for, and disclosures of, events that occur after the balance sheet date, but before the financial statements are issued or available to be issued are established by Subsequent Events ASC 855. In accordance with ASC 855, the Company has evaluated subsequent events through November 9, 2020, which is the date these consolidated financial statements were available to be issued.
F-108
Table of Contents
15,000,000 Shares
loanDepot, Inc.
Class A Common Stock
PRELIMINARY PROSPECTUS
, 2021
Through and including , 2021 (the 25th day after the date of this prospectus), all dealers effecting transactions in these securities, whether or not participating in this offering, may be required to deliver a prospectus. This is in addition to a dealer’s obligation to deliver a prospectus when acting as an underwriter and with respect to an unsold allotment or subscription.
Table of Contents
Item 13. Other Expenses of Issuance and Distribution
The following table sets forth all costs and expenses, other than the underwriting discounts and commissions payable by us, in connection with the offer and sale of the securities being registered. All amounts shown are estimates except for the SEC registration fee and the Financial Industry Regulatory Authority, Inc. (“FINRA”) filing fee.
| SEC registration fee |
$ | 47,020 | ||
| FINRA filing fee |
54,838 | |||
| Listing fees and expenses |
150,000 | |||
| Transfer agent and registrar fees and expenses |
15,000 | |||
| Printing fees and expenses |
250,000 | |||
| Legal fees and expenses |
4,089,437 | |||
| Accounting expenses |
1,028,000 | |||
| Miscellaneous expenses |
3,030,163 | |||
|
|
|
|||
| Total |
$ | 8,664,457 | ||
|
|
|
Item 14. Indemnification of Officers and Directors
Section 102 of the Delaware General Corporation Law (“DGCL”) permits the limitation of directors’ personal liability to the corporation or its stockholders for monetary damages for breach of fiduciary duties as a director except for (i) any breach of the director’s duty of loyalty to the corporation or its stockholders, (ii) acts or omissions not in good faith or which involve intentional misconduct or a knowing violation of the law, (iii) breaches under section 174 of the DGCL, which relates to unlawful payments of dividends or unlawful stock repurchase or redemptions, and (iv) any transaction from which the director derived an improper personal benefit.
Section 145 of the DGCL provides, among other things, that we may indemnify any person who was or is a party or is threatened to be made a party to any threatened, pending or completed action, suit or proceeding—other than an action by or in the right of the registrant—by reason of the fact that the person is or was a director, officer, agent or employee of the registrant, or is or was serving at our request as a director, officer, agent or employee of another corporation, partnership, joint venture, trust or other enterprise against expenses, including attorneys’ fees, judgments, fines and amounts paid in settlement actually and reasonably incurred by the person in connection with such action, suit or proceeding. The power to indemnify applies (a) if such person is successful on the merits or otherwise in defense of any action, suit or proceeding, or (b) if such person acting in good faith and in a manner he or she reasonably believed to be in the best interest, or not opposed to the best interest, of the registrant, and with respect to any criminal action or proceeding had no reasonable cause to believe his or her conduct was unlawful. The power to indemnify applies to actions brought by or in the right of the registrant as well but only to the extent of defense expenses, including attorneys’ fees but excluding amounts paid in settlement, actually and reasonably incurred and not to any satisfaction of judgment or settlement of the claim itself, and with the further limitation that in such actions no indemnification shall be made in the event of any adjudication of liability to the registrant, unless the court believes that in light of all the circumstances indemnification should apply.
Section 174 of the DGCL provides, among other things, that a director, who willfully or negligently approves of an unlawful payment of dividends or an unlawful stock purchase or redemption, may be held liable for such actions. A director who was either absent when the unlawful actions were approved or dissented at the time, may avoid liability by causing his or her dissent to such actions to be entered in the books containing minutes of the meetings of the board of directors at the time such action occurred or immediately after such absent director receives notice of the unlawful acts.
The registrant’s amended and restated bylaws, to be filed as Exhibit 3.2 hereto, provide that the registrant shall indemnify its directors and executive officers to the fullest extent not prohibited by the DGCL or any other applicable law. In addition, the registrant intends to enter into separate indemnification agreements, to be filed as
Table of Contents
Exhibit 10.3 hereto, with its directors and officers which would require the registrant, among other things, to indemnify them against certain liabilities which may arise by reason of their status or service as directors or officers to the fullest extent not prohibited by law. These indemnification provisions and the indemnification agreements may be sufficiently broad to permit indemnification of the registrant’s officers and directors for liabilities, including reimbursement of expenses incurred, arising under the Securities Act. The registrant also intends to maintain director and officer liability insurance, if available on reasonable terms.
The form of Underwriting Agreement, to be filed as Exhibit 1.1 hereto, provides for indemnification by the underwriters of us and our officers and directors for certain liabilities, including liabilities arising under the Securities Act and affords certain rights of contribution with respect thereto.
Item 15. Recent Sales of Unregistered Securities
Senior Notes
We issued $500.0 million aggregate principal amount of 6.500% Senior Notes due 2025 on October 22, 2020 (the “Senior Notes”) to qualified institutional buyers under Rule 144A, and to persons outside of the United States under Regulation S of the Securities Act. The Senior Notes are jointly and severally guaranteed on a senior unsecured basis, by Artemis Management LLC, loanDepot.com, LLC, LD Settlement, Services, LLC and mello Holdings, LLC. The Senior Notes will mature on November 1, 2025. Interest on the Senior Notes will accrue at a rate of 6.500% per annum and will be payable in cash, semi-annually in arrears on May 1 and November 1 of each year. At any time prior to November 1, 2022, we may redeem some or all of the Senior Notes at a price equal to 100% of the principal amount of the Senior Notes, plus accrued and unpaid interest, if any, to, but not including, the date of redemption plus a make-whole premium. We may also redeem the Senior Notes at our option, in whole or in part, at any time on or after November 1, 2022, upon at least 10 days but not more than 60 days’ notice, at the redemption prices set forth below, together with accrued and unpaid interest, if any, to, but not including, the date of redemption:
| Year |
Percentage | |||
| 2022 |
103.250 | % | ||
| 2023 |
101.625 | % | ||
| 2024 and thereafter |
100.000 | % | ||
In addition, subject to certain conditions at any time prior to November 1, 2022, we may redeem up to 40% of the principal amount of the Senior Notes with the proceeds of certain equity offerings at a redemption price of 106.500% of the principal amount of the Senior Notes, together with accrued and unpaid interest, if any, to, but not including, the date of redemption.
The indenture that governs the Senior Notes contains covenants that will, among other things, limit the our ability and the ability of our restricted subsidiaries, subject to certain exceptions to incur or guarantee additional debt or issue disqualified stock or certain preferred stock; pay dividends and make other distributions on, or redeem or repurchase, capital stock; make certain investments; incur certain liens; enter into certain transactions with affiliates; merge or consolidate; enter into agreements that restrict the ability of certain restricted subsidiaries to make dividends or other payments to the issuer; designate restricted subsidiaries as unrestricted subsidiaries; and transfer or sell certain assets. These covenants are subject to a number of important exceptions and qualifications. In addition, in certain circumstances, if we sell assets or experience certain changes of control, we must offer to purchase the Senior Notes plus accrued and unpaid interest, if any, plus a premium.
Item 16. Exhibits
(1) Exhibits:
The exhibit index attached hereto is incorporated herein by reference.
Table of Contents
(2) Financial Statement Schedules:
All schedules have been omitted because they are not required or because the required information is given in the financial statements or notes to those statements.
Item 17. Undertakings
The undersigned registrant hereby undertakes to provide to the underwriters at the closing specified in the underwriting agreement certificates in such denominations and registered in such names as required by the underwriters to permit prompt delivery to each purchaser.
Insofar as indemnification for liabilities arising under the Securities Act of 1933, as amended, may be permitted to directors, officers and controlling persons of the registrant pursuant to the foregoing provisions, or otherwise, the registrant has been advised that in the opinion of the Securities and Exchange Commission such indemnification is against public policy as expressed in the Securities Act and is, therefore, unenforceable. In the event that a claim for indemnification against such liabilities (other than the payment by the registrant of expenses incurred or paid by a director, officer or controlling person of the registrant in the successful defense of any action, suit or proceeding) is asserted by such director, officer or controlling person in connection with the securities being registered, the registrant will, unless in the opinion of its counsel the matter has been settled by controlling precedent, submit to a court of appropriate jurisdiction, the question whether such indemnification by it is against public policy as expressed in the Securities Act and will be governed by the final adjudication of such issue.
The undersigned registrant hereby further undertakes that:
| (1) | For purposes of determining any liability under the Securities Act of 1933, as amended, the information omitted from the form of prospectus filed as part of this registration statement in reliance upon Rule 430A and contained in a form of prospectus filed by the registrant pursuant to Rule 424(b)(1) or (4) or 497(h) under the Securities Act shall be deemed to be part of this registration statement as of the time it was declared effective. |
| (2) | For the purpose of determining any liability under the Securities Act of 1933, as amended, each post-effective amendment that contains a form of prospectus shall be deemed to be a new registration statement relating to the securities offered therein, and the offering of such securities at that time shall be deemed to be the initial bona fide offering thereof. |
Table of Contents
EXHIBIT INDEX
Table of Contents
Table of Contents
Table of Contents
Table of Contents
Table of Contents
Table of Contents
Table of Contents
Table of Contents
| † | Previously filed as an exhibit to our Registration Statement on Form S-1 (No. 333-252024). |
| ¥ | Schedules (or similar attachments) have been omitted pursuant to Item 601(b)(2) of Regulation S-K. The registrant will furnish supplemental copies of any omitted schedules (or similar attachments) to the Securities and Exchange Commission upon request. |
| + | Management contract or compensatory plan or arrangement. |
| # | Portions of this exhibit (indicated by asterisks) have been redacted in accordance with Item 601(b)(10)(iv) of Regulation S-K. |
Table of Contents
Pursuant to the requirements of the Securities Act, the registrant has duly caused this registration statement to be signed on its behalf by the undersigned, thereunto duly authorized, in the City of Foothill Ranch, State of California, on February 9, 2021.
| LOANDEPOT, INC. | ||
| By: | /s/ Anthony Hsieh | |
| Name: | Anthony Hsieh | |
| Title: | Chief Executive Officer | |
Pursuant to the requirements of the Securities Act of 1933, as amended, this Registration Statement has been signed below by the following persons in the capacities and on the dates indicated.
| Name |
Title |
Date | ||
| /s/ Anthony Hsieh Anthony Hsieh |
Chief Executive Officer & Sole Director | February 9, 2021 | ||
| * Patrick Flanagan |
Chief Financial Officer | February 9, 2021 | ||
| * Nicole Carrillo |
Executive Vice President, Chief Accounting Officer | February 9, 2021 | ||
| * |
/s/ Anthony Hsieh Anthony Hsieh Attorney-in-Fact |