Attached files
| file | filename |
|---|---|
| EX-99.1 - EX-99.1 - i3 Verticals, Inc. | iiiv1q21earningsrelease.htm |
| 8-K - 8-K - i3 Verticals, Inc. | iiiv-20210208.htm |

Q1 Fiscal 2021 Supplemental Information

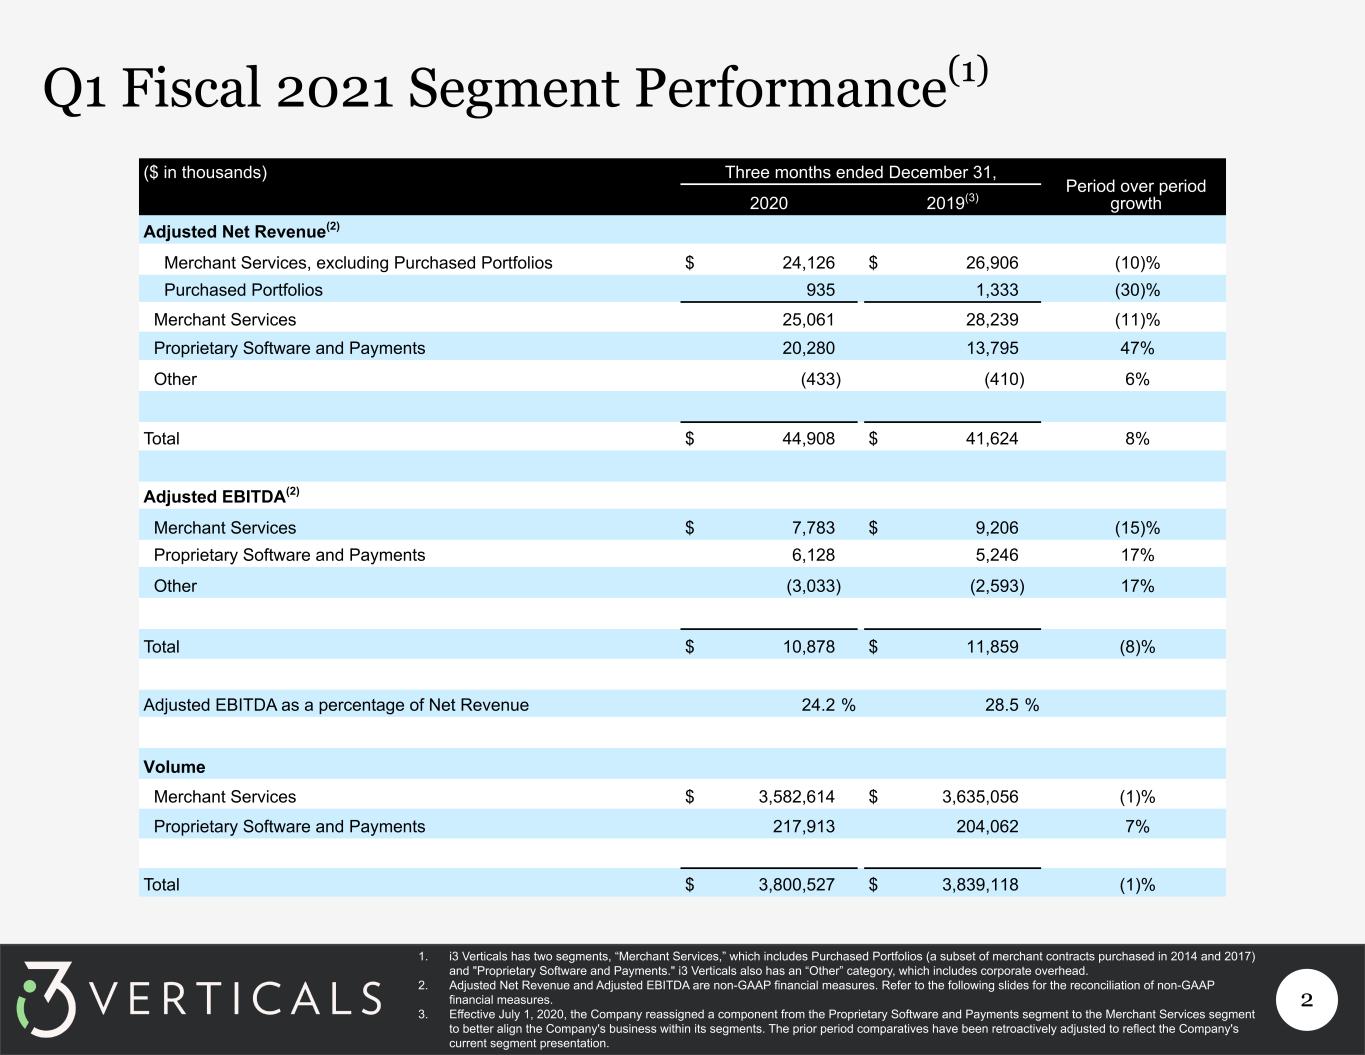
2 Q1 Fiscal 2021 Segment Performance(1) ($ in thousands) Three months ended December 31, Period over period growth2020 2019(3) Adjusted Net Revenue(2) Merchant Services, excluding Purchased Portfolios $ 24,126 $ 26,906 (10)% Purchased Portfolios 935 1,333 (30)% Merchant Services 25,061 28,239 (11)% Proprietary Software and Payments 20,280 13,795 47% Other (433) (410) 6% Total $ 44,908 $ 41,624 8% Adjusted EBITDA(2) Merchant Services $ 7,783 $ 9,206 (15)% Proprietary Software and Payments 6,128 5,246 17% Other (3,033) (2,593) 17% Total $ 10,878 $ 11,859 (8)% Adjusted EBITDA as a percentage of Net Revenue 24.2 % 28.5 % Volume Merchant Services $ 3,582,614 $ 3,635,056 (1)% Proprietary Software and Payments 217,913 204,062 7% Total $ 3,800,527 $ 3,839,118 (1)% 1. i3 Verticals has two segments, “Merchant Services,” which includes Purchased Portfolios (a subset of merchant contracts purchased in 2014 and 2017) and "Proprietary Software and Payments." i3 Verticals also has an “Other” category, which includes corporate overhead. 2. Adjusted Net Revenue and Adjusted EBITDA are non-GAAP financial measures. Refer to the following slides for the reconciliation of non-GAAP financial measures. 3. Effective July 1, 2020, the Company reassigned a component from the Proprietary Software and Payments segment to the Merchant Services segment to better align the Company's business within its segments. The prior period comparatives have been retroactively adjusted to reflect the Company's current segment presentation.

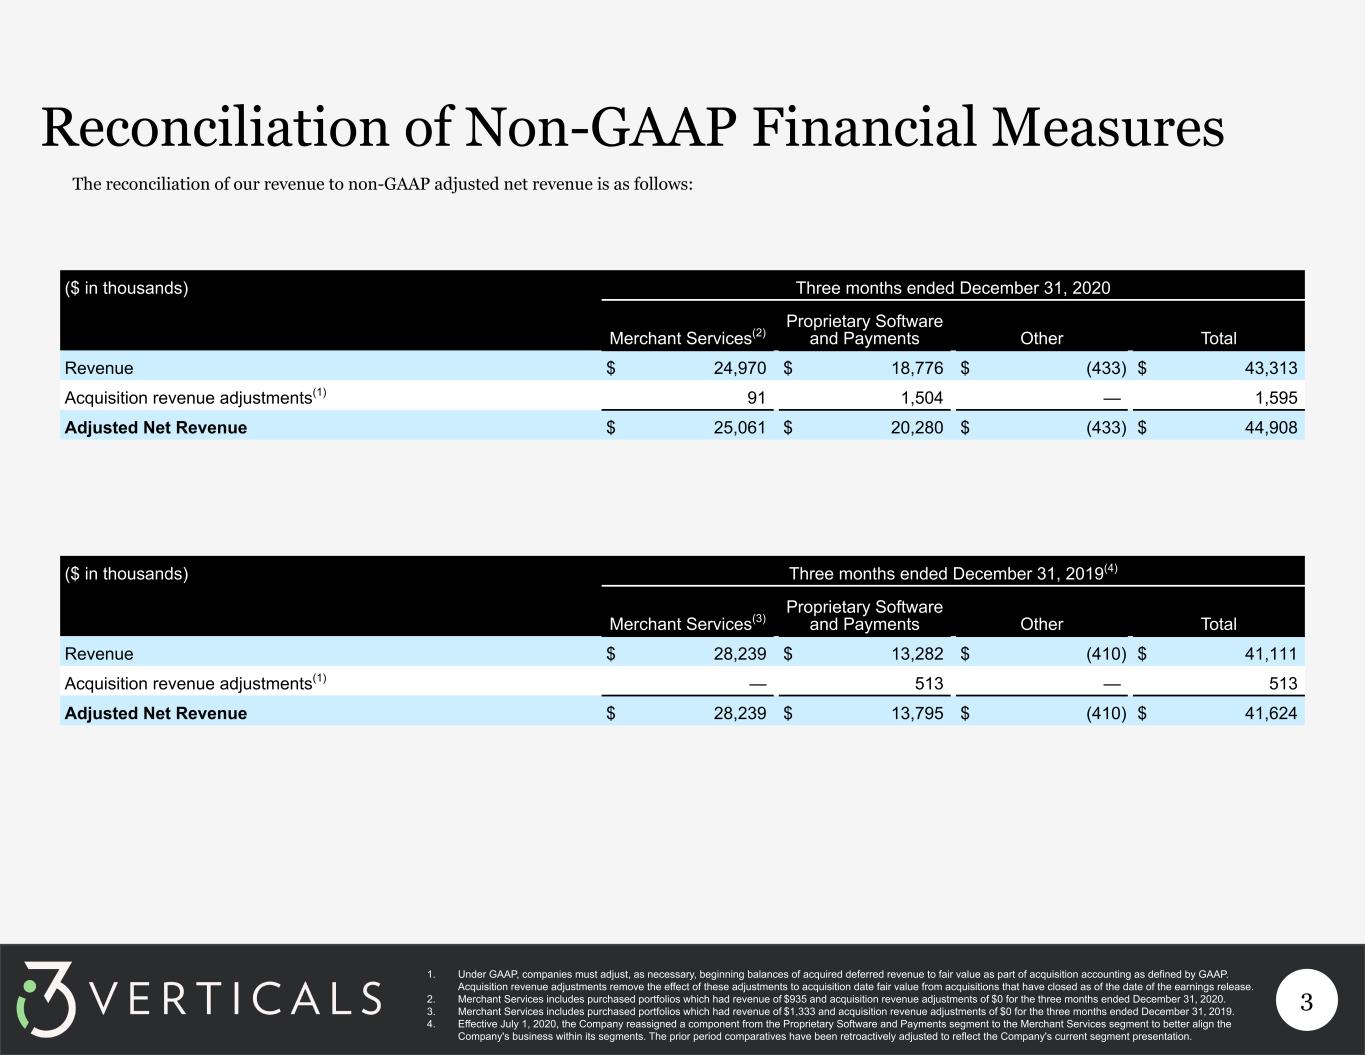
3 Reconciliation of Non-GAAP Financial Measures ($ in thousands) Three months ended December 31, 2020 Merchant Services(2) Proprietary Software and Payments Other Total Revenue $ 24,970 $ 18,776 $ (433) $ 43,313 Acquisition revenue adjustments(1) 91 1,504 — 1,595 Adjusted Net Revenue $ 25,061 $ 20,280 $ (433) $ 44,908 ($ in thousands) Three months ended December 31, 2019(4) Merchant Services(3) Proprietary Software and Payments Other Total Revenue $ 28,239 $ 13,282 $ (410) $ 41,111 Acquisition revenue adjustments(1) — 513 — 513 Adjusted Net Revenue $ 28,239 $ 13,795 $ (410) $ 41,624 1. Under GAAP, companies must adjust, as necessary, beginning balances of acquired deferred revenue to fair value as part of acquisition accounting as defined by GAAP. Acquisition revenue adjustments remove the effect of these adjustments to acquisition date fair value from acquisitions that have closed as of the date of the earnings release. 2. Merchant Services includes purchased portfolios which had revenue of $935 and acquisition revenue adjustments of $0 for the three months ended December 31, 2020. 3. Merchant Services includes purchased portfolios which had revenue of $1,333 and acquisition revenue adjustments of $0 for the three months ended December 31, 2019. 4. Effective July 1, 2020, the Company reassigned a component from the Proprietary Software and Payments segment to the Merchant Services segment to better align the Company's business within its segments. The prior period comparatives have been retroactively adjusted to reflect the Company's current segment presentation. The reconciliation of our revenue to non-GAAP adjusted net revenue is as follows:

4 ($ in thousands) Three months ended December 31, 2020 Three months ended December 31, 2019(1) Merchant Services Proprietary Software and Payments Other Total Merchant Services Proprietary Software and Payments Other Total Income (loss) from operations $ 4,762 $ 728 $ (7,801) $ (2,311) $ 8,427 $ 868 $ (5,198) $ 4,097 Interest expense, net — — 2,029 2,029 — — 2,014 2,014 Provision for income taxes — — (219) (219) — — 149 149 Net income (loss) 4,762 728 (9,611) (4,121) 8,427 868 (7,361) 1,934 Non-GAAP Adjustments: (Benefit from) provision for income taxes — — (219) (219) — — 149 149 Financing-related expenses(2) — — 53 53 — — — — Non-cash change in fair value of contingent consideration(3) 157 1,747 — 1,904 (2,297) 2,451 — 154 Equity-based compensation(4) — — 3,441 3,441 — — 2,124 2,124 Acquisition revenue adjustments(5) 91 1,504 — 1,595 — 513 — 513 Acquisition-related expenses(6) — — 1,010 1,010 — — 262 262 Acquisition intangible amortization(7) 2,486 1,631 — 4,117 2,839 882 — 3,721 Non-cash interest expense(8) — — 1,332 1,332 — — 100 100 Other taxes(9) 7 — 87 94 4 — 50 54 Non-GAAP pro forma adjusted income before taxes 7,503 5,610 (3,907) 9,206 8,973 4,714 (4,676) 9,011 Pro forma taxes at effective tax rate(10) (1,876) (1,403) 977 (2,302) (2,243) (1,179) 1,169 (2,253) Pro forma adjusted net income(11) 5,627 4,207 (2,930) 6,904 6,730 3,535 (3,507) 6,758 Plus: Cash interest expense, net(12) — — 697 697 — — 1,914 1,914 Pro forma taxes at effective tax rate(10) 1,876 1,403 (977) 2,302 2,243 1,179 (1,169) 2,253 Depreciation, non-acquired intangible asset amortization and internally developed software amortization(13) 280 518 177 975 233 532 169 934 Adjusted EBITDA $ 7,783 $ 6,128 $ (3,033) $ 10,878 $ 9,206 $ 5,246 $ (2,593) $ 11,859 See footnotes continued on the next slide. The reconciliation of our income (loss) from operations to non-GAAP pro forma adjusted net income and non-GAAP adjusted EBITDA is as follows: Reconciliation of Non-GAAP Financial Measures

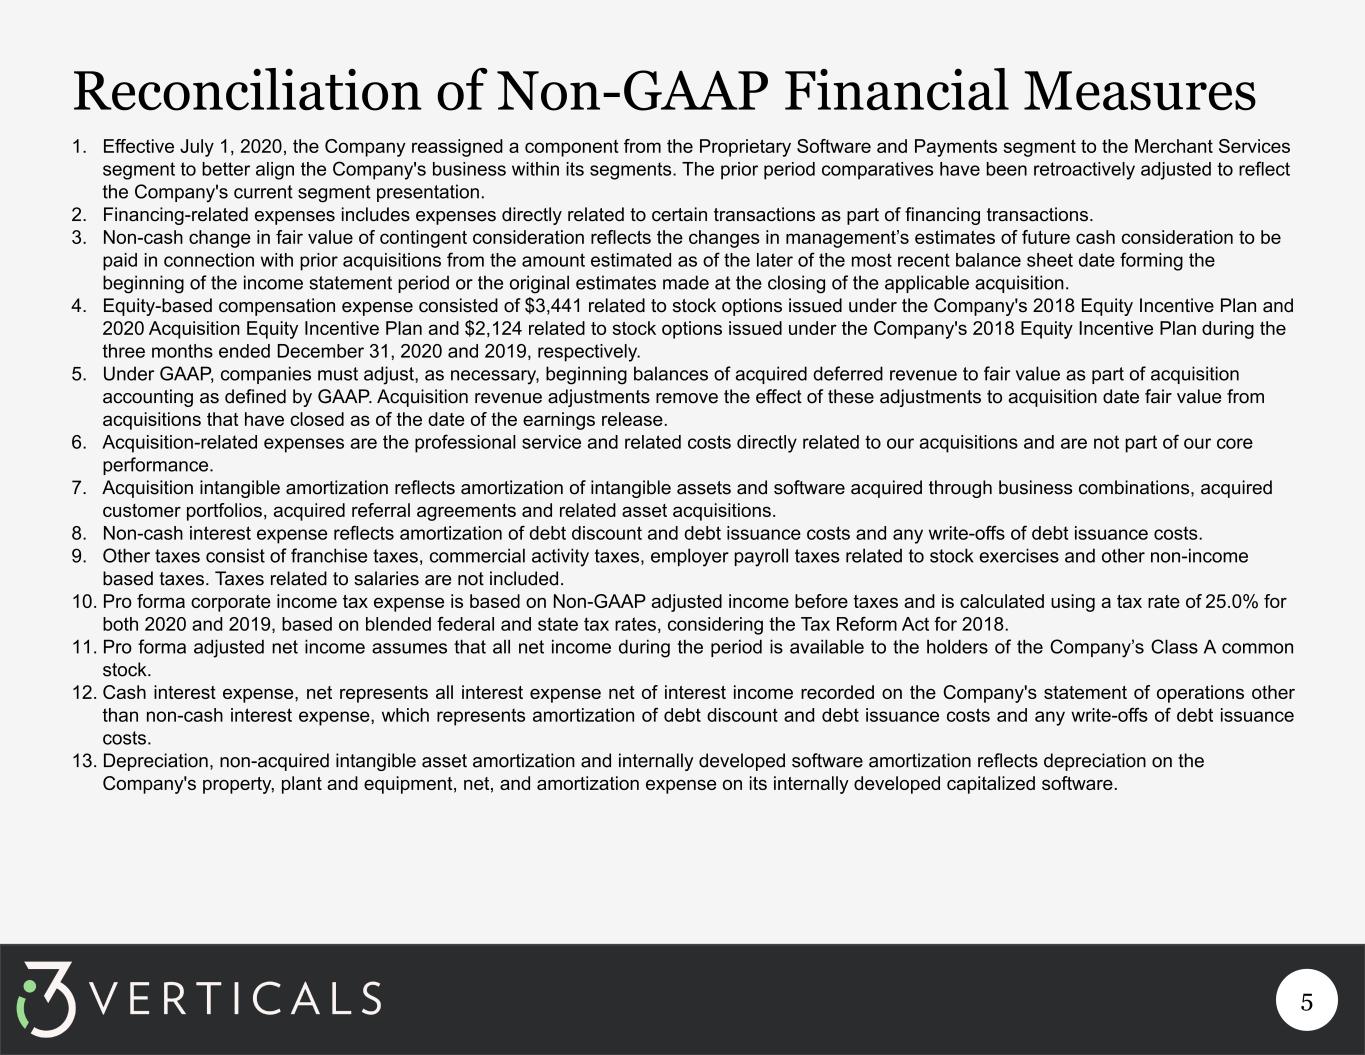
5 Reconciliation of Non-GAAP Financial Measures 1. Effective July 1, 2020, the Company reassigned a component from the Proprietary Software and Payments segment to the Merchant Services segment to better align the Company's business within its segments. The prior period comparatives have been retroactively adjusted to reflect the Company's current segment presentation. 2. Financing-related expenses includes expenses directly related to certain transactions as part of financing transactions. 3. Non-cash change in fair value of contingent consideration reflects the changes in management’s estimates of future cash consideration to be paid in connection with prior acquisitions from the amount estimated as of the later of the most recent balance sheet date forming the beginning of the income statement period or the original estimates made at the closing of the applicable acquisition. 4. Equity-based compensation expense consisted of $3,441 related to stock options issued under the Company's 2018 Equity Incentive Plan and 2020 Acquisition Equity Incentive Plan and $2,124 related to stock options issued under the Company's 2018 Equity Incentive Plan during the three months ended December 31, 2020 and 2019, respectively. 5. Under GAAP, companies must adjust, as necessary, beginning balances of acquired deferred revenue to fair value as part of acquisition accounting as defined by GAAP. Acquisition revenue adjustments remove the effect of these adjustments to acquisition date fair value from acquisitions that have closed as of the date of the earnings release. 6. Acquisition-related expenses are the professional service and related costs directly related to our acquisitions and are not part of our core performance. 7. Acquisition intangible amortization reflects amortization of intangible assets and software acquired through business combinations, acquired customer portfolios, acquired referral agreements and related asset acquisitions. 8. Non-cash interest expense reflects amortization of debt discount and debt issuance costs and any write-offs of debt issuance costs. 9. Other taxes consist of franchise taxes, commercial activity taxes, employer payroll taxes related to stock exercises and other non-income based taxes. Taxes related to salaries are not included. 10. Pro forma corporate income tax expense is based on Non-GAAP adjusted income before taxes and is calculated using a tax rate of 25.0% for both 2020 and 2019, based on blended federal and state tax rates, considering the Tax Reform Act for 2018. 11. Pro forma adjusted net income assumes that all net income during the period is available to the holders of the Company’s Class A common stock. 12. Cash interest expense, net represents all interest expense net of interest income recorded on the Company's statement of operations other than non-cash interest expense, which represents amortization of debt discount and debt issuance costs and any write-offs of debt issuance costs. 13. Depreciation, non-acquired intangible asset amortization and internally developed software amortization reflects depreciation on the Company's property, plant and equipment, net, and amortization expense on its internally developed capitalized software.

6 Reconciliation Between GAAP Debt and Covenant Debt ($ in millions) As of December 31, 2020 Revolving lines of credit to banks under the Senior Secured Credit Facility $ 49.3 Exchangeable Notes 96.4 Debt issuance costs, net (4.3) Total long-term debt, net of issuance costs $ 141.4 Non-GAAP Adjustments: Discount on Exchangeable Notes(1) $ 20.6 Exchangeable Notes 96.4 Exchangeable Notes Face Value $ 117.0 Revolving lines of credit to banks under the Senior Secured Credit Facility $ 49.3 Exchangeable Notes Face Value 117.0 Less: Cash and Cash Equivalents(2) (10.0) Total long-term debt for use in our Total Leverage Ratio $ 156.3 The reconciliation of our GAAP Long-term debt, net of issuance costs and the debt balance used in our Total Leverage Ratio: 1. In accordance with Financial Accounting Standards Board Accounting Standards Codification 470-20, Debt with Conversion and Other Options (“ASC 470-20”), convertible debt that may be entirely or partially settled in cash (such as the notes) is required to be separated into a liability and an equity component, such that interest expense reflects the issuer’s non-convertible debt interest cost. On the issue date, the value of the exchange option of the notes, representing the equity component was recorded as additional paid-in capital within shareholders’ equity and as a discount to the notes, which reduces their initial carrying value. The carrying value of the notes, net of the discount recorded, was accrued up to the principal amount of such notes from the issue date until maturity. ASC 470-20 does not affect the actual amount that the Issuer is required to repay. The amount shown in the table above for the discount reflects the debt discount for the value of the exchange option. 2. Although our cash and cash equivalents balance at December 31, 2020 was $10,879, in accordance with our Senior Secured Credit Facility, only up to $10,000 of unrestricted cash and cash equivalents may be subtracted from the calculation of long-term debt for use in our Total Leverage Ratio.

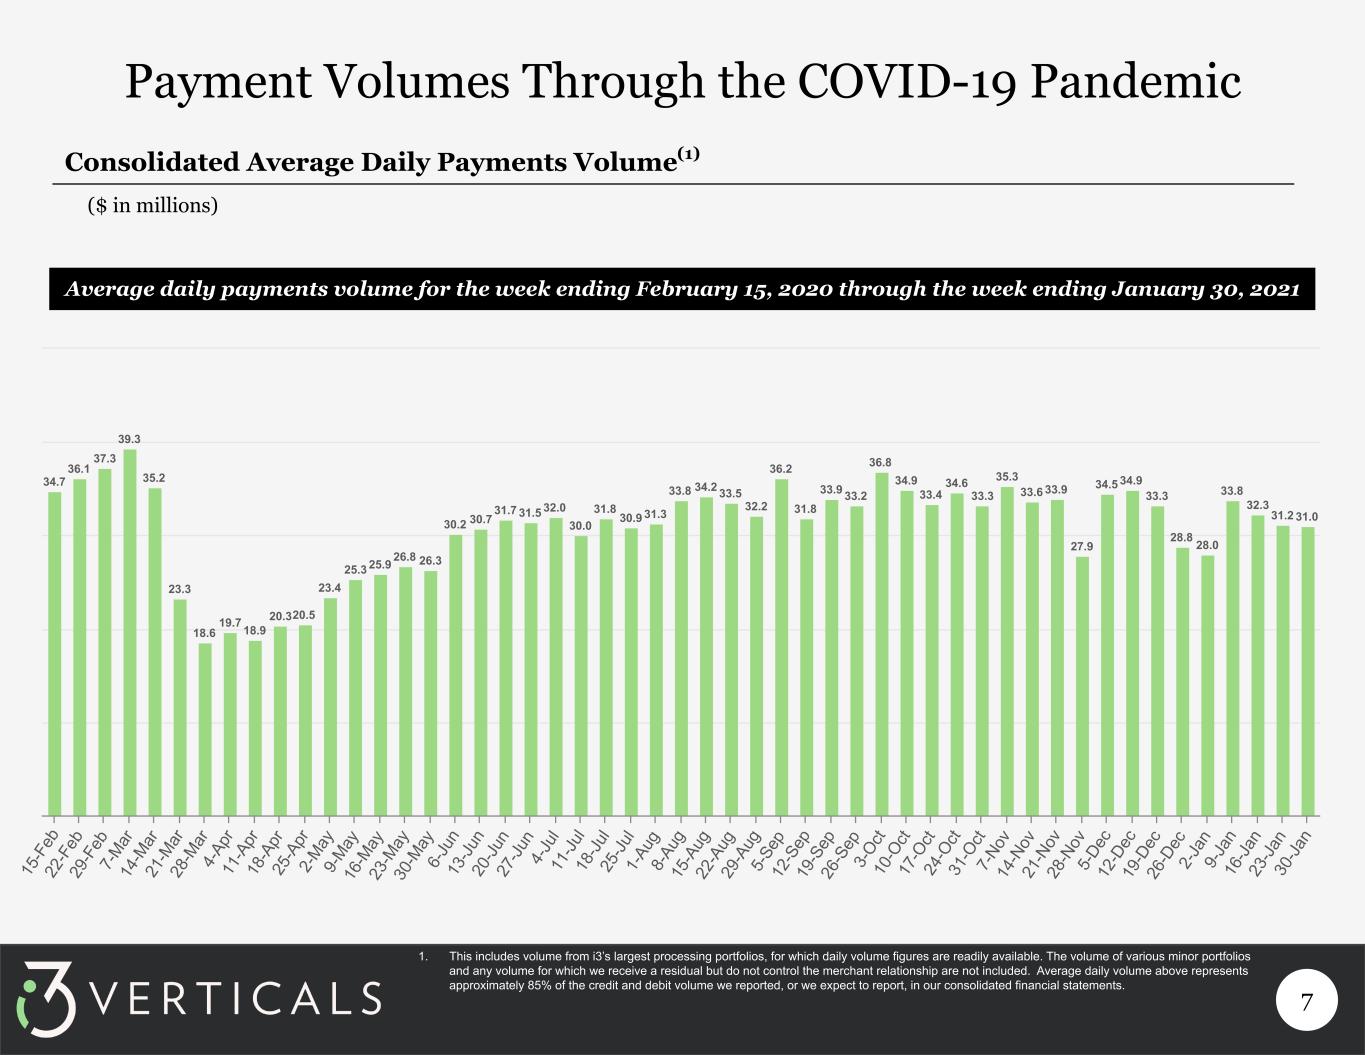
7 Payment Volumes Through the COVID-19 Pandemic ($ in millions) Consolidated Average Daily Payments Volume(1) Average daily payments volume for the week ending February 15, 2020 through the week ending January 30, 2021 34.7 36.1 37.3 39.3 35.2 23.3 18.6 19.7 18.9 20.320.5 23.4 25.3 25.9 26.8 26.3 30.2 30.7 31.7 31.5 32.0 30.0 31.8 30.9 31.3 33.8 34.2 33.5 32.2 36.2 31.8 33.9 33.2 36.8 34.9 33.4 34.6 33.3 35.3 33.6 33.9 27.9 34.5 34.9 33.3 28.8 28.0 33.8 32.3 31.2 31.0 15 -F eb 22 -F eb 29 -F eb 7- M ar 14 -M ar 21 -M ar 28 -M ar 4- Ap r 11 -A pr 18 -A pr 25 -A pr 2- M ay 9- M ay 16 -M ay 23 -M ay 30 -M ay 6- Ju n 13 -J un 20 -J un 27 -J un 4- Ju l 11 -J ul 18 -J ul 25 -J ul 1- Au g 8- Au g 15 -A ug 22 -A ug 29 -A ug 5- Se p 12 -S ep 19 -S ep 26 -S ep 3- O ct 10 -O ct 17 -O ct 24 -O ct 31 -O ct 7- No v 14 -N ov 21 -N ov 28 -N ov 5- De c 12 -D ec 19 -D ec 26 -D ec 2- Ja n 9- Ja n 16 -J an 23 -J an 30 -J an 1. This includes volume from i3’s largest processing portfolios, for which daily volume figures are readily available. The volume of various minor portfolios and any volume for which we receive a residual but do not control the merchant relationship are not included. Average daily volume above represents approximately 85% of the credit and debit volume we reported, or we expect to report, in our consolidated financial statements.

8 Software Revenues Remain Resilient ($ in millions) Software and Related and Services Revenue Trends(1) (Monthly Adjusted Net Revenue)(2) Software and Related Services Monthly Revenue in Q2 2020 through Q1 2021 $3.0 $3.1 $3.4 $2.6 $2.7 $2.8 $2.9 $3.2 $3.9 $3.8 $6.3 $6.2 Jan uar y Feb rua ry Ma rch Ap ril Ma y Jun e Jul y Au gus t Se pte mb er Oc tob er No vem ber De cem ber +138% (24%) 1. Software and related services includes the sale of licenses, subscriptions, installation services, and ongoing support specific to software. 2. Monthly adjusted net revenue is a non-GAAP financial measure. Refer to the following slide for the reconciliation of non-GAAP financial measures.

9 Reconciliation of Non-GAAP Financial Measures The reconciliation of our revenue to adjusted net revenue(1) is as follows: ($ in thousands) Three Months Ended, March 31, 2020 June 30, 2020 September 30, 2020 December 31, 2020 Other revenue $ 12,792 $ 10,926 $ 13,161 $ 17,701 Payments revenue 26,386 20,647 25,111 25,612 Revenue 39,178 31,573 38,272 43,313 Acquisition revenue adjustments(1) 133 24 154 1,595 Adjusted Net Revenue $ 39,311 $ 31,597 $ 38,426 $ 44,908 Non-GAAP Adjusted Net Revenue(2): Software and related services $ 9,552 $ 8,122 $ 10,046 $ 16,270 Other 3,373 2,828 3,269 3,026 Adjusted other revenue(2) 12,925 10,950 13,315 19,296 Payments revenue 26,386 20,647 25,111 25,612 Adjusted Net Revenue $ 39,311 $ 31,597 $ 38,426 $ 44,908 1. Under GAAP, companies must adjust, as necessary, beginning balances of acquired deferred revenue to fair value as part of acquisition accounting as defined by GAAP. Acquisition revenue adjustments remove the effect of these adjustments to the acquisition date fair value of acquisitions that have closed as of the date of the earnings release. 2. For the three months ended March 31, 2020, June 30, 2020, September 30, 2020 and December 31, 2020, software and related services includes the sale of licenses, subscriptions, installation services, and ongoing support specific to software. Payments revenue is defined as volume-based payment processing fees (“discount fees”) and other related fixed transactions or service fees, net of interchange and network fees. Remaining revenue is comprised of other POS-related solutions and services the Company provides to its clients directly and through its processing bank relationships.
