Attached files
| file | filename |
|---|---|
| 8-K - 8-K - Meridian Corp | mrbk-20210208x8k.htm |
Exhibit 99.1
| 4th QTR 2020 Investor Presentation NASDAQ: MRBK ® |

| 2 Meridian Corporation Forward-Looking Statements Meridian Corporation (the “Corporation”) may from time to time make written or oral “forward-looking statements” within the meaning of the “safe harbor” provisions of the Private Securities Litigation Reform Act of 1995. These forward-looking statements include statements with respect to Meridian Corporation’s strategies, goals, beliefs, expectations, estimates, intentions, capital raising efforts, financial condition and results of operations, future performance and business. Statements preceded by, followed by, or that include the words “may,” “could,” “should,” “pro forma,” “looking forward,” “would,” “believe,” “expect,” “anticipate,” “estimate,” “intend,” “plan,” or similar expressions generally indicate a forward-looking statement. These forward-looking statements involve risks and uncertainties that are subject to change based on various important factors (some of which, in whole or in part, are beyond Meridian Corporation’s control). Numerous competitive, economic, regulatory, legal and technological factors, risks and uncertainties including, without limitation: the impact of the current COVID-19 pandemic and government responses thereto, on the U.S. economy, including the markets in which we operate; actions that we and our customers take in response to these factors and the effects such actions have on our operations, products, services and customer relationships; and the risk that the Small Business Administration may not fund some or all Paycheck Protection Program (PPP) loan guaranties, among others, could cause Meridian Corporation’s financial performance to differ materially from the goals, plans, objectives, intentions and expectations expressed in such forward-looking statements. Meridian Corporation cautions that the foregoing factors are not exclusive, and neither such factors nor any such forward- looking statement takes into account the impact of any future events. All forward-looking statements and information set forth herein are based on management’s current beliefs and assumptions as of the date hereof and speak only as of the date they are made. For a more complete discussion of the assumptions, risks and uncertainties related to our business, you are encouraged to review Meridian Corporation’s filings with the Securities and Exchange Commission, including our Annual Report on Form 10- K for the year ended December 31, 2019 and subsequently filed quarterly reports on Form 10-Q and current reports on Form 8-K that update or provide information in addition to the information included in the Form 10-K and Form 10-Q filings, if any. Meridian Corporation does not undertake to update any forward-looking statement whether written or oral, that may be made from time to time by Meridian Corporation or by or on behalf of Meridian Bank. |
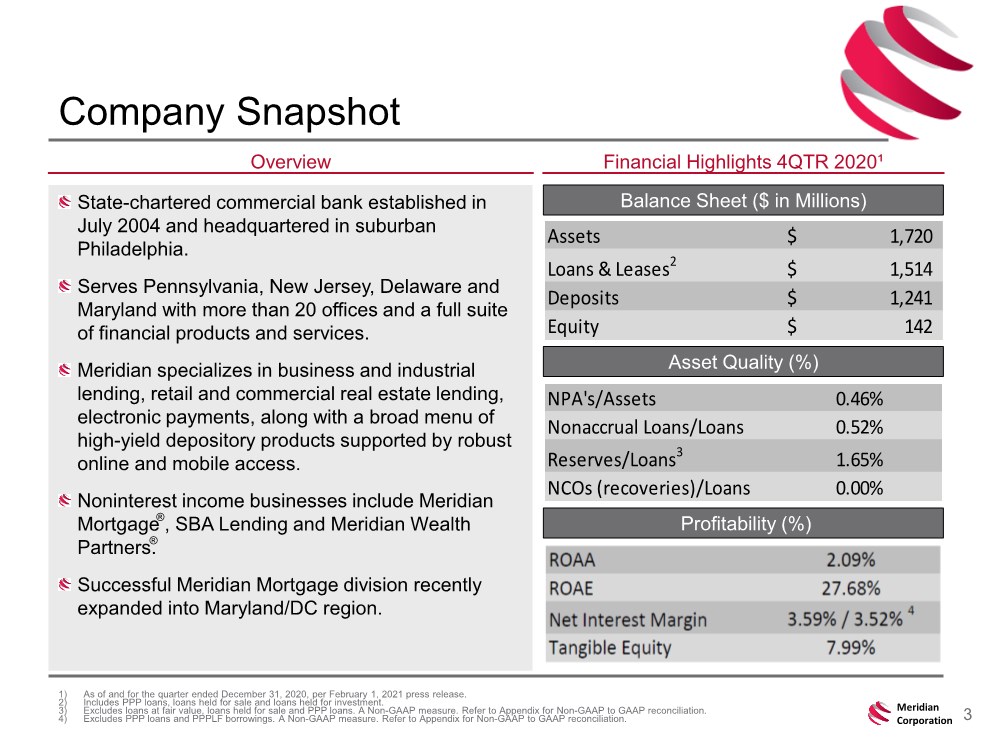
| 3 Meridian Corporation Company Snapshot 1) As of and for the quarter ended December 31, 2020, per February 1, 2021 press release. 2) Includes PPP loans, loans held for sale and loans held for investment. 3) Excludes loans at fair value, loans held for sale and PPP loans. A Non-GAAP measure. Refer to Appendix for Non-GAAP to GAAP reconciliation. 4) Excludes PPP loans and PPPLF borrowings. A Non-GAAP measure. Refer to Appendix for Non-GAAP to GAAP reconciliation. Overview Financial Highlights 4QTR 2020¹ Balance Sheet ($ in Millions) Asset Quality (%) Profitability (%) State-chartered commercial bank established in July 2004 and headquartered in suburban Philadelphia. Serves Pennsylvania, New Jersey, Delaware and Maryland with more than 20 offices and a full suite of financial products and services. Meridian specializes in business and industrial lending, retail and commercial real estate lending, electronic payments, along with a broad menu of high-yield depository products supported by robust online and mobile access. Noninterest income businesses include Meridian Mortgage , SBA Lending and Meridian Wealth Partners. Successful Meridian Mortgage division recently expanded into Maryland/DC region. ® ® Assets 1,720 $ Loans & Leases2 1,514 $ Deposits 1,241 $ Equity 142 $ NPA's/Assets 0.46% Nonaccrual Loans/Loans 0.52% Reserves/Loans3 1.65% NCOs (recoveries)/Loans 0.00% |
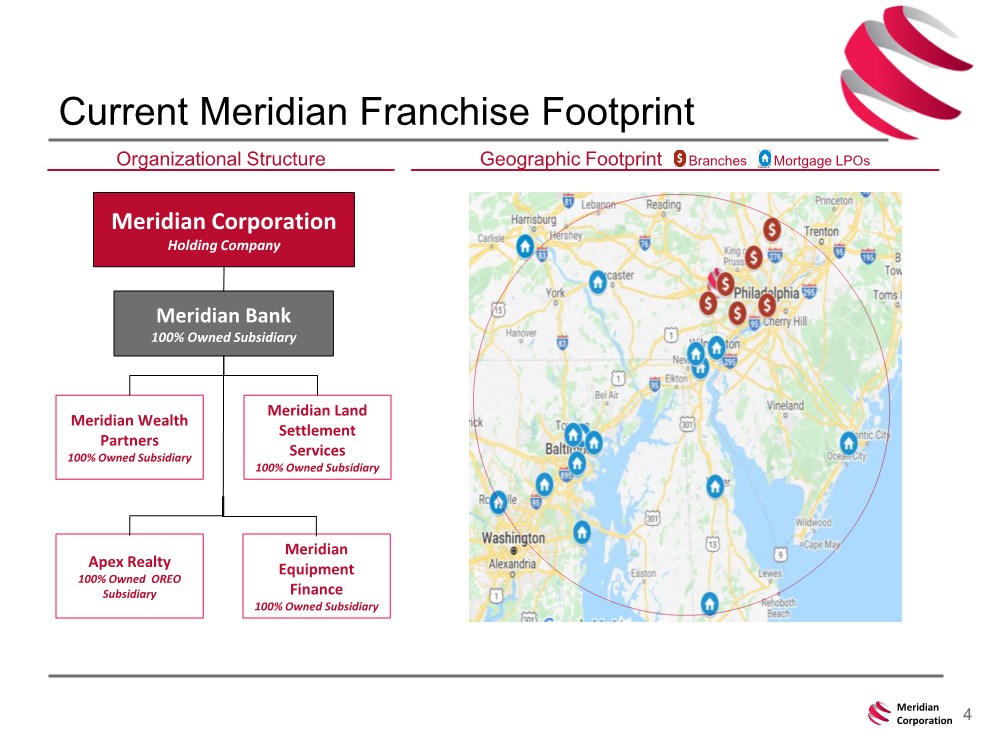
| 4 Meridian Corporation Current Meridian Franchise Footprint Geographic Footprint Branches Mortgage LPOs Meridian Corporation Holding Company Meridian Bank 100% Owned Subsidiary Organizational Structure Meridian Wealth Partners 100% Owned Subsidiary Apex Realty 100% Owned OREO Subsidiary Meridian Land Settlement Services 100% Owned Subsidiary Meridian Equipment Finance 100% Owned Subsidiary |
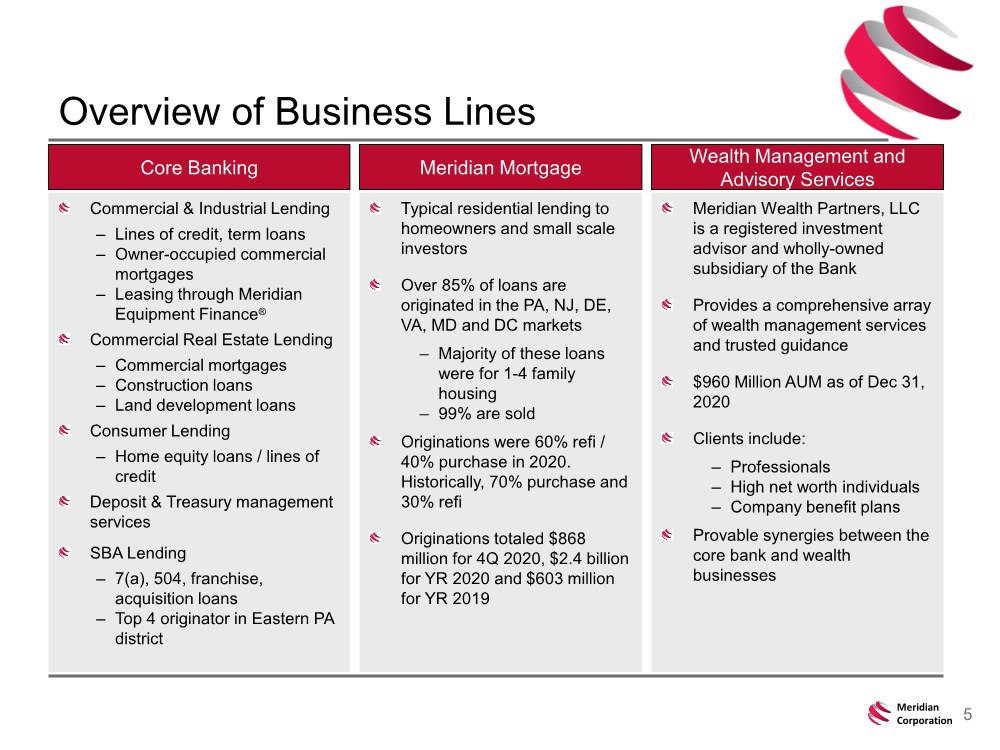
| 5 Meridian Corporation Overview of Business Lines Commercial & Industrial Lending – Lines of credit, term loans – Owner-occupied commercial mortgages – Leasing through Meridian Equipment Finance® Commercial Real Estate Lending – Commercial mortgages – Construction loans – Land development loans Consumer Lending – Home equity loans / lines of credit Deposit & Treasury management services SBA Lending – 7(a), 504, franchise, acquisition loans – Top 4 originator in Eastern PA district Core Banking Meridian Mortgage Wealth Management and Advisory Services Typical residential lending to homeowners and small scale investors Over 85% of loans are originated in the PA, NJ, DE, VA, MD and DC markets – Majority of these loans were for 1-4 family housing – 99% are sold Originations were 60% refi / 40% purchase in 2020. Historically, 70% purchase and 30% refi Originations totaled $868 million for 4Q 2020, $2.4 billion for YR 2020 and $603 million for YR 2019 Meridian Wealth Partners, LLC is a registered investment advisor and wholly-owned subsidiary of the Bank Provides a comprehensive array of wealth management services and trusted guidance $960 Million AUM as of Dec 31, 2020 Clients include: – Professionals – High net worth individuals – Company benefit plans Provable synergies between the core bank and wealth businesses |
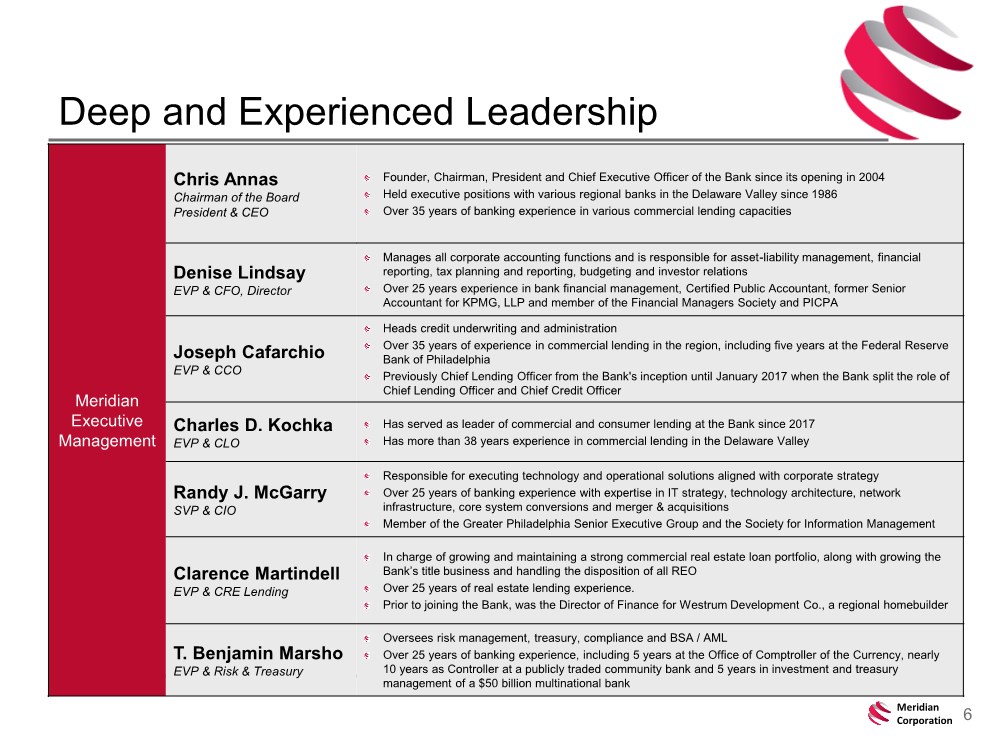
| 6 Meridian Corporation Deep and Experienced Leadership Meridian Executive Management Chris Annas Chairman of the Board President & CEO Founder, Chairman, President and Chief Executive Officer of the Bank since its opening in 2004 Held executive positions with various regional banks in the Delaware Valley since 1986 Over 35 years of banking experience in various commercial lending capacities Denise Lindsay EVP & CFO, Director Manages all corporate accounting functions and is responsible for asset-liability management, financial reporting, tax planning and reporting, budgeting and investor relations Over 25 years experience in bank financial management, Certified Public Accountant, former Senior Accountant for KPMG, LLP and member of the Financial Managers Society and PICPA Joseph Cafarchio EVP & CCO Heads credit underwriting and administration Over 35 years of experience in commercial lending in the region, including five years at the Federal Reserve Bank of Philadelphia Previously Chief Lending Officer from the Bank's inception until January 2017 when the Bank split the role of Chief Lending Officer and Chief Credit Officer Charles D. Kochka EVP & CLO Has served as leader of commercial and consumer lending at the Bank since 2017 Has more than 38 years experience in commercial lending in the Delaware Valley Randy J. McGarry SVP & CIO Responsible for executing technology and operational solutions aligned with corporate strategy Over 25 years of banking experience with expertise in IT strategy, technology architecture, network infrastructure, core system conversions and merger & acquisitions Member of the Greater Philadelphia Senior Executive Group and the Society for Information Management Clarence Martindell EVP & CRE Lending In charge of growing and maintaining a strong commercial real estate loan portfolio, along with growing the Bank’s title business and handling the disposition of all REO Over 25 years of real estate lending experience. Prior to joining the Bank, was the Director of Finance for Westrum Development Co., a regional homebuilder T. Benjamin Marsho EVP & Risk & Treasury Oversees risk management, treasury, compliance and BSA / AML Over 25 years of banking experience, including 5 years at the Office of Comptroller of the Currency, nearly 10 years as Controller at a publicly traded community bank and 5 years in investment and treasury management of a $50 billion multinational bank |
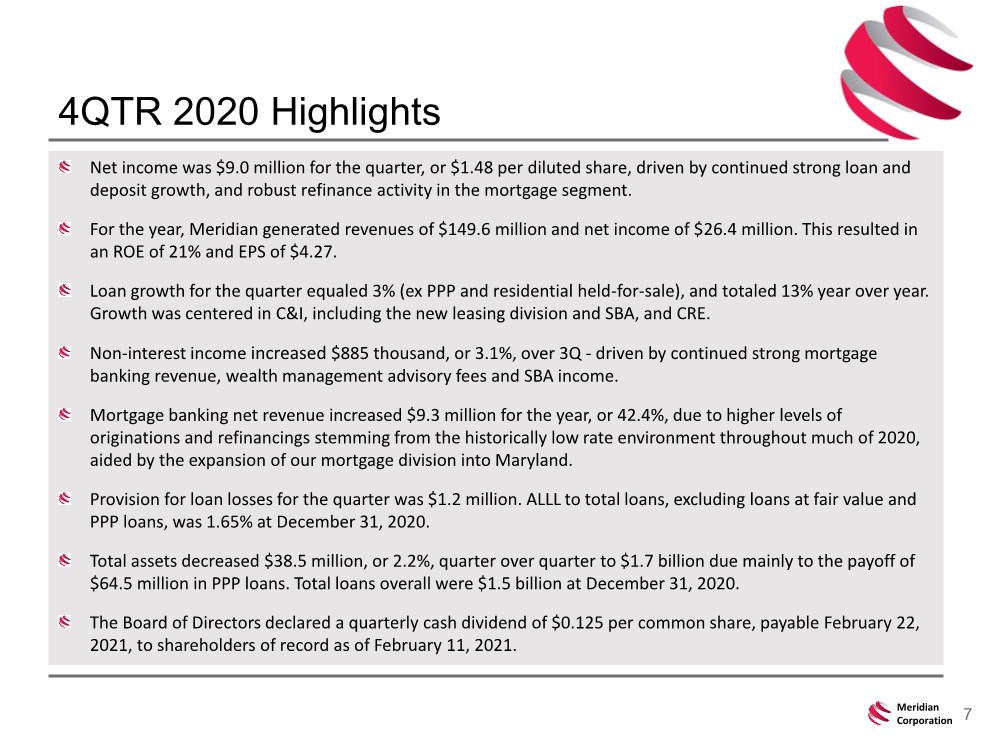
| 7 Meridian Corporation 4QTR 2020 Highlights Net income was $9.0 million for the quarter, or $1.48 per diluted share, driven by continued strong loan and deposit growth, and robust refinance activity in the mortgage segment. For the year, Meridian generated revenues of $149.6 million and net income of $26.4 million. This resulted in an ROE of 21% and EPS of $4.27. Loan growth for the quarter equaled 3% (ex PPP and residential held-for-sale), and totaled 13% year over year. Growth was centered in C&I, including the new leasing division and SBA, and CRE. Non-interest income increased $885 thousand, or 3.1%, over 3Q - driven by continued strong mortgage banking revenue, wealth management advisory fees and SBA income. Mortgage banking net revenue increased $9.3 million for the year, or 42.4%, due to higher levels of originations and refinancings stemming from the historically low rate environment throughout much of 2020, aided by the expansion of our mortgage division into Maryland. Provision for loan losses for the quarter was $1.2 million. ALLL to total loans, excluding loans at fair value and PPP loans, was 1.65% at December 31, 2020. Total assets decreased $38.5 million, or 2.2%, quarter over quarter to $1.7 billion due mainly to the payoff of $64.5 million in PPP loans. Total loans overall were $1.5 billion at December 31, 2020. The Board of Directors declared a quarterly cash dividend of $0.125 per common share, payable February 22, 2021, to shareholders of record as of February 11, 2021. |
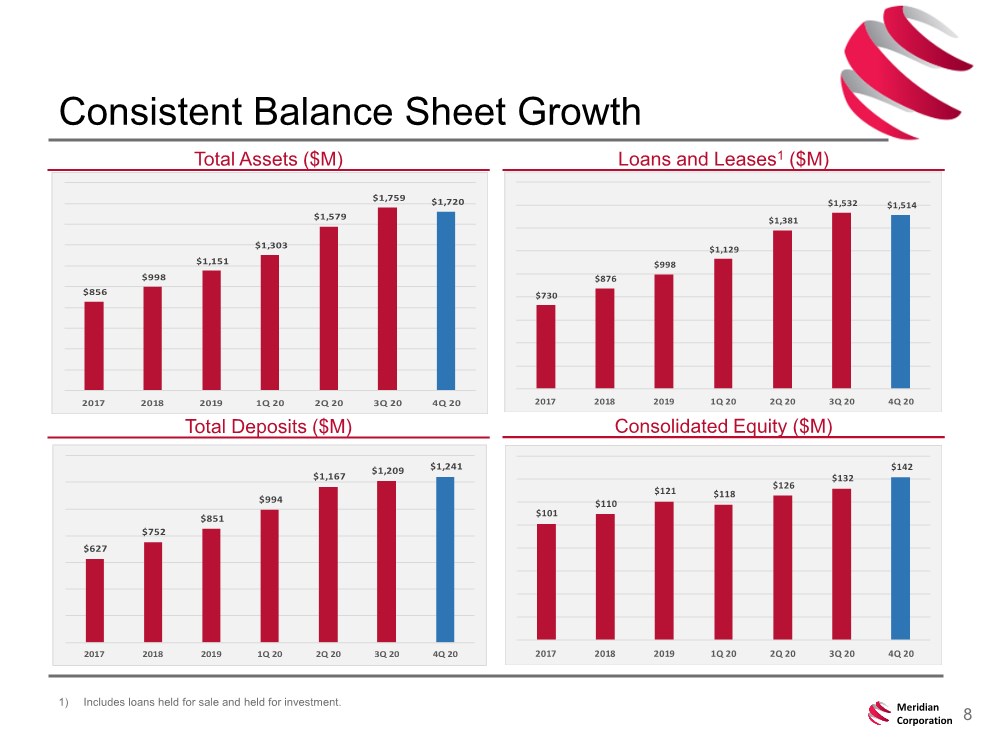
| 8 Meridian Corporation Consistent Balance Sheet Growth 1) Includes loans held for sale and held for investment. Total Assets ($M) Loans and Leases1 ($M) Total Deposits ($M) Consolidated Equity ($M) $856 $998 $1,151 $1,303 $1,579 $1,759 $1,720 2017 2018 2019 1Q 20 2Q 20 3Q 20 4Q 20 $730 $876 $998 $1,129 $1,381 $1,532 $1,514 2017 2018 2019 1Q 20 2Q 20 3Q 20 4Q 20 $627 $752 $851 $994 $1,167 $1,209 $1,241 2017 2018 2019 1Q 20 2Q 20 3Q 20 4Q 20 $101 $110 $121 $118 $126 $132 $142 2017 2018 2019 1Q 20 2Q 20 3Q 20 4Q 20 |
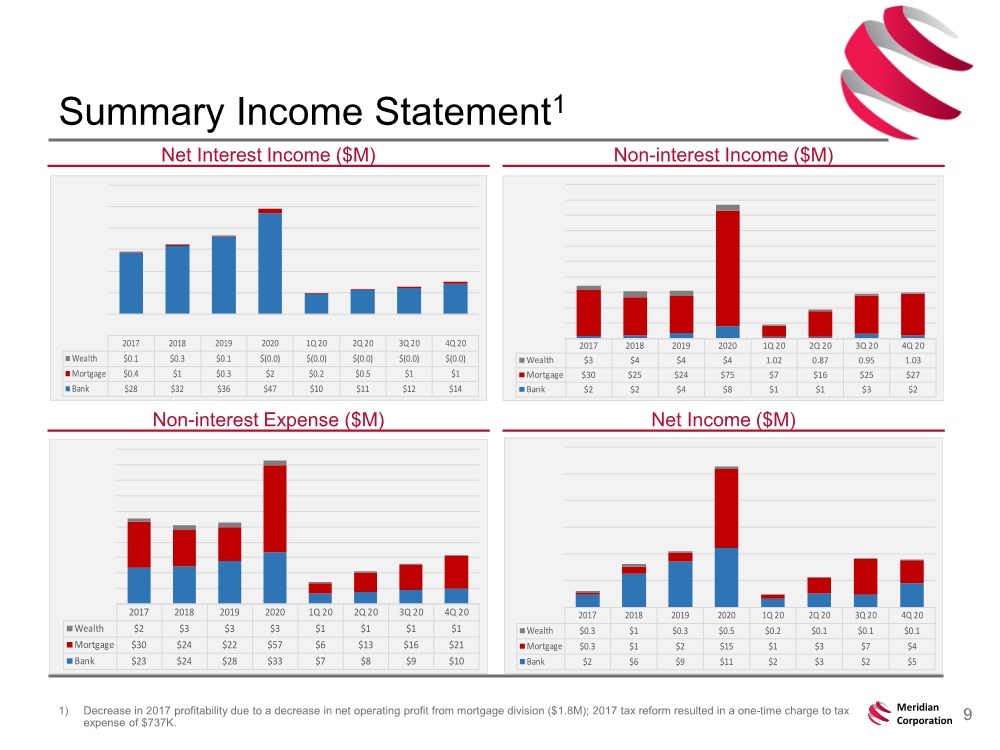
| 9 Meridian Corporation Summary Income Statement1 1) Decrease in 2017 profitability due to a decrease in net operating profit from mortgage division ($1.8M); 2017 tax reform resulted in a one-time charge to tax expense of $737K. Net Interest Income ($M) Non-interest Income ($M) Non-interest Expense ($M) Net Income ($M) 2017 2018 2019 2020 1Q 20 2Q 20 3Q 20 4Q 20 Wealth $2 $3 $3 $3 $1 $1 $1 $1 Mortgage $30 $24 $22 $57 $6 $13 $16 $21 Bank $23 $24 $28 $33 $7 $8 $9 $10 2017 2018 2019 2020 1Q 20 2Q 20 3Q 20 4Q 20 Wealth $0.3 $1 $0.3 $0.5 $0.2 $0.1 $0.1 $0.1 Mortgage $0.3 $1 $2 $15 $1 $3 $7 $4 Bank $2 $6 $9 $11 $2 $3 $2 $5 2017 2018 2019 2020 1Q 20 2Q 20 3Q 20 4Q 20 Wealth $3 $4 $4 $4 1.02 0.87 0.95 1.03 Mortgage $30 $25 $24 $75 $7 $16 $25 $27 Bank $2 $2 $4 $8 $1 $1 $3 $2 2017 2018 2019 2020 1Q 20 2Q 20 3Q 20 4Q 20 Wealth $0.1 $0.3 $0.1 $(0.0) $(0.0) $(0.0) $(0.0) $(0.0) Mortgage $0.4 $1 $0.3 $2 $0.2 $0.5 $1 $1 Bank $28 $32 $36 $47 $10 $11 $12 $14 |
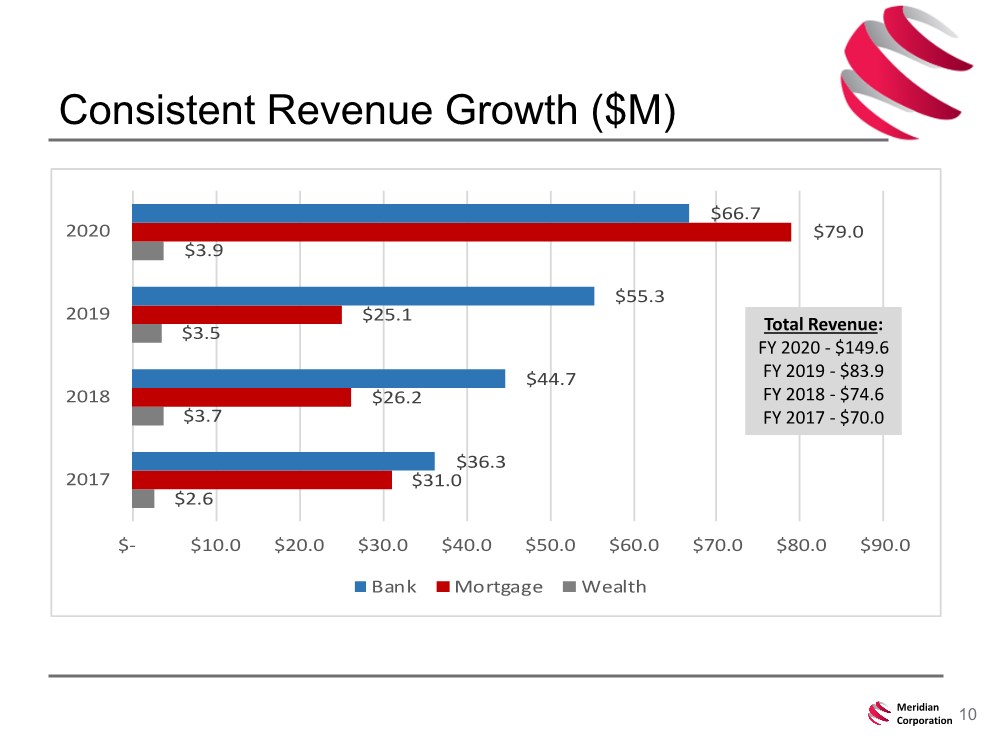
| 10 Meridian Corporation Consistent Revenue Growth ($M) $2.6 $3.7 $3.5 $3.9 $31.0 $26.2 $25.1 $79.0 $36.3 $44.7 $55.3 $66.7 $- $10.0 $20.0 $30.0 $40.0 $50.0 $60.0 $70.0 $80.0 $90.0 2017 2018 2019 2020 Bank Mortgage Wealth Total Revenue: FY 2020 - $149.6 FY 2019 - $83.9 FY 2018 - $74.6 FY 2017 - $70.0 |
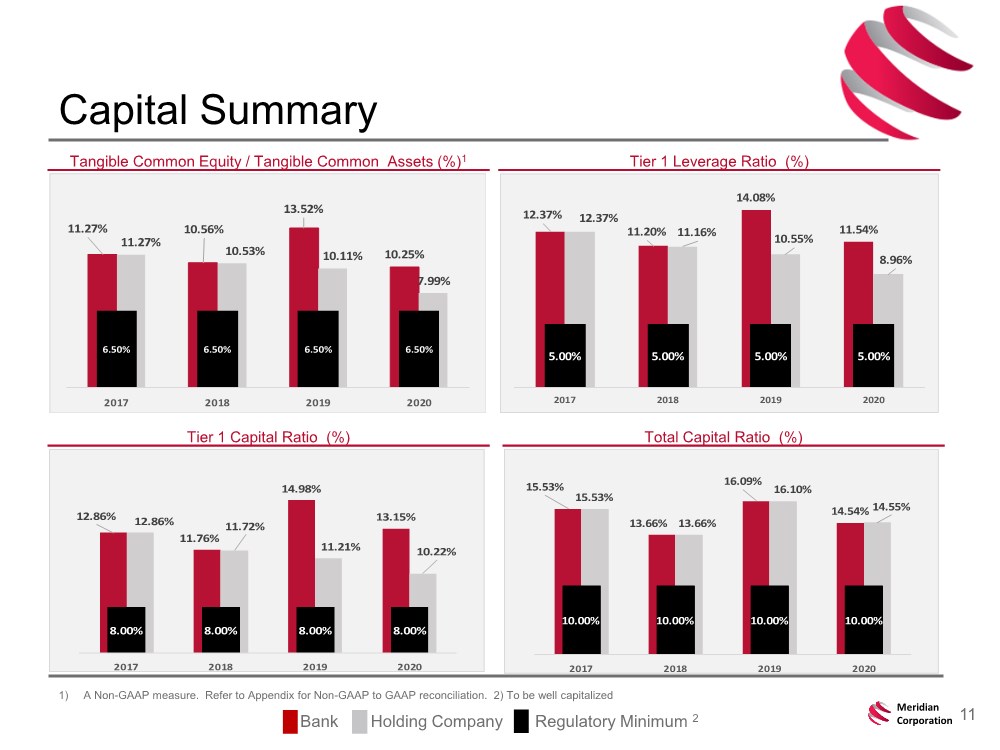
| 11 Meridian Corporation Capital Summary Bank Holding Company Regulatory Minimum 2 Tangible Common Equity / Tangible Common Assets (%)1 Tier 1 Leverage Ratio (%) Tier 1 Capital Ratio (%) Total Capital Ratio (%) 1) A Non-GAAP measure. Refer to Appendix for Non-GAAP to GAAP reconciliation. 2) To be well capitalized 11.27% 10.56% 13.52% 10.25% 11.27% 10.53% 10.11% 7.99% 6.50% 6.50% 6.50% 6.50% 2017 2018 2019 2020 12.86% 11.76% 14.98% 13.15% 12.86% 11.72% 11.21% 10.22% 8.00% 8.00% 8.00% 8.00% 2017 2018 2019 2020 15.53% 13.66% 16.09% 14.54% 15.53% 13.66% 16.10% 14.55% 10.00% 10.00% 10.00% 10.00% 2017 2018 2019 2020 12.37% 11.20% 14.08% 11.54% 12.37% 11.16% 10.55% 8.96% 5.00% 5.00% 5.00% 5.00% 2017 2018 2019 2020 |
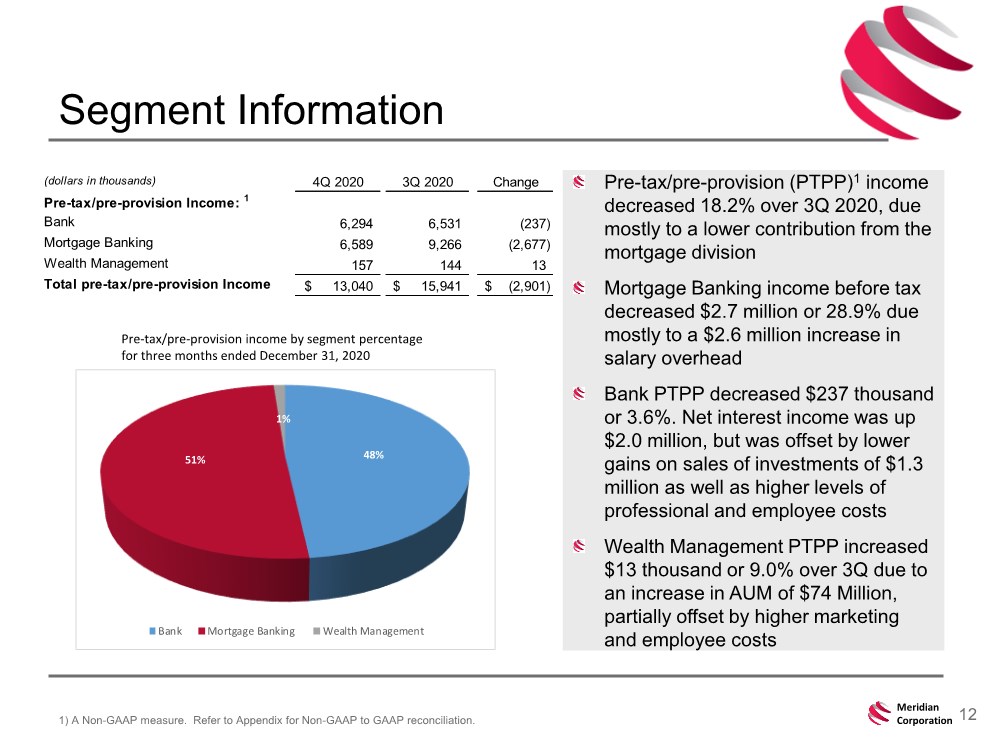
| 12 Meridian Corporation Segment Information 1) A Non-GAAP measure. Refer to Appendix for Non-GAAP to GAAP reconciliation. Pre-tax/pre-provision income by segment percentage for three months ended December 31, 2020 Pre-tax/pre-provision (PTPP)1 income decreased 18.2% over 3Q 2020, due mostly to a lower contribution from the mortgage division Mortgage Banking income before tax decreased $2.7 million or 28.9% due mostly to a $2.6 million increase in salary overhead Bank PTPP decreased $237 thousand or 3.6%. Net interest income was up $2.0 million, but was offset by lower gains on sales of investments of $1.3 million as well as higher levels of professional and employee costs Wealth Management PTPP increased $13 thousand or 9.0% over 3Q due to an increase in AUM of $74 Million, partially offset by higher marketing and employee costs 48% 51% 1% Bank Mortgage Banking Wealth Management (dollars in thousands) 4Q 2020 3Q 2020 Change Pre-tax/pre-provision Income: 1 Bank 6,294 6,531 (237) Mortgage Banking 6,589 9,266 (2,677) Wealth Management 157 144 13 Total pre-tax/pre-provision Income 13,040 $ 15,941 $ (2,901) $ |
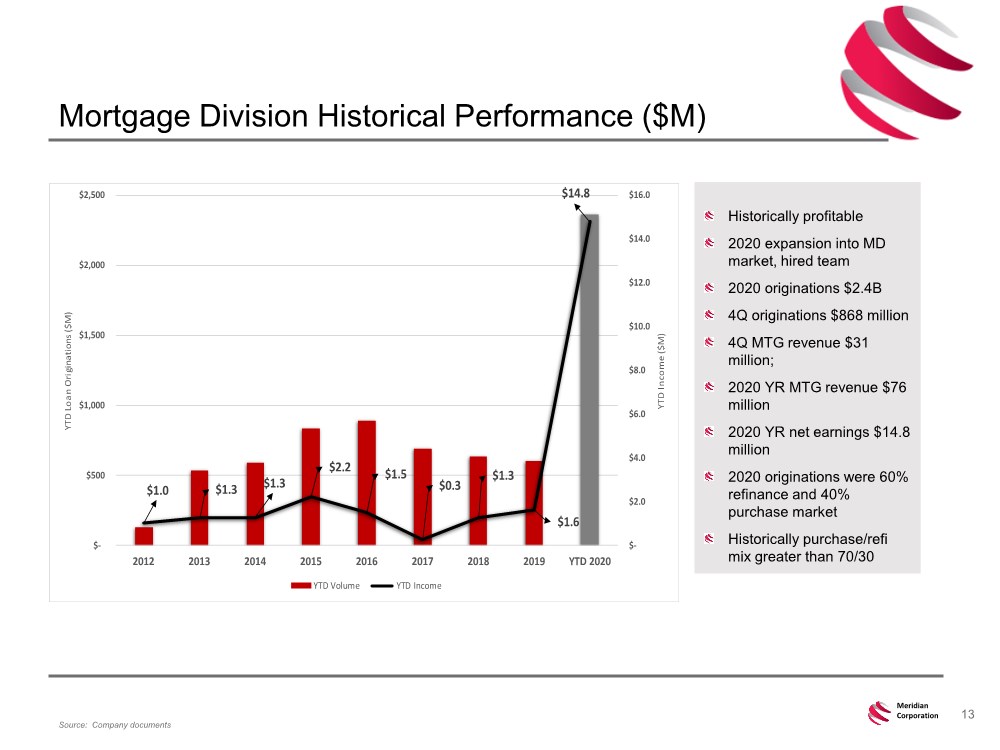
| 13 Meridian Corporation Mortgage Division Historical Performance ($M) Source: Company documents Historically profitable 2020 expansion into MD market, hired team 2020 originations $2.4B 4Q originations $868 million 4Q MTG revenue $31 million; 2020 YR MTG revenue $76 million 2020 YR net earnings $14.8 million 2020 originations were 60% refinance and 40% purchase market Historically purchase/refi mix greater than 70/30 $1.0 $1.3 $1.3 $2.2 $1.5 $0.3 $1.3 $1.6 $14.8 $- $2.0 $4.0 $6.0 $8.0 $10.0 $12.0 $14.0 $16.0 $- $500 $1,000 $1,500 $2,000 $2,500 2012 2013 2014 2015 2016 2017 2018 2019 YTD 2020 YTD Income ($M) YTD Loan Originations ($M) YTD Volume YTD Income |
| 14 Meridian Corporation $1.5 Billion total gross loans and leases as of December 31, 20201 – $198.6 M net PPP loans CRE concentration of 172% of capital as of December 31, 2020 Average yield on loans of 4.56% for 4Q 2020 Average yield on loans, excluding PPP loans, of 4.59% for 4Q 2020 Balanced Loan Portfolio December 31, 2020 1) Total loans held for investment and held for sale, net of fees and costs. Source: Company documents Total Loans: $1.5 Billion 39% 9% 27% 16% 4% 5% CRE C&D C&I PPP Residential HELOC/consumer |

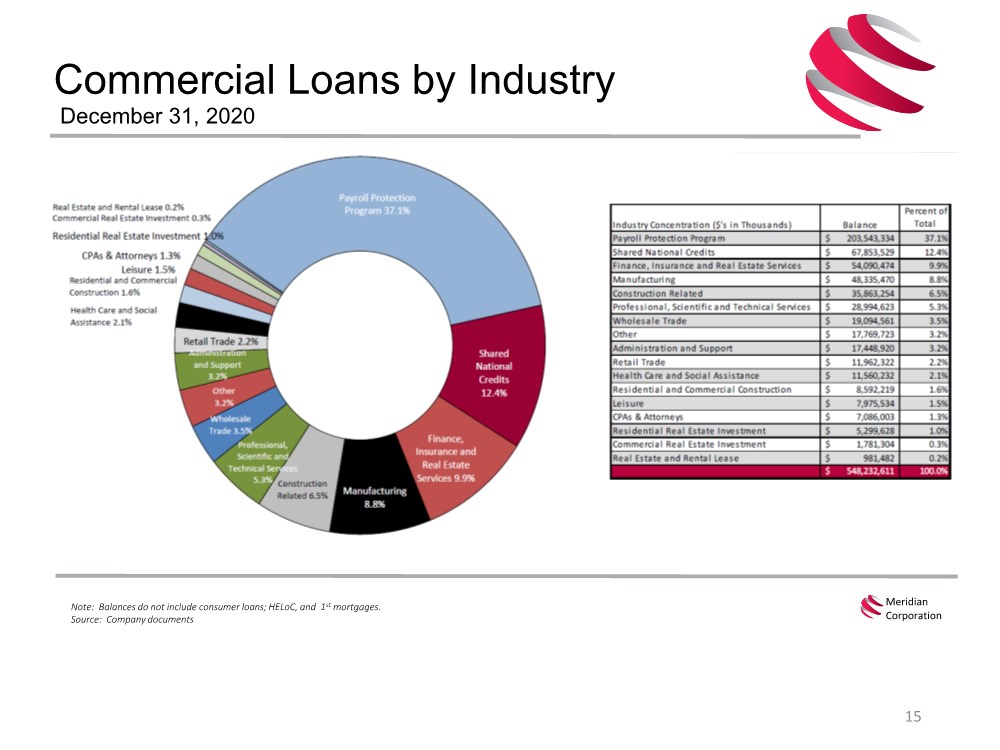
| Commercial Loans by Industry December 31, 2020 Meridian Corporation Note: Balances do not include consumer loans; HELoC, and 1st mortgages. Source: Company documents 15 |
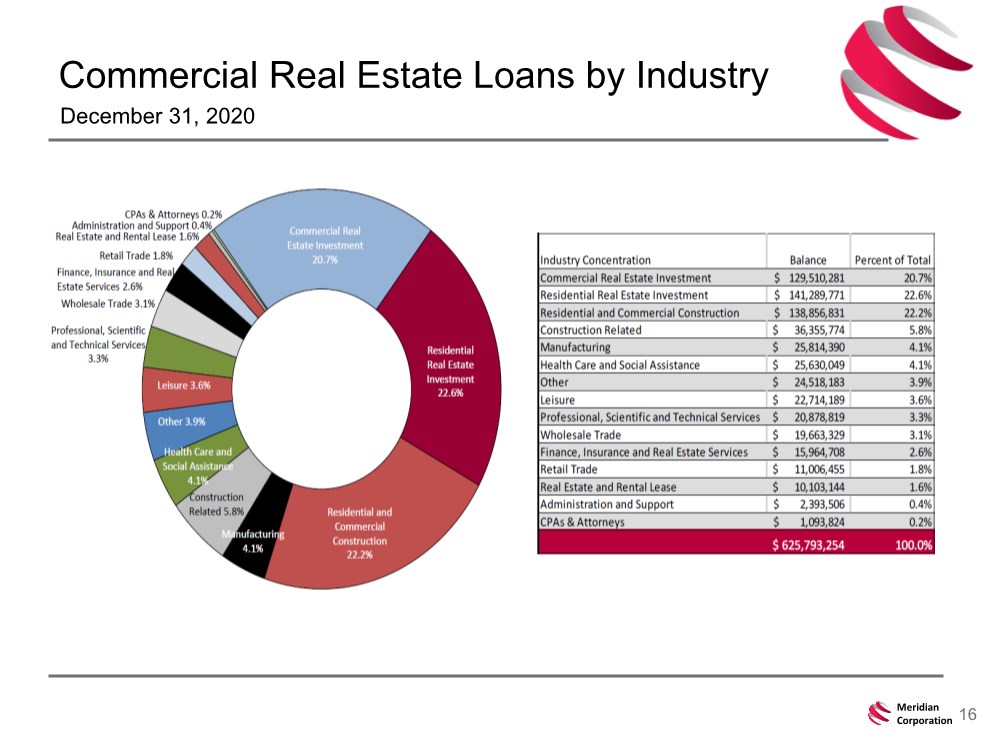
| 16 Meridian Corporation Commercial Real Estate Loans by Industry December 31, 2020 |
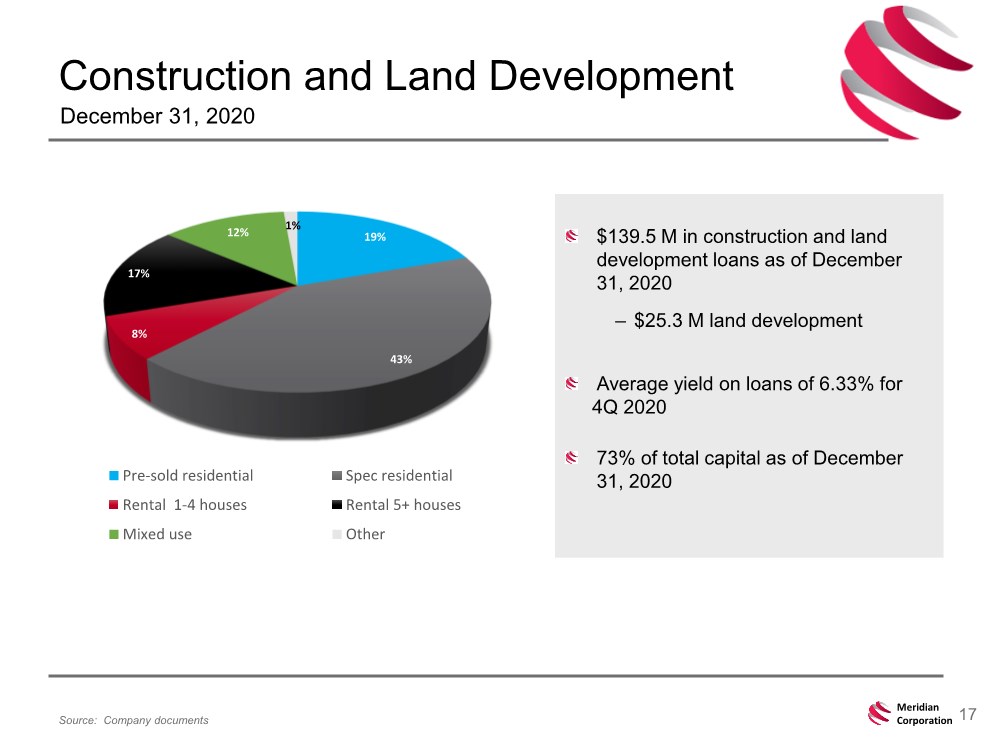
| 17 Meridian Corporation Construction and Land Development Source: Company documents $139.5 M in construction and land development loans as of December 31, 2020 – $25.3 M land development Average yield on loans of 6.33% for 4Q 2020 73% of total capital as of December 31, 2020 19% 43% 8% 17% 12% 1% Pre-sold residential Spec residential Rental 1-4 houses Rental 5+ houses Mixed use Other December 31, 2020 |
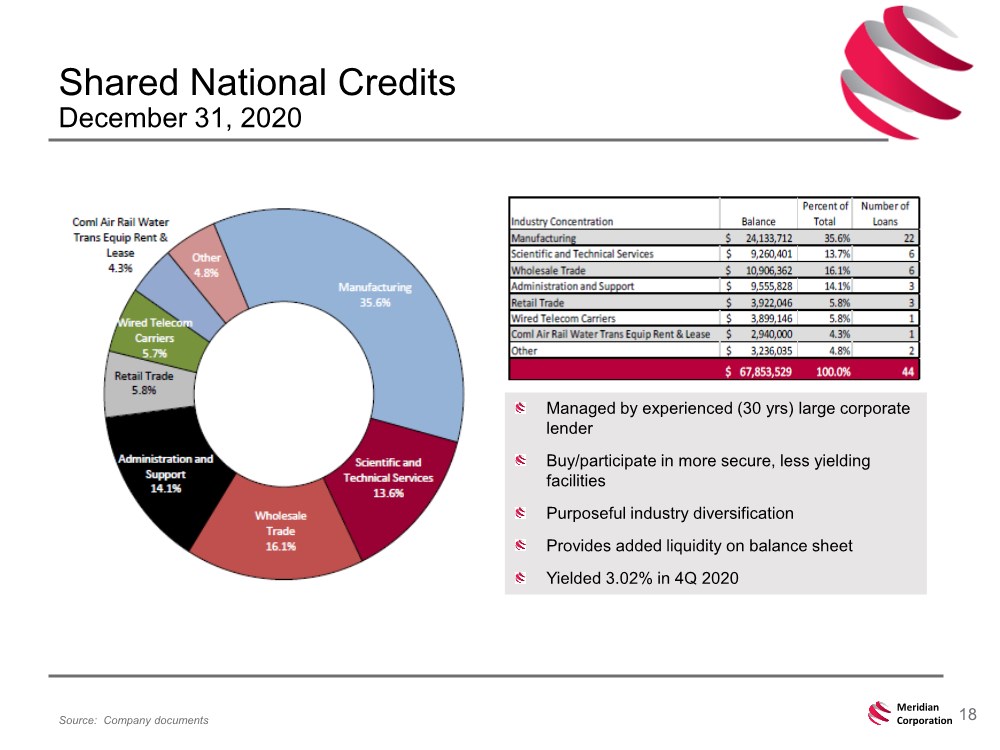
| 18 Meridian Corporation Shared National Credits December 31, 2020 Source: Company documents Managed by experienced (30 yrs) large corporate lender Buy/participate in more secure, less yielding facilities Purposeful industry diversification Provides added liquidity on balance sheet Yielded 3.02% in 4Q 2020 |
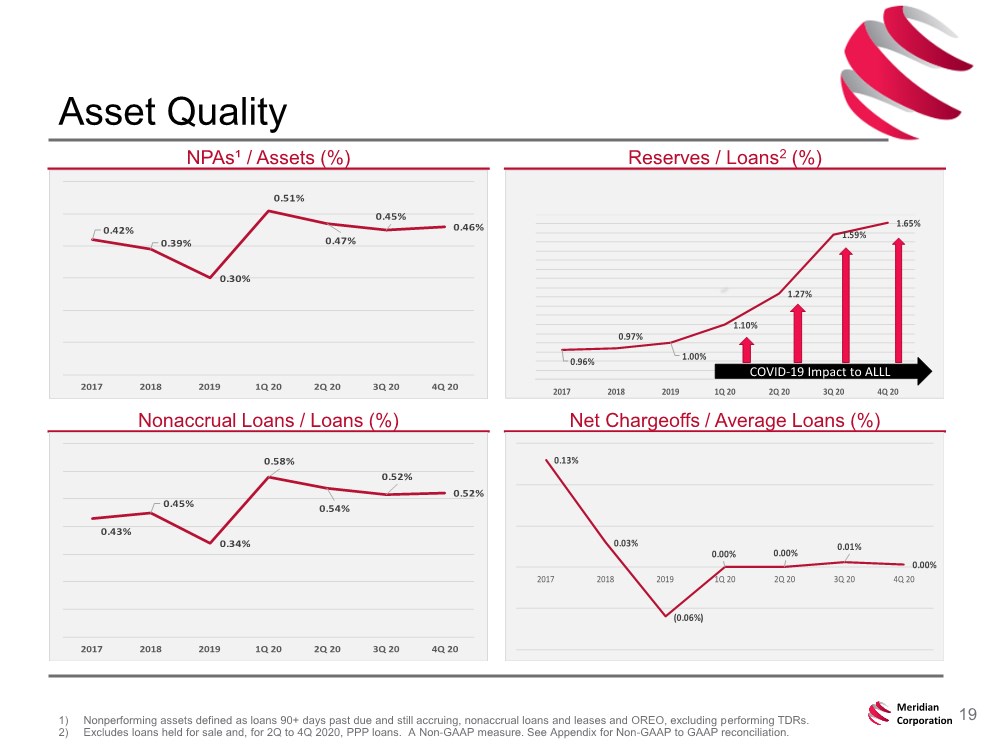
| 19 Meridian Corporation Asset Quality 1) Nonperforming assets defined as loans 90+ days past due and still accruing, nonaccrual loans and leases and OREO, excluding performing TDRs. 2) Excludes loans held for sale and, for 2Q to 4Q 2020, PPP loans. A Non-GAAP measure. See Appendix for Non-GAAP to GAAP reconciliation. NPAs¹ / Assets (%) Reserves / Loans2 (%) Nonaccrual Loans / Loans (%) Net Chargeoffs / Average Loans (%) 0.42% 0.39% 0.30% 0.51% 0.47% 0.45% 0.46% 2017 2018 2019 1Q 20 2Q 20 3Q 20 4Q 20 0.96% 0.97% 1.00% 1.10% 1.27% 1.59% 1.65% 2017 2018 2019 1Q 20 2Q 20 3Q 20 4Q 20 0.43% 0.45% 0.34% 0.58% 0.54% 0.52% 0.52% 2017 2018 2019 1Q 20 2Q 20 3Q 20 4Q 20 0.13% 0.03% (0.06%) 0.00% 0.00% 0.01% 0.00% 2017 2018 2019 1Q 20 2Q 20 3Q 20 4Q 20 COVID-19 Impact to ALLL |
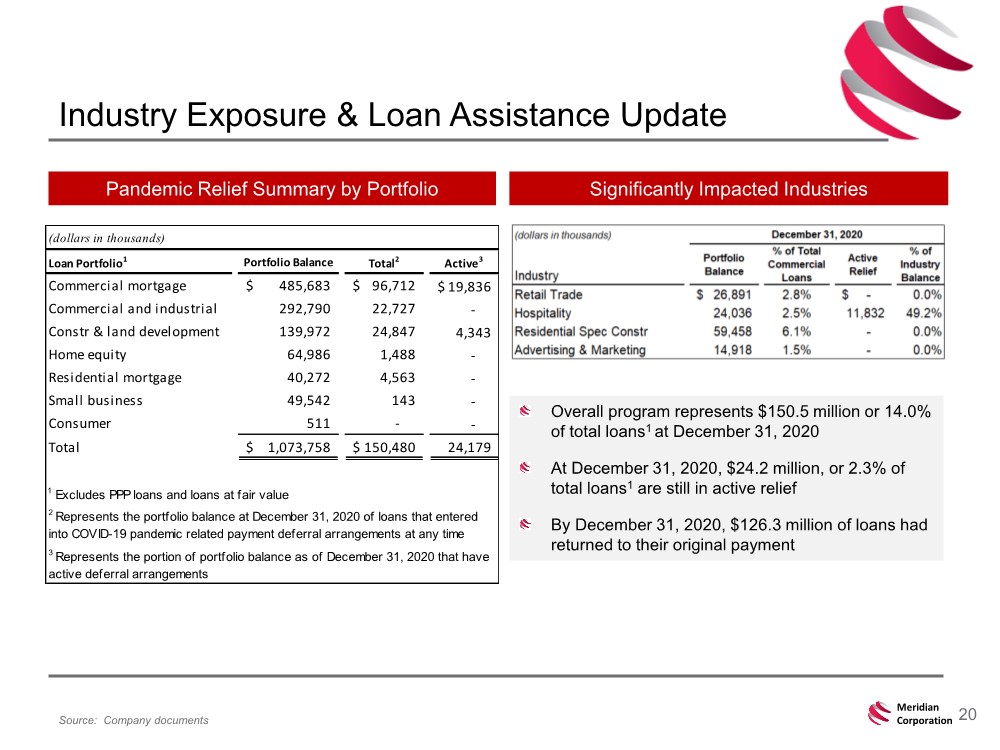
| 20 Meridian Corporation Industry Exposure & Loan Assistance Update Source: Company documents Overall program represents $150.5 million or 14.0% of total loans1 at December 31, 2020 At December 31, 2020, $24.2 million, or 2.3% of total loans1 are still in active relief By December 31, 2020, $126.3 million of loans had returned to their original payment Pandemic Relief Summary by Portfolio Significantly Impacted Industries (dollars in thousands) Loan Portfolio1 Portfolio Balance Total2 Active3 Commercial mortgage 485,683 $ 96,712 $ 19,836 $ Commercial and industrial 292,790 22,727 - Constr & land development 139,972 24,847 4,343 Home equity 64,986 1,488 - Residential mortgage 40,272 4,563 - Small business 49,542 143 - Consumer 511 - - Total 1,073,758 $ 150,480 $ 24,179 1 Excludes PPP loans and loans at fair value 2 Represents the portfolio balance at December 31, 2020 of loans that entered into COVID-19 pandemic related payment deferral arrangements at any time 3 Represents the portion of portfolio balance as of December 31, 2020 that have active deferral arrangements |
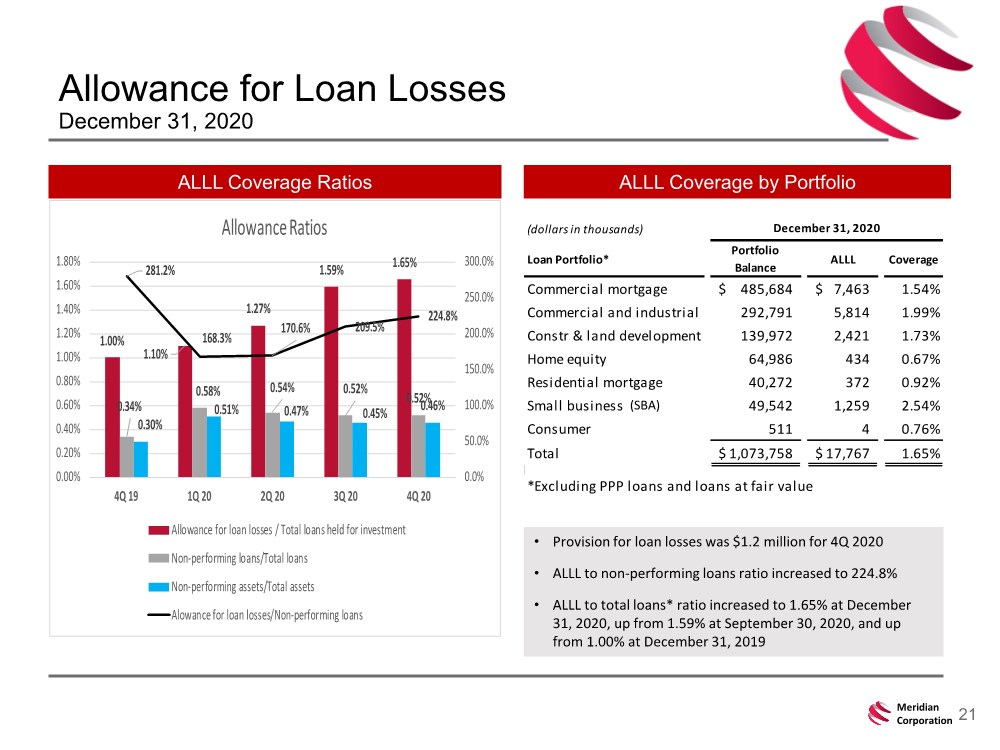
| 21 Meridian Corporation Allowance for Loan Losses December 31, 2020 ALLL Coverage by Portfolio ALLL Coverage Ratios •Provision for loan losses was $1.2 million for 4Q 2020 • ALLL to non-performing loans ratio increased to 224.8% • ALLL to total loans* ratio increased to 1.65% at December 31, 2020, up from 1.59% at September 30, 2020, and up from 1.00% at December 31, 2019 1.00% 1.10% 1.27% 1.59% 1.65% 0.34% 0.58% 0.54% 0.52% 0.52% 0.30% 0.51% 0.47% 0.45% 0.46% 281.2% 168.3% 170.6% 209.5% 224.8% 0.0% 50.0% 100.0% 150.0% 200.0% 250.0% 300.0% 0.00% 0.20% 0.40% 0.60% 0.80% 1.00% 1.20% 1.40% 1.60% 1.80% 4Q 19 1Q 20 2Q 20 3Q 20 4Q 20 Allowance Ratios Allowance for loan losses / Total loans held for investment Non-performing loans/Total loans Non-performing assets/Total assets Alowance for loan losses/Non-performing loans (dollars in thousands) Loan Portfolio* Portfolio Balance ALLL Coverage Commercial mortgage 485,684 $ 7,463 $ 1.54% Commercial and industrial 292,791 5,814 1.99% Constr & land development 139,972 2,421 1.73% Home equity 64,986 434 0.67% Residential mortgage 40,272 372 0.92% Small business 49,542 1,259 2.54% Consumer 511 4 0.76% Total 1,073,758 $ 17,767 $ 1.65% *Excluding PPP loans and loans at fair value December 31, 2020 (SBA) |
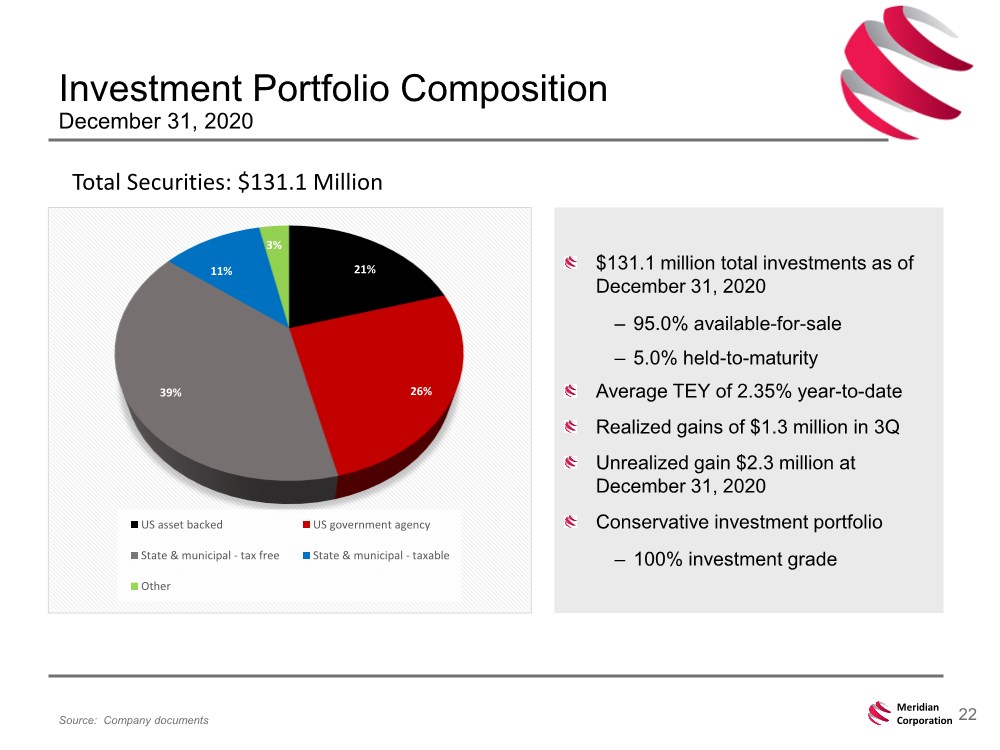
| 22 Meridian Corporation Investment Portfolio Composition December 31, 2020 Source: Company documents $131.1 million total investments as of December 31, 2020 – 95.0% available-for-sale – 5.0% held-to-maturity Average TEY of 2.35% year-to-date Realized gains of $1.3 million in 3Q Unrealized gain $2.3 million at December 31, 2020 Conservative investment portfolio – 100% investment grade Total Securities: $131.1 Million 21% 26% 39% 11% 3% US asset backed US government agency State & municipal - tax free State & municipal - taxable Other |
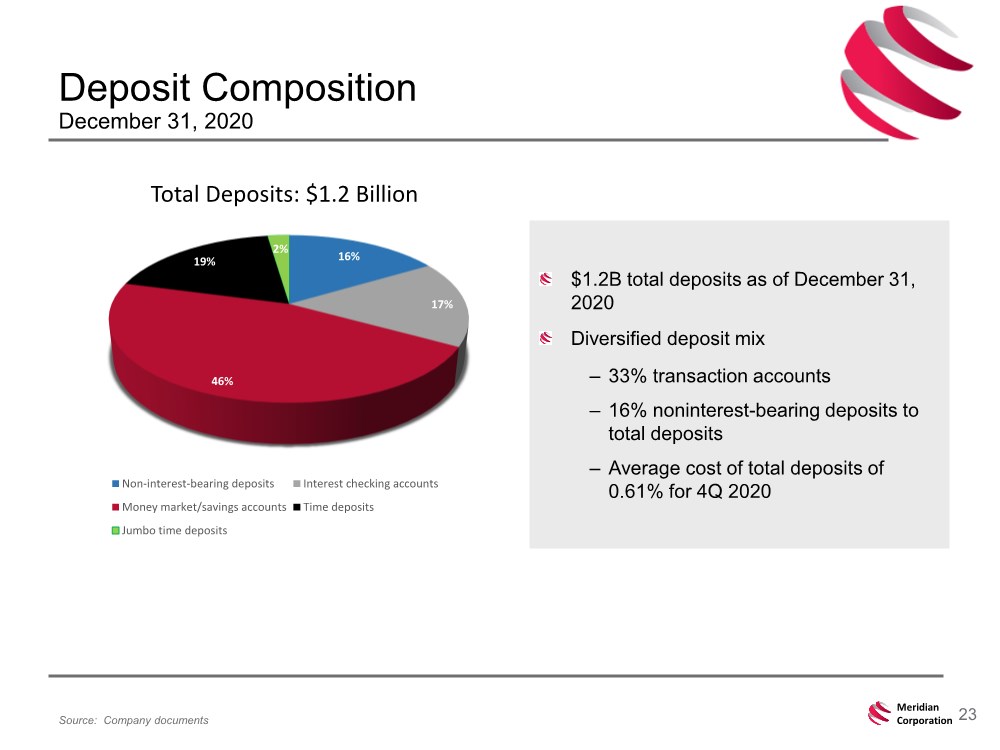
| 23 Meridian Corporation $1.2B total deposits as of December 31, 2020 Diversified deposit mix – 33% transaction accounts – 16% noninterest-bearing deposits to total deposits – Average cost of total deposits of 0.61% for 4Q 2020 Deposit Composition December 31, 2020 Source: Company documents Total Deposits: $1.2 Billion 16% 17% 46% 19% 2% Non-interest-bearing deposits Interest checking accounts Money market/savings accounts Time deposits Jumbo time deposits |
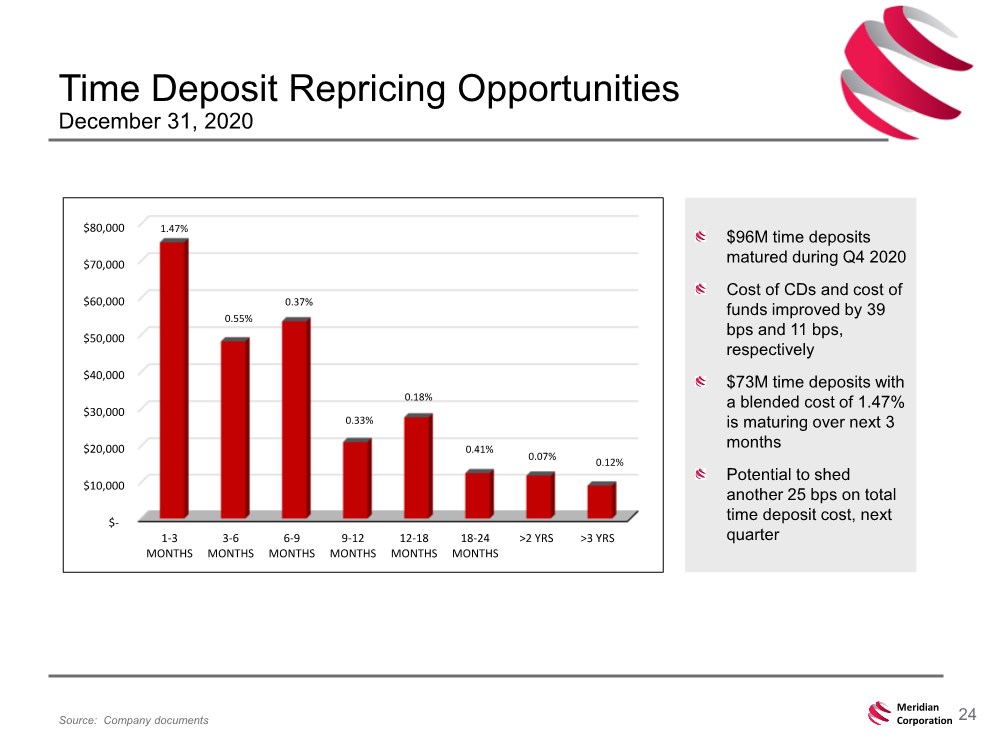
| 24 Meridian Corporation Time Deposit Repricing Opportunities December 31, 2020 Source: Company documents $96M time deposits matured during Q4 2020 Cost of CDs and cost of funds improved by 39 bps and 11 bps, respectively $73M time deposits with a blended cost of 1.47% is maturing over next 3 months Potential to shed another 25 bps on total time deposit cost, next quarter $- $10,000 $20,000 $30,000 $40,000 $50,000 $60,000 $70,000 $80,000 1-3 MONTHS 3-6 MONTHS 6-9 MONTHS 9-12 MONTHS 12-18 MONTHS 18-24 MONTHS >2 YRS >3 YRS 0.55% 0.37% 0.33% 0.18% 0.41% 0.07% 0.12% 1.47% |
| 25 Meridian Corporation Appendix |
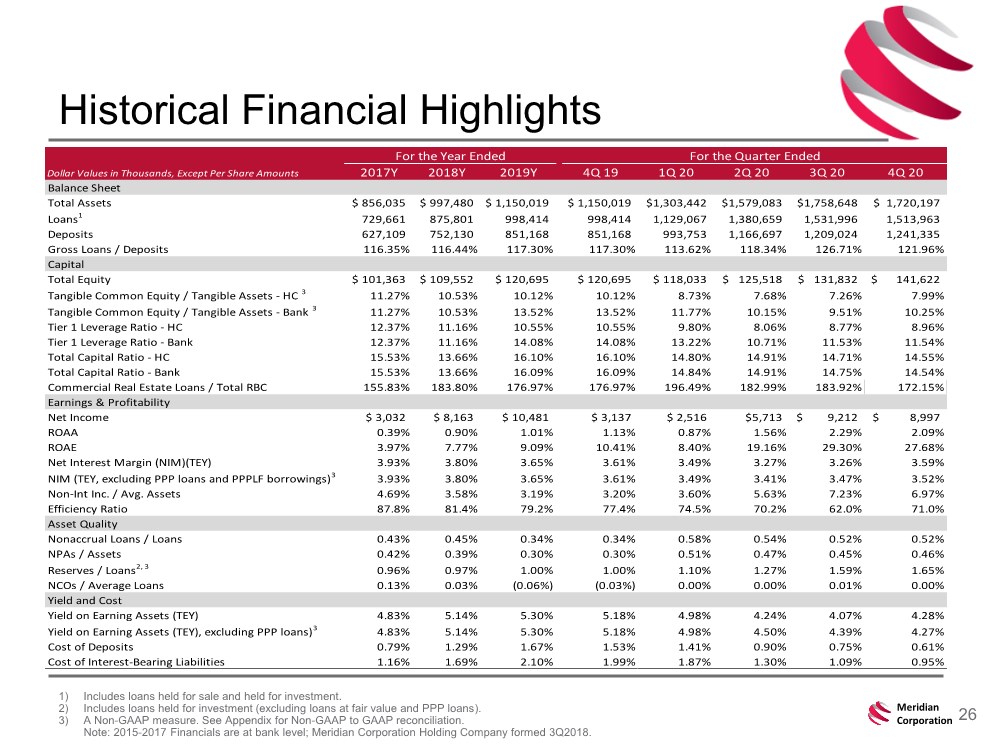
| 26 Meridian Corporation Historical Financial Highlights 1) Includes loans held for sale and held for investment. 2) Includes loans held for investment (excluding loans at fair value and PPP loans). 3) A Non-GAAP measure. See Appendix for Non-GAAP to GAAP reconciliation. Note: 2015-2017 Financials are at bank level; Meridian Corporation Holding Company formed 3Q2018. Dollar Values in Thousands, Except Per Share Amounts 2017Y 2018Y 2019Y 4Q 19 1Q 20 2Q 20 3Q 20 4Q 20 Balance Sheet Total Assets $ 856,035 $ 997,480 $ 1,150,019 $ 1,150,019 1,303,442 $ 1,579,083 $ 1,758,648 $ 1,720,197 $ Loans1 729,661 875,801 998,414 998,414 1,129,067 1,380,659 1,531,996 1,513,963 Deposits 627,109 752,130 851,168 851,168 993,753 1,166,697 1,209,024 1,241,335 Gross Loans / Deposits 116.35% 116.44% 117.30% 117.30% 113.62% 118.34% 126.71% 121.96% Capital Total Equity $ 101,363 $ 109,552 $ 120,695 $ 120,695 $ 118,033 125,518 $ 131,832 $ 141,622 $ Tangible Common Equity / Tangible Assets - HC 3 11.27% 10.53% 10.12% 10.12% 8.73% 7.68% 7.26% 7.99% Tangible Common Equity / Tangible Assets - Bank 3 11.27% 10.53% 13.52% 13.52% 11.77% 10.15% 9.51% 10.25% Tier 1 Leverage Ratio - HC 12.37% 11.16% 10.55% 10.55% 9.80% 8.06% 8.77% 8.96% Tier 1 Leverage Ratio - Bank 12.37% 11.16% 14.08% 14.08% 13.22% 10.71% 11.53% 11.54% Total Capital Ratio - HC 15.53% 13.66% 16.10% 16.10% 14.80% 14.91% 14.71% 14.55% Total Capital Ratio - Bank 15.53% 13.66% 16.09% 16.09% 14.84% 14.91% 14.75% 14.54% Commercial Real Estate Loans / Total RBC 155.83% 183.80% 176.97% 176.97% 196.49% 182.99% 183.92% 172.15% Earnings & Profitability Net Income $ 3,032 $ 8,163 $ 10,481 $ 3,137 $ 2,516 $5,713 9,212 $ 8,997 $ ROAA 0.39% 0.90% 1.01% 1.13% 0.87% 1.56% 2.29% 2.09% ROAE 3.97% 7.77% 9.09% 10.41% 8.40% 19.16% 29.30% 27.68% Net Interest Margin (NIM)(TEY) 3.93% 3.80% 3.65% 3.61% 3.49% 3.27% 3.26% 3.59% NIM (TEY, excluding PPP loans and PPPLF borrowings)3 3.93% 3.80% 3.65% 3.61% 3.49% 3.41% 3.47% 3.52% Non-Int Inc. / Avg. Assets 4.69% 3.58% 3.19% 3.20% 3.60% 5.63% 7.23% 6.97% Efficiency Ratio 87.8% 81.4% 79.2% 77.4% 74.5% 70.2% 62.0% 71.0% Asset Quality Nonaccrual Loans / Loans 0.43% 0.45% 0.34% 0.34% 0.58% 0.54% 0.52% 0.52% NPAs / Assets 0.42% 0.39% 0.30% 0.30% 0.51% 0.47% 0.45% 0.46% Reserves / Loans2, 3 0.96% 0.97% 1.00% 1.00% 1.10% 1.27% 1.59% 1.65% NCOs / Average Loans 0.13% 0.03% (0.06%) (0.03%) 0.00% 0.00% 0.01% 0.00% Yield and Cost Yield on Earning Assets (TEY) 4.83% 5.14% 5.30% 5.18% 4.98% 4.24% 4.07% 4.28% Yield on Earning Assets (TEY), excluding PPP loans)3 4.83% 5.14% 5.30% 5.18% 4.98% 4.50% 4.39% 4.27% Cost of Deposits 0.79% 1.29% 1.67% 1.53% 1.41% 0.90% 0.75% 0.61% Cost of Interest-Bearing Liabilities 1.16% 1.69% 2.10% 1.99% 1.87% 1.30% 1.09% 0.95% For the Quarter Ended For the Year Ended |
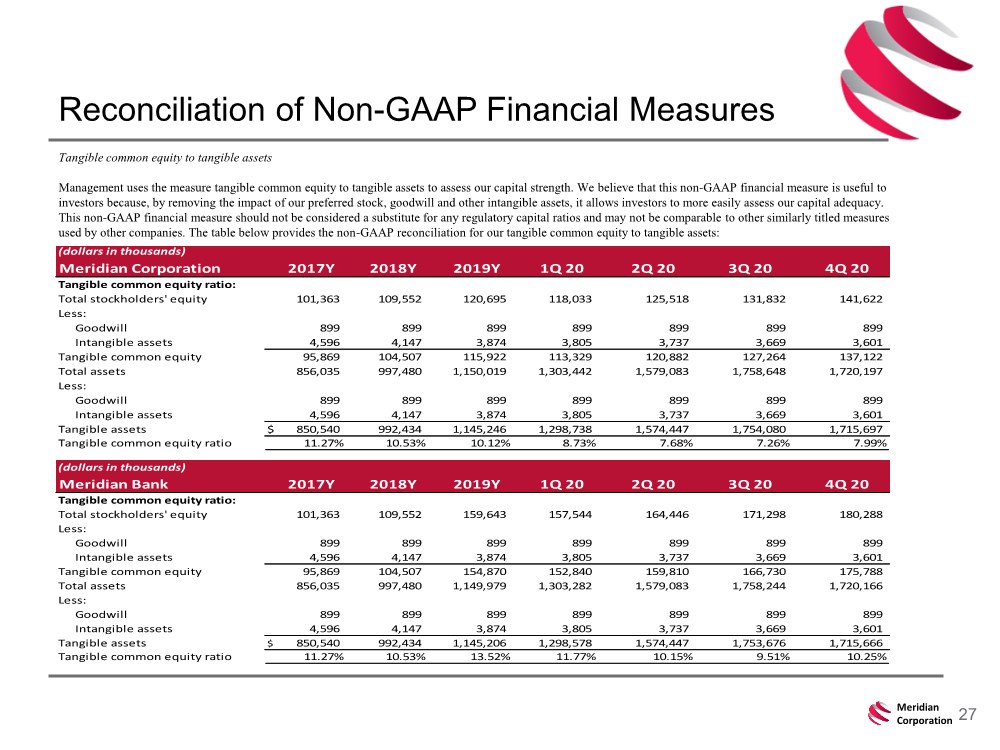
| 27 Meridian Corporation Reconciliation of Non-GAAP Financial Measures Tangible common equity to tangible assets Management uses the measure tangible common equity to tangible assets to assess our capital strength. We believe that this non-GAAP financial measure is useful to investors because, by removing the impact of our preferred stock, goodwill and other intangible assets, it allows investors to more easily assess our capital adequacy. This non-GAAP financial measure should not be considered a substitute for any regulatory capital ratios and may not be comparable to other similarly titled measures used by other companies. The table below provides the non-GAAP reconciliation for our tangible common equity to tangible assets: (dollars in thousands) Meridian Corporation 2017Y 2018Y 2019Y 1Q 20 2Q 20 3Q 20 4Q 20 Tangible common equity ratio: Total stockholders' equity 101,363 109,552 120,695 118,033 125,518 131,832 141,622 Less: Goodwill 899 899 899 899 899 899 899 Intangible assets 4,596 4,147 3,874 3,805 3,737 3,669 3,601 Tangible common equity 95,869 104,507 115,922 113,329 120,882 127,264 137,122 Total assets 856,035 997,480 1,150,019 1,303,442 1,579,083 1,758,648 1,720,197 Less: Goodwill 899 899 899 899 899 899 899 Intangible assets 4,596 4,147 3,874 3,805 3,737 3,669 3,601 Tangible assets $ 850,540 992,434 1,145,246 1,298,738 1,574,447 1,754,080 1,715,697 Tangible common equity ratio 11.27% 10.53% 10.12% 8.73% 7.68% 7.26% 7.99% (dollars in thousands) Meridian Bank 2017Y 2018Y 2019Y 1Q 20 2Q 20 3Q 20 4Q 20 Tangible common equity ratio: Total stockholders' equity 101,363 109,552 159,643 157,544 164,446 171,298 180,288 Less: Goodwill 899 899 899 899 899 899 899 Intangible assets 4,596 4,147 3,874 3,805 3,737 3,669 3,601 Tangible common equity 95,869 104,507 154,870 152,840 159,810 166,730 175,788 Total assets 856,035 997,480 1,149,979 1,303,282 1,579,083 1,758,244 1,720,166 Less: Goodwill 899 899 899 899 899 899 899 Intangible assets 4,596 4,147 3,874 3,805 3,737 3,669 3,601 Tangible assets $ 850,540 992,434 1,145,206 1,298,578 1,574,447 1,753,676 1,715,666 Tangible common equity ratio 11.27% 10.53% 13.52% 11.77% 10.15% 9.51% 10.25% |
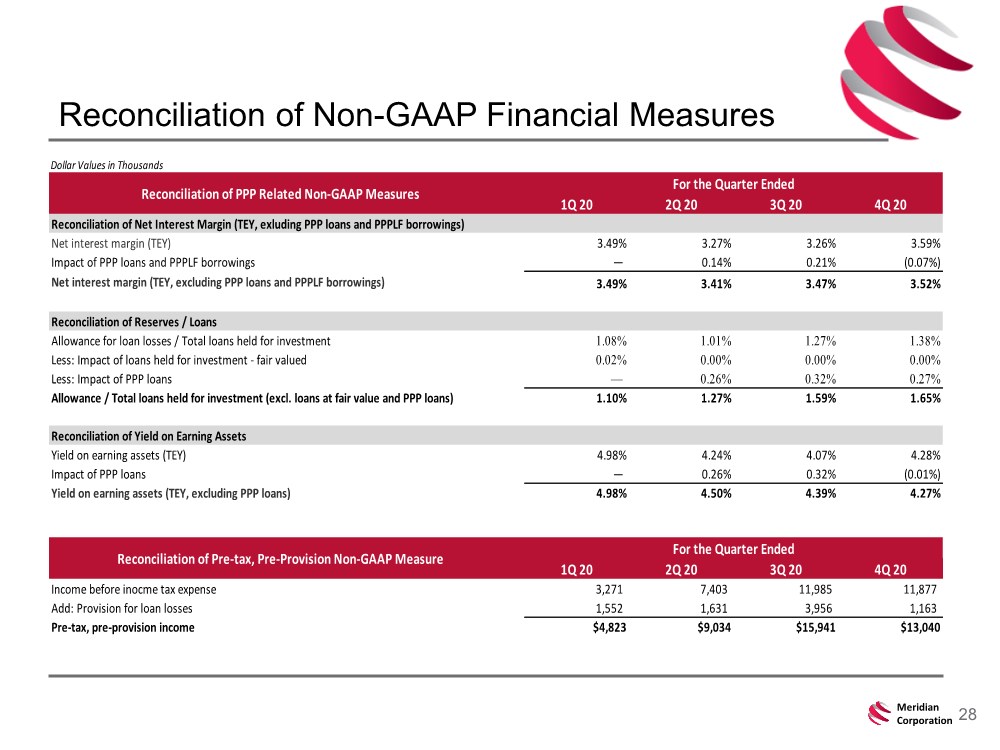
| 28 Meridian Corporation Reconciliation of Non-GAAP Financial Measures Dollar Values in Thousands 1Q 20 2Q 20 3Q 20 4Q 20 Reconciliation of Net Interest Margin (TEY, exluding PPP loans and PPPLF borrowings) Net interest margin (TEY) 3.49% 3.27% 3.26% 3.59% Impact of PPP loans and PPPLF borrowings — 0.14% 0.21% (0.07%) Net interest margin (TEY, excluding PPP loans and PPPLF borrowings) 3.49% 3.41% 3.47% 3.52% Reconciliation of Reserves / Loans Allowance for loan losses / Total loans held for investment 1.08% 1.01% 1.27% 1.38% Less: Impact of loans held for investment - fair valued 0.02% 0.00% 0.00% 0.00% Less: Impact of PPP loans — 0.26% 0.32% 0.27% Allowance / Total loans held for investment (excl. loans at fair value and PPP loans) 1.10% 1.27% 1.59% 1.65% Reconciliation of Yield on Earning Assets Yield on earning assets (TEY) 4.98% 4.24% 4.07% 4.28% Impact of PPP loans — 0.26% 0.32% (0.01%) Yield on earning assets (TEY, excluding PPP loans) 4.98% 4.50% 4.39% 4.27% 1Q 20 2Q 20 3Q 20 4Q 20 Income before inocme tax expense 3,271 7,403 11,985 11,877 Add: Provision for loan losses 1,552 1,631 3,956 1,163 Pre-tax, pre-provision income $4,823 $9,034 $15,941 $13,040 Reconciliation of PPP Related Non-GAAP Measures Reconciliation of Pre-tax, Pre-Provision Non-GAAP Measure For the Quarter Ended For the Quarter Ended |