Attached files
| file | filename |
|---|---|
| EX-99.1 - EX-99.1 - ENERGIZER HOLDINGS, INC. | enrpr12312020.htm |
| 8-K - 8-K - ENERGIZER HOLDINGS, INC. | enr-20210208.htm |

+ Fiscal Q1 Earnings February 8, 2021 Exhibit 99.2

2 Forward-Looking Statements and Non-GAAP Financial Measures Energizer Holdings, Inc. (the “Company”) and its management may make certain statements that constitute “forward-looking statements” within the meaning of the Private Securities Litigation Reform Act of 1995. These statements can be identified by the fact that they do not relate strictly to historical or current facts. Forward-looking statements often use words such as “anticipates,” “targets,” “expects,” “hopes,” “estimates,” “intends,” “plans,” “goals,” “believes,” “continue” and other similar expressions or future or conditional verbs such as “will,” “may,” “might,” “should,” “would” and “could.” Forward- looking statements represent the Company’s current expectations, plans or forecasts of its future results, revenues, expenses, capital measures, strategy, and future business and economic conditions more generally, and other future matters. These statements are not guarantees of future results or performance and involve certain known and unknown risks, uncertainties and assumptions that are difficult to predict and are often beyond the Company’s control. Actual outcomes and results may differ materially from those expressed in these forward-looking statements. Factors that could cause actual results or events to differ materially from those anticipated include, without limitation, the matters implied by, any of these forward-looking statements. You should not place undue reliance on any forward-looking statement and should consider the following uncertainties and risks, as well as the risks and uncertainties more fully discussed under Item 1A. Risk Factors of the Company’s Annual Report on Form 10-K filed with the Securities and Exchange Commission on November 17, 2020: (1) global economic and financial market conditions, including those resulting from the COVID-19 pandemic, and actions taken by our customers, suppliers, other business partners and governments in markets where we compete; (2) competition in our product categories; (3) changes in the retail environment and consumer preferences; (4) demand, supply and operational challenges resulting from the COVID- 19 pandemic; (5) loss or impairment of our reputation or failure of our marketing plans; (6) loss of any of our principal customers; (7) our ability to meet our growth targets based on our product, marketing and operations innovation and our responses to competitive innovation and changing consumer habits; (8) risks related to our international operations, including currency fluctuations and the impact of the United Kingdom’s exit from the European Union; (9) our ability to protect our intellectual property rights; (10) risks resulting from our reliance on certain significant suppliers, including interruptions in supply; (11) the availability of raw materials and our ability to forecast customer demand and to manage production capacity; (12) changes in production costs, including raw materials prices; (13) disruption of our manufacturing facilities, supply channels or other business operations or those of our suppliers from events beyond our control; (14) our ability to generate anticipated cost savings, successfully implement our strategies and efficiently manage our supply chain and manufacturing processes; (15) the seasonality of sales and the impact of adverse weather during peak selling seasons for certain of our products; (16) risks related to the performance of our key information technology systems; (17) our operations’ dependence on information technology systems that are subject to data privacy regulations and are potential targets of cyberattack; (18) the impact of significant debt obligations on our business and our ability to meet those obligations; (19) potential losses or increased funding and expenses related to our pension plans; (20) the accuracy of our estimates and assumptions on which our financial projections are based; (21) our ability to successfully complete strategic acquisitions, divestitures or joint ventures and integrate acquired businesses; (22) our ability to realize the anticipated benefits of the 2019 acquisitions of the global auto care and battery, lighting and power businesses from Spectrum Brands and the availability of sufficient indemnification for liabilities with respect to the acquisitions; (23) our exposure to claims of product liability, labeling claims, commercial claims and other legal claims, and their impact on our results of operations and financial condition and any resulting product recalls or withdrawals; (24) the impact on our business of increasing and changing regulation in the U.S. and abroad, including environmental laws, customs and tariff determinations, and tax laws, policies and regulations, and the uncertainty and cost of future compliance and consequences of noncompliance with applicable laws; and (25) increased focus by governmental and non- governmental organizations, customers, consumers and shareholders on sustainability issues, including those related to climate change.

3 Forward-Looking Statements and Non-GAAP Financial Measures The information contained herein is preliminary and based on Company data available at the time of the earnings presentation. Forward- looking statements speak only as of the date they are made, and the Company undertakes no obligation to update any forward-looking statement to reflect the impact of circumstances or events that arise after the date the forward-looking statement was made. The Company reports its financial results in accordance with accounting principles generally accepted in the U.S. ("GAAP"). However, management believes that certain non-GAAP financial measures provide users with additional meaningful comparisons to the corresponding historical or future period. These non-GAAP financial measures exclude items that are not reflective of the Company's on-going operating performance, such as acquisition and integration costs and related items and the loss on extinguishment of debt. In addition, these measures help investors to analyze year over year comparability when excluding currency fluctuations, acquisition activity as well as other company initiatives that are not on-going. We believe these non-GAAP financial measures are an enhancement to assist investors in understanding our business and in performing analysis consistent with financial models developed by research analysts. Investors should consider non-GAAP measures in addition to, not as a substitute for, or superior to, the comparable GAAP measures. In addition, these non-GAAP measures may not be the same as similar measures used by other companies due to possible differences in method and in the items being adjusted. We provide the following non-GAAP measures and calculations, as well as the corresponding reconciliation to the closest GAAP measure in the following supplemental schedules: A reconciliation of all non-GAAP financial metrics used can be found in the Appendix of this presentation: ‒ Adjusted Earnings Per Share (EPS) excludes the impact of the costs related to acquisition and integration and the loss on extinguishment of debt. ‒ EBITDA is defined as net earnings before income tax provision, interest, loss on extinguishment of debt and depreciation and amortization. Adjusted EBITDA further excludes the impact of the costs related to acquisition and integration and share based payments. ‒ Adjusted Free Cash Flow excludes the cash payments for acquisition and integration expenses and integration capital expenditures. These expense cash payments are net of the statutory tax benefit associated with the payment. ‒ Adjusted Gross Margin excludes any charges related to acquisition and integration charges. ‒ Organic revenue is the non-GAAP financial measurement of the change in revenue that excludes or otherwise adjusts for the impact of acquisitions, operations in Argentina, and the impact of currency from the changes in foreign currency exchange rates. References to specific quarters and years pertain to our fiscal years.

+ Financial Results First Quarter Fiscal 2021

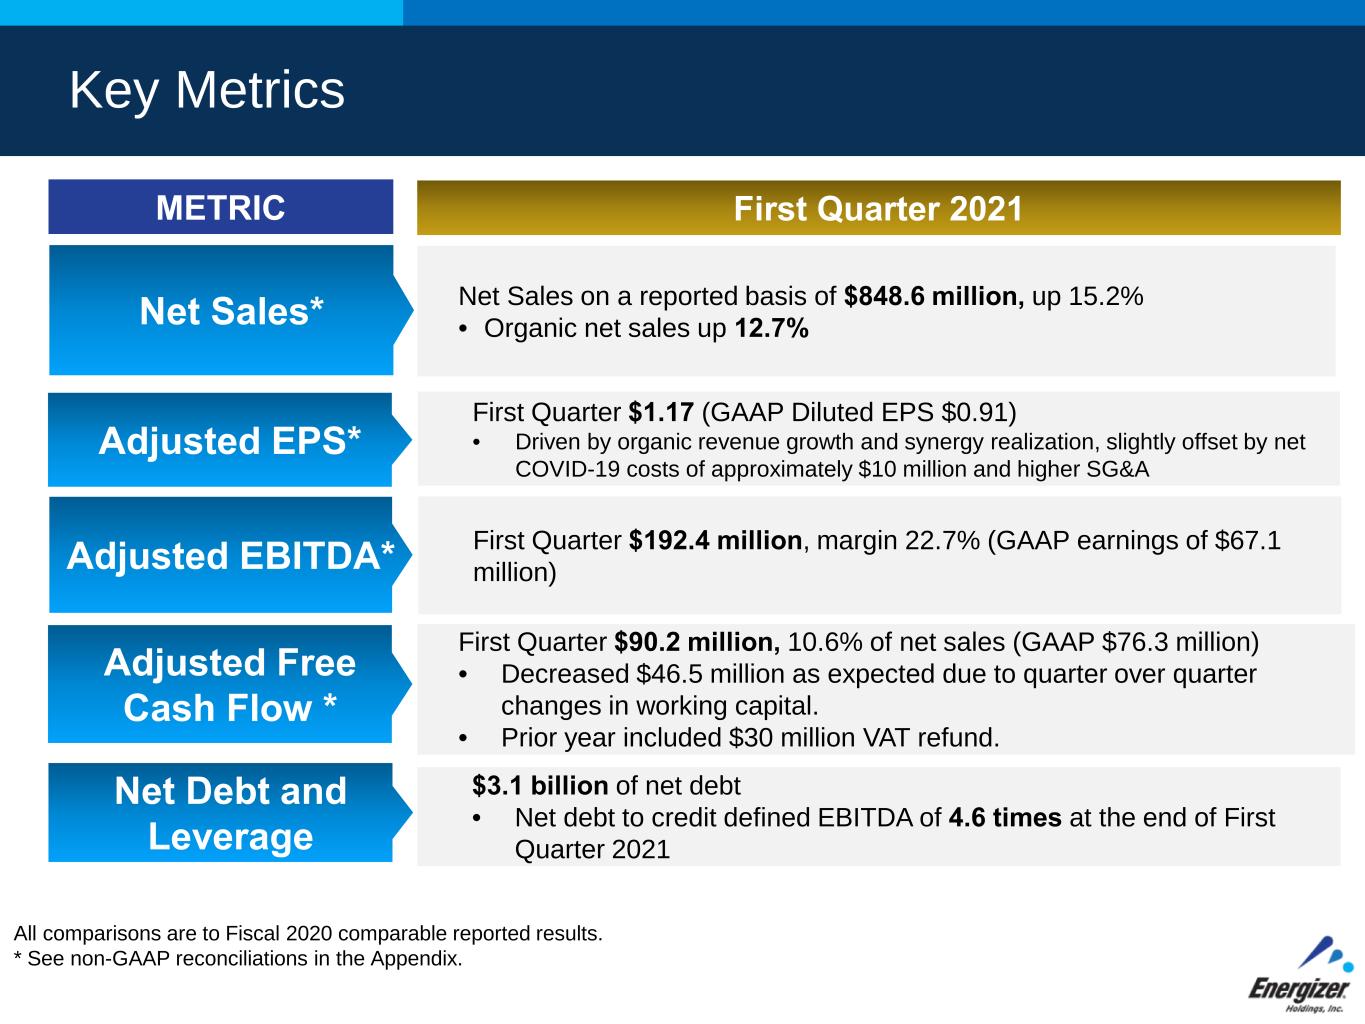
METRIC First Quarter 2021 Adjusted EPS* Adjusted Free Cash Flow * Net Debt and Leverage First Quarter $192.4 million, margin 22.7% (GAAP earnings of $67.1 million) First Quarter $90.2 million, 10.6% of net sales (GAAP $76.3 million) • Decreased $46.5 million as expected due to quarter over quarter changes in working capital. • Prior year included $30 million VAT refund. $3.1 billion of net debt • Net debt to credit defined EBITDA of 4.6 times at the end of First Quarter 2021 All comparisons are to Fiscal 2020 comparable reported results. * See non-GAAP reconciliations in the Appendix. Adjusted EBITDA* First Quarter $1.17 (GAAP Diluted EPS $0.91) • Driven by organic revenue growth and synergy realization, slightly offset by net COVID-19 costs of approximately $10 million and higher SG&A Key Metrics Net Sales* Net Sales on a reported basis of $848.6 million, up 15.2%• Organic net sales up 12.7%

6 Net sales* Q1 Fiscal 2020 to Q1 Fiscal 2021 * See non-GAAP reconciliations in the Appendix.

7 Adjusted Gross Margin* Q1 Fiscal 2020 to Q1 Fiscal 2021 * See non-GAAP reconciliations in the Appendix. (1) Channel, customer and product mix as well as increased operating costs, resulting from increased tariffs associated with higher volumes, commodity costs, and transportation costs, consistent with inflationary trends in the global market.

Adjusted EPS* Q1 Fiscal 2020 to Q1 Fiscal 2021 8 * See non-GAAP reconciliations in the Appendix. (1) COVID-19 includes gross margin impact of $11.7 million offset by SG&A savings of $2.2 million.

Adjusted EBITDA* Q1 Fiscal 2020 to Q1 Fiscal 2021 9 (1) COVID-19 include gross margin impact of $11.7 million offset by SG&A savings of $2.2 million. * See non-GAAP reconciliations in the Appendix.

+ Outlook Fiscal 2021

Fiscal 2021 Outlook Key Financial Metrics METRIC Fiscal 2021 Outlook Adjusted EBITDA* Adjusted Free Cash Flow* Adjusted EPS * $600 to $630 million • Expect to be at the higher end of the range due to strong first quarter organic growth $325 to $350 million $3.10 to $3.40 • Updated previous guidance due to interest savings from first quarter refinancings and strong first quarter organic growth All comparisons are to Fiscal 2020 comparable reported results. * See non-GAAP reconciliations in the Appendix. Net Sales Growth of 2% to 4% • Expect to be at the higher end of the range due to strong first quarter organic growth

Fiscal 2021 Outlook Key Financial Metrics METRIC Fiscal 2021 Outlook Capital Spending Normal Operations - $35 to $40 million Acquisition and Integration - $30 to $40 million All comparisons are to Fiscal 2020 comparable reported results. Adjusted Gross Margin Rate Expected to be flat. Includes approximately $12 million of incremental COVID costs incurred in the first quarter Synergies Incremental $40 to $45 million • $20.2 million of this realized in the first fiscal quarter

13 Appendix Materials

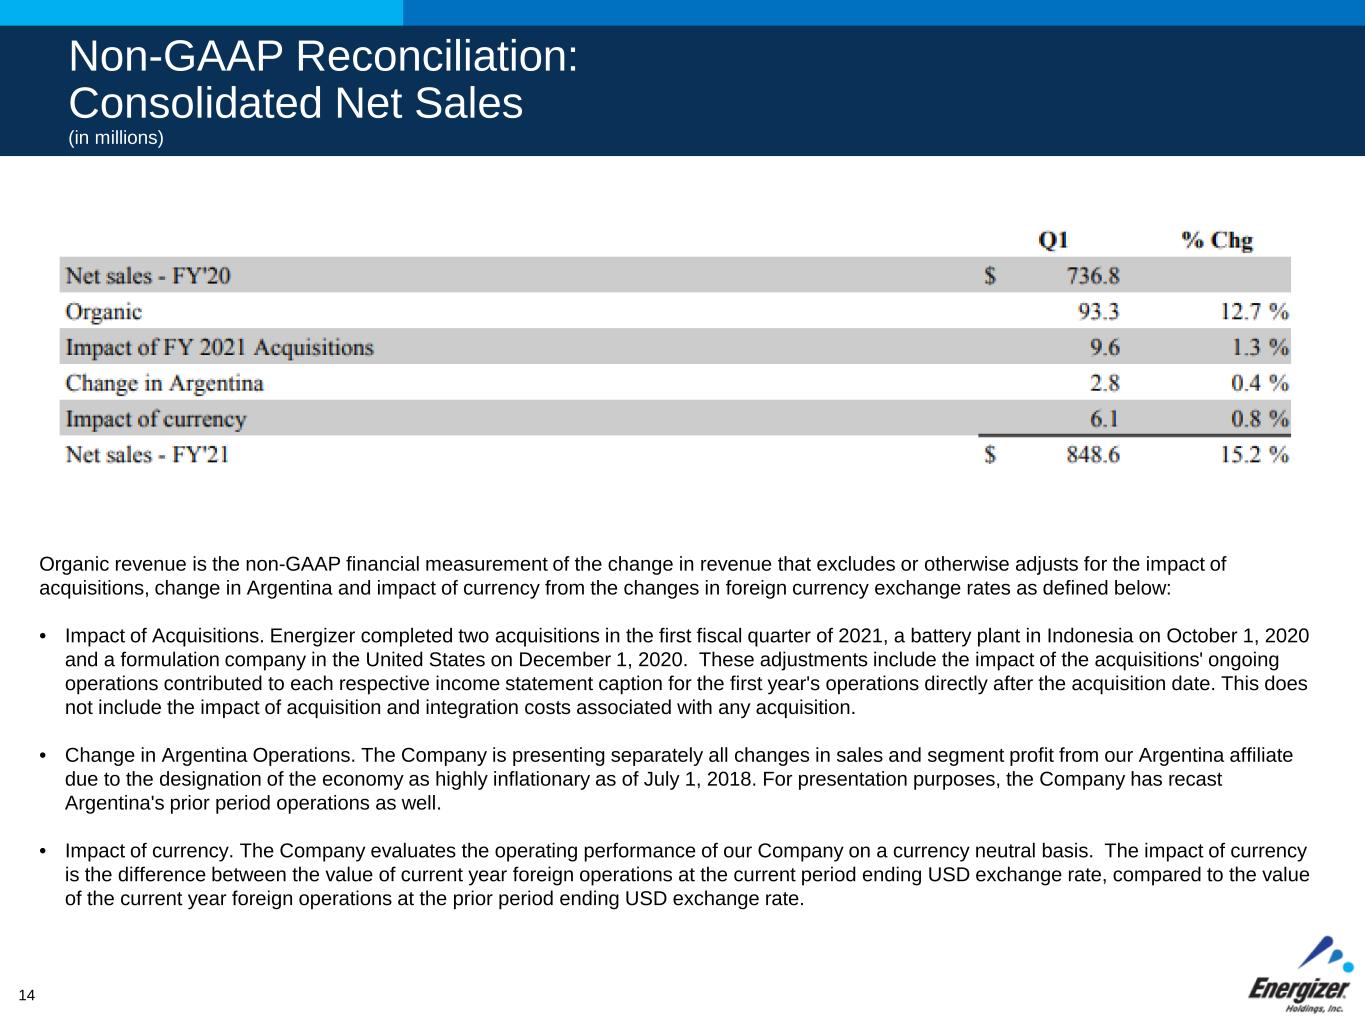
14 Non-GAAP Reconciliation: Consolidated Net Sales (in millions) Organic revenue is the non-GAAP financial measurement of the change in revenue that excludes or otherwise adjusts for the impact of acquisitions, change in Argentina and impact of currency from the changes in foreign currency exchange rates as defined below: • Impact of Acquisitions. Energizer completed two acquisitions in the first fiscal quarter of 2021, a battery plant in Indonesia on October 1, 2020 and a formulation company in the United States on December 1, 2020. These adjustments include the impact of the acquisitions' ongoing operations contributed to each respective income statement caption for the first year's operations directly after the acquisition date. This does not include the impact of acquisition and integration costs associated with any acquisition. • Change in Argentina Operations. The Company is presenting separately all changes in sales and segment profit from our Argentina affiliate due to the designation of the economy as highly inflationary as of July 1, 2018. For presentation purposes, the Company has recast Argentina's prior period operations as well. • Impact of currency. The Company evaluates the operating performance of our Company on a currency neutral basis. The impact of currency is the difference between the value of current year foreign operations at the current period ending USD exchange rate, compared to the value of the current year foreign operations at the prior period ending USD exchange rate.

Non-GAAP Reconciliations: Adjusted Gross Profit Margin (in millions) 15 Adjusted Gross Margin as a percent of sales excludes the impact of costs related to acquisition and integration.

16 Non-GAAP Reconciliation: Adjusted EPS (in millions, except per share data) (1) (1) The Effective tax rate for the quarters ended December 31, 2020 and 2019 for the Adjusted - Non-GAAP Net Earnings and Diluted EPS was 22.6% and 22.5%, respectively, as calculated utilizing the statutory rate for where the costs were incurred

Non-GAAP Reconciliations: Adjusted EBITDA and Adjusted Free Cash Flow (in millions) 17

Non-GAAP Reconciliations: Fiscal 2021 Outlook 18
