Attached files
| file | filename |
|---|---|
| 8-K - 8-K - OLD NATIONAL BANCORP /IN/ | onb-20210203.htm |

Investment Thesis FINANCIAL DATA AS OF December 31, 2020 DATED: February 3, 2021 Exhibit 99.1

Executive Summary Slides 3-15

3 Forward-Looking Statements; Non-GAAP Forward-Looking Statements: This presentation contains certain forward-looking statements within the meaning of the Private Securities Litigation Reform Act of 1995. These statements include, but are not limited to, descriptions of Old National Bancorp’s (“Old National’s”) financial condition, results of operations, asset and credit quality trends and profitability. Forward-looking statements can be identified by the use of the words “anticipate,” “believe,” “expect,” “intend,” “could” and “should,” and other words of similar meaning. These forward-looking statements express management’s current expectations or forecasts of future events and, by their nature, are subject to risks and uncertainties, such as statements about the potential impacts of the COVID-19 pandemic. There are a number of factors that could cause actual results to differ materially from those in such statements. Factors that might cause such a difference include, but are not limited to: the severity, magnitude and duration of the COVID-19 pandemic, including impacts of the pandemic and of businesses’ and governments’ responses to the pandemic on our operations and personnel, and on commercial activity and demand across our and our customers’ businesses; market, economic, operational, liquidity, credit and interest rate risks associated with Old National’s business(including developments and volatility arising from the COVID-19 pandemic); competition; heightened regulatory and governmental oversight and scrutiny of Old National’s business practices; current, pending or future government legislation and policies (including the impact of the Dodd-Frank Wall Street Reform and Consumer Protection Act and its related regulations); ability of Old National to execute its business plan, including the anticipated impact from the ONB Way strategic plan that may differ from current estimates; changes in the economy which could materially impact credit quality trends and the ability to generate loans and gather deposits; failure or circumvention of our internal controls; failure or disruption of our information systems; significant changes in accounting, tax or regulatory practices or requirements, including the impact of the CECL standard as well as changes to address the impact of COVID-19; new legal obligations or liabilities or unfavorable resolutions of litigations; disruptive technologies in payment systems and other services traditionally provided by banks; computer hacking and other cybersecurity threats; other matters discussed in this presentation; and other factors identified in our Annual Report on Form 10-K and other periodic filings with the SEC. These forward-looking statements are made only as of the date of this presentation, and Old National does not undertake an obligation to release revisions to these forward-looking statements to reflect events or conditions after the date of this presentation. Non-GAAP: These slides contain non-GAAP financial measures. For purposes of Regulation G, a non-GAAP financial measure is a numerical measure of the registrant's historical or future financial performance, financial position or cash flows that excludes amounts, or is subject to adjustments that have the effect of excluding amounts, that are included in the most directly comparable measure calculated and presented in accordance with GAAP in the statement of income, balance sheet or statement of cash flows (or equivalent statements) of the registrant; or includes amounts, or is subject to adjustments that have the effect of including amounts, that are excluded from the most directly comparable measure so calculated and presented. In this regard, GAAP refers to generally accepted accounting principles in the United States. Pursuant to the requirements of Regulation G, Old National Bancorp has provided reconciliations within the slides, as necessary, of the non-GAAP financial measure to the most directly comparable GAAP financial measure.

4 Snapshot of Old National Summary Company Description • Largest bank holding company headquartered in Indiana with financial centers located in Indiana, Kentucky, Michigan, Minnesota and Wisconsin • 162 financial centers and 187 ATMs Our new strategic vision--The ONB Way • We are a leading commercially-oriented regional bank with a distinctive client-centric value proposition based on strong relationships, streamlined operating model, and an exceptional work environment that empowers our team members to deliver their best Key Financial MetricsLoan Mix Deposit Mix 1 Non-GAAP financial measure which Management believes is useful in evaluating the financial results of the Company – see Appendix for Non-GAAP reconciliation 2 At or for the three-months ended December 31, 2020 Market data as of February 2, 2021 $ in millions, except as noted Consumer 7.8% Residential Real Estate 16.7% Home Equity 4.0% Commercial Real Estate 42.9% Commercial 28.6% Time Deposits 6.5% Demand Deposits 33.1% NOW 28.6% Savings 19.9% Money Market 11.2% Brokered Deposits 0.7%> Headquarters Evansville, IN Market Cap $2,861 P/ TBV 151% Dividend Yield 3.2% LTM Average Daily Volume (Actual) 874,017 Total Assets $22,961 Wealth Assets Under Management $17,255 4Q20 ROAA As Reported/ Adjusted1 1.30%/ 1.34% 4Q20 ROATCE As Reported/ Adjusted1 16.57%/ 17.08% Loans to Total Deposits 81.3% Cost of Total Deposits 0.09% Return on Risk Weighted Assets 1.93% Tangible Book Value $11.43 Noninterest Income/ Total Revenue (FTE) 26.2 Efficiency Ratio As Reported/ Adjusted1 62.37%/56.35% Net Charge Offs (Recoveries)/ Average Loans -0.03% 90+ Day Delinquent Loans 0.00% Non-Performing Loans/ Total Loans 1.20% Tangible Common Equity to Tangible Assets 8.64%
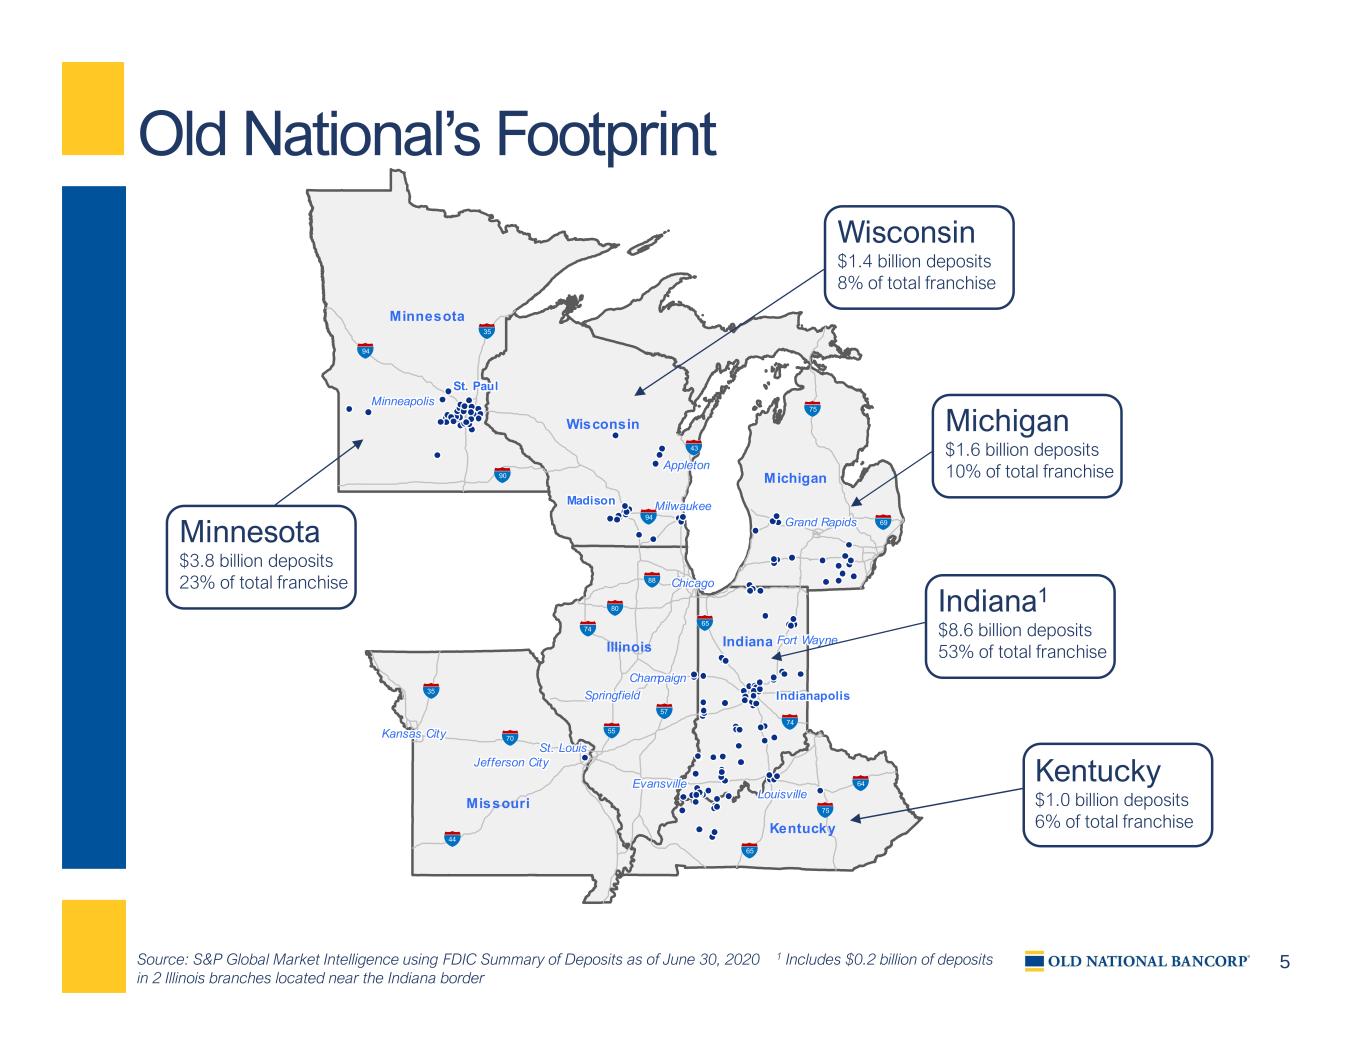
5 IndianaIllinois Missouri Minnesota Michigan Kentucky Fort Waynet r yFo t a net t rr yyFo t a net Fo t a ne Champaigniha paigniiiha paigniha paign Grand Rapids ir sand apid i irr ssand apid iand apid IndianapolisI i liIndianapolisI i liI i liIn ia a lisI i liIn ia a lis Louisvillei illsvLoui illei illi illisvisviLou i lei lLou i le St. Louist. ist. Louit. it. isst. Louit. it. Loui Evansvilleillv svan illeillillv svv svE an i lei lan i le Milwaukeeil kil au eeilil kkil au eeilil au ee Appletonl tppletonl tl tppletonl tppleton Madisoniadisoniiadisoniadison St. Paul. lt. aul. l. ltt. aul. l. aul Minneapolisi lisinneapolii lii lissinneapolii liinneapoli Wisconsin Chicagoichi agoiicchi agoihi ago Springfieldi fi lrp ingfieldi fi li fi lrr ddp ingfieli fi lp ingfiel Kansas City its s yan a it it its s ys s yan a it itan a it Jefferson Cityff itrJ s yeffe on itff itff itrrJ s yJ s yeffe on itff iteffe on it 75 69 75 64 65 90 94 43 65 74 35 94 57 55 74 80 88 35 70 44 Old National’s Footprint Source: S&P Global Market Intelligence using FDIC Summary of Deposits as of June 30, 2020 1 Includes $0.2 billion of deposits in 2 Illinois branches located near the Indiana border Minnesota $3.8 billion deposits 23% of total franchise Indiana1 $8.6 billion deposits 53% of total franchise Michigan $1.6 billion deposits 10% of total franchise Wisconsin $1.4 billion deposits 8% of total franchise Kentucky $1.0 billion deposits 6% of total franchise

6 Attractive Midwest Markets Source: S&P Global Market Intelligence, based on MSAs Loans & Deposits in millions $86.4 $69.2 $66.2 $66.6 $64.5 $68.8 $78.2 $63.9 $60.9 $78.8 $66.7 Median Household Income 2021 (000s) 10.0% 9.6% 8.8% 9.4% 9.8% 10.2% 11.3% 9.6% 9.5% 12.6% 9.4% Projected Household Income Change 2021-2026 4.0% 0.3% 3.7% 0.6% 2.0% 2.7% 3.3% 3.1% 3.1% 1.7% 2.0% Projected Population Change 2021-2026 Average of ONB Footprint Average of ONB Footprint Average of ONB Footprint $2,463 $1,166 $669 $564 $721 $750 $548 $302 $217 $3,701 $1,551 $880 $800 $273 $204 $358 $421 $49 Minneapolis, MN Indianapolis, IN Madison, WI Ann Arbor, MI Louisville, KY Milwaukee, WI Grand Rapids, MI Ft. Wayne, IN Lexington, KY Loans Deposits

7 Why ONB? Our Investment Thesis The Old National Proposition Granular & Diversified Loan Portfolio Average Commercial & Industrial loan size ~$352,000 and average Commercial Real Estate loan size ~$816,000; diversified by product type with no significant industry concentrations; primarily to clients within the Old National footprint Strong Credit Culture and Lower Risk Model Conservative credit culture with below peer net charge-offs and lower-than-peer RWA/Assets; Lower volatility model by design Quality Low-Cost Deposit Base Low loans to deposits ratio of 81%; Below peer cost of total deposits (9 bps) Proven Acquirer Successfully executed and integrated 11 acquisitions since 2011 while the ONB Way provides a streamlined operating model and scalability for future M&A opportunities Old National is a leading commercially-oriented regional bank with a distinctive client-centric value proposition based on strong relationships, streamlined operating model, and an exceptional work environment that empowers our team members to deliver their best

8 Franchise Evolution Built a Better Bank Source: S&P Global Market Intelligence $ in millions unless noted otherwise $5,447 $7,279 $16,918 $47 $40 $104 2007 2012 4Q20 Core Deposits Core Deposits/Branch $7,846 $9,544 $22,961 $3.15 $3.56 $9.39 2007 2012 4Q20 Total Assets Assets/FTE 193 215 725 2007 2012 4Q20 Total Businesses in All MSAs (000s) (C&I = 36) (C&I = 40) (C&I = 139) $521 $579 $1,840 $274 $295 $1,023 2007 2012 4Q20 Total Sales in All MSAs ($Billions) GDP ($Billions) Assets per FTEDeposits per Branch Sales and GDPTotal Businesses Key market expansions in Minnesota (2017/2018), Wisconsin (2016), Michigan (2014/2015)

9 $2.0 $2.0 $2.4 $2.5 $3.0 $3.7 $4.0 $4.1 $5.6 $5.3 $5.2 $6.1 $5.8 $7.6 $8.7 $10.2 $10.4 $11.3 $7.3 $7.2 $8.5 $8.3 $10.6 $12.4 $14.2 $14.5 $16.9 2012Y 2013Y 2014Y 2015Y 2016Y 2017Y 2018Y 2019Y 2020Y Noninterest-bearing Interest-bearing Noninterest- bearing Demand 33.3% NOW 28.8% Savings 20.1% Money Market 11.3% Time 6.5% Quality Low-Cost Deposit Franchise $ in billions Peer Group data per S&P Global Market Intelligence - See Appendix for definition of Peer Group 1 As of 12/31/2020 Deposit Growth Deposit Composition Cost of Total Deposits 0.17% 0.16% 0.17% 0.19% 0.32% 0.48% 0.18% 0.24% 0.22% 0.25% 0.37% 0.59% 0.80% 0.36% 2014Y 2015Y 2016Y 2017Y 2018Y 2019Y 2020Y ONB Peer Median

10 CRE Non-Owner Occupied 33% CRE Owner Occupied 13% C&I 23% Residential Real Estate 18% Other Consumer 9% HELOC 4% Multifamily 33% Office 17% Retail 13% Warehouse/ Industrial 10% Single Family 6% Senior Housing 5% Mixed Use 3% Self Storage 3% Other 10% Granular & Diversified Loan Portfolio1,2 $ in billions As of 12/31/2020 1 Includes loans held for sale 2 Excludes PPP Loans $1.3 $1.4 $1.6 $1.8 $1.9 $2.7 $3.2 $2.9 $3.0 $1.3 $1.2 $1.7 $1.8 $3.1 $4.4 $5.0 $5.2 $5.9 $2.2 $2.3 $3.0 $3.3 $4.1 $4.0 $4.1 $4.1 $4.0 $5.2 $5.1 $6.5 $7.0 $9.1 $11.1 $12.3 $12.2 $12.9 2012Y 2013Y 2014Y 2015Y 2016Y 2017Y 2018Y 2019Y 2020Y C&I CRE Consumer Covered Loans
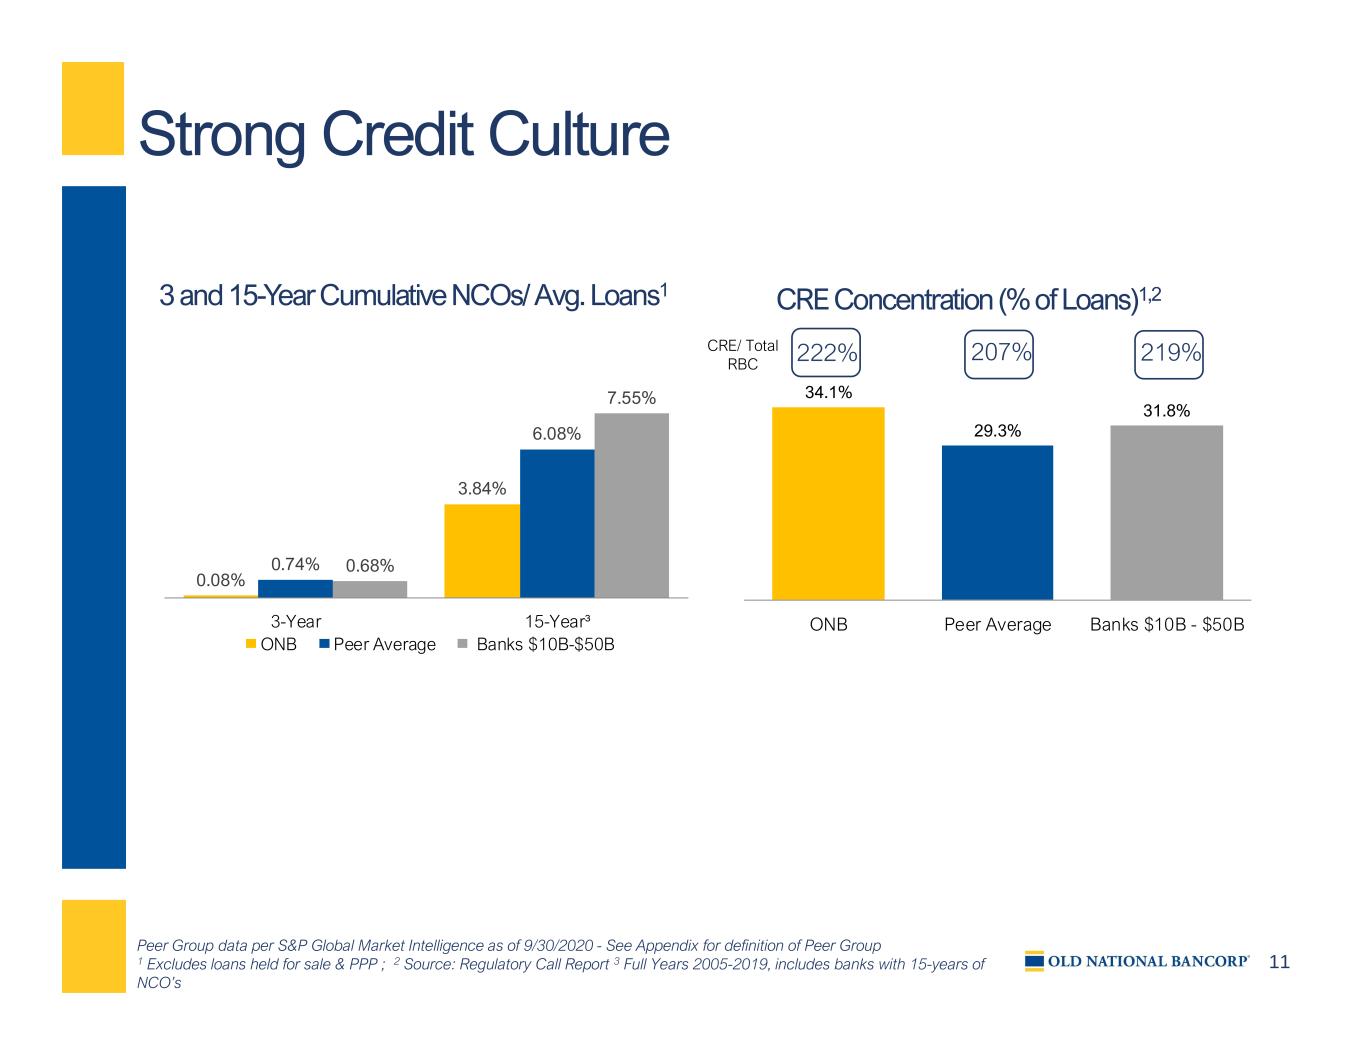
11 34.1% 29.3% 31.8% ONB Peer Average Banks $10B - $50B Strong Credit Culture Peer Group data per S&P Global Market Intelligence as of 9/30/2020 - See Appendix for definition of Peer Group 1 Excludes loans held for sale & PPP ; 2 Source: Regulatory Call Report 3 Full Years 2005-2019, includes banks with 15-years of NCO’s CRE Concentration (% of Loans)1,23 and 15-Year Cumulative NCOs/ Avg. Loans1 222% 207% 219%CRE/ Total RBC 0.08% 3.84% 0.74% 6.08% 0.68% 7.55% 3-Year 15-Year³ ONB Peer Average Banks $10B-$50B

12 Conservative Lending Limit/Risk Grades In-house lending limits conservative relative to ONB’s legal lending limit of $296mm per borrower $ in millions 1 Includes entire relationship with borrower Borrower Asset Quality Rating (Risk Grades) In-House Lending Limit1 0 – Investment Grade $70.0 1 – Minimal Risk $62.5 2 – Modest Risk $55.0 3 – Average Risk $47.5 4 – Monitor $37.5 5 – Weak Monitor $27.5 6 – Watch $12.5 Borrower Asset Quality Rating (Risk Grades) 7 – Criticized (Special Mention) 8 – Classified (Problem) 9 – Nonaccrual

13 Capital Trends Board authorization of up to $100mm in stock to be repurchased, as conditions warrant, through January 31, 2022 1 Non-GAAP financial measure which Management believes is useful in evaluating the financial results of the Company – see Appendix for Non-GAAP reconciliation 9.09% 8.58% 8.64% 4Q19 3Q20 4Q20 Tangible Common Equity to Tangible Assets1 $10.35 $11.10 $11.43 4Q19 3Q20 4Q20 Tangible Common Book Value1

14 Commitment to Excellence

15 Commitment to Diversity & Inclusion Old National is fully committed to supporting a rich culture of diversity as a cornerstone to our success • 27% of Old National’s Executive Operating Group are women • 68% of all Old National associates are women

Financial Details FINANCIAL DATA AS OF December 31, 2020 DATED: February 3, 2021
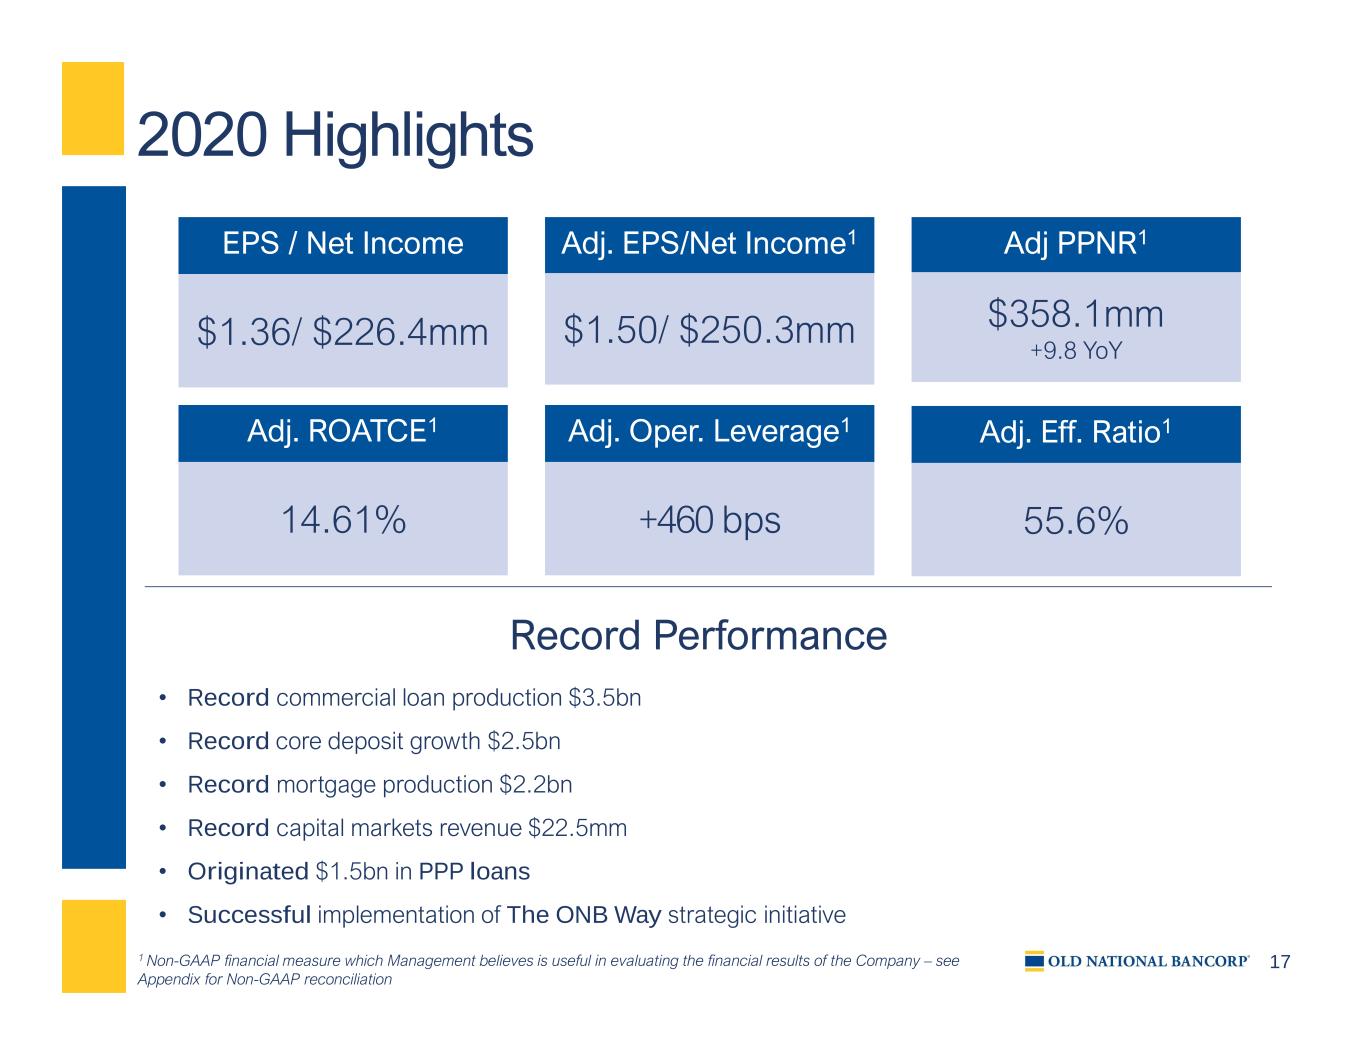
17 2020 Highlights Record Performance • Record commercial loan production $3.5bn • Record core deposit growth $2.5bn • Record mortgage production $2.2bn • Record capital markets revenue $22.5mm • Originated $1.5bn in PPP loans • Successful implementation of The ONB Way strategic initiative 1 Non-GAAP financial measure which Management believes is useful in evaluating the financial results of the Company – see Appendix for Non-GAAP reconciliation EPS / Net Income $1.36/ $226.4mm Adj. EPS/Net Income1 $1.50/ $250.3mm Adj PPNR1 $358.1mm +9.8 YoY Adj. ROATCE1 14.61% Adj. Oper. Leverage1 +460 bps Adj. Eff. Ratio1 55.6%

18 4th Quarter Highlights Performance Drivers • End of period commercial loans (excluding PPP) $473mm increase +22.3% annualized due to strong production • End of period core deposits $468.1mm increase, driven by checking and savings deposit growth • Allowance for credit losses unchanged; net recoveries of $1.1mm • Net interest income (excluding PPP) $1.8mm increase • Adj. noninterest income1 $1.6mm decrease due to seasonal decline in mortgage revenue 1 Non-GAAP financial measure which Management believes is useful in evaluating the financial results of the Company – see Appendix for Non-GAAP reconciliation EPS / Net Income $0.44/ $74.1mm Adj. EPS/Net Income1 $0.46/ $76.6mm Adj PPNR1 $94.0mm +27.2 YoY Adj. ROATCE1 17.08% Adj. Oper. Leverage1 +917 bps Adj. Eff. Ratio1 56.4%
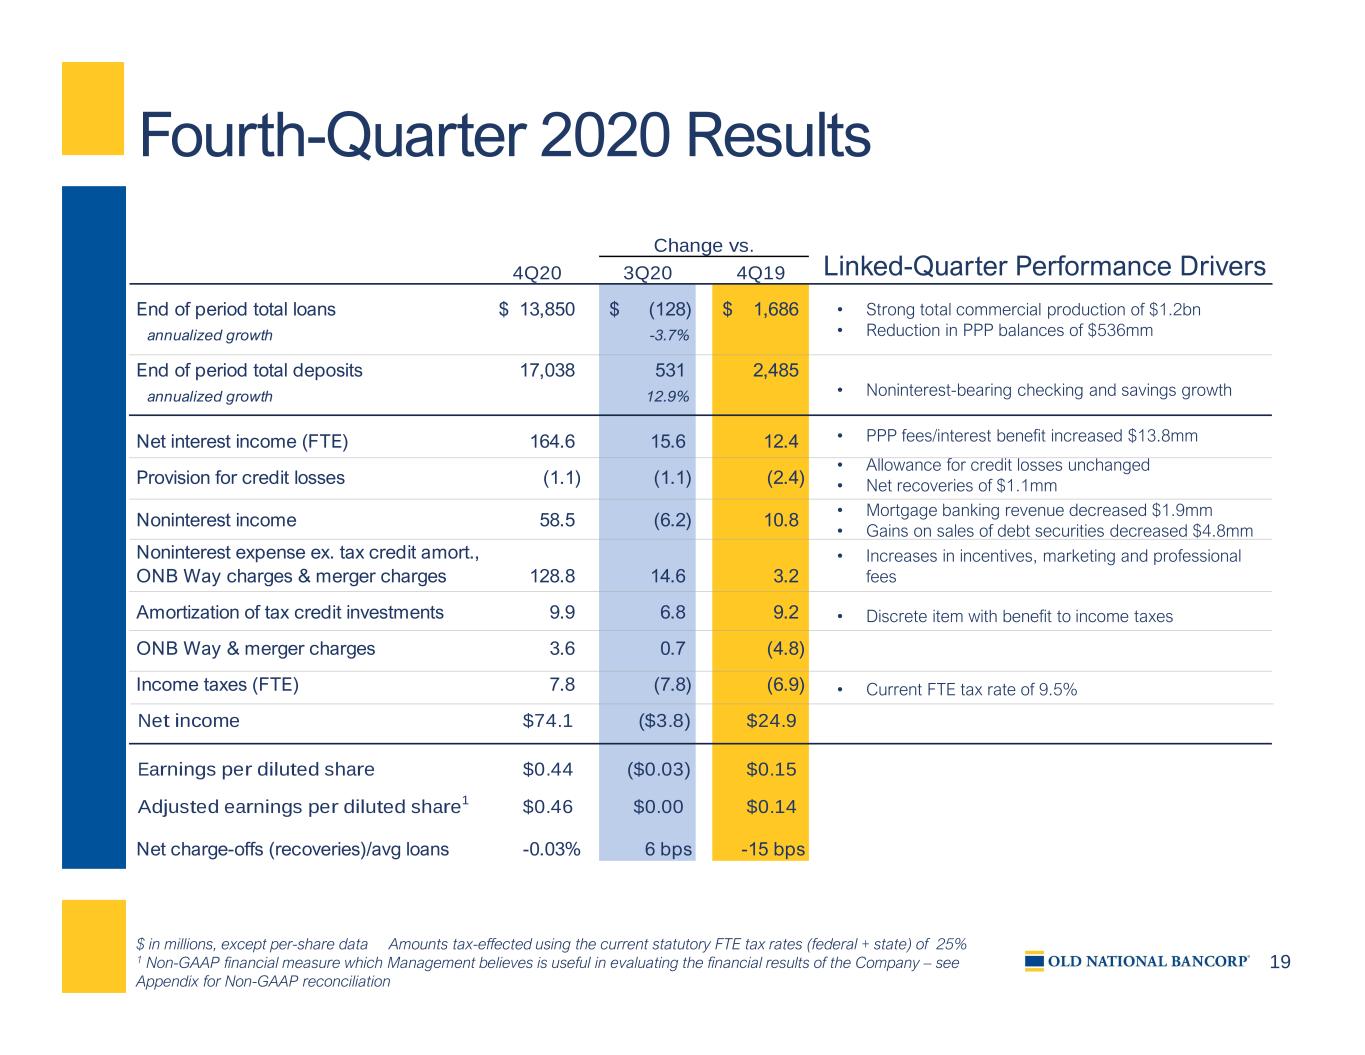
19 Change vs. 4Q20 3Q20 4Q19 End of period total loans 13,850$ (128)$ 1,686$ annualized growth -3.7% End of period total deposits 17,038 531 2,485 annualized growth 12.9% Net interest income (FTE) 164.6 15.6 12.4 Provision for credit losses (1.1) (1.1) (2.4) Noninterest income 58.5 (6.2) 10.8 Noninterest expense ex. tax credit amort., ONB Way charges & merger charges 128.8 14.6 3.2 Amortization of tax credit investments 9.9 6.8 9.2 ONB Way & merger charges 3.6 0.7 (4.8) Income taxes (FTE) 7.8 (7.8) (6.9) Net income $74.1 ($3.8) $24.9 Earnings per diluted share $0.44 ($0.03) $0.15 Adjusted earnings per diluted share1 $0.46 $0.00 $0.14 Net charge-offs (recoveries)/avg loans -0.03% 6 bps -15 bps • Allowance for credit losses unchanged • Net recoveries of $1.1mm Fourth-Quarter 2020 Results $ in millions, except per-share data Amounts tax-effected using the current statutory FTE tax rates (federal + state) of 25% 1 Non-GAAP financial measure which Management believes is useful in evaluating the financial results of the Company – see Appendix for Non-GAAP reconciliation Linked-Quarter Performance Drivers • PPP fees/interest benefit increased $13.8mm • Strong total commercial production of $1.2bn • Reduction in PPP balances of $536mm • Mortgage banking revenue decreased $1.9mm • Gains on sales of debt securities decreased $4.8mm • Noninterest-bearing checking and savings growth • Current FTE tax rate of 9.5% • Increases in incentives, marketing and professional fees • Discrete item with benefit to income taxes

20 Pre-Provision Net Revenue1 • Adjusted Positive operating leverage continues • 460 bps full year improvement • Full year adjusted pre-provision net revenue increased 9.8% • Improvement driven by successful execution of our stated strategy • Strong commercial loan production • Improved fee income • Low-cost core deposit funding • Strong expense management $ in millions 1Non-GAAP financial measure which management believes is useful in evaluating the financial results of the Company – see Appendix for Non-GAAP reconciliation $73.9 $77.4 $92.1 $94.6 $94.0 $326.2 $358.1 4Q19 1Q20 2Q20 3Q20 4Q20 2019 2020 Adjusted Pre-Provision Net Revenue 4Q19 4Q20 FY 2019 FY 2020 Adjusted total revenue1 $199.5 $222.8 $814.6 $838.1 Adjusted noninterest expense1 $125.6 $128.8 $488.4 $480.0 Basis point change in adj. total revenue 1,175 290 Basis point change in adj. noninterest exp. 258 (170) Adjusted Operating leverage 917 460

21 $3,126 $3,148 $3,129 $3,097 $3,040 $3,079 $3,033 $5,130 $5,189 $5,341 $5,546 $5,830 $5,702 $5,947 $2,892 $2,907 $2,924 $2,798 $2,911 $2,785 $3,013 $1,125 $1,477 $1,222 $1,479 $943 $12,069 $12,192 $13,450 $13,849 $13,928 $13,978 $13,850 4.64% 4.35% 3.96% 3.81% 3.73% $921 $948 $931 $931 $925 $933 $914 4Q19 1Q20 2Q20 3Q20 4Q20 3Q20 4Q20 Total Loans Indirect Other Consumer CRE C&I PPP Loan Yields Commercial 46% Cash/Securities 33% Consumer 9% Residential 12% Earning Asset Mix2 Earning Assets1 Average Balances Period-End Balances Commercial loans, excl. PPP • Commercial production of $1,197mm • Average new production size ~$1mm • Commercial pipeline at quarter end of $2.1bn • Line utilization was stable Loan yields decreased 8 bps2 • - 7 bps loan coupons/mix/volume • - 1 bp accretion income 4Q20 new production avg yields2 • Commercial and industrial: 2.28% • Commercial real estate: 2.71% • Residential real estate: 2.96% Securities • Duration of 4.08 vs. 3.94 in 3Q20 • 4Q20 yield was 2.31% • 4Q20 new money yield was 1.40% $ in millions 1 Includes loans held for sale 2 Excludes PPP Loans 2 2 2

22 Deposits Growth in noninterest-bearing and savings lead to higher deposit balances Deposit costs continue to decline • 4Q20 total deposit costs of 9 bps • Total interest-bearing deposit costs were 35 bps, down 7 bps from 3Q20 Low loan to deposit ratio of 81% $ in millions $8,804 $8,717 $9,336 $9,742 $9,971 $9,780 $10,181 $4,047 $3,965 $4,871 $5,291 $5,644 $5,463 $5,634 $1,752 $1,646 $1,446 $1,404 $1,196 $1,263 $1,223 $14,603 $14,328 $15,653 $16,437 $16,811 $16,506 $17,038 0.43% 0.34% 0.17% 0.13% 0.09% 4Q19 1Q20 2Q20 3Q20 4Q20 3Q20 4Q20 Total Deposits Transaction Noninterest-Bearing Time Cost of Deposits Average Balances Period-End Balances

23 4.05% 3.29% 3.46% 3.46% 3.03% 3.26% 0.84% 0.42% 0.35% 0.21% 0.11% 0.10% 4Q19 1Q20 2Q20 3Q20 4Q20 Net Interest Income & Net Interest Margin1 Key Performance Drivers • Net interest income (excluding PPP) increased $1.8mm • Lower new business yields • PPP 1% coupon + fees • $13.8mm increase to NII • 31 bps increase to NIM • NIM increased 23 bps vs. 3Q20 • - 14 bps asset yields • + 7 bps funding costs • - 1 bp accretion • + 31 bps PPP $ in millions 1Tax Equivalent Basis; Non-GAAP financial measure which Management believes is useful in evaluating the financial results of the Company – see Appendix for Non-GAAP reconciliation $10 $7 $6 $5 $5 $7 $9 $23 $152 $147 $149 $149 $165 $44 $23 $39 $617 $610 4Q19 1Q20 2Q20 3Q20 4Q20 FY 2019 FY 2020 Net Interest Income PPP Interest/Fees Accretion Income PPP Interest/Fees Total Earning Assets Yield Net Interest Margin Accretion Interest-Bearing Liability Cost Net Interest Margin Net Interest Margin 3.03% 3.26% (0.01%) (0.07%) 0.31% 3Q20 Accretion Rate/Volume Mix PPP 4Q20
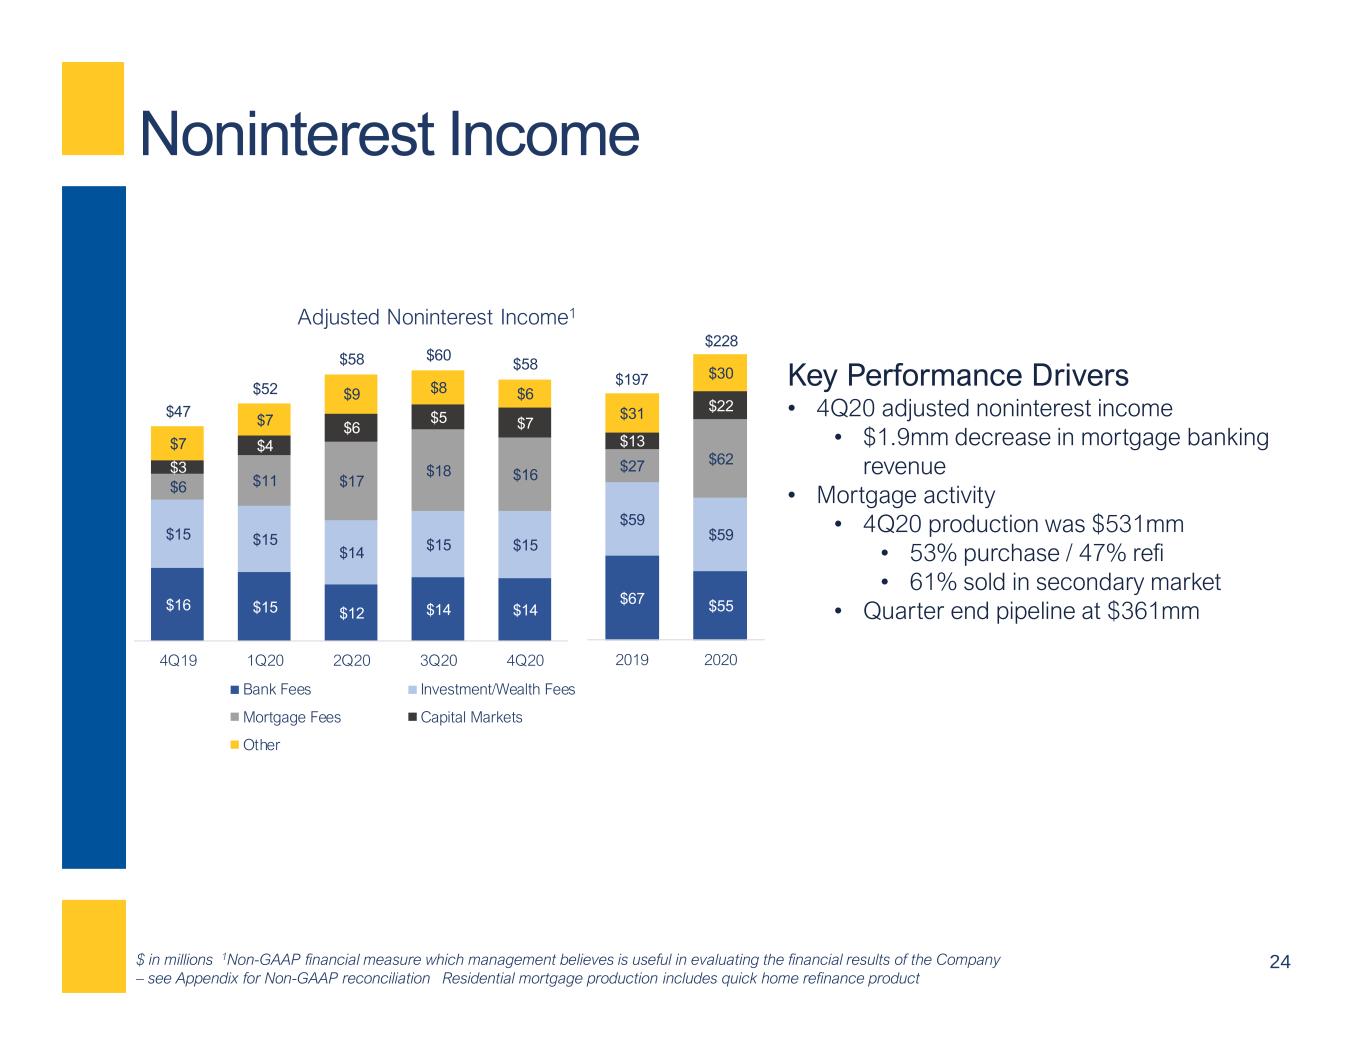
24 Noninterest Income Key Performance Drivers • 4Q20 adjusted noninterest income • $1.9mm decrease in mortgage banking revenue • Mortgage activity • 4Q20 production was $531mm • 53% purchase / 47% refi • 61% sold in secondary market • Quarter end pipeline at $361mm $ in millions 1Non-GAAP financial measure which management believes is useful in evaluating the financial results of the Company – see Appendix for Non-GAAP reconciliation Residential mortgage production includes quick home refinance product $16 $15 $12 $14 $14 $15 $15 $14 $15 $15 $6 $11 $17 $18 $16$3 $4 $6 $5 $7 $7 $7 $9 $8 $6 $47 $52 $58 $60 $58 4Q19 1Q20 2Q20 3Q20 4Q20 Adjusted Noninterest Income1 Bank Fees Investment/Wealth Fees Mortgage Fees Capital Markets Other $67 $55 $59 $59 $27 $62 $13 $22$31 $30$197 $228 2019 2020
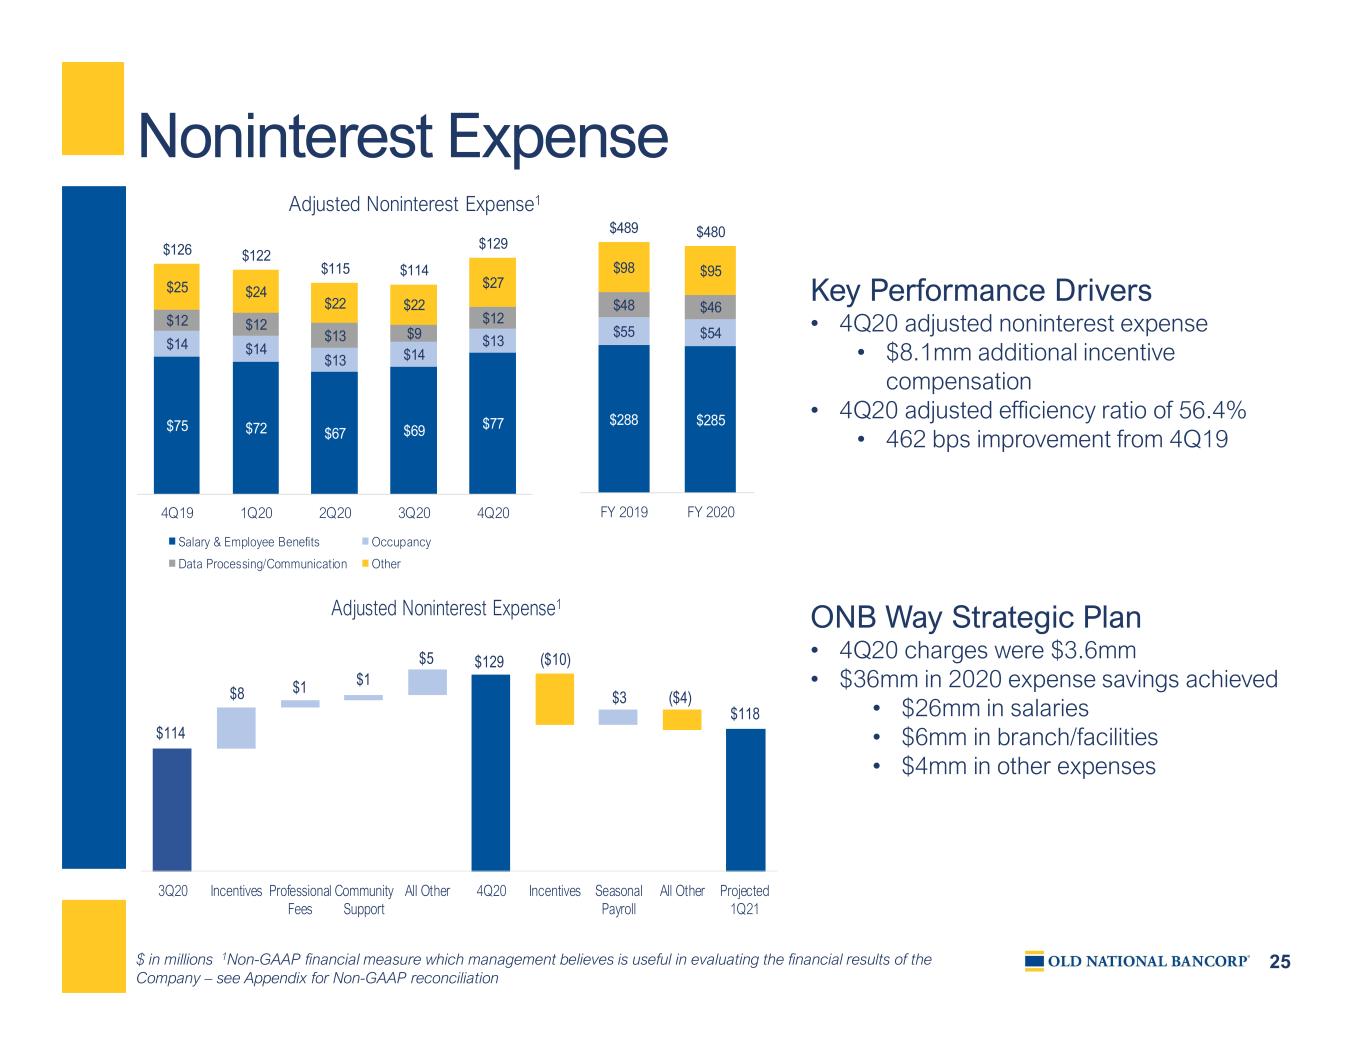
25 $75 $72 $67 $69 $77 $14 $14 $13 $14 $13 $12 $12 $13 $9 $12 $25 $24 $22 $22 $27 $126 $122 $115 $114 $129 4Q19 1Q20 2Q20 3Q20 4Q20 Adjusted Noninterest Expense1 Salary & Employee Benefits Occupancy Data Processing/Communication Other Noninterest Expense Key Performance Drivers • 4Q20 adjusted noninterest expense • $8.1mm additional incentive compensation • 4Q20 adjusted efficiency ratio of 56.4% • 462 bps improvement from 4Q19 ONB Way Strategic Plan • 4Q20 charges were $3.6mm • $36mm in 2020 expense savings achieved • $26mm in salaries • $6mm in branch/facilities • $4mm in other expenses $ in millions 1Non-GAAP financial measure which management believes is useful in evaluating the financial results of the Company – see Appendix for Non-GAAP reconciliation $288 $285 $55 $54 $48 $46 $98 $95 $489 $480 FY 2019 FY 2020 $114 $8 $1 $1 $5 $129 ($10) $3 ($4) $118 3Q20 Incentives Professional Fees Community Support All Other 4Q20 Incentives Seasonal Payroll All Other Projected 1Q21 Adjusted Noninterest Expense1
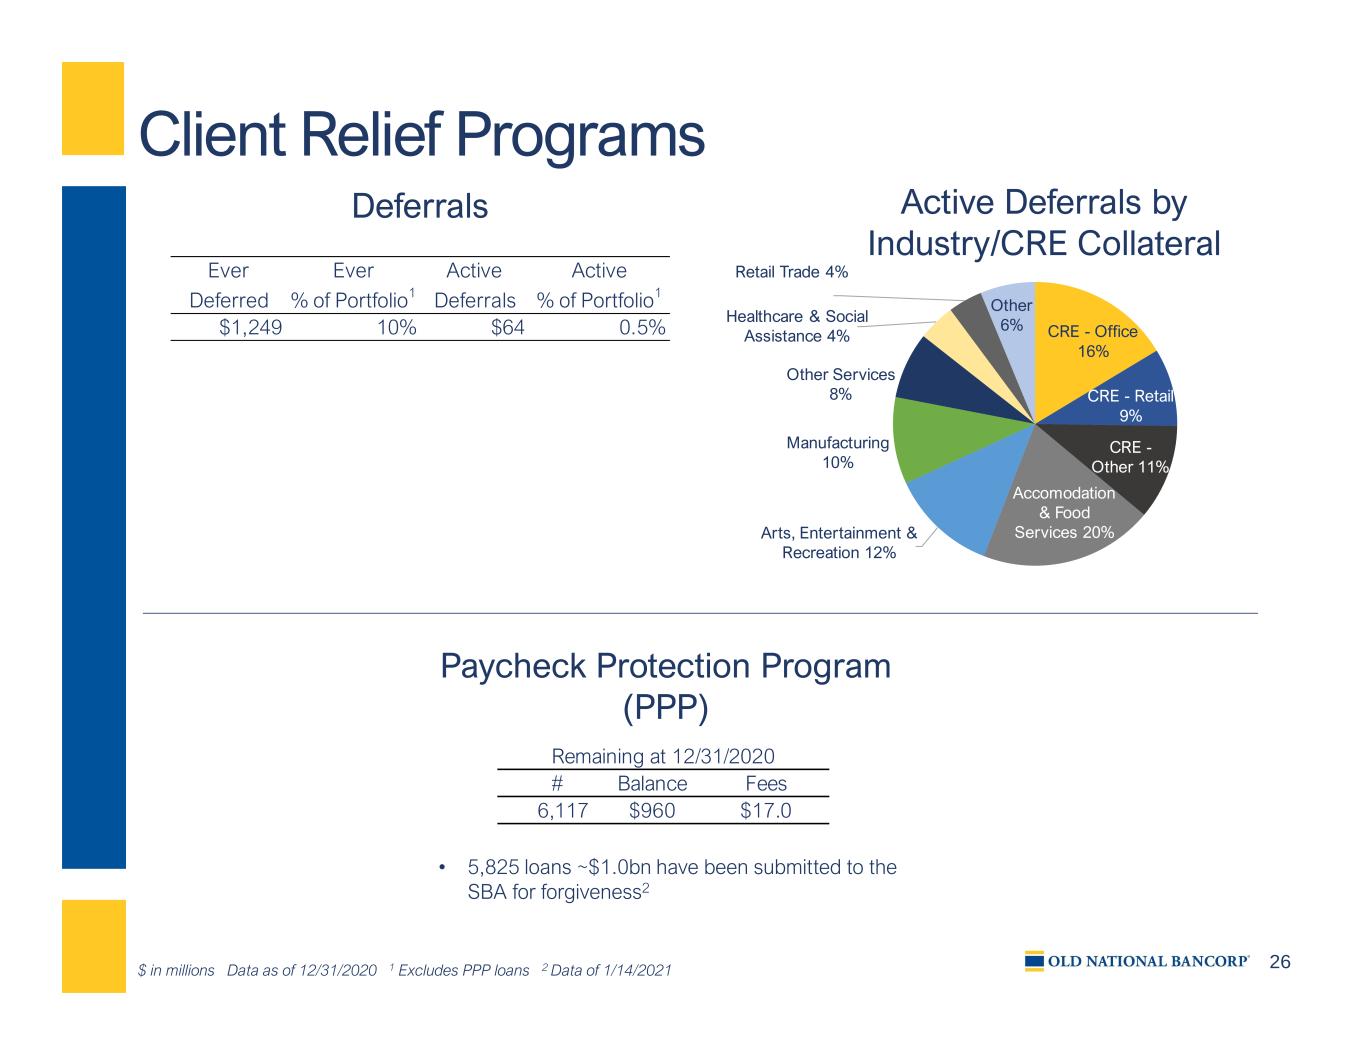
26 Client Relief Programs Paycheck Protection Program (PPP) Deferrals $ in millions Data as of 12/31/2020 1 Excludes PPP loans 2 Data of 1/14/2021 Active Deferrals by Industry/CRE Collateral CRE - Office 16% CRE - Retail 9% CRE - Other 11% Accomodation & Food Services 20%Arts, Entertainment & Recreation 12% Manufacturing 10% Other Services 8% Healthcare & Social Assistance 4% Retail Trade 4% Other 6% Remaining at 12/31/2020 # Balance Fees 6,117 $960 $17.0 • 5,825 loans ~$1.0bn have been submitted to the SBA for forgiveness2 Ever Ever Active Active Deferred % of Portfolio1 Deferrals % of Portfolio1 $1,249 10% $64 0.5%

27 -1.05% 2.32% 1.71% 1.08% 3.86% 18.15% 1.50% -7.50% -2.67% 13.69% 15.78% 16.95% 27.51% 26.53% 28.71% 24.66% 25.02% 2015Y 2016Y 2017Y 2018Y 2019Y 1Q20 2Q20 3Q20 4Q20 Net Charge-offs / NPL's ONB Peer Avg -0.02% 0.04% 0.03% 0.02% 0.05% 0.21% 0.02% -0.09% -0.03% 0.15% 0.17% 0.18% 0.23% 0.20% 0.26% 0.23% 0.22% 2015Y 2016Y 2017Y 2018Y 2019Y 1Q20 2Q20 3Q20 4Q20 Net Charge-offs ONB Peer Avg Credit Quality Peer Group data per S&P Global Market Intelligence as of 9/30/2020- See Appendix for definition of Peer Group 1 2Q20 excludes Hancock Whitney 1 1 0.31% 0.43% 0.38% 0.40% 0.25% 0.27% 0.17% 0.20% 0.15% 0.48% 0.45% 0.50% 0.48% 0.53% 0.56% 0.45% 0.45% 2015Y 2016Y 2017Y 2018Y 2019Y 1Q20 2Q20 3Q20 4Q20 30+ Day Delinquency ONB Peer Avg 2.11% 1.62% 1.30% 1.43% 1.19% 1.16% 1.04% 1.15% 1.20% 0.98% 1.02% 0.96% 0.77% 0.72% 0.85% 0.85% 0.93% 2015Y 2016Y 2017Y 2018Y 2019Y 1Q20 2Q20 3Q20 4Q20 Non-Performing Loans ONB Peer Avg Full year 0.02% Full year 1.80%

28 1-4 Family $2,312 Other Consumer $165 HELOC $556 Indirect $914 Credit Quality Scrutinized Industries Consumer Portfolio1 Average FICO 767 756 783 751 2.1% of total consumer loans are subprime (FICO < 660) 1 Includes loans held for sale $ in millions Data as of 12/31/2020 Scrutinized Industries 7.0% Other Loans 93.0% Excludes PPP Loans % of Industry Balance Total Loans Exposure CRE - Senior Housing $292 2.3% $322 Restaurants $215 1.7% $233 Arts/Entertainment $148 1.1% $180 C&I - Retail $97 0.7% $274 Hotels $91 0.7% $93 Oil/Gas $59 0.5% $126 Total $902 7.0% $1,228

29 Allowance for Credit Losses 1Beginning January 1, 2020, calculation is based on current expected loss methodology Prior to January 1, 2020, calculation was based on incurred loss methodology 2Excludes loans held for sale $ in millions $131.4 ($18.7) $1.5 $17.2 $131.4 Allowance 09/30/2020 Economic Forecast Portfolio Changes Qualitative Factors Allowance 12/31/2020 Allowance for Credit Losses Key Economic Assumptions Other Key Model Inputs • Commercial Asset Quality Ratings • Consumer Credit Bureau Score • Loan To Value • Portfolio segment • Seasoning $55 $106 $128 $131 $131 0.45% 0.86% 0.94% 0.95% 0.95% 1.06% 1.06% 1.02% 2019 1Q20 2Q20 3Q20 4Q20 Allowance to Total Loans1,2 ACL Allowance to Total Loans Allowance to Total Loans (less PPP) Discount on acquired portfolio • $50.6mm remaining as of 12/31/2020 4Q20 1Q21 2021 2022 2023 2024 GDP Change 4.0% 1.6% 4.1% 4.7% 3.2% 2.3% Unemployment Rate 6.7% 6.9% 6.9% 6.0% 4.6% 4.3% BBB Spread/10Y Treasury 2.5% 2.2% 2.2% 2.4% 2.6% 2.6%

30 Outlook COVID-19 will impact performance going forward Category Outlook Commercial Loans Healthy pipeline heading into 2021; remaining PPP runoff expected to be concentrated in the first half of 2021 Net Interest Margin Net interest income should remain stable given expected earning asset growth and reduced funding costs; FTE NIM, excluding accretion income, under pressure from excess liquidity; timing of remaining PPP fees will coincide with timing of loan forgiveness Noninterest Income Mortgage revenue should remain strong but subject to industry trends; strong commercial activity should support capital markets revenue; all other fee lines expected to be stable in the near term Noninterest Expense Noninterest expenses, excluding ONB Way charges and tax credit amortization charges, expected to be ~$118mm in the first quarter Capital and Liquidity Strong capital position validated by internal stress test model; liquidity position remains strong with a low loan to deposit ratio of 81%; confident with ability to out earn our current dividend Tax Rate/Credit Expect 2021 tax credit amortization of $5mm; FY2021 tax rates expected to be ~20% FTE and ~15% GAAP

Appendix
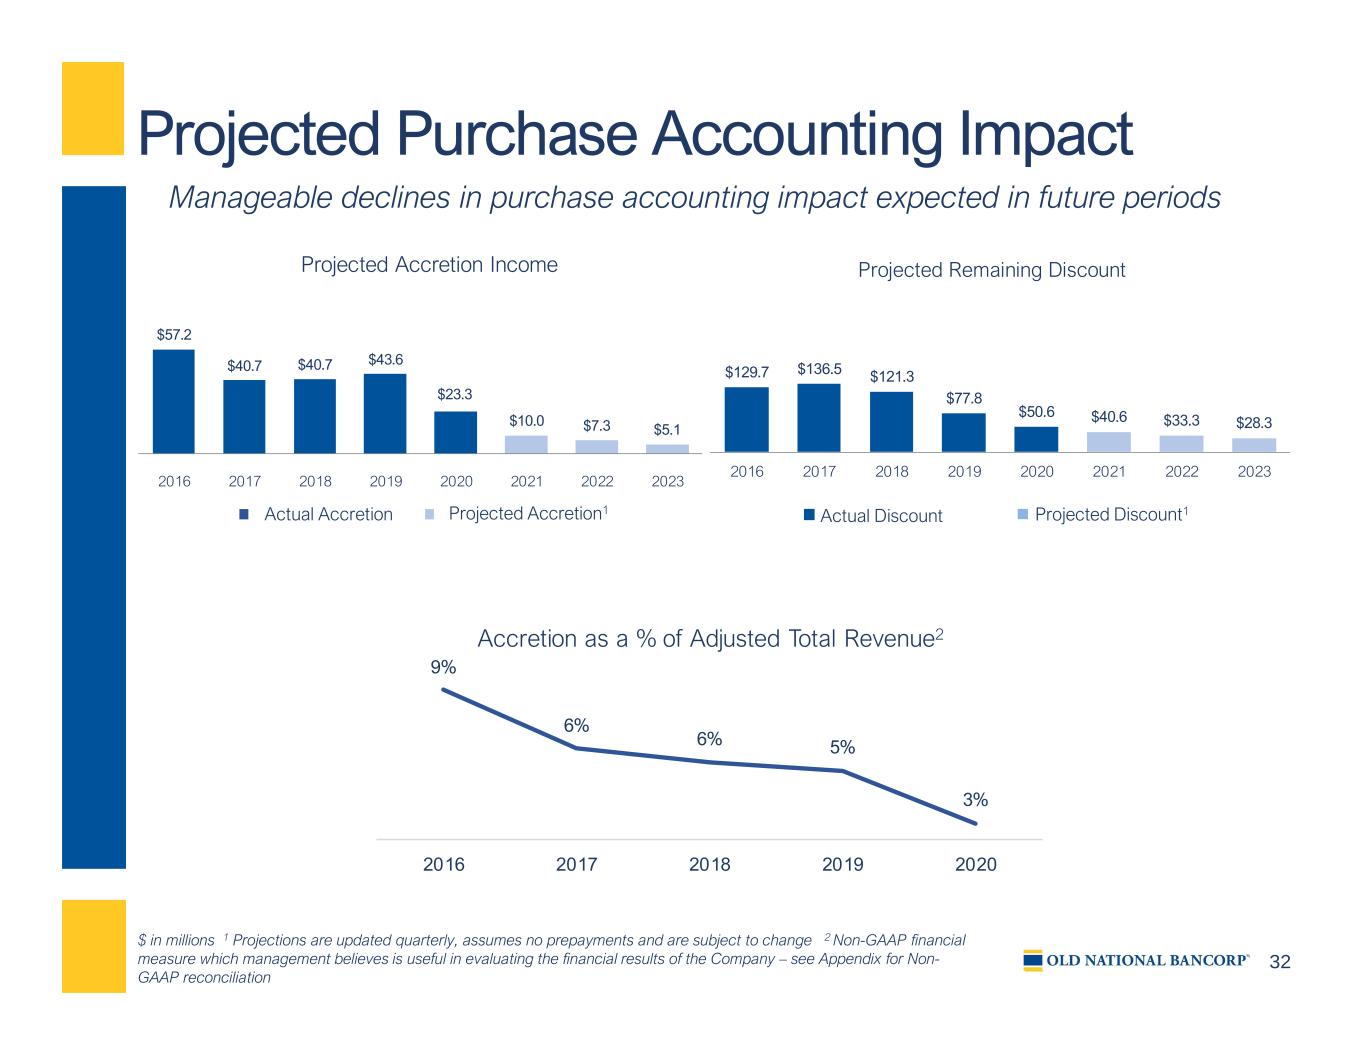
32 Projected Purchase Accounting Impact $ in millions 1 Projections are updated quarterly, assumes no prepayments and are subject to change 2 Non-GAAP financial measure which management believes is useful in evaluating the financial results of the Company – see Appendix for Non- GAAP reconciliation Manageable declines in purchase accounting impact expected in future periods Actual Accretion Projected Accretion1 Actual Discount Projected Discount1 9% 6% 6% 5% 3% 2016 2017 2018 2019 2020 Accretion as a % of Adjusted Total Revenue2 $57.2 $40.7 $40.7 $43.6 $23.3 $10.0 $7.3 $5.1 2016 2017 2018 2019 2020 2021 2022 2023 Projected Accretion Income $129.7 $136.5 $121.3 $77.8 $50.6 $40.6 $33.3 $28.3 2016 2017 2018 2019 2020 2021 2022 2023 Projected Remaining Discount

33 Fixed 57% Variable 38% Floating 5% Noninterest- bearing 33% CDs (Maturing/ Repricing ≤ 1-Year) 5% Other Interest- bearing 62% Year 1&2 NII Impact vs Rates Unchanged +50 bps Parallel Shock -50 bps Parallel Shock $22.8 2.1% $(30.2) -2.8% • 43% of loans are variable/floating-rate1 • $400mm of downrate asset hedges with a weighted average 1-month LIBOR strike of 1.84% • Strong deposit franchise and disciplined pricing • 4Q20 total cost of deposits was 9 bps, improving 4 bps from 3Q20 • $826mm in time deposits scheduled to mature within next 12 months, further reducing costs • Experienced only an 18% deposit beta during the last rate hike cycle • Liquid investment portfolio of $6.1bn • Net unrealized pre-tax gain of $185.2mm • Duration of 4.08 years and estimated NTM cash flows of $1,235mm • $347.5mm of pay-fixed, receive-float interest rate swaps on investment securities Net Interest Income Sensitivity Disciplined balance sheet management and well-positioned to both defend margin against lower rates and benefit from higher rates Interest Rate Risk Position Loan and Deposit Mix Loans1 Deposits Asset Liability Management Position 1 Excludes PPP loans Total interest-bearing deposit beta assumptions in rising interest rate scenarios are approximately 34%. Rates are floored at 0.00% in the -50 bps scenario.

34 Branch Actions • Driving efficiencies through increased branch size and investment in mobile and online banking • Consolidated 103 branches since January 2014 • Increased core deposits per branch by 208% since 2009 • Launched new online and mobile solution January 2016 • Increased mobile user by over 565% • As part of The ONB Way, consolidated 31 branches throughout the footprint in April 2020
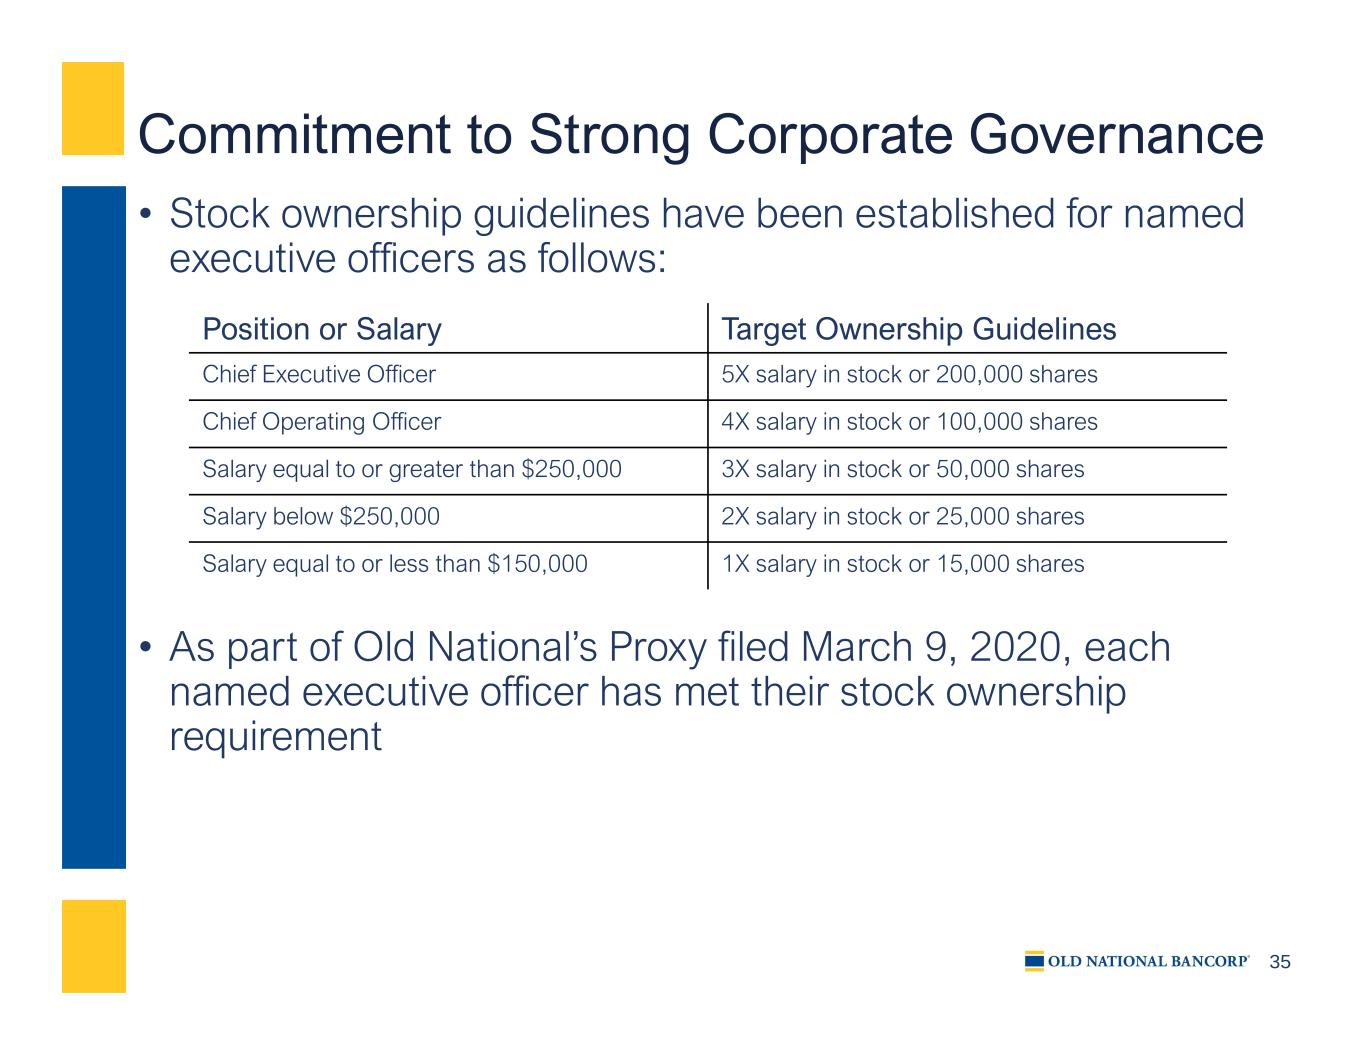
35 Commitment to Strong Corporate Governance • Stock ownership guidelines have been established for named executive officers as follows: • As part of Old National’s Proxy filed March 9, 2020, each named executive officer has met their stock ownership requirement Position or Salary Target Ownership Guidelines Chief Executive Officer 5X salary in stock or 200,000 shares Chief Operating Officer 4X salary in stock or 100,000 shares Salary equal to or greater than $250,000 3X salary in stock or 50,000 shares Salary below $250,000 2X salary in stock or 25,000 shares Salary equal to or less than $150,000 1X salary in stock or 15,000 shares
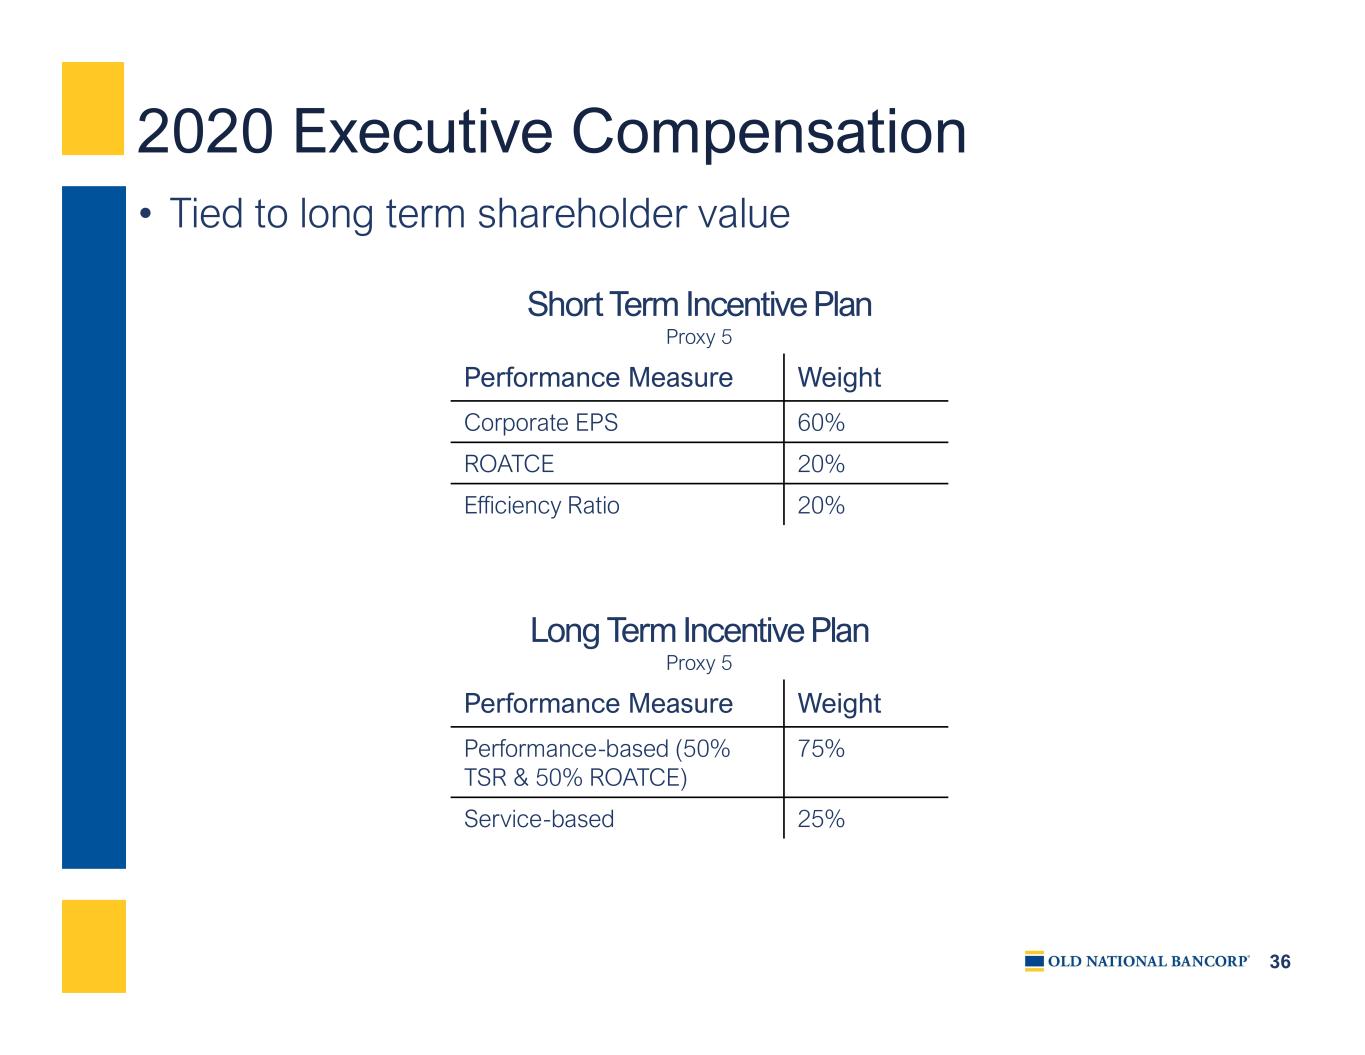
36 2020 Executive Compensation • Tied to long term shareholder value Performance Measure Weight Corporate EPS 60% ROATCE 20% Efficiency Ratio 20% Short Term Incentive Plan Proxy 5 Performance Measure Weight Performance-based (50% TSR & 50% ROATCE) 75% Service-based 25% Long Term Incentive Plan Proxy 5
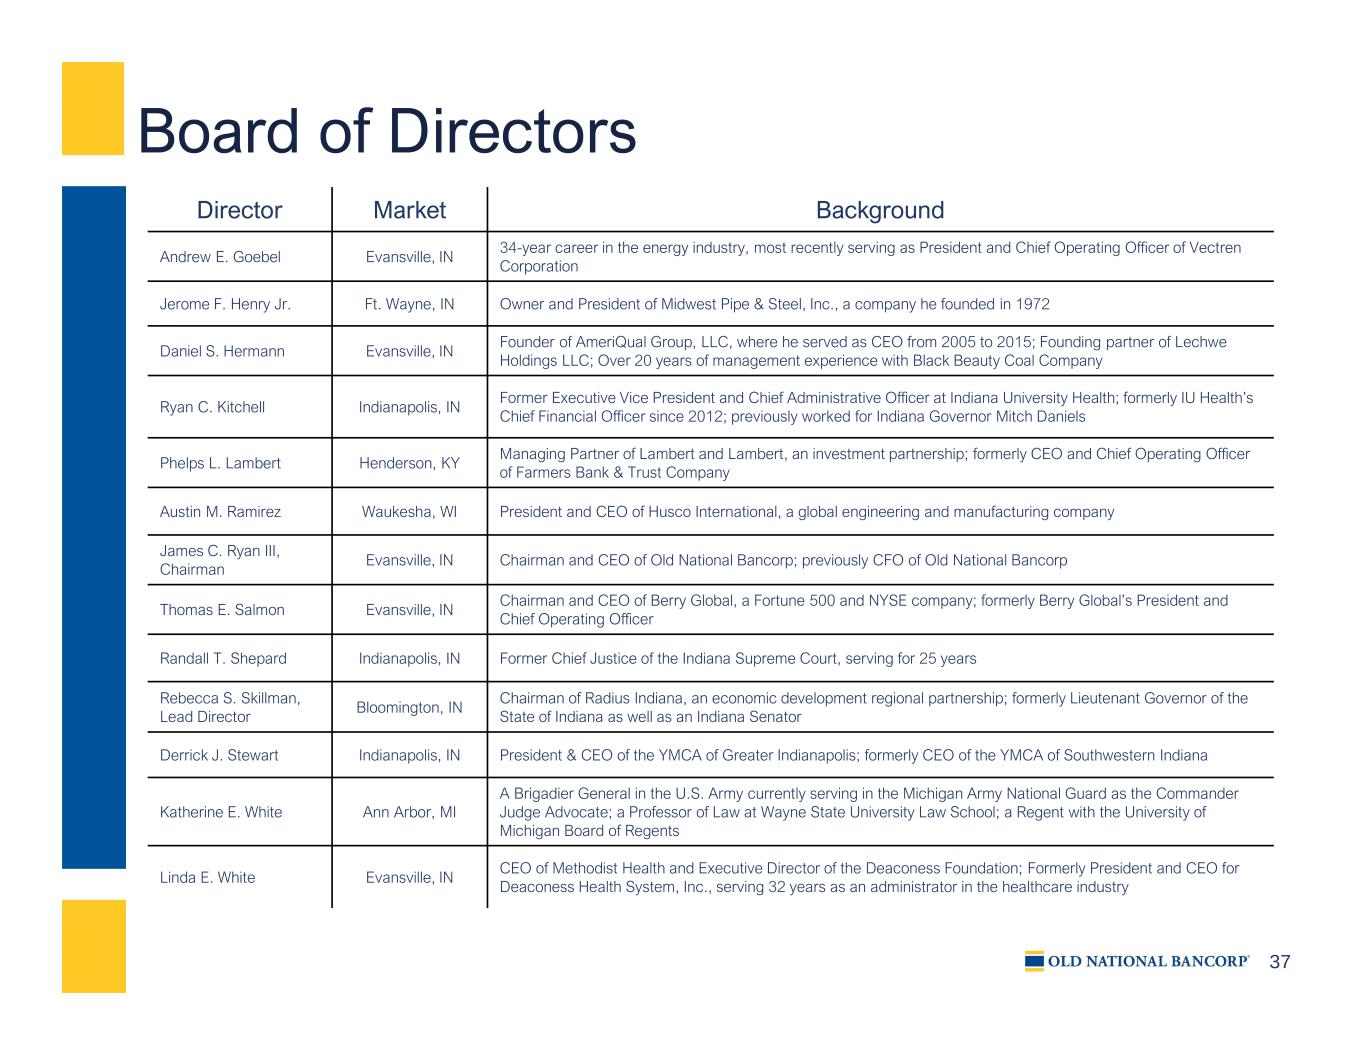
37 Board of Directors Director Market Background Andrew E. Goebel Evansville, IN 34-year career in the energy industry, most recently serving as President and Chief Operating Officer of Vectren Corporation Jerome F. Henry Jr. Ft. Wayne, IN Owner and President of Midwest Pipe & Steel, Inc., a company he founded in 1972 Daniel S. Hermann Evansville, IN Founder of AmeriQual Group, LLC, where he served as CEO from 2005 to 2015; Founding partner of Lechwe Holdings LLC; Over 20 years of management experience with Black Beauty Coal Company Ryan C. Kitchell Indianapolis, IN Former Executive Vice President and Chief Administrative Officer at Indiana University Health; formerly IU Health’s Chief Financial Officer since 2012; previously worked for Indiana Governor Mitch Daniels Phelps L. Lambert Henderson, KY Managing Partner of Lambert and Lambert, an investment partnership; formerly CEO and Chief Operating Officer of Farmers Bank & Trust Company Austin M. Ramirez Waukesha, WI President and CEO of Husco International, a global engineering and manufacturing company James C. Ryan III, Chairman Evansville, IN Chairman and CEO of Old National Bancorp; previously CFO of Old National Bancorp Thomas E. Salmon Evansville, IN Chairman and CEO of Berry Global, a Fortune 500 and NYSE company; formerly Berry Global’s President and Chief Operating Officer Randall T. Shepard Indianapolis, IN Former Chief Justice of the Indiana Supreme Court, serving for 25 years Rebecca S. Skillman, Lead Director Bloomington, IN Chairman of Radius Indiana, an economic development regional partnership; formerly Lieutenant Governor of the State of Indiana as well as an Indiana Senator Derrick J. Stewart Indianapolis, IN President & CEO of the YMCA of Greater Indianapolis; formerly CEO of the YMCA of Southwestern Indiana Katherine E. White Ann Arbor, MI A Brigadier General in the U.S. Army currently serving in the Michigan Army National Guard as the Commander Judge Advocate; a Professor of Law at Wayne State University Law School; a Regent with the University of Michigan Board of Regents Linda E. White Evansville, IN CEO of Methodist Health and Executive Director of the Deaconess Foundation; Formerly President and CEO for Deaconess Health System, Inc., serving 32 years as an administrator in the healthcare industry

38 Non-GAAP Reconciliations $ in millions, except per share data 4Q19 3Q20 4Q20 2020 As Reported: Net Interest Income (FTE) $152.2 $149.0 $164.6 $609.7 Add: Fee Income 47.7 64.7 58.5 239.2 Total Revenue (FTE) $199.9 $213.7 $223.1 $848.9 Less: Provision (1.3) - 1.1 (38.4) Less: Noninterest Expense (134.7) (120.2) (142.3) (541.4) Pre-Tax Income $63.9 $93.5 $81.9 $269.1 Less: Income Taxes (FTE) 14.7 15.6 7.8 42.7 Net Income $49.2 $77.9 $74.1 $226.4 Earnings Per Share $0.29 $0.47 $0.44 $1.36 Adjustments: Less: Debt Securities Gains/Losses ($0.4) ($4.9) ($0.2) ($10.8) Add: Loss on Branch Actions - - (0.1) - Add: ONB Way Charges 8.2 2.9 3.6 42.6 Add: M&A Charges 0.2 - - - Net Total Adjustments $8.0 ($2.0) $3.3 $31.8 Tax Effect on Net Total Adjustments 2.0 (0.5) 0.8 7.9 After-Tax Net Total Adjustments $6.0 ($1.5) $2.5 $23.9 Adjusted Net Income $55.2 $76.4 $76.6 $250.3 Adjusted Earnings Per Diluted Share $0.32 $0.46 $0.46 $1.50 4Q20 Net Income $74.1 Risk-Weighted Assets $15,369.1 Return on Risk-Weighted Assets 1.93%

39 Non-GAAP Reconciliations $ in millions 4Q19 1Q20 2Q20 3Q20 4Q20 2019 2020 As Reported: Net Interest Income (FTE) $152.2 $147.1 $149.0 $149.0 $164.6 $617.2 $609.7 Add: Fee Income 47.7 57.5 58.5 64.7 58.5 199.3 239.2 Total Revenue (FTE) $199.9 $204.6 $207.5 $213.7 $223.1 $816.5 $848.9 Less: Noninterest Expense 134.7 158.7 120.2 120.2 142.3 508.5 541.4 Pre-Provision Net Revenue (PPNR) $65.2 $45.9 $87.3 $93.5 $80.8 $308.0 $307.5- - Revenue Adjustments: Less: Debt Securities Gains/Losses ($0.4) ($5.2) ($0.5) ($4.9) ($0.2) ($1.9) ($10.8) Less: Gain/Loss on Branch Actions - - 0.1 - (0.1) - - Adjusted Total Revenue $199.5 $199.4 $207.1 $208.8 $222.8 $814.6 $838.1 Expense Adjustments: Less: ONB Way Charges ($8.2) ($31.2) ($4.9) ($2.9) ($3.6) ($11.4) ($42.6) Less: M&A Charges (0.2) - - - - (6.0) - Less: Amortization of Tax Credit Investments (0.7) (5.5) (0.3) (3.1) (9.9) (2.7) ($18.8) Adjusted Noninterest Expense $125.6 $122.0 $115.0 $114.2 $128.8 $488.4 $480.0 Adjusted Pre-Provision Net Revenue (PPNR) $73.9 $77.4 $92.1 $94.6 $94.0 $326.2 $358.1 Average assets $20,218.8 $20,366.5 $21,617.8 $22,273.7 $22,864.9 $20,033.4 $21,785.0 Pre-Provision Net Revenue to Average Assets 1.29% 0.90% 1.62% 1.68% 1.41% 1.54% 1.41% Adjusted Pre-Provision Net Revenue to Average Assets 1.46% 1.52% 1.70% 1.70% 1.64% 1.63% 1.64% Accretion Income $9.5 $6.7 $5.8 $5.4 $5.4 $43.6 $23.3 Accretion Income as a % of Total Revenue 4.7% 3.3% 2.8% 2.5% 2.4% 5.3% 2.7% Accretion Income as a % of Adjusted Total Revenue 4.8% 3.4% 2.8% 2.6% 2.4% 5.3% 2.8%
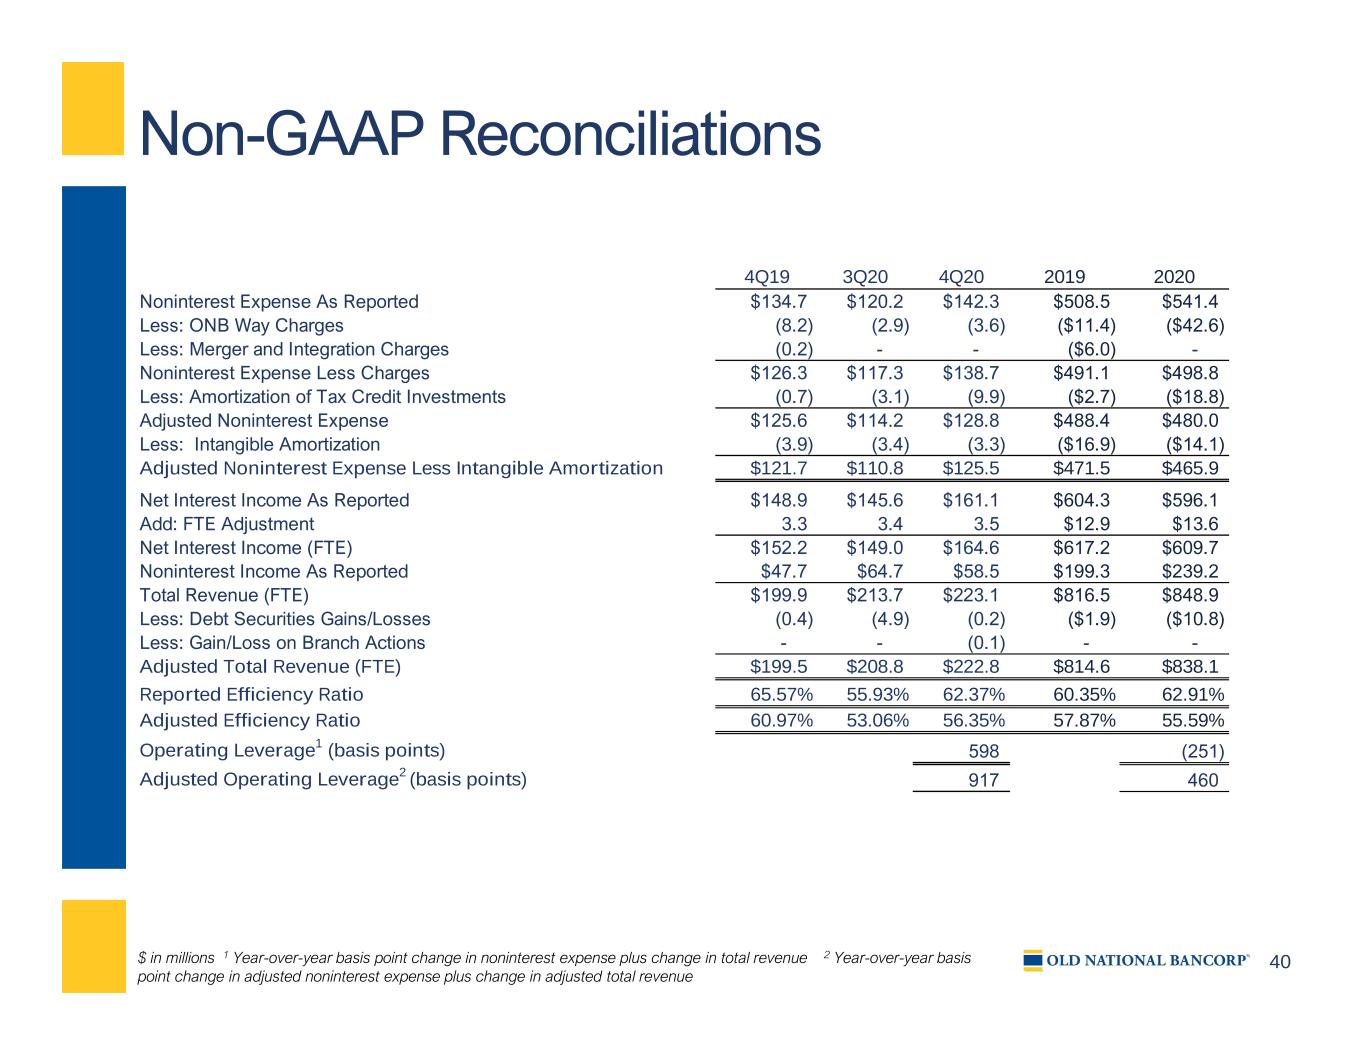
40 Non-GAAP Reconciliations $ in millions 1 Year-over-year basis point change in noninterest expense plus change in total revenue 2 Year-over-year basis point change in adjusted noninterest expense plus change in adjusted total revenue 4Q19 3Q20 4Q20 2019 2020 Noninterest Expense As Reported $134.7 $120.2 $142.3 $508.5 $541.4 Less: ONB Way Charges (8.2) (2.9) (3.6) ($11.4) ($42.6) Less: Merger and Integration Charges (0.2) - - ($6.0) - Noninterest Expense Less Charges $126.3 $117.3 $138.7 $491.1 $498.8 Less: Amortization of Tax Credit Investments (0.7) (3.1) (9.9) ($2.7) ($18.8) Adjusted Noninterest Expense $125.6 $114.2 $128.8 $488.4 $480.0 Less: Intangible Amortization (3.9) (3.4) (3.3) ($16.9) ($14.1) Adjusted Noninterest Expense Less Intangible Amortization $121.7 $110.8 $125.5 $471.5 $465.9 Net Interest Income As Reported $148.9 $145.6 $161.1 $604.3 $596.1 Add: FTE Adjustment 3.3 3.4 3.5 $12.9 $13.6 Net Interest Income (FTE) $152.2 $149.0 $164.6 $617.2 $609.7 Noninterest Income As Reported $47.7 $64.7 $58.5 $199.3 $239.2 Total Revenue (FTE) $199.9 $213.7 $223.1 $816.5 $848.9 Less: Debt Securities Gains/Losses (0.4) (4.9) (0.2) ($1.9) ($10.8) Less: Gain/Loss on Branch Actions - - (0.1) - - Adjusted Total Revenue (FTE) $199.5 $208.8 $222.8 $814.6 $838.1 Reported Efficiency Ratio 65.57% 55.93% 62.37% 60.35% 62.91% Adjusted Efficiency Ratio 60.97% 53.06% 56.35% 57.87% 55.59% Operating Leverage1 (basis points) 598 (251) Adjusted Operating Leverage2 (basis points) 917 460

41 Non-GAAP Reconciliations $ in millions, except per share data 2Q20 3Q20 4Q20 Net Interest Income As Reported $145.6 $145.6 $161.1 FTE Adjustment 3.4 3.4 3.5 Net Interest Income (FTE) $149.0 $149.0 $164.6 Average Earning Assets $19,007.7 $19,654.3 $20,182.0 Net Interest Margin 3.06% 2.96% 3.19% Net Interest Margin (FTE) 3.14% 3.03% 3.26% 4Q19 1Q20 2Q20 3Q20 4Q20 FY 2019 FY 2020 Noninterest Income As Reported $47.7 $57.5 $58.5 $64.7 $58.5 $199.3 $239.2 Less: Debt Securities Gains/Losses (0.4) (5.2) (0.5) (4.9) (0.2) (1.9) (10.8) Less: Gain/Loss on Branch Actions - - 0.1 - (0.1) - - Adjusted Noninterest Income $47.3 $52.3 $58.1 $59.8 $58.2 $197.4 $228.4 4Q19 3Q20 4Q20 Shareholders' Equity As Reported $2,852.5 $2,921.2 $2,972.7 Less: Goodwill and Intangible Assets (1,097.1) (1,086.3) (1,083.0) Tangible Common Shareholders' Equity $1,755.4 $1,834.9 $1,889.7 Common Shares Issued and Outstanding at Period End 169.6 165.3 165.4 Tangible Common Book Value $10.35 $11.10 $11.43 4Q19 3Q20 4Q20 Shareholders' Equity As Reported $2,852.5 $2,921.2 $2,972.7 Less: Goodwill and Intangible Assets (1,097.1) (1,086.3) (1,083.0) Tangible Common Shareholders' Equity $1,755.4 $1,834.9 $1,889.7 Total Assets $20,411.7 $22,460.5 $22,960.6 Less: Goodwill and Intangible Assets (1,097.1) (1,086.3) (1,083.0) Tangible Assets $19,314.6 $21,374.2 $21,877.6 Tangible Equity to Tangible Assets 9.09% 8.58% 8.64% Tangible Common Equity to Tangible Assets 9.09% 8.58% 8.64%

42 Non-GAAP Reconciliations $ in millions 2020 4Q20 Net Income As Reported $226.4 $74.1 Add: Intangible Amortization (net of tax) 10.6 2.4 Tangible Net Income $237.0 $76.5 Less: Securities Gains/Losses (net of tax) (8.1) (0.2) Add: ONB Way Charges (net of tax) 32.0 2.7 Add: Gain/Loss on Branch Action (net of tax) - (0.1) Adjusted Tangible Net Income (Loss) $260.9 $78.9 Average Total Shareholders' Equity As Reported $2,875.5 $2,932.6 Less: Average Goodwill (1,037.0) (1,037.0) Less: Average Intangibles (52.7) (47.5) Average Tangible Shareholders' Equity $1,785.8 $1,848.1 Return on Average Tangible Common Equity 13.27% 16.57% Adjusted Return on Average Tangible Common Equity 14.61% 17.08% 4Q20 Net Income As Reported $74.1 Less: Securities Gains/Losses (net of tax) (0.2) Add: ONB Way Charges (net of tax) 2.7 Adjusted Net Income $76.6 Average Total Assets $22,864.9 Return on Average Assets 1.30% Adjusted Return on Average Assets 1.34%

43 Peer Group Like-size, publicly-traded financial services companies, generally in the Midwest, serving comparable demographics with comparable services as ONB Associated Banc-Corp ASB BancorpSouth Bank BXS Bank OZK OZK Commerce Bancshares, Inc. CBSH Cullen/Frost Bankers, Inc. CFR F.N.B. Corporation FNB First Financial Bancorp. FFBC First Midwest Bancorp, Inc. FMBI Fulton Financial Corporation FULT Great Western Bancorp, Inc. GWB Hancock Whitney Corporation HWC TCF Financial Corporation TCF Trustmark Corporation TRMK UMB Financial Corporation UMBF Valley National Bancorp VLY Western Alliance Bancorporation WAL Wintrust Financial Corporation WTFC

44 Old National Investor Relations Contact Additional information can be found on the Investor Relations web pages at www.oldnational.com Investor Inquiries: Lynell J. Walton, CPA SVP – Director of Investor Relations 812-464-1366 lynell.walton@oldnational.com
