Attached files
| file | filename |
|---|---|
| 8-K - 8-K - OCEANFIRST FINANCIAL CORP | ocfc-20210203.htm |

. . . OceanFirst Financial Corp. Investor Presentation February 2021 Exhibit 99.1

. . . Forward Looking Statements In addition to historical information, this presentation contains certain forward-looking statements within the meaning of the Private Securities Litigation Reform Act of 1995 which are based on certain assumptions and describe future plans, strategies and expectations of the Company. These forward-looking statements are generally identified by use of the words “believe,” “expect,” “intend,” “anticipate,” “estimate,” “project,” “will,” “should,” “may,” “view,” “opportunity,” “potential,” or similar expressions or expressions of confidence. The Company’s ability to predict results or the actual effect of future plans or strategies is inherently uncertain. Factors which could have a material adverse effect on the operations of the Company and its subsidiaries include, but are not limited to: changes in interest rates, general economic conditions, public health crises (such as governmental, social and economic effects of the novel coronavirus), levels of unemployment in the Bank’s lending area, real estate market values in the Bank’s lending area, future natural disasters and increases to flood insurance premiums, increased defaults as a result of economic disruptions caused by novel coronavirus, the level of prepayments on loans and mortgage-backed securities, legislative/regulatory changes (particularly with respect to the novel coronavirus), monetary and fiscal policies of the U.S. Government including policies of the U.S. Treasury and the Board of Governors of the Federal Reserve System, the quality or composition of the loan or investment portfolios, demand for loan products, deposit flows, competition, demand for financial services in the Company’s market area, accounting principles and guidelines and the Bank’s ability to successfully integrate acquired operations. These risks and uncertainties are further discussed in the Company’s Annual Report on Form 10-K for the year ended December 31, 2019, under Item 1A - Risk Factors and elsewhere, and subsequent securities filings and should be considered in evaluating forward-looking statements and undue reliance should not be placed on such statements. The Company does not undertake, and specifically disclaims any obligation, to publicly release the result of any revisions which may be made to any forward-looking statements to reflect events or circumstances after the date of such statements or to reflect the occurrence of anticipated or unanticipated events. Annualized, pro forma, projected and estimated numbers are used for illustrative purpose only, are not forecasts and may not reflect actual results. No Offer or Solicitation: The Presentation does not constitute or form part of, and should not be construed as, an offer to sell or issue, or the solicitation of an offer to purchase, subscribe to or acquire, securities of the Company, or an inducement to enter into investment activity in the United States or in any other jurisdiction in which such offer, solicitation, inducement or sale would be unlawful prior to registration, exemption from registration or qualification under the securities laws of such jurisdiction. No part of this Presentation, nor the fact of its distribution, should form the basis of, or be relied on in connection with, any contract or commitment or investment decision whatsoever. I N V E S T O R P R E S E N T A T I O N 2 F E B R U A R Y | 2 0 2 1 . . .

. . . OceanFirst Financial Corp. • NASDAQ: OCFC • Market Cap: $1.10 billion 1 • Bank Holding Company with National Bank Subsidiary • Founded in 1902 • Total Assets of $11.45 billion 2 • 62 Full-Service Branches in New Jersey and Metropolitan New York City I N V E S T O R P R E S E N T A T I O N 3 1 As of January 29, 2021 2 As of December 31, 2020 Headquarters OceanFirst Bank Branches OceanFirst Bank Loan Offices . . . F E B R U A R Y | 2 0 2 1
. . . Investment Thesis – Well Positioned for the Post-COVID-19 Environment • Strength of Assets • Balance sheet de-risked with executed loan sales, resolution of substantially all full forbearance loans, and extinguishment of high-cost borrowings • Organic Growth Including Low-Cost and Durable Deposit Base • Cost of deposits is low at 45 basis points, and is projected to fall • Digital Innovation • Digital products and customer experience on par with national banks and FinTechs, outpacing regional and community banks • Disciplined and Strategic M&A • Acquired attractive and underappreciated assets in exurban markets at favorable prices • Bench Strength • Deep banking, regulatory, M&A, and integration experience • Demonstrated strong pandemic response • Conservative Risk Culture • Commitment to management of credit, interest rate and regulatory/compliance risk • Insider Ownership • Meaningful insider ownership aligned with shareholder interest I N V E S T O R P R E S E N T A T I O N 4 . . . F E B R U A R Y | 2 0 2 1
. . . I N V E S T O R P R E S E N T A T I O N 5 Fourth Quarter 2020 Results Financial Results • Net interest margin of 2.97% • Loan pipeline of $368 million at December 31, 2020 • Total deposit costs decreased by 4 basis points from Q3 to Q4 • Creation of a yield-focused debt and equity portfolio which resulted in $23.6 million of net gains in Q4; $8.1 million more in Q1 2021 • Sold $298.1 million in PPP loans realizing $5.1 million in gains • Extinguished $343.5 million in high- cost borrowings, with an average rate of 1.63% Strategic and Operational Focus • COVID-19 on-going initiatives for employees, customers, and community • Recommit resources to core businesses, loan growth, and customer service • Expand commercial banking team to support more rapid organic growth and deploy excess liquidity • Effective February 1, will restart common share repurchase plan while also considering M&A to improve operating scale . . . F E B R U A R Y | 2 0 2 1
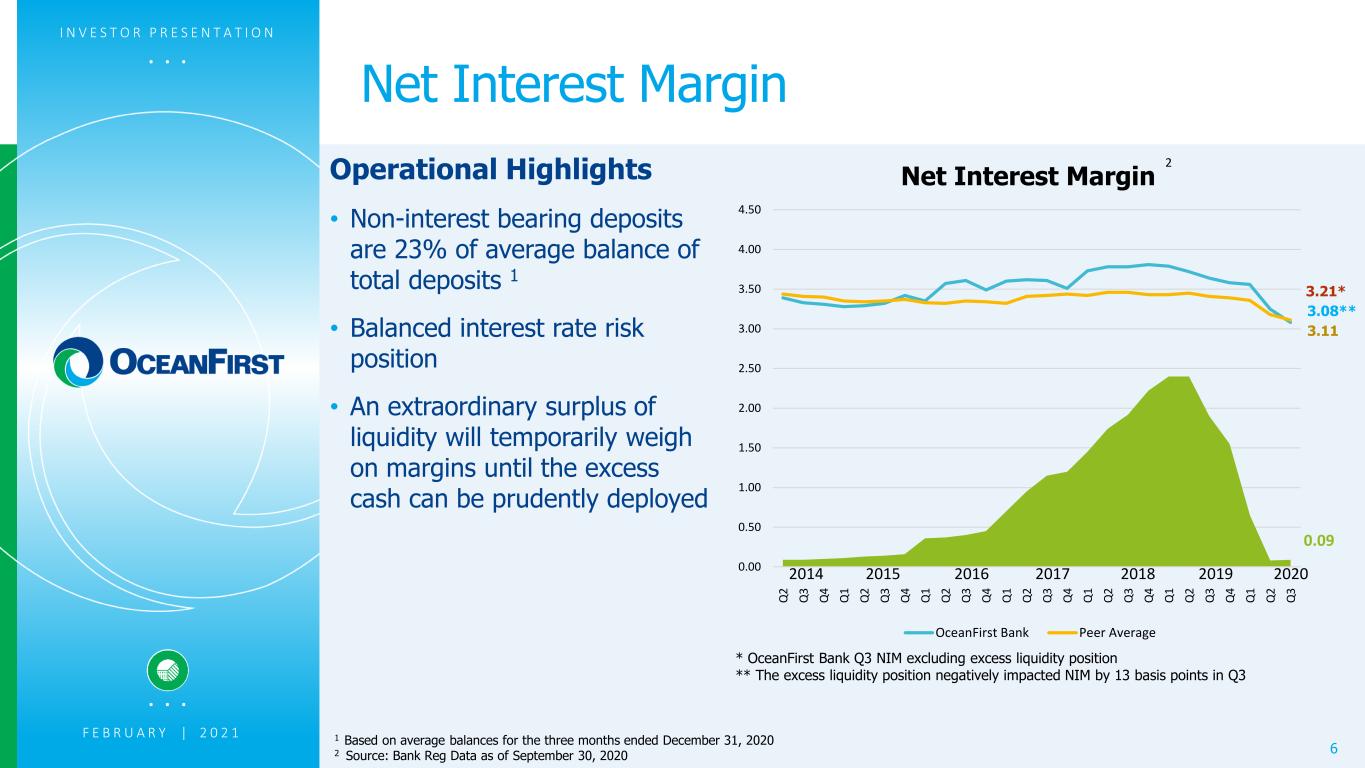
. . . Operational Highlights • Non-interest bearing deposits are 23% of average balance of total deposits 1 • Balanced interest rate risk position • An extraordinary surplus of liquidity will temporarily weigh on margins until the excess cash can be prudently deployed I N V E S T O R P R E S E N T A T I O N 6 Net Interest Margin 2015 2016 2017 2018 2019 2 2014 0.09 2020 1 Based on average balances for the three months ended December 31, 2020 2 Source: Bank Reg Data as of September 30, 2020 F E B R U A R Y | 2 0 2 1 0.00 0.50 1.00 1.50 2.00 2.50 3.00 3.50 4.00 4.50 Q 2 Q 3 Q 4 Q 1 Q 2 Q 3 Q 4 Q 1 Q 2 Q 3 Q 4 Q 1 Q 2 Q 3 Q 4 Q 1 Q 2 Q 3 Q 4 Q 1 Q 2 Q 3 Q 4 Q 1 Q 2 Q 3 Net Interest Margin OceanFirst Bank Peer Average * OceanFirst Bank Q3 NIM excluding excess liquidity position ** The excess liquidity position negatively impacted NIM by 13 basis points in Q3 3.08** 3.21* 3.11 . . .
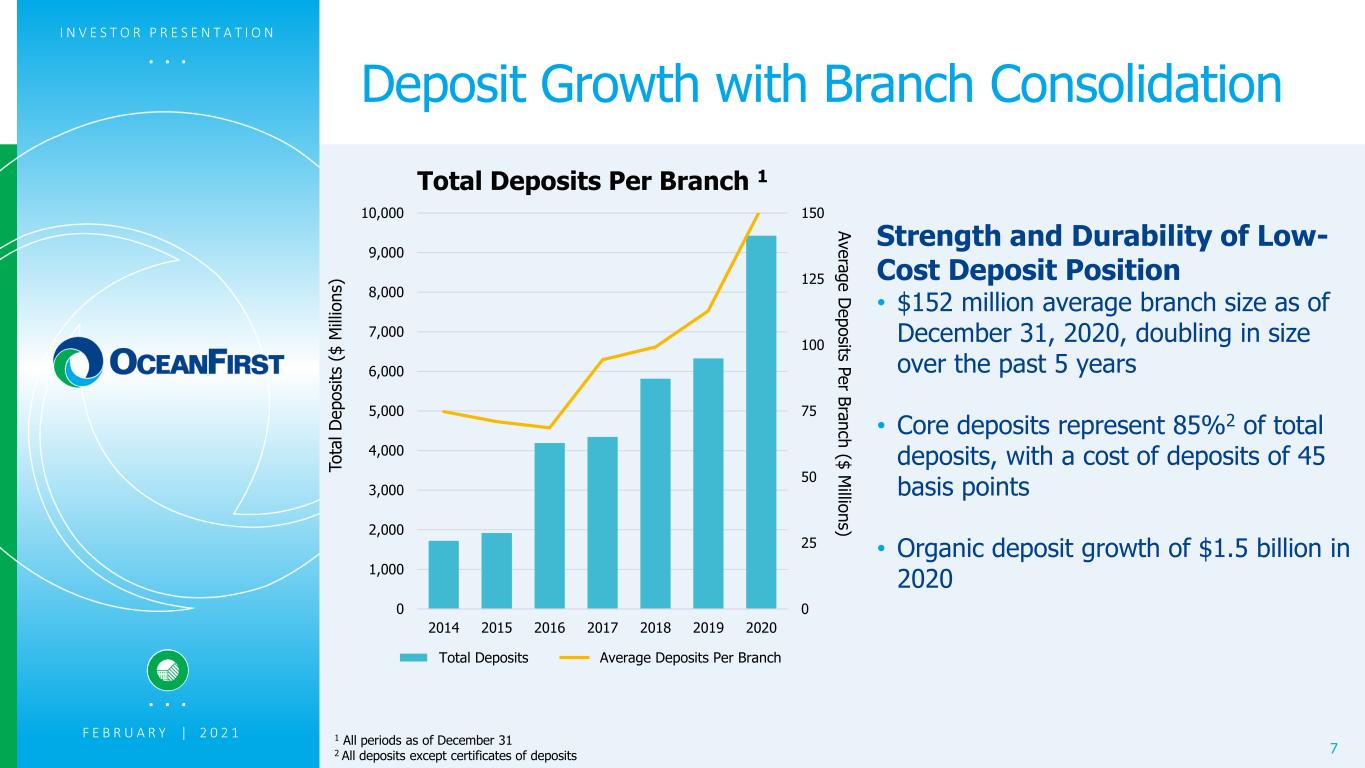
. . . I N V E S T O R P R E S E N T A T I O N 7 Deposit Growth with Branch Consolidation Strength and Durability of Low- Cost Deposit Position • $152 million average branch size as of December 31, 2020, doubling in size over the past 5 years • Core deposits represent 85%2 of total deposits, with a cost of deposits of 45 basis points • Organic deposit growth of $1.5 billion in 2020 1 All periods as of December 31 2 All deposits except certificates of deposits T o ta l D e p o s it s ( $ M il li o n s ) 0 25 50 75 100 125 150 0 1,000 2,000 3,000 4,000 5,000 6,000 7,000 8,000 9,000 10,000 2014 2015 2016 2017 2018 2019 2020 Total Deposits Per Branch 1 Total Deposits Average Deposits Per Branch A v e ra g e D e p o s its P e r B ra n c h ($ M illio n s ) . . . F E B R U A R Y | 2 0 2 1
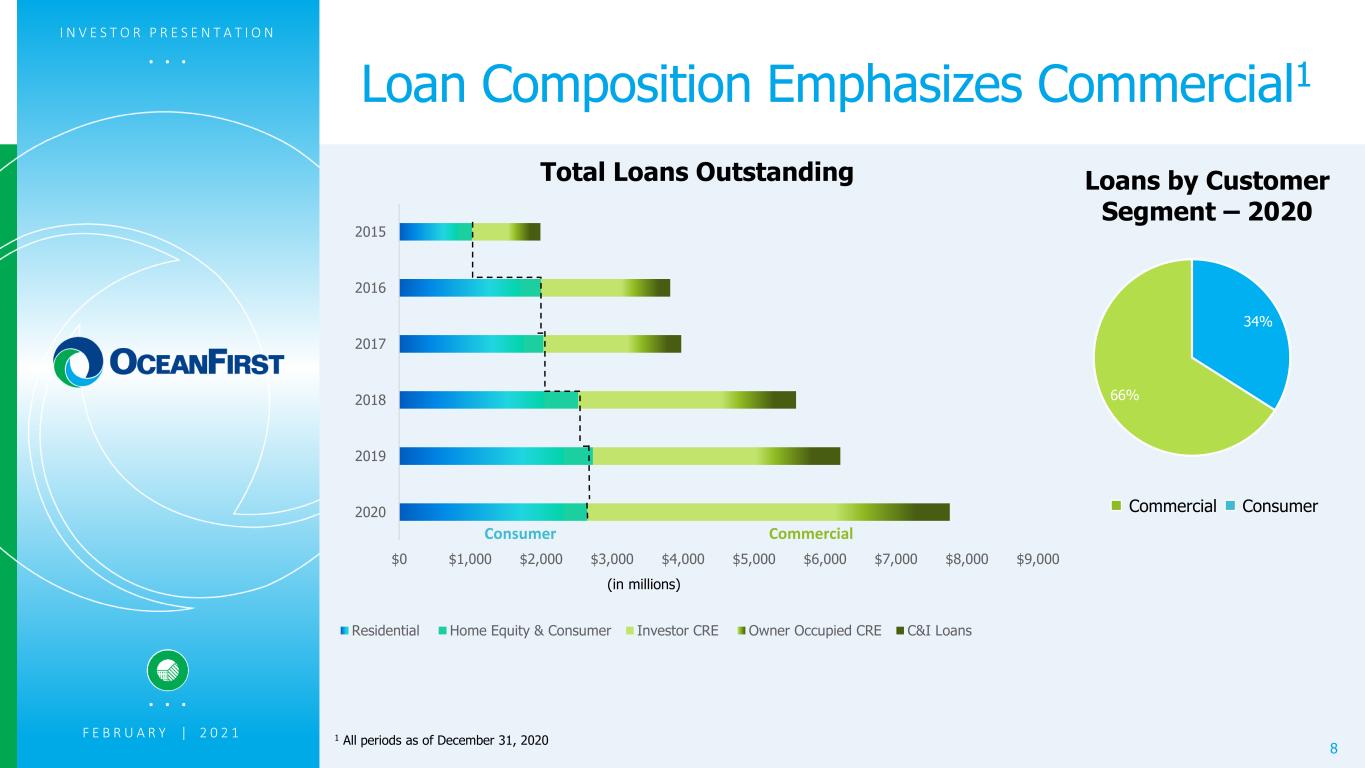
. . . I N V E S T O R P R E S E N T A T I O N 8 Loan Composition Emphasizes Commercial1 . . . 1 All periods as of December 31, 2020 $0 $1,000 $2,000 $3,000 $4,000 $5,000 $6,000 $7,000 $8,000 $9,000 2020 2019 2018 2017 2016 2015 Total Loans Outstanding Residential Home Equity & Consumer Investor CRE Owner Occupied CRE C&I Loans (in millions) 34% 66% Loans by Customer Segment – 2020 ConsumerCommercial Consumer Commercial F E B R U A R Y | 2 0 2 1
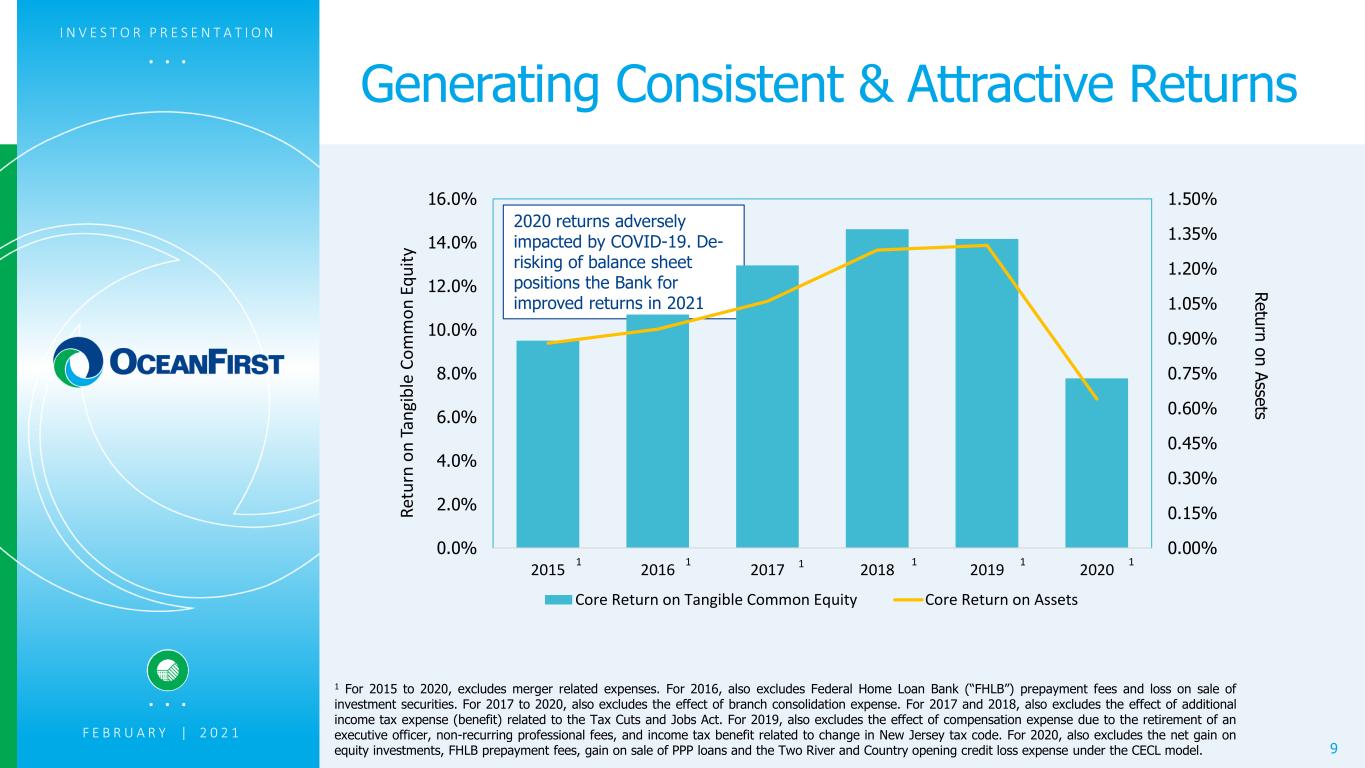
. . . 2020 returns adversely impacted by COVID-19. De- risking of balance sheet positions the Bank for improved returns in 2021 0.00% 0.15% 0.30% 0.45% 0.60% 0.75% 0.90% 1.05% 1.20% 1.35% 1.50% 2015 2016 2017 2018 2019 2020 0.0% 2.0% 4.0% 6.0% 8.0% 10.0% 12.0% 14.0% 16.0% R e tu rn o n T a n g ib le C o m m o n E q u it y Core Return on Tangible Common Equity Core Return on Assets 11 I N V E S T O R P R E S E N T A T I O N 9 Generating Consistent & Attractive Returns 1 For 2015 to 2020, excludes merger related expenses. For 2016, also excludes Federal Home Loan Bank (“FHLB”) prepayment fees and loss on sale of investment securities. For 2017 to 2020, also excludes the effect of branch consolidation expense. For 2017 and 2018, also excludes the effect of additional income tax expense (benefit) related to the Tax Cuts and Jobs Act. For 2019, also excludes the effect of compensation expense due to the retirement of an executive officer, non-recurring professional fees, and income tax benefit related to change in New Jersey tax code. For 2020, also excludes the net gain on equity investments, FHLB prepayment fees, gain on sale of PPP loans and the Two River and Country opening credit loss expense under the CECL model. R e tu rn o n A s s e ts 1 1 1 1 . . . F E B R U A R Y | 2 0 2 1

. . . I N V E S T O R P R E S E N T A T I O N 10 Credit Metrics Reflect Conservative Culture N o n -P e rf o rm in g L o a n s a s P e rc e n t o f T o ta l L o a n s R e ce iv a b le 0.00% 0.10% 0.20% 0.30% 0.40% 0.50% 0.60% 0.70% 0.80% 0.90% 1.00% 2015 2016 2017 2018 2019 2020 Residential Consumer Commercial Real Estate Commercial & Industrial 0.47% 0.91% 0.35% 0.31% 0.52% 0.05% 0.15% 0.10% 0.05%NET CHARGE-OFFS 0.29% 0.02% Non-Performing Loans by Source as a Percent of Loans Receivable 0.24% Excluding net charge-offs of $17.8 million related to higher risk commercial loans and the sale of under-performing residential/consumer loans sold, core net charge-offs are 0.01% of total loans . . . F E B R U A R Y | 2 0 2 1
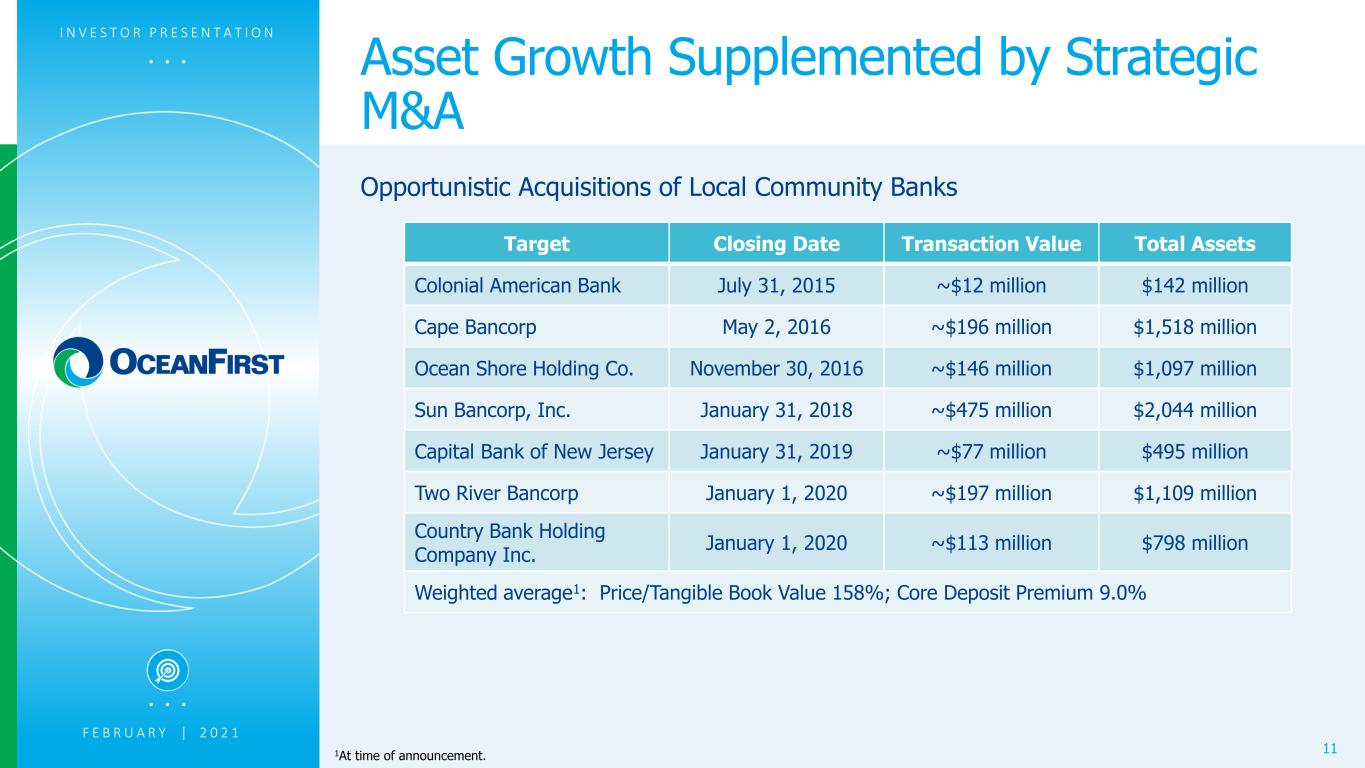
. . . I N V E S T O R P R E S E N T A T I O N 11 Asset Growth Supplemented by Strategic M&A Opportunistic Acquisitions of Local Community Banks Target Closing Date Transaction Value Total Assets Colonial American Bank July 31, 2015 ~$12 million $142 million Cape Bancorp May 2, 2016 ~$196 million $1,518 million Ocean Shore Holding Co. November 30, 2016 ~$146 million $1,097 million Sun Bancorp, Inc. January 31, 2018 ~$475 million $2,044 million Capital Bank of New Jersey January 31, 2019 ~$77 million $495 million Two River Bancorp January 1, 2020 ~$197 million $1,109 million Country Bank Holding Company Inc. January 1, 2020 ~$113 million $798 million Weighted average1: Price/Tangible Book Value 158%; Core Deposit Premium 9.0% 1At time of announcement. . . . F E B R U A R Y | 2 0 2 1
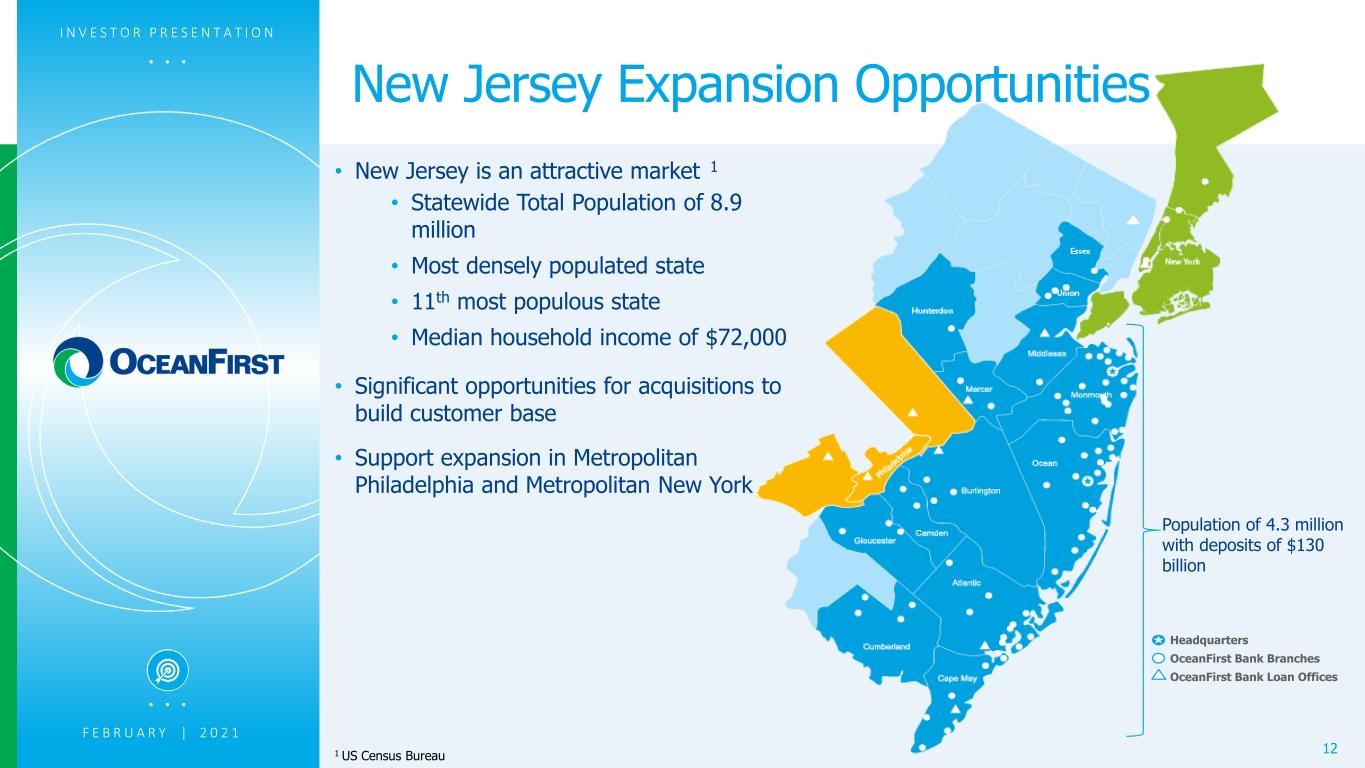
. . . Headquarters OceanFirst Bank Branches OceanFirst Bank Loan Offices I N V E S T O R P R E S E N T A T I O N 12 New Jersey Expansion Opportunities • New Jersey is an attractive market 1 • Statewide Total Population of 8.9 million • Most densely populated state • 11th most populous state • Median household income of $72,000 • Significant opportunities for acquisitions to build customer base • Support expansion in Metropolitan Philadelphia and Metropolitan New York 1 US Census Bureau Population of 4.3 million with deposits of $130 billion . . . F E B R U A R Y | 2 0 2 1
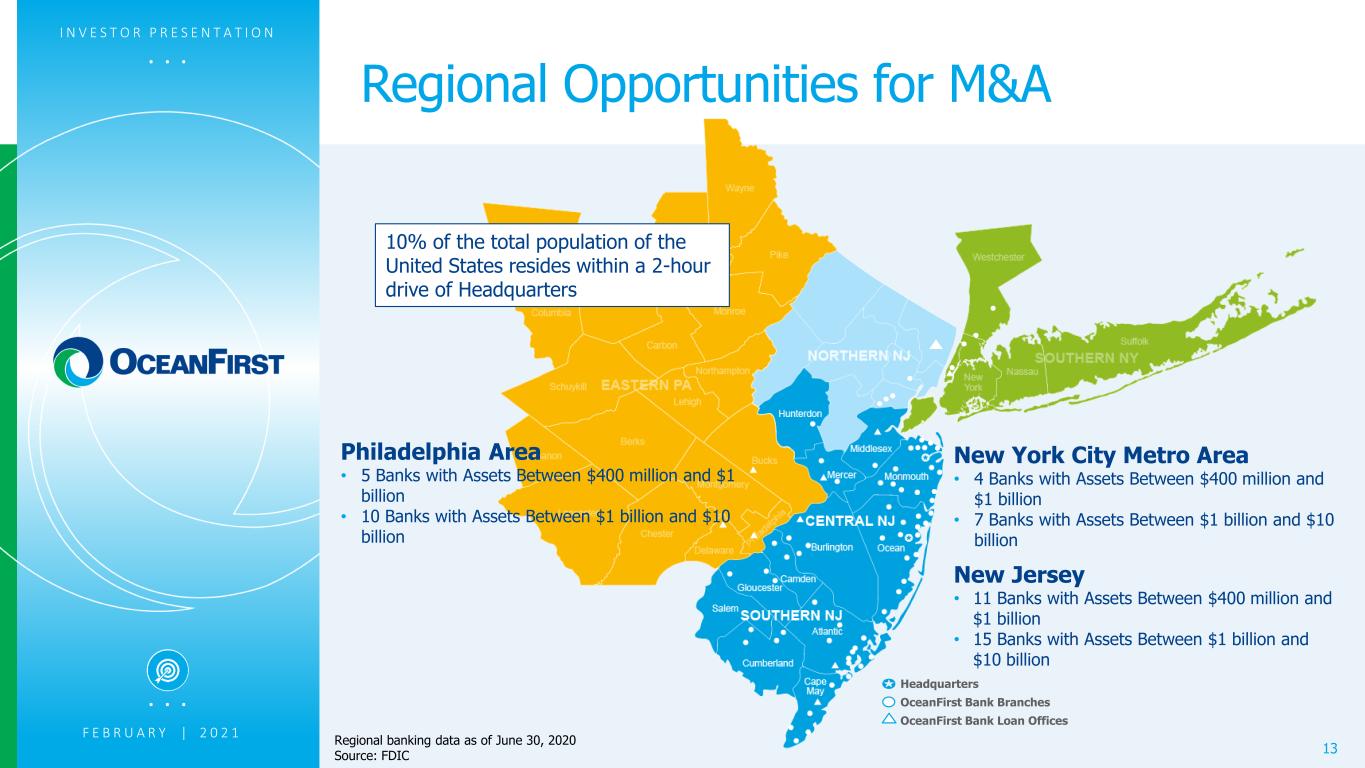
. . . I N V E S T O R P R E S E N T A T I O N 13 Regional Opportunities for M&A Regional banking data as of June 30, 2020 Source: FDIC New York City Metro Area • 4 Banks with Assets Between $400 million and $1 billion • 7 Banks with Assets Between $1 billion and $10 billion New Jersey • 11 Banks with Assets Between $400 million and $1 billion • 15 Banks with Assets Between $1 billion and $10 billion Headquarters OceanFirst Bank Branches OceanFirst Bank Loan Offices Philadelphia Area • 5 Banks with Assets Between $400 million and $1 billion • 10 Banks with Assets Between $1 billion and $10 billion 10% of the total population of the United States resides within a 2-hour drive of Headquarters . . . F E B R U A R Y | 2 0 2 1
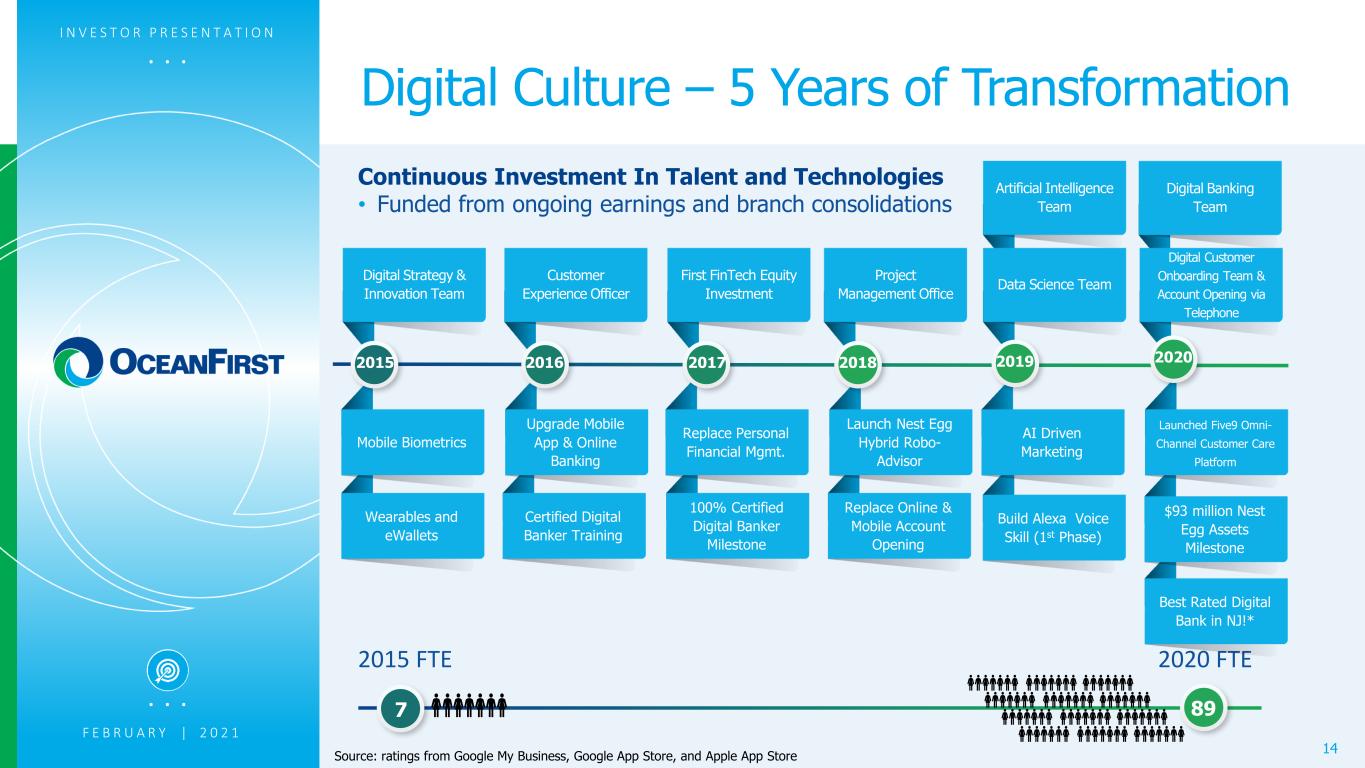
. . . Digital Banking Team Continuous Investment In Talent and Technologies • Funded from ongoing earnings and branch consolidations 2015 FTE 2020 FTE Best Rated Digital Bank in NJ!* Digital Customer Onboarding Team & Account Opening via Telephone $93 million Nest Egg Assets Milestone Artificial Intelligence Team Digital Strategy & Innovation Team Data Science Team Project Management Office First FinTech Equity Investment Customer Experience Officer Build Alexa Voice Skill (1st Phase) Wearables and eWallets Replace Online & Mobile Account Opening AI Driven Marketing 100% Certified Digital Banker Milestone Certified Digital Banker Training Launch Nest Egg Hybrid Robo- Advisor Replace Personal Financial Mgmt. Upgrade Mobile App & Online Banking Mobile Biometrics Digital Culture – 5 Years of Transformation I N V E S T O R P R E S E N T A T I O N 14 20182015 2016 2017 2019 7 89 Launched Five9 Omni- Channel Customer Care Platform 2020 . . . Source: ratings from Google My Business, Google App Store, and Apple App Store F E B R U A R Y | 2 0 2 1
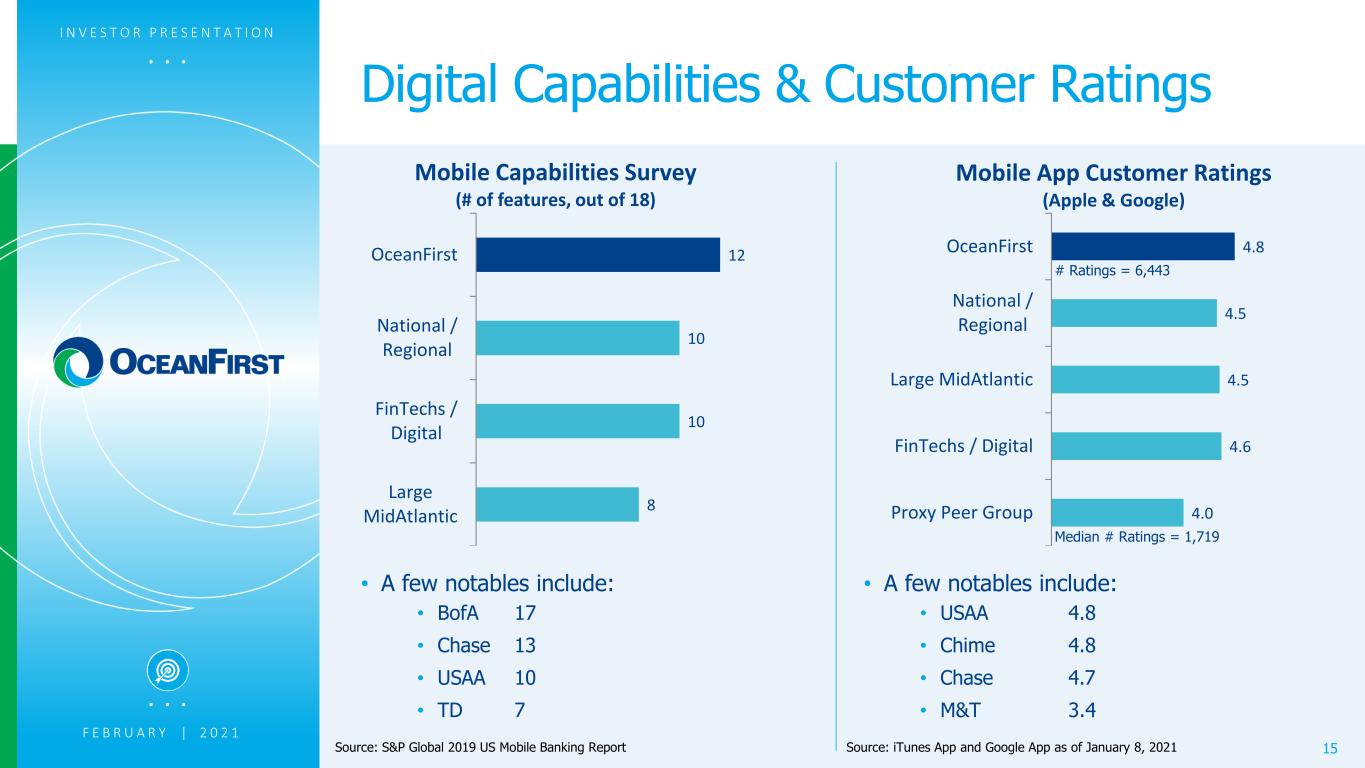
. . . Digital Capabilities & Customer Ratings I N V E S T O R P R E S E N T A T I O N Source: iTunes App and Google App as of January 8, 2021 4.8 4.5 4.5 4.6 4.0 OceanFirst National / Regional Large MidAtlantic FinTechs / Digital Proxy Peer Group Mobile App Customer Ratings (Apple & Google) Source: S&P Global 2019 US Mobile Banking Report 12 10 10 8 OceanFirst National / Regional FinTechs / Digital Large MidAtlantic Mobile Capabilities Survey (# of features, out of 18) • A few notables include: • BofA 17 • Chase 13 • USAA 10 • TD 7 • A few notables include: • USAA 4.8 • Chime 4.8 • Chase 4.7 • M&T 3.4 # Ratings = 6,443 Median # Ratings = 1,719 . . . F E B R U A R Y | 2 0 2 1 15
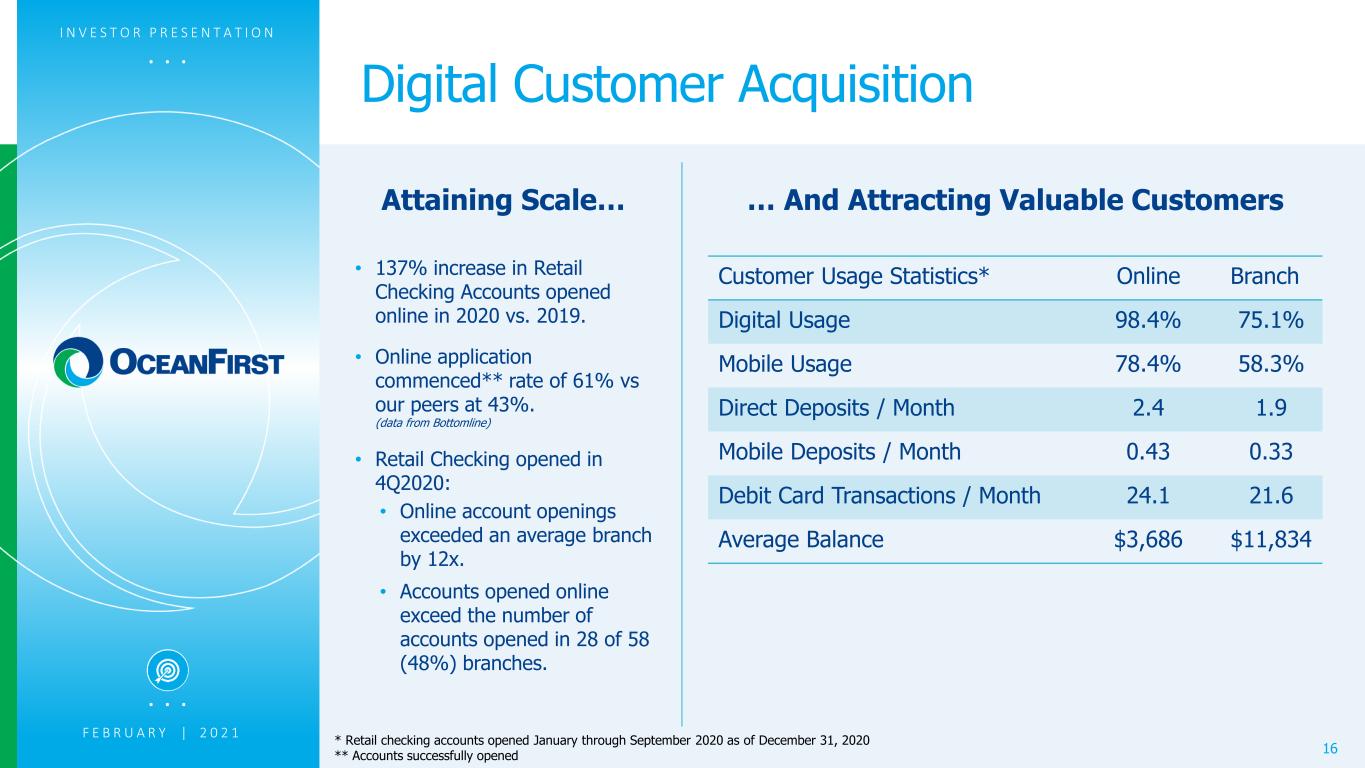
. . . Digital Customer Acquisition I N V E S T O R P R E S E N T A T I O N 16 Attaining Scale… … And Attracting Valuable Customers . . . F E B R U A R Y | 2 0 2 1 Customer Usage Statistics* Online Branch Digital Usage 98.4% 75.1% Mobile Usage 78.4% 58.3% Direct Deposits / Month 2.4 1.9 Mobile Deposits / Month 0.43 0.33 Debit Card Transactions / Month 24.1 21.6 Average Balance $3,686 $11,834 * Retail checking accounts opened January through September 2020 as of December 31, 2020 ** Accounts successfully opened • 137% increase in Retail Checking Accounts opened online in 2020 vs. 2019. • Online application commenced** rate of 61% vs our peers at 43%. (data from Bottomline) • Retail Checking opened in 4Q2020: • Online account openings exceeded an average branch by 12x. • Accounts opened online exceed the number of accounts opened in 28 of 58 (48%) branches.
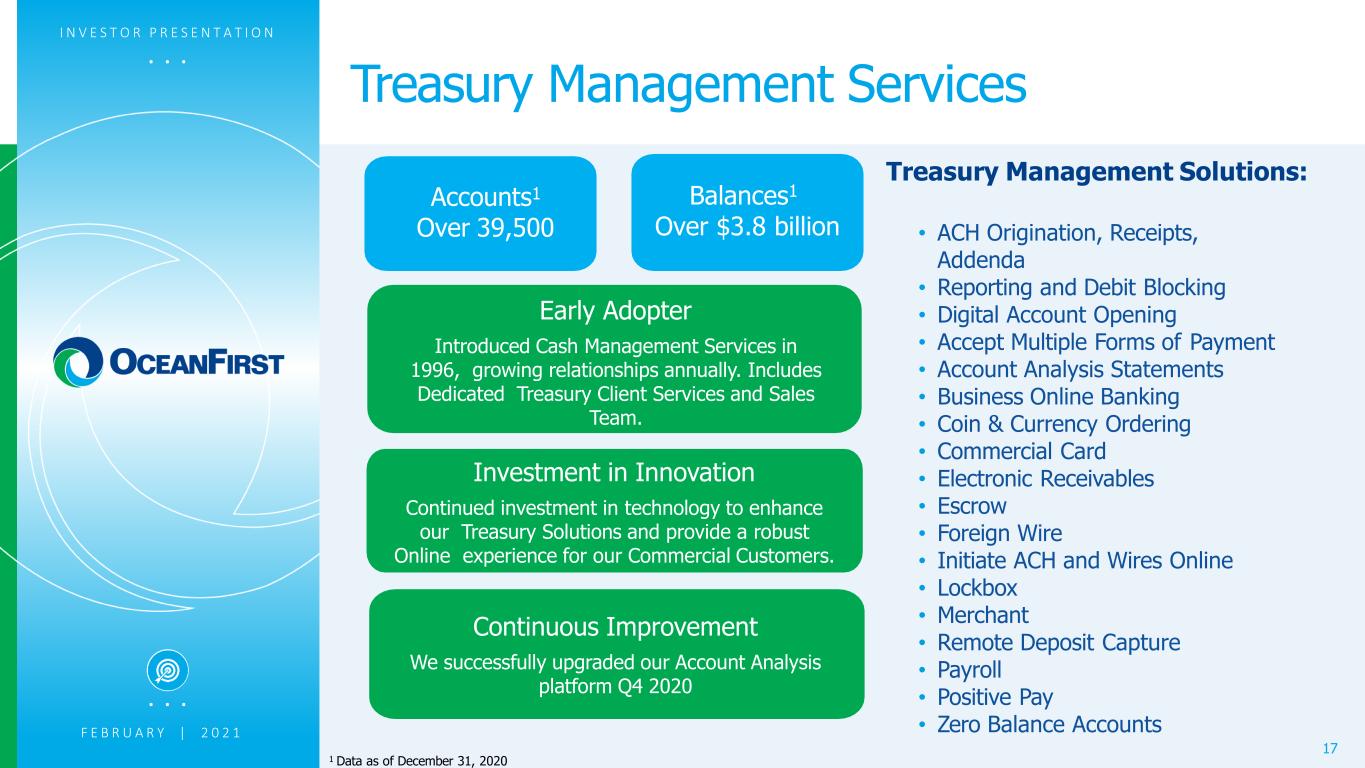
. . . 1 Data as of December 31, 2020 Treasury Management Solutions: • ACH Origination, Receipts, Addenda • Reporting and Debit Blocking • Digital Account Opening • Accept Multiple Forms of Payment • Account Analysis Statements • Business Online Banking • Coin & Currency Ordering • Commercial Card • Electronic Receivables • Escrow • Foreign Wire • Initiate ACH and Wires Online • Lockbox • Merchant • Remote Deposit Capture • Payroll • Positive Pay • Zero Balance Accounts Accounts1 Over 39,500 Early Adopter Introduced Cash Management Services in 1996, growing relationships annually. Includes Dedicated Treasury Client Services and Sales Team. Treasury Management Services I N V E S T O R P R E S E N T A T I O N . . . 17 Balances1 Over $3.8 billion F E B R U A R Y | 2 0 2 1 Investment in Innovation Continued investment in technology to enhance our Treasury Solutions and provide a robust Online experience for our Commercial Customers. Continuous Improvement We successfully upgraded our Account Analysis platform Q4 2020
. . . I N V E S T O R P R E S E N T A T I O N 18 Protecting Our Clients with Cyber Security • Remains current with evolving industry-wide standards • Real-time analytical tools in place for fraud protection and firewall security • Use of top tier, neural-based, real-time debit card fraud analytics • Qualified, certified senior InfoSec personnel, backed up by: • Ongoing significant investments in technology, education and training • Board of Directors with cyber security focus and expertise • Created a security operations center which provides dedicated space to enhance day-to-day operations and includes a central area for key members of the business continuity team to collaborate for maximum effectiveness . . . F E B R U A R Y | 2 0 2 1

. . . I N V E S T O R P R E S E N T A T I O N 19 Strategic Capital Allocation Generates Shareholder Returns A n n u a l R e tu rn o f C a p it a l ($ M il li o n s ) Total Cash Returned to Shareholders: $222.7 million $0 $5 $10 $15 $20 $25 $30 $35 $40 $45 $50 $55 $60 $65 2014 2015 2016 2017 2018 2019 2020 Returned Capital to Shareholders Cash Dividends Share Repurchases . . . F E B R U A R Y | 2 0 2 1 • Stable & competitive dividend • 96th consecutive quarter • Historical Payout Ratio of 30% to 40% • Repurchased 648,851 shares YTD 2020; over 2 million shares remain available for repurchase • Strategic acquisitions in critical new markets • Share repurchases have recommenced following a COVID- 19 driven pause for most of 2020
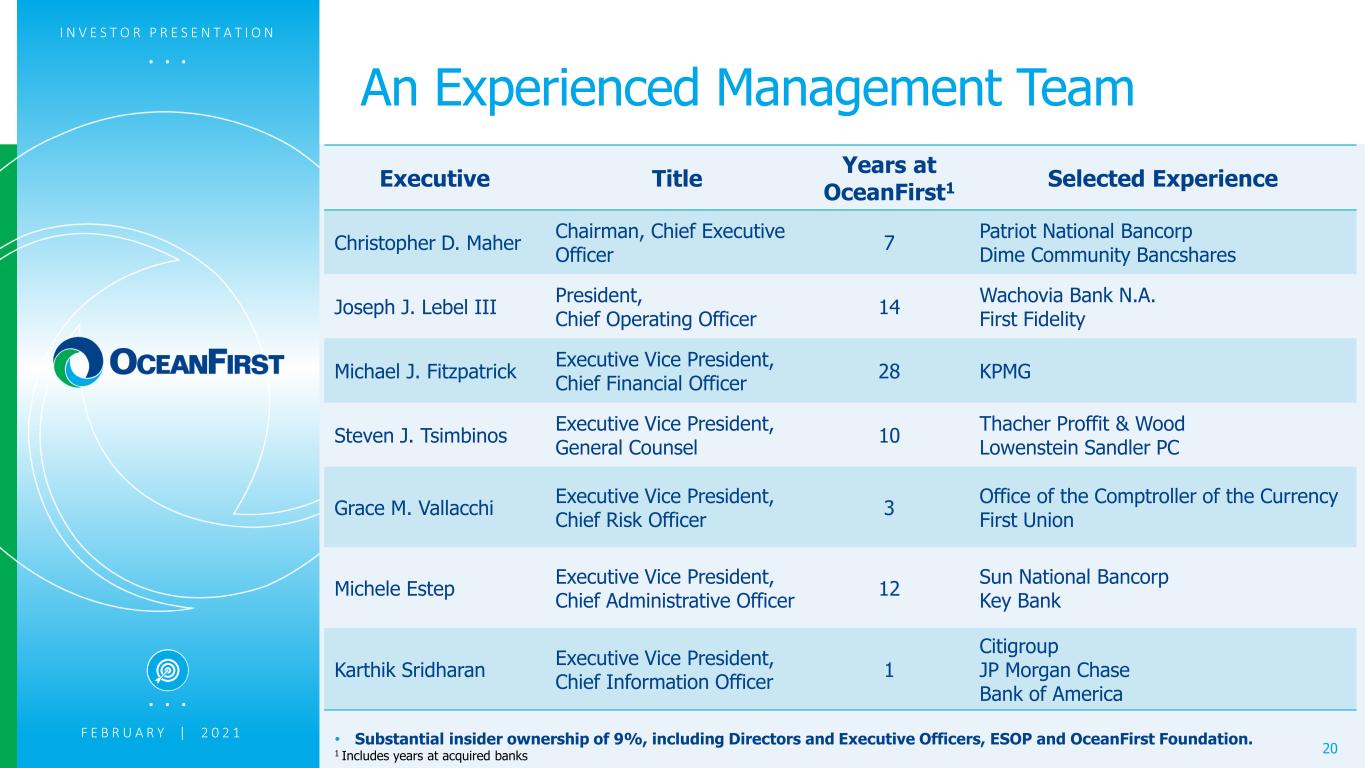
. . . I N V E S T O R P R E S E N T A T I O N 20 An Experienced Management Team Executive Title Years at OceanFirst1 Selected Experience Christopher D. Maher Chairman, Chief Executive Officer 7 Patriot National Bancorp Dime Community Bancshares Joseph J. Lebel III President, Chief Operating Officer 14 Wachovia Bank N.A. First Fidelity Michael J. Fitzpatrick Executive Vice President, Chief Financial Officer 28 KPMG Steven J. Tsimbinos Executive Vice President, General Counsel 10 Thacher Proffit & Wood Lowenstein Sandler PC Grace M. Vallacchi Executive Vice President, Chief Risk Officer 3 Office of the Comptroller of the Currency First Union Michele Estep Executive Vice President, Chief Administrative Officer 12 Sun National Bancorp Key Bank Karthik Sridharan Executive Vice President, Chief Information Officer 1 Citigroup JP Morgan Chase Bank of America • Substantial insider ownership of 9%, including Directors and Executive Officers, ESOP and OceanFirst Foundation. 1 Includes years at acquired banks . . . F E B R U A R Y | 2 0 2 1
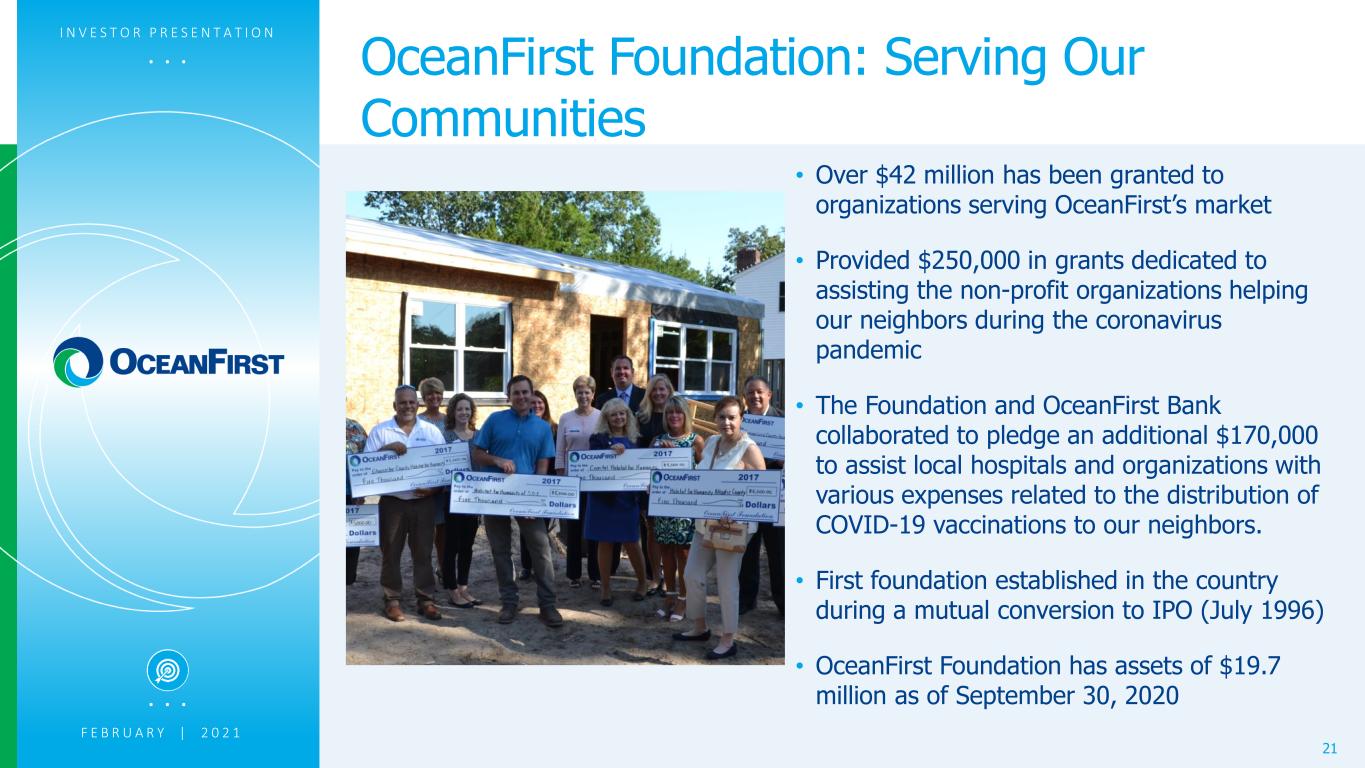
. . . I N V E S T O R P R E S E N T A T I O N 21 OceanFirst Foundation: Serving Our Communities • Over $42 million has been granted to organizations serving OceanFirst’s market • Provided $250,000 in grants dedicated to assisting the non-profit organizations helping our neighbors during the coronavirus pandemic • The Foundation and OceanFirst Bank collaborated to pledge an additional $170,000 to assist local hospitals and organizations with various expenses related to the distribution of COVID-19 vaccinations to our neighbors. • First foundation established in the country during a mutual conversion to IPO (July 1996) • OceanFirst Foundation has assets of $19.7 million as of September 30, 2020. . . F E B R U A R Y | 2 0 2 1
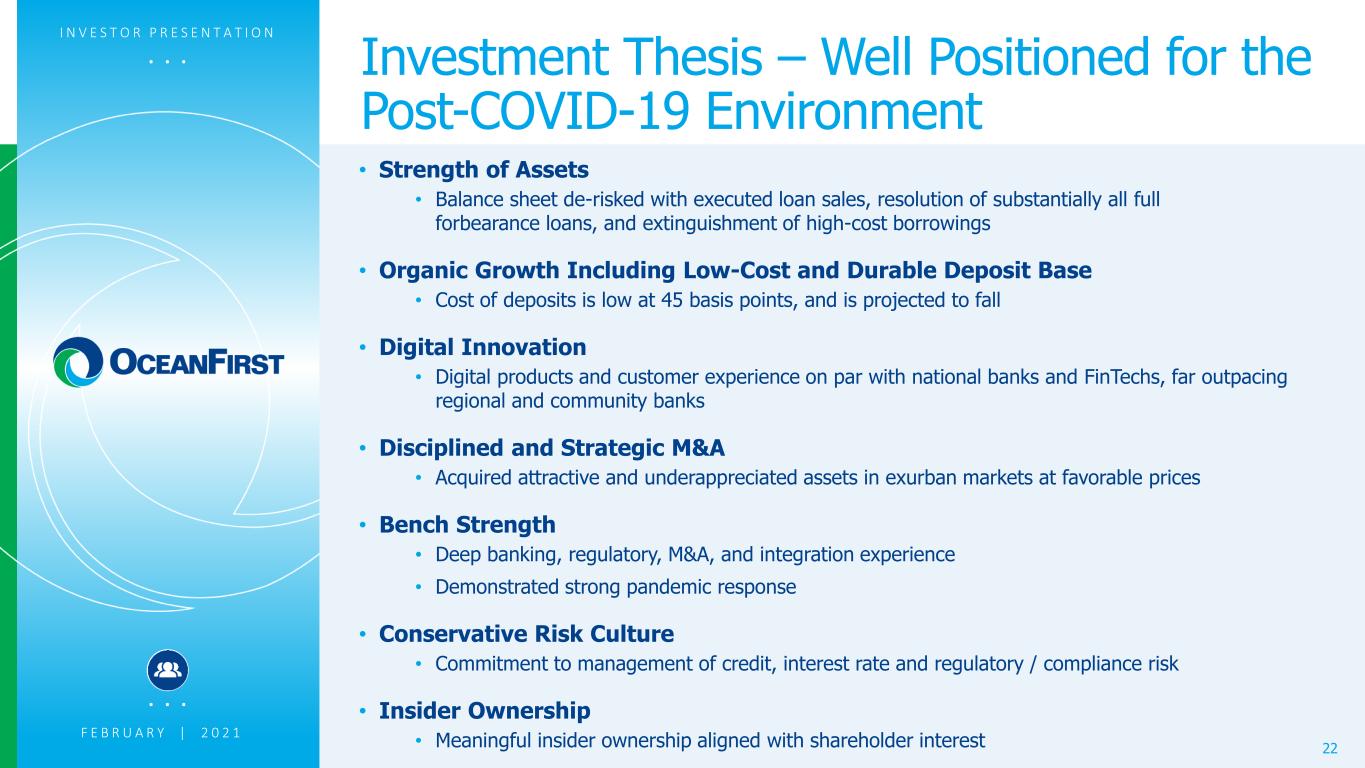
. . . Investment Thesis – Well Positioned for the Post-COVID-19 Environment • Strength of Assets • Balance sheet de-risked with executed loan sales, resolution of substantially all full forbearance loans, and extinguishment of high-cost borrowings • Organic Growth Including Low-Cost and Durable Deposit Base • Cost of deposits is low at 45 basis points, and is projected to fall • Digital Innovation • Digital products and customer experience on par with national banks and FinTechs, far outpacing regional and community banks • Disciplined and Strategic M&A • Acquired attractive and underappreciated assets in exurban markets at favorable prices • Bench Strength • Deep banking, regulatory, M&A, and integration experience • Demonstrated strong pandemic response • Conservative Risk Culture • Commitment to management of credit, interest rate and regulatory / compliance risk • Insider Ownership • Meaningful insider ownership aligned with shareholder interest I N V E S T O R P R E S E N T A T I O N 22 . . . F E B R U A R Y | 2 0 2 1

. . . Investor Relations Inquiries Jill A. Hewitt Senior Vice President, Director of Investor Relations & Corporate Communications jhewitt@oceanfirst.com (732) 240-4500, ext. 7513 23
. . . Appendix 24
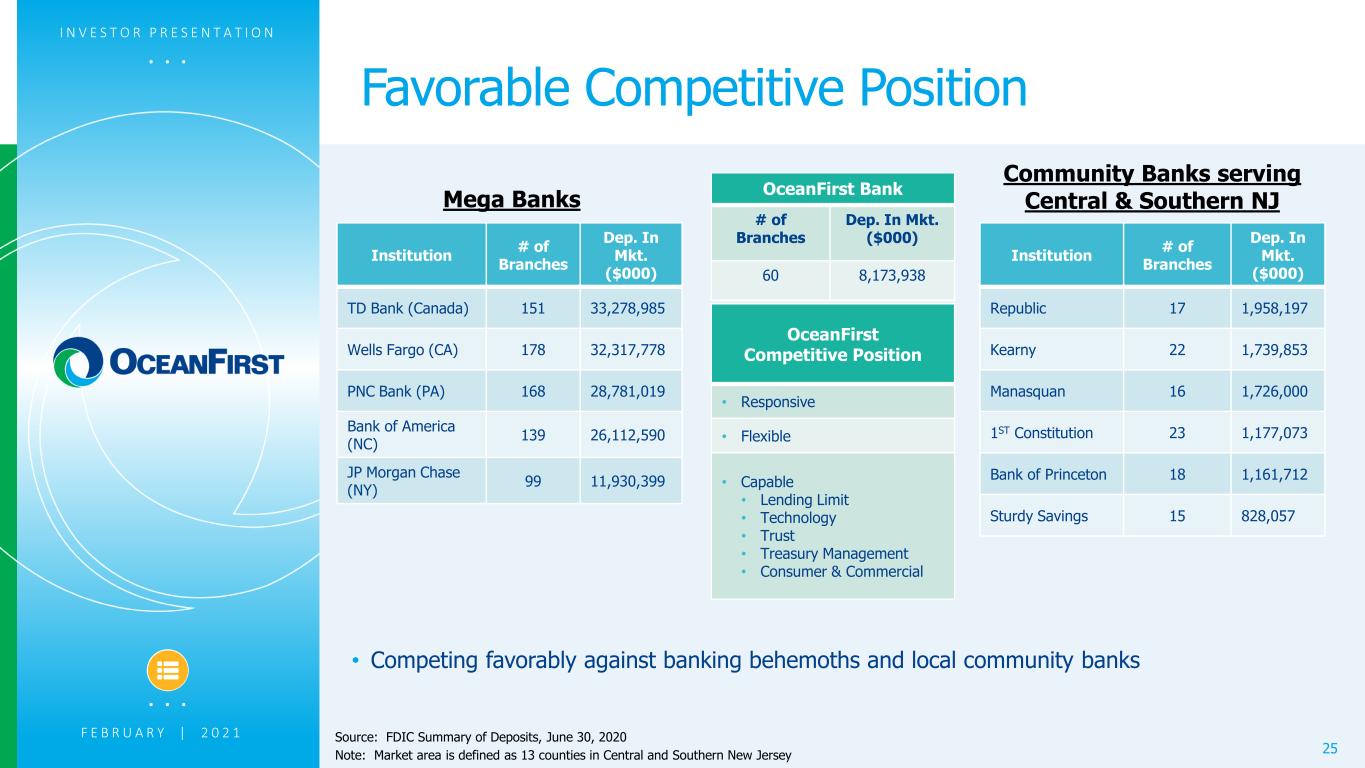
. . . Favorable Competitive Position I N V E S T O R P R E S E N T A T I O N 25 Institution # of Branches Dep. In Mkt. ($000) TD Bank (Canada) 151 33,278,985 Wells Fargo (CA) 178 32,317,778 PNC Bank (PA) 168 28,781,019 Bank of America (NC) 139 26,112,590 JP Morgan Chase (NY) 99 11,930,399 OceanFirst Bank # of Branches Dep. In Mkt. ($000) 60 8,173,938 Institution # of Branches Dep. In Mkt. ($000) Republic 17 1,958,197 Kearny 22 1,739,853 Manasquan 16 1,726,000 1ST Constitution 23 1,177,073 Bank of Princeton 18 1,161,712 Sturdy Savings 15 828,057 OceanFirst Competitive Position • Responsive • Flexible • Capable • Lending Limit • Technology • Trust • Treasury Management • Consumer & Commercial Mega Banks Community Banks serving Central & Southern NJ Source: FDIC Summary of Deposits, June 30, 2020 Note: Market area is defined as 13 counties in Central and Southern New Jersey • Competing favorably against banking behemoths and local community banks . . . F E B R U A R Y | 2 0 2 1
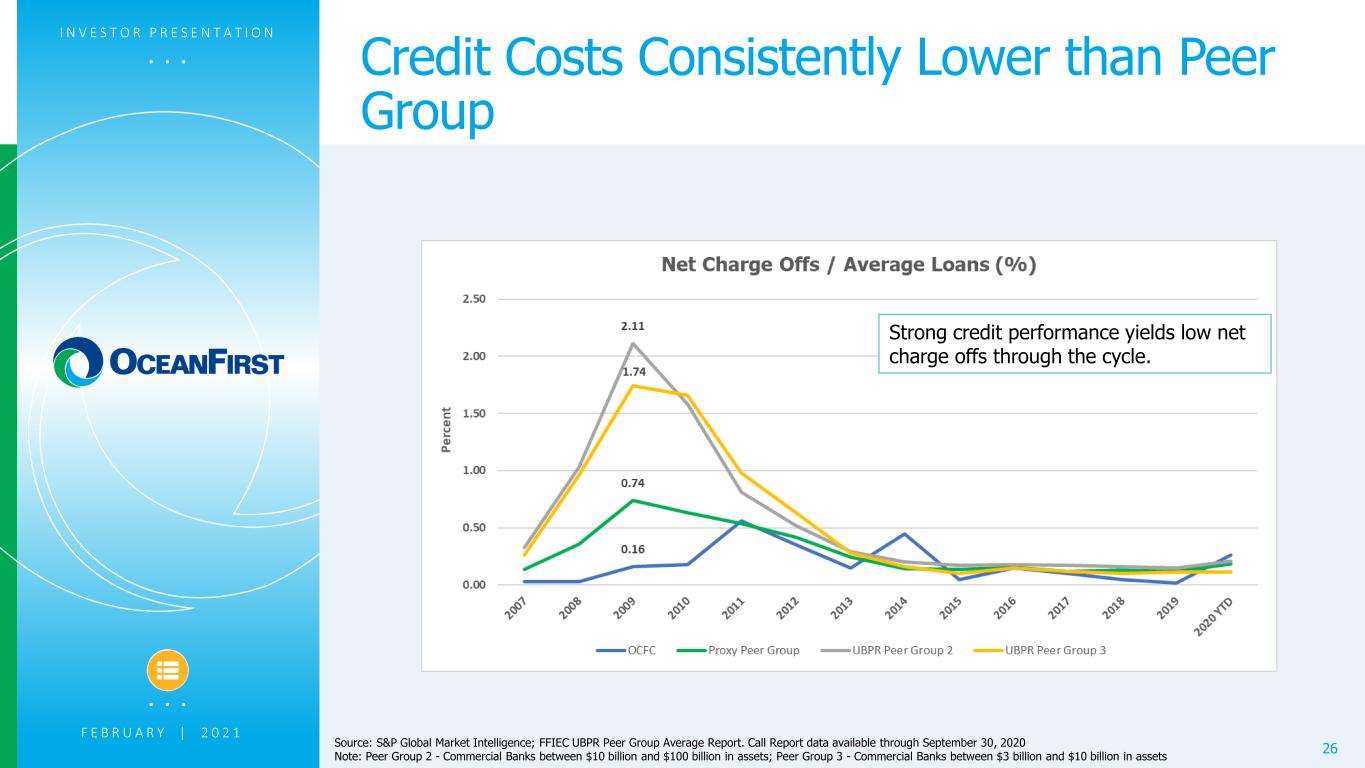
. . . Credit Costs Consistently Lower than Peer Group I N V E S T O R P R E S E N T A T I O N 26 Strong credit performance yields low net charge offs through the cycle. . . . Source: S&P Global Market Intelligence; FFIEC UBPR Peer Group Average Report. Call Report data available through September 30, 2020 Note: Peer Group 2 - Commercial Banks between $10 billion and $100 billion in assets; Peer Group 3 - Commercial Banks between $3 billion and $10 billion in assets F E B R U A R Y | 2 0 2 1
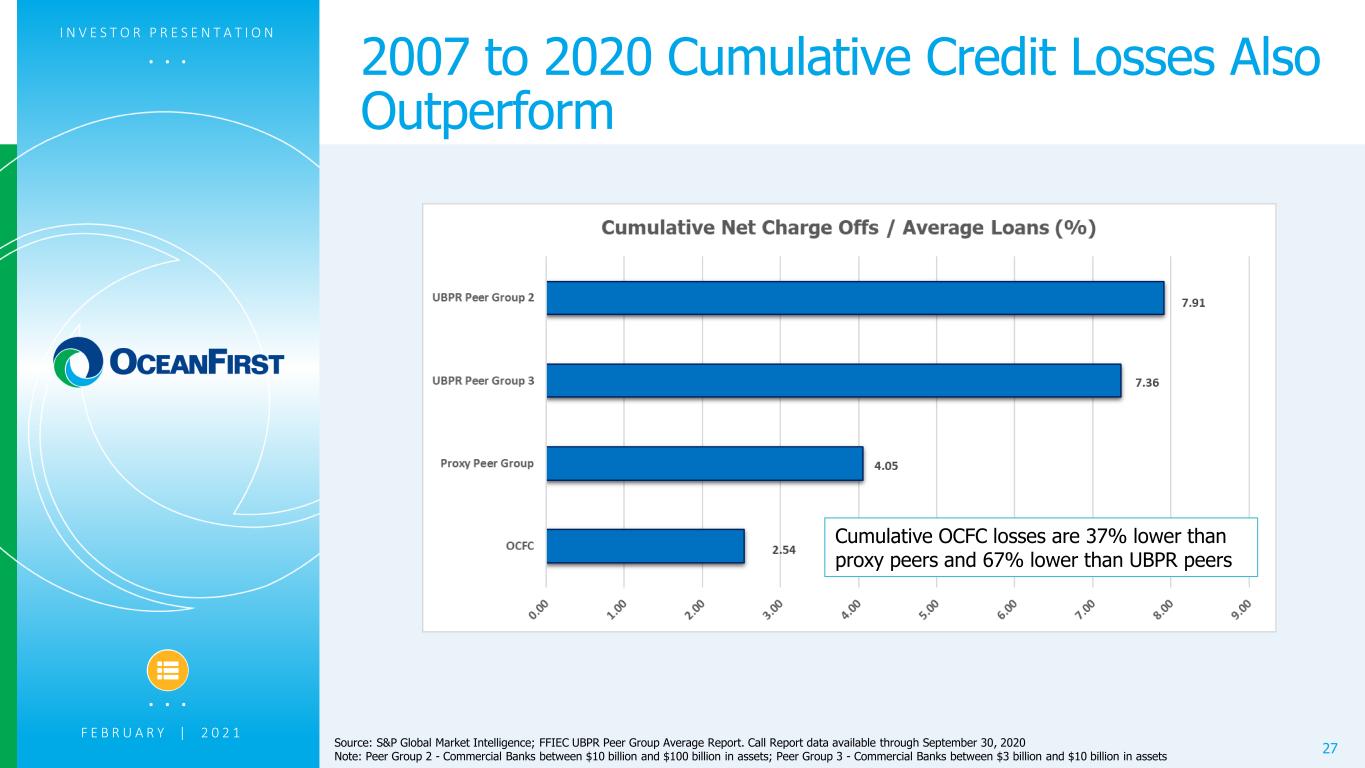
. . . 2007 to 2020 Cumulative Credit Losses Also Outperform I N V E S T O R P R E S E N T A T I O N 27 . . . F E B R U A R Y | 2 0 2 1 Source: S&P Global Market Intelligence; FFIEC UBPR Peer Group Average Report. Call Report data available through September 30, 2020 Note: Peer Group 2 - Commercial Banks between $10 billion and $100 billion in assets; Peer Group 3 - Commercial Banks between $3 billion and $10 billion in assets Cumulative OCFC losses are 37% lower than proxy peers and 67% lower than UBPR peers

. . . 2007 to 2020 Cumulative Losses By Segment I N V E S T O R P R E S E N T A T I O N 28 . . . F E B R U A R Y | 2 0 2 1 Source: S&P Global Market Intelligence; FFIEC UBPR Peer Group Average Report. Call Report data available through September 30, 2020 1 Peer Group 2 - Commercial Banks between $10 billion and $100 billion in assets; Peer Group 3 - Commercial Banks between $3 billion and $10 billion in assets 2 Residential and Consumer losses were driven by subprime loans originated by Columbia Home Loans, LLC, which was a mortgage banking company acquired by OCFC in 2000 and shuttered in 2007. Cumulative Residential losses of 2.09% excludes the estimated loss of 0.74% related to Columbia originated loans Cumulative OCFC losses are 46% lower than UBPR peers. Cumulative OCFC losses are 54% lower than UBPR peers. Cumulative OCFC losses are 37% lower than UBPR peers. Cumulative OCFC losses are 27% lower than UBPR peers.
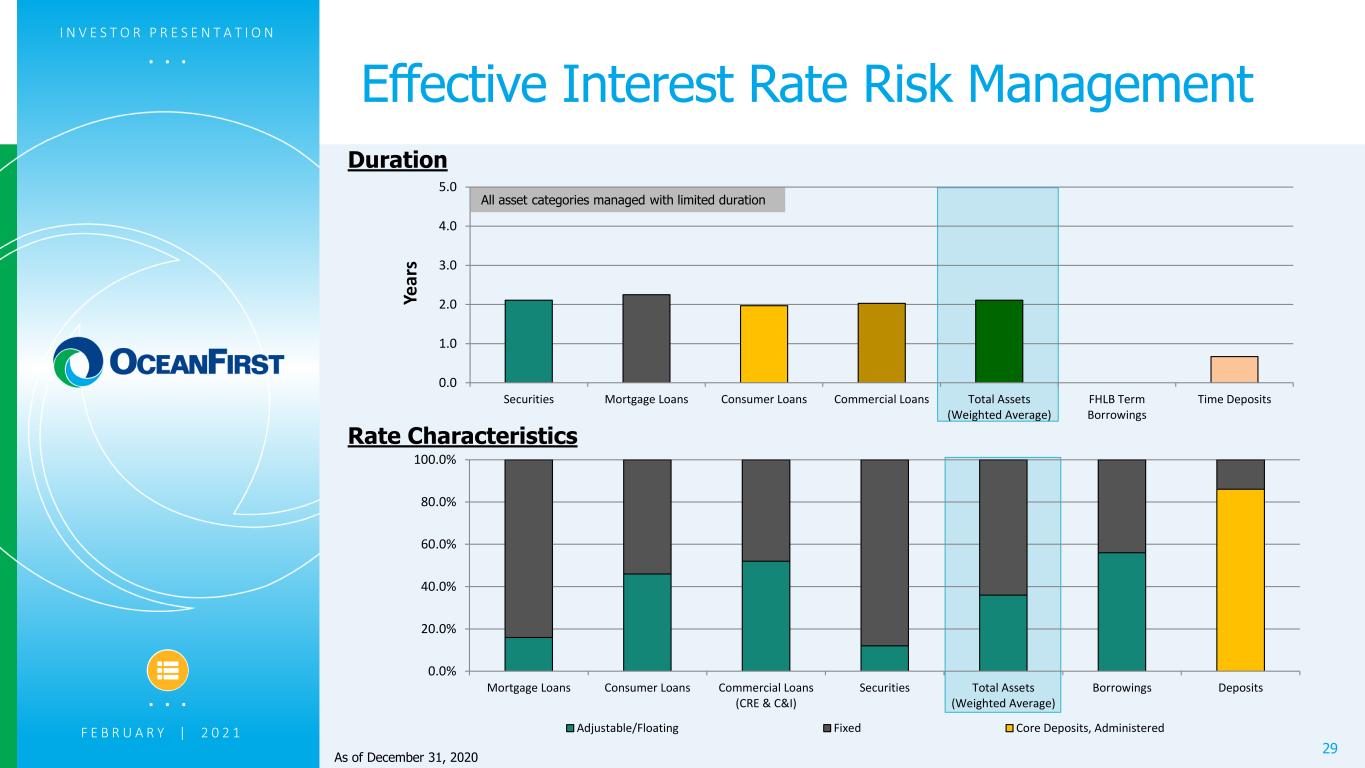
. . . As of December 31, 2020 Duration Rate Characteristics All asset categories managed with limited duration Effective Interest Rate Risk Management 29 I N V E S T O R P R E S E N T A T I O N . . . F E B R U A R Y | 2 0 2 1 0.0% 20.0% 40.0% 60.0% 80.0% 100.0% Mortgage Loans Consumer Loans Commercial Loans (CRE & C&I) Securities Total Assets (Weighted Average) Borrowings Deposits Adjustable/Floating Fixed Core Deposits, Administered 0.0 1.0 2.0 3.0 4.0 5.0 Securities Mortgage Loans Consumer Loans Commercial Loans Total Assets (Weighted Average) FHLB Term Borrowings Time Deposits Ye a rs
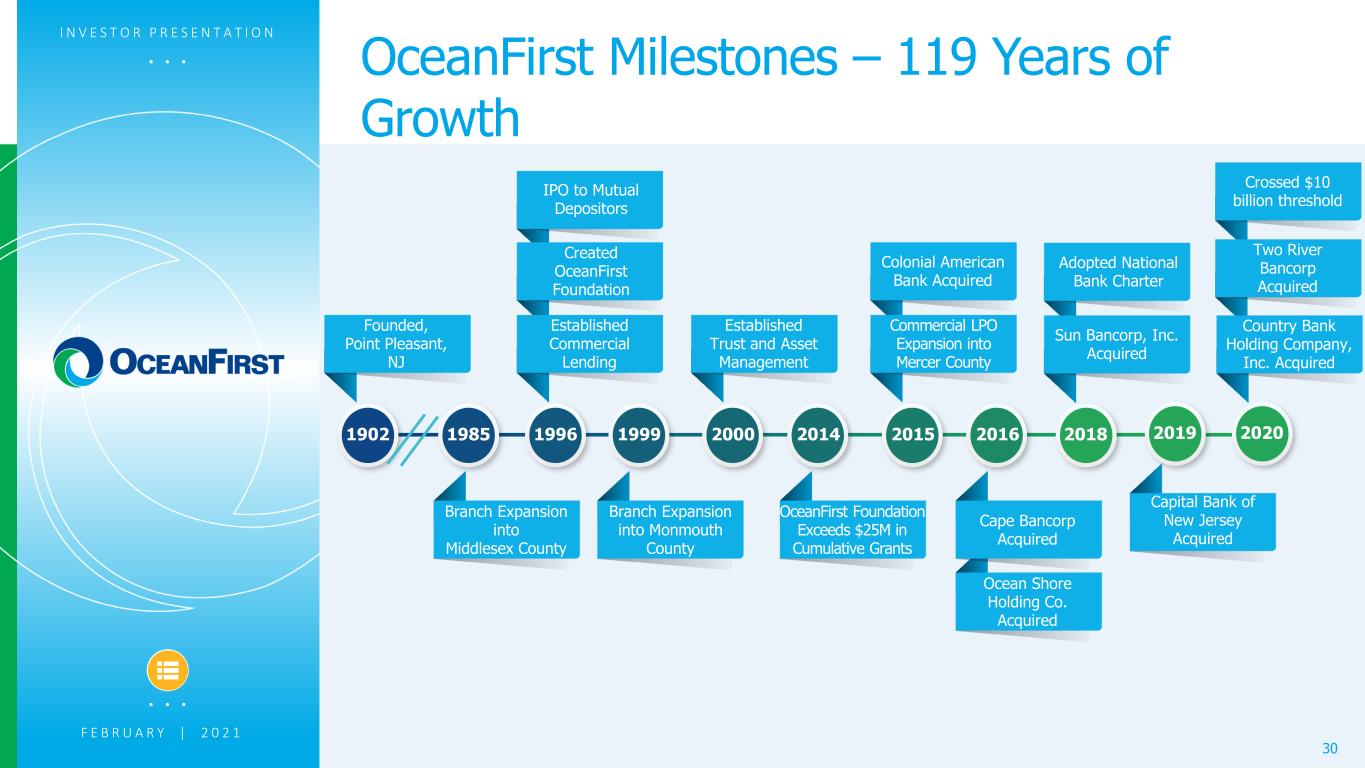
. . . Crossed $10 billion threshold Two River Bancorp Acquired OceanFirst Milestones – 119 Years of Growth I N V E S T O R P R E S E N T A T I O N 30 Founded, Point Pleasant, NJ Established Trust and Asset Management Colonial American Bank Acquired IPO to Mutual Depositors Branch Expansion into Middlesex County Branch Expansion into Monmouth County OceanFirst Foundation Exceeds $25M in Cumulative Grants Ocean Shore Holding Co. Acquired Created OceanFirst Foundation Established Commercial Lending Cape Bancorp Acquired Commercial LPO Expansion into Mercer County 20181902 1985 1996 1999 2000 2014 2015 2016 2019 Adopted National Bank Charter Sun Bancorp, Inc. Acquired Capital Bank of New Jersey Acquired 2020 Country Bank Holding Company, Inc. Acquired . . . F E B R U A R Y | 2 0 2 1
. . . 4Q-20 Earnings Supplement1 January 28, 2021 1 The 4Q-20 Earnings Supplement is for the purpose and use in conjunction with our Earnings Release furnished as Exhibit 99.1 to our Form 8-K on January 28, 2021.
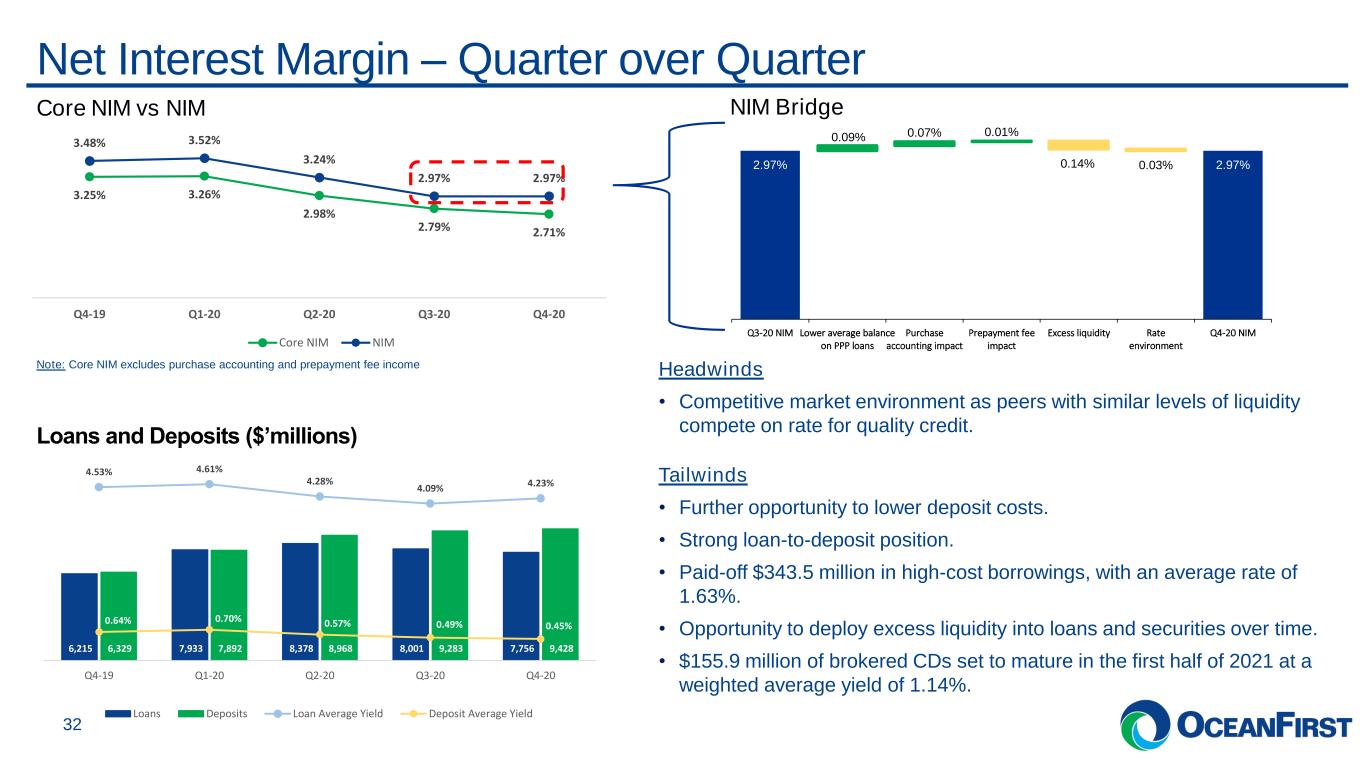
. . . 3.25% 3.26% 2.98% 2.79% 2.71% 3.48% 3.52% 3.24% 2.97% 2.97% Q4-19 Q1-20 Q2-20 Q3-20 Q4-20 Core NIM NIM 2.97% 2.97% 0.09% 0.07% 0.01% 0.14% 0.03% Q3-20 NIM Lower average balance on PPP loans Purchase accounting impact Prepayment fee impact Excess liquidity Rate environment Q4-20 NIM Core NIM vs NIM Net Interest Margin – Quarter over Quarter 32 Headwinds • Competitive market environment as peers with similar levels of liquidity compete on rate for quality credit. Tailwinds • Further opportunity to lower deposit costs. • Strong loan-to-deposit position. • Paid-off $343.5 million in high-cost borrowings, with an average rate of 1.63%. • Opportunity to deploy excess liquidity into loans and securities over time. • $155.9 million of brokered CDs set to mature in the first half of 2021 at a weighted average yield of 1.14%. 6,215 7,933 8,378 8,001 7,756 6,329 7,892 8,968 9,283 9,428 4.53% 4.61% 4.28% 4.09% 4.23% 0.64% 0.70% 0.57% 0.49% 0.45% Q4-19 Q1-20 Q2-20 Q3-20 Q4-20 Loans Deposits Loan Average Yield Deposit Average Yield Note: Core NIM excludes purchase accounting and prepayment fee income Loans and Deposits ($’millions) NIM Bridge
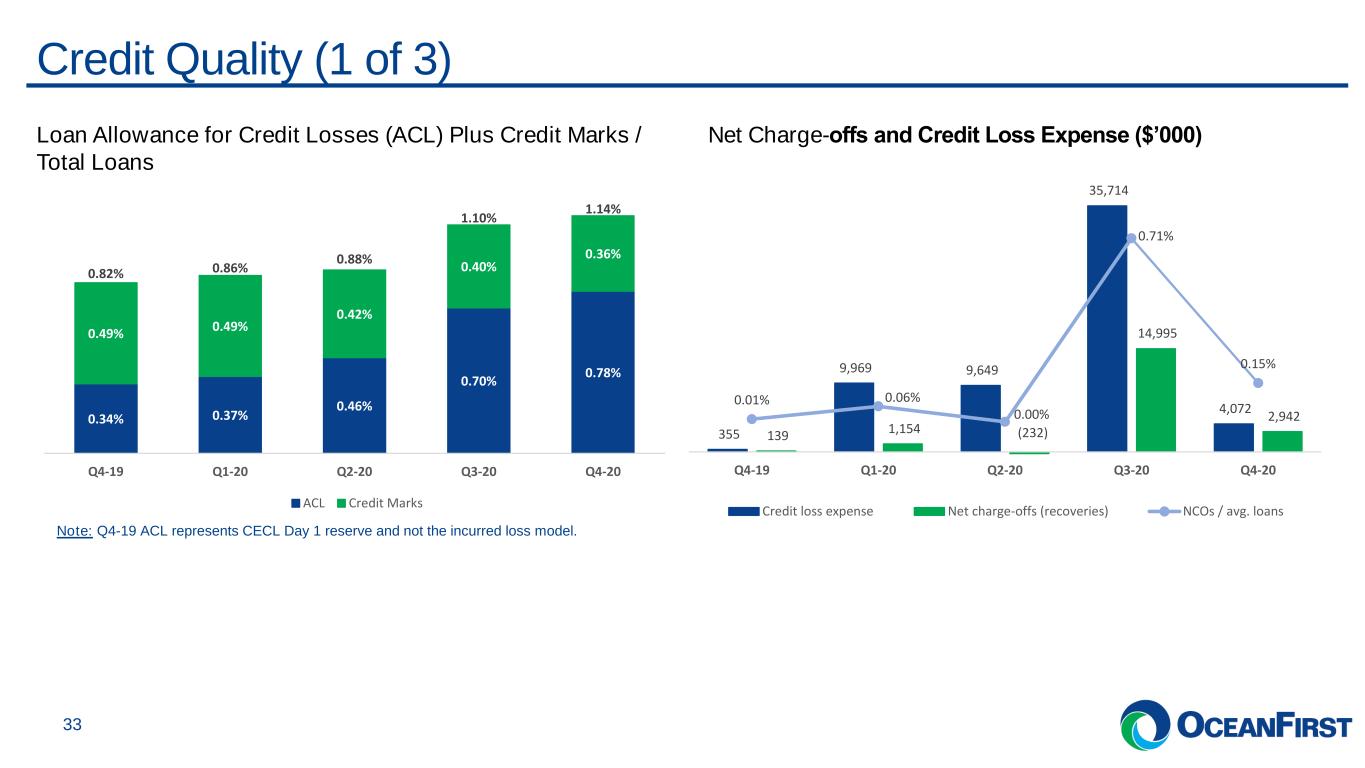
. . . 0.34% 0.37% 0.46% 0.70% 0.78% 0.49% 0.49% 0.42% 0.40% 0.36% 0.82% 0.86% 0.88% 1.10% 1.14% Q4-19 Q1-20 Q2-20 Q3-20 Q4-20 ACL Credit Marks Credit Quality (1 of 3) 33 355 9,969 9,649 35,714 4,072 139 1,154 (232) 14,995 2,942 0.01% 0.06% 0.00% 0.71% 0.15% Q4-19 Q1-20 Q2-20 Q3-20 Q4-20 Credit loss expense Net charge-offs (recoveries) NCOs / avg. loans Loan Allowance for Credit Losses (ACL) Plus Credit Marks / Total Loans Net Charge-offs and Credit Loss Expense ($’000) Note: Q4-19 ACL represents CECL Day 1 reserve and not the incurred loss model.
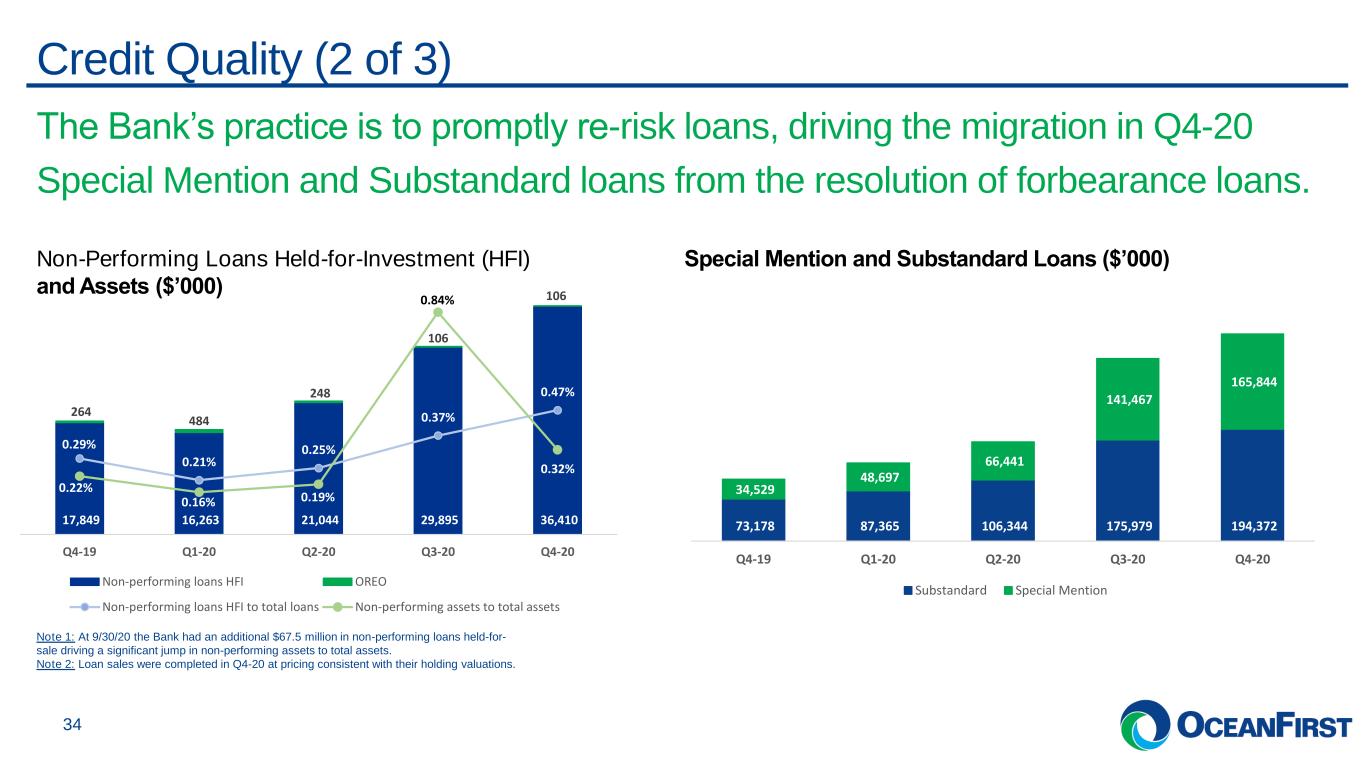
. . . 73,178 87,365 106,344 175,979 194,372 34,529 48,697 66,441 141,467 165,844 Q4-19 Q1-20 Q2-20 Q3-20 Q4-20 Substandard Special Mention Credit Quality (2 of 3) 34 17,849 16,263 21,044 29,895 36,410 264 484 248 106 106 0.29% 0.21% 0.25% 0.37% 0.47% 0.22% 0.16% 0.19% 0.84% 0.32% Q4-19 Q1-20 Q2-20 Q3-20 Q4-20 Non-performing loans HFI OREO Non-performing loans HFI to total loans Non-performing assets to total assets Non-Performing Loans Held-for-Investment (HFI) and Assets ($’000) Special Mention and Substandard Loans ($’000) Note 1: At 9/30/20 the Bank had an additional $67.5 million in non-performing loans held-for- sale driving a significant jump in non-performing assets to total assets. Note 2: Loan sales were completed in Q4-20 at pricing consistent with their holding valuations. The Bank’s practice is to promptly re-risk loans, driving the migration in Q4-20 Special Mention and Substandard loans from the resolution of forbearance loans.
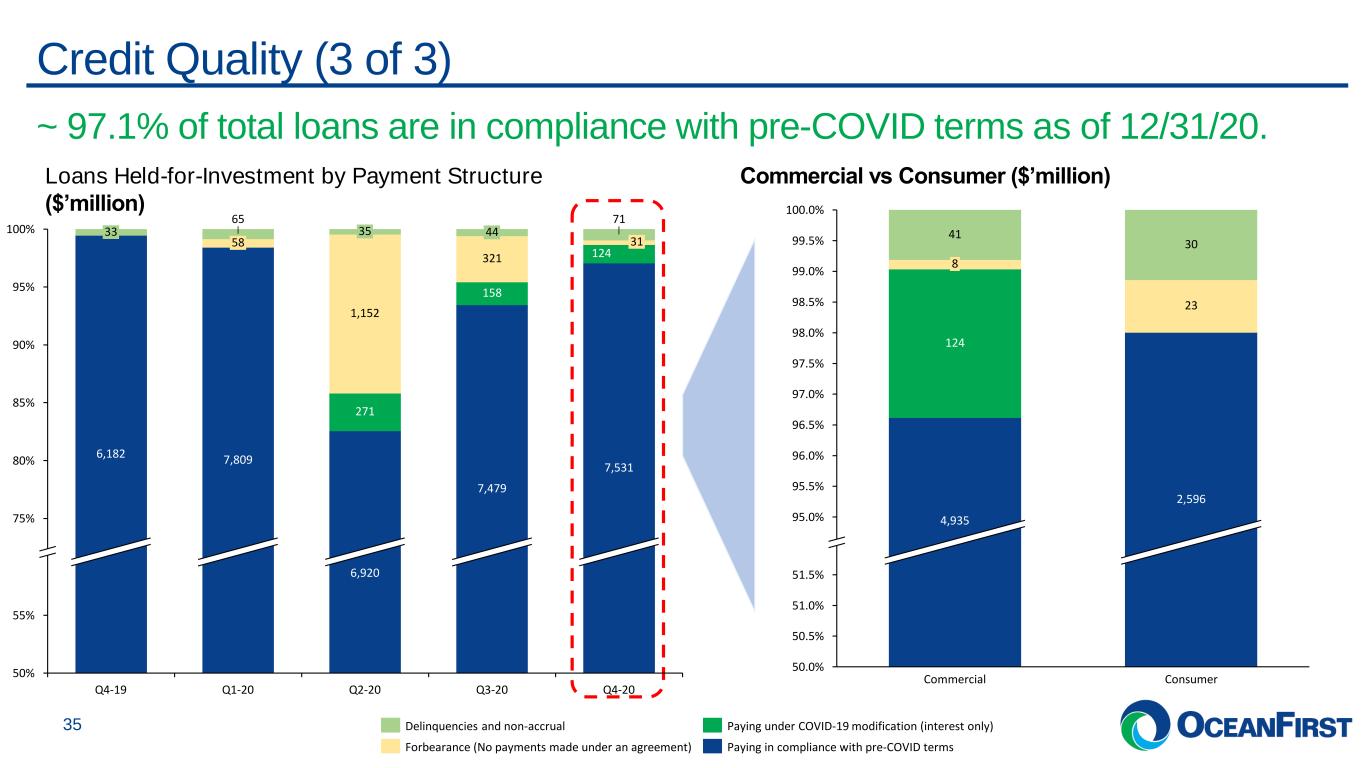
. . .Credit Quality (3 of 3) 35 Commercial vs Consumer ($’million)Loans Held-for-Investment by Payment Structure ($’million) ~ 97.1% of total loans are in compliance with pre-COVID terms as of 12/31/20. 75% 90% 50% 55% 100% 95% 85% 80% 35 Q1-20 321 6,182 31 Q4-19 65 7,809 1,152 271 Q2-20 44 7,479 Q3-20 6,920 124 158 33 7,531 71 Q4-20 58 Delinquencies and non-accrual Forbearance (No payments made under an agreement) Paying in compliance with pre-COVID terms Paying under COVID-19 modification (interest only) 97.0% 50.0% 50.5% 51.0% 99.5% 96.0% 96.5% 95.0% 95.5% 97.5% 98.0% 98.5% 99.0% 100.0% 51.5% 41 ConsumerCommercial 30 124 4,935 23 2,596 8

. . .Non-Interest Expense 36 Core Non-Interest Expense ($’000) 19,797 21,790 23,140 23,789 25,730 22,518 29,885 27,935 29,012 27,323 42,315 51,675 51,075 52,801 53,053 Q4-19 Q1-20 Q2-20 Q3-20 Q4-20 Other Core Non-Int Exp Compensation & Employees Benefits Core Efficiency Ratio • $4.5 million for the year relates to COVID- 19 expenses. • Core non-interest expense excludes branch consolidation, merger related expenses, and FHLB prepayment penalty. • Announced the consolidation of 4 additional branches to be closed in early April. Pro- forma average branch size is anticipated to be in the range of $160 million. • The increase in core non-interest expense of $252,000 from the linked quarter was primarily driven by the following: (i) an increase in other operating expense of $788,000, (ii) an increase in FDIC expense of $648,000; partially offset by (iii) a decrease in compensation and benefit expense of $1.1 million. 56.73% 55.36% 56.69% 59.63% 59.69% 2.05% 2.01% 1.85% 1.81% 1.80% Q4-19 Q1-20 Q2-20 Q3-20 Q4-20 Core Efficiency Ratio Core Non-Interest Expense to Average Assets
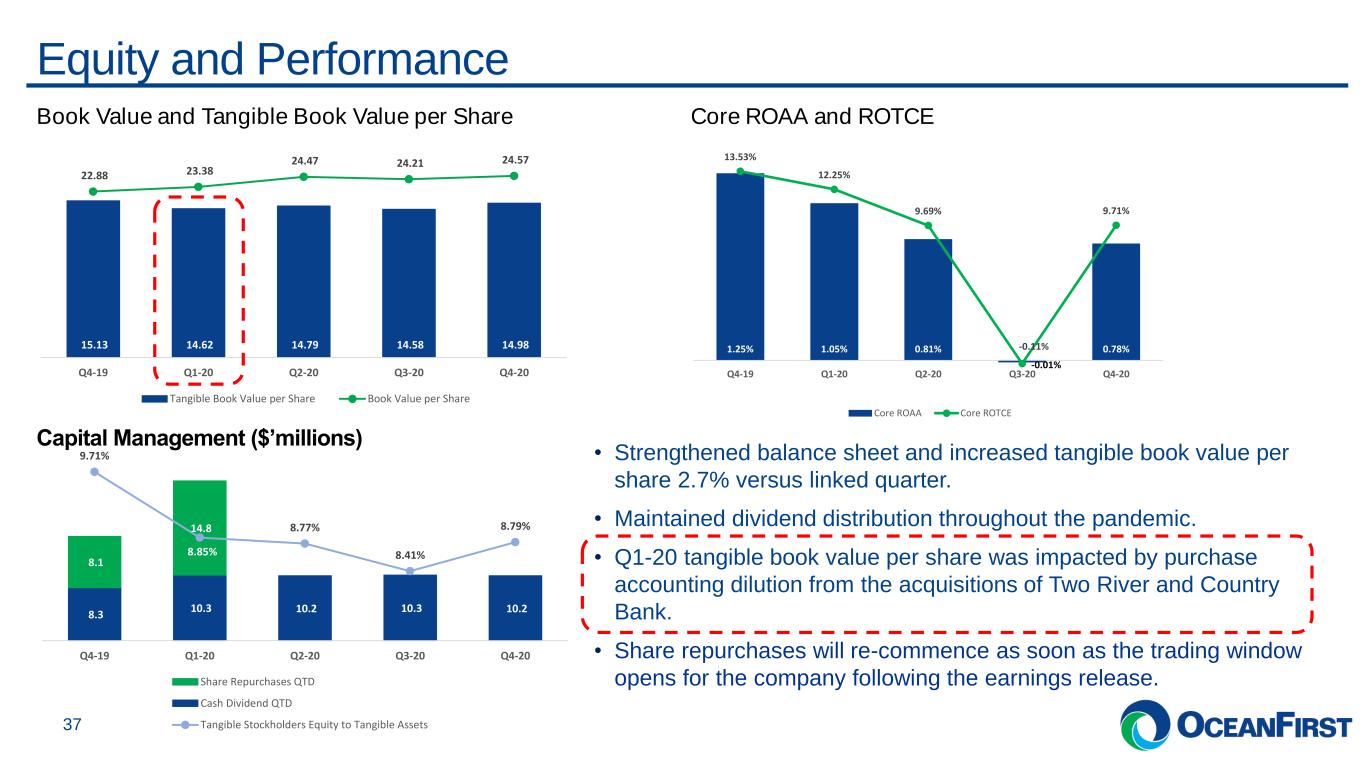
. . .Equity and Performance 37 15.13 14.62 14.79 14.58 14.98 22.88 23.38 24.47 24.21 24.57 Q4-19 Q1-20 Q2-20 Q3-20 Q4-20 Tangible Book Value per Share Book Value per Share Book Value and Tangible Book Value per Share 1.25% 1.05% 0.81% -0.01% 0.78% 13.53% 12.25% 9.69% -0.11% 9.71% Q4-19 Q1-20 Q2-20 Q3-20 Q4-20 Core ROAA Core ROTCE Core ROAA and ROTCE • Strengthened balance sheet and increased tangible book value per share 2.7% versus linked quarter. • Maintained dividend distribution throughout the pandemic. • Q1-20 tangible book value per share was impacted by purchase accounting dilution from the acquisitions of Two River and Country Bank. • Share repurchases will re-commence as soon as the trading window opens for the company following the earnings release. 8.3 10.3 10.2 10.3 10.2 8.1 14.8 9.71% 8.85% 8.77% 8.41% 8.79% Q4-19 Q1-20 Q2-20 Q3-20 Q4-20 Share Repurchases QTD Cash Dividend QTD Tangible Stockholders Equity to Tangible Assets Capital Management ($’millions)
