Attached files
| file | filename |
|---|---|
| 8-K - 8-K - OPPENHEIMER HOLDINGS INC | opy-20210202.htm |

Fourth Quarter and Full Year 2020 Investor Update Oppenheimer Holdings Inc.

Safe Harbor Statement 2 This presentation and other written or oral statements made from time to time by representatives of Oppenheimer Holdings Inc. (the “company”) may contain “forward-looking statements” within the meaning of Section 27A of the Securities Act of 1933, as amended, and Section 21E of the Securities Exchange Act of 1934, as amended. These forward-looking statements may relate to such matters as anticipated financial performance, future revenues or earnings, business prospects, new products or services, anticipated market performance and similar matters. The Private Securities Litigation Reform Act of 1995 provides a safe harbor for forward-looking statements. Forward-looking statements are neither historical facts nor assurances of future performance. Instead, they are based only on the company’s current beliefs, expectations and assumptions regarding the future of the company’s business, future plans and strategies, projections, anticipated events and trends, the economy and other future conditions. Because forward-looking statements relate to the future, they are subject to inherent uncertainties, risks and changes in circumstances that are difficult to predict and many of which are outside of the company’s control. The company cautions that a variety of factors could cause the company’s actual results to differ materially from the anticipated results or other expectations expressed in the company’s forwarding-looking statements. These risks and uncertainties include, but are not limited to, those risk factors discussed in Part I, “Item 1A. Risk Factors” of our Annual Report on Form 10-K for the year ended December 31, 2019 filed with the SEC on March 2, 2020 (the “2019 10-K”). In addition, important factors that could cause actual results to differ materially from those in the forward-looking statements include those factors discussed in Part I, “Item 2. Management’s Discussion & Analysis of Financial Condition and Results of Operations – Factors Affecting ‘Forward- Looking Statements’” and Part II, “Item IA. Risk Factors” of our Quarterly Report on Form 10-Q for the quarter ended September 30, 2020 filed with the SEC on October 29, 2020 (“2020 10-Q3”). Any forward-looking statements herein are qualified in their entirety by reference to all such factors discussed in the 2019 10-K, the 2020 10-Q3 and the company’s other SEC filings. There can be no assurance that the company has correctly or completely identified and assessed all of the factors affecting the company’s business. Therefore, you should not rely on any of these forward-looking statements. Any forward-looking statement made by the company in this presentation is based only on information currently available to the company and speaks only as of the date on which it is made. The company does not undertake any obligation to publicly update or revise any forward-looking statements, whether written or oral, that may be made from time to time, whether as a result of new information, future developments or otherwise.

Oppenheimer is a leading investment bank and full-service investment firm that provides financial services and advice to high net worth investors, individuals, businesses and institutions. 3 Hong Kong, China London, UK Geneva, Switzerland St. Helier, Isle of Jersey Frankfurt, Germany Tel Aviv, Israel (1) Represents book value less goodwill and intangible assets divided by number of shares outstanding. (2) Includes special dividend of $1.00 paid on December 30, 2020 to holders of Class A non-voting and Class B voting common stock. $123.0 million Net Income in 2020 $1.2 billion Revenue in 2020 Oppenheimer Snapshot (as of 12/31/20) Listed NYSE Ticker: OPY Shareholders’ Equity ($M): $685.6 Market Cap ($M): $392.3 Book Value per Share: $54.93 Tangible Book Value per Share:(1) $41.31 Share Price: $31.43 Earnings per Share (Basic): $9.73 Earnings per Share (Diluted): $9.30 P/E Ratio (TTM): 3.23 Dividend Yield (TTM):(2) 4.70% Employees: 2,908 # of Financial Advisors: 1,002 Retail Branches in the US: 92 Client Assets under Administration ($B): $104.8 Assets Under Management ($B): $38.8 Business Overview

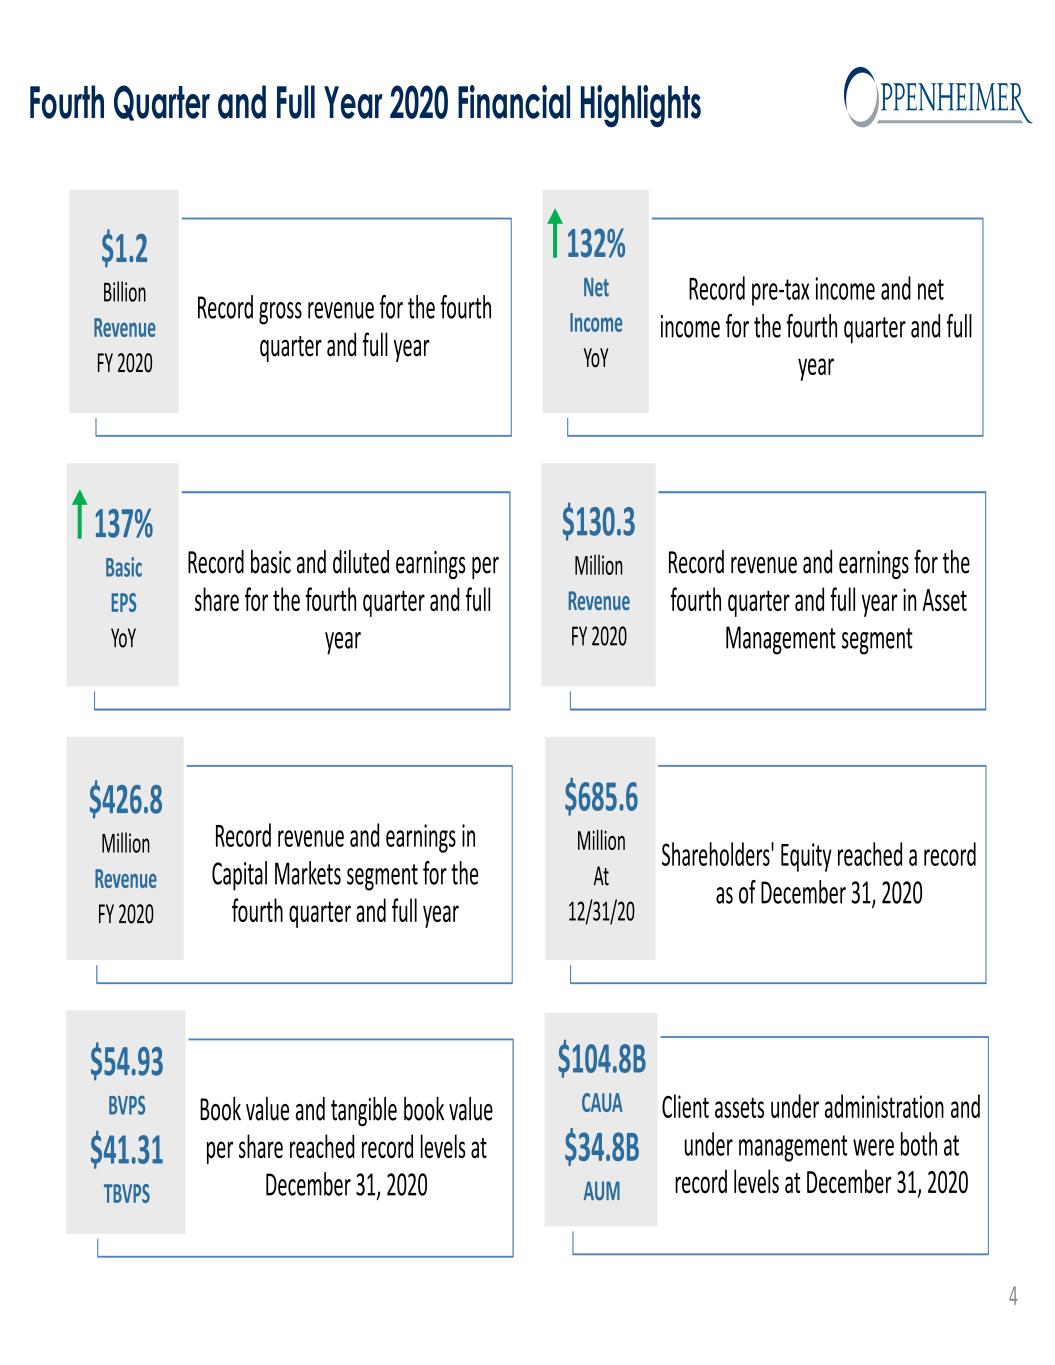
Fourth Quarter and Full Year 2020 Financial Highlights 4 Record gross revenue for the fourth quarter and full year Record pre-tax income and net income for the fourth quarter and full year Record basic and diluted earnings per share for the fourth quarter and full year Record revenue and earnings for the fourth quarter and full year in Asset Management segment Record revenue and earnings in Capital Markets segment for the fourth quarter and full year Shareholders' Equity reached a record as of December 31, 2020 Book value and tangible book value per share reached record levels at December 31, 2020 Client assets under administration and under management were both at record levels at December 31, 2020 137% Basic EPS YoY $426.8 Million Revenue FY 2020 $54.93 BVPS $41.31 TBVPS $685.6 Million At 12/31/20 $104.8B CAUA $34.8B AUM $130.3 Million Revenue FY 2020 132% Net Income YoY $1.2 Billion Revenue FY 2020

Record revenue and operating results for the quarter were primarily due to significantly higher investment banking income and incentive fees from our sponsorship of alternative investments Retail and institutional commissions higher driven by elevated volatility and increased client participation during the quarter Advisory fees increased due to record incentive fees as well as increased management fees due to higher assets under management The Investment Banking division had its best quarter due to significantly higher equities underwriting fees and an increase in M&A fees Lower short-term interest rates negatively impacted bank deposit sweep income Compensation expense as a percentage of revenue was lower at 57.7% during the current period versus 64.3% the same period last year Non-compensation expenses were lower primarily due to lower interest, legal and regulatory, and travel and entertainment costs during the current period versus the same period last year Highlights Earnings per share (Basic) $ 6.56 $ 1.99 229.6% Earnings per share (Diluted) $ 6.17 $ 1.84 235.3% ($000’s) For the 3-Months Ended REVENUE 12-31-20 12-31-19 % Change Commissions $ 97,971 $ 81,182 20.7% Advisory fees 204,521 118,430 72.7% Investment banking 84,139 44,364 89.7% Bank deposit sweep income 4,262 22,730 -81.2% Interest 8,827 12,102 -27.1% Principal transactions, net 8,975 8,005 12.1% Other 14,213 9,068 56.7% Total Revenue 422,908 295,881 42.9% EXPENSES Compensation and related expenses 244,073 190,292 28.3% Non-Compensation related expenses 65,040 70,616 -7.9% Total Expenses 309,113 260,908 18.5% Pre-tax Income 113,795 34,973 225.4% Net income $ 81,880 $ 25,435 221.9% Summary Operating Results: 4Q-20 (Unaudited) 5

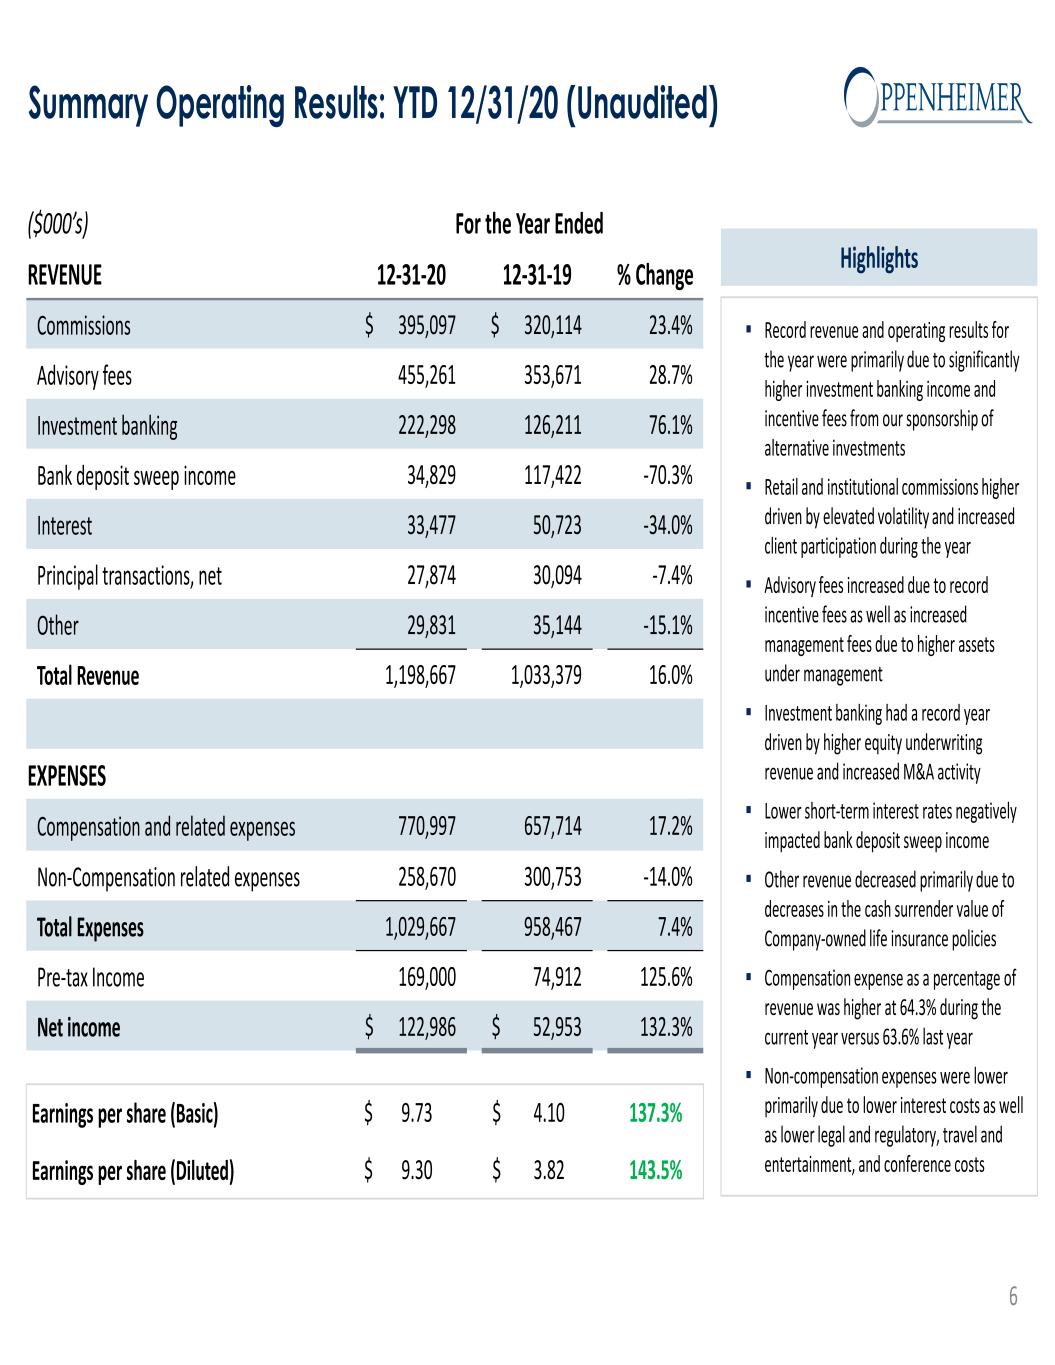
Record revenue and operating results for the year were primarily due to significantly higher investment banking income and incentive fees from our sponsorship of alternative investments Retail and institutional commissions higher driven by elevated volatility and increased client participation during the year Advisory fees increased due to record incentive fees as well as increased management fees due to higher assets under management Investment banking had a record year driven by higher equity underwriting revenue and increased M&A activity Lower short-term interest rates negatively impacted bank deposit sweep income Other revenue decreased primarily due to decreases in the cash surrender value of Company-owned life insurance policies Compensation expense as a percentage of revenue was higher at 64.3% during the current year versus 63.6% last year Non-compensation expenses were lower primarily due to lower interest costs as well as lower legal and regulatory, travel and entertainment, and conference costs Highlights Earnings per share (Basic) $ 9.73 $ 4.10 137.3% Earnings per share (Diluted) $ 9.30 $ 3.82 143.5% ($000’s) For the Year Ended REVENUE 12-31-20 12-31-19 % Change Commissions $ 395,097 $ 320,114 23.4% Advisory fees 455,261 353,671 28.7% Investment banking 222,298 126,211 76.1% Bank deposit sweep income 34,829 117,422 -70.3% Interest 33,477 50,723 -34.0% Principal transactions, net 27,874 30,094 -7.4% Other 29,831 35,144 -15.1% Total Revenue 1,198,667 1,033,379 16.0% EXPENSES Compensation and related expenses 770,997 657,714 17.2% Non-Compensation related expenses 258,670 300,753 -14.0% Total Expenses 1,029,667 958,467 7.4% Pre-tax Income 169,000 74,912 125.6% Net income $ 122,986 $ 52,953 132.3% Summary Operating Results: YTD 12/31/20 (Unaudited) 6

7 Shareholders’ Equity ($M)Earnings per Share ($) Return on Equity (%)Net Income ($M) Select Financial Measures

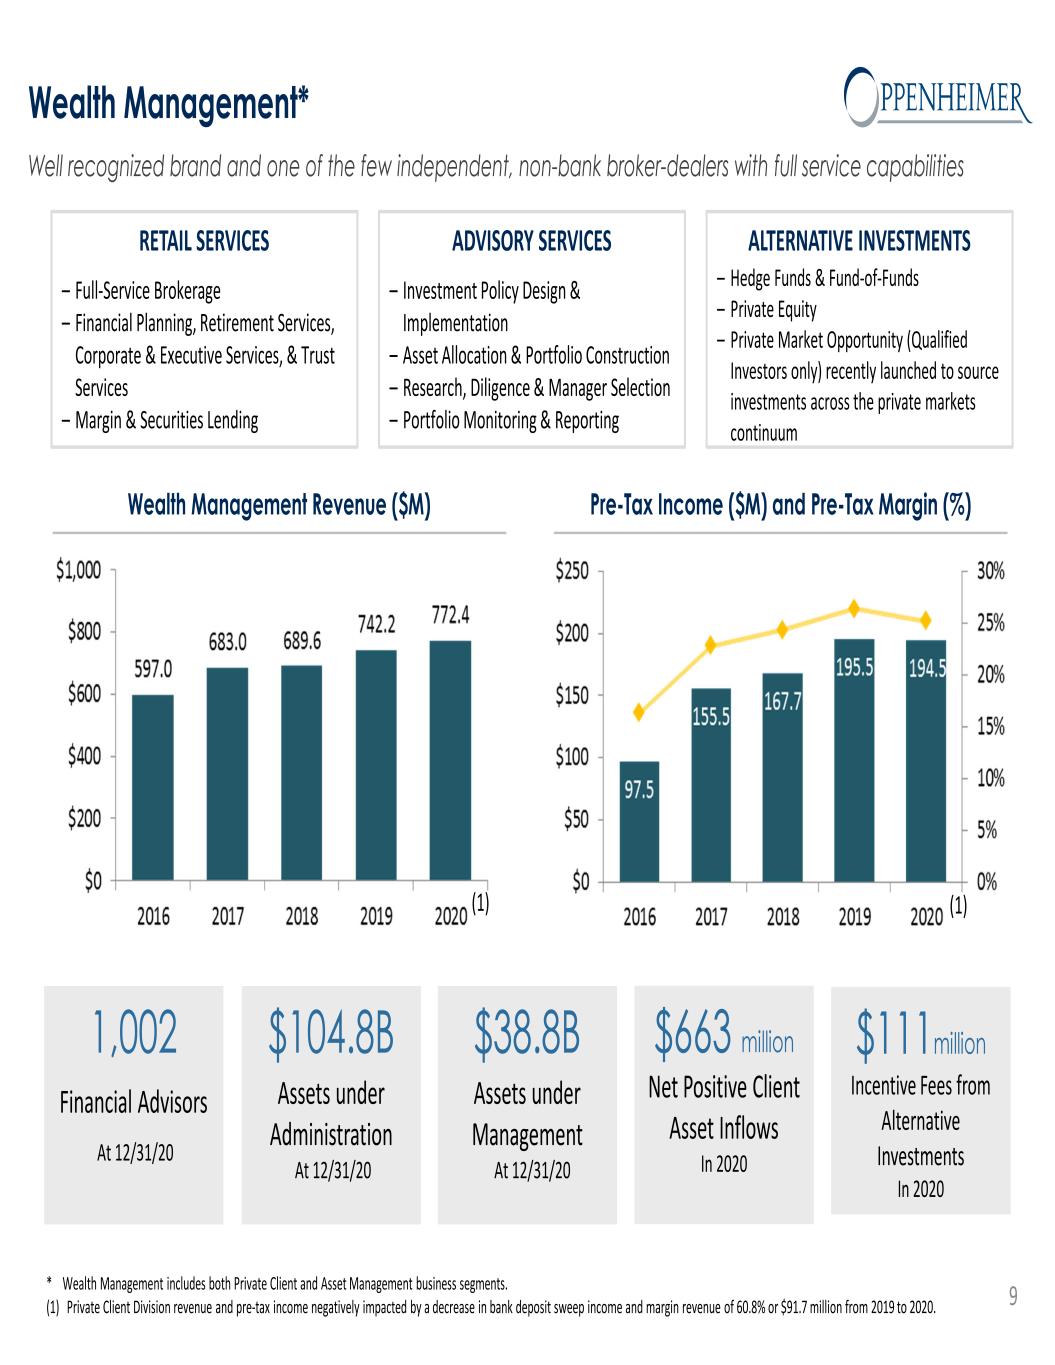
8 ('000s, except per share amounts or otherwise indicated) 4Q-20 4Q-19 % Δ FY-20 FY-19 % Δ Private Client(1) Revenue $ 217,743 $ 175,900 23.8% $ 642,083 $ 653,409 -1.7% Pre-Tax Income $ 39,362 $ 42,416 -7.2% $ 122,844 $ 163,917 -25.1% Assets Under Administration ($Bn) $ 104.8 $ 91.0 15.2% $ 104.8 $ 91.0 15.2% Asset Management Revenue $ 72,851 $ 35,179 107.1% $ 130,274 $ 88,755 46.8% Pre-Tax Income $ 56,911 $ 19,114 197.7% $ 71,625 $ 31,606 126.6% Asset Under Management ($Bn) $ 38.8 $ 32.1 20.9% $ 38.8 $ 32.1 20.9% Capital Markets Revenue $ 131,651 $ 83,982 56.8% $ 426,752 $ 290,830 46.7% Pre-Tax Income (Loss) $ 41,894 $ (2,891) * $ 83,442 $ (13,724) * Segment Results (Unaudited) • Percentage not meaningful. (1) Private Client Division revenue and pre-tax income negatively impacted by a decrease in bank deposit sweep income and margin revenue of 60.8% or $91.7 million from 2019 to 2020.

9 RETAIL SERVICES – Full-Service Brokerage – Financial Planning, Retirement Services, Corporate & Executive Services, & Trust Services – Margin & Securities Lending ALTERNATIVE INVESTMENTS – Hedge Funds & Fund-of-Funds – Private Equity – Private Market Opportunity (Qualified Investors only) recently launched to source investments across the private markets continuum ADVISORY SERVICES – Investment Policy Design & Implementation – Asset Allocation & Portfolio Construction – Research, Diligence & Manager Selection – Portfolio Monitoring & Reporting Pre-Tax Income ($M) and Pre-Tax Margin (%) $663 million Net Positive Client Asset Inflows In 2020 $38.8B Assets under Management At 12/31/20 $104.8B Assets under Administration At 12/31/20 1,002 Financial Advisors At 12/31/20 Well recognized brand and one of the few independent, non-bank broker-dealers with full service capabilities Wealth Management Revenue ($M) Wealth Management* $111million Incentive Fees from Alternative Investments In 2020 (1) (1) * Wealth Management includes both Private Client and Asset Management business segments. (1) Private Client Division revenue and pre-tax income negatively impacted by a decrease in bank deposit sweep income and margin revenue of 60.8% or $91.7 million from 2019 to 2020.

Healthcare Technology Consumer & Retail Transportation & Logistics Finance & Real Estate Energy Investment Banking Focus Industries 10 $426.8M Capital Markets Revenue Breakdown FY 2020Capital Markets Revenue ($M) FIXED INCOME – Taxable Fixed Income – Non-Taxable Fixed Income – Public Finance INVESTMENT BANKING – Mergers & Acquisitions – Equity Capital Markets – Debt Capital Markets – Restructuring & Special Situations INSTITUTIONAL EQUITIES – Sales and Trading – Equity Research • ˜40 senior research analysts covering 600+ companies – Corporate Access (Conferences & NDRs) A leading capital markets business providing sophisticated investment banking, research and trading solutions Capital Markets

11 Select 4Q-20 Investment Banking Transactions $1,913,600,000 $1,325,000,000 $128,250,000 $197,706,708 Technology Follow-On Joint Bookrunner Financial Institutions Initial Public Offering Senior Co-Lead Manager Healthcare Initial Public Offering Lead Manager Technology Follow-On Joint Bookrunner October 2020 October 2020 October 2020 October 2020 $172,500,000 $230,000,000 $275,800,000 $3,490,000,108 Rodgers Silicon Valley Acquisition Corp. Consumer & Retail Follow-On Lead Bookrunner Technology Initial Public Offering Sole Bookrunner Healthcare Follow-On Lead Manager Technology Initial Public Offering Co-Manager December 2020 December 2020 December 2020 December 2020 $61,700,000 $115,000,000 $125,000,000 $475,000,000 Rental Services Sale of Vanguard Modular Building Systems, LLC to Exclusive Financial Advisor Financial Institutions SPAC Initial Public Offering Sole Bookrunner Technology Convertible Senior Notes Sole Advisor Financial Institutions Initial Public Offering Senior Co-Lead Manager November 2020 November 2020 November 2020 November 2020

Liquidity & Capital Book & Tangible Book Value per Share ($) Conservative risk profile with strong balance sheet 12 (1) Total Assets divided by Total Shareholders’ Equity. As of December 31, 2020 ($ in thousands) Total Assets: $2,713,942 Shareholders’ Equity: Long-Term Debt: $685,621 $125,000 Total Capitalization: $810,621 Debt to Equity Ratio: 18.2% Gross Leverage Ratio(1): 3.96x Broker-Dealer Regulatory Capital ($ in thousands) Regulatory Net Capital: $274,539 Regulatory Excess Net Capital: $250,102 Shareholders’ equity reached a record high $685.6 million on December 31, 2020 Book value ($54.93) and tangible book value per share ($41.31) reached record levels at December 31, 2020 The Company bought back a total of 718,522 shares of its Class A Non-Voting Common Stock for $15 million (average price of $20.94 per share) during 2020 The Company paid a special dividend of $1.00 per share to holders of Class A non-voting and Class B voting common stock on December 30, 2020 or $12.5 million bringing total 2020 dividends to $1.48 per share compared to $0.48 per share in 2019 Level 3 assets, comprised of auction rate securities, were $30.7 million as of December 31, 2020 Capital Structure

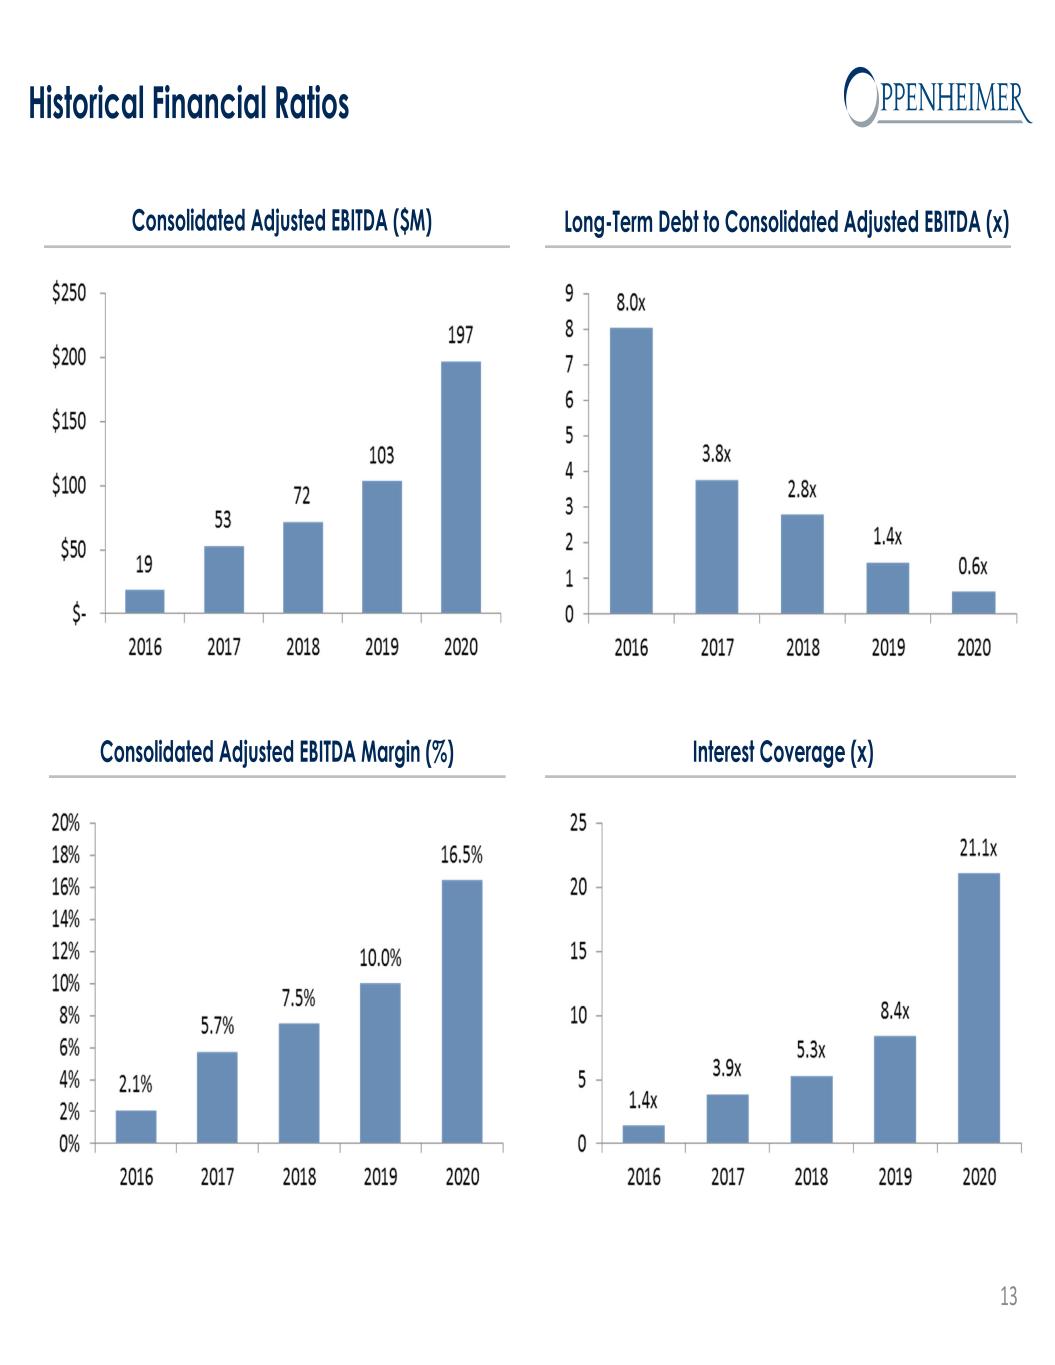
Historical Financial Ratios Consolidated Adjusted EBITDA Margin (%) Interest Coverage (x) Consolidated Adjusted EBITDA ($M) Long-Term Debt to Consolidated Adjusted EBITDA (x) 13 1.8x* 6.3x

For more information contact Investor Relations at info@opco.com
