Attached files
| file | filename |
|---|---|
| 8-K - FORM 8-K - QCR HOLDINGS INC | f8k_020121.htm |
Exhibit 99.1

Investor Presentation Updated February 1, 2021

FORWARD - LOOKING STATEMENTS This document contains, and future oral and written statements of QCR Holdings, Inc. (the “Company”) and its management may contain, forward - looking statements within the meaning of the Private Securities Litigation Reform Act of 1995 with respect to the financial condition, results of operations, plans, objectives, future performance and business of the Company. Forward - looking statements, which may be based upon beliefs, expectations and assumptions of the Company’s management and on information currently available to management, are generally identifiable by the use of words such as “believe,” “expect,” “anticipate,” “predict,” “suggest,” “appear,” “plan,” “intend,” “estimate,” “annualize,” “may,” “will,” “would,” “could,” “should” or other similar expressions. Additionally, all statements in this document, including forward - looking statements, speak only as of the date they are made, and the Company undertakes no obligation to update any statement in light of new information or future events. A number of factors, many of which are beyond the ability of the Company to control or predict, could cause actual results to differ materially from those in its forward - looking statements. These factors include, among others, the following: (i) the strength of the local, state, national and international economies (including the impact of the new presidential administration and the impact of tariffs, a U.S. withdrawal from or significant renegotiation of trade agreements, trade wars and other changes in trade regulations); (ii) the economic impact of any future terrorist threats and attacks, widespread disease or pandemics (including the COVID - 19 pandemic in the United States), or other adverse external events that could cause economic deterioration or instability in credit markets, and the response of local, state and national governments to any such adverse external events; (iii) changes in accounting policies and practices (including the new current expected credit loss (CECL) impairment standards, that will change how the Company estimates credit losses, when implemented); (iv) changes in state and federal laws, regulations and governmental policies concerning the Company’s general business; (v) changes in interest rates and prepayment rates of the Company’s assets (including the impact of LIBOR phase - out); (vi) increased competition in the financial services sector and the inability to attract new customers; (vii) changes in technology and the ability to develop and maintain secure and reliable electronic systems; (viii) unexpected results of acquisitions, which may include failure to realize the anticipated benefits of acquisitions and the possibility that transaction costs may be greater than anticipated; (ix) the loss of key executives or employees; (x) changes in consumer spending; and (xi) unexpected outcomes of existing or new litigation involving the Company. These risks and uncertainties should be considered in evaluating forward - looking statements and undue reliance should not be placed on such statements. Additional information concerning the Company and its business, including additional factors that could materially affect the Company’s financial results, is included in the Company’s filings with the Securities and Exchange Commission. NON - GAAP FINANCIAL MEASURES These slides contain non - GAAP financial measures. For purposes of Regulation G, a non - GAAP financial measure is a numerical measure of the registrant ’ s historical or future financial performance, financial position or cash flows that excludes amounts, or is subject to adjustments that have the effect of excluding amounts, that are included in the most directly comparable measure calculated and presented in accordance with GAAP in the statement of income, balance sheet or statement of cash flows (or equivalent statements) of the issuer; or includes amounts, or is subject to adjustments that have the effect of including amounts, that are excluded from the most directly comparable measure so calculated and presented. In this regard, GAAP refers to generally accepted accounting principles in the United States. Pursuant to the requirement of Regulation G, the Company has provided reconciliations within the slides, as necessary, of the non - GAAP financial measure to the most directly comparable GAAP financial measure. For more details on the Company’s non - GAAP measures, refer to the Company’s Annual Report on Form 10 - K for the year ended December 31, 2019.
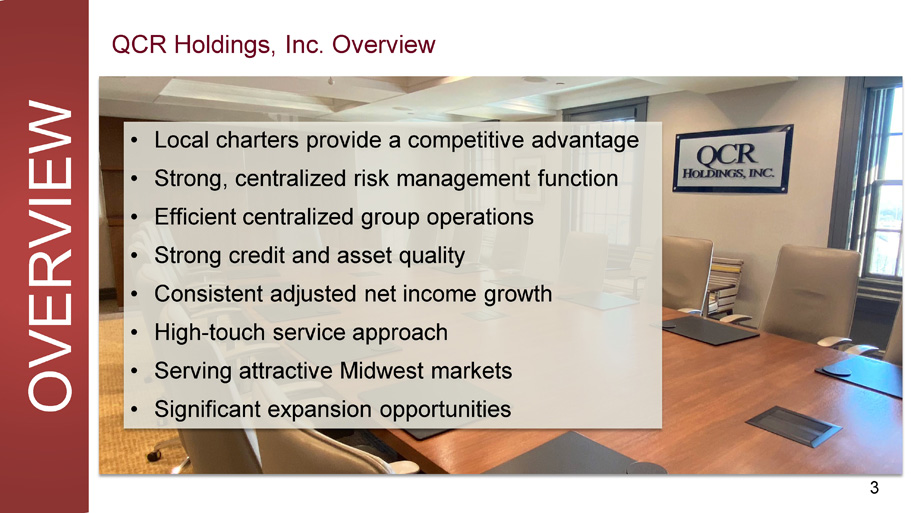
• Local charters provide a competitive advantage • Strong, centralized risk management function • Efficient centralized group operations • Strong credit and asset quality • Consistent adjusted net income growth • High - touch service approach • Serving attractive Midwest markets • Significant expansion opportunities OVERVIEW QCR Holdings, Inc. Overview 3
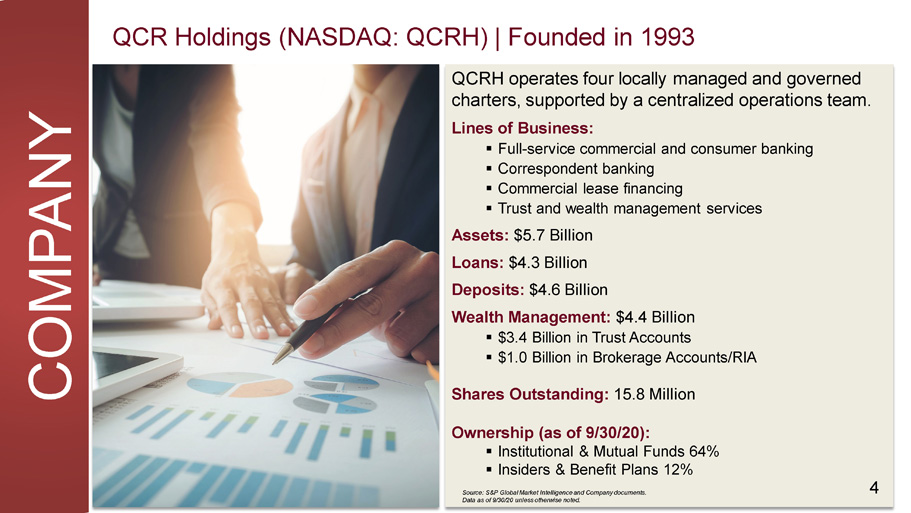
QCRH operates four locally managed and governed charters, supported by a centralized operations team. Lines of Business: ▪ Full - service commercial and consumer banking ▪ Correspondent banking ▪ Commercial lease financing ▪ Trust and wealth management services Assets: $5.7 Billion Loans: $4.3 Billion Deposits: $4.6 Billion Wealth Management: $4.4 Billion ▪ $3.4 Billion in Trust Accounts ▪ $1.0 Billion in Brokerage Accounts/RIA Shares Outstanding: 15.8 Million 4 QCR Holdings (NASDAQ: QCRH) | Founded in 1993 C OM P A N Y Ownership (as of 9/30/20): ▪ Institutional & Mutual Funds 64% ▪ Insiders & Benefit Plans 12% Source: S&P Global Market Intelligence and Company documents. Data as of 9/30/20 unless otherwise noted.

5 Todd A. Gipple President, Chief Operating Officer & Chief Financial Officer ▪ Over 30 years of commercial banking and financial accounting experience ▪ Joined QCR Holdings in 2000 ▪ QCR Holdings Board Director since 2009 ▪ Appointed Chief Financial Officer in 2000 ▪ Appointed Chief Operating Officer in 2008 Larry J. Helling Chief Executive Officer ▪ Over 30 years of commercial banking experience ▪ Founding member and CEO of Cedar Rapids Bank & Trust ▪ QCR Holdings Board Director since 2001 ▪ Oversight responsibility for specific product lines and services ▪ Specialty Finance Group – Municipal Finance and Government Guaranteed Lending, Tax Credit Lending, Interest Rate Swap Products and Services ▪ m 2 Equipment Finance LEADERSHIP Seasoned Senior Leadership

WHO WE ARE Our Values PASSION | We care. ACHIEVEMENT | We expect to win. ACCOUNTABILITY | We drive it. COLLABORATION | We work together. INNOVATION | We embrace change. INCLUSION | We respect all. Our Vision Exceptional people providing extraordinary performance for our clients, shareholders and communities. Our Mission, Vision and Values Our Mission We make financial dreams a reality. 6

The Value of Separate Charters Source: FDIC deposit market share data a provided by S&P Global (as of 6/30/19). Managed and governed by local veteran bankers and boards with strong community ties and expertise • High touch service delivered by knowledgeable professionals • Strong community involvement with high employee participation • Local decisions and solutions Local autonomy has led to favorable relative performance metrics • Loan growth • Credit and asset quality • Deposit growth Focus on growing deposit market share • #1 deposit share in two markets • Within top 10 deposit share in all four markets Ample opportunities to expand products and services across footprint • Specialty lending & leasing • Correspondent banking • Wealth management CHARTER MODEL 7
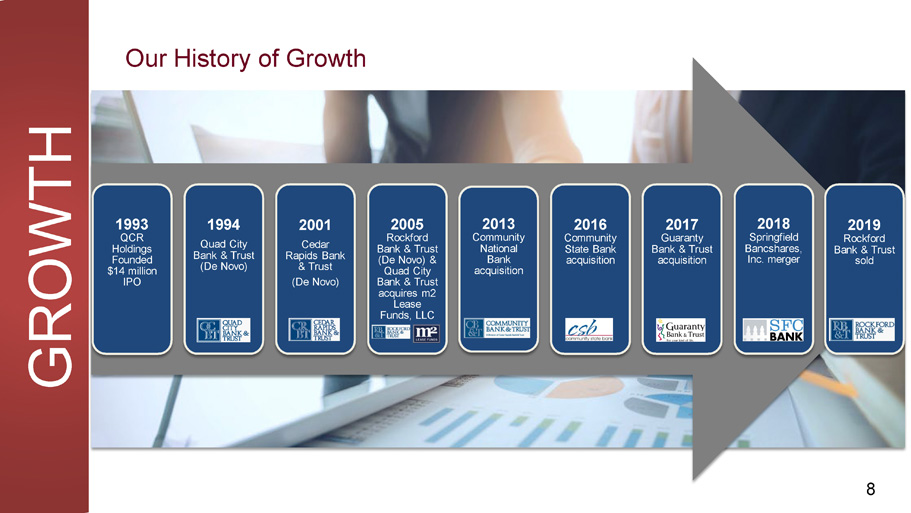
8 1993 QCR H o ldings F o unded $14 million IPO 1994 Quad City Bank & Trust (De Novo) 2001 Cedar Rapids Bank & Trust (De Novo) 2005 Rockford Bank & Trust (De Novo) & Quad City Bank & Trust acquires m2 Lease Funds, LLC 2013 C o mm uni t y National Bank acquisition 2016 C o mm uni t y State Bank acquisition 2017 Guaranty Bank & Trust acquisition 2018 Springfield B a n cs h a r e s , Inc. merger 2019 Rockford Bank & Trust sold Our History of Growth G R O W T H

9 G R O W T H Our Entities at a Glance Entity States/ R e g i on # Locations Deposits Market Share I o w a /I lli no i s Quad Cities 5 $1.9B #1 Iowa Cedar Rapids 5 $1.2B #1 Iowa Cedar Valley 3 $0.2B #7 Iowa Des Moines/ Ankeny 9 $0.9B #7 Missouri S p r i ng f i e l d 1 $0.6B #7

Strong Market Share in Attractive MSAs * MSAs include Davenport - Moline - Rock Island, IA - IL, Cedar Rapids, IA, Rockford - IL, Waterloo - Cedar Falls - IA, Des Moines/West Des Moines - IA, and Springfield, MO. All banks reflect Pro Forma Data from acquisitions. ** Pro Forma based on Rockford Bank & Trust disposition. Source: S&P Global Market Intelligence and Company documents. Deposit data as of 9/30/20. Davenport - Moline, IA - IL Cedar Rapids, IA Des Moines - West Des Moines, IA Springfield, MO Waterloo - Cedar Falls, IA ▪ Ranked #3 most diversified metro economy in U.S. (Livability.com 2020) ▪ 16th in the nation for high - tech job growth ▪ Ranked #3 out of 382 metro areas for industry diversity (EMSI) ▪ #11 in the top American cities to live in after the pandemic. (Business Insider) ▪ Cedar Rapids named 'mini megacity to watch' (2020) ▪ #2 Most Recession - Resistant City 2020 (Smart Asset) ▪ #5 Best Place to Live in the U.S . ( U.S. News & World Report, 2020) ▪ #8 Best City to Live in After the Pandemic ( Business Insider, 2020) ▪ Top 10 Best Place for Business and Careers (Forbes 2019) ▪ Top 5 Best Cities to start a business ▪ Top 20 Magnets for Young Adults ▪ O’Reilly Auto Parts and Bass Pro Shops headquarters ▪ First Gigabit city in Iowa and one of eight in the U.S. ▪ Cost of living is 2.2% below the national average ▪ W aterloo/Cedar Falls in the top 10 job markets in the U.S. (Zippia 2018) Deposit Market Share in Our Current MSAs* • Ranked 2nd in overall deposit market share in our current MSAs* • 48% of deposits are based in a Top 20 ranked Midwest MSA** Top 20 Banks Total Active Branches 2020 Total Deposits 2020 ($000) Wells Fargo & Co. 42 $6 , 14 3 , 42 1 U.S. Bancorp 49 $4 , 46 4 , 73 1 QCR Holdings, Inc. 24 $4 , 40 2 , 99 7 BTC Financial Corp. 22 $3 , 64 4 , 84 4 Great Southern Bancorp Inc. 28 $2 , 50 9 , 89 3 Bank of America Corp. 7 $1 , 89 9 , 17 9 West Bancorporation, Inc. 8 $1 , 85 0 , 59 3 Commerce Bancshares Inc. 11 $1 , 48 1 , 64 9 Central Banco. Inc. 22 $1 , 41 1 , 46 2 Great Western Bancorp Inc. 14 $1 , 37 6 , 92 7 Blackhawk Bancorp. Inc. 18 $1 , 03 4 , 31 4 FSB Financial Services Inc. 8 $911 , 92 8 Lincoln Bancorp 9 $820 , 68 7 Neighbor Insurance Agency Inc. 9 $784 , 17 7 Guaranty Federal Bancshares Inc. 10 $750 , 60 8 BNP Paribas SA 15 $675 , 12 6 OakStar Bancshares Inc. 6 $672 , 96 7 Hills Bancorp. 7 $612 , 16 0 Regions Financial Corp. 11 $604 , 03 4 Reliable Community Bancshares Inc. 12 $549 , 92 7 MARKET SHARE 10
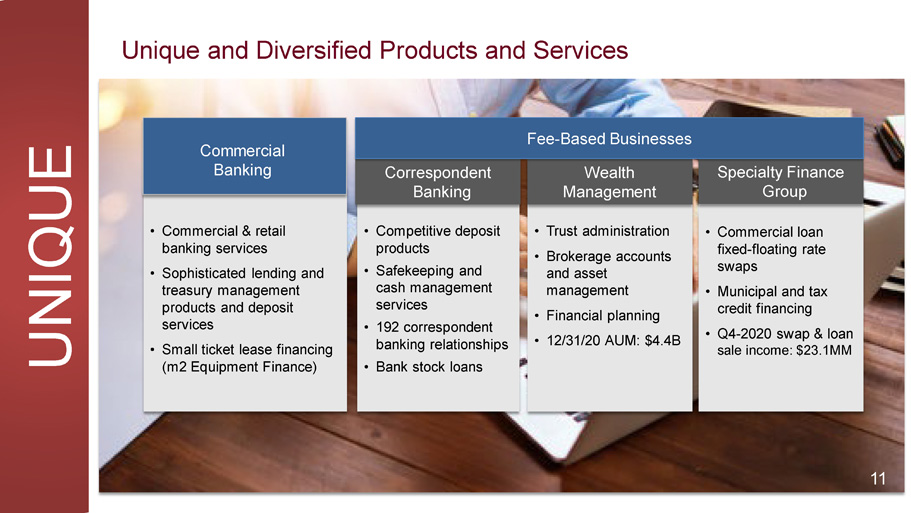
11 Unique and Diversified Products and Services • Trust administration • Brokerage accounts and asset management • Financial planning • 12/31/20 AUM: $4.4B • Competitive deposit products • Safekeeping and cash management services • 192 correspondent banking relationships • Bank stock loans • Commercial & retail banking services • Sophisticated lending and treasury management products and deposit services • Small ticket lease financing (m2 Equipment Finance) C o mm e r c i al Banking C o rr e s pondent Banking Wealth M anage m ent • Commercial loan fixed - floating rate swaps • Municipal and tax credit financing • Q4 - 2020 swap & loan sale income: $23.1MM Specialty Finance Group UN I Q UE Fee - Based Businesses

COMMITMENT Environmental, Social and Governance We are very proud of the communities we serve. Our employees demonstrate their commitment to our communities through volunteerism and philanthropy. At a Glance • 13,000 Volunteer Hours in 2020 • Diversity, Equity and Inclusion policy; focus on inclusion • Diverse Board Composition • Employees support hundreds of community organizations • Officers required to serve on at least one non - profit board • Free Financial Literacy classes 12 • Environmentally - focused lending programs

Our Strategy for Long - Term Success In 2020, we set a simple and focused strategy for our future. 9 - 6 - 5 is our plan to continue to grow earnings and drive attractive long - term returns for our shareholders. 9 – Grow loans by 9% per year, funded with core deposits 6 – Grow fee income no less than 6% per year 5 – Improve efficiencies and hold expense growth to no more than 5% 13 S T R A T E G Y

Financial Highlights

ASSET GROWTH 15 $2 . 2 $2 . 2 $2 . 9 $3 . 5 $4 . 4 $4 . 9 $5 . 7 62 . 6% 67 . 6% 71 . 9% 73 . 8% 75 . 0% 75 . 2% 74 . 8% 2014 2015 2016 2020 Total Assets 2017 2018 2019 Total Loans & Leases/Total Assets A Consistent Track Record of Asset Growth Asset growth has been driven by a combination of organic growth and strategic acquisitions (1) Rockford Bank & Trust assets were removed from this data. (2) includes $237.2 million of the assets of m2 Equipment Finance, as this entity is wholly - owned by and consolidated with Quad City Bank and Trust. Recent Acquisitions (Assets at acquisition date ($ Millions)): 2013: Community National Bancorporation ($288) 2016: Community State Bank ($582) 2017: Guaranty Bankshares, Ltd. ($260) 2018: Springfield Bancshares, Inc. ($576) $780 . 0 13% $1,000.7 17% $2 , 149 . 5 37% $1 , 952 . 3 33% Quad City Bank and Trust (2) Cedar Rapids Bank and Trust Community State Bank Springfield First Community Bank Asset Distribution by Charter as of 12/31/20 ($MM) Total Consolidated Assets ($B) (1)

32% 34% 31% 25% 20% 20% 25% 47% 48% 52% 60% 57% 62% 65% 17% 15% 15% 13% 16% 16% 4% 2% 2% 7% 4% $1 . 6 3% $1 . 4 $2 . 4 $2 . 9 $3 . 5 $3 . 9 $4.6 10% 20 1 4 20 1 5 20 1 6 Noninterest - bearing Deposits 20 1 7 20 1 8 20 1 9 20 2 0 Interest - bearing Deposits Time Deposits Brokered Deposits Deposit Growth Driven by Core Deposits $ in billions Core Deposits (1) Represent Virtually All of Total Deposits as of 12/31/20 (1) Core deposits are defined as total deposits less brokered deposits. Rockford Bank & Trust deposits excluded from this data. DEPOSIT GROWTH 16

$0 . 4 $0 . 5 $0 . 7 $1 . 0 $1 . 3 $1 . 5 $1 . 7 $0 . 6 $0 . 6 $0 . 9 $1 . 1 $1 . 6 $1 . 8 $2 . 1 $0 . 2 $0 . 2 $0 . 2 $0 . 2 $0 . 1 $0 . 1 $0 . 2 $0 . 2 $0 . 2 $0 . 1 $0 . 2 $0 . 1 $0 . 2 $0 . 1 $0 . 1 $0 . 1 $0 . 1 $0 . 1 $0 . 1 $2. 1 $0.1 $1. 4 $1. 5 $2. 6 $3. 3 $3. 7 $4. 3 $0.1 20 1 4 2015 Commercial & Industrial 2016 Commercial RE 2017 Direct Fin. Leases 2018 Residential RE 2019 Consumer & Other 20 2 0 Loan Growth Driven by Commercial Lending $ in billions Commercial Loans (1) Represent Approximately 90% of the Loan Portfolio as of 12/31/20 (1) Includes Commercial & Industrial, Commercial RE and Direct Financing Lease. Loan composition excludes deferred loan/lease origination costs, net of fees. Rockford Bank & Trust is excluded from this data. LOAN GROWTH 17

18 Strong Pre - Provision, Pre - Tax Earnings EARNINGS $46 $42 $64 $78 $132 $29 $20 $20 $0 $40 $60 $80 $100 $120 $140 2014 2015 2019 2020 2016 2017 2018 Pre - Provision, Pre - Tax Earnings (in Millions) Rockford Bank & Trust data excluded.
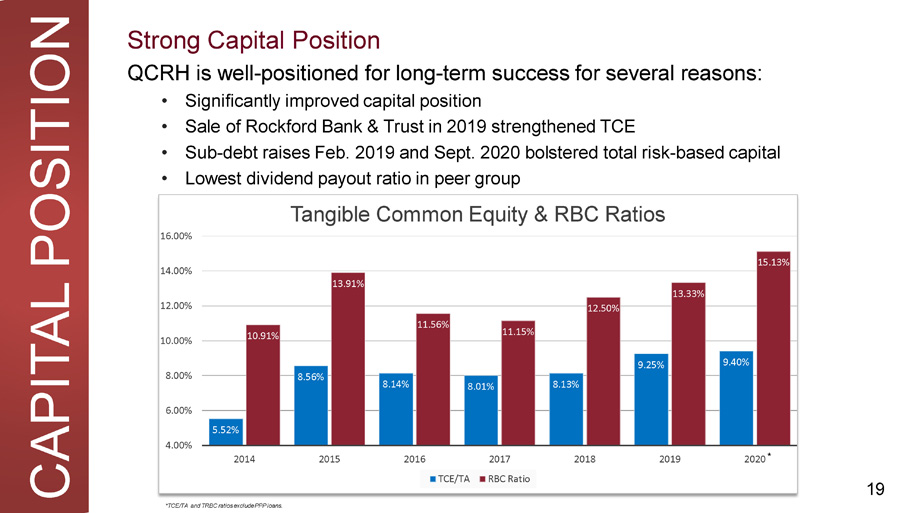
19 CAPITAL POSITION Strong Capital Position 5.52% 8.56% 8.14% 8.01% 8.13% 9.25% 9.40% 10 . 91% 13 . 91% 11 . 56% 11 . 15% 12 . 50% 13 . 33% 15 . 13% 4.00% 6.00% 8.00% 10 . 00% 12 . 00% 14 . 00% 16 . 00% 2014 2015 201 6 2017 2018 2019 QCRH is well - positioned for long - term success for several reasons: • Significantly improved capital position • Sale of Rockford Bank & Trust in 2019 strengthened TCE • Sub - debt raises Feb. 2019 and Sept. 2020 bolstered total risk - based capital • Lowest dividend payout ratio in peer group Tangible Common Equity & RBC Ratios TCE/TA RBC Ratio 2020 * *TCE/TA and TRBC ratios exclude PPP loans.

ASSET QUALITY 20 94.0% 1.0% 5.0% 0 . 0% Nonaccrual Loans/Leases Other Real Estate Owned & Repossessed Assets Accruing Loans/Leases past due 90 days or more Troubled Debt Restructures – Accruing Asset Quality Management remains focused on maintaining excellent asset quality and resolving problem assets $14.8 million Classified Loans & NPAs / Assets Nonperforming Assets Composition as of 12/31/20 $35 .7 $28 .0 $49 .0 $43 .7 $28 .6 $66 .1 1.31% 0.74% 0.82% 0.81% 0.56% 0.27% 0 . 26% 1 2 3 4 5 6 7 Classified Loans NPAs / Assets (%) $ in millions $33 . 6 2014 2015 2016 2017 2018 2019 2020
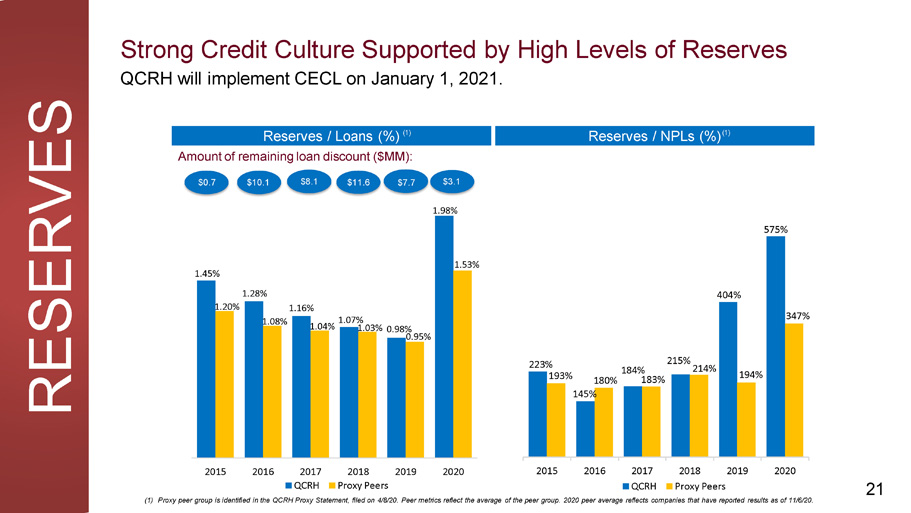
223% 145% 184% 404% 575% 193% 180% 183% 215% 214% 194% 347% 201 8 201 9 202 0 201 5 2016 Proxy Peers 2017 Q C RH 2018 2019 2020 Proxy Peers 1 . 45% 1 . 28% 1 . 16% 1 . 07% 1 . 98% 1 . 20% 1 . 08% 1 . 04% 1.03% 0.98% 0 . 95% 1 . 53% 2015 2016 2017 QCRH (1) Proxy peer group is identified in the QCRH Proxy Statement, filed on 4/8/20. Peer metrics reflect the average of the peer group. 2020 peer average reflects companies that have reported results as of 11/6/20. Strong Credit Culture Supported by High Levels of Reserves QCRH will implement CECL on January 1, 2021. Reserves / Loans (%) (1) Reserves / NPLs (%) (1) $3 . 1 Amount of remaining loan discount ($MM): $0.7 $10.1 $8.1 $11.6 $7.7 R ESE R VES 21

77% 75% 75% 79% 77% 66% 59% 23% 25% 25% 21% 23% 34% 41% $77 $87 $110 $130 $167 $234 2014 2015 2019 2020 2016 2017 2018 Net Interest Income Noninterest Income Strong Revenue Growth and Attractive Mix Predictable and diversified fee income streams complement net interest income $ in millions $281 Key Components of Fee Income: • Wealth Management ( $4.4 billion in assets under administration as of 12/31/20) • Correspondent banking ( 192 relationships as of 12 / 31 / 20 ) • SBA & USDA guaranteed loan sales • Swap fee income (1) All data excludes Rockford Bank & Trust and 2019 excludes $12.3 million gained on sale from the RB&T transaction. ( 1 ) REVENUE 22
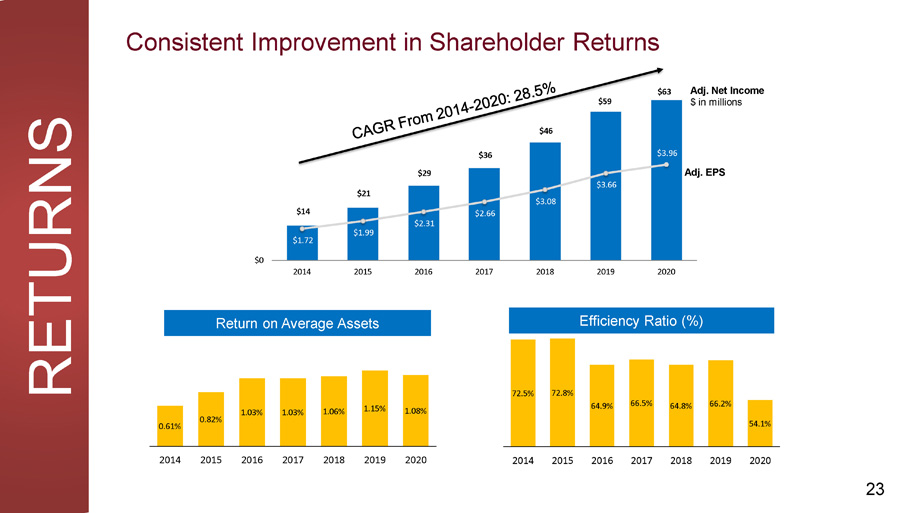
$14 $21 $29 $36 $46 $59 $63 $2.66 $3.08 $3.66 $3.96 $2.31 $1.99 $1.72 $0 2014 2015 2016 2017 2018 2019 2020 Consistent Improvement in Shareholder Returns 0.61% 0.82% 1.03% 1.03% 1.06% 1.15% 1.08% 2014 2015 2016 2017 2018 2019 2020 Return on Average Assets 72.5% 72.8% 64.9% 66.5% 64.8% 66.2% 54.1% 201 4 201 5 201 6 201 7 201 8 201 9 2020 Efficiency Ratio (%) Adj. Net Income $ in millions Adj. EPS RETURNS 23

COVID - 19 EXPOSURE Q4 2020

PPP & LRP Participation

In 2020, QCRH originated 1,698 PPP loans with a total of $358MM. • As of Dec. 31, 2020, 316 of these loans, totaling $85MM were paid off. This total includes the acquisition of new, highly desired clients in our existing markets: • Number of new client loans: 309 (18% of total PPP loans) • Total of new client loans: $63MM Client Participation in the Paycheck Protection Program (PPP) PPP 26 PPP Loans and Balances as of Dec. 31, 2020 PPP Loan Size # of Loans Total ($MM) Average Loan Size < $350 K * 1 , 223 $86 M M $154K $350K - $2MM 132 $102 M M $774K > $2 M M 27 $85 M M $3 , 000K T O T A L 1 , 382 $273 M M $198K * PPP loans $50K or less accounted for 684 loans, totaling $14MM with an average loan size of $21K.

The QCRH LRP offers immediate payment relief to consumer and small business loan clients. • As of Dec. 31, 2020, there were $28MM or 0.66% of total loans and leases still on deferral. • This is down from $83MM or 1.98% of total loans and leases on deferral, as of Sept. 30, 2020. Loan Relief Program Impact on NPAs: • As of Dec. 31, 2020, five loans totaling $1.3 million received deferrals and are now classified as nonperforming assets. QCRH Loan Relief Program (LRP) LOAN RELIEF 27
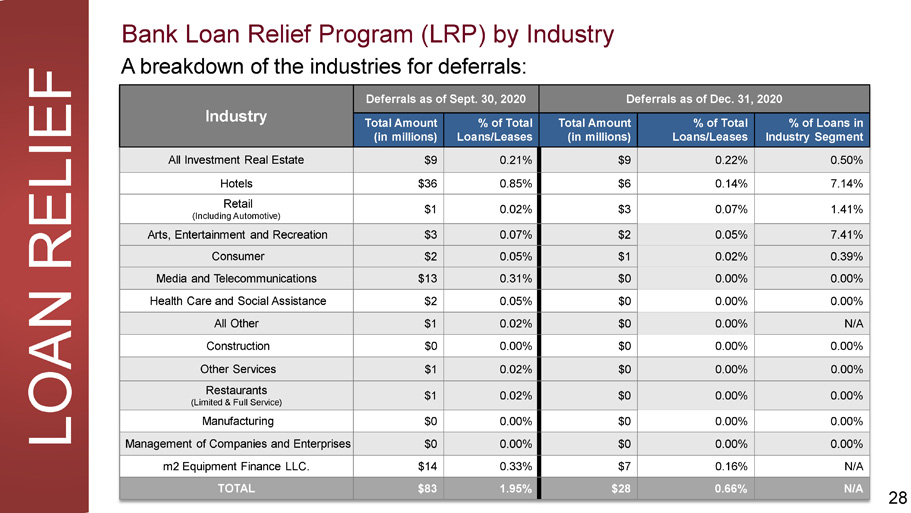
LOAN RELIEF Bank Loan Relief Program (LRP) by Industry A breakdown of the industries for deferrals: 28 Industry Deferrals as of Sept. 30, 2020 Deferrals as of Dec. 31, 2020 Total Amount (in millions) % of Total Lo a ns /L e a s es Total Amount (in millions) % of Total Lo a ns /L e a s es % of Loans in Industry Segment All Investment Real Estate $ 9 0.21 % $ 9 0.22 % 0.50 % Hotels $36 0.85 % $ 6 0.14 % 7.14 % Retail (Including Automotive) $ 1 0.02 % $ 3 0.07 % 1.41 % Arts, Entertainment and Recreation $ 3 0.07 % $ 2 0.05 % 7.41 % Consumer $ 2 0.05 % $ 1 0.02 % 0.39 % Media and Telecommunications $13 0.31 % $ 0 0.00 % 0.00 % Health Care and Social Assistance $ 2 0.05 % $ 0 0.00 % 0.00 % All Other $ 1 0.02 % $ 0 0.00 % N/A Construction $ 0 0.00 % $ 0 0.00 % 0.00 % Other Services $ 1 0.02 % $ 0 0.00 % 0.00 % Restaurants (Limited & Full Service) $ 1 0.02 % $ 0 0.00 % 0.00 % Manufacturing $ 0 0.00 % $ 0 0.00 % 0.00 % Management of Companies and Enterprises $ 0 0.00 % $ 0 0.00 % 0.00 % m2 Equipment Finance LLC. $14 0.33 % $ 7 0.16 % N/A TOTAL $83 1.95 % $28 0.66 % N/A
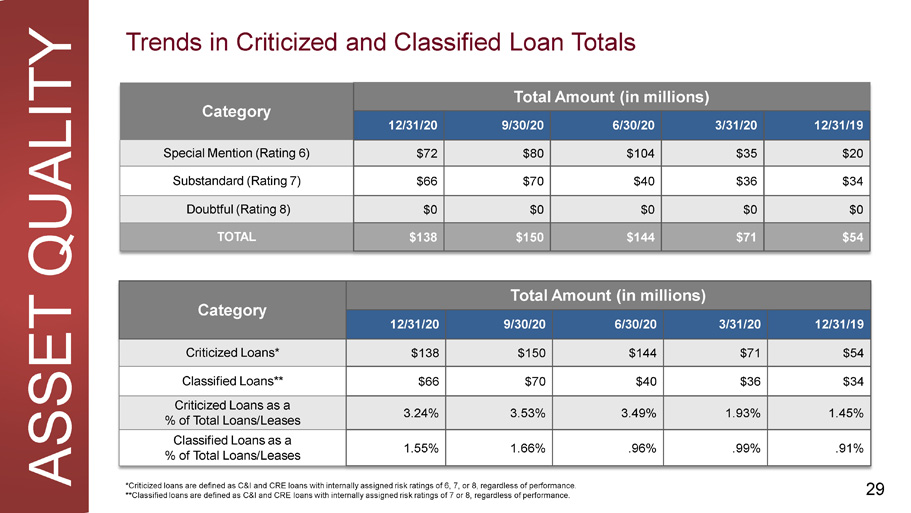
Trends in Criticized and Classified Loan Totals ASSET QUALITY 29 Category Total Amount (in millions) 12 / 31 / 20 9 / 30 / 20 6 / 30 / 20 3 / 31 / 20 12 / 31 / 19 Special Mention (Rating 6) $72 $80 $104 $35 $20 Substandard (Rating 7) $66 $70 $40 $36 $34 Doubtful (Rating 8) $0 $0 $0 $0 $0 TOTAL $138 $150 $144 $71 $54 Category Total Amount (in millions) 12 / 31 / 20 9 / 30 / 20 6 / 30 / 20 3 / 31 / 20 12 / 31 / 19 Criticized Loans* $138 $150 $144 $71 $54 Classified Loans** $66 $70 $40 $36 $34 Criticized Loans as a % of Total Loans/Leases 3 . 24% 3 . 53% 3 . 49% 1 . 93% 1 . 45% Classified Loans as a % of Total Loans/Leases 1 . 55% 1 . 66% . 96% . 99% . 91% *Criticized loans are defined as C&I and CRE loans with internally assigned risk ratings of 6, 7, or 8, regardless of performance. **Classified loans are defined as C&I and CRE loans with internally assigned risk ratings of 7 or 8, regardless of performance.

Industry Concentration Disclosures

P R I M A R Y The following industries were deemed higher risk in our commercial loan portfolio due to the COVID - 19 pandemic. As of Dec. 31: Industry A m o unt % of Total Loans Hotels $84 M M 1 . 98% Restaurants $36 M M 0 . 85% Arts, Entertainment and Recreation $27 M M 0 . 63% Aviation $0 M M 0 . 00% Energy $0 M M 0 . 00% TOTAL $147 M M 3 . 46% Primary Industry Concentration Overview 31

SE C O ND A R Y Secondary Industry Concentration | Retail As of Dec. 31, QCRH retail exposure was $213MM, or 5.01% of total loans. Overview in Our Markets • Grocery - related sales continue to grow. • Automotive/truck sales in our markets remain strong and better than the national average, which reported an estimated 15% decline from the previous year. • Sales at bars and traditional restaurants slid as typical holiday outings were cancelled. 32 Retail A m ount % of Total Loans Retail Investment CRE $133 M M 3 . 13% C&I Retail $34 M M 0 . 80% Retail Owner Occupied CRE $25 M M 0 . 59% Other $21 M M 0 . 49% TOTAL $213 M M 5 . 01%

APPENDIX

QUAD CITY BANK & TRUST John H. Anderson, CEO Laura “Divot” Ekizian, President Assets: $2.1 Billion 1 (as of 12/31/20) Population: 382,268 Market Deposits: $8.2 Billion (1) Includes $241.5 million of the assets of m2 Equipment Finance, as this entity is wholly - owned and consolidated with the bank. Source: FDIC deposit market share data as provided by S&P Global.. Deposit data is as of 9/30/20 * Dollars in millions. Institution Name Offices in MSA Deposits* ($ in millions) M a r ket Share 1. Quad City Bank & Trust 5 1,708.0 18.6% 2. Wells Fargo & Co. 10 1,272.2 14.0% 3. Blackhawk Bancorp. Inc. 18 1,034.3 11.4% 4. U.S. Bancorp 10 875.5 9.6% 5. Orion Bancorp. Inc. 8 438.7 4.8% 6. Triumph Bancorp Inc. 10 435.1 4.8% 7. First Midwest Bancorp Inc. 4 380.0 4.2% 8. AmBank Holdings Inc. 8 324.4 3.6% 9. Prophetstown Banking Co. 1 228.5 2.5% 10. Northwest Investment Co. 3 200.4 2.2% MARKET SHARE Deposit Market Share 34 CEDAR RAPIDS BANK & TRUST Deposit Institution Name Market S Offices in MSA hare Deposits* ($ in millions) M a r ket Share 1. Cedar Rapids Bank & Trust 5 1,195.8 16.5% Larry J. Helling, CEO 2. U.S. Bancorp 7 1,026.9 14.2% 3. James Klein, President Wells Fargo & Co. 9 794.4 11.0% 4. Neighbor Insurance Agency Inc. 9 784.1 10.8% Assets: $2.0 Billion (as of 12/31/20) 5. Hills Bancorp. 7 612.1 8.5% 6. Population: 271,952 BTC Financial Corp. 3 306.7 4.2% 7. Dunn Investment Co. 4 281.8 3.9% Market Deposits: $5.9 Billion 8. Fidelity Ban Corp. 3 175.6 2.4% 9. Ohnward Bancshares Inc. 4 168.2 2.3% 10. Country Bancorp. 5 154.8 2.1%

Source: FDIC deposit market share data as provided by S&P Global. Deposit data is as of 9/30/20. * Dollars in millions. COMMUNITY BANK & TRUST Stacey J . Bentley, President & CEO Assets : $ 231 Million (as of 12 / 31 / 20 ) Population : 169 , 565 Market Deposits : $ 1 . 7 Billion Institution Name Offices in MSA Deposits* ($ in millions) M a r ket Share 1. FSB Financial Services Inc. 6 793.9 30.5% 2. U.S. Bancorp 6 457.6 17.6% 3. Wells Fargo & Co. 3 284.9 10.9% 4. Lincoln Bancorp 4 194.5 7.5% 5. Regions Financial Corp. 3 163.4 6.3% 6. Fidelity Ban Corp. 3 158.9 6.1% 7. Community Bank and Trust 3 156.0 6.0% 8. First of Waverly Corp. 1 98.3 3.8% 9. Great Western Bancorp Inc. 2 87.0 3.3% 10. Evans Bancshares Inc. 2 83.2 3.2% MARKET SHARE Deposit Market Share (Black Hawk County) 35 COMMUNITY STATE BANK Kurt A. Gibson, President & CEO Assets: $1.0 Billion (as of 12/31/20) Population: 682,877 Des Moines/West Des Moines MSA Market Deposits: $18.7 Billion Institution Name Offices in MSA Deposits* ($ in millions) M a r ket Share 1. Wells Fargo & Co. 18 3,610.2 15.2% 2. BTC Financial Corp. 19 3,338.1 14.0% 3. West Bancorporation, Inc. 8 1,850.6 7.8% 4. U.S. Bancorp 13 1,499.9 6.3% 5. Great Western Bancorp Inc. 11 1,258.5 5.3% 6. Bank of America Corp. 3 1,250.5 5.3% 7. Community State Bank 10 778.5 3.3% 8. BNP Paribas SA 12 547.1 2.3% 9. Albrecht Financial Services Inc. 7 392.9 1.7% 10. Bank Iowa Corp. 6 373.5 1.6% Deposit Market Share

SFC BANK Monte C. McNew, President & CEO Assets: $780 Million (as of 12/31/20) Population: 467,912 Springfield, MO - MSA Market Deposits: $9.9 Billion Source: FDIC deposit market share data as provided by S&P Global. Deposit data is as of 9/30/20. * Dollars in millions. Institution Name Offices in MSA Deposits* ($ in millions) M a r ket Share 1. Great Southern Bancorp Inc. 20 2,220.3 16.7% 2. Commerce Bancshares Inc. 11 1,481.6 11.1% 3. Central Banco. Inc. 22 1,411.5 10.6% 4. Guaranty Federal Bancshares Inc. 10 750.6 5.6% 5. OakStar Bancshares Inc. 6 673.0 5.1% 6. Bank of America Corp. 4 648.6 4.9% 7. SFC Bank 1 564.7 4.2% 8. Reliable Community Bancshares Inc. 12 549.9 4.1% 9. U.S. Bancorp 11 512.6 3.9% 10. Simmons First National Corp. 8 443.8 3.3% MARKET SHARE Deposit Market Share 36
3551 Seventh Street Moline, IL 61265 ww w .Q CRH . c o m © Copyright 2021 QCR Holdings, Inc. All Rights Reserved