Attached files
| file | filename |
|---|---|
| EX-99.1 - EXHIBIT 99.1 - CIRRUS LOGIC, INC. | a52370661ex99_1.htm |
| 8-K - CIRRUS LOGIC, INC. 8-K - CIRRUS LOGIC, INC. | a52370661.htm |
|
Exhibit 99.2
|
6 Q3 FY21Letter to ShareholdersFebruary 1, 2021
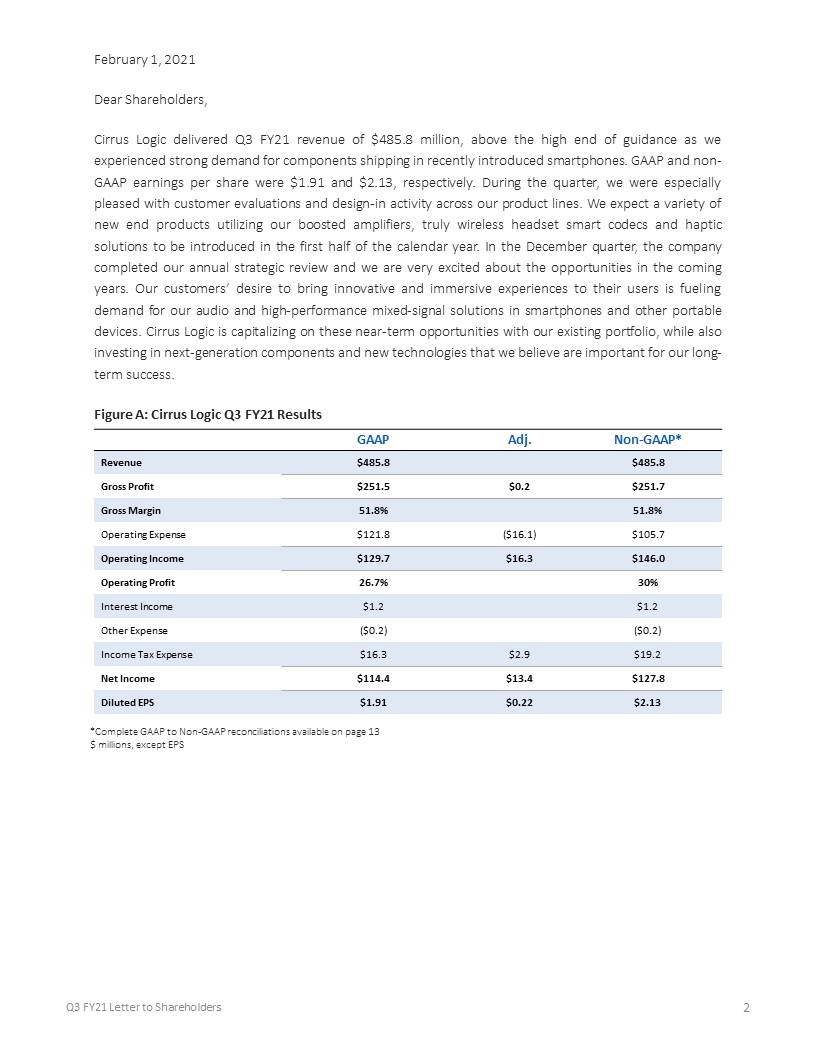
2 Q3 FY21 Letter to Shareholders GAAP Adj. Non-GAAP* Revenue $485.8 $485.8 Gross
Profit $251.5 $0.2 $251.7 Gross Margin 51.8% 51.8% Operating Expense $121.8 ($16.1) $105.7 Operating Income $129.7 $16.3 $146.0 Operating Profit 26.7% 30% Interest Income $1.2 $1.2 Other
Expense ($0.2) ($0.2) Income Tax Expense $16.3 $2.9 $19.2 Net Income $114.4 $13.4 $127.8 Diluted EPS $1.91 $0.22 $2.13 *Complete GAAP to Non-GAAP reconciliations available on page 13$ millions, except EPS February 1, 2021Dear
Shareholders,Cirrus Logic delivered Q3 FY21 revenue of $485.8 million, above the high end of guidance as we experienced strong demand for components shipping in recently introduced smartphones. GAAP and non-GAAP earnings per share were $1.91 and
$2.13, respectively. During the quarter, we were especially pleased with customer evaluations and design-in activity across our product lines. We expect a variety of new end products utilizing our boosted amplifiers, truly wireless headset smart
codecs and haptic solutions to be introduced in the first half of the calendar year. In the December quarter, the company completed our annual strategic review and we are very excited about the opportunities in the coming years. Our customers’
desire to bring innovative and immersive experiences to their users is fueling demand for our audio and high-performance mixed-signal solutions in smartphones and other portable devices. Cirrus Logic is capitalizing on these near-term
opportunities with our existing portfolio, while also investing in next-generation components and new technologies that we believe are important for our long-term success. Figure A: Cirrus Logic Q3 FY21 Results
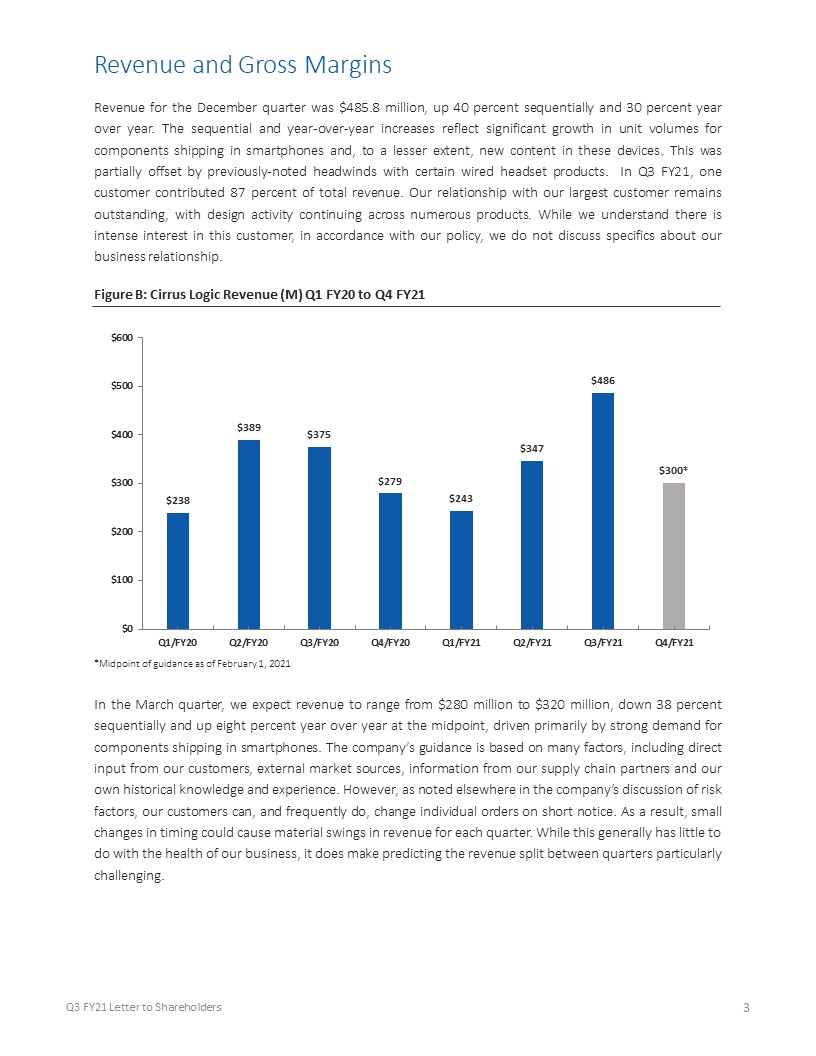
3 Q3 FY21 Letter to Shareholders Revenue and Gross MarginsRevenue for the December quarter was $485.8
million, up 40 percent sequentially and 30 percent year over year. The sequential and year-over-year increases reflect significant growth in unit volumes for components shipping in smartphones and, to a lesser extent, new content in these
devices. This was partially offset by previously-noted headwinds with certain wired headset products. In Q3 FY21, one customer contributed 87 percent of total revenue. Our relationship with our largest customer remains outstanding, with design
activity continuing across numerous products. While we understand there is intense interest in this customer, in accordance with our policy, we do not discuss specifics about our business relationship. Figure B: Cirrus Logic Revenue (M) Q1 FY20
to Q4 FY21 *Midpoint of guidance as of February 1, 2021 In the March quarter, we expect revenue to range from $280 million to $320 million, down 38 percent sequentially and up eight percent year over year at the midpoint, driven primarily by
strong demand for components shipping in smartphones. The company’s guidance is based on many factors, including direct input from our customers, external market sources, information from our supply chain partners and our own historical knowledge
and experience. However, as noted elsewhere in the company’s discussion of risk factors, our customers can, and frequently do, change individual orders on short notice. As a result, small changes in timing could cause material swings in revenue
for each quarter. While this generally has little to do with the health of our business, it does make predicting the revenue split between quarters particularly challenging.
4 Q3 FY21 Letter to Shareholders GAAP gross margin in the December quarter was 51.8 percent, compared to
51.9 percent in Q2 FY21 and 52.7 percent in Q3 FY20. Non-GAAP gross margin was 51.8 percent, compared to 51.9 percent in Q2 FY21 and 52.8 percent in Q3 FY20. The year-over-year decline in gross margin reflects a shift in product mix and, to a
lesser extent, typical pricing reductions on certain components, partially offset by a benefit of lower reserves versus Q3 FY20. We expect gross margin to range from 50 percent to 52 percent in Q4 FY21. Operating Profit, Earnings and
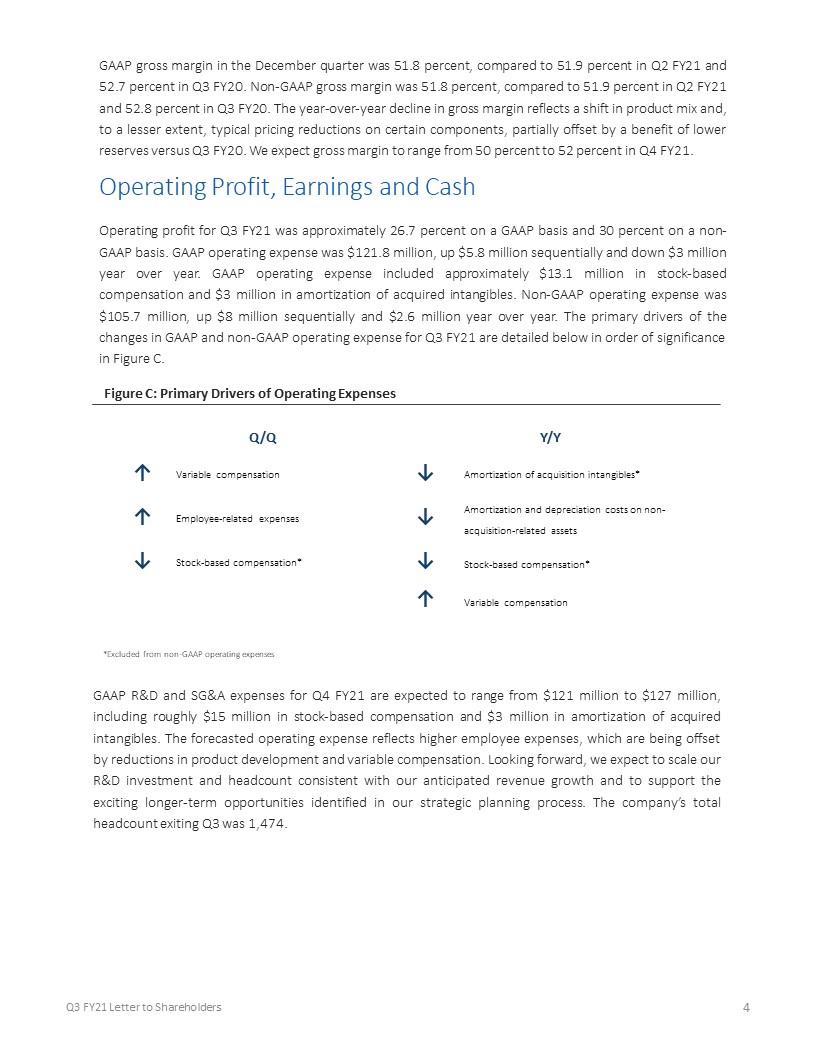
CashOperating profit for Q3 FY21 was approximately 26.7 percent on a GAAP basis and 30 percent on a non-GAAP basis. GAAP operating expense was $121.8 million, up $5.8 million sequentially and down $3 million year over year. GAAP operating expense
included approximately $13.1 million in stock-based compensation and $3 million in amortization of acquired intangibles. Non-GAAP operating expense was $105.7 million, up $8 million sequentially and $2.6 million year over year. The primary
drivers of the changes in GAAP and non-GAAP operating expense for Q3 FY21 are detailed below in order of significance in Figure C. GAAP R&D and SG&A expenses for Q4 FY21 are expected to range from $121 million to $127 million, including
roughly $15 million in stock-based compensation and $3 million in amortization of acquired intangibles. The forecasted operating expense reflects higher employee expenses, which are being offset by reductions in product development and variable
compensation. Looking forward, we expect to scale our R&D investment and headcount consistent with our anticipated revenue growth and to support the exciting longer-term opportunities identified in our strategic planning process. The
company’s total headcount exiting Q3 was 1,474. Figure C: Primary Drivers of Operating Expenses *Excluded from non-GAAP operating expenses Q/Q Y/Y ↑ Variable compensation ↓ Amortization of acquisition
intangibles* ↑ Employee-related expenses ↓ Amortization and depreciation costs on non-acquisition-related assets ↓ Stock-based compensation* ↓ Stock-based compensation* ↑ Variable compensation
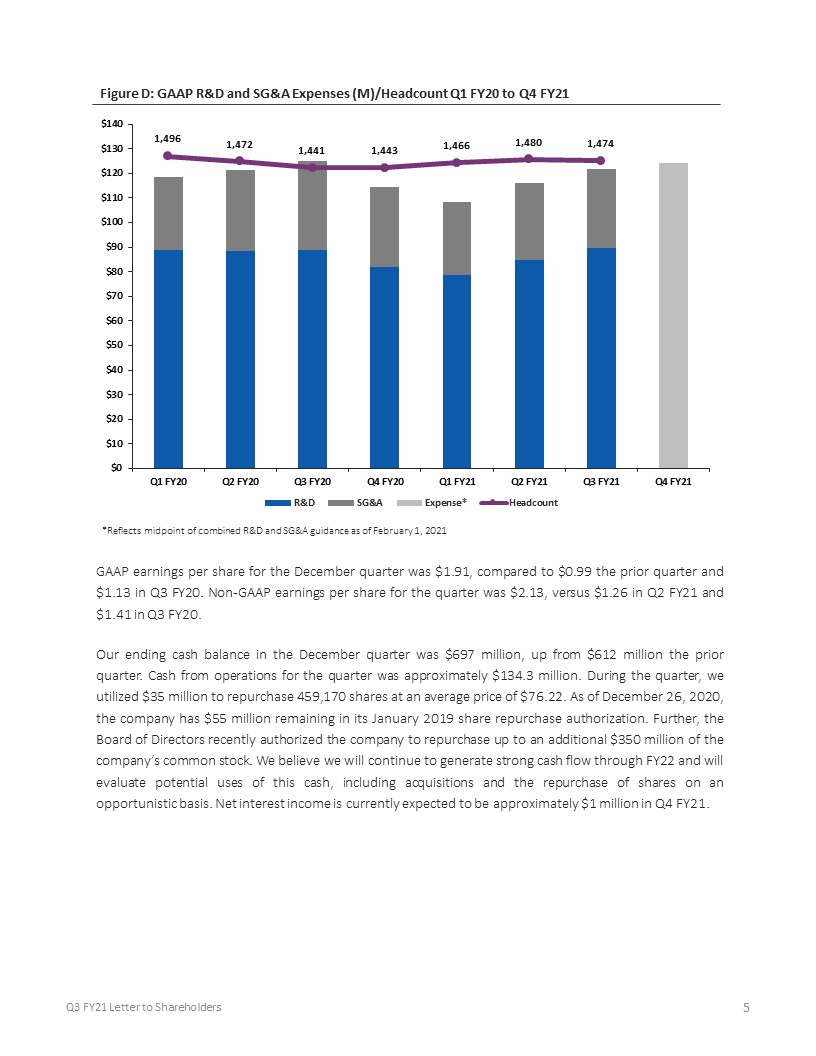
5 Q3 FY21 Letter to Shareholders Figure D: GAAP R&D and SG&A Expenses (M)/Headcount Q1 FY20 to Q4
FY21 *Reflects midpoint of combined R&D and SG&A guidance as of February 1, 2021 GAAP earnings per share for the December quarter was $1.91, compared to $0.99 the prior quarter and $1.13 in Q3 FY20. Non-GAAP earnings per share for the
quarter was $2.13, versus $1.26 in Q2 FY21 and $1.41 in Q3 FY20.Our ending cash balance in the December quarter was $697 million, up from $612 million the prior quarter. Cash from operations for the quarter was approximately $134.3 million.
During the quarter, we utilized $35 million to repurchase 459,170 shares at an average price of $76.22. As of December 26, 2020, the company has $55 million remaining in its January 2019 share repurchase authorization. Further, the Board of
Directors recently authorized the company to repurchase up to an additional $350 million of the company’s common stock. We believe we will continue to generate strong cash flow through FY22 and will evaluate potential uses of this cash, including
acquisitions and the repurchase of shares on an opportunistic basis. Net interest income is currently expected to be approximately $1 million in Q4 FY21.
6 Q3 FY21 Letter to Shareholders Taxes and Inventory For the December quarter, we realized GAAP tax
expense of $16.3 million on GAAP pre-tax income of $130.6 million, resulting in an effective tax rate of 12.5 percent. Non-GAAP tax expense for the quarter was $19.2 million on non-GAAP pre-tax income of $146.9 million, resulting in an effective
tax rate of 13.1 percent. Non-GAAP tax expense for the quarter includes the effect of higher non-GAAP income in various jurisdictions. We expect the worldwide non-GAAP effective tax rate to be approximately 12 percent to 14 percent for FY21. We
expect that our worldwide non-GAAP effective tax rate in FY22 will range from 13 percent to 15 percent.Q3 FY21 inventory was $142.7 million, down from $209.1 million in Q2 FY21. Cirrus Logic, like the majority of the semiconductor industry, has
been experiencing demand in excess of supply. While we continue to see some capacity constraints, our supply chain team is focused on addressing any associated challenges and providing outstanding support to our customers. We expect inventory in
Q4 FY21 to increase as we fulfill ongoing demand and manage inventory ahead of ramps later in the calendar year. Company Strategy We are delighted with our progress in the December quarter as we continued to support production of recently
introduced smartphones and experienced strong design momentum across our portfolio. The company has identified three growth vectors that we believe will contribute to our long-term success. First, we anticipate strengthening our position as the
leading audio supplier in smartphones. Second, we are focused on increasing sales of audio components in applications beyond smartphones. And third, we are drawing on our extensive mixed-signal engineering expertise to develop technology in new
product areas that we believe will drive diversification beyond the audio domain. With a robust portfolio of products available today and a pipeline of innovative new components in development, we are optimistic about our ability to execute on
this strategic plan, which we believe will drive both revenue growth opportunities and product diversification in the coming years. During the quarter, design activity for audio components shipping in flagship and mid-tier Android smartphones
accelerated and we anticipate new devices utilizing our products to be introduced in the first half of the calendar year. We experienced robust demand for our latest-generation high-voltage boosted amplifier, which features enhanced dynamics,
higher power output and battery-management technology that enables louder sound while preventing speaker damage and brownouts. Innovations in industrial design, including OEM’s ongoing desire to maximize screen size along with new form factors
such as foldable and flip phones, are also creating further opportunities for our audio components. Cirrus Logic’s boosted amplifiers and advanced algorithms are particularly well-suited to address the performance and power challenges associated
with
7 Q3 FY21 Letter to Shareholders delivering a consistent and compelling user experience in these form
factors. With strong customer engagements and a solid pipeline of design wins expected to come to market over the next 12-months, we are optimistic about our ability to broaden our penetration in Android smartphones. Building on our success as a
leading supplier of audio products in smartphones, the company is focused on expanding in other application areas including tablets, wearables, truly wireless headsets, laptops and virtual reality headsets. Similar to many consumer markets, these
exciting application spaces have a wide range of retail price points, and Cirrus Logic is targeting segments where we can service demand for differentiated audio and voice technology while maximizing our return on investment. We are pleased to be
ramping shipments of our second-generation general market smart codec with two leading truly wireless headset brands. This component incorporates hybrid active noise cancellation and high-quality audio playback with enhanced features for
environmental listening, hearing augmentation and personal sound amplification products (PSAP) functionality. We also experienced strong demand for boosted amplifiers and smart codecs shipping in tablets, including our first Android tablet design
win with our latest-generation boosted amplifier. We continue to believe there will be further opportunities for boosted amplifiers in larger screen computing devices, including tablets and ultrabooks. Market trends indicate that the average
number of speakers, and therefore the number of boosted amplifiers required, per device is increasing. Additionally, as larger screen computing devices are being designed to be thinner and lighter weight, OEMs face similar challenges that
smartphone manufacturers have encountered for years with delivering a high-quality and loud experience to consumers. While this market is still developing, Cirrus Logic’s technologies directly align with these trends by enabling high-quality,
multi-channel audio performance in space and battery constrained systems. Drawing on our extensive mixed-signal design and low-power processing expertise, Cirrus Logic has expanded beyond our traditional audio domain into new categories including
haptic driver and sensing solutions, camera controllers and a power conversion and control IC. While audio remains an important growth vector, we believe these new high-performance mixed-signal technologies will drive product diversification and
fuel exciting avenues of growth in the coming years. In Q3, we were encouraged with customer evaluations and design activity utilizing our haptic driver and sensing solutions for smartphones, wearables and laptops. Additionally, we began sampling
our latest-generation haptic driver with additional signal processing capabilities and new advanced algorithms and are pleased with initial indications from customers as they move forward with evaluation and design-in. During the quarter, we
continued to ramp our camera controller in recently launched smartphones and are delighted with the positive reviews around the functionality we support. The low-latency processing and high-precision data conversion capabilities of this device
enable our customer to deliver significantly improved image capture results. We also continued to work closely with a key customer on a power conversion and control IC that we expect to ramp in the second half of calendar year 2021.
8 Q3 FY21 Letter to Shareholders Longer-term, the company has several advanced processes, intellectual
property and technology developments in progress that we believe are important for the execution of our roadmap of smart codecs, boosted amplifiers, and other new high-performance mixed-signal solutions. These investments include utilizing
22-nanometer process node technology to facilitate smaller components with high-performance mixed-signal circuits, coupled with ultra-low power processing and advanced functionality. Further, we are investing in higher voltage capabilities and
advanced embedded processing features for boosted amplifiers, haptic drivers and other new high-performance mixed-signal products in adjacent technology domains. With a robust intellectual property portfolio and an outstanding engineering team,
Cirrus Logic is investing significantly in technologies that we expect to fuel long-term growth. Summary and GuidanceFor the March quarter we expect the following results:Revenue to range between $280 million and $320 million; GAAP gross margin
to be between 50 percent and 52 percent; and Combined GAAP R&D and SG&A expenses to range between $121 million and $127 million, including approximately $15 million in stock-based compensation expense and $3 million in amortization of
acquired intangibles. In summary, we are delighted with our results in the December quarter, as higher than anticipated demand for certain components shipping in smartphones drove revenue above guidance. We continue to be amazed by what our team
has been able to accomplish during the unusual and challenging circumstances of the last year. We believe that this dedication and talent, combined with our innovative roadmap and the strength of our relationships with the leaders in the markets
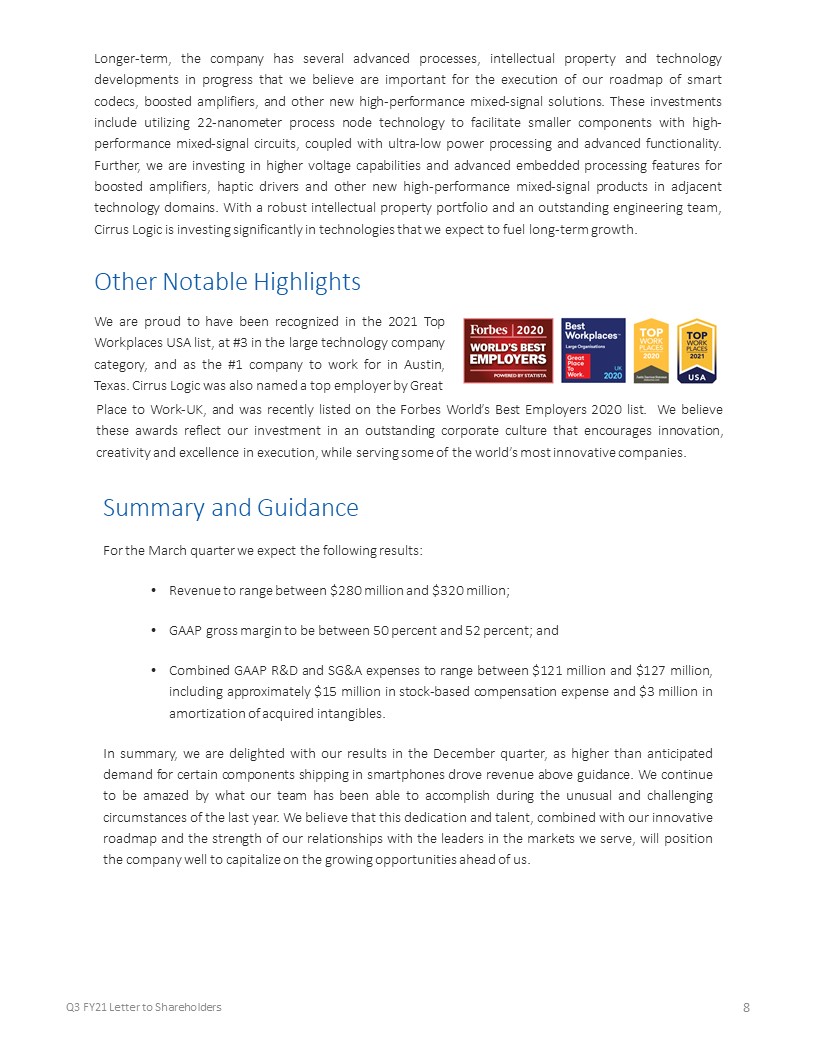
we serve, will position the company well to capitalize on the growing opportunities ahead of us. Other Notable Highlights We are proud to have been recognized in the 2021 Top Workplaces USA list, at #3 in the large technology company category,
and as the #1 company to work for in Austin, Texas. Cirrus Logic was also named a top employer by Great Place to Work-UK, and was recently listed on the Forbes World’s Best Employers 2020 list. We believe these awards reflect our investment in
an outstanding corporate culture that encourages innovation, creativity and excellence in execution, while serving some of the world’s most innovative companies.
9 Q3 FY21 Letter to Shareholders Sincerely, John ForsythPresident & Chief Executive
Officers Thurman CaseChief Financial Officer Conference Call Q&A SessionCirrus Logic will host a live Q&A session at 5 p.m. EST today to answer questions related to its financial results and business outlook. Participants may listen
to the conference call on the Cirrus Logic website. Participants who would like to submit a question to be addressed during the call are requested to email investor@cirrus.com.A replay of the webcast can be accessed on the Cirrus Logic website
approximately two hours following its completion, or by calling (416) 621-4642 or toll free at (800) 585-8367 (Access Code: 5791509 ). Use of Non-GAAP Financial InformationTo supplement Cirrus Logic's financial statements presented on a GAAP
basis, Cirrus has provided non-GAAP financial information, including non-GAAP net income, diluted earnings per share, operating income and profit, operating expenses, gross margin and profit, tax expense, tax expense impact on earnings per share,
and effective tax rate. A reconciliation of the adjustments to GAAP results is included in the tables below. We are also providing guidance on our non-GAAP expected effective tax rate. We are not able to provide guidance on our GAAP tax rate or a
related reconciliation without unreasonable efforts since our future GAAP tax rate depends on our future stock price and related stock-based compensation information that is not currently available.Non-GAAP financial information is not meant as a
substitute for GAAP results but is included because management believes such information is useful to our investors for informational and comparative purposes. In addition, certain non-GAAP financial information is used internally by management
to evaluate and manage the company. The non-GAAP financial information used by Cirrus Logic may differ from that used by other companies. These non-GAAP measures should be considered in addition to, and not as a substitute for, the results
prepared in accordance with GAAP.
10 Q3 FY21 Letter to Shareholders Safe Harbor StatementExcept for historical information contained
herein, the matters set forth in this shareholder letter contain forward-looking statements, including statements about our long-term growth opportunities; ability to capitalize on near-term opportunities with our existing portfolio and also
meaningfully invest in next-generation and new product categories; our expectation of scaling our R&D investment and headcount with our anticipated revenue growth to support our longer-term opportunities; new product ramps and new end product
introductions in calendar year 2021; our ability to broaden our position as the leading audio supplier in smartphones; our ability to increase sales of audio components in applications beyond smartphones; our ability to develop new product areas
that will drive diversification beyond audio; our ability to execute on our strategic plan and drive growth opportunities and product diversification in the coming years; our ability to broaden our penetration in the smartphone market; our
ability to expand our penetration in other application areas including tablets, wearables, truly wireless headsets, laptops and virtual reality headsets; our ability to focus on segments where we can service strong demand for differentiated audio
and voice technology while maximizing our return on investment; our ability to capitalize on larger screen mobile computing trends and expand our share beyond smartphones; our ability to drive product diversification and fuel exciting avenues of
growth in the coming years; our ability to invest significantly in high-performance mixed-signal technologies that we believe will fuel long-term growth; our ability to develop and ramp a new power conversion and control IC with a key customer in
the second half of calendar year 2021; our ability to continue to generate strong cash flow through FY22; effective tax rate for the full fiscal year 2021 and the full fiscal year 2022; and our forecasts for the fourth quarter of fiscal year 2021
revenue, profit, net interest income, gross margin, combined research and development and selling, general and administrative expense levels, stock-based compensation expense, amortization of acquired intangibles and inventory levels. In some
cases, forward-looking statements are identified by words such as “emerge,” “expect,” “anticipate,” “foresee,” “target,” “project,” “believe,” “goals,” “opportunity,” “estimates,” “intend,” “will,” and variations of these types of words and
similar expressions. In addition, any statements that refer to our plans, expectations, strategies or other characterizations of future events or circumstances are forward-looking statements. These forward-looking statements are based on our
current expectations, estimates and assumptions and are subject to certain risks and uncertainties that could cause actual results to differ materially and readers should not place undue reliance on such statements. These risks and uncertainties
include, but are not limited to, the following: the level and timing of orders and shipments during the fourth quarter of fiscal year 2021, customer cancellations of orders, or the failure to place orders consistent with forecasts; changes with
respect to our current expectations of future smartphone unit volumes; any delays in the timing and/or success of customers’ new product ramps; failure to win new designs or additional content as expected at Android customers; the risks of doing
business internationally, including increased import/export restrictions and controls (e.g., the effect of the U.S. Bureau of Industry and Security of the U.S. Department of Commerce placing Huawei Technologies Co., Ltd. and certain of its
affiliates on the Bureau’s Entity List), imposition of trade protection measures (e.g., tariffs or taxes), security and health risks, possible disruptions in transportation networks, and other economic, social, military and geo-political
conditions in the countries in which we, our customers or our suppliers operate; recent increased industry-wide capacity constraints that may
11 Q3 FY21 Letter to Shareholders impact our ability to meet current customer demand, which could cause
an unanticipated decline in our sales and damage our existing customer relationships and our ability to establish new customer relationships; the potential for increased prices due to capacity constraints in our supply chain, which, if we are
unable to increase our selling price to our customers, could result in lower revenues and margins that could adversely affect our financial results; and the risk factors listed in our Form 10-K for the year ended March 28, 2020 and in our other
filings with the Securities and Exchange Commission, which are available at www.sec.gov. The foregoing information concerning our business outlook represents our outlook as of the date of this news release, and we expressly disclaim any
obligation to update or revise any forward-looking statements, whether as a result of new developments or otherwise.Special Statement Concerning Risks Associated with the COVID-19 Pandemic and Our Forward-Looking DisclosuresWe face risks related
to global health epidemics that could impact our sales, supply chain and operations, resulting in significantly reduced revenue and adversely affecting operating results. On March 11, 2020, the World Health Organization declared a pandemic
related to a novel coronavirus, commonly referred to as COVID-19. We continue to expect that COVID-19 will have an adverse effect on our business, financial condition and results of operations and, with the pandemic ongoing, we are unable to
predict the full extent and nature of these impacts at this time. The COVID-19 pandemic will likely heighten or exacerbate many of the other risks described in the risk factors listed in our Form 10-K for the year ended March 28, 2020 and in our
other filings with the Securities and Exchange Commission.Although we have not experienced a significant reduction in our overall productivity during fiscal year 2021 to date, we have experienced, and expect to continue to experience, disruptions
to our business operations, including those resulting from remote work arrangements for the majority of our employees, the implementation of certain measures at our facilities worldwide to protect our employees’ health and safety, government
stay-at-home directives, quarantines, self-isolations, travel restrictions, or other restrictions on the ability of our employees to perform their jobs that may impact our ability to develop and design our products in a timely manner, meet
required milestones, or win new business. Any increased or additional disruptions to our business operations would likely impact our ability to continue to maintain current levels of productivity. In the longer term, the COVID-19 pandemic is
likely to continue to adversely affect the economies and financial markets of many countries, leading to a global economic downturn and potentially a recession. This would likely adversely affect the demand environment for our products and those
of our customers, particularly consumer products such as smartphones, which may, in turn negatively affect our revenue and operating results. Cirrus Logic, Cirrus, and the Cirrus Logic logo are registered trademarks of Cirrus Logic, Inc. All
other company or product names noted herein may be trademarks of their respective holders.
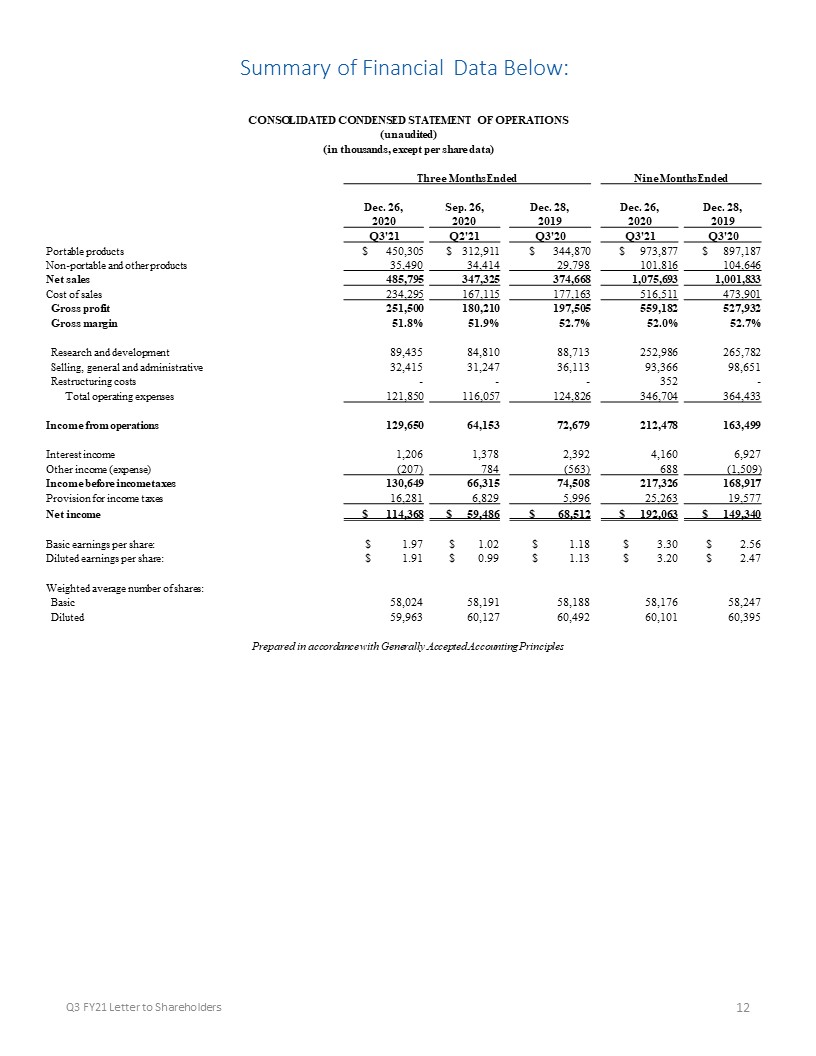
12 Q3 FY21 Letter to Shareholders CONSOLIDATED CONDENSED STATEMENT OF
OPERATIONS (unaudited) (in thousands, except per share data) Three Months Ended Nine Months Ended Dec.
26, Sep. 26, Dec. 28, Dec. 28, Dec. 26, Dec. 28, 2020 2020 2019 2019 2020 2019 Q3'21 Q2'21 Q3'20 Q3'20 Q3'21 Q3'20 Portable products $ 450,305 $ 312,911 $ 344,870 $ 344,870 $
973,877 $ 897,187 Non-portable and other products 35,490 34,414 29,798 29,798 101,816 104,646 Net sales 485,795 347,325 374,668 374,668 1,075,693 1,001,833 Cost of sales 234,295
167,115 177,163 177,163 516,511 473,901 Gross profit 251,500 180,210 197,505 197,505 559,182 527,932 Gross margin 51.8%
51.9% 52.7% 52.7% 52.0% 52.7% Research and development 89,435 84,810 88,713 88,713 252,986 265,782 Selling, general and administrative 32,415 31,247 36,113
36,113 93,366 98,651 Restructuring costs - - - - 352 - Total operating expenses 121,850 116,057 124,826 124,826 346,704 364,433 Income from
operations 129,650 64,153 72,679 72,679 212,478 163,499 Interest income 1,206 1,378 2,392 2,392 4,160 6,927 Other income (expense) (207) 784 (563)
(563) 688 (1,509) Income before income taxes 130,649 66,315 74,508 74,508 217,326 168,917 Provision for income taxes 16,281 6,829 5,996 5,996 25,263 19,577 Net income $
114,368 $ 59,486 $ 68,512 $ 68,512 $ 192,063 $ 149,340 Basic earnings per share: $ 1.97 $ 1.02 $ 1.18 $ 1.18 $ 3.30 $ 2.56 Diluted earnings per share: $ 1.91 $
0.99 $ 1.13 $ 1.13 $ 3.20 $ 2.47 Weighted average number of shares: Basic 58,024 58,191 58,188 58,188 58,176 58,247 Diluted 59,963 60,127
60,492 60,492 60,101 60,395 Prepared in accordance with Generally Accepted Accounting Principles Summary of Financial Data Below:
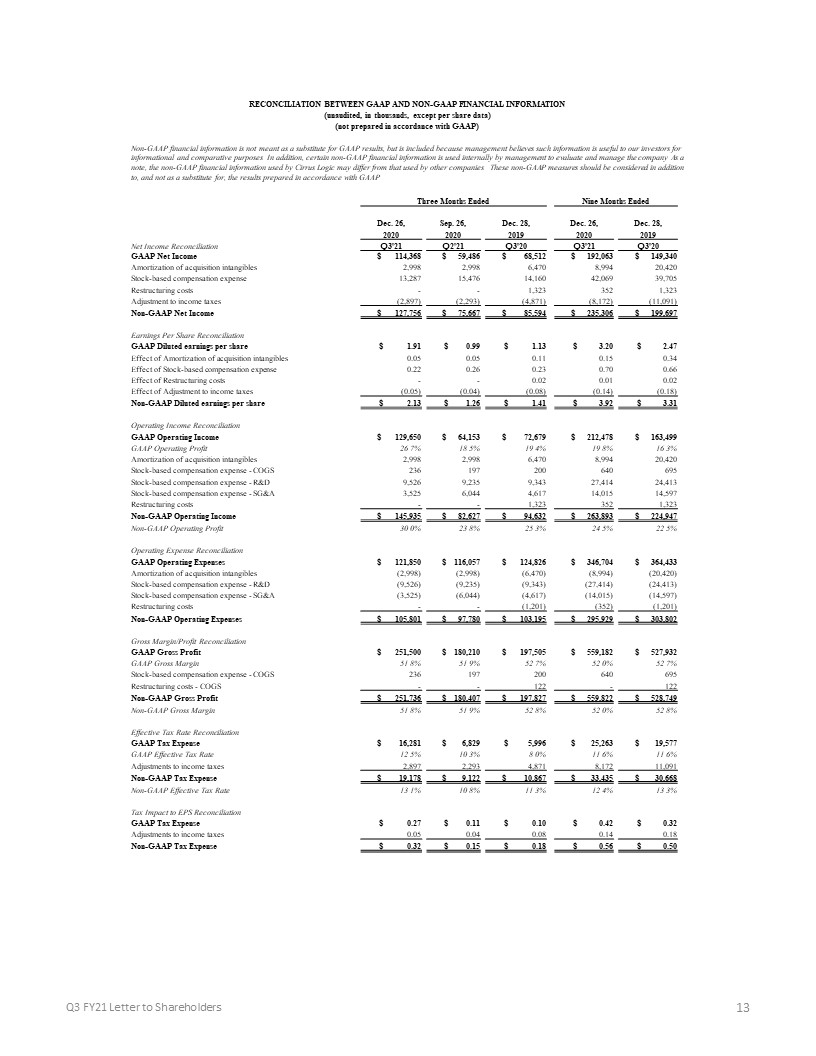
13 Q3 FY21 Letter to Shareholders RECONCILIATION BETWEEN GAAP AND NON-GAAP FINANCIAL
INFORMATION (unaudited, in thousands, except per share data) (not prepared in accordance with GAAP) Non-GAAP financial information is not meant as a substitute
for GAAP results, but is included because management believes such information is useful to our investors for informational and comparative purposes. In addition, certain non-GAAP financial information is used internally by management to evaluate
and manage the company. As a note, the non-GAAP financial information used by Cirrus Logic may differ from that used by other companies. These non-GAAP measures should be considered in addition to, and not as a substitute for, the results
prepared in accordance with GAAP. Three Months Ended Nine Months Ended Dec. 26, Sep. 26, Dec. 28, Dec. 26, Dec.
28, 2020 2020 2019 2020 2019 Net Income Reconciliation Q3'21 Q2'21 Q3'20 Q3'21 Q3'20 GAAP Net Income $ 114,368 $ 59,486 $ 68,512 $ 192,063 $ 149,340 Amortization of acquisition
intangibles 2,998 2,998 6,470 8,994 20,420 Stock-based compensation expense 13,287 15,476 14,160 42,069 39,705 Restructuring costs - - 1,323 352 1,323 Adjustment to
income taxes (2,897) (2,293) (4,871) (8,172) (11,091) Non-GAAP Net Income $ 127,756 $ 75,667 $ 85,594 $ 235,306 $ 199,697 Earnings Per Share
Reconciliation GAAP Diluted earnings per share $ 1.91 $ 0.99 $ 1.13 $ 3.20 $ 2.47 Effect of Amortization of acquisition intangibles 0.05 0.05 0.11 0.15 0.34 Effect of
Stock-based compensation expense 0.22 0.26 0.23 0.70 0.66 Effect of Restructuring costs - - 0.02 0.01 0.02 Effect of Adjustment to income taxes (0.05) (0.04) (0.08) (0.14)
(0.18) Non-GAAP Diluted earnings per share $ 2.13 $ 1.26 $ 1.41 $ 3.92 $ 3.31 Operating Income Reconciliation GAAP Operating Income $ 129,650 $ 64,153 $ 72,679
$ 212,478 $ 163,499 GAAP Operating Profit 26.7% 18.5% 19.4% 19.8% 16.3% Amortization of acquisition intangibles 2,998 2,998 6,470 8,994 20,420 Stock-based compensation expense - COGS 236
197 200 640 695 Stock-based compensation expense - R&D 9,526 9,235 9,343 27,414 24,413 Stock-based compensation expense - SG&A 3,525 6,044 4,617 14,015 14,597
Restructuring costs - - 1,323 352 1,323 Non-GAAP Operating Income $ 145,935 $ 82,627 $ 94,632 $ 263,893 $ 224,947 Non-GAAP Operating
Profit 30.0% 23.8% 25.3% 24.5% 22.5% Operating Expense Reconciliation GAAP Operating Expenses $ 121,850 $ 116,057 $ 124,826 $ 346,704 $ 364,433 Amortization of
acquisition intangibles (2,998) (2,998) (6,470) (8,994) (20,420) Stock-based compensation expense - R&D (9,526) (9,235) (9,343) (27,414) (24,413) Stock-based compensation expense - SG&A
(3,525) (6,044) (4,617) (14,015) (14,597) Restructuring costs - - (1,201) (352) (1,201) Non-GAAP Operating Expenses $ 105,801 $ 97,780 $ 103,195 $ 295,929 $ 303,802
Gross Margin/Profit Reconciliation GAAP Gross Profit $ 251,500 $ 180,210 $ 197,505 $ 559,182 $ 527,932 GAAP Gross
Margin 51.8% 51.9% 52.7% 52.0% 52.7% Stock-based compensation expense - COGS 236 197 200 640 695 Restructuring costs - COGS - - 122 - 122 Non-GAAP Gross Profit $ 251,736 $
180,407 $ 197,827 $ 559,822 $ 528,749 Non-GAAP Gross Margin 51.8% 51.9% 52.8% 52.0% 52.8% Effective Tax Rate Reconciliation GAAP Tax Expense $ 16,281 $ 6,829
$ 5,996 $ 25,263 $ 19,577 GAAP Effective Tax Rate 12.5% 10.3% 8.0% 11.6% 11.6% Adjustments to income taxes 2,897 2,293 4,871 8,172 11,091 Non-GAAP Tax Expense $ 19,178 $ 9,122
$ 10,867 $ 33,435 $ 30,668 Non-GAAP Effective Tax Rate 13.1% 10.8% 11.3% 12.4% 13.3% Tax Impact to EPS Reconciliation GAAP Tax Expense $ 0.27 $ 0.11 $ 0.10
$ 0.42 $ 0.32 Adjustments to income taxes 0.05 0.04 0.08 0.14 0.18 Non-GAAP Tax Expense $ 0.32 $ 0.15 $ 0.18 $ 0.56 $ 0.50
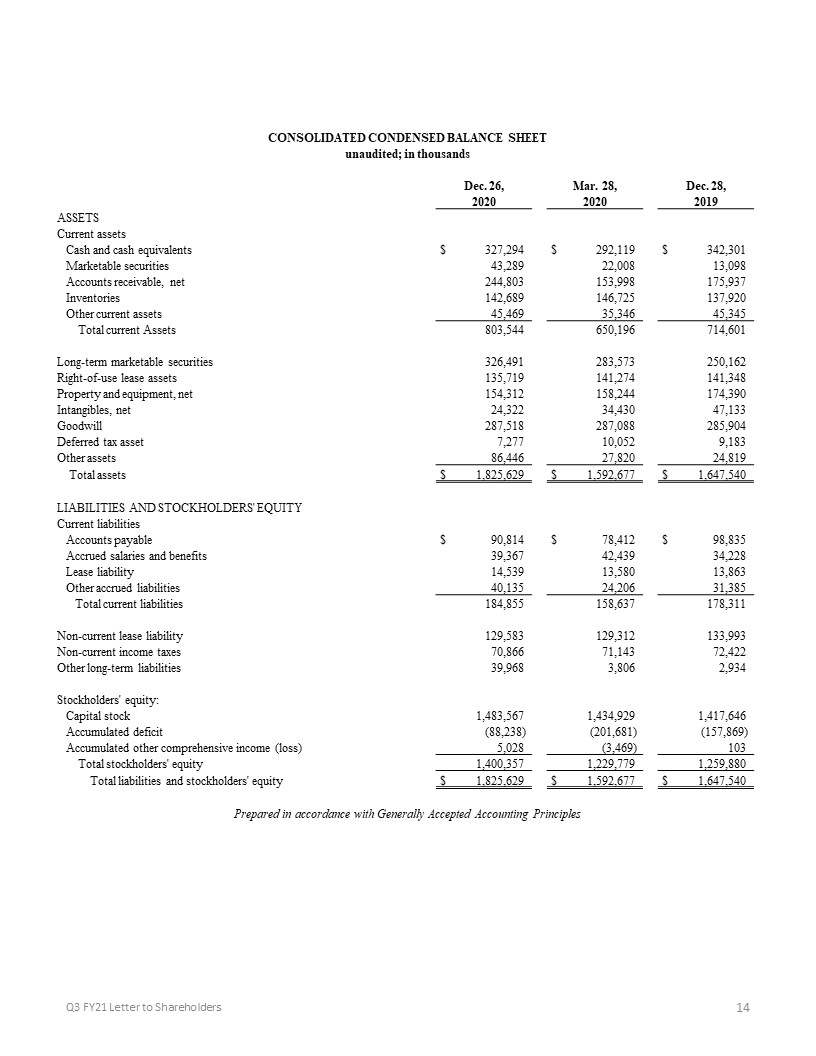
14 Q3 FY21 Letter to Shareholders CONSOLIDATED CONDENSED BALANCE SHEET unaudited;
in thousands Dec. 26, Mar. 28, Dec. 28, 2020 2020 2019 ASSETS Current assets Cash and cash
equivalents $ 327,294 $ 292,119 $ 342,301 Marketable securities 43,289 22,008 13,098 Accounts receivable, net 244,803 153,998 175,937 Inventories 142,689
146,725 137,920 Other current assets 45,469 35,346 45,345 Total current Assets 803,544 650,196 714,601 Long-term marketable securities 326,491
283,573 250,162 Right-of-use lease assets 135,719 141,274 141,348 Property and equipment, net 154,312 158,244 174,390 Intangibles, net 24,322 34,430 47,133
Goodwill 287,518 287,088 285,904 Deferred tax asset 7,277 10,052 9,183 Other assets 86,446 27,820 24,819 Total assets $ 1,825,629 $ 1,592,677
$ 1,647,540 LIABILITIES AND STOCKHOLDERS' EQUITY Current liabilities Accounts payable $ 90,814 $ 78,412 $ 98,835 Accrued salaries and
benefits 39,367 42,439 34,228 Lease liability 14,539 13,580 13,863 Other accrued liabilities 40,135 24,206 31,385 Total current liabilities 184,855
158,637 178,311 Non-current lease liability 129,583 129,312 133,993 Non-current income taxes 70,866 71,143 72,422 Other long-term liabilities 39,968
3,806 2,934 Stockholders' equity: Capital stock 1,483,567 1,434,929 1,417,646 Accumulated deficit (88,238) (201,681)
(157,869) Accumulated other comprehensive income (loss) 5,028 (3,469) 103 Total stockholders' equity 1,400,357 1,229,779 1,259,880 Total liabilities and stockholders' equity $
1,825,629 $ 1,592,677 $ 1,647,540 Prepared in accordance with Generally Accepted Accounting Principles