Attached files
| file | filename |
|---|---|
| 8-K - FORM 8-K - MACKINAC FINANCIAL CORP /MI/ | tm214565d1_8k.htm |
Exhibit 99

PRESS RELEASE
| For Release: | January 28, 2021 |
| Nasdaq: | MFNC |
| Contact: | Jesse A. Deering, EVP& Chief Financial Officer (248) 290-5906 /jdeering@bankmbank.com |
| Website: | www.bankmbank.com |
MACKINAC FINANCIAL CORPORATION
REPORTS 2020 Fourth quarter and Annual Results
Manistique, Michigan – Mackinac Financial Corporation (Nasdaq: MFNC) (the “Corporation”), the bank holding company for mBank, today announced 2020 net income of $13.47 million, or $1.27 per share, compared to 2019 net income of $13.85 million, or $1.29 per share. The Corporation had fourth quarter 2020 net income of $3.64 million, or $.35 per share, compared to 2019 fourth quarter net income of $3.30 million, or $.31 per share.
Total assets of the Corporation at December 31, 2020 were $1.50 billion, compared to $1.32 billion at December 31, 2019. Shareholders’ equity at December 31, 2020 totaled $167.86 million, compared to $161.92 million at December 31, 2019. Book value per share outstanding equated to $15.99 at the end of the fourth quarter 2020, compared to $15.06 per share outstanding a year ago. Tangible book value at quarter-end was $143.92 million, or $13.71 per share outstanding, compared to $137.30 million, or $12.77 per share outstanding at the end of the fourth quarter 2019.
Additional notes:
| · | mBank, the Corporation’s primary asset, recorded net income of $15.02 million in 2020, which resulted in an ROAA of 1.03%, compared to $15.07 million in 2019. mBank recorded net income of $4.04 million for the fourth quarter of 2020 and $3.73 million for the same period of 2019. |
| · | COVID-19 loan modifications resided at a nominal $2.4 million, or .25% of total loans with no commercial loans remaining in total payment deferral at December 31, 2020. This is compared to peak levels of $201 million in the spring. |
| · | Core bank deposit growth has been very strong this year with an increase of approximately $196.55 million, or 19% year-over-year. The vast majority of that growth has centered in transactional related accounts through our branch network outreach and treasury management line of business. |
| · | Non-interest income continued to be very solid for the fourth quarter of 2020. This included strong secondary market mortgage fee income and gain on sale of $1.92 million and premiums on the sale of Small Business Administration (SBA) guaranteed loans of $269 thousand. Year-to-date secondary market mortgage sale revenue and fees were $5.93 million and SBA premiums were $1.73 million. The residential mortgage pipeline resides at very robust levels and we expect sustained output from this line of business as we look to upcoming quarters. |
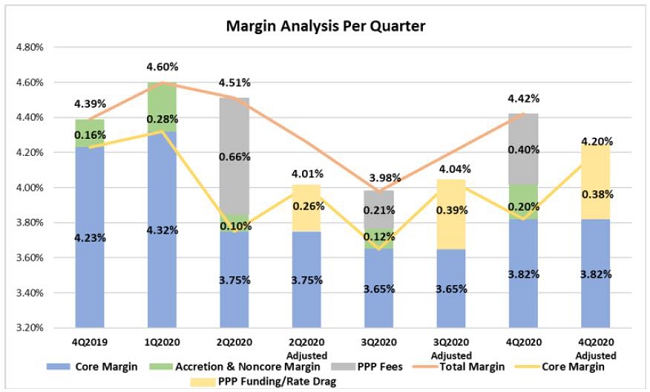
| · | Reported margin in the fourth quarter, which is inclusive of accretion from acquired loans that were subject to purchase accounting adjustments and recognition of some Paycheck Protection Program (“PPP”) loan origination fees, was 4.42%. Estimated non-GAAP core operating margin, when adjusted for purchase accounting accretion and PPP impact, is approximately 4.20% for the fourth quarter. Reportable margin for the entirety of the year was 4.37%. |
1
| · | The Corporation resumed buying back Mackinac Financial Corporation (MFNC) shares in the fourth quarter. Total purchases for the quarter were 43,135 shares at a blended price of $12.76 per share. For the entire year of 2020, the Corporation has repurchased 283,779 shares at a total weighted average price of $11.55 per share. All repurchase activity was completed at prices below tangible book value per share. |
Revenue & PPP Recognition
Total revenue of the Corporation for 2020 was $72.23 million, compared to $70.34 million in 2019. Total revenue for the three months ended December 31, 2020 equated to $18.01 million, compared to $17.61 million for the same period of 2019. Total interest income for the fourth quarter was $15.23 million, compared to $15.77 million for the same period in 2019. The 2020 fourth quarter interest income included accretive yield of $661 thousand from combined credit mark accretion associated with acquisitions, compared to $488 thousand in the same period of 2019.
The fourth quarter 2020 interest income was also positively impacted by the recognition of a portion of the PPP loan origination fees that were deferred in accordance with the following required accounting treatment:
| · | The Bank originated approximately $152 million of PPP loans in 2020. |
| · | For these originations, the company earned $5.18 million in PPP fees. Of that amount, $1.69 million was recognized immediately to offset direct costs of the program, leaving roughly $3.49 million to be recognized through GAAP monthly amortization or upon forgiveness of the loan by the Small Business Administration (“SBA”). |
| · | Of the $3.49 million, $2.33 million was recognized during the remainder of 2020. The greatest amounts occurred in the third and fourth quarters as acceleration of recognition due to forgiveness increased. |
| · | The 2020 fourth quarter results include recognition of $1.21 million in PPP fees. |
| · | The remaining $1.15 million of PPP fees are likely to be recognized in 2021. |
| · | The remaining $1.15 million of PPP origination fee income will continue to be amortized monthly, but more likely will be accelerated earlier upon forgiveness of the debt by SBA. |
Loan Production and Portfolio Mix
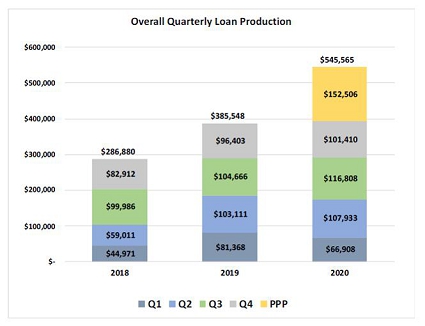
Total balance sheet loans at December 31, 2020 were $1.08 billion, which is inclusive of $105.49 million of PPP loans, compared to December 31, 2019 balances of $1.06 billion. Total loans under management reside at $1.33 billion, which includes $204.55 million of service retained loans. Driven by strong consumer mortgage activity, overall traditional loan production (non-PPP) for 2020 was $393.06 million, compared to $385.55 million for the same period of 2019. When including PPP loans, total production was $545.57 million. Of the total production, commercial loans equated to $128 million, consumer $265 million and the aforementioned $152 million of PPP. Within the consumer totals was $205 million of secondary market mortgage production compared to $89 million for 2019.
2
| New Loan Production (excluding PPP) | ||||||||||||||||||||
| Q1 | Q2 | Q3 | Q4 | 2020 | ||||||||||||||||
| Upper Peninsula | $ | 34,132 | $ | 44,721 | $ | 50,690 | $ | 41,708 | $ | 171,251 | ||||||||||
| Northern Lower Peninsula | 17,261 | 46,490 | 42,058 | 37,750 | 143,559 | |||||||||||||||
| Southeast Michigan | 3,834 | 2,580 | 3,565 | 5,760 | 15,739 | |||||||||||||||
| Wisconsin | 11,681 | 14,142 | 15,995 | 14,592 | 56,410 | |||||||||||||||
| Asset-Based Lending | - | - | 4,500 | 1,600 | 6,100 | |||||||||||||||
| Total | $ | 66,908 | $ | 107,933 | $ | 116,808 | $ | 101,410 | $ | 393,059 | ||||||||||
Commenting on new loan production and overall lending activities, Mr. George stated, “As can be seen from our production totals, we continued our positive lending momentum and have started to see some more traditional commercial loan opportunities in the quarter, which also continues to be dominated by record mortgage production. We are also seeing very good mortgage activity early in 2021 as our markets continue to see a continued influx of buyers for all types of properties. This migration from more populated areas is in light of the ongoing pandemic and the quality of life and work changes many continue to seek, which entails residing in more rural areas that offer larger space acquisition opportunities. We have also begun to participate in the recently announced second round of PPP funding. Initial forecasts based on client demand indicate it could potentially yield $75 million to $100 million of additional PPP loans.”
Credit Quality and COVID-19 Loan Activity
Nonperforming loans totaled $5.46 million, or .51% (.56% excluding PPP balances) of total loans at December 31, 2020, compared to .49% of total loans at December 31, 2019. The nonperforming assets to total assets ratio resided at .48% (.52% excluding PPP balances) for the fourth quarter of 2020, compared to .56% for the fourth quarter of 2019. Total loan delinquencies greater than 30 days resided at .58% (.65% excluding PPP balances), compared to 1.10% in 2019.
COVID-19 related loan modification activity has continued its positive trend downward throughout the fourth quarter. Currently, only $2.4 million of loan balances ($1.98 million of commercial and $.4 million of consumer) remain in some form of modification relief.
| COVID-19 Loan Modifications Remaining in Deferral |
| 12/31/2020 (dollars in millions) |
| Covid-19 Loans in Deferral | Bank Total Loans | Remaining Deferrals to Total Loans Ratio | ||||||||||
| mBank CML Loans (interest only) | $ | 2.0 | $ | 746.3 | 0.27 | % | ||||||
| mBank CML Loans (deferral) | $ | - | 0.00 | % | ||||||||
| mBank Consumer Loans (deferral) | $ | 0.4 | $ | 237.8 | 0.18 | % | ||||||
| Total Loans | $ | 2.4 | $ | 984.1 | 0.25 | % | ||||||
| For Reference as of 9/30/2020 | ||||||||||||
| Total Loans | $ | 30.2 | $ | 977.6 | 3.09 | % | ||||||
The fourth quarter provision for loan losses was $400 thousand. This amount was consistent with last quarter and we remain “risk neutral” quarter-over-quarter within the portfolio given the continued improvement in deferral activity and absence of any known pending credit issues. The resulting Allowance for Loan Loss (“ALLL”) coverage ratio was .54% of total loans. However, the total coverage ratio (equivalent to ALLL plus remaining purchase accounting credit marks to total loans less PPP balances) is .95%. Management will actively refine the provision and loan reserves as client impact and broader economic data from the pandemic become more clear. The Corporation is not currently required to utilize CECL.
Commenting on overall credit risk, Mr. George stated, “The credit book has seen no signs of any systemic adverse trends and our COVID-19 modifications are extremely modest at $2.4 million. A very small segment of consumer loans remain in deferment as we continue to work with retail clients who have been adversely impacted for an elongated period of time within the pandemic. While certainly not clear of all headwinds, we remain cautiously optimistic in terms of overall credit performance as many of our hospitality and tourism related businesses in our northern footprint experienced strong demand and revenues throughout the second half of 2020. We remain ever vigilant in terms of monitoring deterioration in any isolated specific situations that could arise for our clients where provisions and/or COVID relief could be needed in light of ongoing pandemic conditions within a particular industry that we all know can still change quickly.”
3
Margin Analysis, Funding and Liquidity
Net interest income for the year ended December 31, 2020 was $54.81 million, with a net interest margin (NIM) of 4.37% compared to the same period of 2019 of $53.91 million and a NIM of 4.57%. Net interest income for the fourth quarter 2020 was $13.90 million, resulting in a NIM of 4.42%, compared to $13.35 million in the fourth quarter 2019 and a NIM of 4.39%. Core operating margin, which is net of accretion from acquired loans that were subject to purchase accounting adjustments and recognized PPP fee income, was 3.82% for the fourth quarter of 2020, compared to 4.23% for the same period of 2019. Items impacting margin, outside of the overall current low interest rate environment, include higher than normal cash balances as well as negative impact from the yields associated with PPP loans. On a non-GAAP basis, management currently estimates the direct negative impact of the PPP loan balances for the fourth quarter to be .38%. Estimated adjusted core margin for the fourth quarter is 4.20% for the quarter.
Total bank deposits (excluding brokered deposits) have increased by $196.55 million year-over-year from $1.02 billion at December 31, 2019 to $1.21 billion at fourth quarter-end 2020. Total brokered deposits have also decreased and were $45.17 million at December 31, 2020, compared to $58.62 million at December 31, 2019, a decrease of 23%. FHLB (Federal Home Loan Bank) borrowings have remained mostly flat year-over-year from $63.48 million to $64.55 million. Further maturities are expected to be paid off in both the first and second quarters of 2021. The Corporation utilized the Paycheck Protection Program Liquidity Facility (“PPPLF”) to fund a portion of the initial PPP loan originations. There was no balance on this facility as of December 31, 2020 and management does not expect the need to utilize the facility for the new round of PPP funding based on the Corporation’s current liquidity position. Overall access to short-term functional liquidity remains very strong through multiple sources.
Mr. George stated, “We are very pleased with our organic efforts in terms of core deposit growth this year within the more challenging pandemic environment. While this is partially due to the significant amount of liquidity in the economic system from various stimulus packages, we have also procured and expanded client relationships that we expect to be with us well beyond the pandemic. This is also reflective of the strong commerce activity many of our retail and tourism related clients had over the summer and into the fall and the cash buildup within those businesses. Like many banks, we remain flush with liquidity with slowed commercial loan demand (compared to prior years) given the pandemic and limited prudent investment opportunities in light of market rates, both of which have continued to negatively impact our core margin. We expect that we will use some of this excess cash on our balance sheet for PPP funding, additional retirement of higher priced brokered deposits and FHLB maturities and to fund expected loan growth in 2021.”
4
Noninterest Income / Expense
Noninterest income (which is not inclusive of PPP fees) for 2020 was $10.20 million, compared to 2019 of $5.95 million, an increase of 71%. Fourth quarter 2020 noninterest income was $2.78 million, compared to $1.85 million for the same period of 2019. The significant year-over-year improvement is mainly a combination of the secondary market mortgage and SBA sales. The SBA 7A sales were not inclusive of any PPP loan fees, all of which are recognized through interest income. Noninterest expense for 2020 was $46.95 million, compared to 2019 of $41.76 million. Noninterest expense for the fourth quarter of 2020 was $11.66 million, compared to $10.81 million for the same period of 2019. Year-over-year increases were mainly associated with the COVID operating environment as well as incentives associated with retail and mortgage related activity.
Assets and Capital
Total assets of the Corporation at December 31, 2020 were $1.50 billion, compared to $1.32 billion at December 31, 2019. Shareholders’ equity at December 31, 2020 totaled $167.86 million, compared to $161.92 million at December 31, 2019. Book value per share outstanding equated to $15.99 at the end of the fourth quarter 2020, compared to $15.06 per share outstanding a year ago. Tangible book value at quarter-end was $143.92 million, or $13.71 per share outstanding, compared to $137.30 million, or $12.77 per share outstanding at the end of the fourth quarter 2019.
Both the Corporation and the Bank are “well-capitalized” with total risk-based capital to risk-weighted assets of 15.07% at the Corporation and 14.42% at the Bank and tier 1 capital to total tier 1 average assets (the “leverage ratio”) at the Corporation of 9.63% and at the Bank of 9.25%. The leverage ratio is calculated inclusive of PPP loan balances. The Corporation is monitoring the impact of the recent pandemic-associated market volatility on its Goodwill asset. The Corporation continues to conduct Goodwill impairment analysis to confirm the value of this intangible asset as market events unfold.
Paul D. Tobias, Chairman and Chief Executive Officer of the Corporation and Chairman of mBank concluded, “2020 saw our company overcome significant hurdles and obstacles to achieve net income of $13.47 million, or $1.27 of earnings per share for the year. Considering significant downward rate moves, a pandemic operating environment and significant global economic pressures, we successfully managed through a very difficult year with our credit book and operating platform in-tact. We executed on PPP to both support our clients and communities and supplement earnings. With commercial loan production slowed by COVID, we pivoted to originate record levels of residential mortgage loans and drive significant noninterest income. This further proved our ability to be agile within our operations. We also accreted capital while executing the repurchase of approximately 284,000 shares of MFNC on the open market and maintaining our $.56 annual dividend. Overall, we could not be more pleased with our team’s efforts and execution during this unprecedented year.”
Mackinac Financial Corporation is a registered bank holding company formed under the Bank Holding Company Act of 1956 with assets in excess of $1.5 billion and whose common stock is traded on the NASDAQ stock market as “MFNC.” The principal subsidiary of the Corporation is mBank. Headquartered in Manistique, Michigan, mBank has 29 branch locations; eleven in the Upper Peninsula, ten in the Northern Lower Peninsula, one in Oakland County, Michigan, and seven in Northern Wisconsin. The Corporation’s banking services include commercial lending and treasury management products and services geared toward small to mid-sized businesses, as well as a full array of personal and business deposit products and consumer loans.
Forward-Looking Statements
This release contains certain forward-looking statements. Words such as “anticipates,” “believes,” “estimates,” “expects,” “intends,” “should,” “will,” and variations of such words and similar expressions are intended to identify forward-looking statements: as defined by the Private Securities Litigation Reform Act of 1995. These statements reflect management’s current beliefs as to expected outcomes of future events and are not guarantees of future performance. These statements involve certain risks, uncertainties and assumptions that are difficult to predict with regard to timing, extent, likelihood, and degree of occurrence. Therefore, actual results and outcomes may materially differ from what may be expressed or forecasted in such forward-looking statements. Factors that could cause a difference include among others: the effects of the COVID-19 pandemic, particularly potentially negative effects on our customers, borrowers, third party service providers and our liquidity; changes in the national and local economies or market conditions; changes in interest rates and banking regulations; the impact of competition from traditional or new sources; and the possibility that anticipated cost savings and revenue enhancements from mergers and acquisitions, bank consolidations, and other sources may not be fully realized at all or within specified time frames as well as other risks and uncertainties including but not limited to those detailed from time to time in filings of the Corporation with the Securities and Exchange Commission. These and other factors may cause decisions and actual results to differ materially from current expectations. Mackinac Financial Corporation undertakes no obligation to revise, update, or clarify forward-looking statements to reflect events or conditions after the date of this release.
5
MACKINAC FINANCIAL CORPORATION AND SUBSIDIARIES
SELECTED FINANCIAL HIGHLIGHTS
| As of and For the | As of and For the | |||||||
| Year Ending | Year Ending | |||||||
| December 31, | December 31, | |||||||
| (Dollars in thousands, except per share data) | 2020 | 2019 | ||||||
| (Unaudited) | ||||||||
| Selected Financial Condition Data (at end of period): | ||||||||
| Assets | $ | 1,501,730 | $ | 1,320,069 | ||||
| Loans | 1,077,592 | 1,058,776 | ||||||
| Investment securities | 111,836 | 107,972 | ||||||
| Deposits | 1,258,776 | 1,075,677 | ||||||
| Borrowings | 63,479 | 64,551 | ||||||
| Shareholders' equity | 167,864 | 161,919 | ||||||
| Selected Statements of Income Data | ||||||||
| Net interest income | $ | 54,806 | $ | 53,907 | ||||
| Income before taxes | 17,056 | 17,710 | ||||||
| Net income | 13,473 | 13,850 | ||||||
| Income per common share - Basic | 1.27 | 1.29 | ||||||
| Income per common share - Diluted | 1.27 | 1.29 | ||||||
| Weighted average shares outstanding - Basic | 10,580,044 | 10,737,653 | ||||||
| Weighted average shares outstanding- Diluted | 10,580,044 | 10,757,507 | ||||||
| Selected Financial Ratios and Other Data: | ||||||||
| Performance Ratios: | ||||||||
| Net interest margin | 4.37 | % | 4.57 | % | ||||
| Efficiency ratio | 71.84 | 69.10 | ||||||
| Return on average assets | .92 | 1.04 | ||||||
| Return on average equity | 8.19 | 8.78 | ||||||
| Average total assets | $ | 1,464,674 | $ | 1,332,882 | ||||
| Average total shareholders' equity | 164,505 | 157,831 | ||||||
| Average loans to average deposits ratio | 93.34 | % | 95.03 | % | ||||
| Common Share Data at end of period: | ||||||||
| Market price per common share | $ | 12.76 | $ | 17.56 | ||||
| Book value per common share | 15.99 | 15.06 | ||||||
| Tangible book value per share | 13.71 | 12.77 | ||||||
| Dividends paid per share, annualized | .52 | .52 | ||||||
| Common shares outstanding | 10,500,758 | 10,748,712 | ||||||
| Other Data at end of period: | ||||||||
| Allowance for loan losses | $ | 5,816 | $ | 5,308 | ||||
| Non-performing assets | 7,210 | 7,377 | ||||||
| Allowance for loan losses to total loans | .51 | % | .49 | % | ||||
| Non-performing assets to total assets | .48 | % | .56 | % | ||||
| Texas ratio | 4.82 | % | 4.41 | % | ||||
| Number of: | ||||||||
| Branch locations | 28 | 29 | ||||||
| FTE Employees | 315 | 304 | ||||||
6
MACKINAC FINANCIAL CORPORATION AND SUBSIDIARIES
CONSOLIDATED BALANCE SHEETS
| December 31, | December 31, | |||||||
| 2020 | 2019 | |||||||
| (Unaudited) | ||||||||
| ASSETS | ||||||||
| Cash and due from banks | $ | 218,901 | $ | 49,794 | ||||
| Federal funds sold | 76 | 32 | ||||||
| Cash and cash equivalents | 218,977 | 49,826 | ||||||
| Interest-bearing deposits in other financial institutions | 2,917 | 10,295 | ||||||
| Securities available for sale | 111,836 | 107,972 | ||||||
| Federal Home Loan Bank stock | 4,924 | 4,924 | ||||||
| Loans: | ||||||||
| Commercial | 819,907 | 765,524 | ||||||
| Mortgage | 238,705 | 272,014 | ||||||
| Consumer | 18,980 | 21,238 | ||||||
| Total Loans | 1,077,592 | 1,058,776 | ||||||
| Allowance for loan losses | (5,816 | ) | (5,308 | ) | ||||
| Net loans | 1,071,776 | 1,053,468 | ||||||
| Premises and equipment | 25,518 | 23,608 | ||||||
| Other real estate held for sale | 1,752 | 2,194 | ||||||
| Deferred tax asset | 3,303 | 3,732 | ||||||
| Deposit based intangibles | 4,368 | 5,043 | ||||||
| Goodwill | 19,574 | 19,574 | ||||||
| Other assets | 36,785 | 39,433 | ||||||
| TOTAL ASSETS | $ | 1,501,730 | $ | 1,320,069 | ||||
| LIABILITIES AND SHAREHOLDERS’ EQUITY | ||||||||
| LIABILITIES: | ||||||||
| Deposits: | ||||||||
| Noninterest bearing deposits | $ | 414,804 | $ | 287,611 | ||||
| NOW, money market, interest checking | 450,556 | 373,165 | ||||||
| Savings | 130,755 | 109,548 | ||||||
| CDs<$250,000 | 202,266 | 233,956 | ||||||
| CDs>$250,000 | 15,224 | 12,775 | ||||||
| Brokered | 45,171 | 58,622 | ||||||
| Total deposits | 1,258,776 | 1,075,677 | ||||||
| Federal funds purchased | — | 6,225 | ||||||
| Borrowings | 63,479 | 64,551 | ||||||
| Other liabilities | 11,611 | 11,697 | ||||||
| Total liabilities | 1,333,866 | 1,158,150 | ||||||
| SHAREHOLDERS’ EQUITY: | ||||||||
| Common stock and additional paid in capital - No par value Authorized - 18,000,000 shares Issued and outstanding - 10,500,758 and 10,748,712 respectively | 127,164 | 129,564 | ||||||
| Retained earnings | 39,318 | 31,740 | ||||||
| Accumulated other comprehensive income (loss) | ||||||||
| Unrealized (losses) gains on available for sale securities | 1,965 | 1,025 | ||||||
| Minimum pension liability | (583 | ) | (410 | ) | ||||
| Total shareholders’ equity | 167,864 | 161,919 | ||||||
| TOTAL LIABILITIES AND SHAREHOLDERS’ EQUITY | $ | 1,501,730 | $ | 1,320,069 | ||||
7
MACKINAC FINANCIAL CORPORATION AND SUBSIDIARIES
CONSOLIDATED STATEMENTS OF OPERATIONS
| For the Years Ended | ||||||||
| December 31, | ||||||||
| 2020 | 2019 | |||||||
| (Unaudited) | ||||||||
| INTEREST INCOME: | ||||||||
| Interest and fees on loans: | ||||||||
| Taxable | $ | 58,412 | $ | 59,673 | ||||
| Tax-exempt | 201 | 187 | ||||||
| Interest on securities: | ||||||||
| Taxable | 2,255 | 2,708 | ||||||
| Tax-exempt | 535 | 343 | ||||||
| Other interest income | 626 | 1,473 | ||||||
| Total interest income | 62,029 | 64,384 | ||||||
| INTEREST EXPENSE: | ||||||||
| Deposits | 6,052 | 9,436 | ||||||
| Borrowings | 1,171 | 1,041 | ||||||
| Total interest expense | 7,223 | 10,477 | ||||||
| Net interest income | 54,806 | 53,907 | ||||||
| Provision for loan losses | 1,000 | 385 | ||||||
| Net interest income after provision for loan losses | 53,806 | 53,522 | ||||||
| OTHER INCOME: | ||||||||
| Deposit service fees | 1,133 | 1,586 | ||||||
| Income from loans sold on the secondary market | 5,935 | 1,889 | ||||||
| SBA/USDA loan sale gains | 1,729 | 908 | ||||||
| Mortgage servicing amortization | 838 | 693 | ||||||
| Net security gains | 2 | 208 | ||||||
| Other | 562 | 669 | ||||||
| Total other income | 10,199 | 5,953 | ||||||
| OTHER EXPENSE: | ||||||||
| Salaries and employee benefits | 26,081 | 22,743 | ||||||
| Occupancy | 4,370 | 4,069 | ||||||
| Furniture and equipment | 3,347 | 3,000 | ||||||
| Data processing | 3,093 | 2,717 | ||||||
| Advertising | 912 | 889 | ||||||
| Professional service fees | 1,842 | 2,100 | ||||||
| Loan origination expenses and deposit and card related fees | 1,965 | 1,546 | ||||||
| Writedowns and (gains) losses on other real estate held for sale | (22 | ) | 212 | |||||
| FDIC insurance assessment | 578 | 70 | ||||||
| Communications expense | 935 | 885 | ||||||
| Other | 3,848 | 3,534 | ||||||
| Total other expenses | 46,949 | 41,765 | ||||||
| Income before provision for income taxes | 17,056 | 17,710 | ||||||
| Provision for income taxes | 3,583 | 3,860 | ||||||
| NET INCOME AVAILABLE TO COMMON SHAREHOLDERS | $ | 13,473 | $ | 13,850 | ||||
| INCOME PER COMMON SHARE: | ||||||||
| Basic | $ | 1.27 | $ | 1.29 | ||||
| Diluted | $ | 1.27 | $ | 1.29 | ||||
8
MACKINAC FINANCIAL CORPORATION AND SUBSIDIARIES
LOAN PORTFOLIO AND CREDIT QUALITY
(Dollars in thousands)
Loan Portfolio Balances (at end of period):
| December 31, | December 31, | |||||||
| 2020 | 2019 | |||||||
| (Unaudited) | (Audited) | |||||||
| Commercial Loans: | ||||||||
| Real estate - operators of nonresidential buildings | $ | 138,992 | $ | 141,965 | ||||
| Hospitality and tourism | 100,237 | 97,721 | ||||||
| Lessors of residential buildings | 52,035 | 51,085 | ||||||
| Gasoline stations and convenience stores | 29,046 | 27,176 | ||||||
| Logging | 18,651 | 22,136 | ||||||
| Commercial construction | 47,698 | 40,107 | ||||||
| Other | 433,248 | 385,334 | ||||||
| Total Commercial Loans | 819,907 | 765,524 | ||||||
| 1-4 family residential real estate | 227,044 | 253,918 | ||||||
| Consumer | 18,980 | 21,238 | ||||||
| Consumer construction | 11,661 | 18,096 | ||||||
| Total Loans | $ | 1,077,592 | $ | 1,058,776 | ||||
Credit Quality (at end of period):
| December 31, | December 31, | |||||||
| 2020 | 2019 | |||||||
| (Unaudited) | (Audited) | |||||||
| Nonperforming Assets : | ||||||||
| Nonaccrual loans | $ | 5,458 | $ | 5,172 | ||||
| Loans past due 90 days or more | - | 11 | ||||||
| Restructured loans | - | - | ||||||
| Total nonperforming loans | 5,458 | 5,183 | ||||||
| Other real estate owned | 1,752 | 2,194 | ||||||
| Total nonperforming assets | $ | 7,210 | $ | 7,377 | ||||
| Nonperforming loans as a % of loans | .51 | % | .49 | % | ||||
| Nonperforming assets as a % of assets | .48 | % | .56 | % | ||||
| Reserve for Loan Losses: | ||||||||
| At period end | $ | 5,816 | $ | 5,308 | ||||
| As a % of outstanding loans | .54 | % | .50 | % | ||||
| As a % of nonperforming loans | 106.56 | % | 102.41 | % | ||||
| As a % of nonaccrual loans | 106.56 | % | 102.63 | % | ||||
| Texas Ratio | 4.82 | % | 4.41 | % | ||||
| Charge-off Information (year to date): | ||||||||
| Average loans | $ | 1,117,132 | $ | 1,047,439 | ||||
| Net charge-offs (recoveries) | $ | 492 | $ | 260 | ||||
| Charge-offs as a % of average loans, annualized | .04 | % | .02 | % | ||||
9
MACKINAC
FINANCIAL CORPORATION AND SUBSIDIARIES
QUARTERLY FINANCIAL HIGHLIGHTS
| QUARTER ENDED | ||||||||||||||||||||
| (Unaudited) | ||||||||||||||||||||
| December 31, | September 30, | June 30, | March 31, | December 31, | ||||||||||||||||
| 2020 | 2020 | 2020 | 2020 | 2019 | ||||||||||||||||
| BALANCE SHEET (Dollars in thousands) | ||||||||||||||||||||
| Total loans | $ | 1,077,592 | $ | 1,144,325 | $ | 1,153,790 | $ | 1,044,177 | $ | 1,058,776 | ||||||||||
| Allowance for loan losses | (5,816 | ) | (5,832 | ) | (5,355 | ) | (5,292 | ) | (5,308 | ) | ||||||||||
| Total loans, net | 1,071,776 | 1,138,493 | 1,148,435 | 1,038,885 | 1,053,468 | |||||||||||||||
| Total assets | 1,501,730 | 1,522,917 | 1,518,473 | 1,356,381 | 1,320,069 | |||||||||||||||
| Core deposits | 1,198,381 | 1,195,062 | 1,122,582 | 984,936 | 1,004,280 | |||||||||||||||
| Noncore deposits | 60,395 | 85,825 | 104,970 | 110,445 | 71,397 | |||||||||||||||
| Total deposits | 1,258,776 | 1,280,887 | 1,227,552 | 1,095,381 | 1,075,677 | |||||||||||||||
| Total borrowings | 63,479 | 63,505 | 114,466 | 67,120 | 64,551 | |||||||||||||||
| Total shareholders' equity | 167,864 | 166,168 | 164,157 | 160,060 | 161,919 | |||||||||||||||
| Total tangible equity | 143,922 | 142,057 | 139,877 | 135,612 | 137,302 | |||||||||||||||
| Total shares outstanding | 10,500,758 | 10,533,589 | 10,533,589 | 10,533,589 | 10,748,712 | |||||||||||||||
| Weighted average shares outstanding | 10,536,023 | 10,533,589 | 10,533,589 | 10,717,967 | 10,748,712 | |||||||||||||||
| AVERAGE BALANCES (Dollars in thousands) | ||||||||||||||||||||
| Assets | $ | 1,505,869 | $ | 1,536,128 | $ | 1,501,423 | $ | 1,321,134 | $ | 1,347,916 | ||||||||||
| Earning assets | 1,252,038 | 1,303,102 | 1,290,012 | 1,171,551 | 1,205,241 | |||||||||||||||
| Loans | 1,118,665 | 1,154,670 | 1,147,620 | 1,047,144 | 1,081,294 | |||||||||||||||
| Noninterest bearing deposits | 422,081 | 422,134 | 346,180 | 284,677 | 283,259 | |||||||||||||||
| Deposits | 1,255,669 | 1,269,658 | 1,211,694 | 1,076,206 | 1,080,359 | |||||||||||||||
| Equity | 167,459 | 165,450 | 161,811 | 162,661 | 161,588 | |||||||||||||||
| INCOME STATEMENT (Dollars in thousands) | ||||||||||||||||||||
| Net interest income | $ | 13,898 | $ | 13,052 | $ | 14,458 | $ | 13,397 | $ | 13,350 | ||||||||||
| Provision for loan losses | 400 | 400 | 100 | 100 | 35 | |||||||||||||||
| Net interest income after provision | 13,498 | 12,652 | 14,358 | 13,297 | 13,315 | |||||||||||||||
| Total noninterest income | 2,779 | 3,116 | 2,367 | 1,937 | 1,848 | |||||||||||||||
| Total noninterest expense | 11,663 | 11,561 | 12,352 | 11,372 | 10,813 | |||||||||||||||
| Income before taxes | 4,614 | 4,207 | 4,373 | 3,862 | 4,350 | |||||||||||||||
| Provision for income taxes | 970 | 883 | 919 | 811 | 1,054 | |||||||||||||||
| Net income available to common shareholders | $ | 3,644 | $ | 3,324 | $ | 3,454 | $ | 3,051 | $ | 3,296 | ||||||||||
| Income pre-tax, pre-provision | $ | 5,014 | $ | 3,724 | $ | 4,473 | $ | 3,962 | $ | 4,385 | ||||||||||
| PER SHARE DATA | ||||||||||||||||||||
| Earnings per common share | $ | .35 | $ | .32 | $ | .33 | $ | .28 | $ | .31 | ||||||||||
| Book value per common share | 15.99 | 15.78 | 15.58 | 15.20 | 15.06 | |||||||||||||||
| Tangible book value per share | 13.71 | 13.49 | 13.28 | 12.87 | 12.77 | |||||||||||||||
| Market value, closing price | 12.76 | 9.65 | 10.37 | 10.45 | 17.56 | |||||||||||||||
| Dividends per share | .14 | .14 | .14 | .14 | .14 | |||||||||||||||
| ASSET QUALITY RATIOS | ||||||||||||||||||||
| Nonperforming loans/total loans | .51 | % | .47 | % | .53 | % | .61 | % | .49 | % | ||||||||||
| Nonperforming assets/total assets | .48 | .48 | .55 | .64 | .56 | |||||||||||||||
| Allowance for loan losses/total loans | .54 | .51 | .46 | .51 | .50 | |||||||||||||||
| Allowance for loan losses/nonperforming loans | 106.56 | 107.72 | 87.44 | 82.48 | 102.41 | |||||||||||||||
| Texas ratio | 4.82 | 4.91 | 4.22 | 6.13 | 4.41 | |||||||||||||||
| PROFITABILITY RATIOS | ||||||||||||||||||||
| Return on average assets | .96 | % | .86 | % | .93 | % | .93 | % | .97 | % | ||||||||||
| Return on average equity | 8.66 | 7.99 | 8.58 | 7.54 | 8.09 | |||||||||||||||
| Net interest margin | 4.42 | 3.98 | 4.51 | 4.60 | 4.39 | |||||||||||||||
| Average loans/average deposits | 89.09 | 90.94 | 94.71 | 97.30 | 100.09 | |||||||||||||||
| CAPITAL ADEQUACY RATIOS | ||||||||||||||||||||
| Tier 1 leverage ratio | 9.63 | % | 9.20 | % | 9.45 | % | 10.20 | % | 10.09 | % | ||||||||||
| Tier 1 capital to risk weighted assets | 14.48 | 13.91 | 13.27 | 12.89 | 12.71 | |||||||||||||||
| Total capital to risk weighted assets | 15.07 | 14.49 | 13.79 | 13.41 | 13.22 | |||||||||||||||
| Average equity/average assets (for the quarter) | 11.12 | 10.77 | 10.78 | 12.31 | 11.99 | |||||||||||||||
10