Attached files
| file | filename |
|---|---|
| EX-99.1 - EXHIBIT 99.1 - WestRock Co | a52368975ex99_1.htm |
| 8-K - WESTROCK COMPANY 8-K - WestRock Co | a52368975.htm |
Exhibit 99.2
Westrock | Q1 fy2021 resultsJanuary 28, 2021
Forward Looking Statements:This presentation contains forward-looking statements within the meaning of
the Private Securities Litigation Reform Act of 1995, including but not limited to the statements on the slides entitled “Productivity Improvements”, “Update on WestRock Pandemic Action Plan”, “Capital Allocation Priorities”, “Financial
Strength Supported by Strong Cash Flow Generation”, “WestRock: Creating Value”, “Key Commodity Annual Consumption Volumes”, and “Mill Maintenance Schedule” that give guidance or estimates for future periods as well as statements regarding,
among other things, (i) our expectation that (A) the Florence, SC mill capital project will generate $30 million in EBITDA improvement in FY21 with a run rate of $55 million at full ramp up, (B) our expectation that the Porto Feliz project will
generate $10 million in EBITDA improvement in FY21 with a run rate of $30 million at full ramp up, (C) that, with respect to Tres Barras, production will increase to approximately 750,000 tons a year, fiber mix will improve to 100% virgin fiber
and we expect annual EBITDA benefit of $70 million when fully ramped up in FY22 and (D) our expectation that run rate synergies from the KapStone acquisition will grow to more than $240 million by the end of FY21 and (E) that annual EBITDA at
the North Charleston, SC mill will increase by $40 million; (ii) that we expect to add $125 million of EBITDA in FY21 as a result of the productivity improvement projects listed on slide 20; (iv) that the Pandemic Action Plan is on track to
achieve approximately $1 billion of savings through calendar 2021 and is expected to lead to meaningful debt reduction as set forth on slide 10; (v) that we expect to invest $800 to $900 million in capital investments in FY21; (vi) that we
intend to invest to further enhance our cost position while pursuing growth opportunities; that we have an annual capex target of $900 million to $1 billion; (vii) that we have near-term priorities of reducing debt levels and returning to a net
leverage ratio of 2.25x to 2.5x and returning capital to stockholders through a competitive annual dividend; (viii) that we have medium-term priorities of maintaining a net leverage ratio of 2.25x to 2.5x, paying a competitive and growing
dividend supplemented with opportunistic share repurchases and targeted M&A opportunities focused on improving vertical integration; (ix) that the WestRock Pandemic Action Plan is expected to provide approximately $1 billion of cash
available for debt reduction through the end of calendar 2021 in addition to ongoing cash generation; (x) that we have a road map to return to our targeted leverage ratio range of 2.25x to 2.5x; and (xi) the key commodity annual consumption
volumes on slide 22. Forward-looking statements are based on our current expectations, beliefs, plans or forecasts and are typically identified by words or phrases such as “may,” “will,” “could,” “should,” “would,” “anticipate,” “estimate,”
“expect,” “project,” “intend,” “plan,” “believe,” “target,” “prospects,” “potential” and “forecast,” and other words, terms and phrases of similar meaning. Forward-looking statements involve estimates, expectations, projections, goals,
forecasts, assumptions, risks and uncertainties. WestRock cautions readers that a forward-looking statement is not a guarantee of future performance and that actual results could differ materially from those contained in the forward-looking
statement. WestRock’s businesses are subject to a number of risks that would affect any such forward-looking statements, including, among others, developments related to the COVID-19 pandemic, including the severity, magnitude and duration of
the pandemic, negative global economic conditions arising from the pandemic, impacts of governments’ responses to the pandemic on our operations, impacts of the pandemic on commercial activity, our customers and consumer preferences and demand,
supply chain disruptions, and disruptions in the credit or financial markets; decreases in demand for their products; increases in energy, raw materials, shipping and capital equipment costs; reduced supply of raw materials; our ongoing
assessment of the recent ransomware incident, adverse legal, reputational and financial effects on us resulting from the incident or additional cyber incidents and the effectiveness of our business continuity plans during the ransomware
incident; fluctuations in selling prices and volumes; intense competition; the potential loss of certain customers; the scope, costs, timing and impact of any restructuring of our operations and corporate and tax structure; the occurrence of a
natural disaster, such as hurricanes or other unanticipated problems, such as labor difficulties, equipment failure or unscheduled maintenance and repair; risks associated with integrating KapStone’s operations into our operations and our
ability to realize anticipated synergies and productivity improvements; risks associated with completing our strategic capital projects on the anticipated timelines and realizing our anticipated EBITDA improvements; benefits that we expect to
realize from actions that we are taking and plan to take in response to COVID-19; and adverse changes in general market and industry conditions. Such risks and other factors that may impact management’s assumptions are more particularly
described in our filings with the Securities and Exchange Commission, including in Item 1A under the caption “Risk Factors” in our Annual Report on Form 10-K for the year ended September 30, 2020. The information contained herein speaks as of
the date hereof and WestRock does not have or undertake any obligation to update or revise its forward-looking statements, whether as a result of new information, future events or otherwise.Non-GAAP Financial Measures:We report our financial
results in accordance with accounting principles generally accepted in the United States (“GAAP”). However, management believes certain non-GAAP financial measures provide users with additional meaningful financial information that should be
considered when assessing our ongoing performance. Management also uses these non-GAAP financial measures in making financial, operating and planning decisions and in evaluating our performance. Non-GAAP financial measures should be viewed in
addition to, and not as an alternative for, our GAAP results. The non-GAAP financial measures we present may differ from similarly captioned measures presented by other companies.We may from time to time be in possession of certain information
regarding WestRock that applicable law would not require us to disclose to the public in the ordinary course of business, but would require us to disclose if we were engaged in the purchase or sale of our securities. This presentation shall not
be considered to be part of any solicitation of an offer to buy or sell WestRock securities. This presentation also may not include all of the information regarding WestRock that you may need to make an investment decision regarding WestRock
securities. Any investment decision should be made on the basis of the total mix of information regarding WestRock that is publicly available as of the date of the investment decision. Forward Looking Statements; Non-GAAP Financial
Measures 2
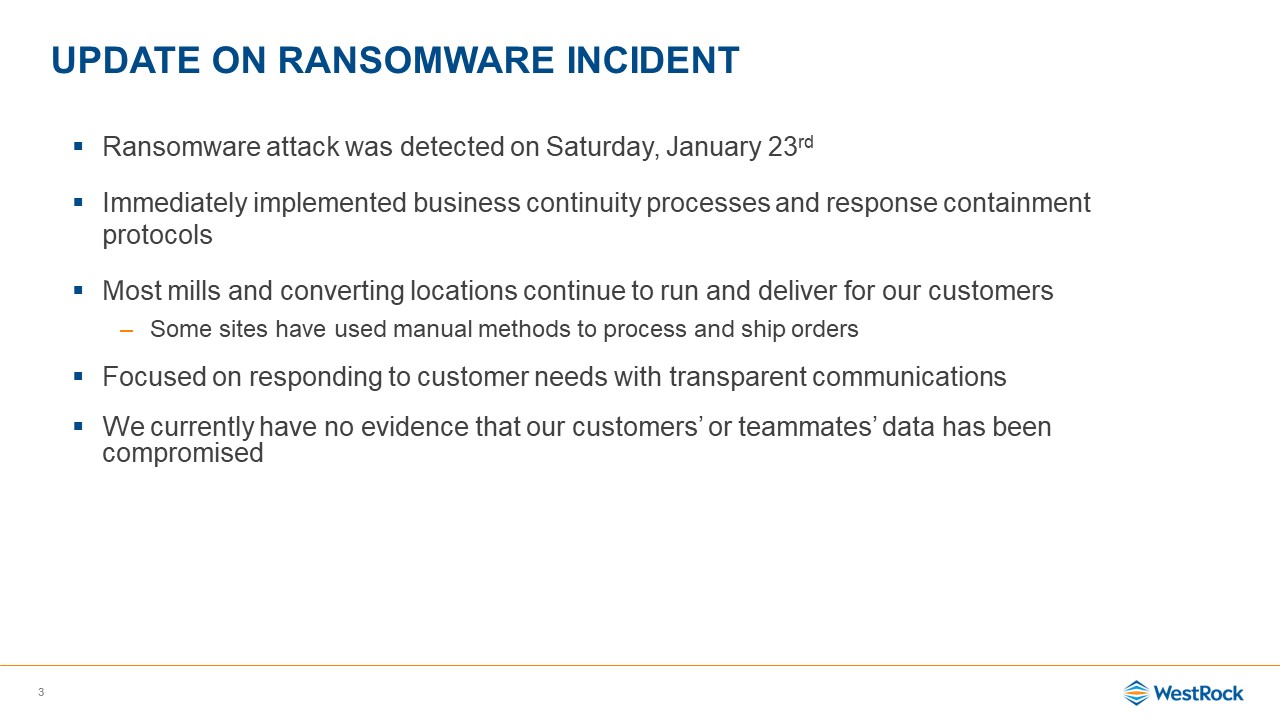
3 Update on Ransomware Incident Ransomware attack was detected on Saturday, January 23rd Immediately
implemented business continuity processes and response containment protocolsMost mills and converting locations continue to run and deliver for our customersSome sites have used manual methods to process and ship ordersFocused on responding to
customer needs with transparent communicationsWe currently have no evidence that our customers’ or teammates’ data has been compromised
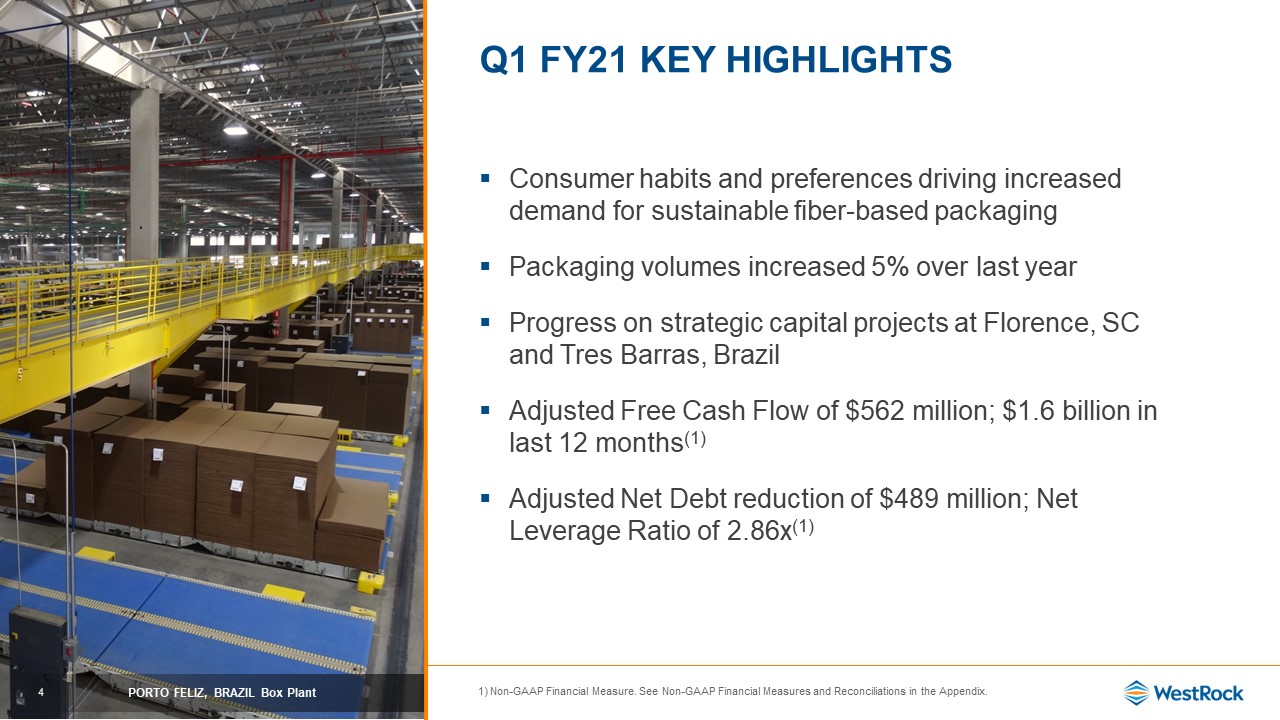
4 Q1 FY21 Key Highlights PORTO FELIZ, BRAZIL Box Plant Consumer habits and preferences driving
increased demand for sustainable fiber-based packagingPackaging volumes increased 5% over last yearProgress on strategic capital projects at Florence, SC and Tres Barras, BrazilAdjusted Free Cash Flow of $562 million; $1.6 billion in last 12
months(1)Adjusted Net Debt reduction of $489 million; Net Leverage Ratio of 2.86x(1) Non-GAAP Financial Measure. See Non-GAAP Financial Measures and Reconciliations in the Appendix.
5 Non-GAAP Financial Measure. See Non-GAAP Financial Measures and Reconciliations in the
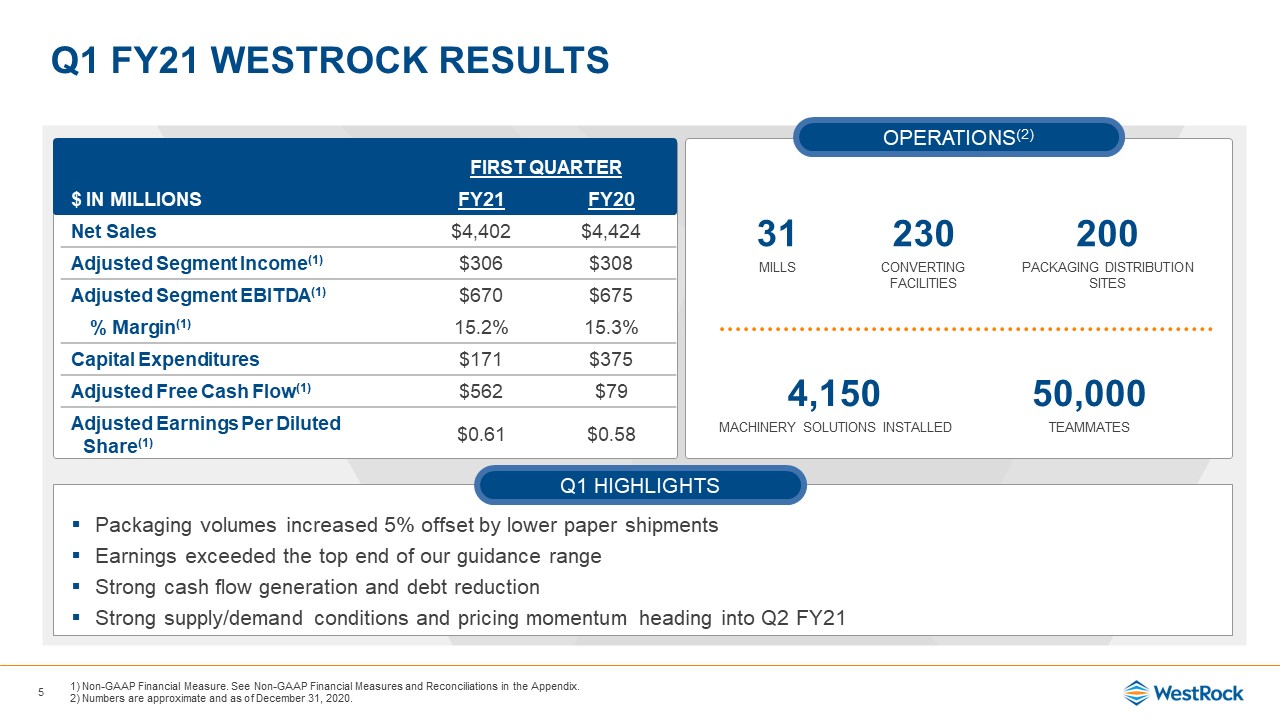
Appendix.Numbers are approximate and as of December 31, 2020. FIRST QUARTER $ in millions FY21 FY20 Net Sales $4,402 $4,424 Adjusted Segment Income(1) $306 $308 Adjusted Segment EBITDA(1) $670 $675 %
Margin(1) 15.2% 15.3% Capital Expenditures $171 $375 Adjusted Free Cash Flow(1) $562 $79 Adjusted Earnings Per Diluted Share(1) $0.61 $0.58 Q1 Fy21 WestRock Results Packaging volumes increased 5% offset by lower paper shipments
Earnings exceeded the top end of our guidance rangeStrong cash flow generation and debt reductionStrong supply/demand conditions and pricing momentum heading into Q2 FY21 31 230 200 MILLS CONVERTING FACILITIES PACKAGING DISTRIBUTION
SITES 4,150 50,000 MACHINERY SOLUTIONS INSTALLED TEAMMATES Q1 Highlights Operations(2)
6 Non-GAAP Financial Measure. See Non-GAAP Financial Measures and Reconciliations in the
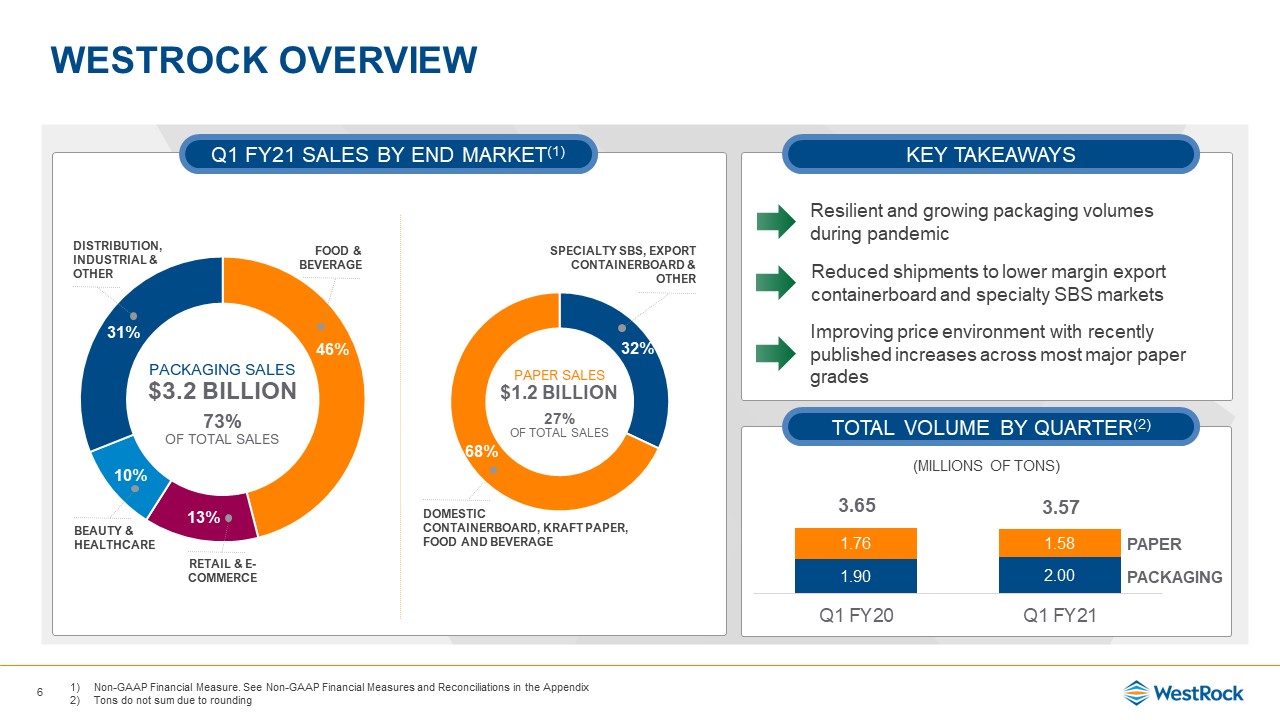
AppendixTons do not sum due to rounding Key takeaways Q1 FY21 Sales by end market(1) WestRock overview Total volume by quarter(2) Paper Packaging 3.65 3.57 Resilient and growing packaging volumes during pandemic Reduced shipments
to lower margin export containerboard and specialty SBS markets Improving price environment with recently published increases across most major paper grades (Millions of tons) Packaging Sales $3.2 Billion73% of Total Sales Distribution,
Industrial & Other Food & Beverage Beauty & healthcare Retail & e-commerce paper Sales $1.2 Billion27% of Total Sales SPECIALTY SBS, EXPORT CONTAINERBOARD & OTHER DOMESTIC CONTAINERBOARD, KRAFT PAPER, FOOD
and BEVERAGE
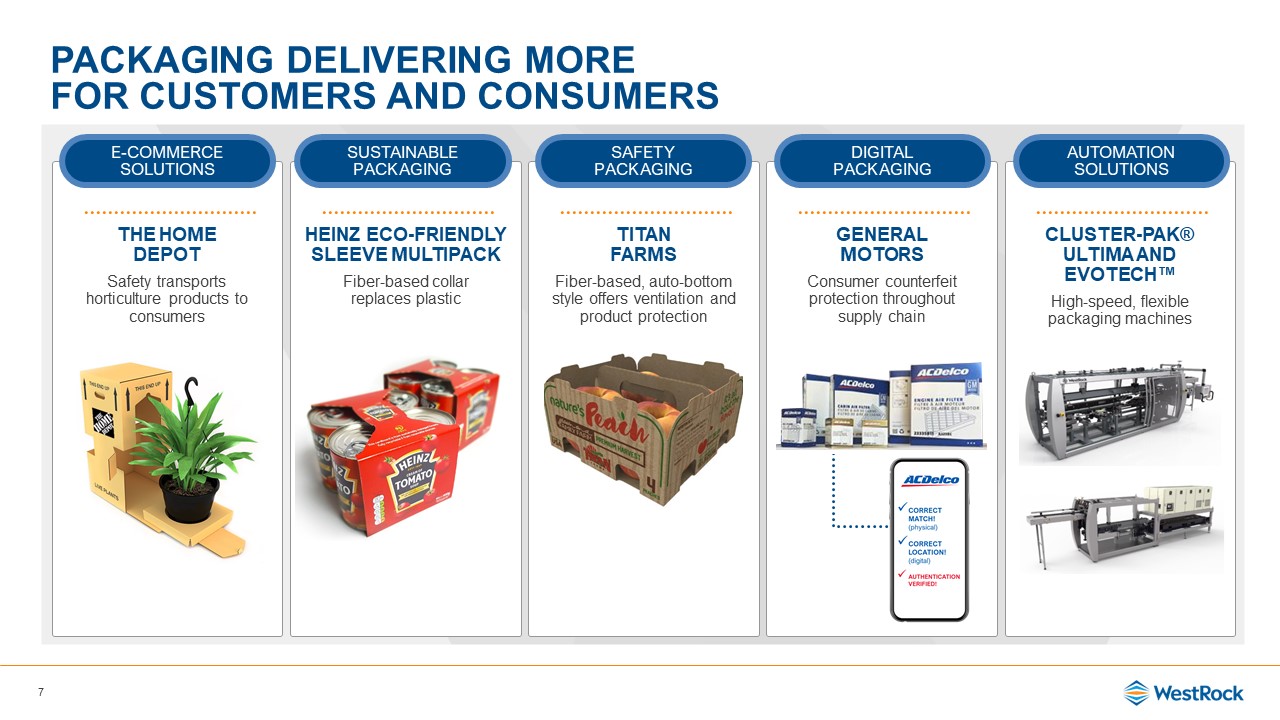
packaging Delivering more for customers and consumers 7 The Home DepotSafety transports horticulture
products to consumers E-commerce solutions HEINZ ECO-FRIENDLY SLEEVE MULTIPACKFiber-based collar replaces plastic Sustainable packaging Titan farmsFiber-based, auto-bottom style offers ventilation and product protection Safety
packaging General motorsConsumer counterfeit protection throughout supply chain Digital packaging Cluster-pak® ultima and evotech™High-speed, flexible packaging machines Automationsolutions
8 Non-GAAP Financial Measure. See Non-GAAP Financial Measures and Reconciliations in the
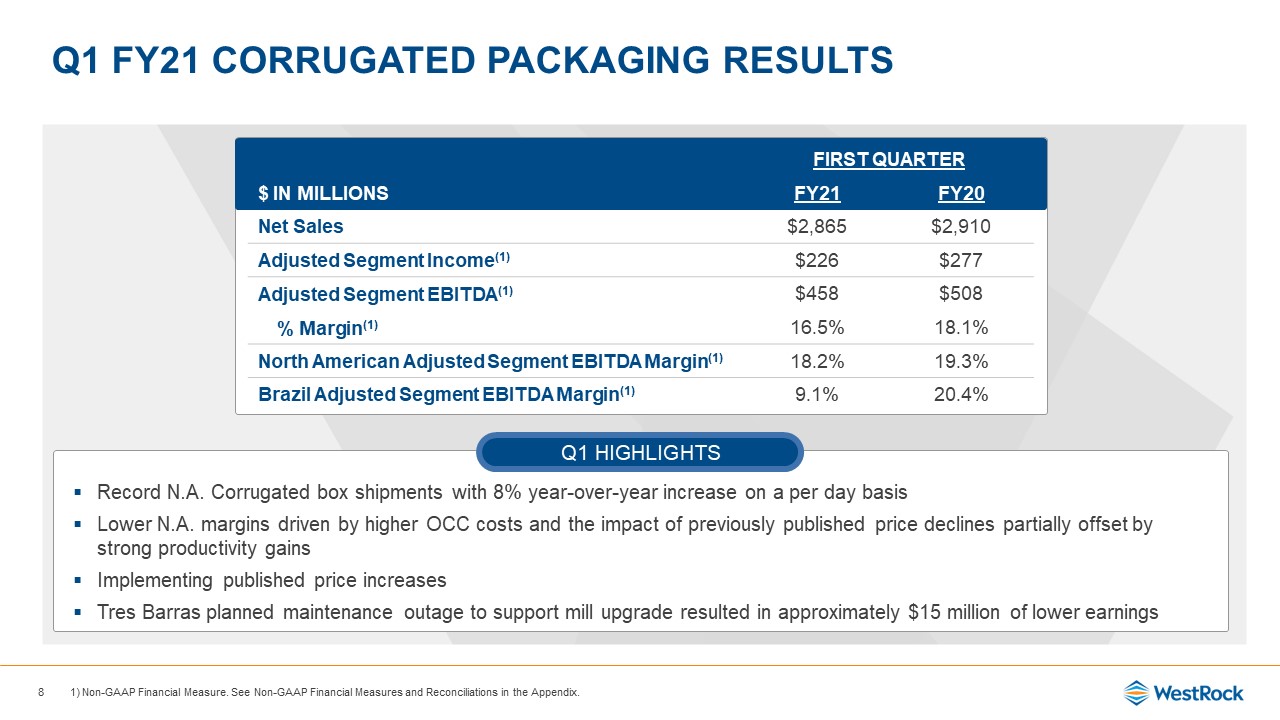
Appendix. FIRST QUARTER $ in millions FY21 FY20 Net Sales $2,865 $2,910 Adjusted Segment Income(1) $226 $277 Adjusted Segment EBITDA(1) $458 $508 % Margin(1) 16.5% 18.1% North American Adjusted Segment EBITDA
Margin(1) 18.2% 19.3% Brazil Adjusted Segment EBITDA Margin(1) 9.1% 20.4% Q1 Fy21 Corrugated Packaging Results Record N.A. Corrugated box shipments with 8% year-over-year increase on a per day basisLower N.A. margins driven by higher OCC
costs and the impact of previously published price declines partially offset by strong productivity gains Implementing published price increasesTres Barras planned maintenance outage to support mill upgrade resulted in approximately $15 million
of lower earnings Q1 Highlights
9 Non-GAAP Financial Measure. See Non-GAAP Financial Measures and Reconciliations in the
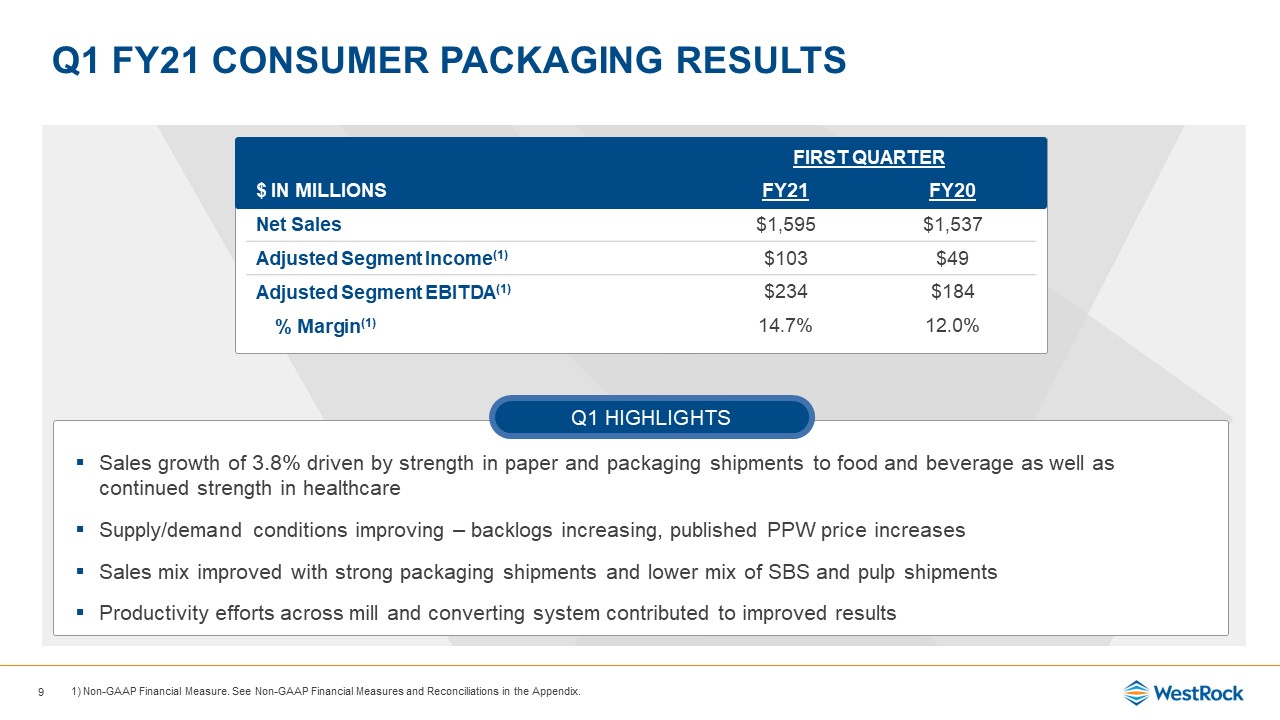
Appendix. Q1 Fy21 consumer Packaging Results Sales growth of 3.8% driven by strength in paper and packaging shipments to food and beverage as well as continued strength in healthcare Supply/demand conditions improving – backlogs
increasing, published PPW price increasesSales mix improved with strong packaging shipments and lower mix of SBS and pulp shipmentsProductivity efforts across mill and converting system contributed to improved results Q1 Highlights FIRST
QUARTER $ in millions FY21 FY20 Net Sales $1,595 $1,537 Adjusted Segment Income(1) $103 $49 Adjusted Segment EBITDA(1) $234 $184 % Margin(1) 14.7% 12.0%
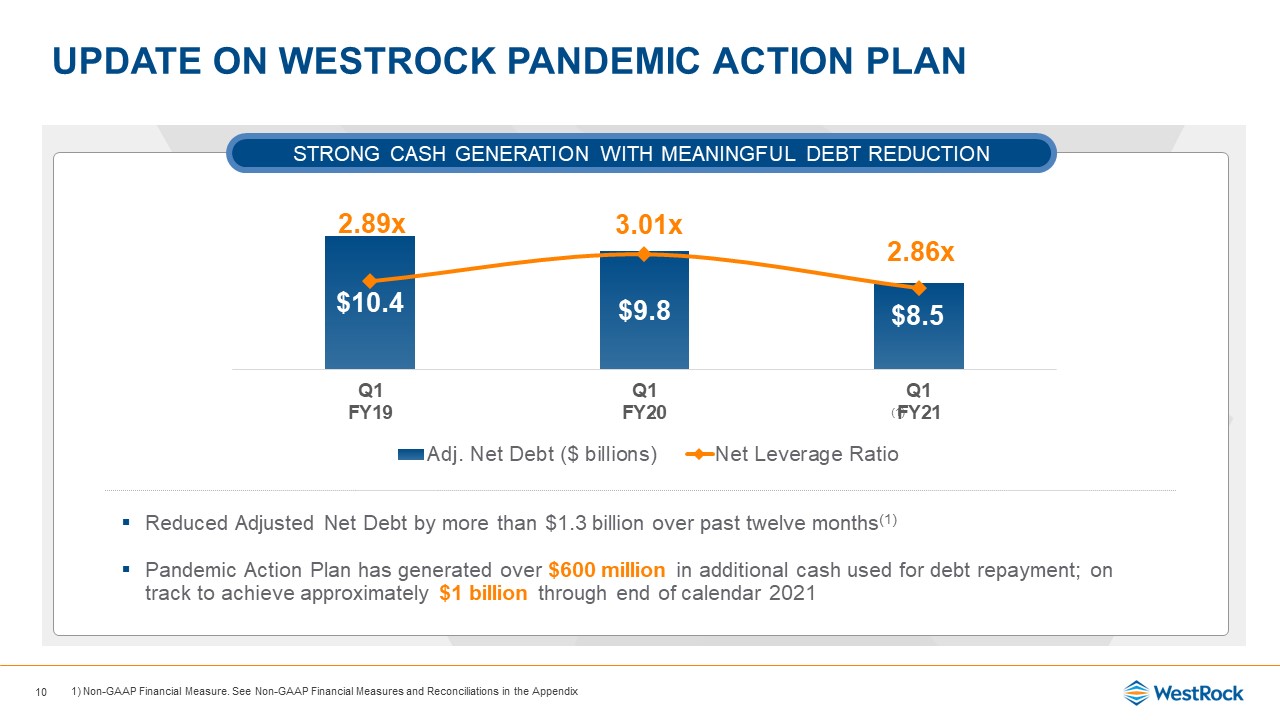
Update on Westrock pandemic action plan Reduced Adjusted Net Debt by more than $1.3 billion over past
twelve months(1)Pandemic Action Plan has generated over $600 million in additional cash used for debt repayment; on track to achieve approximately $1 billion through end of calendar 2021 Strong Cash Generation with Meaningful Debt
Reduction Non-GAAP Financial Measure. See Non-GAAP Financial Measures and Reconciliations in the Appendix 10 (1) (1)
Non-GAAP Financial Measure. See Non-GAAP Financial Measures and Forward-looking Guidance in the
Appendix. Growing packaging demand Implementing published price increasesStrategic capital investments nearly complete and benefits ramping upStrong cash flow generationFive consecutive years of greater than $1 billion in Adjusted Free Cash
Flow(1)Over $1.6 billion in Adjusted Free Cash Flow during the trailing twelve months as of Q1 FY21(1)Road map to return Net Leverage Ratio to targeted range of 2.25x to 2.50x(1) FY21 Update 11
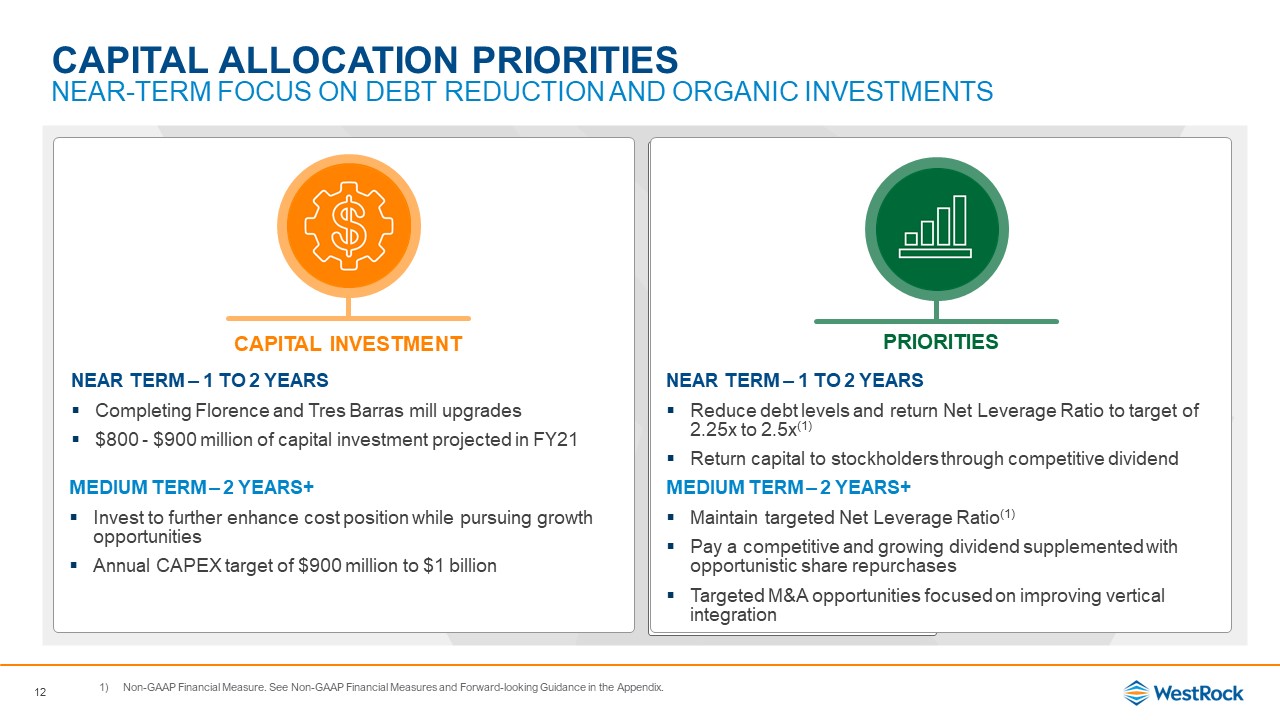
Capital Investment PRIORITIES Capital Allocation PrioritiesNear-Term Focus on Debt Reduction and
Organic Investments xxx Near Term – 1 to 2 YearsCompleting Florence and Tres Barras mill upgrades$800 - $900 million of capital investment projected in FY21 Near Term – 1 to 2 YearsReduce debt levels and return Net Leverage Ratio to target
of 2.25x to 2.5x(1)Return capital to stockholders through competitive dividend Medium Term – 2 Years+Invest to further enhance cost position while pursuing growth opportunities Annual CAPEX target of $900 million to $1 billion Medium Term – 2
Years+Maintain targeted Net Leverage Ratio(1)Pay a competitive and growing dividend supplemented with opportunistic share repurchasesTargeted M&A opportunities focused on improving vertical integration Non-GAAP Financial Measure. See
Non-GAAP Financial Measures and Forward-looking Guidance in the Appendix. 12
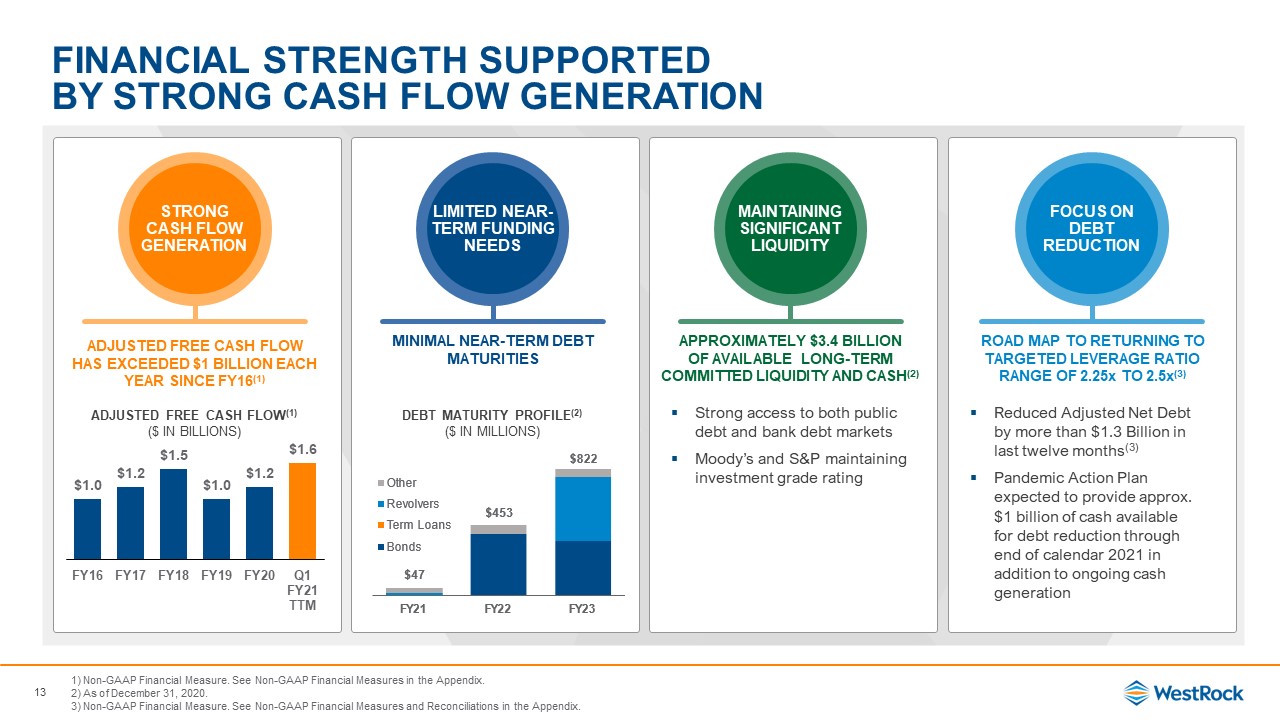
Adjusted Free Cash Flow Has Exceeded $1 billion each Year since FY16(1) Minimal Near-term debt
maturities Approximately $3.4 billionof Available Long-term Committed liquidity and Cash(2) Road Map to returning to targeted leverage RATIO range of 2.25x to 2.5x(3) Financial Strength Supported by Strong Cash Flow Generation Strong
Cash Flow Generation Limited Near-Term Funding Needs Maintaining Significant Liquidity Focus on Debt Reduction Strong access to both public debt and bank debt marketsMoody’s and S&P maintaining investment grade
rating Reduced Adjusted Net Debt by more than $1.3 Billion in last twelve months(3)Pandemic Action Plan expected to provide approx. $1 billion of cash available for debt reduction through end of calendar 2021 in addition to ongoing cash
generation Adjusted Free Cash Flow(1)($ in Billions) Debt Maturity Profile(2)($ in Millions) Non-GAAP Financial Measure. See Non-GAAP Financial Measures in the Appendix. As of December 31, 2020.Non-GAAP Financial Measure. See Non-GAAP
Financial Measures and Reconciliations in the Appendix. 13
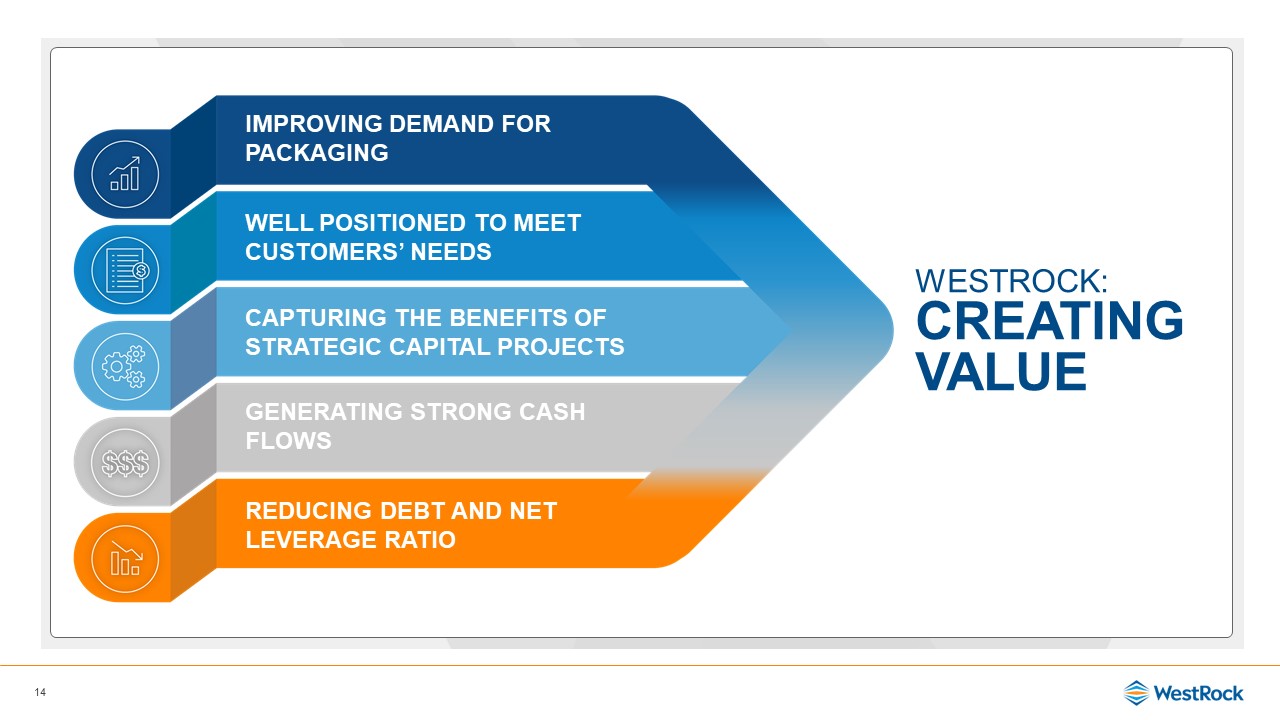
WestRock:Creating Value Reducing Debt And NET Leverage ratio Generating Strong Cash Flows Capturing
the benefits of Strategic capital projects Well positioned to meet customers’ needs Improving Demand for packaging 14
15 Appendix
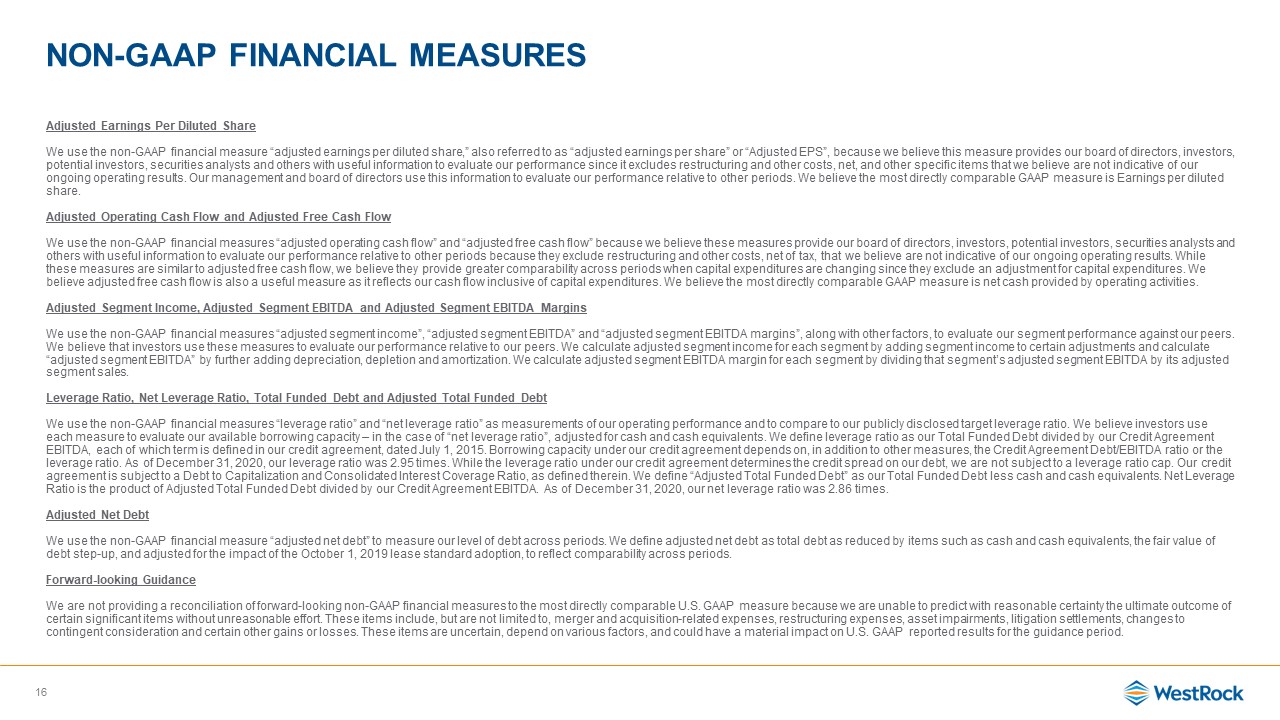
Non-GAAP Financial Measures Adjusted Earnings Per Diluted ShareWe use the non-GAAP financial measure
“adjusted earnings per diluted share,” also referred to as “adjusted earnings per share” or “Adjusted EPS”, because we believe this measure provides our board of directors, investors, potential investors, securities analysts and others with
useful information to evaluate our performance since it excludes restructuring and other costs, net, and other specific items that we believe are not indicative of our ongoing operating results. Our management and board of directors use this
information to evaluate our performance relative to other periods. We believe the most directly comparable GAAP measure is Earnings per diluted share.Adjusted Operating Cash Flow and Adjusted Free Cash FlowWe use the non-GAAP financial measures
“adjusted operating cash flow” and “adjusted free cash flow” because we believe these measures provide our board of directors, investors, potential investors, securities analysts and others with useful information to evaluate our performance
relative to other periods because they exclude restructuring and other costs, net of tax, that we believe are not indicative of our ongoing operating results. While these measures are similar to adjusted free cash flow, we believe they provide
greater comparability across periods when capital expenditures are changing since they exclude an adjustment for capital expenditures. We believe adjusted free cash flow is also a useful measure as it reflects our cash flow inclusive of capital
expenditures. We believe the most directly comparable GAAP measure is net cash provided by operating activities. Adjusted Segment Income, Adjusted Segment EBITDA and Adjusted Segment EBITDA MarginsWe use the non-GAAP financial measures
“adjusted segment income”, “adjusted segment EBITDA” and “adjusted segment EBITDA margins”, along with other factors, to evaluate our segment performance against our peers. We believe that investors use these measures to evaluate our
performance relative to our peers. We calculate adjusted segment income for each segment by adding segment income to certain adjustments and calculate “adjusted segment EBITDA” by further adding depreciation, depletion and amortization. We
calculate adjusted segment EBITDA margin for each segment by dividing that segment’s adjusted segment EBITDA by its adjusted segment sales. Leverage Ratio, Net Leverage Ratio, Total Funded Debt and Adjusted Total Funded DebtWe use the non-GAAP
financial measures “leverage ratio” and “net leverage ratio” as measurements of our operating performance and to compare to our publicly disclosed target leverage ratio. We believe investors use each measure to evaluate our available borrowing
capacity – in the case of “net leverage ratio”, adjusted for cash and cash equivalents. We define leverage ratio as our Total Funded Debt divided by our Credit Agreement EBITDA, each of which term is defined in our credit agreement, dated July
1, 2015. Borrowing capacity under our credit agreement depends on, in addition to other measures, the Credit Agreement Debt/EBITDA ratio or the leverage ratio. As of December 31, 2020, our leverage ratio was 2.95 times. While the leverage ratio
under our credit agreement determines the credit spread on our debt, we are not subject to a leverage ratio cap. Our credit agreement is subject to a Debt to Capitalization and Consolidated Interest Coverage Ratio, as defined therein. We define
“Adjusted Total Funded Debt” as our Total Funded Debt less cash and cash equivalents. Net Leverage Ratio is the product of Adjusted Total Funded Debt divided by our Credit Agreement EBITDA. As of December 31, 2020, our net leverage ratio was
2.86 times. Adjusted Net DebtWe use the non-GAAP financial measure “adjusted net debt” to measure our level of debt across periods. We define adjusted net debt as total debt as reduced by items such as cash and cash equivalents, the fair value
of debt step-up, and adjusted for the impact of the October 1, 2019 lease standard adoption, to reflect comparability across periods. Forward-looking GuidanceWe are not providing a reconciliation of forward-looking non-GAAP financial measures
to the most directly comparable U.S. GAAP measure because we are unable to predict with reasonable certainty the ultimate outcome of certain significant items without unreasonable effort. These items include, but are not limited to, merger and
acquisition-related expenses, restructuring expenses, asset impairments, litigation settlements, changes to contingent consideration and certain other gains or losses. These items are uncertain, depend on various factors, and could have a
material impact on U.S. GAAP reported results for the guidance period. 16
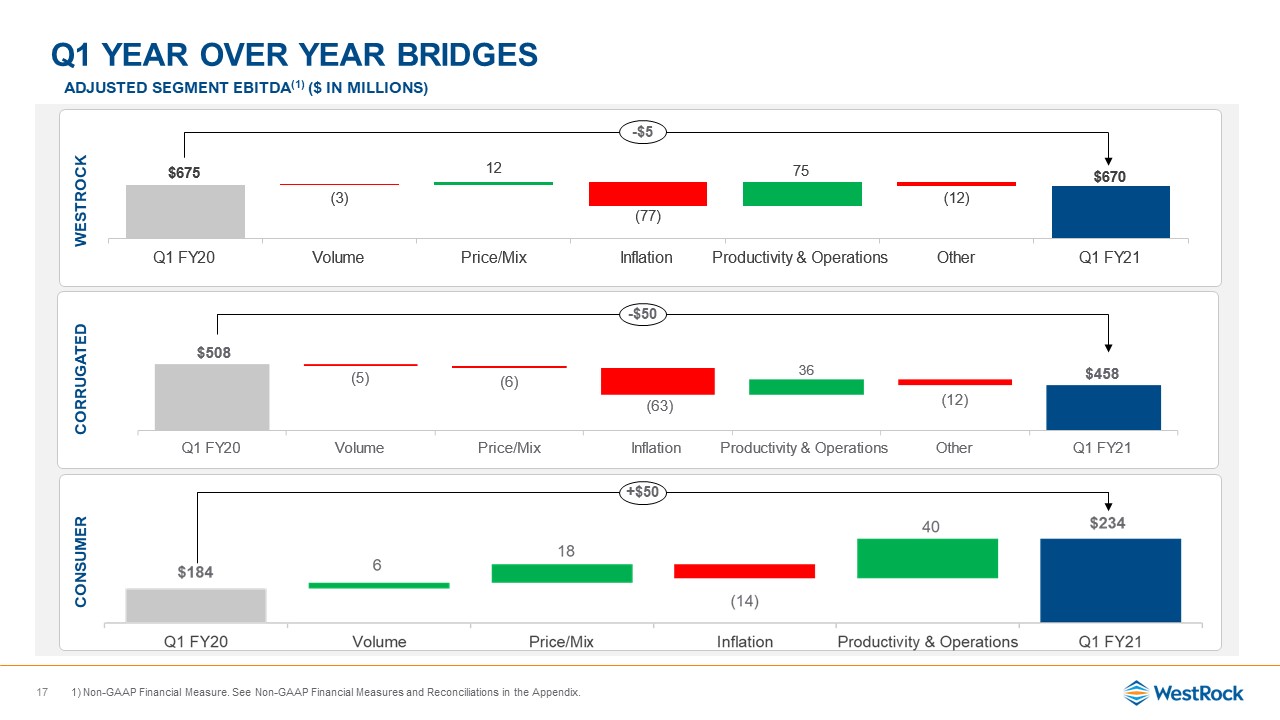
Q1 Year OVER YEAR BRIDGES 17 Adjusted Segment EBITDA(1) ($ in
millions) WESTROCK CORRUGATED CONSUMER Non-GAAP Financial Measure. See Non-GAAP Financial Measures and Reconciliations in the Appendix. -$5 -$50 +$50
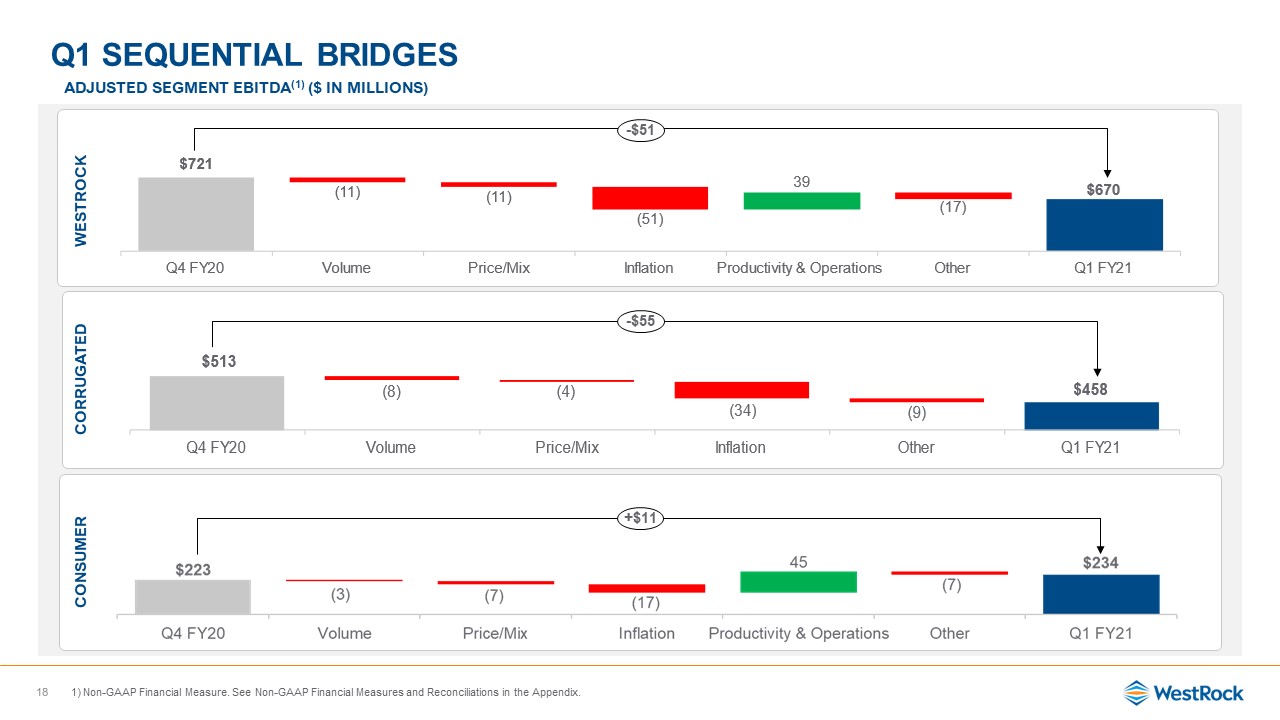
Q1 SEQUENTIAL BRIDGES 18 Adjusted Segment EBITDA(1) ($ in
millions) WESTROCK CORRUGATED CONSUMER Non-GAAP Financial Measure. See Non-GAAP Financial Measures and Reconciliations in the Appendix. -$51 -$55 +$11
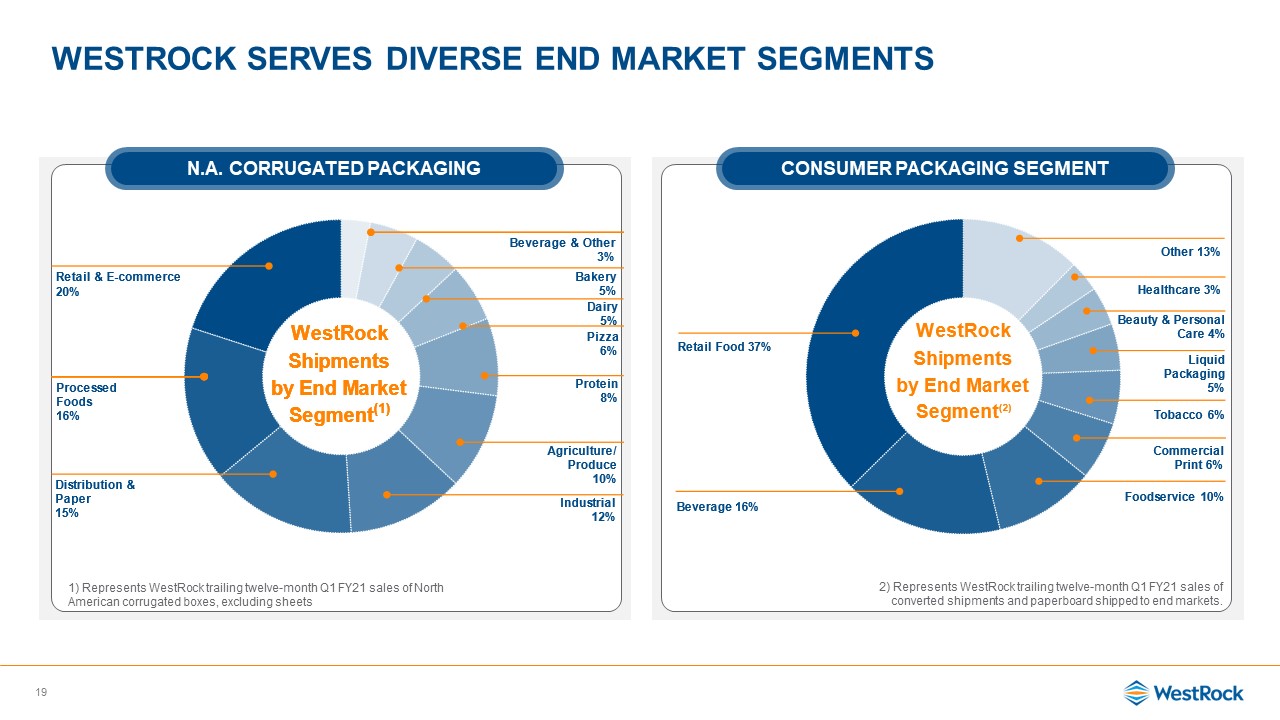
Westrock Serves Diverse End Market segments 19 N.A. Corrugated Packaging Consumer
Packaging Segment 2) Represents WestRock trailing twelve-month Q1 FY21 sales of converted shipments and paperboard shipped to end markets. 1) Represents WestRock trailing twelve-month Q1 FY21 sales of North American corrugated boxes,
excluding sheets
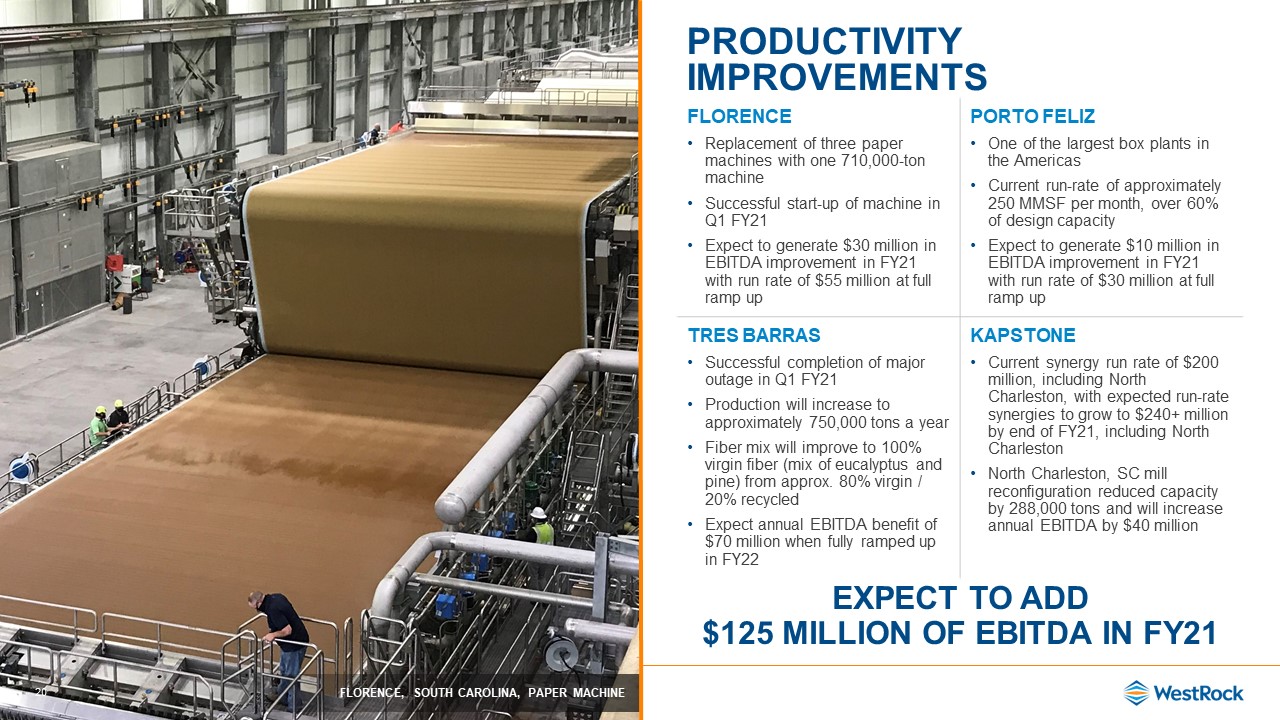
20 Productivity Improvements EXPECT TO ADD$125 MILLION OF EBITDA IN FY21 FLORENCEReplacement of
three paper machines with one 710,000-ton machineSuccessful start-up of machine in Q1 FY21Expect to generate $30 million in EBITDA improvement in FY21 with run rate of $55 million at full ramp up PORTO FELIZOne of the largest box plants in the
AmericasCurrent run-rate of approximately 250 MMSF per month, over 60% of design capacityExpect to generate $10 million in EBITDA improvement in FY21 with run rate of $30 million at full ramp up TRES BARRASSuccessful completion of major outage
in Q1 FY21Production will increase to approximately 750,000 tons a yearFiber mix will improve to 100% virgin fiber (mix of eucalyptus and pine) from approx. 80% virgin / 20% recycled Expect annual EBITDA benefit of $70 million when fully ramped
up in FY22 KAPSTONECurrent synergy run rate of $200 million, including North Charleston, with expected run-rate synergies to grow to $240+ million by end of FY21, including North CharlestonNorth Charleston, SC mill reconfiguration reduced
capacity by 288,000 tons and will increase annual EBITDA by $40 million FLORENCE, SOUTH CAROLINA, PAPER MACHINE

21 Q1 Q2 Q3 Q4 Full Year FY21 Maintenance 79 55 118 2 254 FY20
Maintenance 110 87 21 88 306 North American Corrugated Packaging Q1 Q2 Q3 Q4 Full Year FY21 Maintenance 26 16 21 2 65 FY20 Maintenance 36 18 0 14 68 Consumer Packaging Note: North American Corrugated Packaging FY21
maintenance downtime excludes 48,000 tons of mill downtime in Brazil during Q1 FY21 from the Tres Barras mill upgrade Mill Maintenance Schedule (tons in thousands)
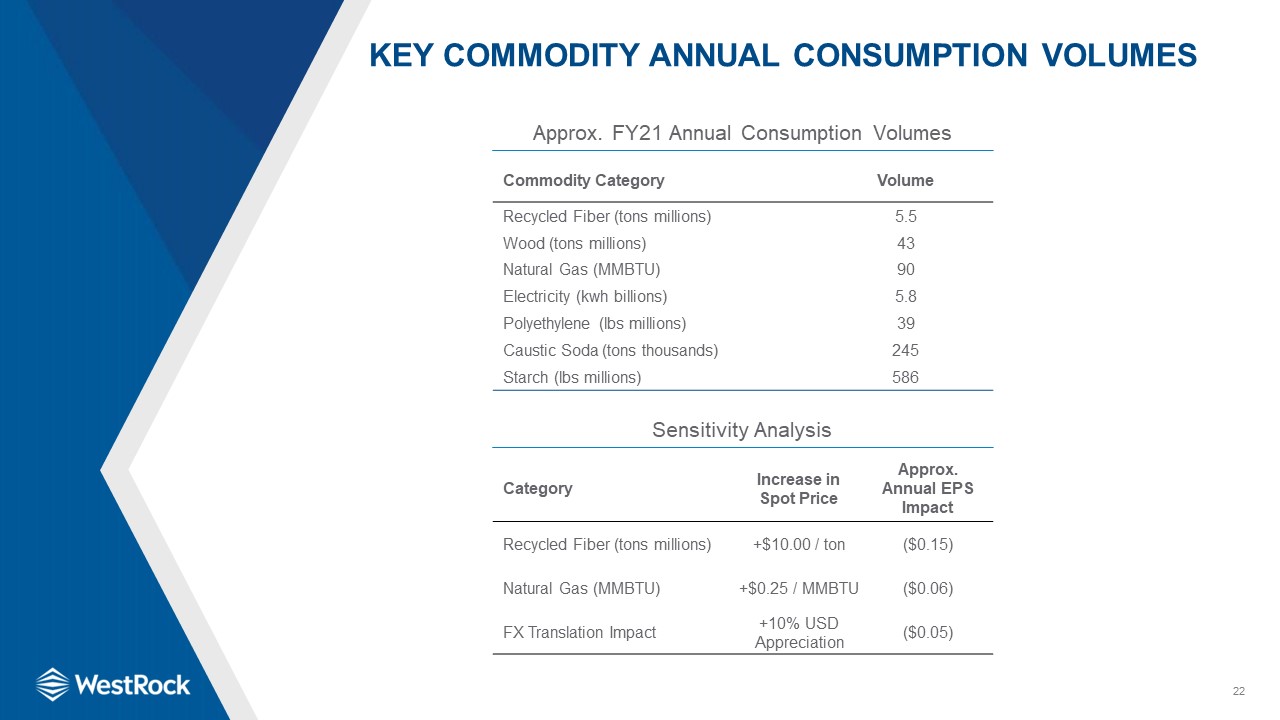
22 Key Commodity Annual Consumption Volumes Commodity Category Volume Recycled Fiber (tons
millions) 5.5 Wood (tons millions) 43 Natural Gas (MMBTU) 90 Electricity (kwh billions) 5.8 Polyethylene (lbs millions) 39 Caustic Soda (tons thousands) 245 Starch (lbs millions) 586 Approx. FY21 Annual Consumption
Volumes Sensitivity Analysis Category Increase in Spot Price Approx. Annual EPS Impact Recycled Fiber (tons millions) +$10.00 / ton ($0.15) Natural Gas (MMBTU) +$0.25 / MMBTU ($0.06) FX Translation Impact +10% USD
Appreciation ($0.05)
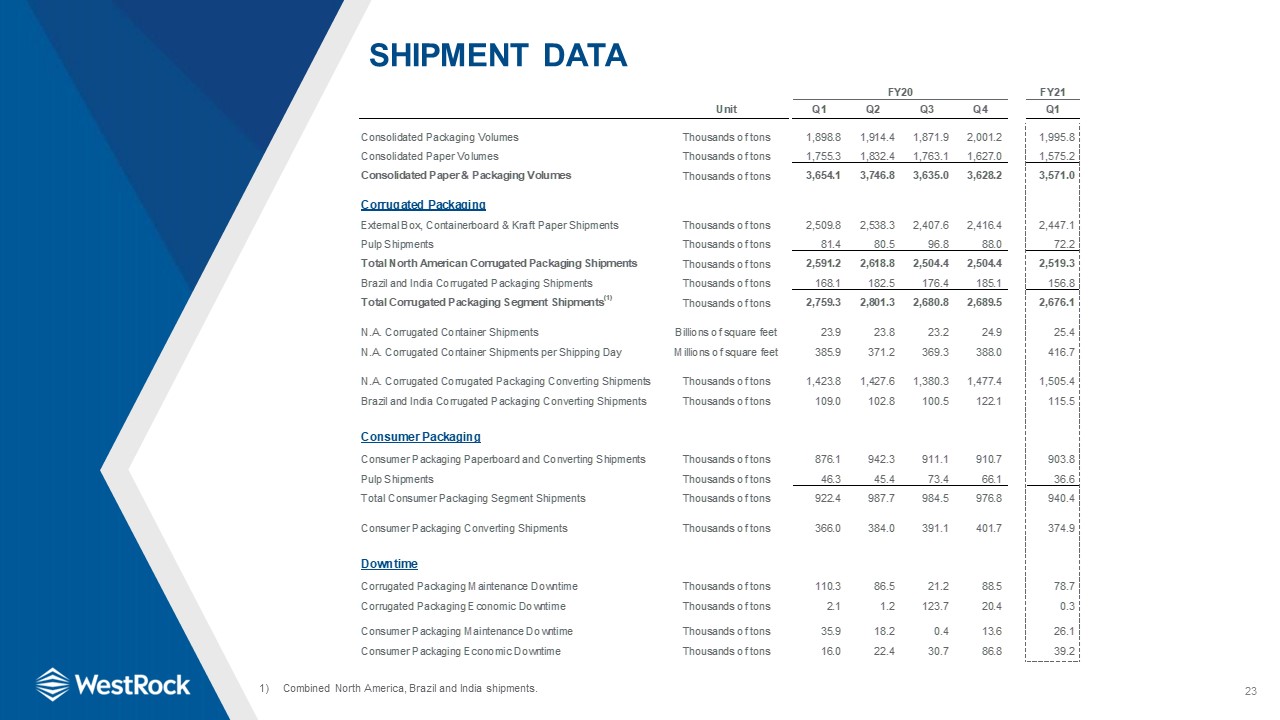
23 Shipment Data Combined North America, Brazil and India shipments.
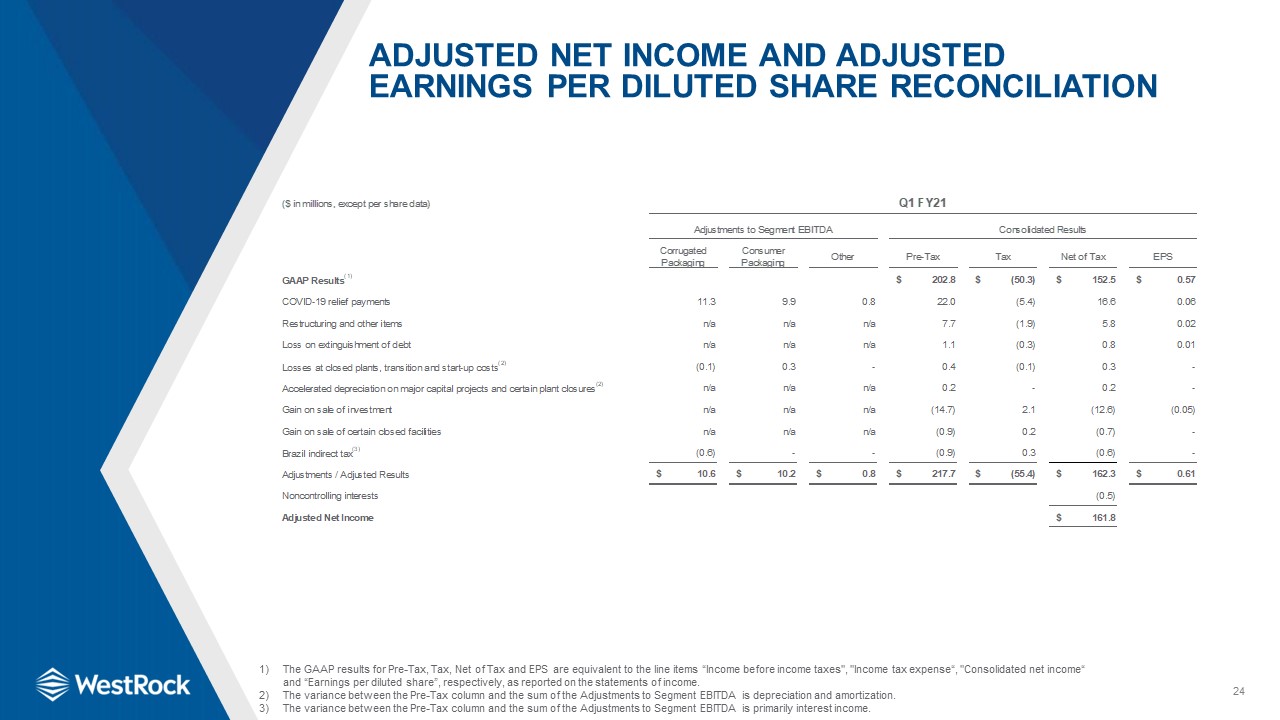
24 Adjusted Net Income and Adjusted Earnings Per Diluted Share Reconciliation The GAAP results for
Pre-Tax, Tax, Net of Tax and EPS are equivalent to the line items “Income before income taxes", "Income tax expense“, "Consolidated net income“ and “Earnings per diluted share”, respectively, as reported on the statements of income.The variance
between the Pre-Tax column and the sum of the Adjustments to Segment EBITDA is depreciation and amortization.The variance between the Pre-Tax column and the sum of the Adjustments to Segment EBITDA is primarily interest income.
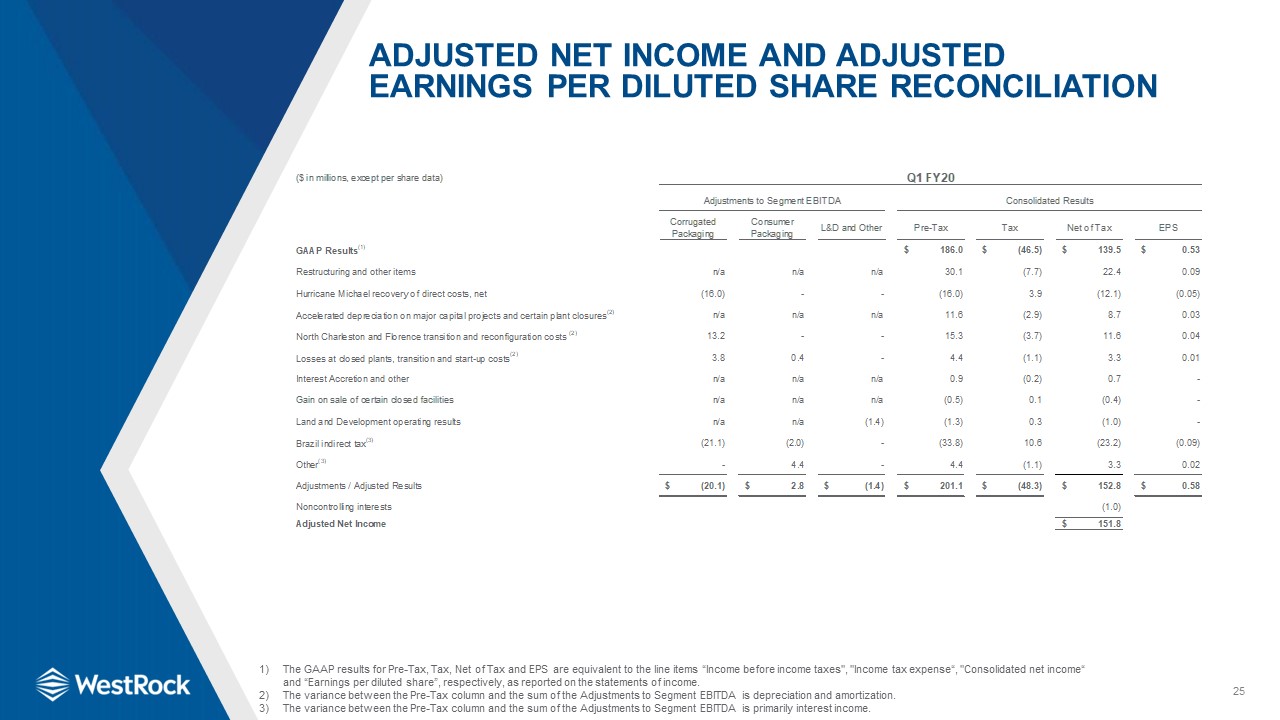
25 Adjusted Net Income and Adjusted Earnings Per Diluted Share Reconciliation The GAAP results for
Pre-Tax, Tax, Net of Tax and EPS are equivalent to the line items “Income before income taxes", "Income tax expense“, "Consolidated net income“ and “Earnings per diluted share”, respectively, as reported on the statements of income.The variance
between the Pre-Tax column and the sum of the Adjustments to Segment EBITDA is depreciation and amortization.The variance between the Pre-Tax column and the sum of the Adjustments to Segment EBITDA is primarily interest income.
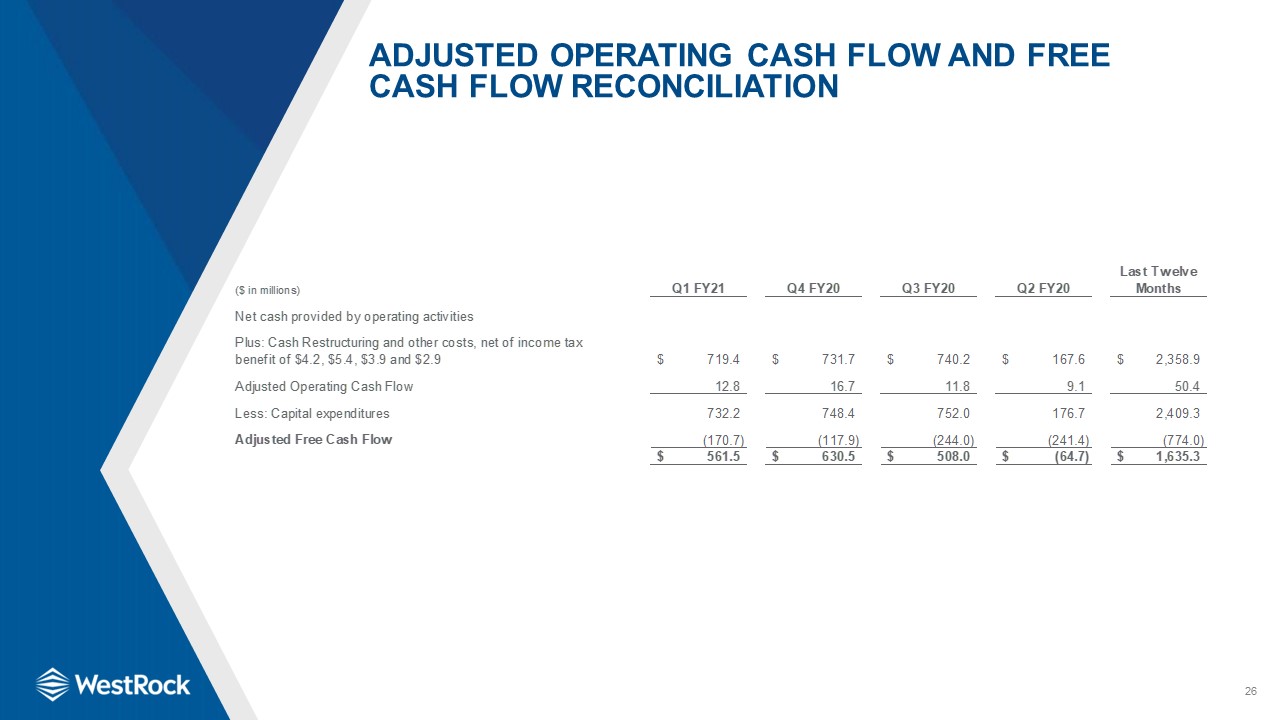
26 Adjusted Operating Cash Flow and Free Cash Flow Reconciliation

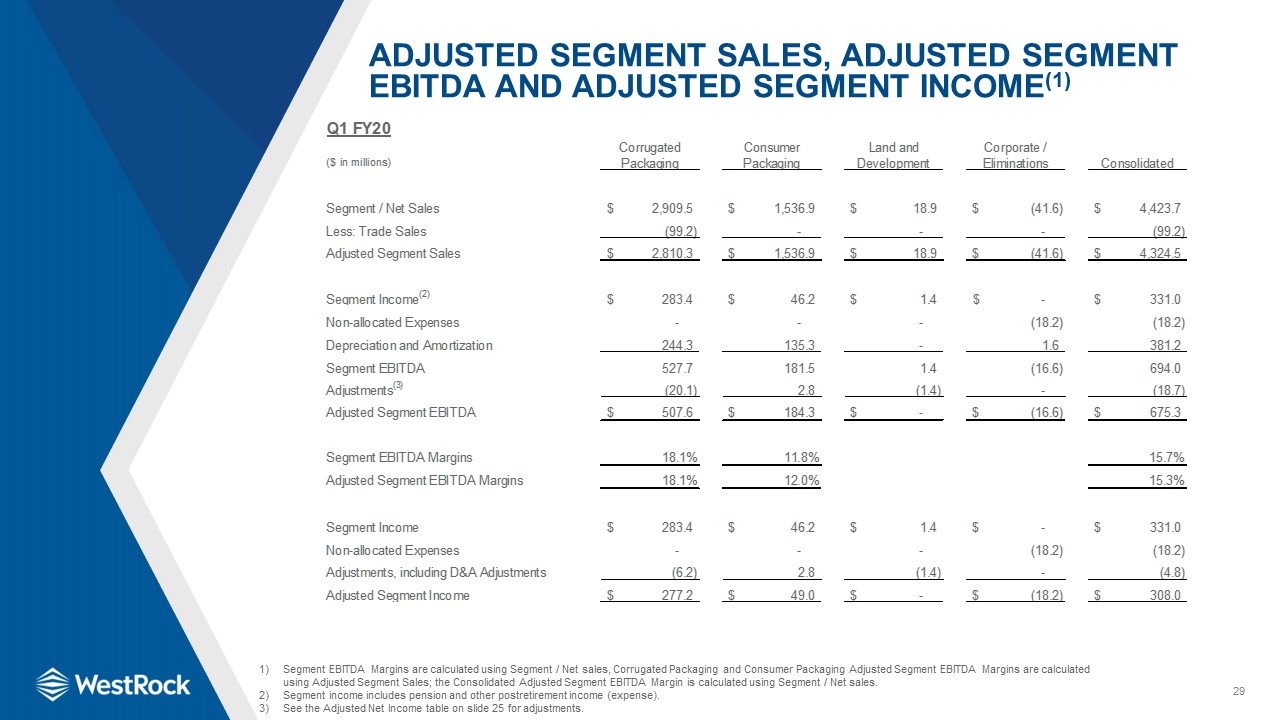
27 Adjusted Segment Sales, Adjusted Segment EBITDA and Adjusted Segment Income(1) Segment EBITDA
Margins are calculated using Segment / Net sales, Corrugated Packaging and Consumer Packaging Adjusted Segment EBITDA Margins are calculated using Adjusted Segment Sales; the Consolidated Adjusted Segment EBITDA Margin is calculated using
Segment / Net sales.Segment income includes pension and other postretirement income (expense).See the Adjusted Net Income table on slide 24 for adjustments.
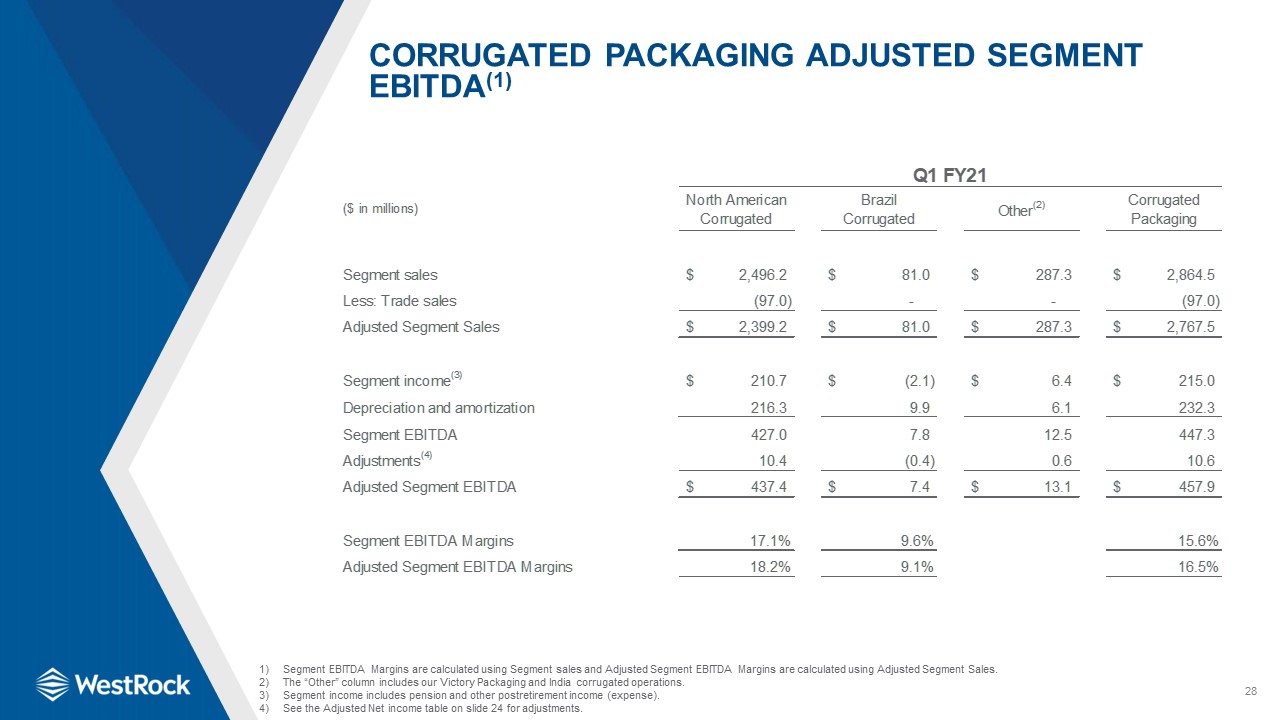
28 Corrugated Packaging Adjusted Segment EBITDA(1) Segment EBITDA Margins are calculated using Segment
sales and Adjusted Segment EBITDA Margins are calculated using Adjusted Segment Sales.The “Other” column includes our Victory Packaging and India corrugated operations.Segment income includes pension and other postretirement income
(expense).See the Adjusted Net income table on slide 24 for adjustments.
29 Adjusted Segment Sales, Adjusted Segment EBITDA and Adjusted Segment Income(1) Segment EBITDA
Margins are calculated using Segment / Net sales, Corrugated Packaging and Consumer Packaging Adjusted Segment EBITDA Margins are calculated using Adjusted Segment Sales; the Consolidated Adjusted Segment EBITDA Margin is calculated using
Segment / Net sales.Segment income includes pension and other postretirement income (expense).See the Adjusted Net Income table on slide 25 for adjustments.
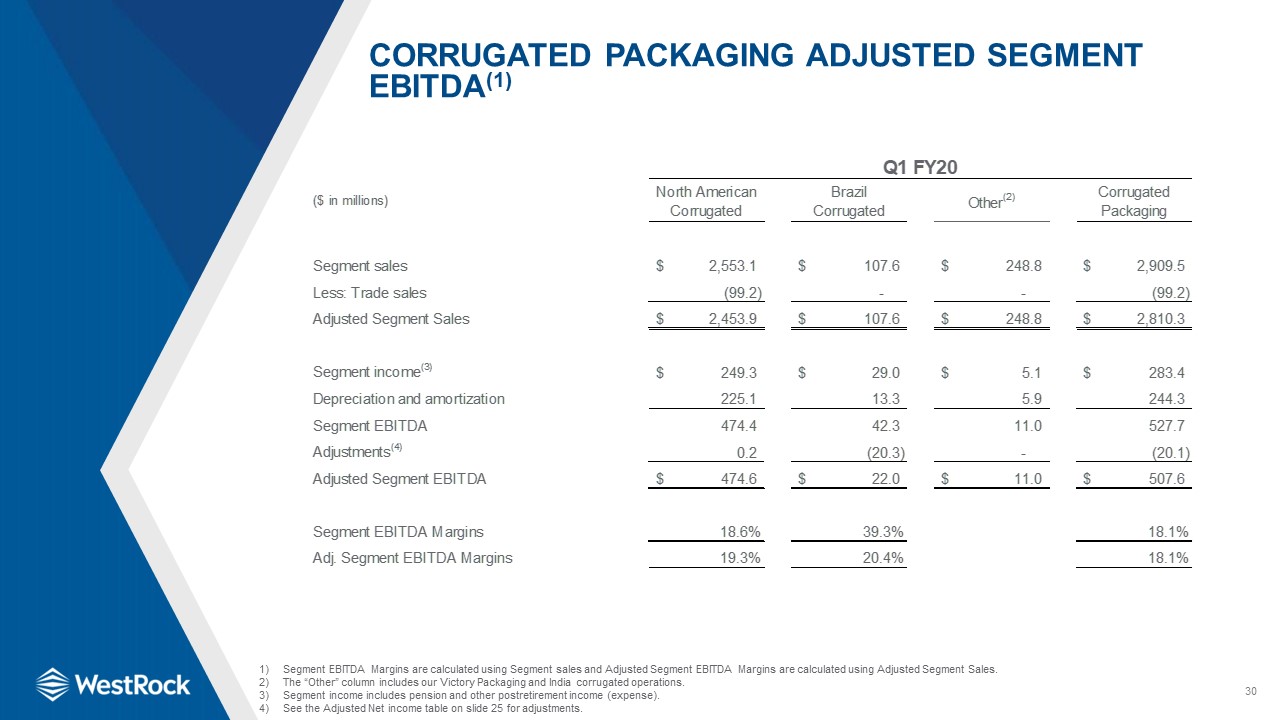
30 Corrugated Packaging Adjusted Segment EBITDA(1) Segment EBITDA Margins are calculated using Segment
sales and Adjusted Segment EBITDA Margins are calculated using Adjusted Segment Sales.The “Other” column includes our Victory Packaging and India corrugated operations.Segment income includes pension and other postretirement income
(expense).See the Adjusted Net income table on slide 25 for adjustments.
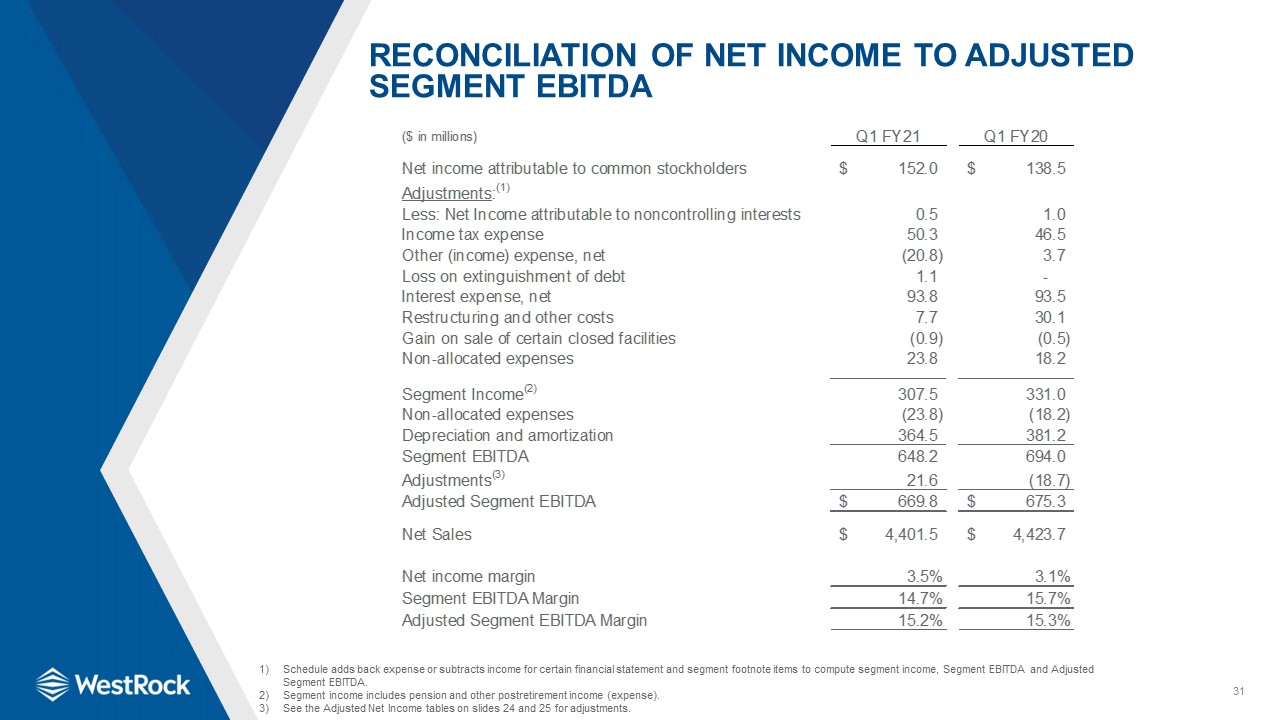
31 Reconciliation of Net Income to Adjusted Segment EBITDA Schedule adds back expense or subtracts
income for certain financial statement and segment footnote items to compute segment income, Segment EBITDA and Adjusted Segment EBITDA.Segment income includes pension and other postretirement income (expense).See the Adjusted Net Income tables
on slides 24 and 25 for adjustments.
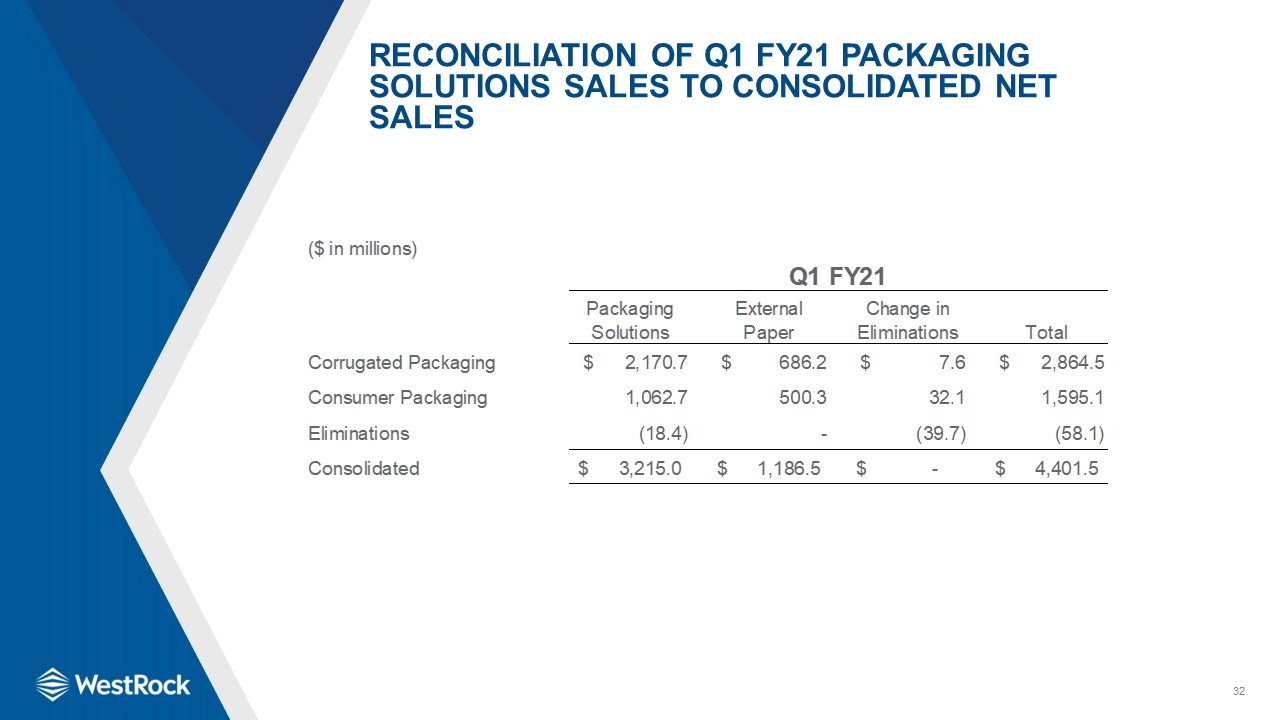
32 Reconciliation of Q1 FY21 Packaging Solutions Sales to Consolidated Net Sales
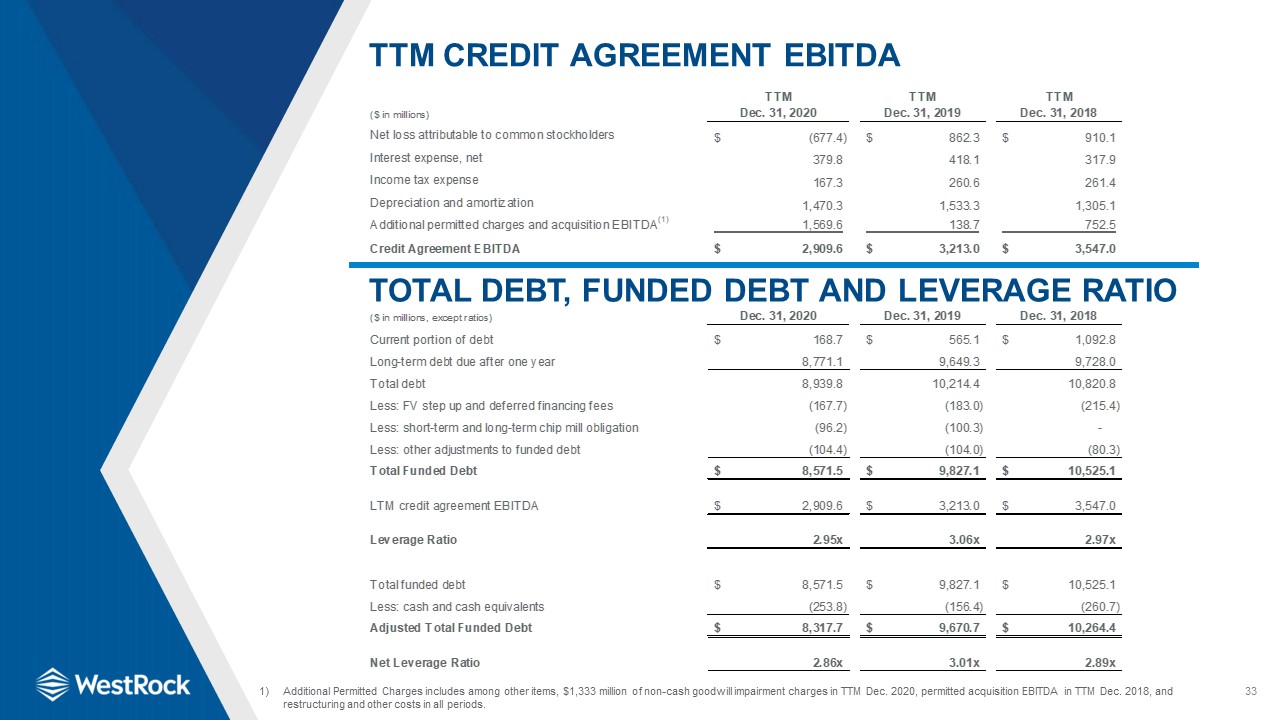
33 TTM Credit Agreement EBITDA Total Debt, Funded Debt and Leverage Ratio Additional Permitted Charges
includes among other items, $1,333 million of non-cash goodwill impairment charges in TTM Dec. 2020, permitted acquisition EBITDA in TTM Dec. 2018, and restructuring and other costs in all periods.
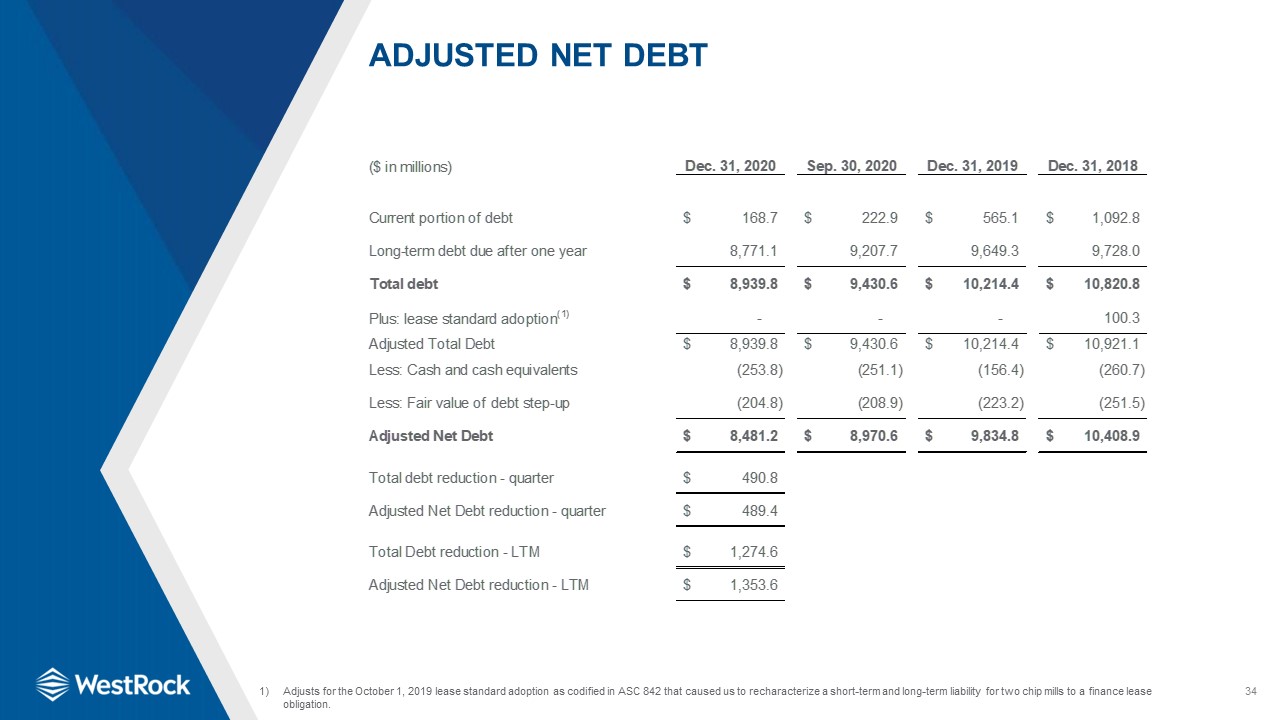
34 Adjusted Net Debt Adjusts for the October 1, 2019 lease standard adoption as codified in ASC 842
that caused us to recharacterize a short-term and long-term liability for two chip mills to a finance lease obligation.