Attached files
| file | filename |
|---|---|
| EX-99.1 - EX-99.1 - OCEANFIRST FINANCIAL CORP | ex991-earningsreleasejanua.htm |
| 8-K - 8-K - OCEANFIRST FINANCIAL CORP | ocfc-20210128.htm |
. . . 4Q-20 Earnings Supplement1 January 28, 2021 1 The 4Q-20 Earnings Supplement is for the purpose and use in conjunction with our Earnings Release furnished as Exhibit 99.1 to our Form 8-K on January 28, 2021. Exhibit 99.2
. . . In addition to historical information, this presentation contains certain forward-looking statements within the meaning of the Private Securities Litigation Reform Act of 1995 which are based on certain assumptions and describe future plans, strategies and expectations of the Company. These forward-looking statements are generally identified by use of the words “believe,” “expect,” “intend,” “anticipate,” “estimate,” “project,” “will,” “should,” “may,” “view,” “opportunity,” “potential,” or similar expressions or expressions of confidence. The Company’s ability to predict results or the actual effect of future plans or strategies is inherently uncertain. Factors which could have a material adverse effect on the operations of the Company and its subsidiaries include, but are not limited to the following: changes in interest rates, general economic conditions, public health crises (such as the governmental, social and economic effects of the novel coronavirus), levels of unemployment in the Bank’s lending area, real estate market values in the Bank’s lending area, future natural disasters and increases to flood insurance premiums, the level of prepayments on loans and mortgage- backed securities, legislative/regulatory changes, monetary and fiscal policies of the U.S. Government including policies of the U.S. Treasury and the Board of Governors of the Federal Reserve System, the quality or composition of the loan or investment portfolios, demand for loan products, deposit flows, competition, demand for financial services in the Company’s market area, accounting principles and guidelines, the Bank’s ability to successfully integrate acquired operations and the other risks described in the Company’s filings with the Securities and Exchange Commission. These risks and uncertainties should be considered in evaluating forward-looking statements and undue reliance should not be placed on such statements. The Company does not undertake, and specifically disclaims any obligation, to publicly release the result of any revisions which may be made to any forward-looking statements to reflect events or circumstances after the date of such statements or to reflect the occurrence of anticipated or unanticipated events. Annualized, pro forma, projected and estimated numbers are used for illustrative purpose only, are not forecasts and may not reflect actual results. This presentation is not an offer to sell securities, nor is it a solicitation of an offer to buy securities in any locality, state, country or other jurisdiction where such distribution, publication, availability or use would be contrary to law or regulation or which would require any registration or licensing within such jurisdiction. Neither the Securities and Exchange Commission nor any other regulatory body has approved or disapproved of the securities of the Company or passed upon the accuracy or adequacy of the presentation. Any representation to the contrary is a criminal offense. Except as otherwise indicated, this presentation speaks as of the date hereof. The delivery of this presentation shall not, under any circumstances, create any implication that there has been no change in the affairs of the Company after the date hereof. Forward Looking Statements 2
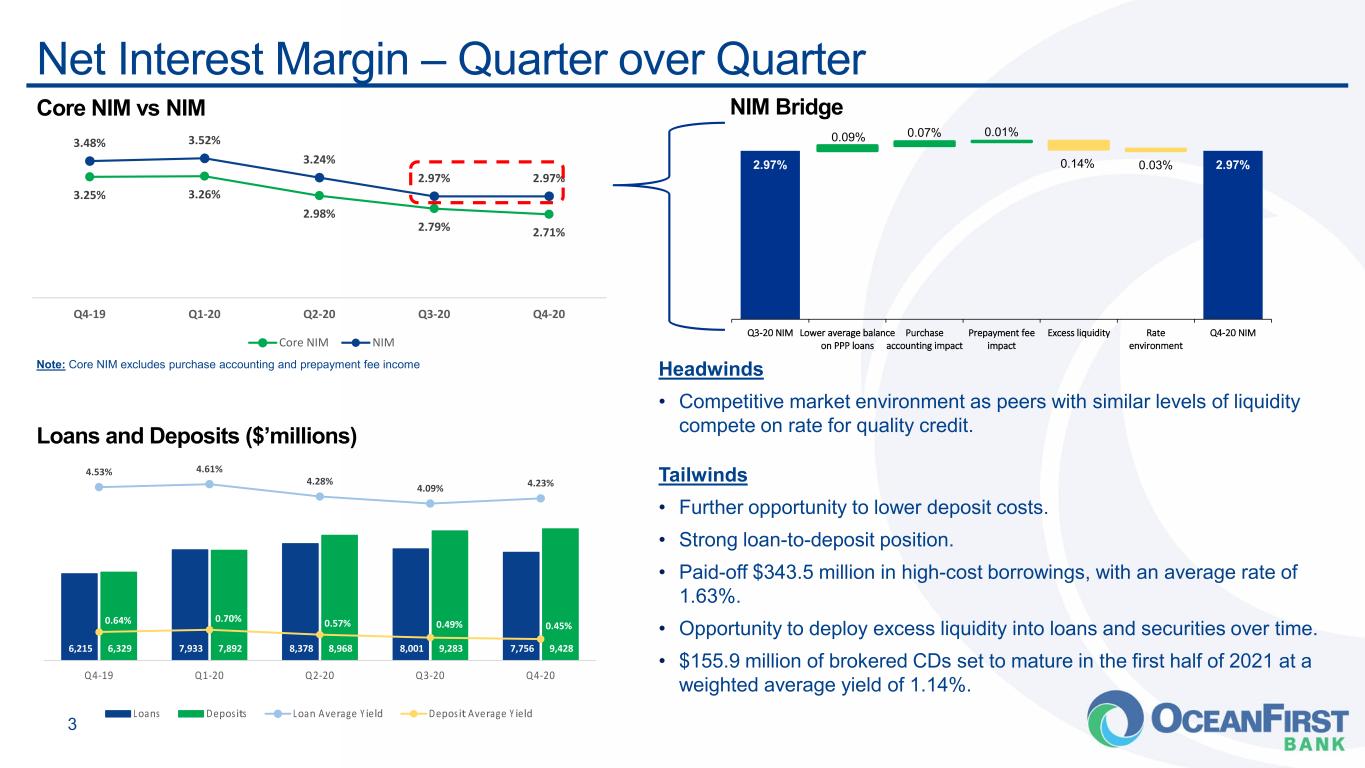
. . . 3.25% 3.26% 2.98% 2.79% 2.71% 3.48% 3.52% 3.24% 2.97% 2.97% Q4-19 Q1-20 Q2-20 Q3-20 Q4-20 Core NIM NIM 2.97% 2.97% 0.09% 0.07% 0.01% 0.14% 0.03% Q3-20 NIM Lower average balance on PPP loans Purchase accounting impact Prepayment fee impact Excess liquidity Rate environment Q4-20 NIM Core NIM vs NIM Net Interest Margin – Quarter over Quarter 3 Headwinds • Competitive market environment as peers with similar levels of liquidity compete on rate for quality credit. Tailwinds • Further opportunity to lower deposit costs. • Strong loan-to-deposit position. • Paid-off $343.5 million in high-cost borrowings, with an average rate of 1.63%. • Opportunity to deploy excess liquidity into loans and securities over time. • $155.9 million of brokered CDs set to mature in the first half of 2021 at a weighted average yield of 1.14%. 6,215 7,933 8,378 8,001 7,756 6,329 7,892 8,968 9,283 9,428 4.53% 4.61% 4.28% 4.09% 4.23% 0.64% 0.70% 0.57% 0.49% 0.45% Q4-19 Q1-20 Q2-20 Q3-20 Q4-20 Loans Deposits Loan Average Yield Deposit Average Yield Note: Core NIM excludes purchase accounting and prepayment fee income Loans and Deposits ($’millions) NIM Bridge
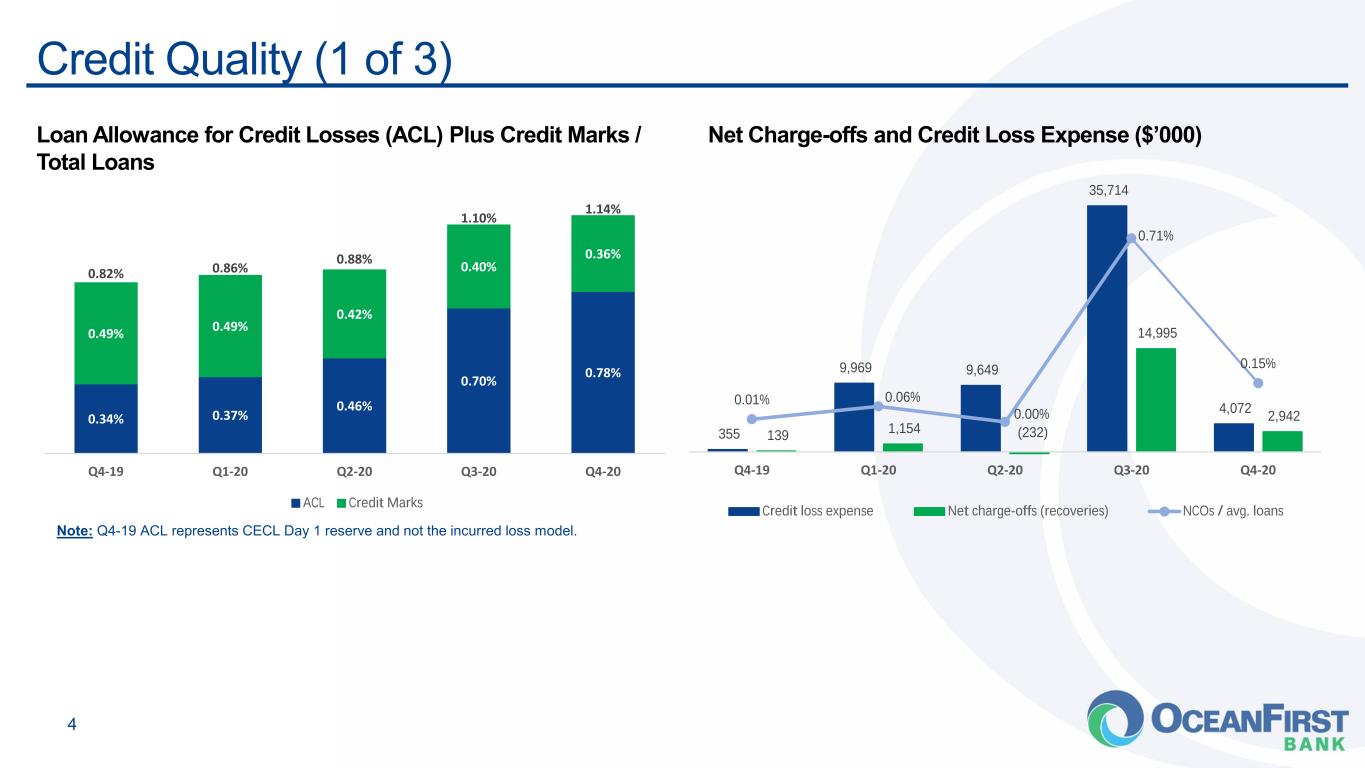
. . . 0.34% 0.37% 0.46% 0.70% 0.78% 0.49% 0.49% 0.42% 0.40% 0.36% 0.82% 0.86% 0.88% 1.10% 1.14% Q4-19 Q1-20 Q2-20 Q3-20 Q4-20 ACL Credit Marks Credit Quality (1 of 3) 4 355 9,969 9,649 35,714 4,072 139 1,154 (232) 14,995 2,942 0.01% 0.06% 0.00% 0.71% 0.15% Q4-19 Q1-20 Q2-20 Q3-20 Q4-20 Credit loss expense Net charge-offs (recoveries) NCOs / avg. loans Loan Allowance for Credit Losses (ACL) Plus Credit Marks / Total Loans Net Charge-offs and Credit Loss Expense ($’000) Note: Q4-19 ACL represents CECL Day 1 reserve and not the incurred loss model.
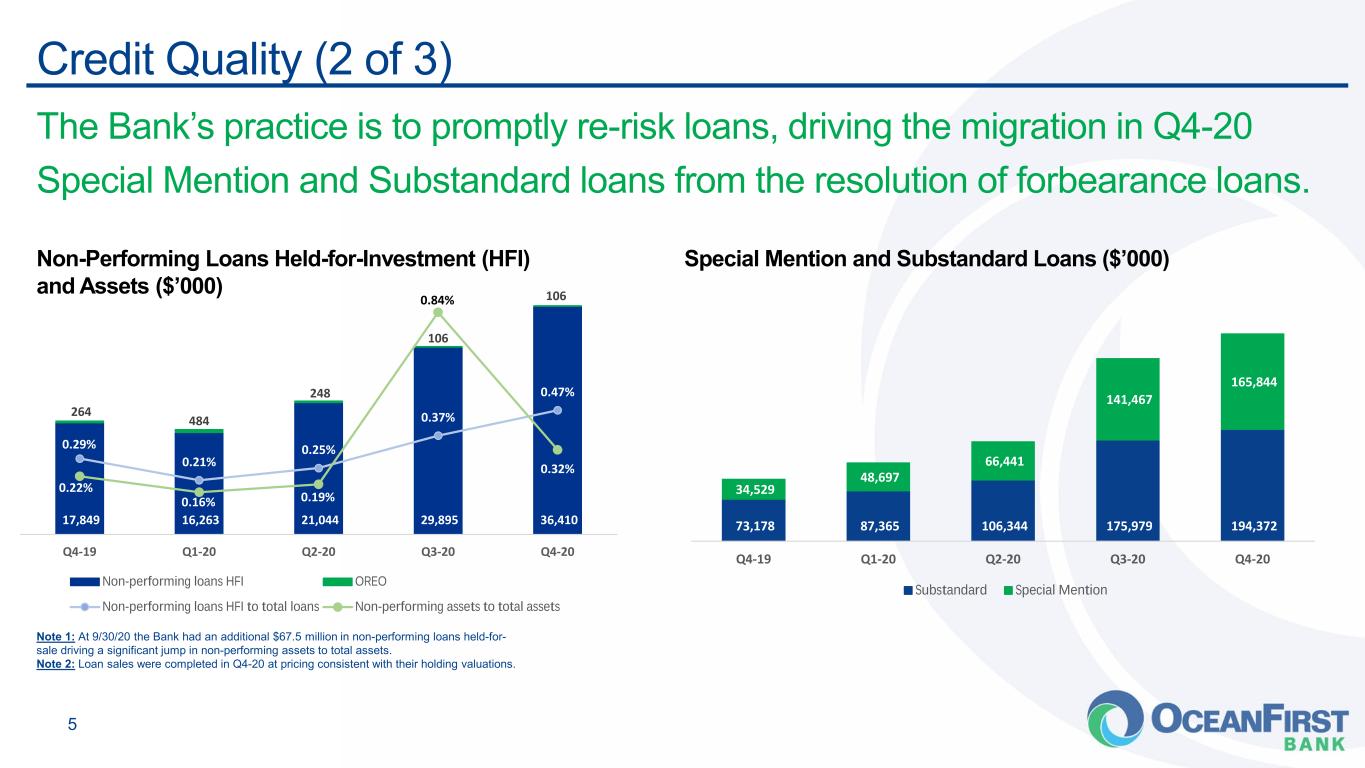
. . . 73,178 87,365 106,344 175,979 194,372 34,529 48,697 66,441 141,467 165,844 Q4-19 Q1-20 Q2-20 Q3-20 Q4-20 Substandard Special Mention Credit Quality (2 of 3) 5 17,849 16,263 21,044 29,895 36,410 264 484 248 106 106 0.29% 0.21% 0.25% 0.37% 0.47% 0.22% 0.16% 0.19% 0.84% 0.32% Q4-19 Q1-20 Q2-20 Q3-20 Q4-20 Non-performing loans HFI OREO Non-performing loans HFI to total loans Non-performing assets to total assets Non-Performing Loans Held-for-Investment (HFI) and Assets ($’000) Special Mention and Substandard Loans ($’000) Note 1: At 9/30/20 the Bank had an additional $67.5 million in non-performing loans held-for- sale driving a significant jump in non-performing assets to total assets. Note 2: Loan sales were completed in Q4-20 at pricing consistent with their holding valuations. The Bank’s practice is to promptly re-risk loans, driving the migration in Q4-20 Special Mention and Substandard loans from the resolution of forbearance loans.
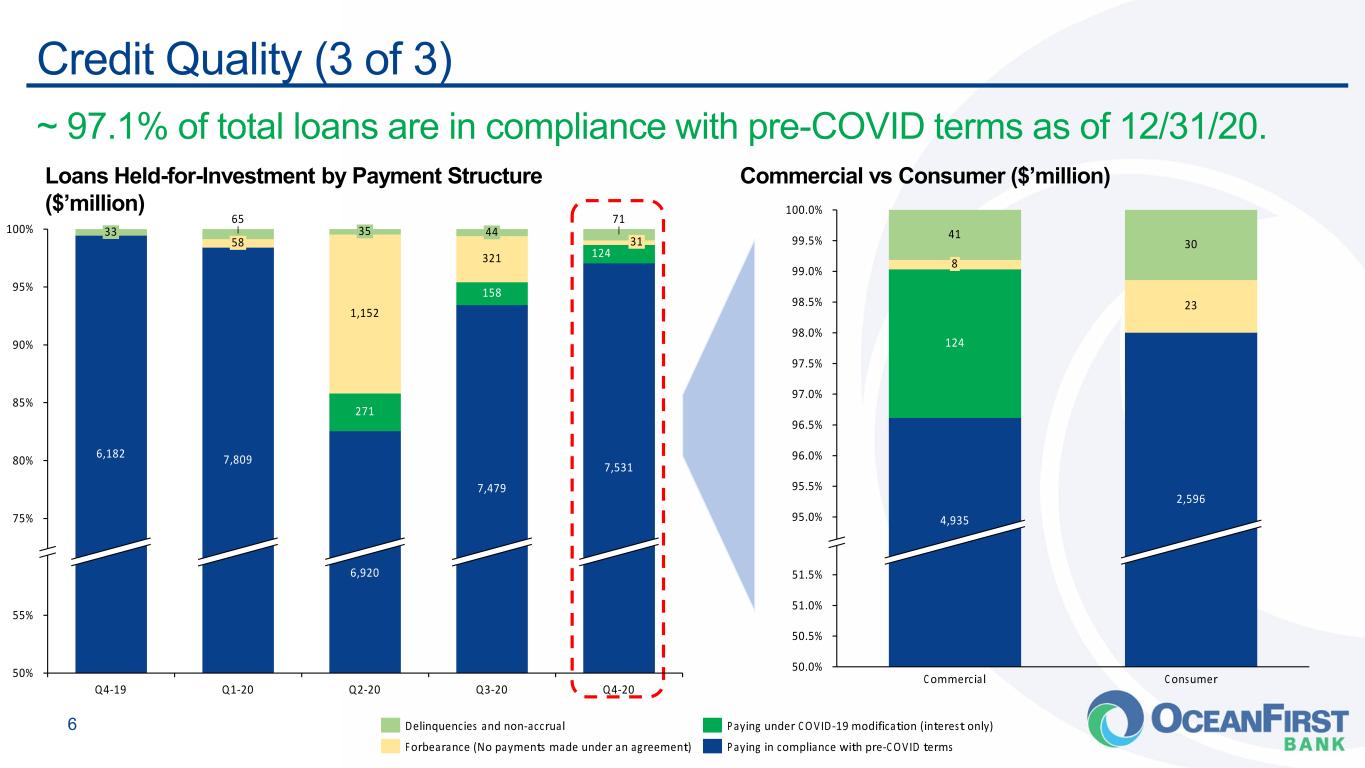
. . .Credit Quality (3 of 3) 6 Commercial vs Consumer ($’million)Loans Held-for-Investment by Payment Structure ($’million) ~ 97.1% of total loans are in compliance with pre-COVID terms as of 12/31/20. 75% 90% 50% 55% 100% 95% 85% 80% 35 Q1-20 321 6,182 31 Q4-19 65 7,809 1,152 271 Q2-20 44 7,479 Q3-20 6,920 124 158 33 7,531 71 Q4-20 58 Delinquencies and non-accrual Forbearance (No payments made under an agreement) Paying in compliance with pre-COVID terms Paying under COVID-19 modification (interest only) 97.0% 50.0% 50.5% 51.0% 99.5% 96.0% 96.5% 95.0% 95.5% 97.5% 98.0% 98.5% 99.0% 100.0% 51.5% 41 ConsumerCommercial 30 124 4,935 23 2,596 8
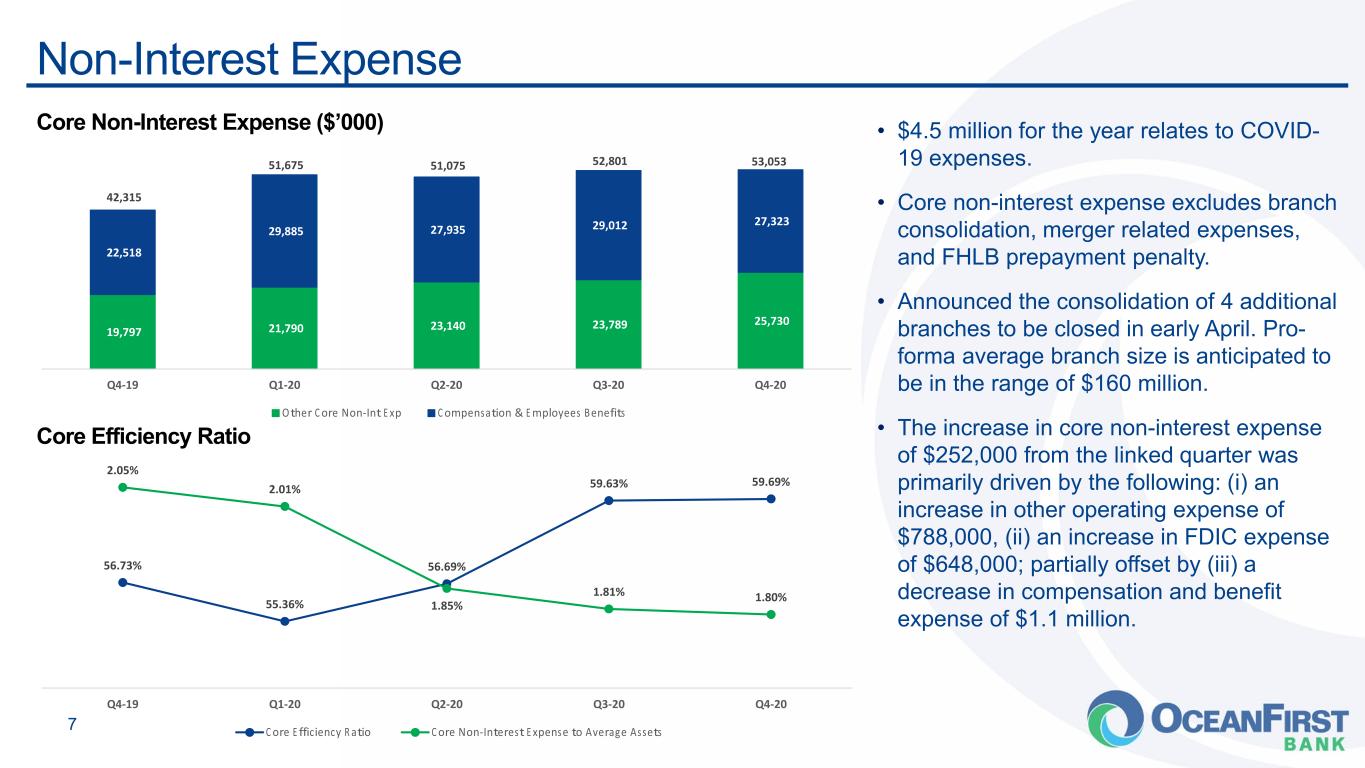
. . .Non-Interest Expense 7 Core Non-Interest Expense ($’000) 19,797 21,790 23,140 23,789 25,730 22,518 29,885 27,935 29,012 27,323 42,315 51,675 51,075 52,801 53,053 Q4-19 Q1-20 Q2-20 Q3-20 Q4-20 Other Core Non-Int Exp Compensation & Employees Benefits Core Efficiency Ratio • $4.5 million for the year relates to COVID- 19 expenses. • Core non-interest expense excludes branch consolidation, merger related expenses, and FHLB prepayment penalty. • Announced the consolidation of 4 additional branches to be closed in early April. Pro- forma average branch size is anticipated to be in the range of $160 million. • The increase in core non-interest expense of $252,000 from the linked quarter was primarily driven by the following: (i) an increase in other operating expense of $788,000, (ii) an increase in FDIC expense of $648,000; partially offset by (iii) a decrease in compensation and benefit expense of $1.1 million. 56.73% 55.36% 56.69% 59.63% 59.69% 2.05% 2.01% 1.85% 1.81% 1.80% Q4-19 Q1-20 Q2-20 Q3-20 Q4-20 Core Efficiency Ratio Core Non-Interest Expense to Average Assets
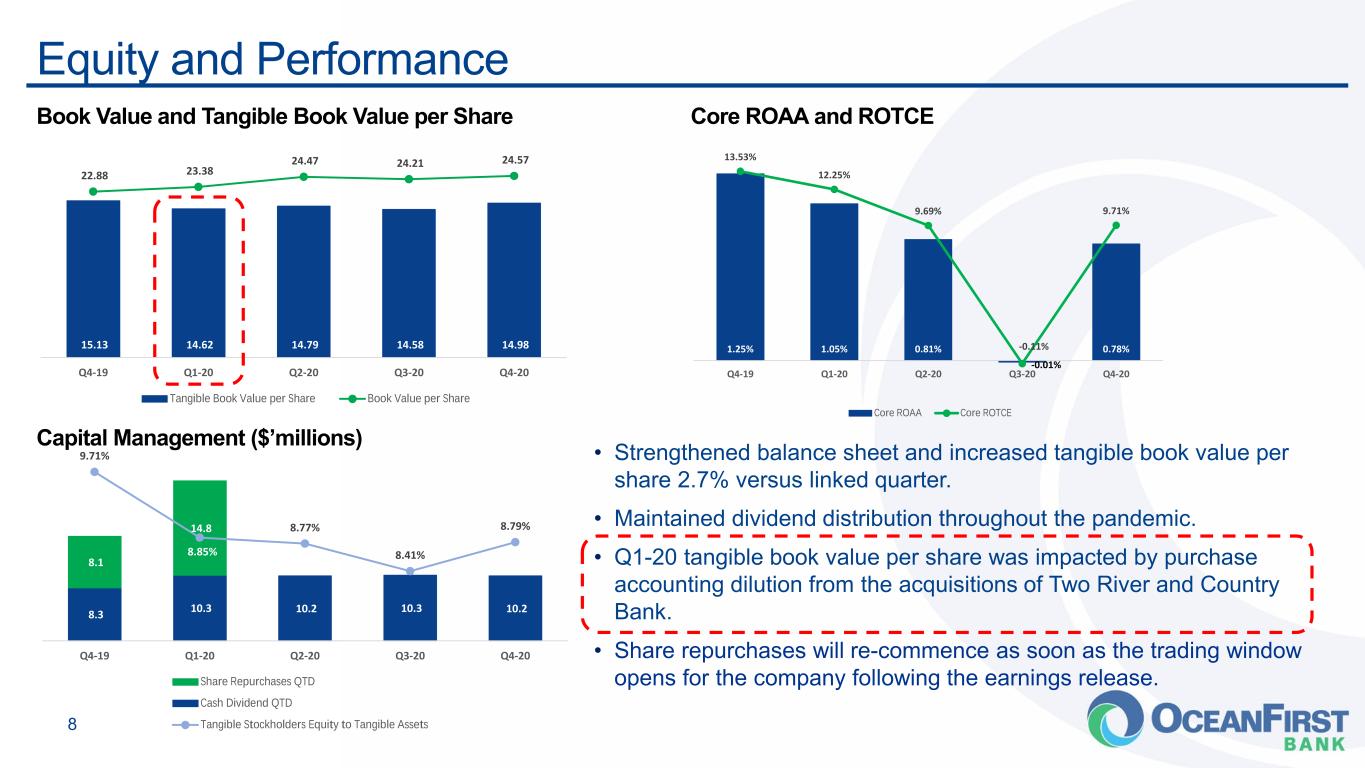
. . .Equity and Performance 8 15.13 14.62 14.79 14.58 14.98 22.88 23.38 24.47 24.21 24.57 Q4-19 Q1-20 Q2-20 Q3-20 Q4-20 Tangible Book Value per Share Book Value per Share Book Value and Tangible Book Value per Share 1.25% 1.05% 0.81% -0.01% 0.78% 13.53% 12.25% 9.69% -0.11% 9.71% Q4-19 Q1-20 Q2-20 Q3-20 Q4-20 Core ROAA Core ROTCE Core ROAA and ROTCE • Strengthened balance sheet and increased tangible book value per share 2.7% versus linked quarter. • Maintained dividend distribution throughout the pandemic. • Q1-20 tangible book value per share was impacted by purchase accounting dilution from the acquisitions of Two River and Country Bank. • Share repurchases will re-commence as soon as the trading window opens for the company following the earnings release. 8.3 10.3 10.2 10.3 10.2 8.1 14.8 9.71% 8.85% 8.77% 8.41% 8.79% Q4-19 Q1-20 Q2-20 Q3-20 Q4-20 Share Repurchases QTD Cash Dividend QTD Tangible Stockholders Equity to Tangible Assets Capital Management ($’millions)
. . . Appendix
. . .Quarterly Non-GAAP / Adjusted to GAAP Disclosure Reported amounts are presented in accordance with generally accepted accounting principles in the United States (“GAAP”). The Company’s management believes that the supplemental Non-GAAP information, which consists of reported net income excluding non-core operations, which can vary from period to period, provides a better comparison of period to period operating performance. Additionally, the Company believes this information is utilized by regulators and market analysts to evaluate a company’s financial condition and therefore, such information is useful to investors. These disclosures should not be viewed as a substitute for financial results in accordance with GAAP, nor are they necessarily comparable to Non-GAAP performance measures which may be presented by other companies. 10
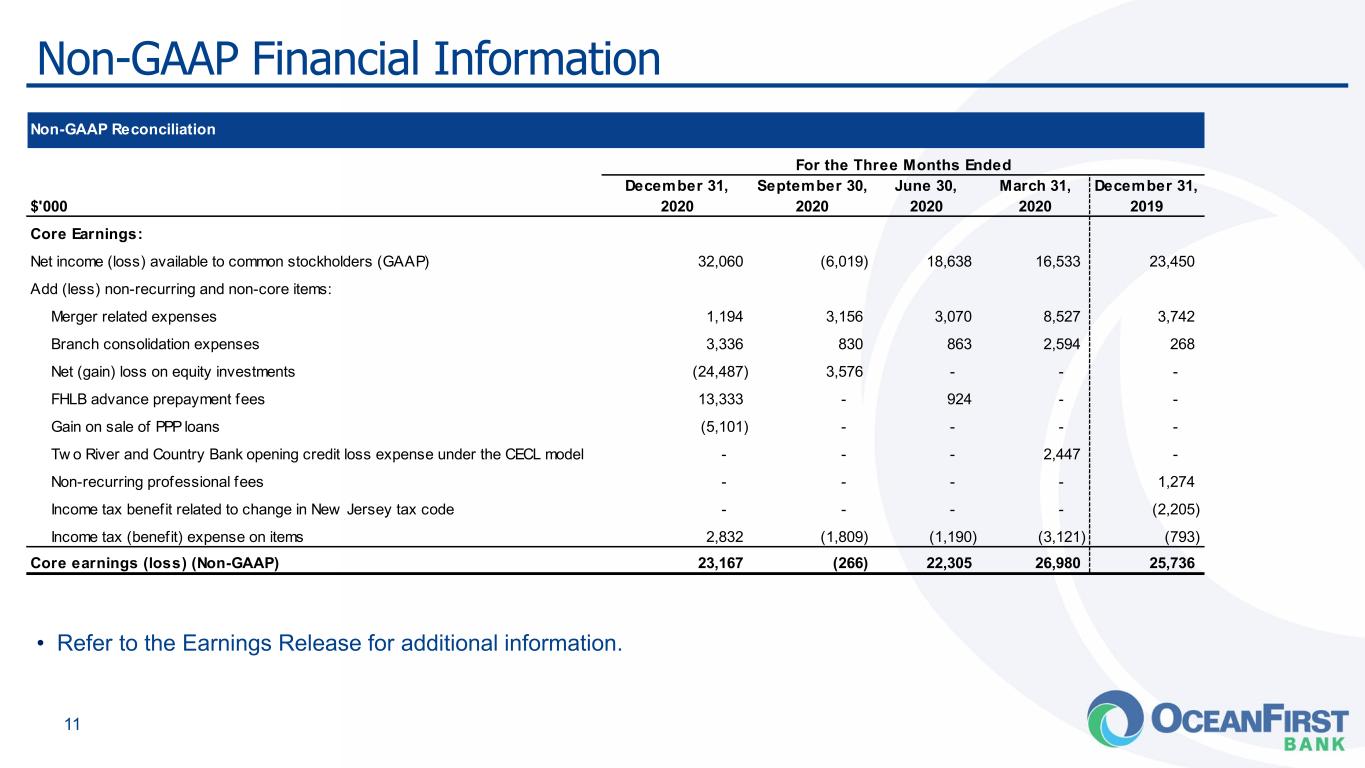
. . .Non-GAAP Financial Information 11 • Refer to the Earnings Release for additional information. Non-GAAP Reconciliation For the Three Months Ended $'000 December 31, 2020 September 30, 2020 June 30, 2020 March 31, 2020 December 31, 2019 Core Earnings: Net income (loss) available to common stockholders (GAAP) 32,060 (6,019) 18,638 16,533 23,450 Add (less) non-recurring and non-core items: Merger related expenses 1,194 3,156 3,070 8,527 3,742 Branch consolidation expenses 3,336 830 863 2,594 268 Net (gain) loss on equity investments (24,487) 3,576 - - - FHLB advance prepayment fees 13,333 - 924 - - Gain on sale of PPP loans (5,101) - - - - Tw o River and Country Bank opening credit loss expense under the CECL model - - - 2,447 - Non-recurring professional fees - - - - 1,274 Income tax benefit related to change in New Jersey tax code - - - - (2,205) Income tax (benefit) expense on items 2,832 (1,809) (1,190) (3,121) (793) Core earnings (loss) (Non-GAAP) 23,167 (266) 22,305 26,980 25,736
