Attached files
| file | filename |
|---|---|
| EX-99.1 - EX-99.1 - SOUTH STATE Corp | ssb-20210127xex99d1.htm |
| 8-K - 8-K - SOUTH STATE Corp | ssb-20210127x8k.htm |
| Exhibit 99.2 Earnings Call Thursday, January 28, 2021 4Q 2020 |
| DISCL A IME R Statements included in this communication, which are not historical in nature are intended to be, and are hereby identified as, forward-looking statements for purposes of the safe harbor provided by Section 27A of the Securities Act of 1933 and Section 21E of the Securities Exchange Act of 1934. Forward-looking statements are based on, among other things, management’s beliefs, assumptions, current expectations, estimates and projections about the financial services industry, the economy and SouthState. Words and phrases such as “may,” “approximately,” “continue,” “should,” “expects,” “projects,” “anticipates,” “is likely,” “look ahead,” “look forward,” “believes,” “will,” “intends,” “estimates,” “strategy,” “plan,” “could,” “potential,” “possible” and variations of such words and similar expressions are intended to identify such forward-looking statements. SouthState cautions readers that forward-looking statements are subject to certain risks, uncertainties and assumptions that are difficult to predict with regard to, among other things, timing, extent, likelihood and degree of occurrence, which could cause actual results to differ materially from anticipated results. Such risks, uncertainties and assumptions, include, among others, the following: (1) economic downturn risk, potentially resulting in deterioration in the credit markets, greater than expected noninterest expenses, excessive loan losses and other negative consequences, which risks could be exacerbated by potential negative economic developments resulting from the Covid19 pandemic, or from federal spending cuts and/or one or more federal budget-related impasses or actions; (2) interest rate risk primarily resulting from the low interest rate environment and historically low yield curve primarily due to government programs in place under the CARES Act and otherwise in response to the Covid19 pandemic, and their impact on the Bank’s earnings, including from the correspondent and mortgage divisions, housing demand, the market value of the bank’s loan and securities portfolios, and the market value of SouthState’s equity; (3) risks related to the merger and integration of SouthState and CSFL including, among others, (i) the risk that the cost savings and any revenue synergies from the merger may not be fully realized or may take longer than anticipated to be realized, (ii) the risk that the integration of each party’s operations will be materially delayed or will be more costly or difficult than expected or that the parties are otherwise unable to successfully integrate each party’s businesses into the other’s businesses, (iii) the amount of the costs, fees, expenses and charges related to the merger, (iv) reputational risk and the reaction of each company's customers, suppliers, employees or other business partners to the merger, (4) the impact of increasing digitization of the banking industry and movement of customers to on-line platforms, and the possible impact on the Bank’s results of operations, customer base, expenses, suppliers and operations, (5) controls and procedures risk, including the potential failure or circumvention of our controls and procedures or failure to comply with regulations related to controls and procedures; (6) potential deterioration in real estate values; (7) the impact of competition with other financial institutions, including pricing pressures (including those resulting from the CARES Act) and the resulting impact, including as a result of compression to net interest margin; (8) credit risks associated with an obligor’s failure to meet the terms of any contract with the bank or otherwise fail to perform as agreed under the terms of any loan-related document; (9) liquidity risk affecting the Bank’s ability to meet its obligations when they come due; (10) risks associated with an anticipated increase in SouthState’s investment securities portfolio, including risks associated with acquiring and holding investment securities or potentially determining that the amount of investment securities SouthState desires to acquire are not available on terms acceptable to SouthState; (11) price risk focusing on changes in market factors that may affect the value of traded instruments in “mark-to-market” portfolios; (12) transaction risk arising from problems with service or product delivery; (13) compliance risk involving risk to earnings or capital resulting from violations of or nonconformance with laws, rules, regulations, prescribed practices, or ethical standards; (14) regulatory change risk resulting from new laws, rules, regulations, accounting principles, proscribed practices or ethical standards, including, without limitation, the possibility that regulatory agencies may require higher levels of capital above the current regulatory-mandated minimums and including the impact of the recently enacted CARES Act, the Consumer Financial Protection Bureau rules and regulations, and the possibility of changes in accounting standards, policies, principles and practices, including changes in accounting principles relating to loan loss recognition (CECL); (15) strategic risk resulting from adverse business decisions or improper implementation of business decisions; (16) reputation risk that adversely affects earnings or capital arising from negative public opinion; (17) terrorist activities risk that results in loss of consumer confidence and economic disruptions; (18) cybersecurity risk related to the dependence of SouthState on internal computer systems and the technology of outside service providers, as well as the potential impacts of internal or external security breaches, which may subject the company to potential business disruptions or financial losses resulting from deliberate attacks or unintentional events; (19) greater than expected noninterest expenses; (20) excessive loan losses; (21) potential deposit attrition, higher than expected costs, customer loss and business disruption associated with the CSFL integration, and potential difficulties in maintaining relationships with key personnel; (22) the risks of fluctuations in market prices for SouthState common stock that may or may not reflect economic condition or performance of SouthState; (23) the payment of dividends on SouthState common stock, which is subject to legal and regulatory limitations as well as the discretion of the board of directors of SouthState, SouthState’s performance and other factors; (24) ownership dilution risk associated with potential acquisitions in which SouthState’s stock may be issued as consideration for an acquired company; (25) operational, technological, cultural, regulatory, legal, credit and other risks associated with the exploration, consummation and integration of potential future acquisition, whether involving stock or cash consideration; (26) major catastrophes such as hurricanes, tornados, earthquakes, floods or other natural or human disasters, including infectious disease outbreaks, including the recent outbreak of the COVID-19 coronavirus, and the related disruption to local, regional and global economic activity and financial markets, and the impact that any of the foregoing may have on SouthState and its customers and other constituencies; and (27) other factors that may affect future results of SouthState and CenterState, as disclosed in SouthState’s Annual Report on Form 10-K, as amended, Quarterly Reports on Form 10-Q, and Current Reports on Form 8-K, and CenterState’s Annual Report on Form 10-K, Quarterly Reports on Form 10-Q, and Current Reports on Form 8-K, in each case filed by SouthState or CenterState, as applicable, with the U.S. Securities and Exchange Commission (“SEC”) and available on the SEC’s website at http://www.sec.gov, any of which could cause actual results to differ materially from future results expressed, implied or otherwise anticipated by such forward-looking statements. All forward-looking statements speak only as of the date they are made and are based on information available at that time. SouthState does not undertake any obligation to update or otherwise revise any forward-looking statements, whether as a result of new information, future events, or otherwise, except as required by federal securities laws. As forward-looking statements involve significant risks and uncertainties, caution should be exercised against placing undue reliance on such statements. 2 |
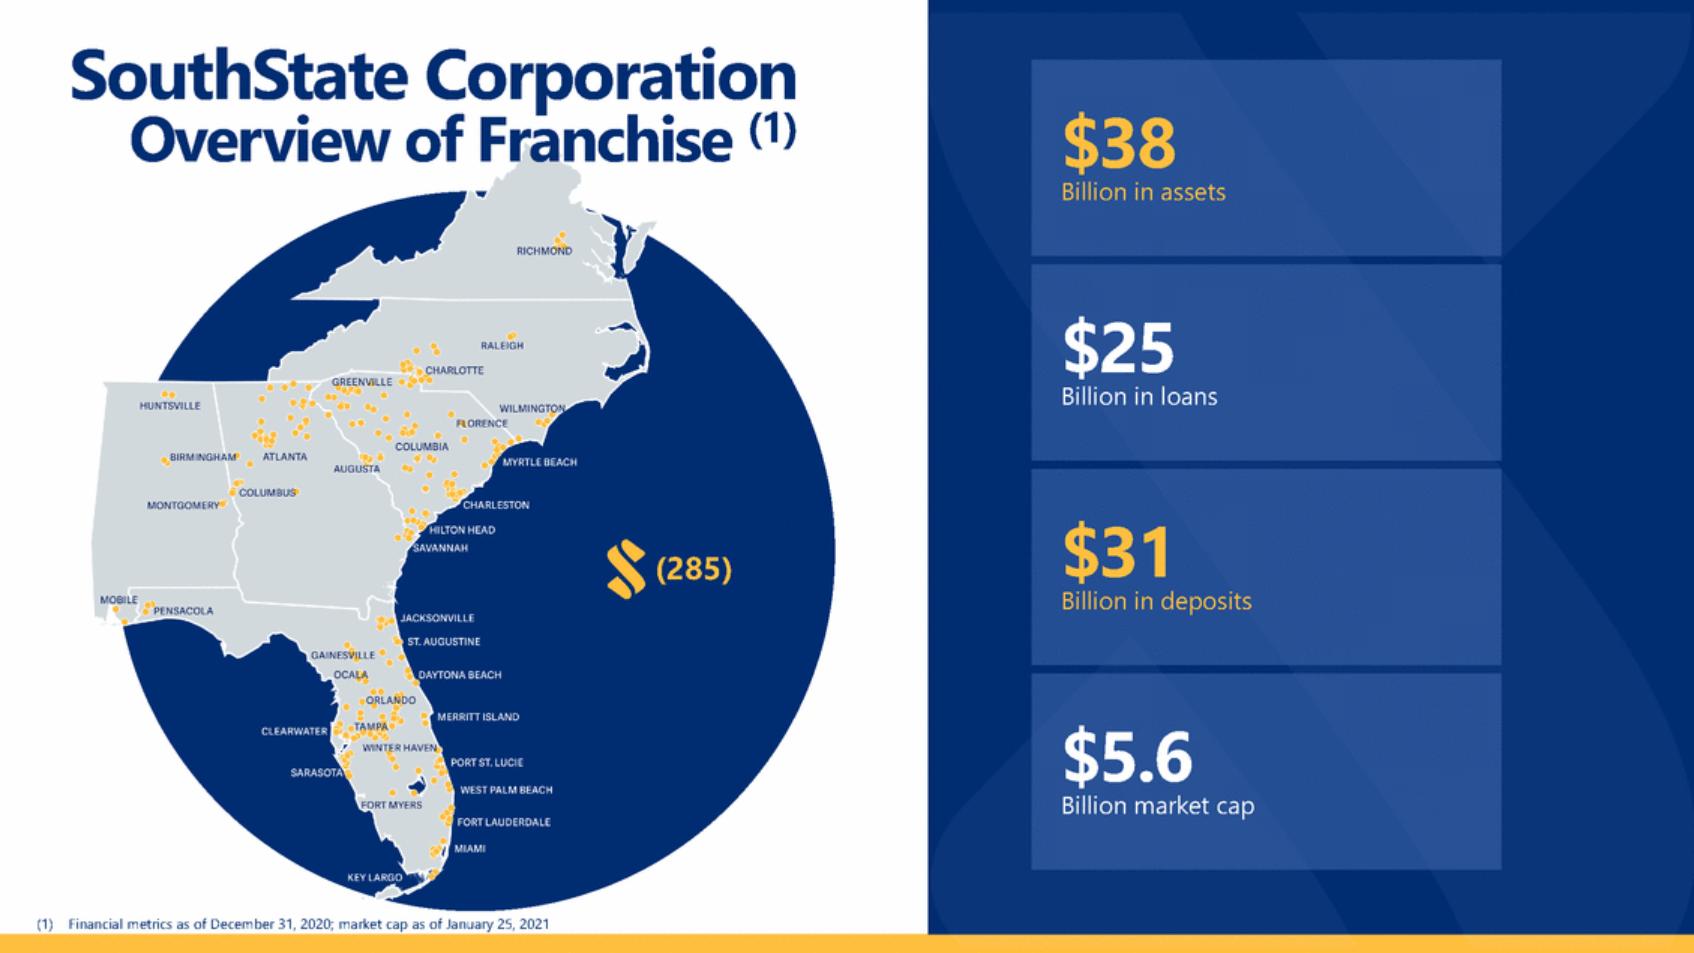
| SouthState Corporation (1) Overview of Franchise Billion in assets Billion in loans (285) Billion in deposits Billion market cap (1) Financial metrics as of December 31, 2020; market cap as of January 25, 2021 $5.6 $31 $25 $38 |
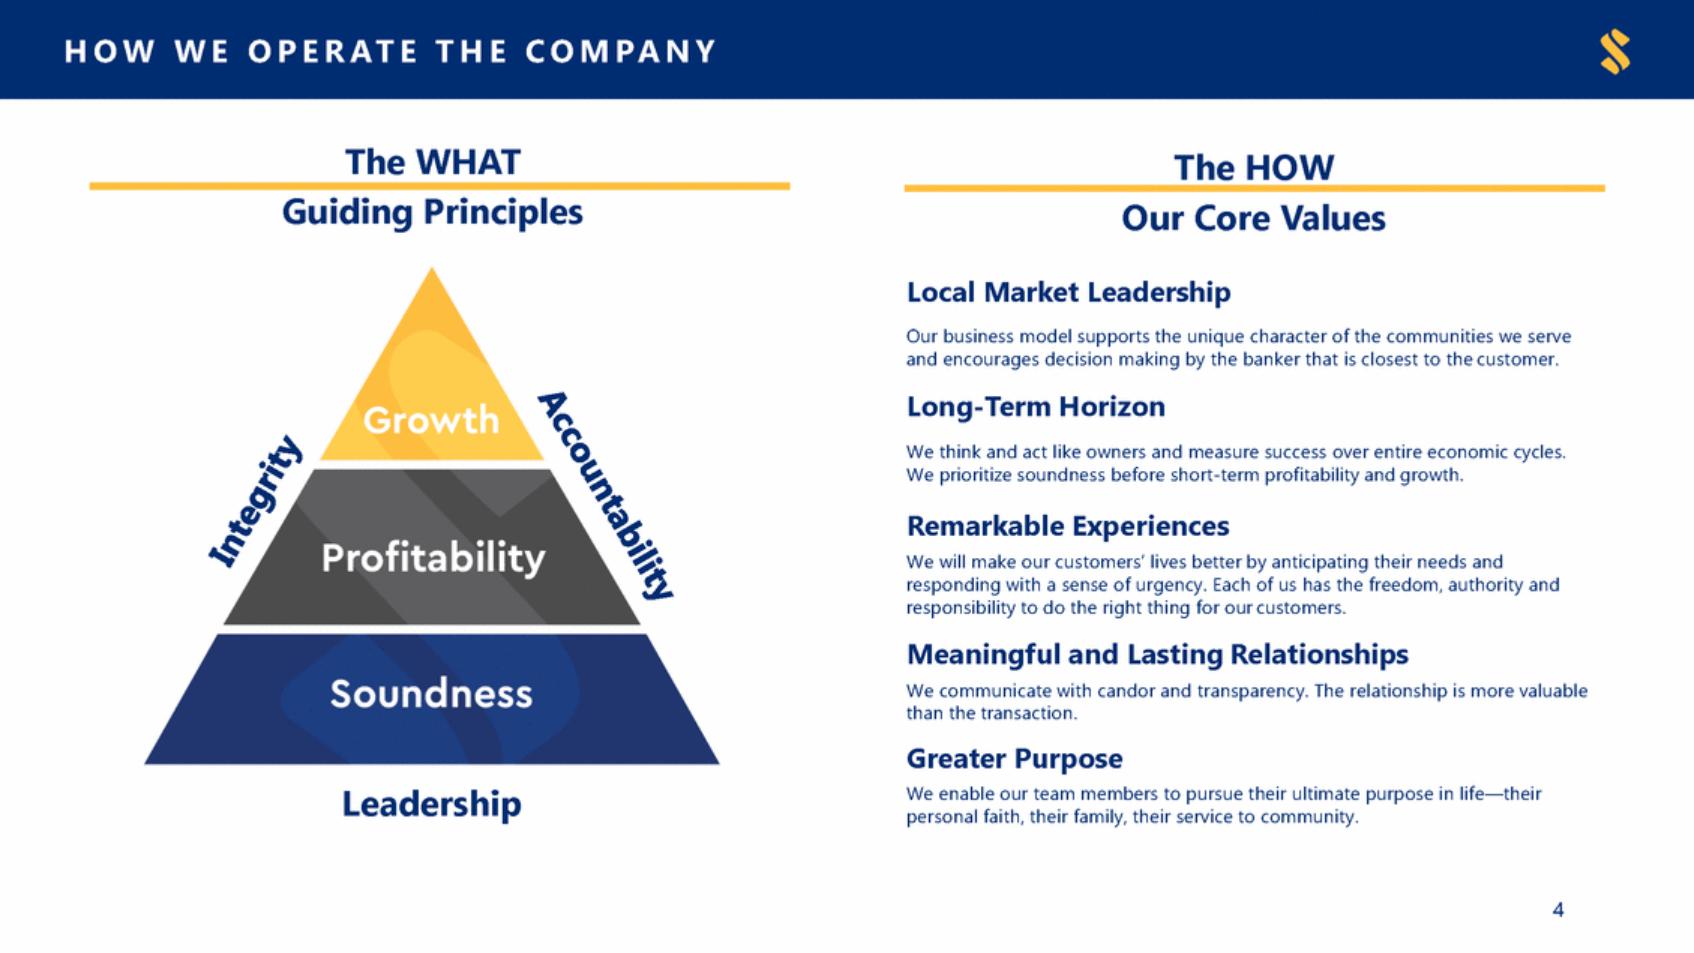
| HO W W E O P E R A TETHEC O M P ANY The WHAT The HOW Guiding Principles Our Core Values Local Market Leadership Our business model supports the unique character of the communities we serve and encourages decision making by the banker that is closest to the customer. Long-Term Horizon We think and act like owners and measure success over entire economic cycles. We prioritize soundness before short-term profitability and growth. Remarkable Experiences We will make our customers’ lives better by anticipating their needs and responding with a sense of urgency. Each of us has the freedom, authority and responsibility to do the right thing for our customers. Meaningful and Lasting Relationships We communicate with candor and transparency. The relationship is more valuable than the transaction. Greater Purpose We enable our team members to pursue their ultimate purpose in life—their personal faith, their family, their service to community. Leadership 4 |
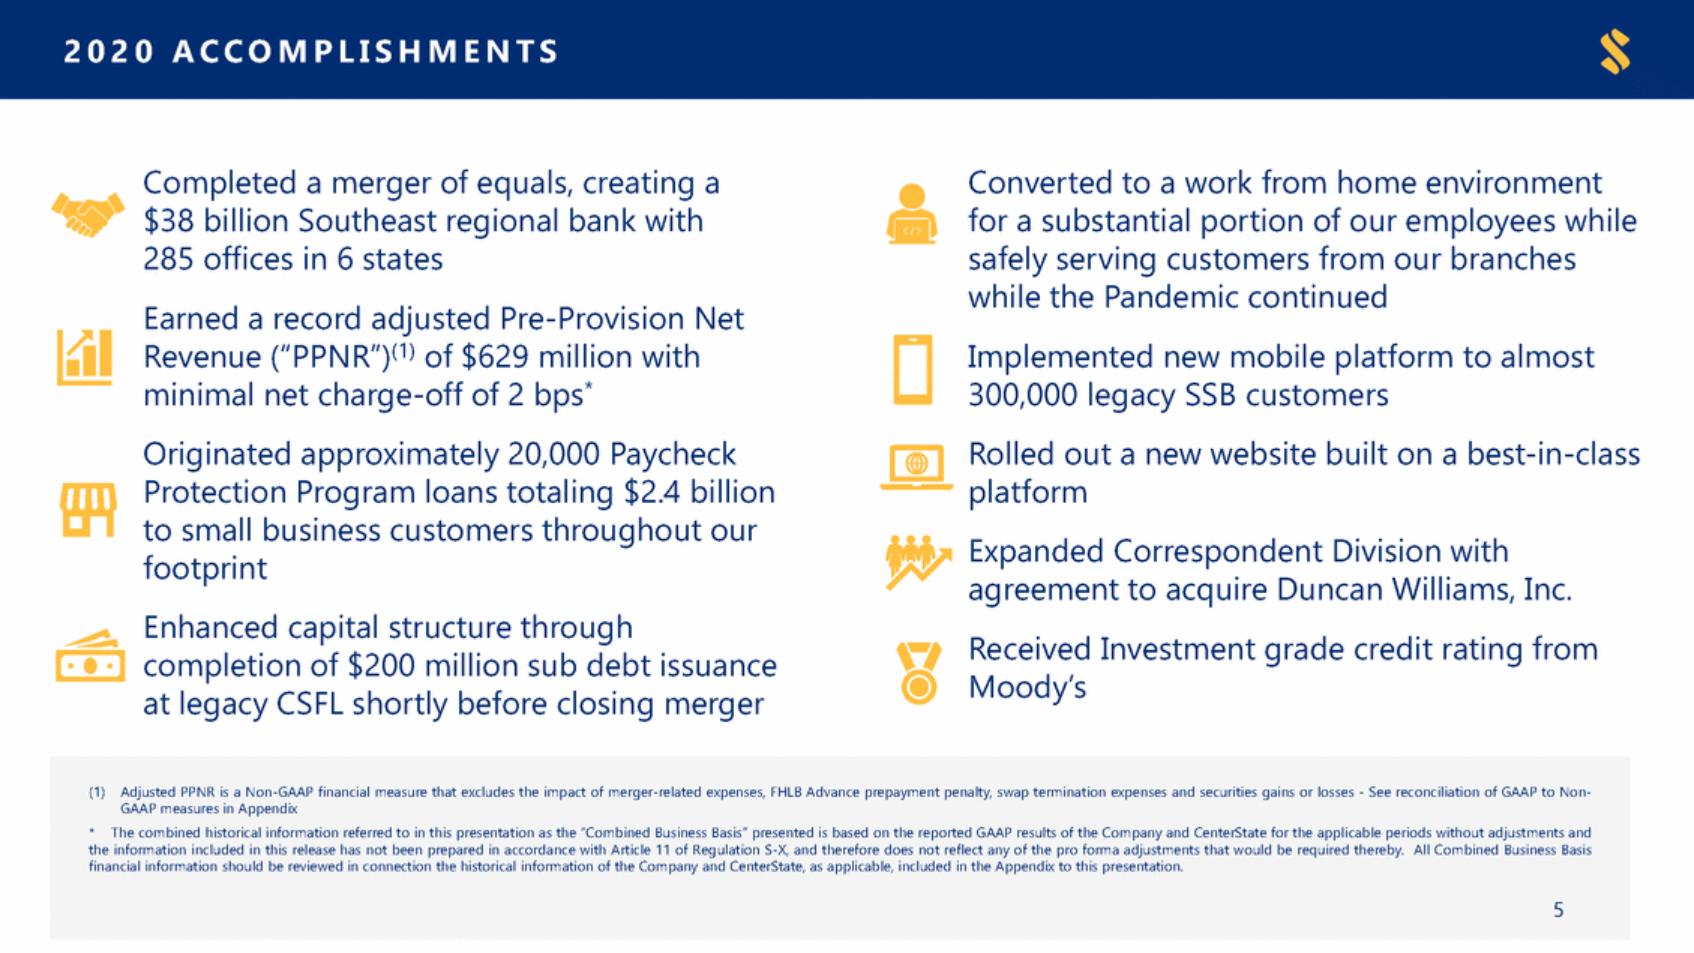
| 2 0 2 0A C C O MPLISH ME N T S Completed a merger of equals, creating a $38 billion Southeast regional bank with 285 offices in 6 states Earned a record adjusted Pre-Provision Net Revenue (“PPNR”)(1) of $629 million with minimal net charge-off of 2 bps* Originated approximately 20,000 Paycheck Protection Program loans totaling $2.4 billion to small business customers throughout our footprint Enhanced capital structure through completion of $200 million sub debt issuance at legacy CSFL shortly before closing merger Converted to a work from home environment for a substantial portion of our employees while safely serving customers from our branches while the Pandemic continued Implemented new mobile platform to almost 300,000 legacy SSB customers Rolled out a new website built on a best-in-class platform Expanded Correspondent Division with agreement to acquire Duncan Williams, Inc. Received Investment grade credit rating from Moody’s (1) Adjusted PPNR is a Non-GAAP financial measure that excludes the impact of merger-related expenses, FHLB Advance prepayment penalty, swap termination expenses and securities gains or losses - See reconciliation of GAAP to Non-GAAP measures in Appendix * The combined historical information referred to in this presentation as the “Combined Business Basis” presented is based on the reported GAAP results of the Company and CenterState for the applicable periods without adjustments and the information included in this release has not been prepared in accordance with Article 11 of Regulation S-X, and therefore does not reflect any of the pro forma adjustments that would be required thereby. All Combined Business Basis financial information should be reviewed in connection the historical information of the Company and CenterState, as applicable, included in the Appendix to this presentation. 5 |
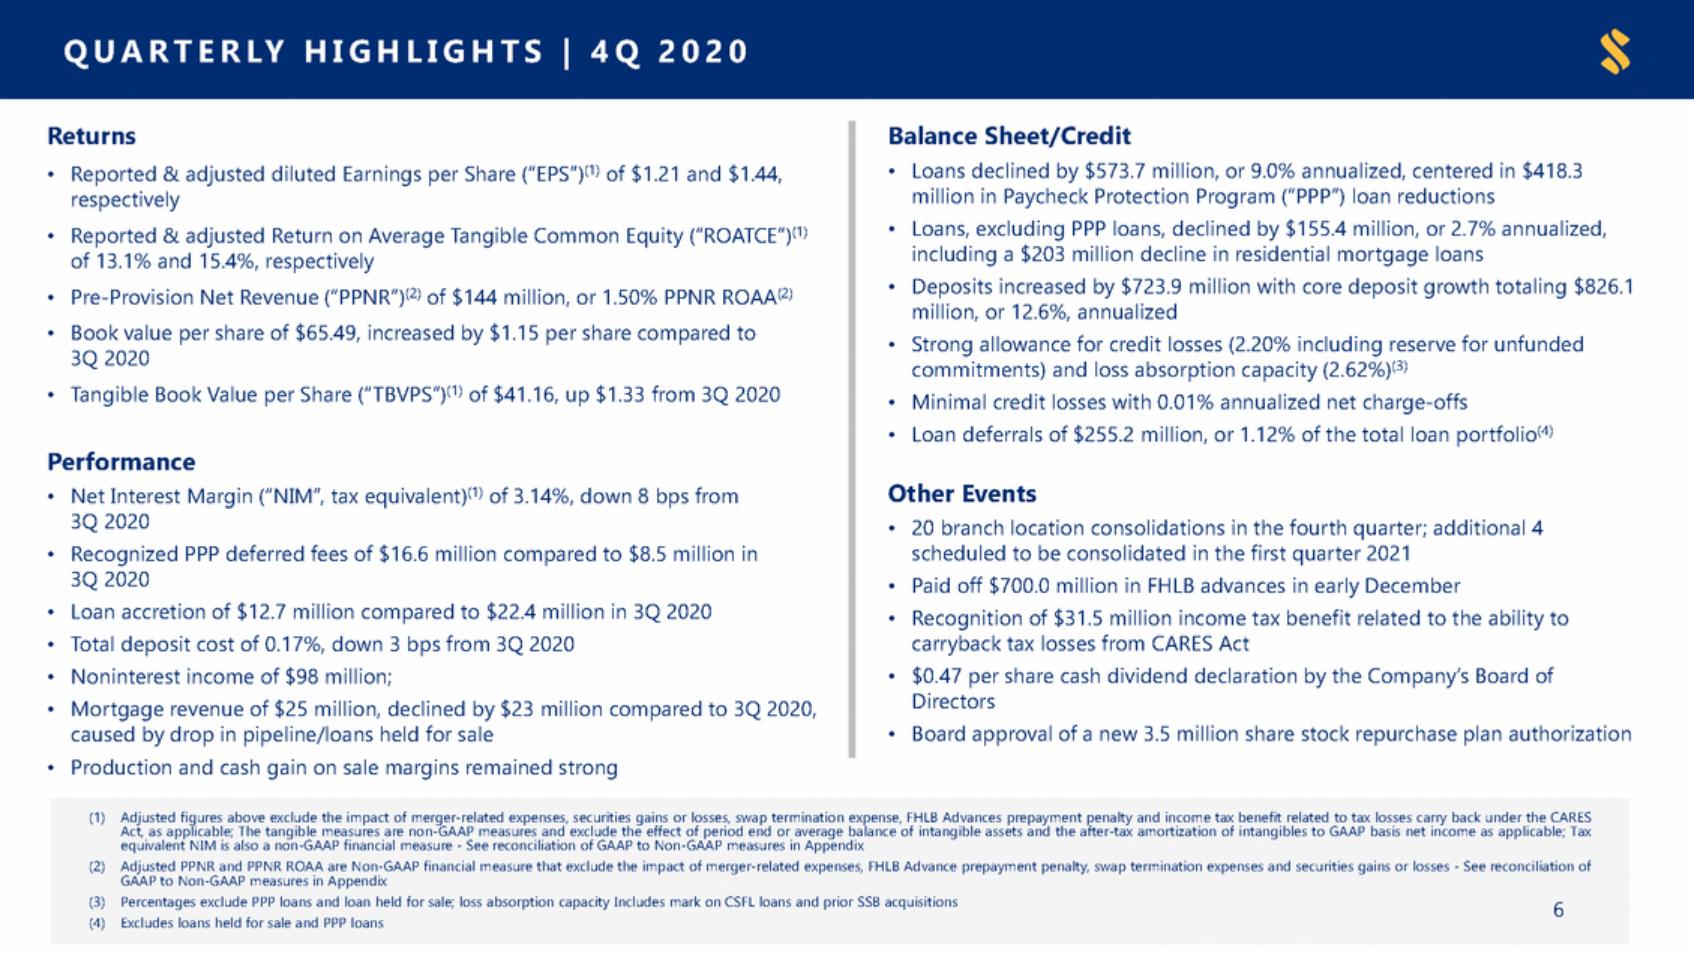
| Q U AR TE R L YHI G HL I G HTS|4 Q2 0 2 0 Returns • Reported & adjusted diluted Earnings per Share (“EPS”)(1) of $1.21 and $1.44, respectively • Reported & adjusted Return on Average Tangible Common Equity (“ROATCE”)(1) of 13.1% and 15.4%, respectively • Pre-Provision Net Revenue (“PPNR”)(2) of $144 million, or 1.50% PPNR ROAA(2) • Book value per share of $65.49, increased by $1.15 per share compared to 3Q 2020 • Tangible Book Value per Share (“TBVPS”)(1) of $41.16, up $1.33 from 3Q 2020 Balance Sheet/Credit • Loans declined by $573.7 million, or 9.0% annualized, centered in $418.3 million in Paycheck Protection Program (“PPP”) loan reductions Loans, excluding PPP loans, declined by $155.4 million, or 2.7% annualized, including a $203 million decline in residential mortgage loans Deposits increased by $723.9 million with core deposit growth totaling $826.1 million, or 12.6%, annualized Strong allowance for credit losses (2.20% including reserve for unfunded commitments) and loss absorption capacity (2.62%)(3) Minimal credit losses with 0.01% annualized net charge-offs Loan deferrals of $255.2 million, or 1.12% of the total loan portfolio(4) • • • • • Performance Other Events • Net Interest Margin (“NIM”, tax equivalent)(1) of 3.14%, down 8 bps from 3Q 2020 Recognized PPP deferred fees of $16.6 million compared to $8.5 million in 3Q 2020 Loan accretion of $12.7 million compared to $22.4 million in 3Q 2020 Total deposit cost of 0.17%, down 3 bps from 3Q 2020 Noninterest income of $98 million; Mortgage revenue of $25 million, declined by $23 million compared to 3Q 2020, caused by drop in pipeline/loans held for sale Production and cash gain on sale margins remained strong • 20 branch location consolidations in the fourth quarter; additional 4 scheduled to be consolidated in the first quarter 2021 Paid off $700.0 million in FHLB advances in early December Recognition of $31.5 million income tax benefit related to the ability to carryback tax losses from CARES Act $0.47 per share cash dividend declaration by the Company’s Board of Directors Board approval of a new 3.5 million share stock repurchase plan authorization • • • • • • • • • • Act, as applicable; The tangible measures are non-GAAP measures and exclude the effect of period end or average balance of intangible assets and the after-tax amortization of intangibles to GAAP basis net income as applicable; Tax GAAP to Non-GAAP measures in Appendix (4) Excludes loans held for sale and PPP loans (1) Adjusted figures above exclude the impact of merger-related expenses, securities gains or losses, swap termination expense, FHLB Advances prepayment penalty and income tax benefit related to tax losses carry back under the CARES equivalent NIM is also a non-GAAP financial measure - See reconciliation of GAAP to Non-GAAP measures in Appendix (2) Adjusted PPNR and PPNR ROAA are Non-GAAP financial measure that exclude the impact of merger-related expenses, FHLB Advance prepayment penalty, swap termination expenses and securities gains or losses - See reconciliation of (3) Percentages exclude PPP loans and loan held for sale; loss absorption capacity Includes mark on CSFL loans and prior SSB acquisitions6 |
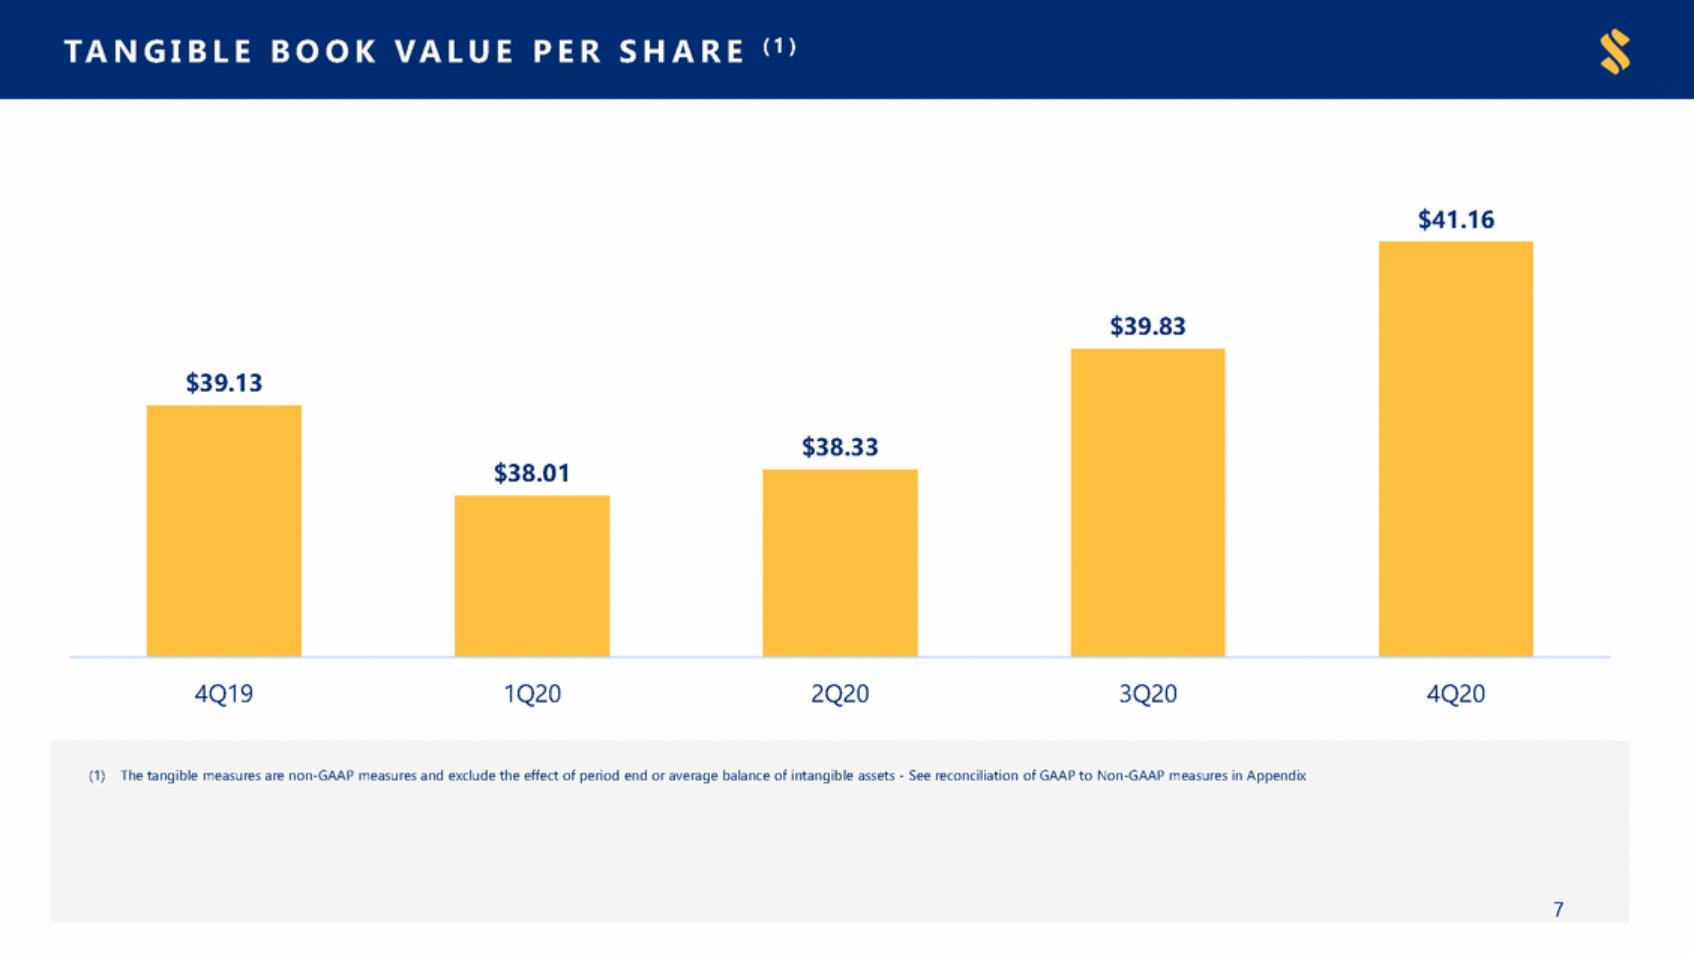
| ( 1) T ANG I B L E B O O K V AL UE P E R S HARE $41.16 $38.01 4Q19 1Q20 2Q20 3Q20 4Q20 (1) The tangible measures are non-GAAP measures and exclude the effect of period end or average balance of intangible assets - See reconciliation of GAAP to Non-GAAP measures in Appendix 7 $39.83 $39.13 $38.33 |
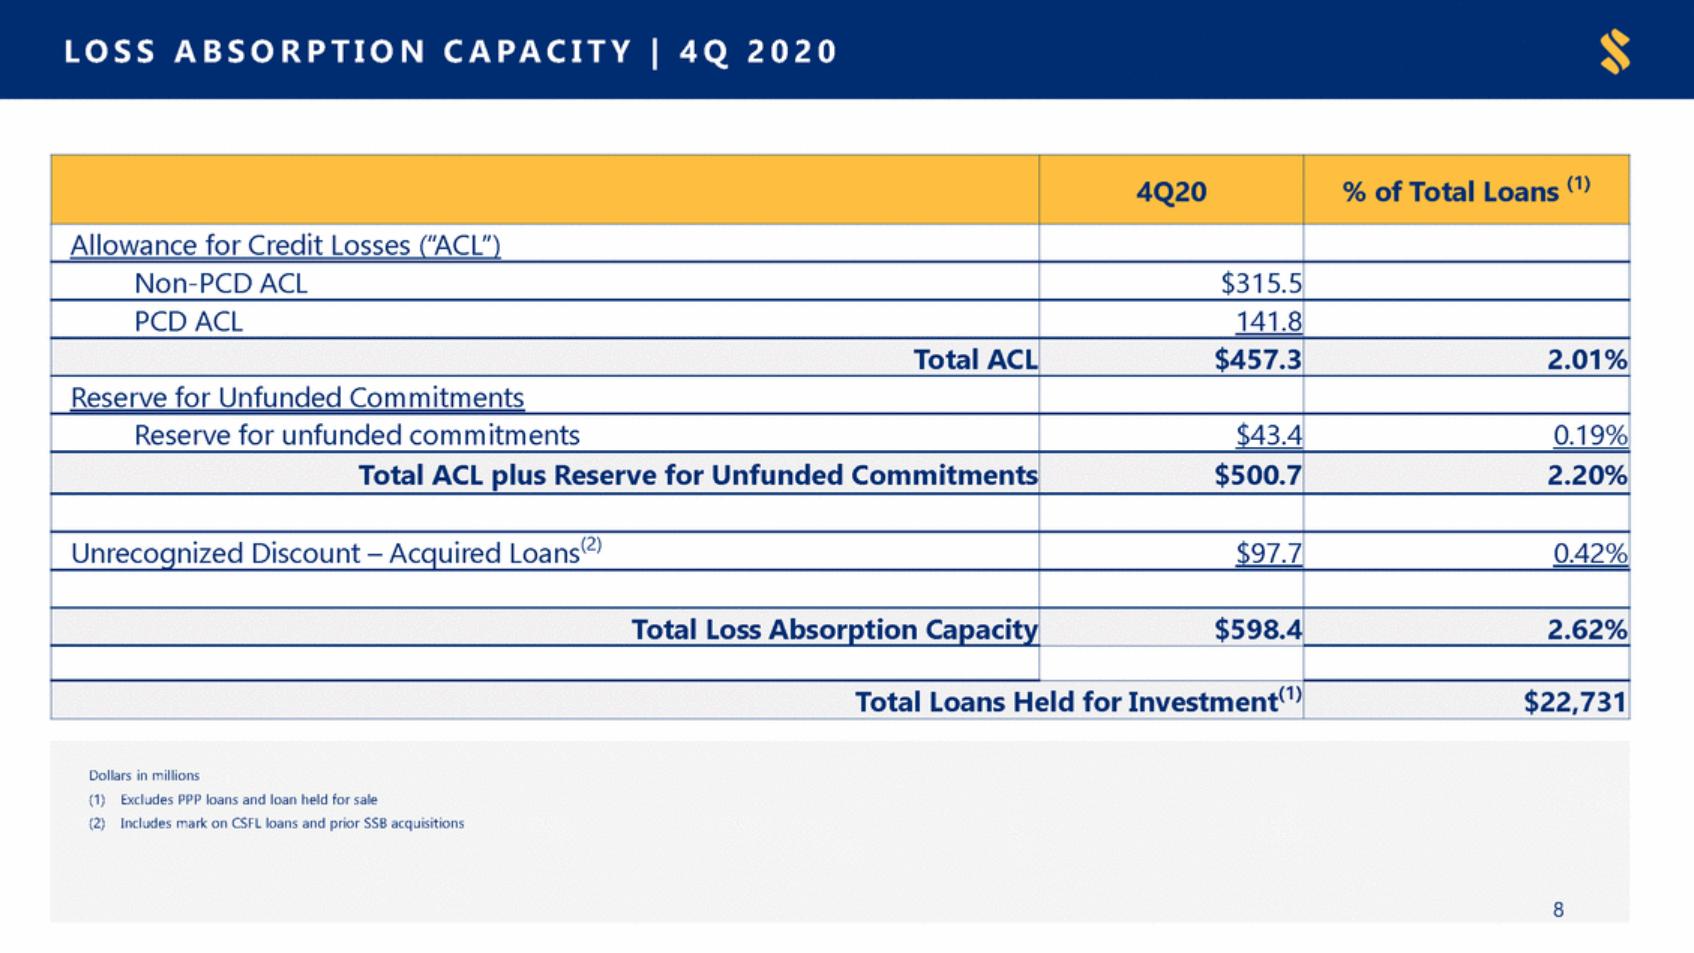
| L O SSA BSO R PT IO NCA P A CIT Y|4 Q2 0 2 0 Dollars in millions (1) Excludes PPP loans and loan held for sale (2) Includes mark on CSFL loans and prior SSB acquisitions 8 4Q20 % of Total Loans (1) Allowance for Credit Losses (“ACL”) Non-PCD ACL $315.5 PCD ACL 141.8 Total ACL $457.3 2.01% Reserve for Unfunded Commitments Reserve for unfunded commitments $43.4 0.19% Total ACL plus Reserve for Unfunded Commitments $500.7 2.20% Unrecognized Discount – Acquired Loans(2) $97.7 0.42% Total Loss Absorption Capacity $598.4 2.62% Total Loans Held for Investment(1) $22,731 |
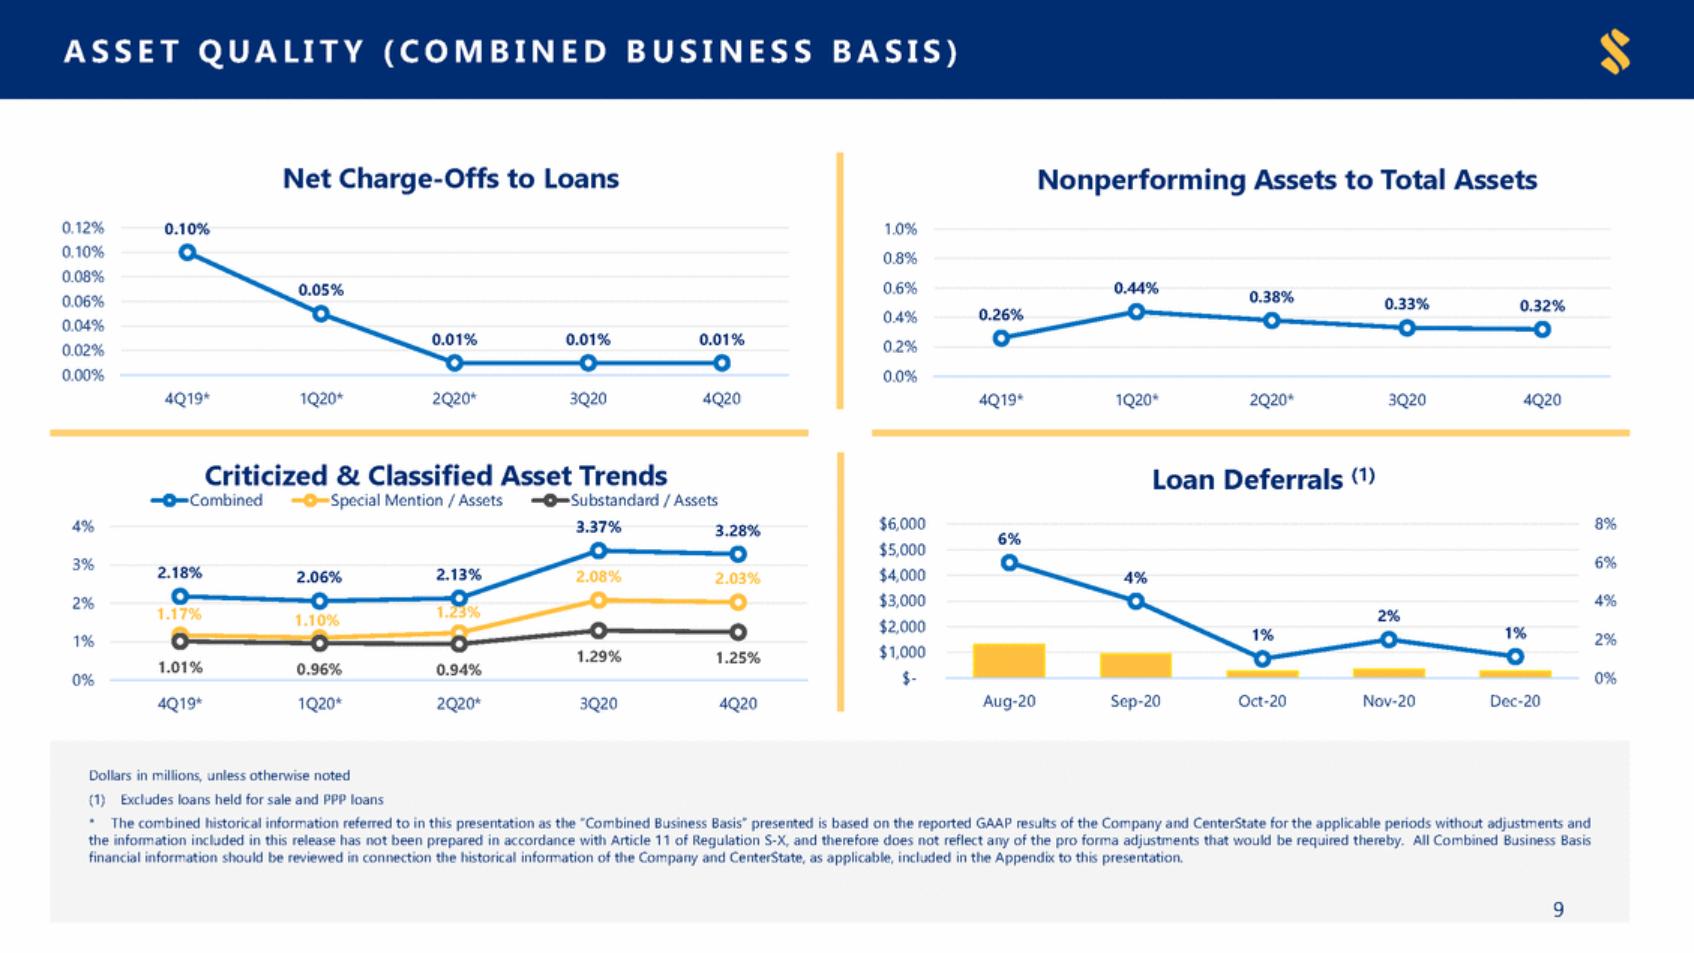
| A SSE TQ U A LIT Y( C O MBIN E DBU SIN E SS BA SIS) Net Charge-Offs to Loans 0.10% Nonperforming Assets to Total Assets 0.12% 0.10% 0.08% 0.06% 0.04% 0.02% 0.00% 1.0% 0.8% 0.6% 0.4% 0.2% 0.0% 0.44% 0.38% 0.26% 0.05% 0.33% 0.32% 0.01% 0.01% 0.01% 4Q19* 1Q20* 2Q20* 3Q20 4Q20 4Q19* 1Q20* 2Q20* 3Q20 4Q20 Criticized & Classified Asset Trends Loan Deferrals (1) Combined Special Mention / Assets Substandard / Assets $6,000 $5,000 $4,000 $3,000 $2,000 $1,000 $-8% 4% 3.37% 3.28% 6% 6% 3% 2.18% 2.13% 2.06% 2.08% 4% 2.03% 4% 2% 1.23% 1.17% 2% 1.10% 1% 1% 2% 1% 1.29% 1.25% 1.01% 0.96% 0.94% 0% 0% Aug-20 Sep-20 Oct-20 Nov-20 Dec-20 4Q19* 1Q20* 2Q20* 3Q20 4Q20 Dollars in millions, unless otherwise noted (1) Excludes loans held for sale and PPP loans * The combined historical information referred to in this presentation as the “Combined Business Basis” presented is based on the reported GAAP results of the Company and CenterState for the applicable periods without adjustments and the information included in this release has not been prepared in accordance with Article 11 of Regulation S-X, and therefore does not reflect any of the pro forma adjustments that would be required thereby. All Combined Business Basis financial information should be reviewed in connection the historical information of the Company and CenterState, as applicable, included in the Appendix to this presentation. 9 |
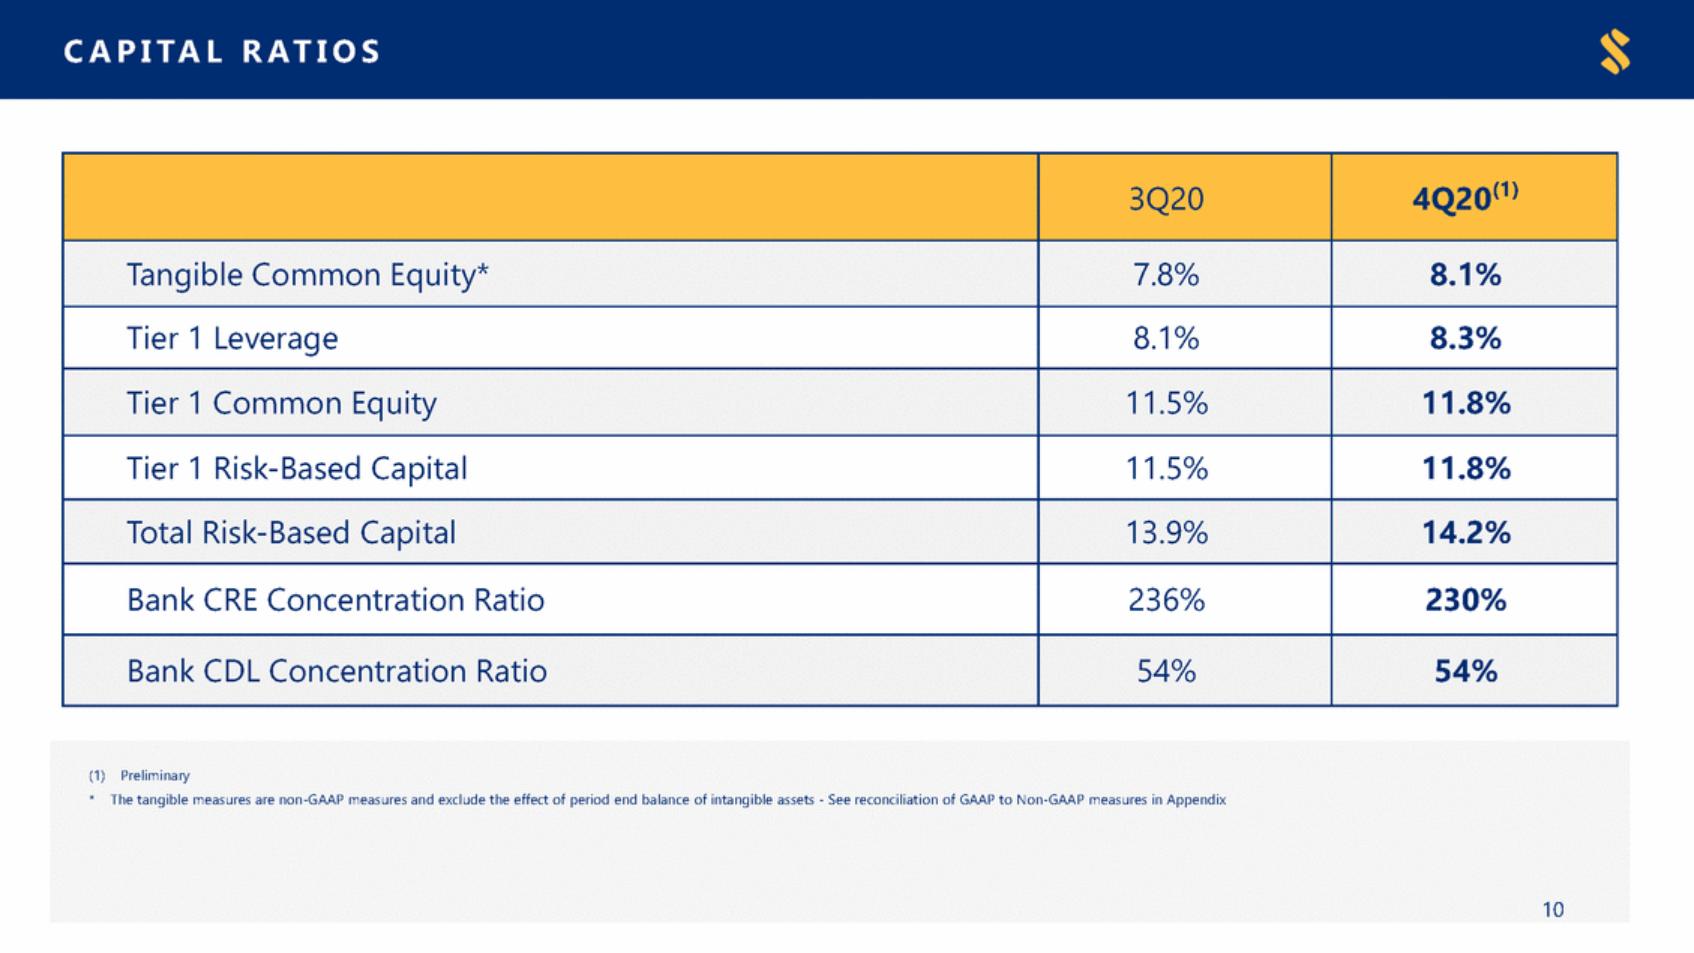
| CA PI T A LR A T IO S (1) Preliminary * The tangible measures are non-GAAP measures and exclude the effect of period end balance of intangible assets - See reconciliation of GAAP to Non-GAAP measures in Appendix 10 3Q20 4Q20(1) Tangible Common Equity* 7.8% 8.1% Tier 1 Leverage 8.1% 8.3% Tier 1 Common Equity 11.5% 11.8% Tier 1 Risk-Based Capital 11.5% 11.8% Total Risk-Based Capital 13.9% 14.2% Bank CRE Concentration Ratio 236% 230% Bank CDL Concentration Ratio 54% 54% |
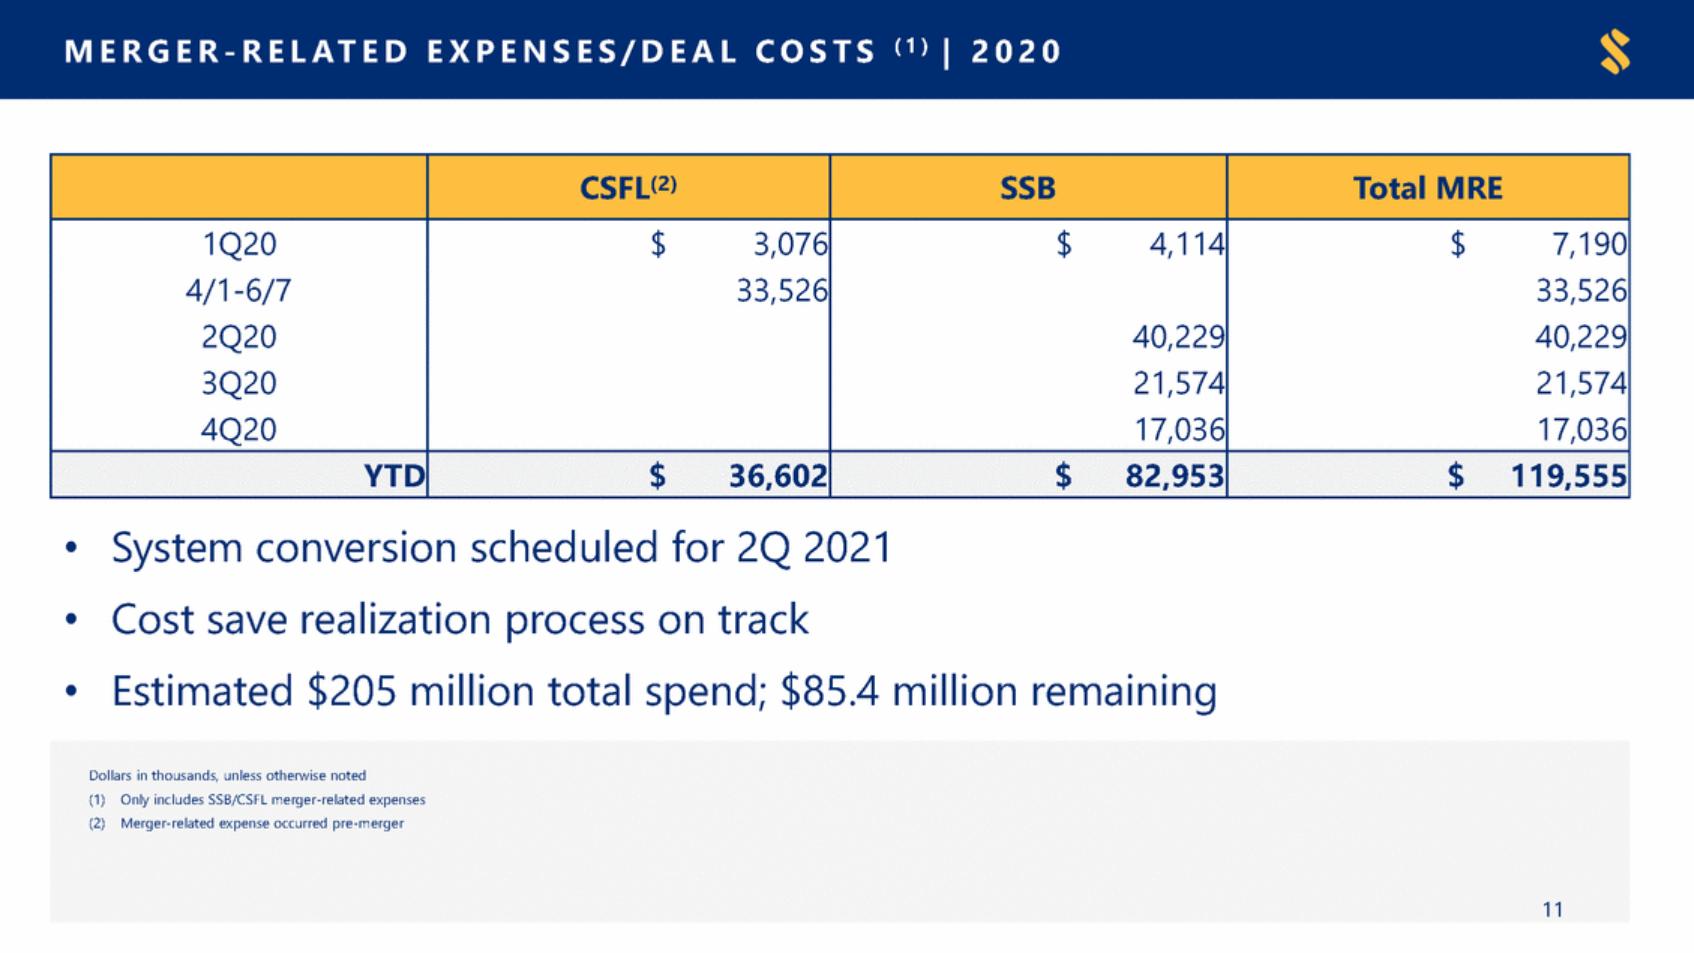
| (1 ) ME R GE R - R E L A T E D E X PE N SE S/ DE A L C O ST S | 2020 • • • System conversion scheduled for 2Q 2021 Cost save realization process on track Estimated $205 million total spend; $85.4 million remaining Dollars in thousands, unless otherwise noted (1) Only includes SSB/CSFL merger-related expenses (2) Merger-related expense occurred pre-merger 11 CSFL(2) SSB Total MRE 1Q20 4/1-6/7 2Q20 3Q20 4Q20 $3,076 33,526 $4,114 40,229 21,574 17,036 $7,190 33,526 40,229 21,574 17,036 YTD $36,602 $82,953 $119,555 |
| Financial Highlights - Reported |

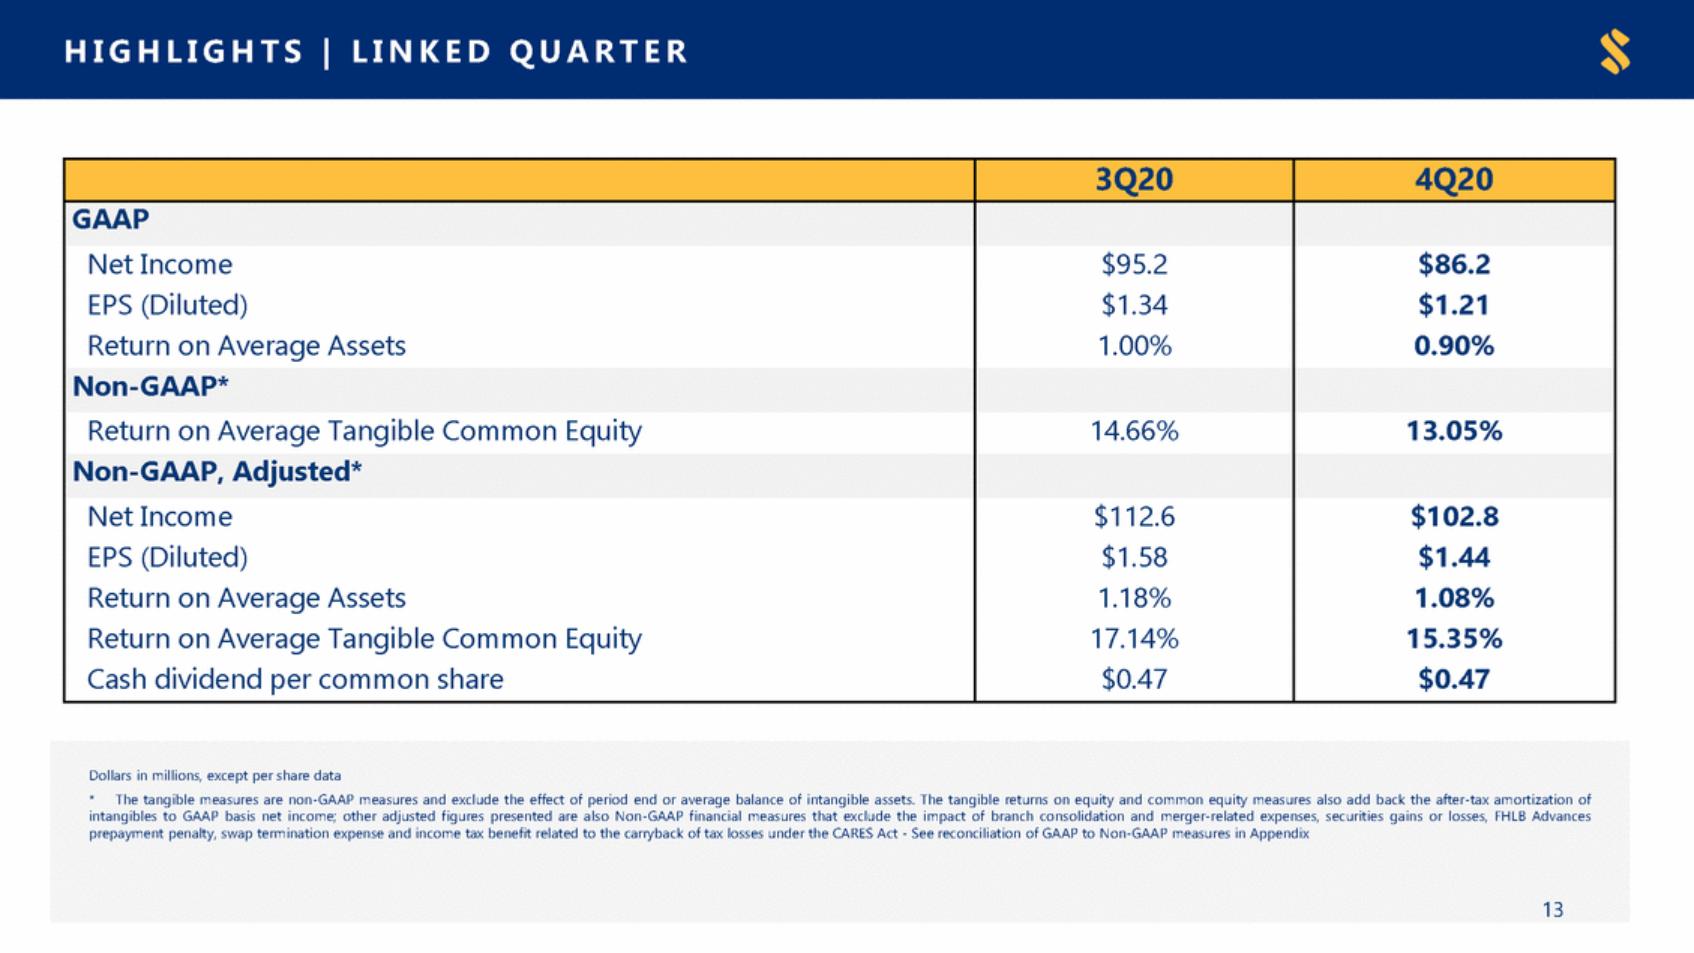
| HI G HL I G HTS|L I NK E DQ U AR TE R Dollars in millions, except per share data * The tangible measures are non-GAAP measures and exclude the effect of period end or average balance of intangible assets. The tangible returns on equity and common equity measures also add back the after-tax amortization of intangibles to GAAP basis net income; other adjusted figures presented are also Non-GAAP financial measures that exclude the impact of branch consolidation and merger-related expenses, securities gains or losses, FHLB Advances prepayment penalty, swap termination expense and income tax benefit related to the carryback of tax losses under the CARES Act - See reconciliation of GAAP to Non-GAAP measures in Appendix 13 3Q20 4Q20 GAAP Net Income EPS (Diluted) Return on Average Assets $95.2 $1.34 1.00% $86.2 $1.21 0.90% Non-GAAP* Return on Average Tangible Common Equity 14.66% 13.05% Non-GAAP, Adjusted* Net Income EPS (Diluted) Return on Average Assets Return on Average Tangible Common Equity Cash dividend per common share $112.6 $1.58 1.18% 17.14% $0.47 $102.8 $1.44 1.08% 15.35% $0.47 |
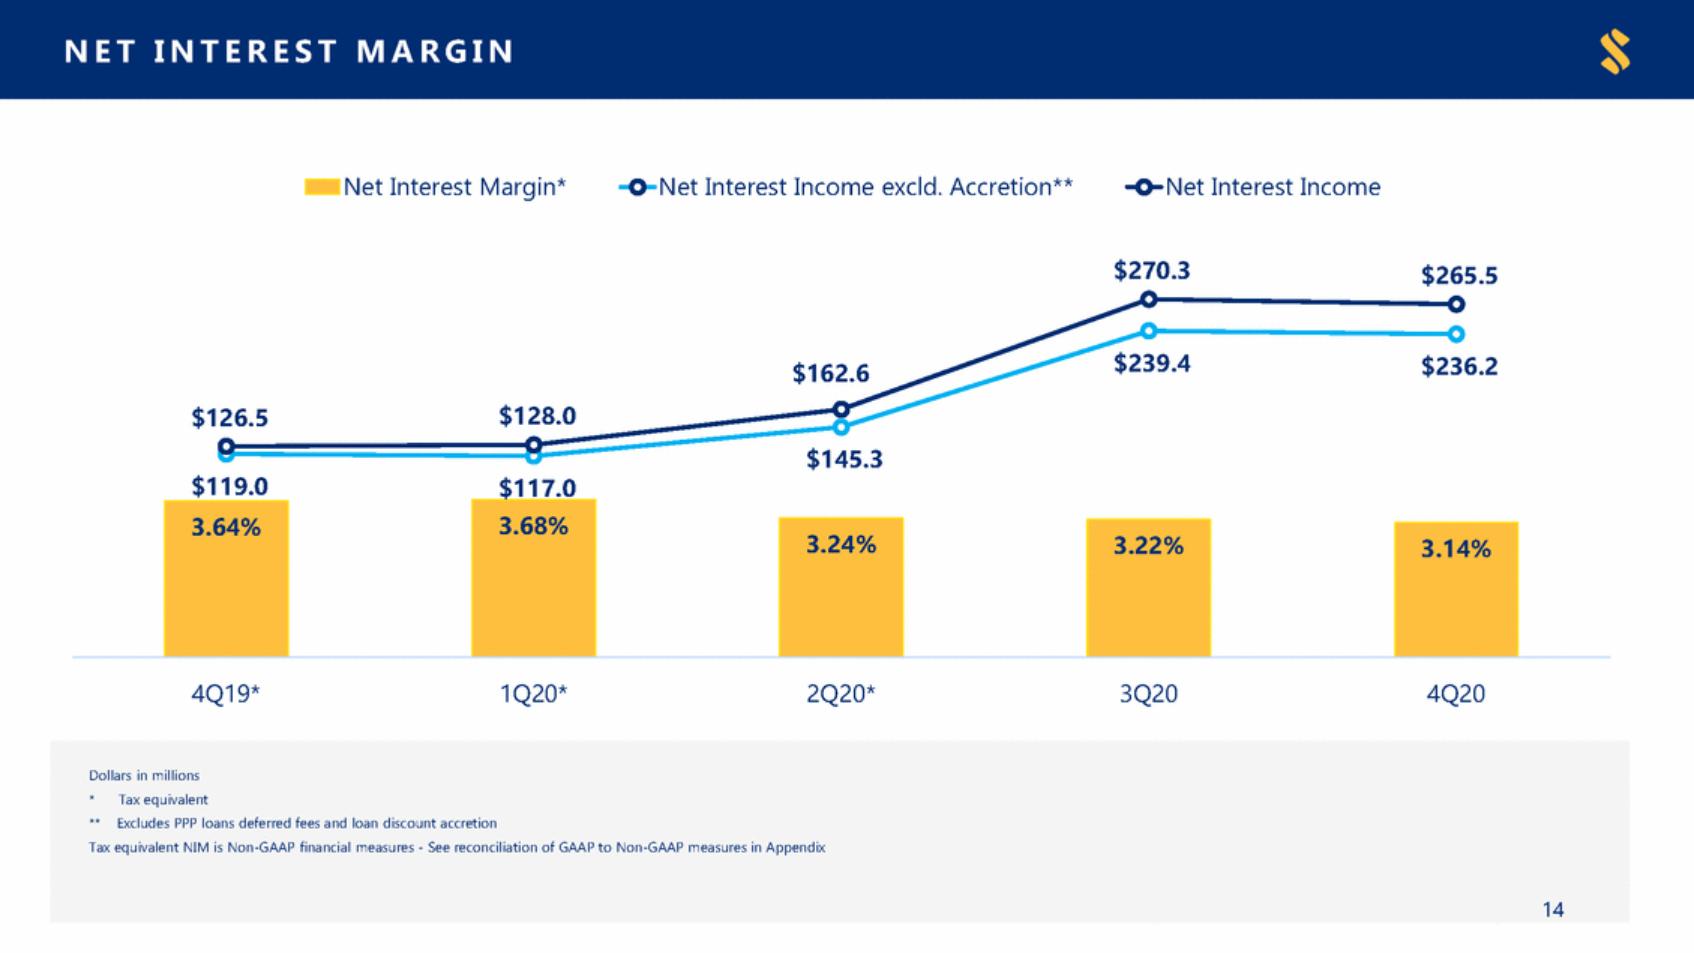
| NE T I NTE RE S TM AR G I N Net Interest Margin* Net Interest Income excld. Accretion** Net Interest Income $270.3 $265.5 $239.4 $236.2 $162.6 $128.0 $126.5 $145.3 $119.0 $117.0 4Q19* 1Q20* 2Q20* 3Q20 4Q20 Dollars in millions *Tax equivalent ** Excludes PPP loans deferred fees and loan discount accretion Tax equivalent NIM is Non-GAAP financial measures - See reconciliation of GAAP to Non-GAAP measures in Appendix 14 3.64% 3.68% 3.24% 3.22% 3.14% |
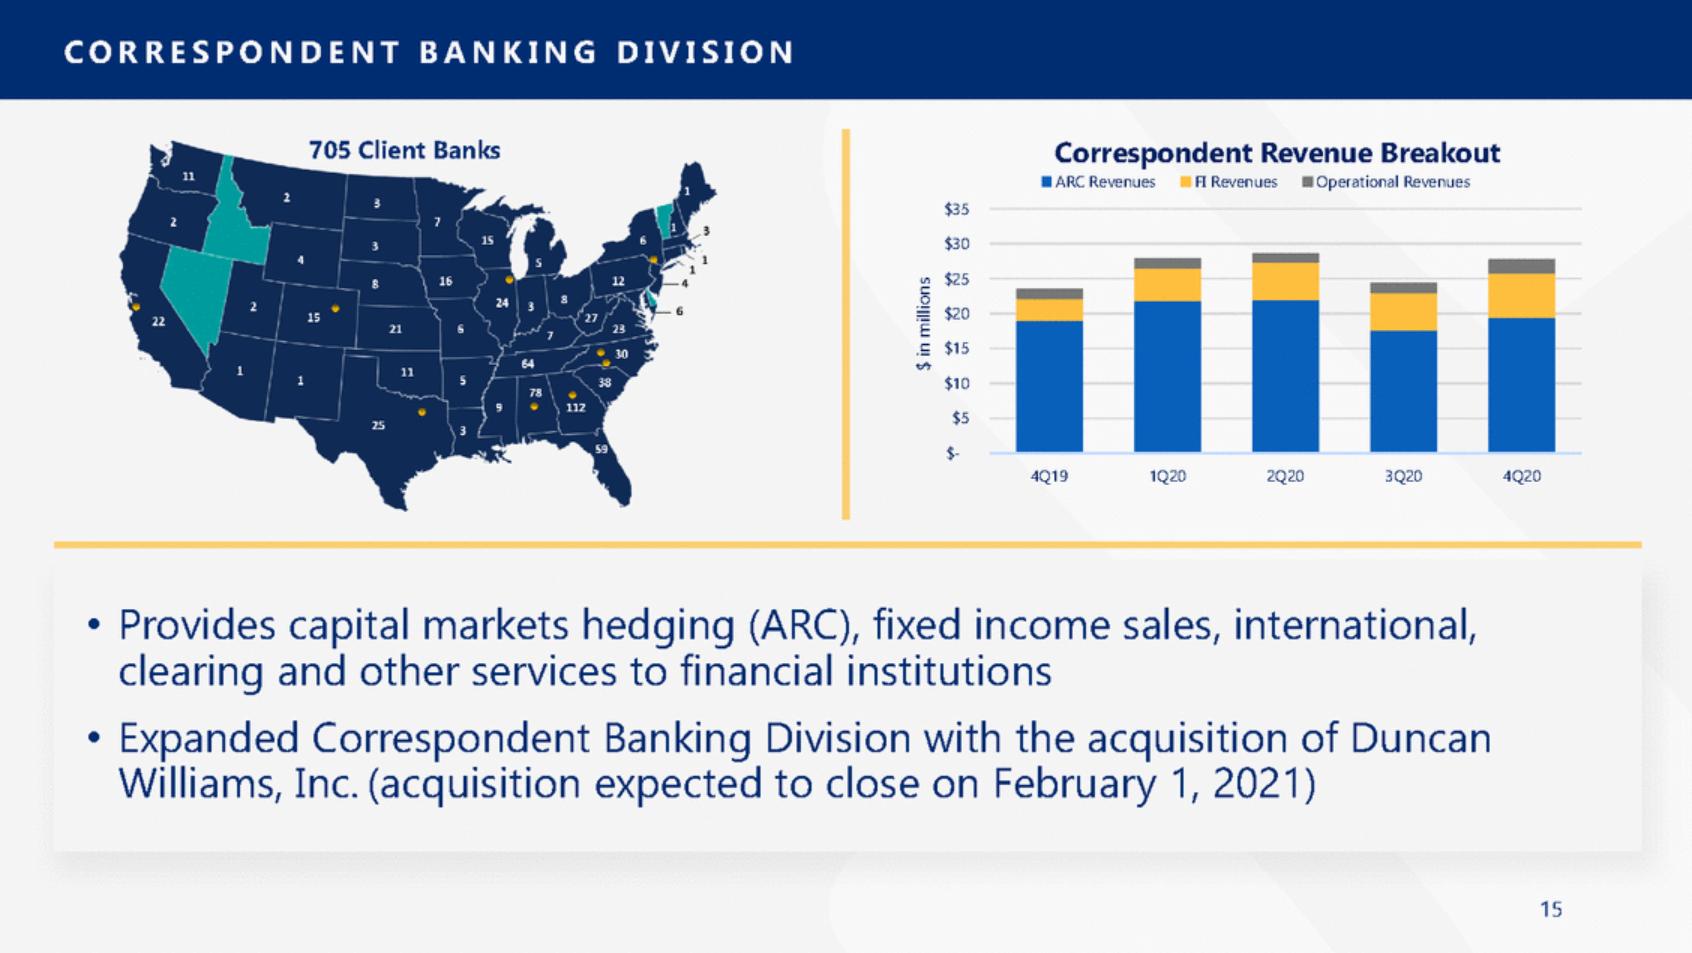
| C O R R E SPO N DE N TBA N K IN G DIVISIO N 705 Client Banks Correspondent Revenue Breakout ARC Revenues FI Revenues Operational Revenues $35 $30 $25 $20 $15 $10 $5 $-4Q19 1Q20 2Q20 3Q20 4Q20 • Provides capital markets hedging (ARC), fixed income sales, international, clearing and other services to financial institutions • Expanded Correspondent Banking Division with the acquisition of Duncan Williams, Inc. (acquisition expected to close on February 1, 2021) 15 $ in millions |
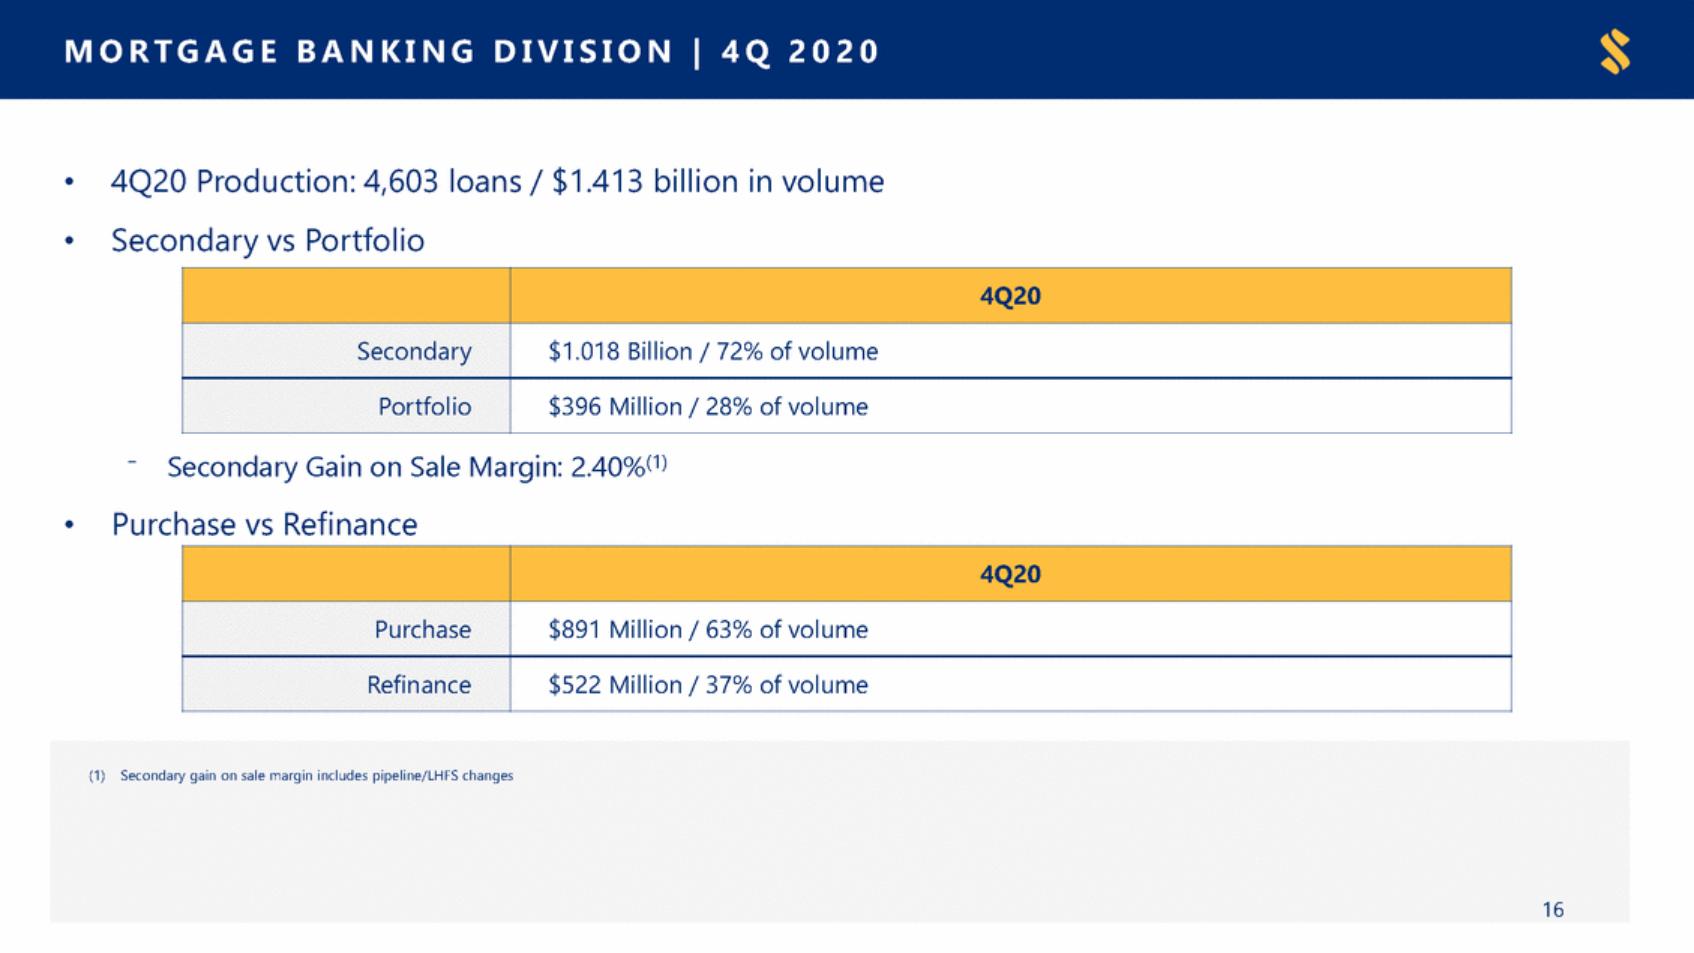
| MO R T GA GEBA N K IN GDIVISIO N|4 Q2 0 2 0 • • 4Q20 Production: 4,603 loans / $1.413 billion in volume Secondary vs Portfolio Secondary Gain on Sale Margin: 2.40%(1) ⁻ • Purchase vs Refinance (1) Secondary gain on sale margin includes pipeline/LHFS changes •Pipeline as of December 31, 2020: 1,982 units / $674 million 16 4Q20 Purchase $891 Million / 63% of volume Refinance $522 Million / 37% of volume 4Q20 Secondary $1.018 Billion / 72% of volume Portfolio $396 Million / 28% of volume |
| Combined Business Basis Performance |
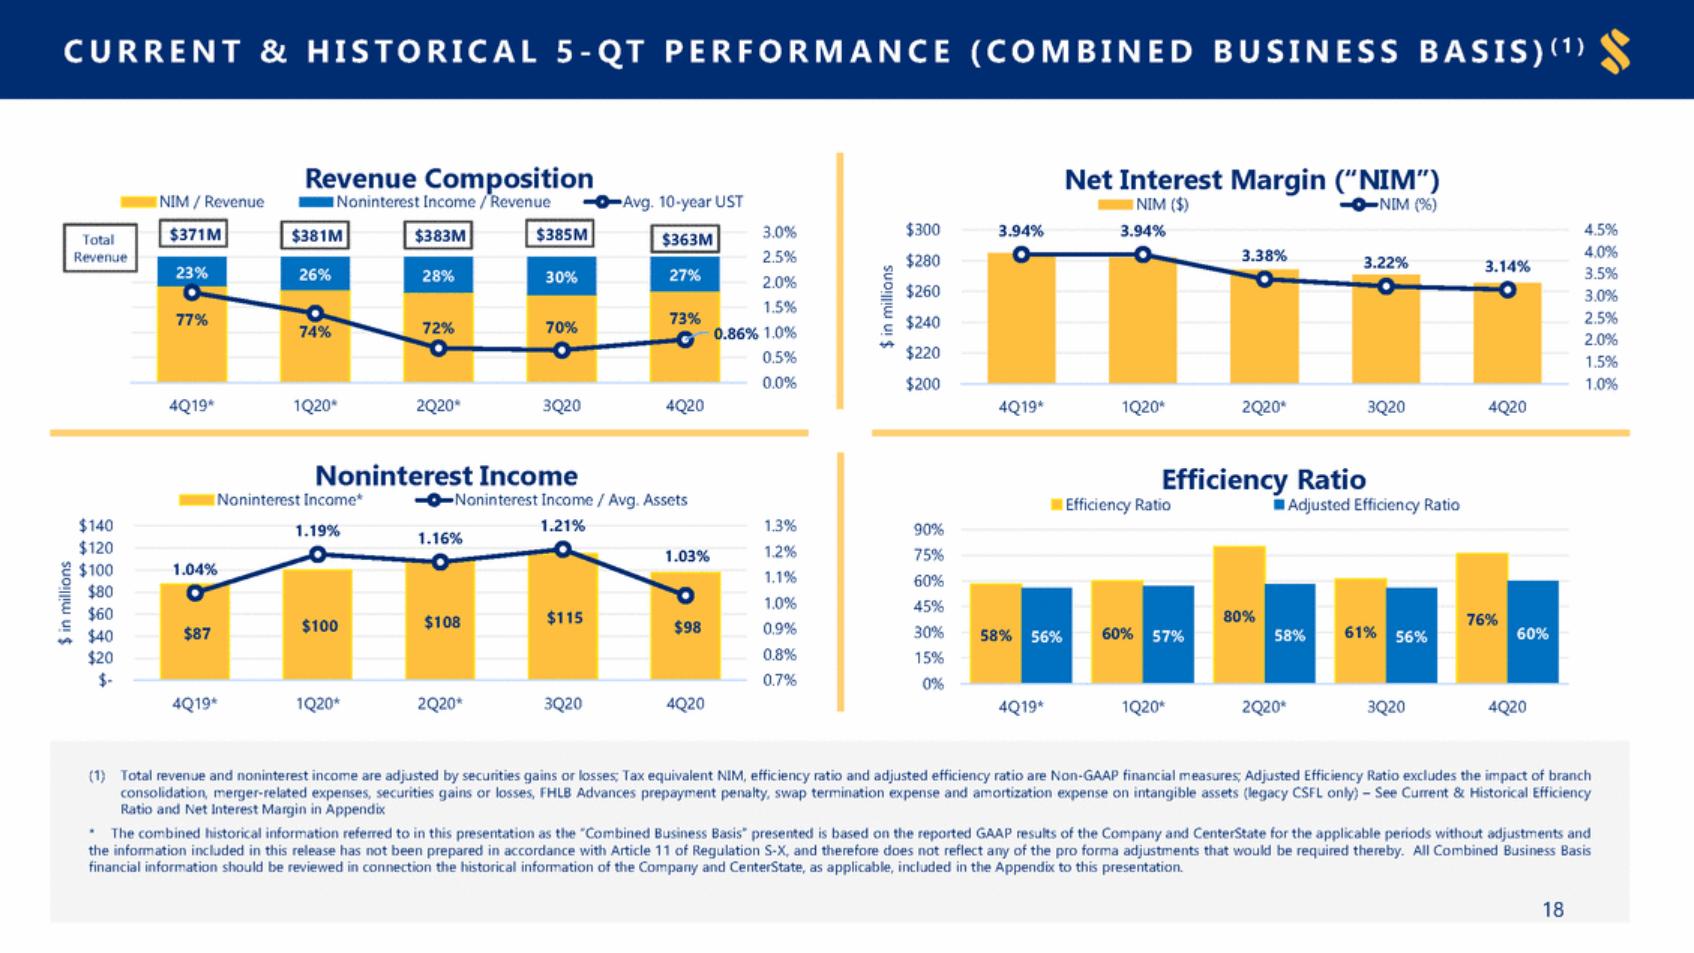
| ( C O MBIN E DBU SIN E SSBA SIS) ( 1) C URRE NT& HI S T O RI C AL5 - Q TPE R F O R MA N CE Revenue Composition Net Interest Margin (“NIM”) NIM / Revenue Noninterest Income / Revenue Avg. 10-year UST NIM ($) NIM (%) $300 $280 $260 $240 $220 $200 4.5% 4.0% 3.5% 3.0% 2.5% 2.0% 1.5% 1.0% 3.0% 2.5% 2.0% 1.5% 3.94% 3.94% 3.38% 3.22% 3.14% 0.86% 1.0% 0.5% 0.0% 4Q19* 1Q20* 2Q20* 3Q20 4Q20 4Q19* 1Q20* 2Q20* 3Q20 4Q20 Noninterest Income Efficiency Ratio Noninterest Income* 1.19% Noninterest Income / Avg. Assets Efficiency Ratio Adjusted Efficiency Ratio $140 $120 $100 $80 $60 $40 $20 $-1.21% 1.3% 1.2% 1.1% 1.0% 0.9% 0.8% 0.7% 90% 75% 60% 45% 30% 15% 0% 1.16% 1.04% 4Q19* 1Q20* 2Q20* 3Q20 4Q20 4Q19* 1Q20* 2Q20* 3Q20 4Q20 $ in millions $ in millions (1) Total revenue and noninterest income are adjusted by securities gains or losses; Tax equivalent NIM, efficiency ratio and adjusted efficiency ratio are Non-GAAP financial measures; Adjusted Efficiency Ratio excludes the impact of branch consolidation, merger-related expenses, securities gains or losses, FHLB Advances prepayment penalty, swap termination expense and amortization expense on intangible assets (legacy CSFL only) – See Current & Historical Efficiency Ratio and Net Interest Margin in Appendix * The combined historical information referred to in this presentation as the “Combined Business Basis” presented is based on the reported GAAP results of the Company and CenterState for the applicable periods without adjustments and the information included in this release has not been prepared in accordance with Article 11 of Regulation S-X, and therefore does not reflect any of the pro forma adjustments that would be required thereby. All Combined Business Basis financial information should be reviewed in connection the historical information of the Company and CenterState, as applicable, included in the Appendix to this presentation. 18 $115 1.03% $108 $100 $98 $87 80% 76% 58% 56% 60% 57% 60% 58% 61% 56% Total Revenue $371M $381M $383M $385M $363M 23% 26% 28% 30% 27% 77% 74% 72% 70% 73% |
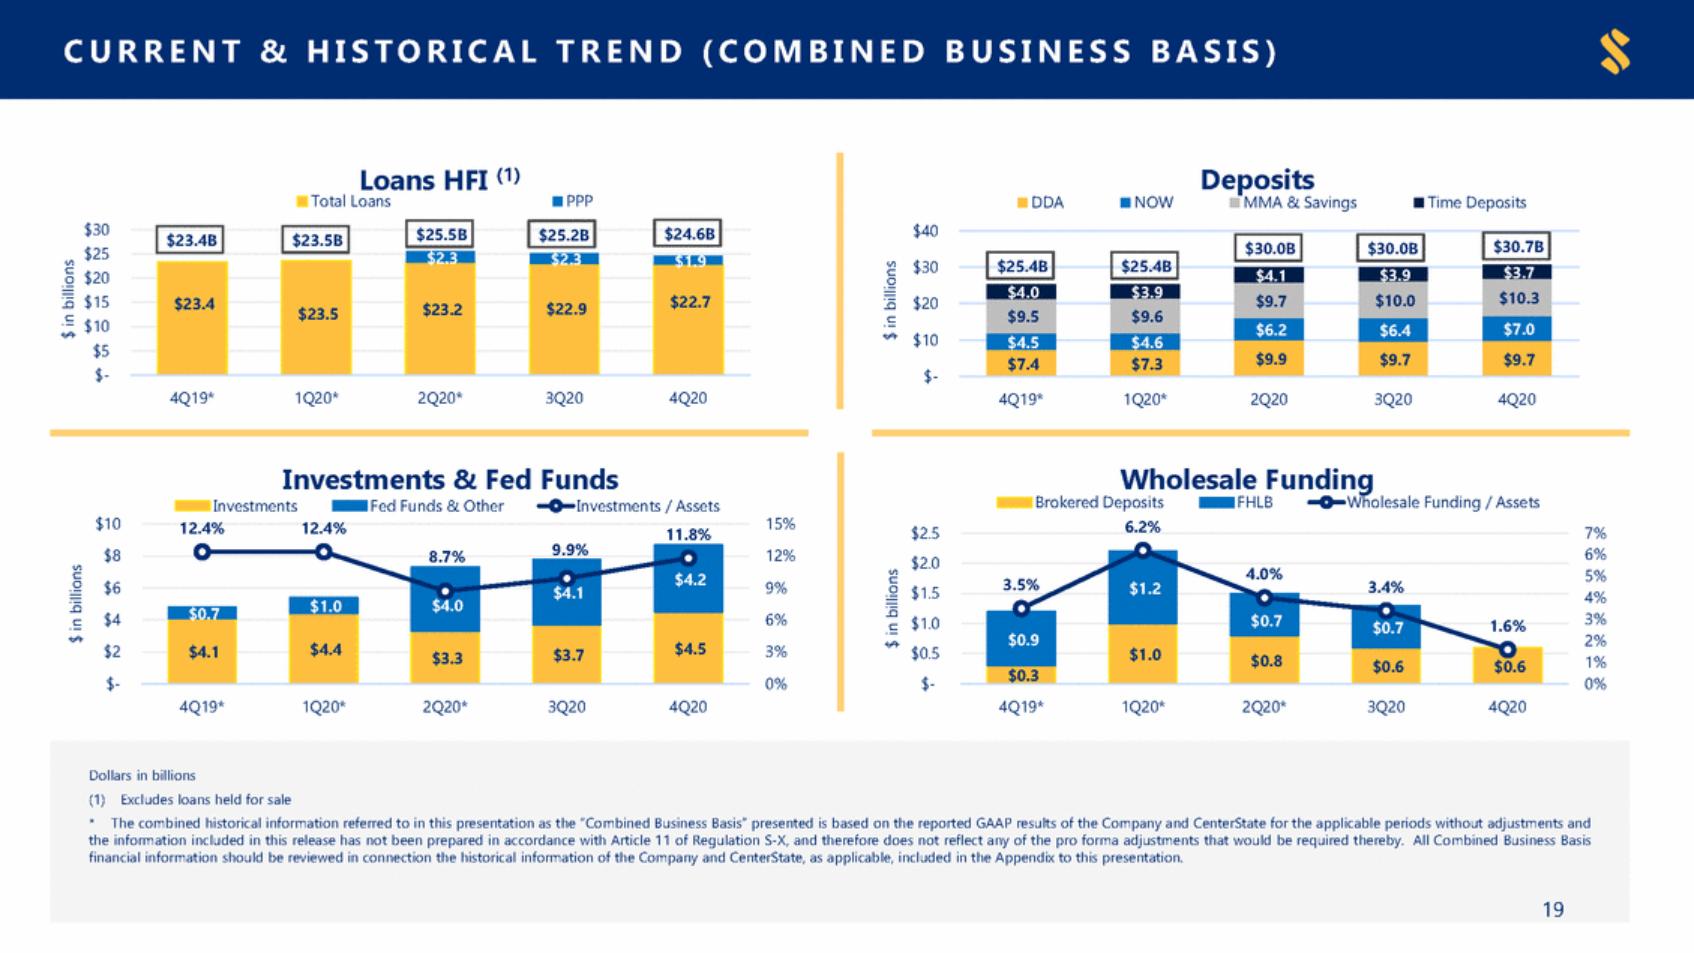
| CU R R E N T & H IST O R ICA L T R E N D ( C O MBIN E D BU SIN E SSBA SIS) Loans HFI (1) Total Loans Deposits PPP DDA NOW MMA & Savings Time Deposits $30 $25 $20 $15 $10 $5 $-$40 $30 $25.4B $25.4B $20 $10 $-4Q19* 1Q20* 2Q20* 3Q20 4Q20 4Q19* 1Q20* 2Q20 3Q20 4Q20 Investments & Fed Funds Wholesale Funding Brokered Deposits FHLB Wholesale Funding / Assets Investments Fed Funds & Other Investments / Assets $10 $8 $6 $4 $2 $-15% 12% 9% 6% 3% 0% 6.2% 12.4% 12.4% $2.5 $2.0 $1.5 $1.0 $0.5 $-7% 6% 5% 4% 3% 2% 1% 0% 11.8% 9.9% 8.7% 4Q19* 1Q20* 2Q20* 3Q20 4Q20 4Q19* 1Q20* 2Q20* 3Q20 4Q20 $ in billions $ in billions $ in billions $ in billions Dollars in billions (1) Excludes loans held for sale * The combined historical information referred to in this presentation as the “Combined Business Basis” presented is based on the reported GAAP results of the Company and CenterState for the applicable periods without adjustments and the information included in this release has not been prepared in accordance with Article 11 of Regulation S-X, and therefore does not reflect any of the pro forma adjustments that would be required thereby. All Combined Business Basis financial information should be reviewed in connection the historical information of the Company and CenterState, as applicable, included in the Appendix to this presentation. 19 $1.2 4.0% 3.4% 3.5% $0.7 $0.7 $0.9 $1.0 1.6% $0.8 $0.6 $0.6 $0.3 $4.2 $4.1 $4.0 $1.0 $4.4 $4.5 $4.1 $3.7 $3.3 $30.0B $30.0B $30.7B $4.1 $3.9 $3.7 $10.3 $9.7 $10.0 $4.0 $3.9 $9.5 $9.6 $7.0 $6.2 $6.4 $4.5 $4.6 $9.9 $9.7 $9.7 $7.4 $7.3 $23.4B $23.5B $25.5B $25.2B $24.6B $23.4 $23.5 $23.2 $22.9 $22.7 |
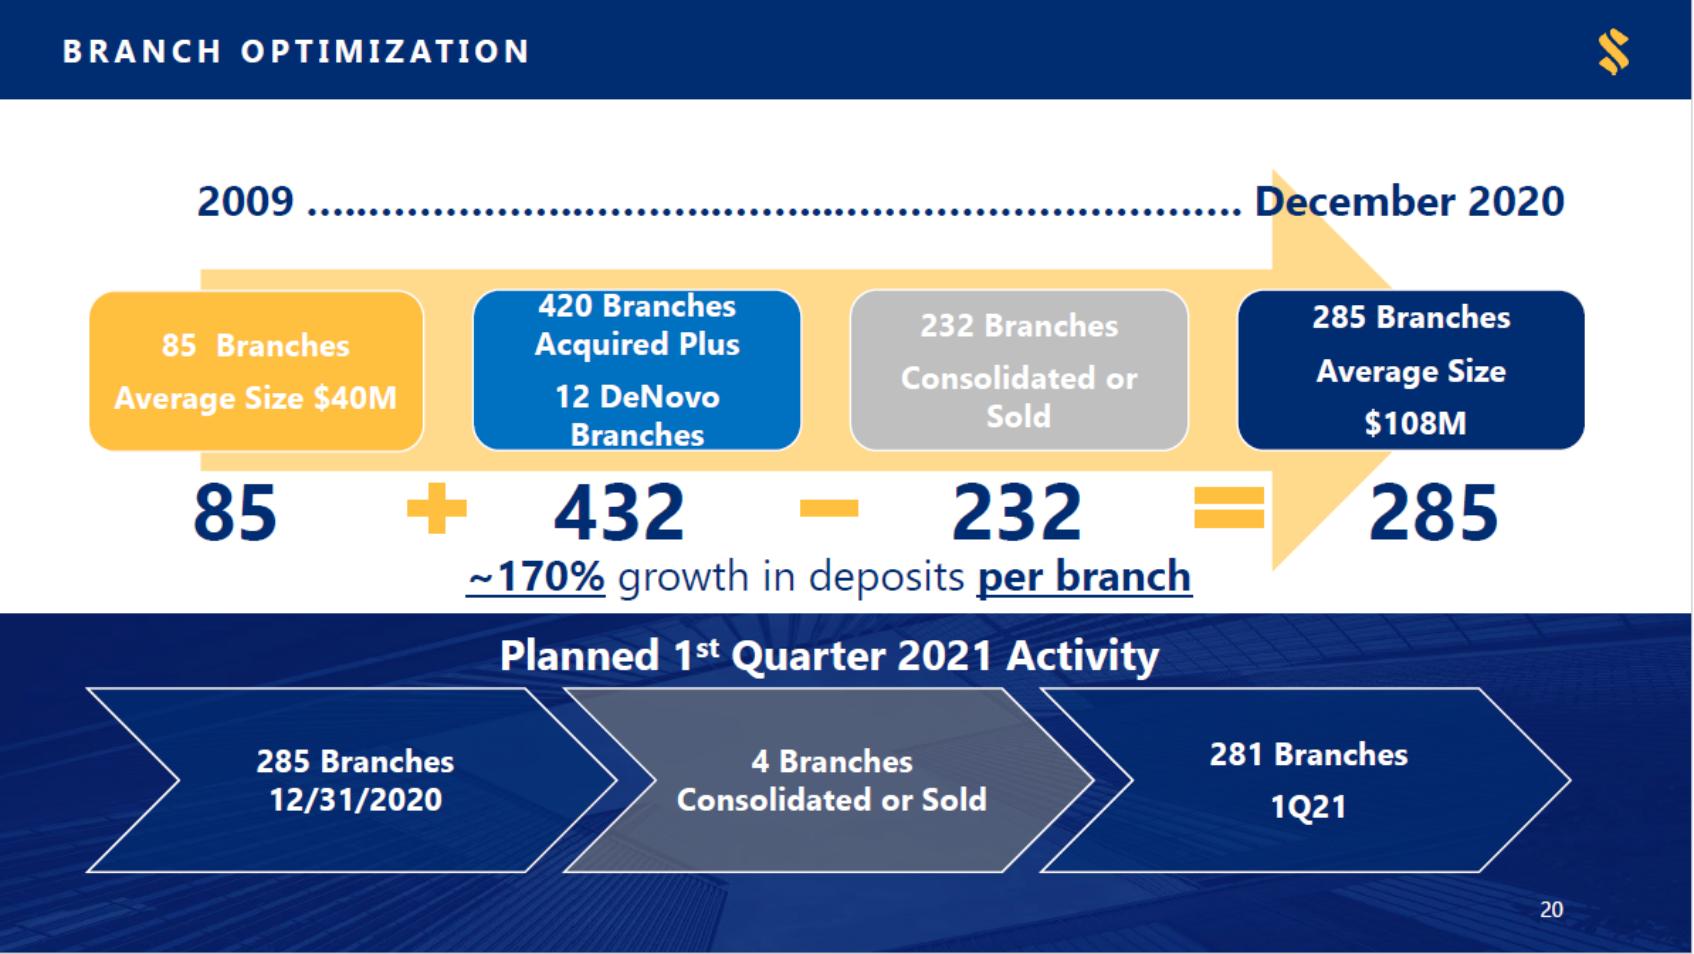
| BR A N CHO PT IMIZ A T IO N 2009 …..……………..………..……....…………………………. December 2020 420 Branches Acquired Plus 12 DeNovo Branches 432 285 Branches Average Size $108M 232 Branches 85 Branches Average Size $40M Consolidated Sold or 85 232 285 ~170% growth in deposits per branch 1st Planned Quarter 2021 Activity 281 Branches 1Q21 285 Branches 12/31/2020 4 Branches Consolidated or Sold 20 |
| Appendix |

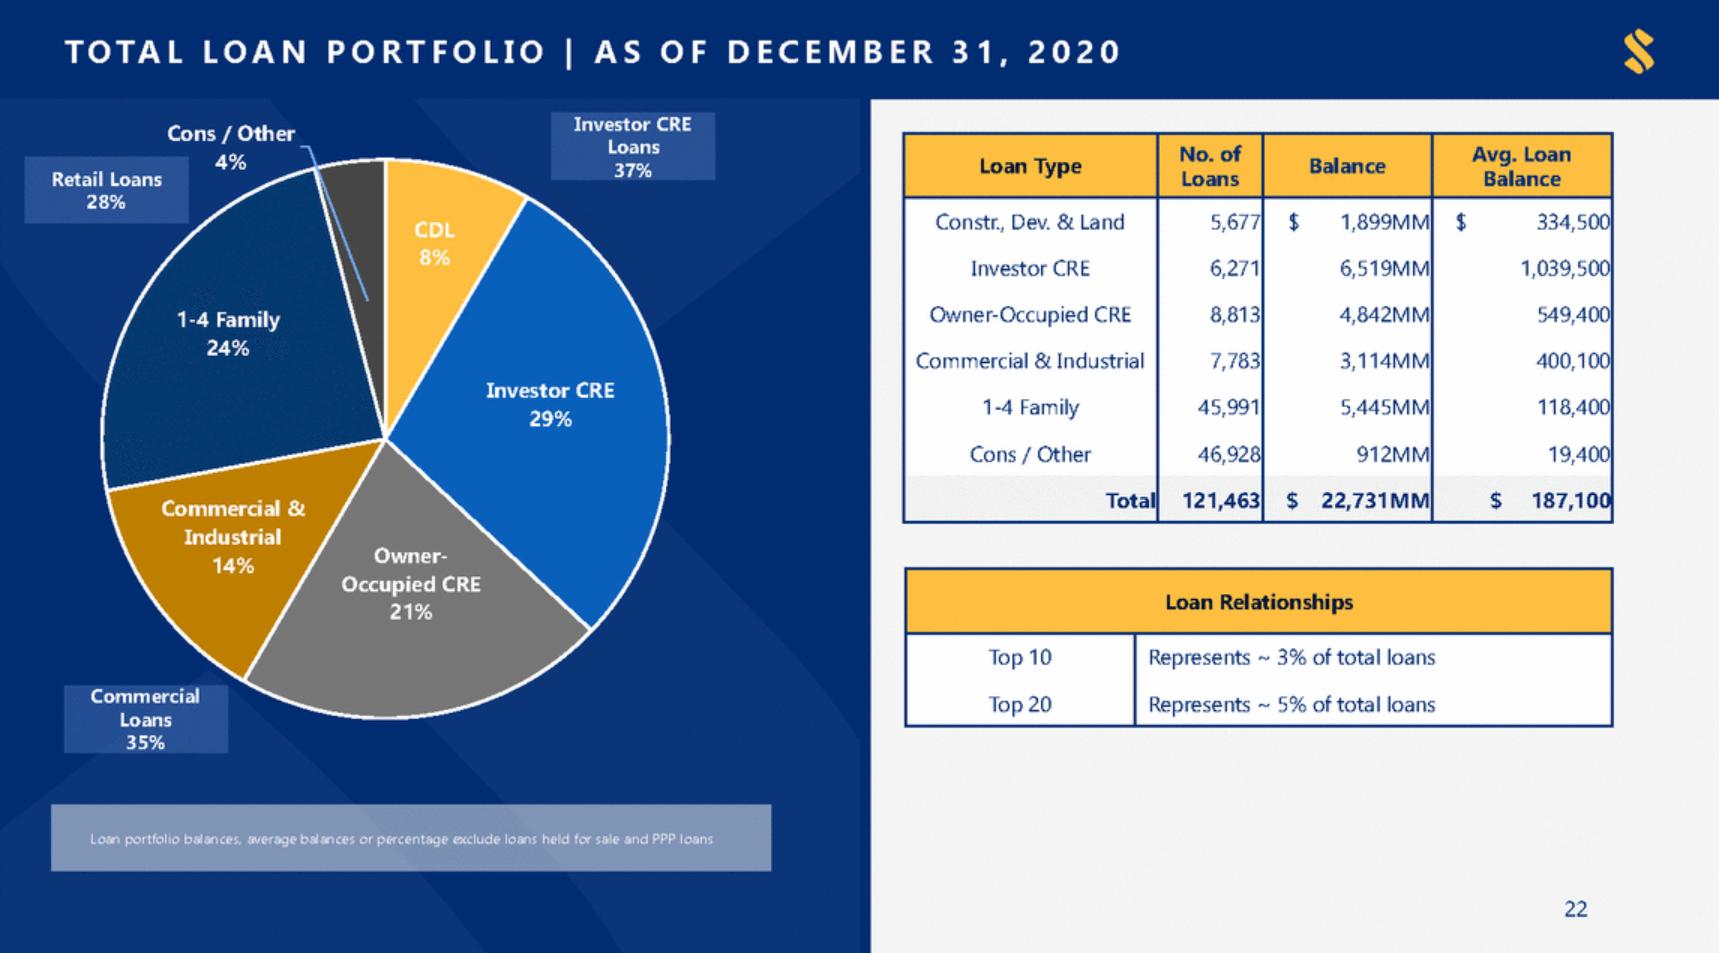
| T O T ALL O AN P O R TFO L I O | AS O F D E C E M B E R 3 1 , 2 0 2 0 Cons / Other 4% CDL 8% 1-4 Family 24% Investor CRE 29% Commercial & Industrial 14% Owner-Occupied CRE 21% Loans 22 Loan portfolio balances, average balances or percentage exclude loans held for sale and PPP loans Commercial 35% Loan Relationships Top 10 Top 20 Represents ~ 3% of total loans Represents ~ 5% of total loans Retail Loans 28% Loan Type No. of Loans Balance Avg. Loan Balance Constr., Dev. & Land Investor CRE Owner-Occupied CRE Commercial & Industrial 1-4 Family Cons / Other 5,677 6,271 8,813 7,783 45,991 46,928 $1,899MM 6,519MM 4,842MM 3,114MM 5,445MM 912MM $334,500 1,039,500 549,400 400,100 118,400 19,400 Total 121,463 $22,731MM $187,100 Investor CRE Loans 37% |
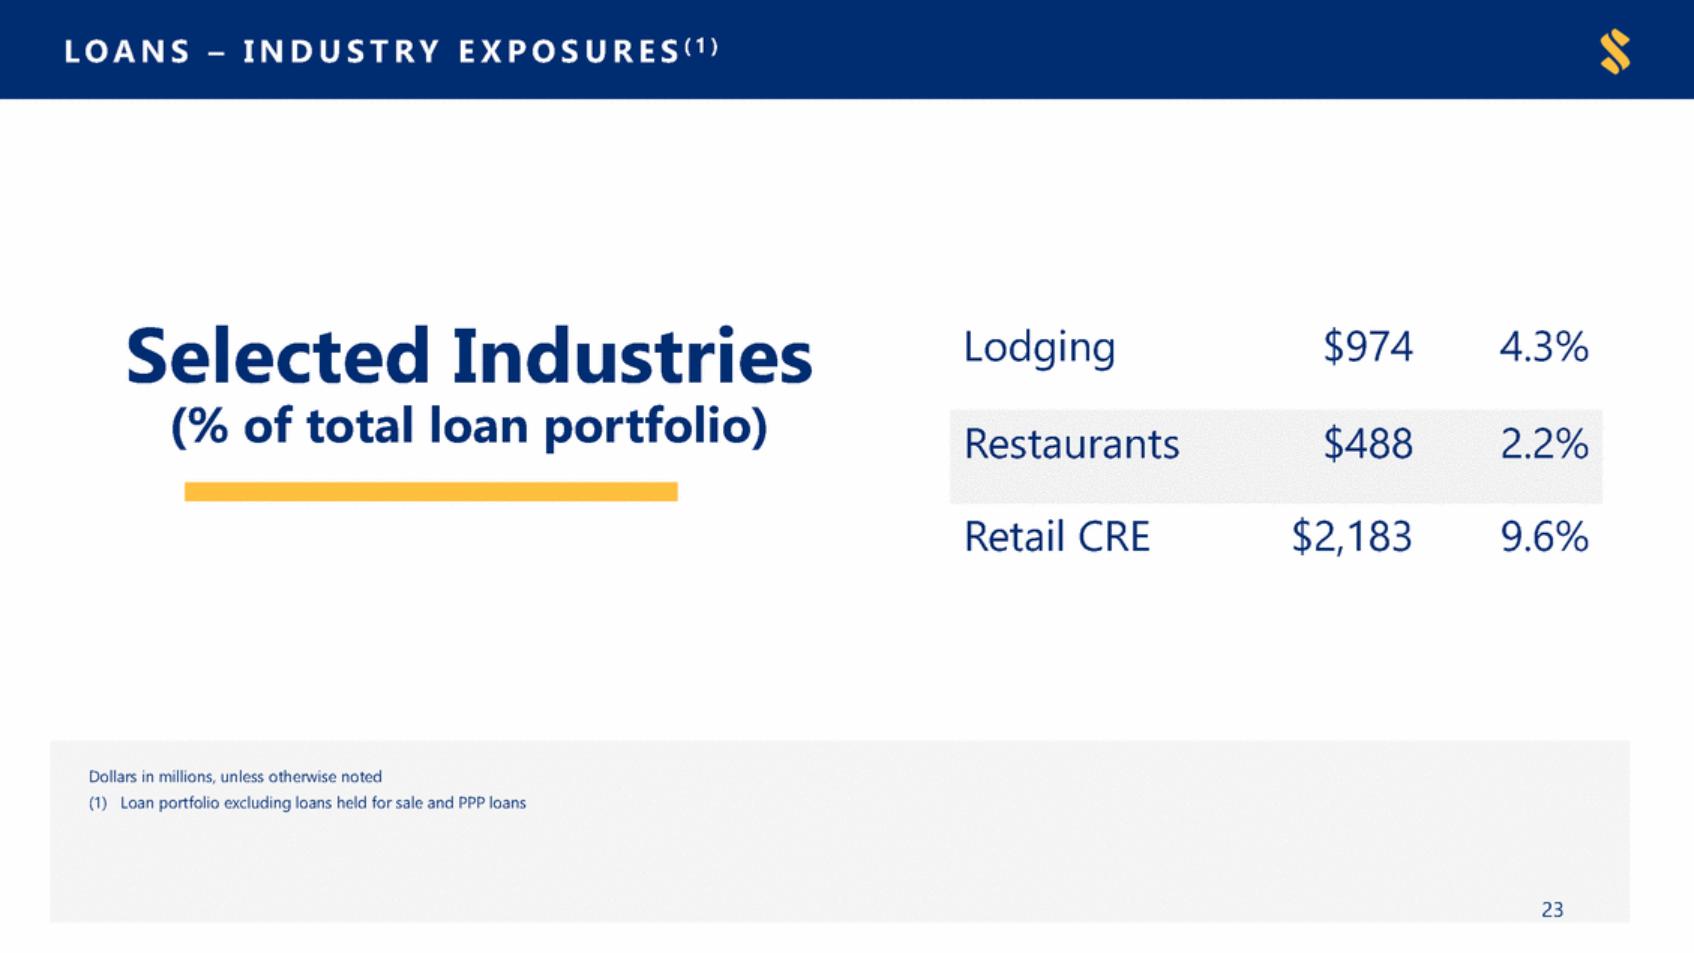
| E X PO SU R E S ( 1) L O ANS–IN DU ST R Y Selected Industries Lodging $974 4.3% (% of total loan portfolio) Retail CRE $2,183 9.6% Dollars in millions, unless otherwise noted (1) Loan portfolio excluding loans held for sale and PPP loans 23 Restaurants$4882.2% |
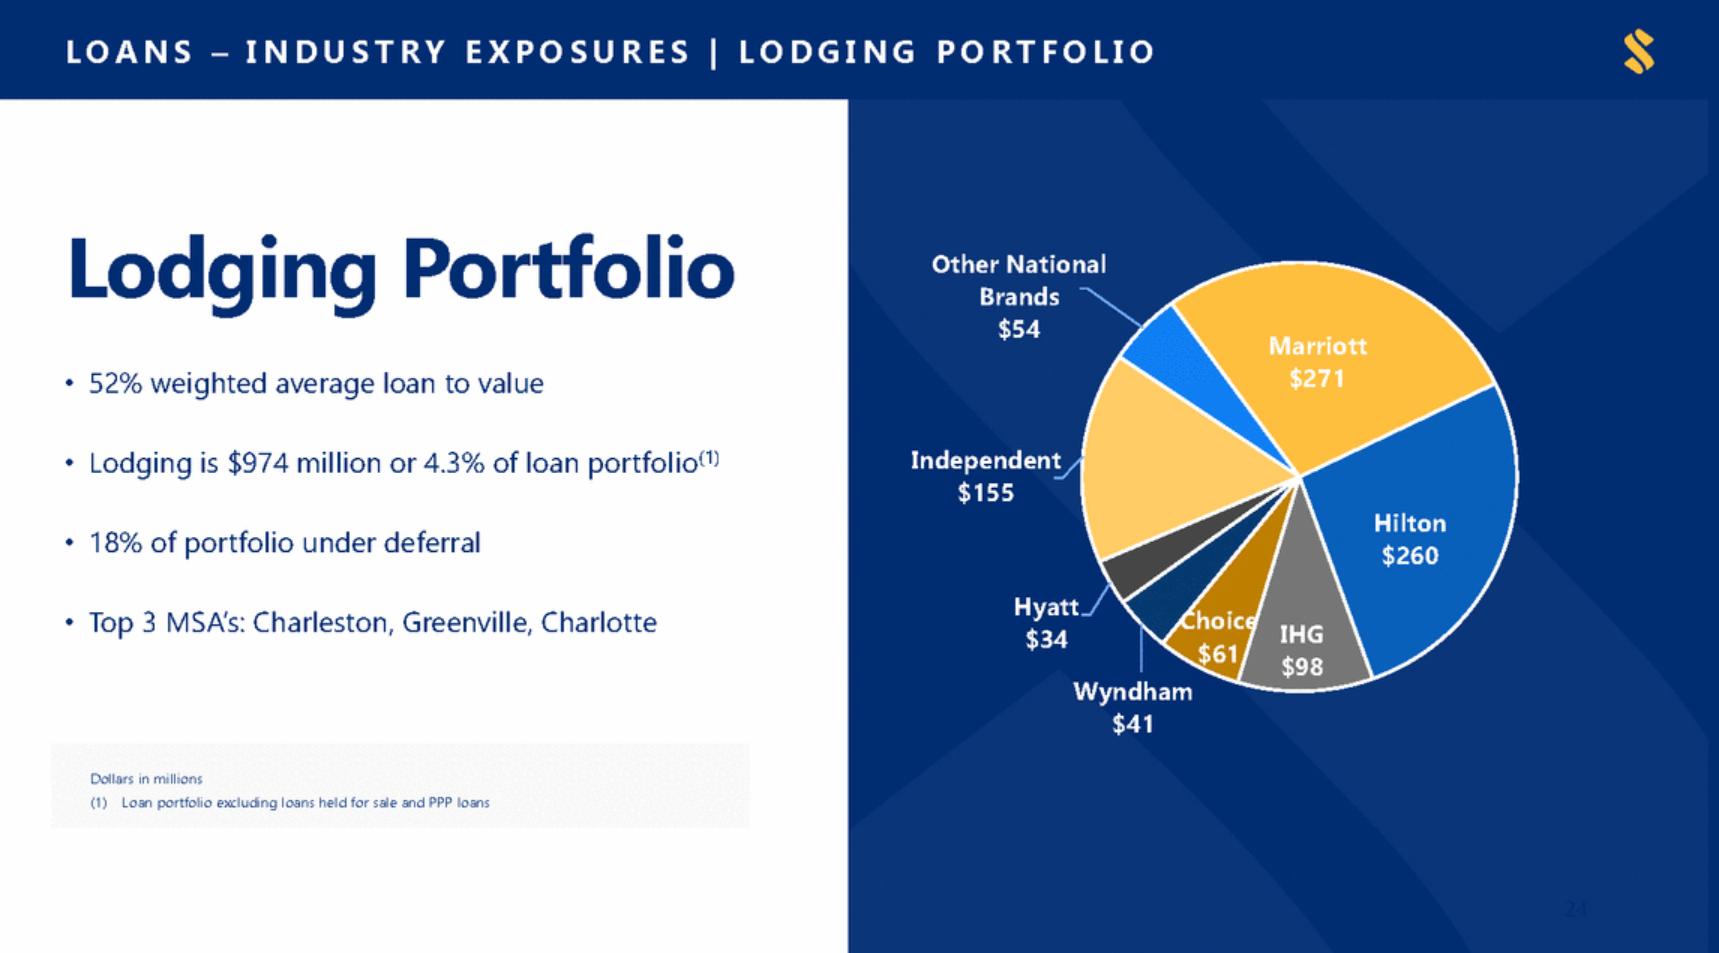
| L O ANS–IN DU ST R YE X PO SU R E S|L O DGIN G PO R T F O LIO Lodging Portfolio Other National Brands $54 M riott • 52% weighted average loan to value Lodging is $974 million or 4.3% of loan portfolio(1) Independent $155 • Hilton $260 • 18% of portfolio under deferral Hyatt $34 • Top 3 MSA’s: Charleston, Greenville, Charlotte Choice $61 G Wyndham $41 24 Dollars in millions (1) Loan portfolio excluding loans held for sale and PPP loans |
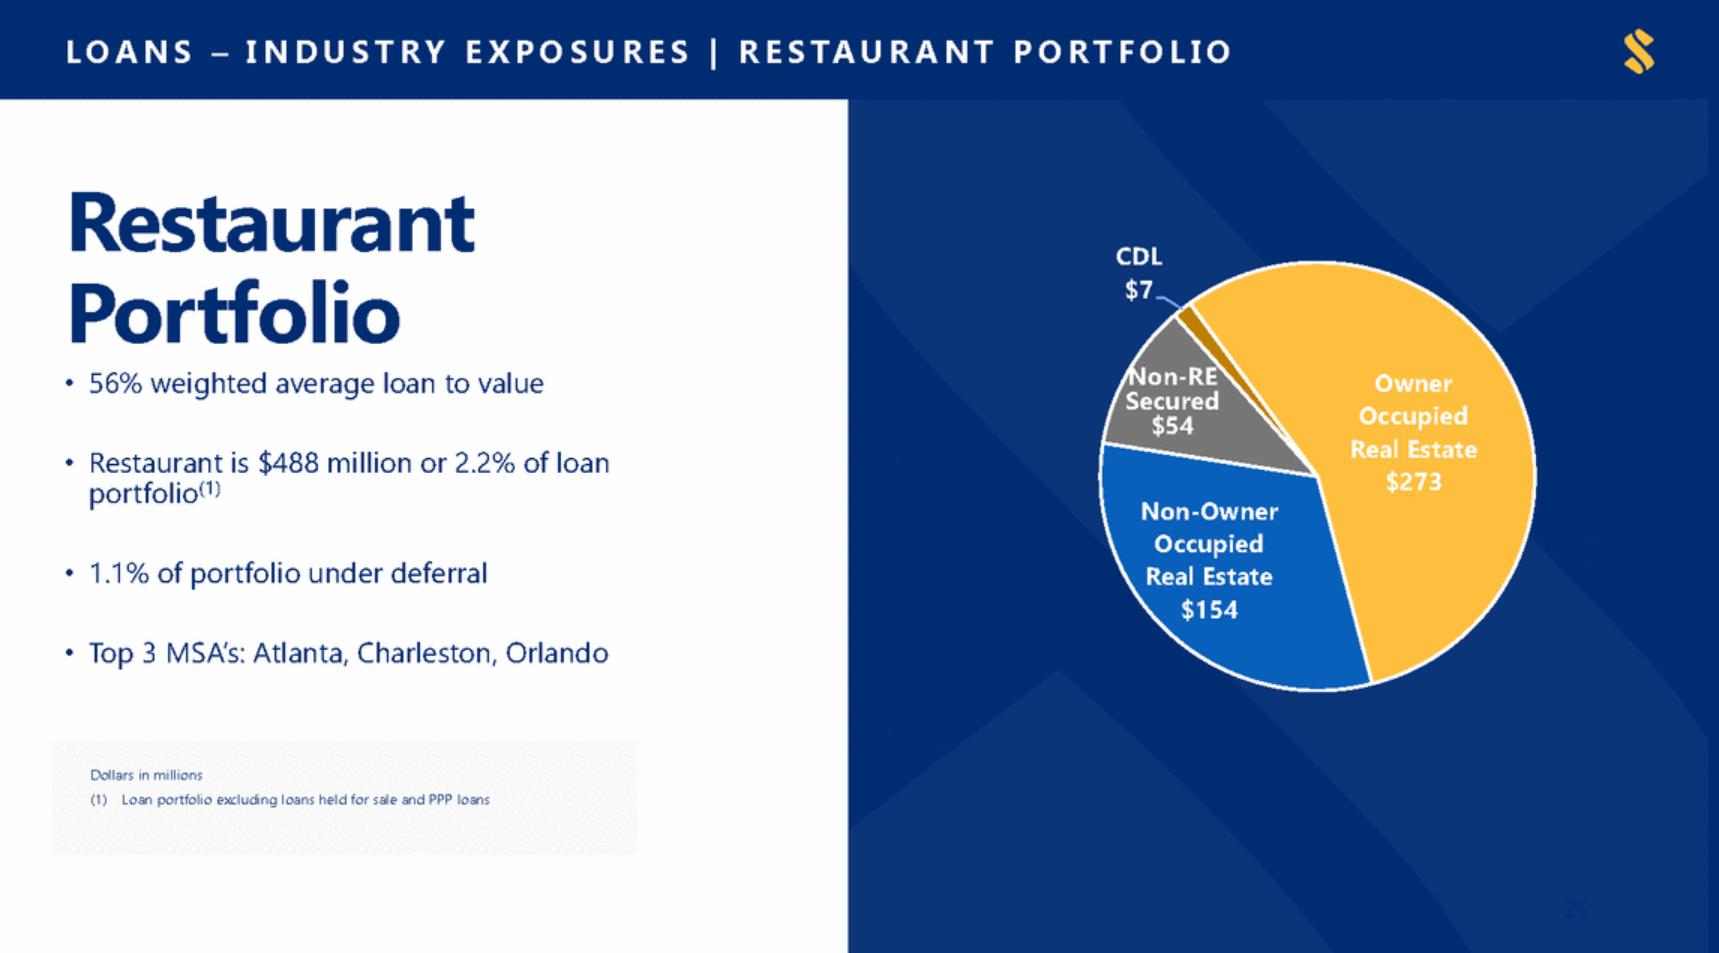
| L O ANS–I ND US TR YE X P O S URE S | RE S T A URANT P O R TFO L I O Restaurant Portfolio CDL $7 Non-RE • 56% weighted average loan to value Owner Occupied al Estate $273 Sec ed • Restaurant is $488 million or 2.2% of loan portfolio(1) Non-Owner Occupied Real Estate $154 • 1.1% of portfolio under deferral • Top 3 MSA’s: Atlanta, Charleston, Orlando 25 Dollars in millions (1) Loan portfolio excluding loans held for sale and PPP loans |
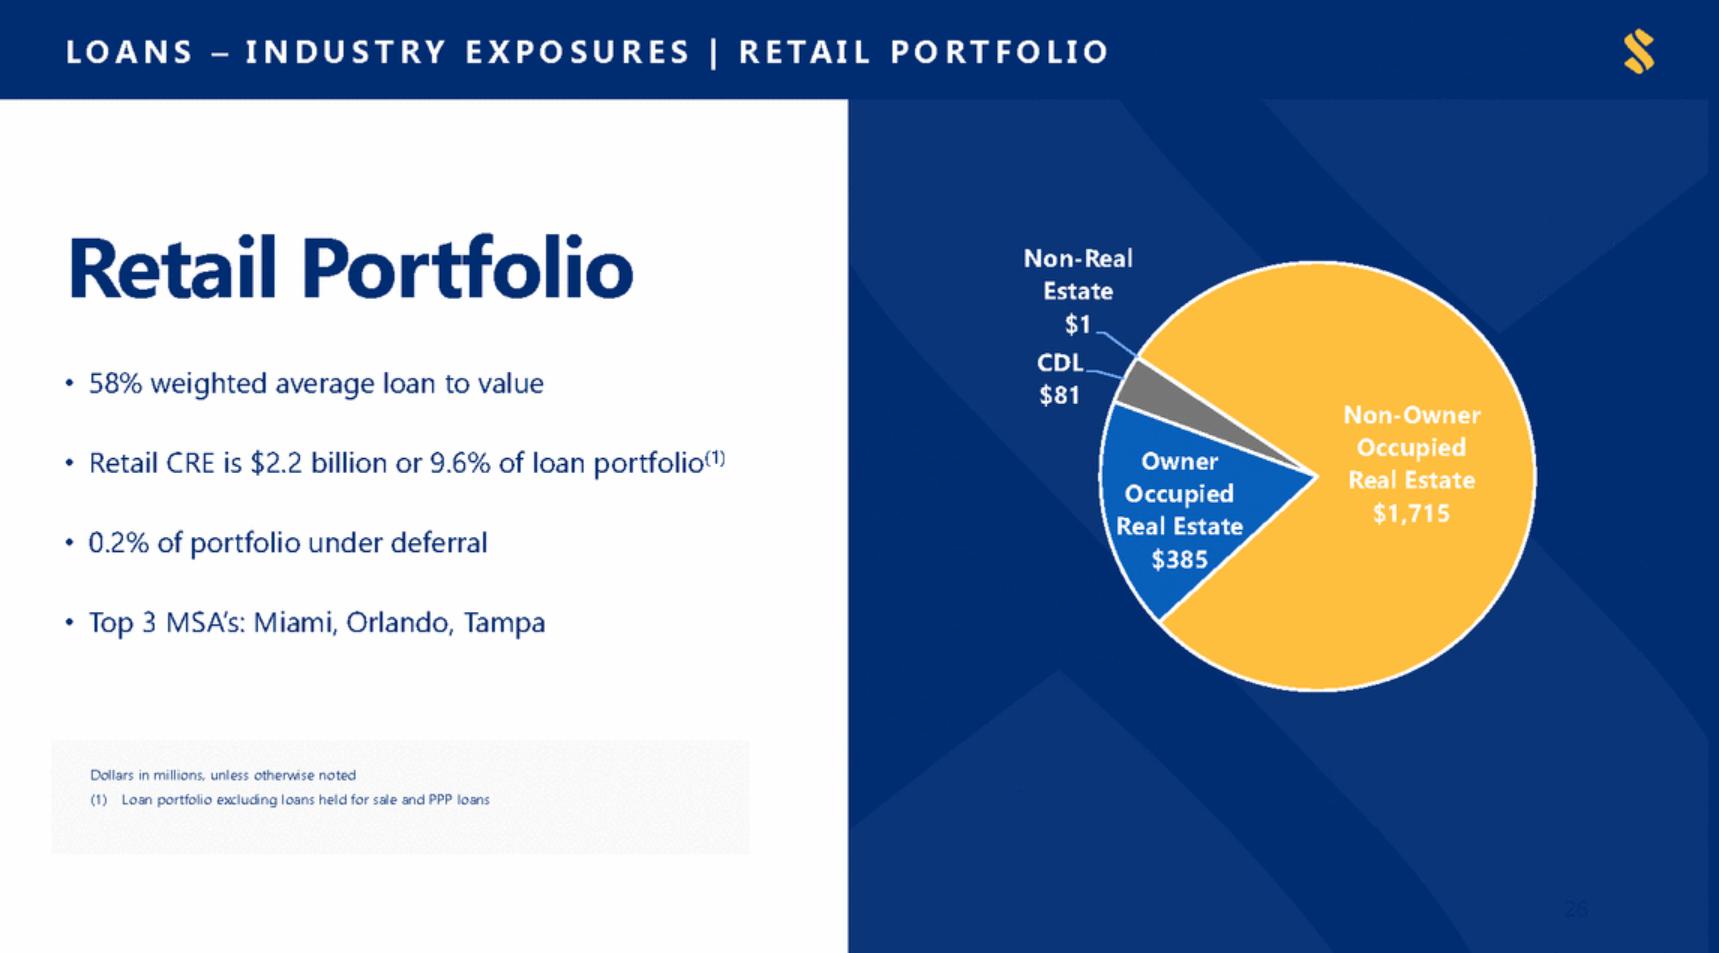
| L O ANS–IN DU ST R YE X PO SU R E S | R E T A IL PO R T F O LIO Retail Portfolio Non-Real Estate $1 CDL $81 • 58% weighted average loan to value Non-Owner Occupied Real Estate $1,715 Retail CRE is $2.2 billion or 9.6% of loan portfolio(1) • Owner Occupied Real Estate $385 • 0.2% of portfolio under deferral • Top 3 MSA’s: Miami, Orlando, Tampa 26 Dollars in millions, unless otherwise noted (1) Loan portfolio excluding loans held for sale and PPP loans |
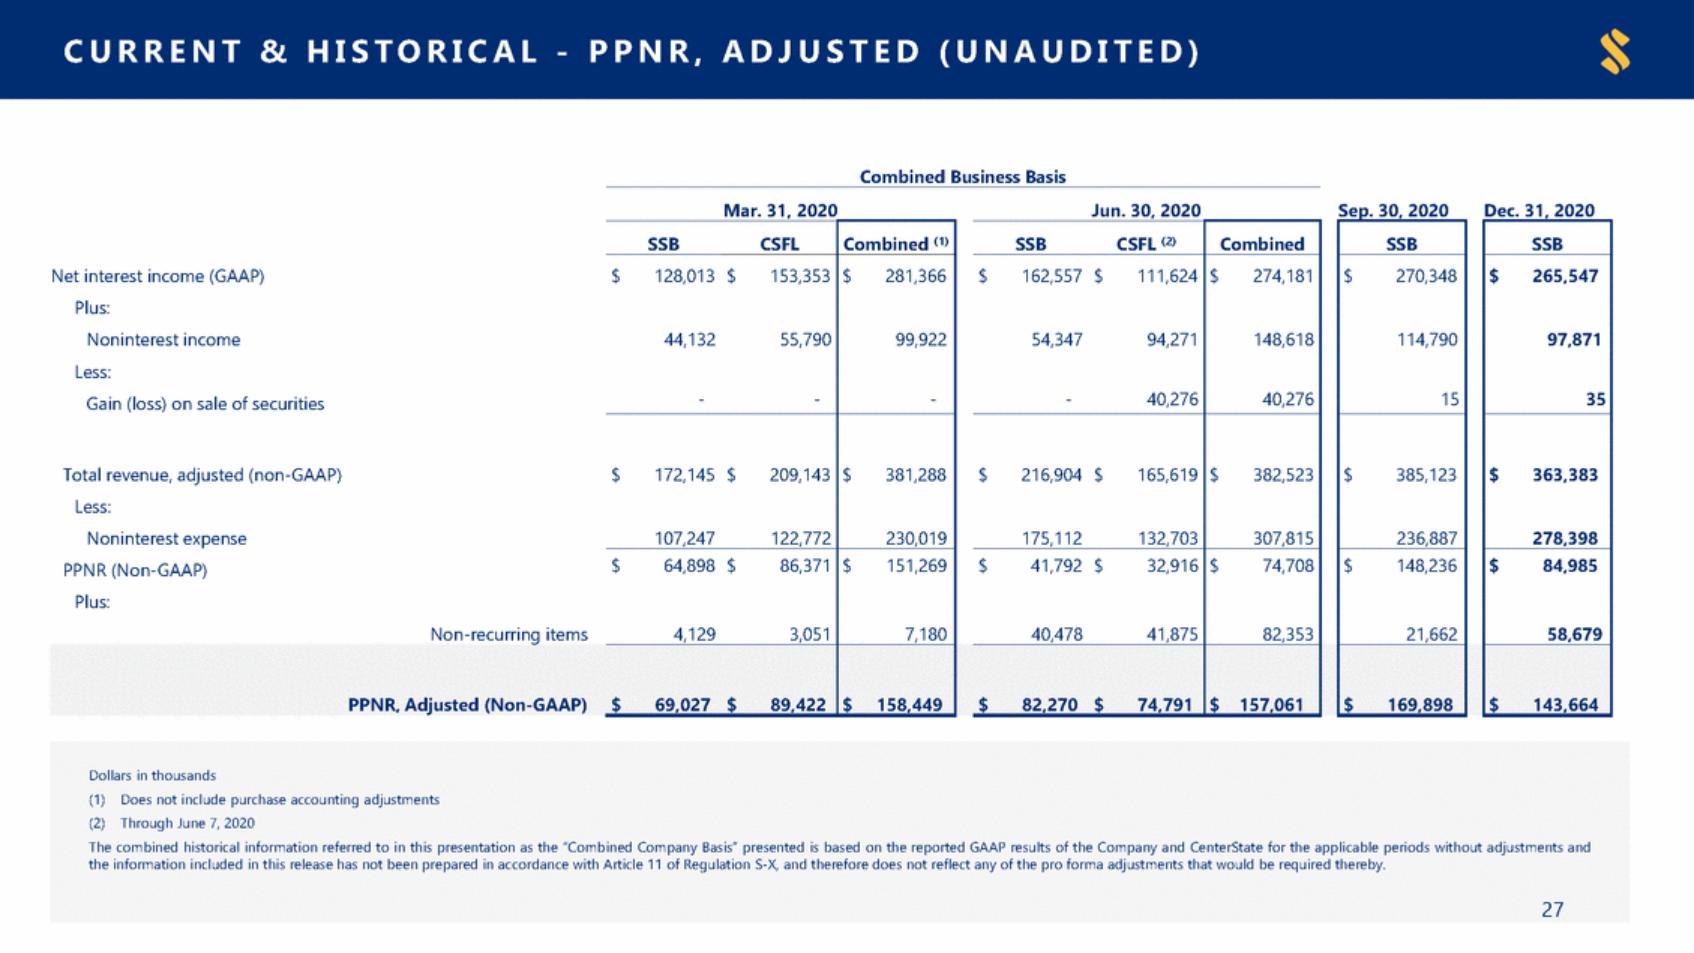
| C URRE NT&HI S T O RI C AL-PPN R ,A DJ U ST E D( U N A U DIT E D) Combined Business Basis Mar. 31, 2020 Jun. 30, 2020 Sep. 30, 2020 Dec. 31, 2020 Dollars in thousands (1) Does not include purchase accounting adjustments (2) Through June 7, 2020 The combined historical information referred to in this presentation as the “Combined Company Basis” presented is based on the reported GAAP results of the Company and CenterState for the applicable periods without adjustments and the information included in this release has not been prepared in accordance with Article 11 of Regulation S-X, and therefore does not reflect any of the pro forma adjustments that would be required thereby. 27 Net interest income (GAAP) Plus: Noninterest income Less: Gain (loss) on sale of securities Total revenue, adjusted (non-GAAP) Less: Noninterest expense PPNR (Non-GAAP) Plus: Non-recurring items SSBCSFL Combined (1) SSBCSFL (2) Combined SSB SSB $128,013 $153,353 44,13255,790 --$281,366 99,922 - $162,557 $111,624 54,34794,271 -40,276 $274,181 148,618 40,276 $270,348 114,790 15 $265,547 97,871 35 $172,145 $209,143 107,247122,772 $381,288 230,019 $216,904 $165,619 175,112132,703 $382,523 307,815 $385,123 236,887 $363,383 278,398 $64,898 $86,371 4,1293,051 $151,269 7,180 $41,792 $32,916 40,47841,875 $74,708 82,353 $148,236 21,662 $84,985 58,679 PPNR, Adjusted (Non-GAAP)$69,027 $89,422 $158,449 $82,270 $74,791 $157,061 $169,898 $143,664 |
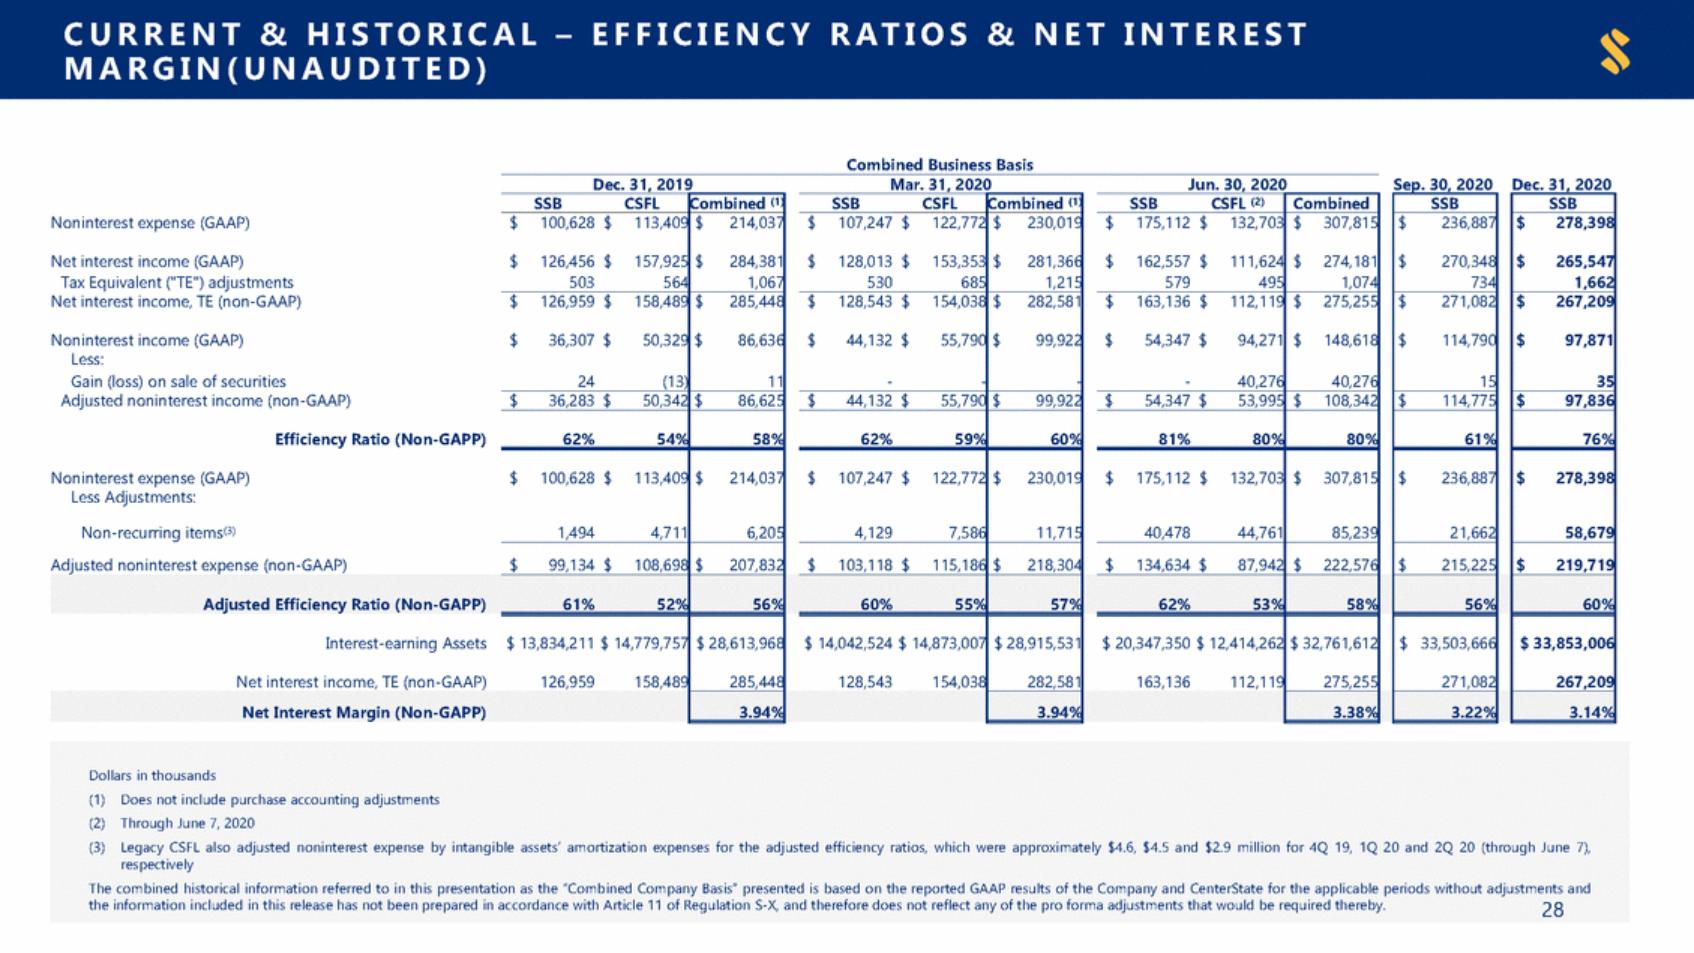
| C URRE NT&HI S T O RI C AL–E FFI C I E NC YR A TI O S&NE TI NTE RE S T MA R GIN ( U N A U DIT E D) Combined Business Basis Dec. 31, 2019 Mar. 31, 2020 Jun. 30, 2020 Sep. 30, 2020Dec. 31, 2020 Dollars in thousands (1) Does not include purchase accounting adjustments (2) Through June 7, 2020 (3) Legacy CSFL also adjusted noninterest expense by intangible assets’ amortization expenses for the adjusted efficiency ratios, which were approximately $4.6, $4.5 and $2.9 million for 4Q 19, 1Q 20 and 2Q 20 (through June 7), respectively The combined historical information referred to in this presentation as the “Combined Company Basis” presented is based on the reported GAAP results of the Company and CenterState for the applicable periods without adjustments and the information included in this release has not been prepared in accordance with Article 11 of Regulation S-X, and therefore does not reflect any of the pro forma adjustments that would be required thereby.28 Noninterest expense (GAAP) Net interest income (GAAP) Tax Equivalent ("TE") adjustments Net interest income, TE (non-GAAP) Noninterest income (GAAP) Less: Gain (loss) on sale of securities Adjusted noninterest income (non-GAAP) Efficiency Ratio (Non-GAPP) Noninterest expense (GAAP) Less Adjustments: Non-recurring items(3) Adjusted noninterest expense (non-GAAP) SSBCSFL Combined (1) SSBCSFL Combined (1) SSBCSFL (2) Combined SSB SSB $100,628 $113,409 $126,456 $157,925 503564 $214,037 $284,381 1,067 $107,247 $122,772 $128,013 $153,353 530685 $230,019 $281,366 1,215 $175,112 $132,703 $162,557 $111,624 579495 $307,815 $274,181 1,074 $236,887 $270,348 734 $278,398 $265,547 1,662 $126,959 $158,489 $36,307 $50,329 24(13) $285,448 $86,636 11 $128,543 $154,038 $44,132 $55,790 --$282,581 $99,922 - $163,136 $112,119 $54,347 $94,271 -40,276 $275,255 $148,618 40,276 $271,082 $114,790 15 $267,209 $97,871 35 $36,283 $50,342 $86,625 $44,132 $55,790 $99,922 $54,347 $53,995 $108,342 $114,775 $97,836 62%54% 58% 62%59% 60% 81%80% 80% 61% 76% $100,628 $113,409 1,4944,711 $214,037 6,205 $107,247 $122,772 4,1297,586 $230,019 11,715 $175,112 $132,703 40,47844,761 $307,815 85,239 $236,887 21,662 $278,398 58,679 $99,134 $108,698 $207,832 $103,118 $115,186 $218,304 $134,634 $87,942 $222,576 $215,225 $219,719 Adjusted Efficiency Ratio (Non-GAPP)61%52% 56% 60%55% 57% 62%53% 58% 56% 60% Interest-earning Assets$ 13,834,211 $ 14,779,757 Net interest income, TE (non-GAAP)126,959158,489 $ 28,613,968 285,448 $ 14,042,524 $ 14,873,007 128,543154,038 $ 28,915,531 282,581 $ 20,347,350 $ 12,414,262 163,136112,119 $ 32,761,612 275,255 $ 33,503,666 271,082 $ 33,853,006 267,209 Net Interest Margin (Non-GAPP) 3.94% 3.94% 3.38% 3.22% 3.14% |
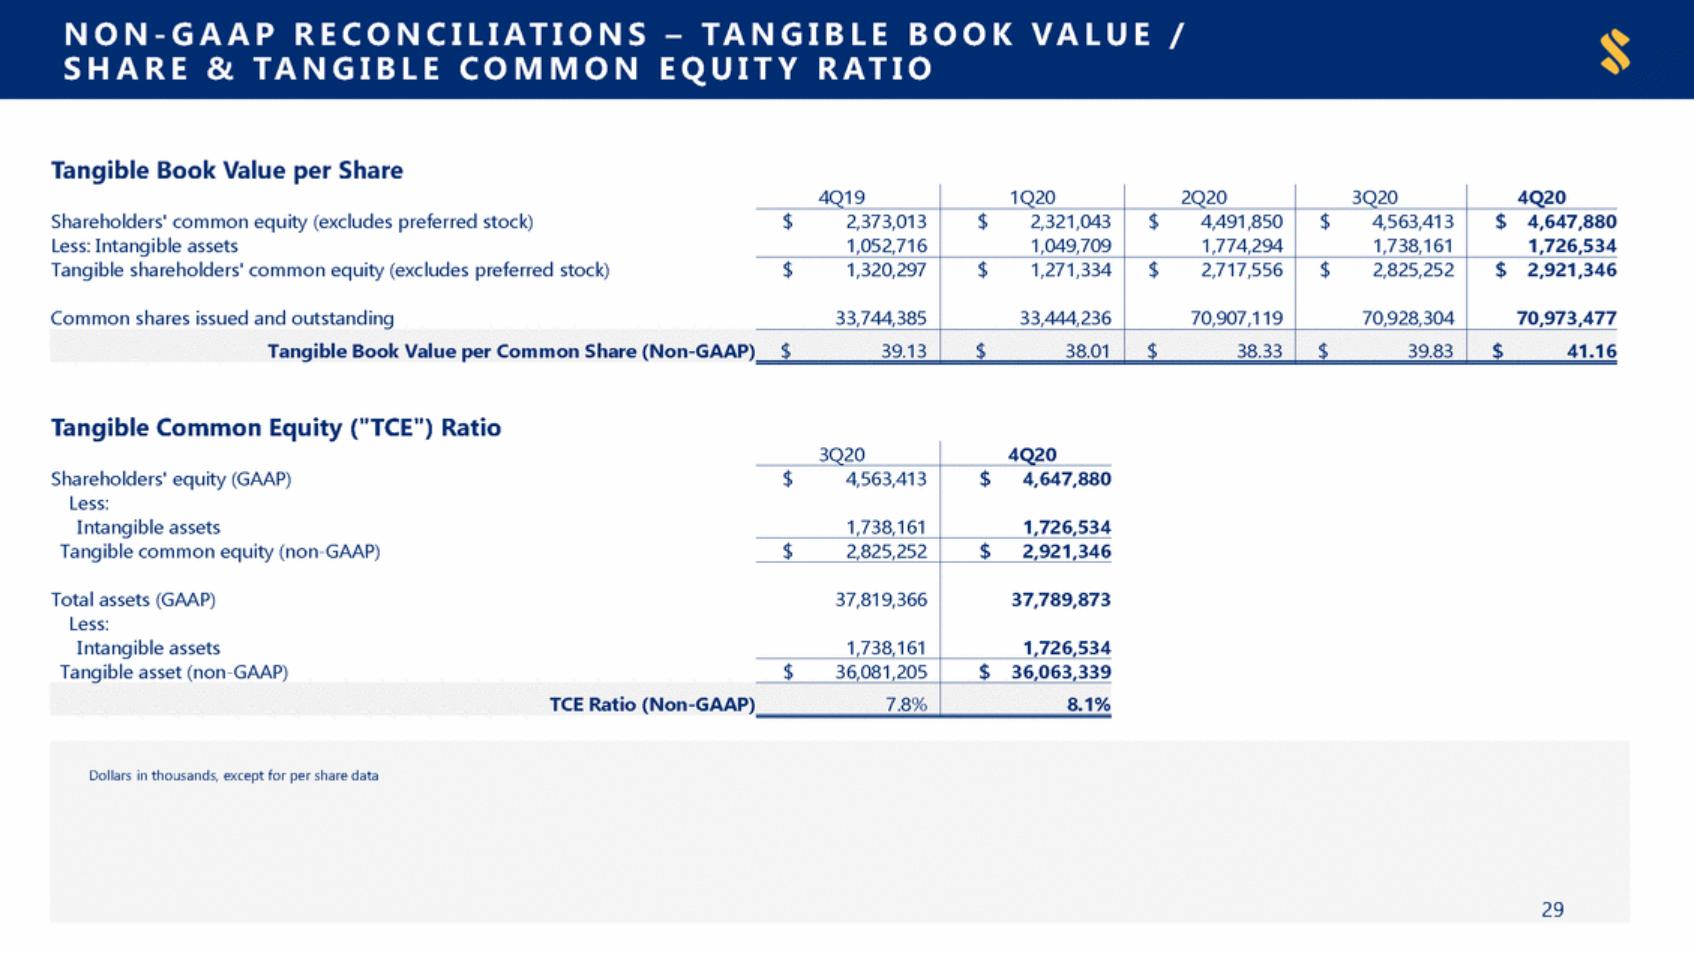
| N ON - GA A PR E C O N CILI A T IO N S –T ANG I B L EB O O K V AL UE / S HARE&T ANG I B L E C O M M O N E Q UI T Y R A TI O Tangible Book Value per Share Tangible Common Equity ("TCE") Ratio Dollars in thousands, except for per share data 29 Shareholders' equity (GAAP) Less: Intangible assets Tangible common equity (non-GAAP) Total assets (GAAP) Less: Intangible assets Tangible asset (non-GAAP) 3Q20 4Q20 $4,563,413 1,738,161 $4,647,880 1,726,534 $2,825,252 $2,921,346 37,819,366 1,738,161 37,789,873 1,726,534 $36,081,205 $36,063,339 TCE Ratio (Non-GAAP)7.8% 8.1% Shareholders' common equity (excludes preferred stock) Less: Intangible assets Tangible shareholders' common equity (excludes preferred stock) Common shares issued and outstanding 4Q19 1Q20 2Q20 3Q20 4Q20 $2,373,013 1,052,716 $2,321,043 1,049,709 $4,491,850 1,774,294 $4,563,413 1,738,161 $4,647,880 1,726,534 $1,320,297 33,744,385 $1,271,334 33,444,236 $2,717,556 70,907,119 $2,825,252 70,928,304 $2,921,346 70,973,477 Tangible Book Value per Common Share (Non-GAAP)$39.13 $38.01 $38.33 $39.83 $41.16 |
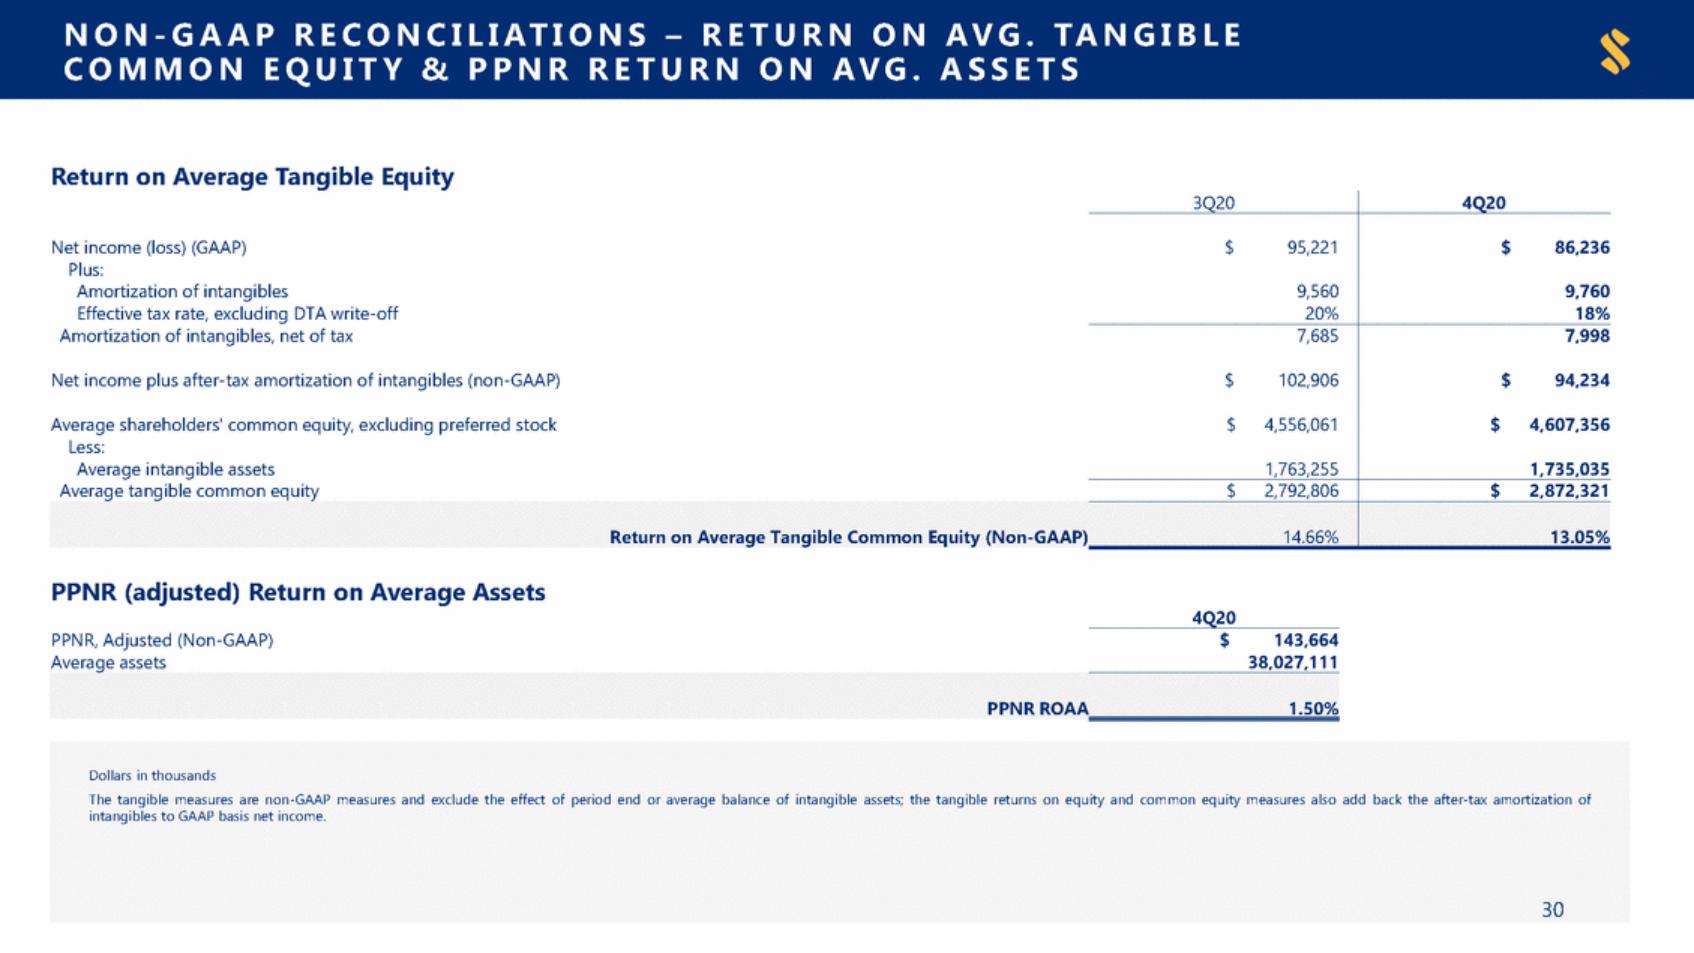
| N ON - GA A PR E C O N CILI A T IO N S–RE TURNO N A V G .T ANG I B L E AS S E TS C O M M O NE Q UI T Y& P P NR RE TURN O N A V G . Return on Average Tangible Equity PPNR (adjusted) Return on Average Assets 4Q20 PPNR, Adjusted (Non-GAAP) Average assets $143,664 38,027,111 Dollars in thousands The tangible measures are non-GAAP measures and exclude the effect of period end or average balance of intangible assets; the tangible returns on equity and common equity measures also add back the after-tax amortization of intangibles to GAAP basis net income. 30 PPNR ROAA1.50% Net income (loss) (GAAP) Plus: Amortization of intangibles Effective tax rate, excluding DTA write-off Amortization of intangibles, net of tax Net income plus after-tax amortization of intangibles (non-GAAP) Average shareholders' common equity, excluding preferred stock Less: Average intangible assets Average tangible common equity 3Q20 4Q20 $95,221 9,560 20% $86,236 9,760 18% 7,685 $102,906 $4,556,061 1,763,255 7,998 $94,234 $4,607,356 1,735,035 $2,792,806 $2,872,321 Return on Average Tangible Common Equity (Non-GAAP)14.66% 13.05% |
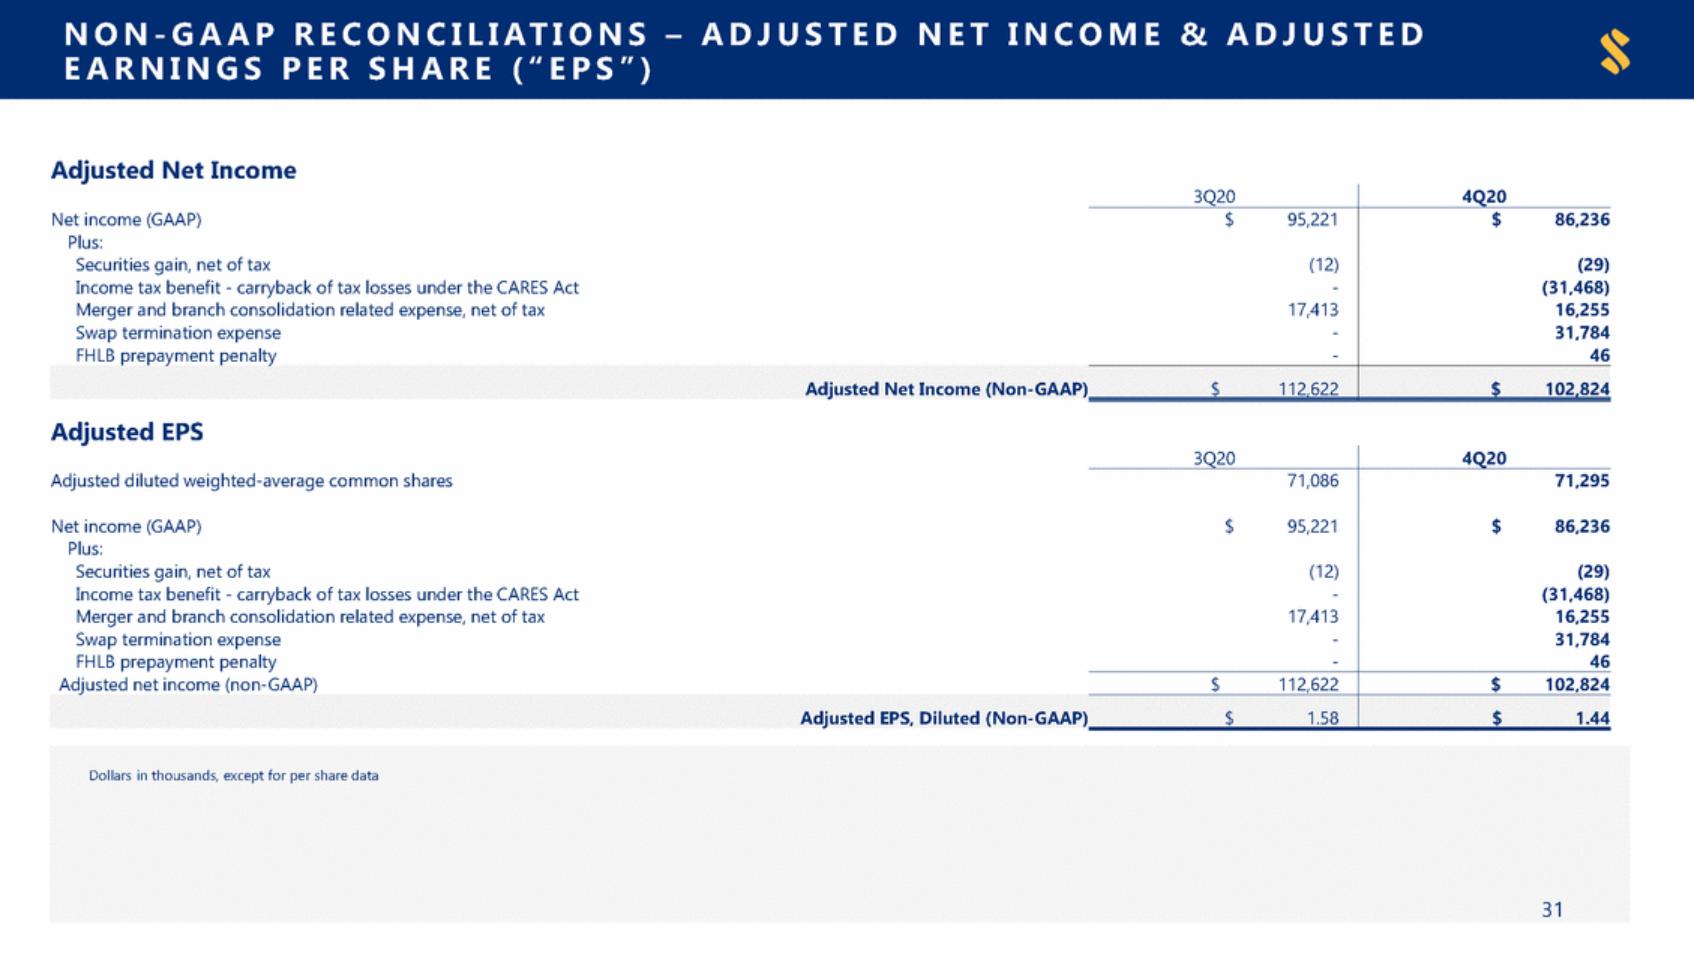
| N ON - GA A PR E C O N CILI A T IO N S– AD J US TE D NE T I NC O M E & AD J US TE D E ARNI NG SP E R S HARE ( “E P S ”) Adjusted Net Income Adjusted EPS Dollars in thousands, except for per share data 31 Adjusted diluted weighted-average common shares Net income (GAAP) Plus: Securities gain, net of tax Income tax benefit - carryback of tax losses under the CARES Act Merger and branch consolidation related expense, net of tax Swap termination expense FHLB prepayment penalty Adjusted net income (non-GAAP) 3Q20 4Q20 71,086 $95,221 (12) - 17,413 - - 71,295 $86,236 (29) (31,468) 16,255 31,784 46 $112,622 $102,824 Adjusted EPS, Diluted (Non-GAAP)$1.58 $1.44 Net income (GAAP) Plus: Securities gain, net of tax Income tax benefit - carryback of tax losses under the CARES Act Merger and branch consolidation related expense, net of tax Swap termination expense FHLB prepayment penalty 3Q20 4Q20 $95,221 (12) - 17,413 - - $86,236 (29) (31,468) 16,255 31,784 46 Adjusted Net Income (Non-GAAP)$112,622 $102,824 |
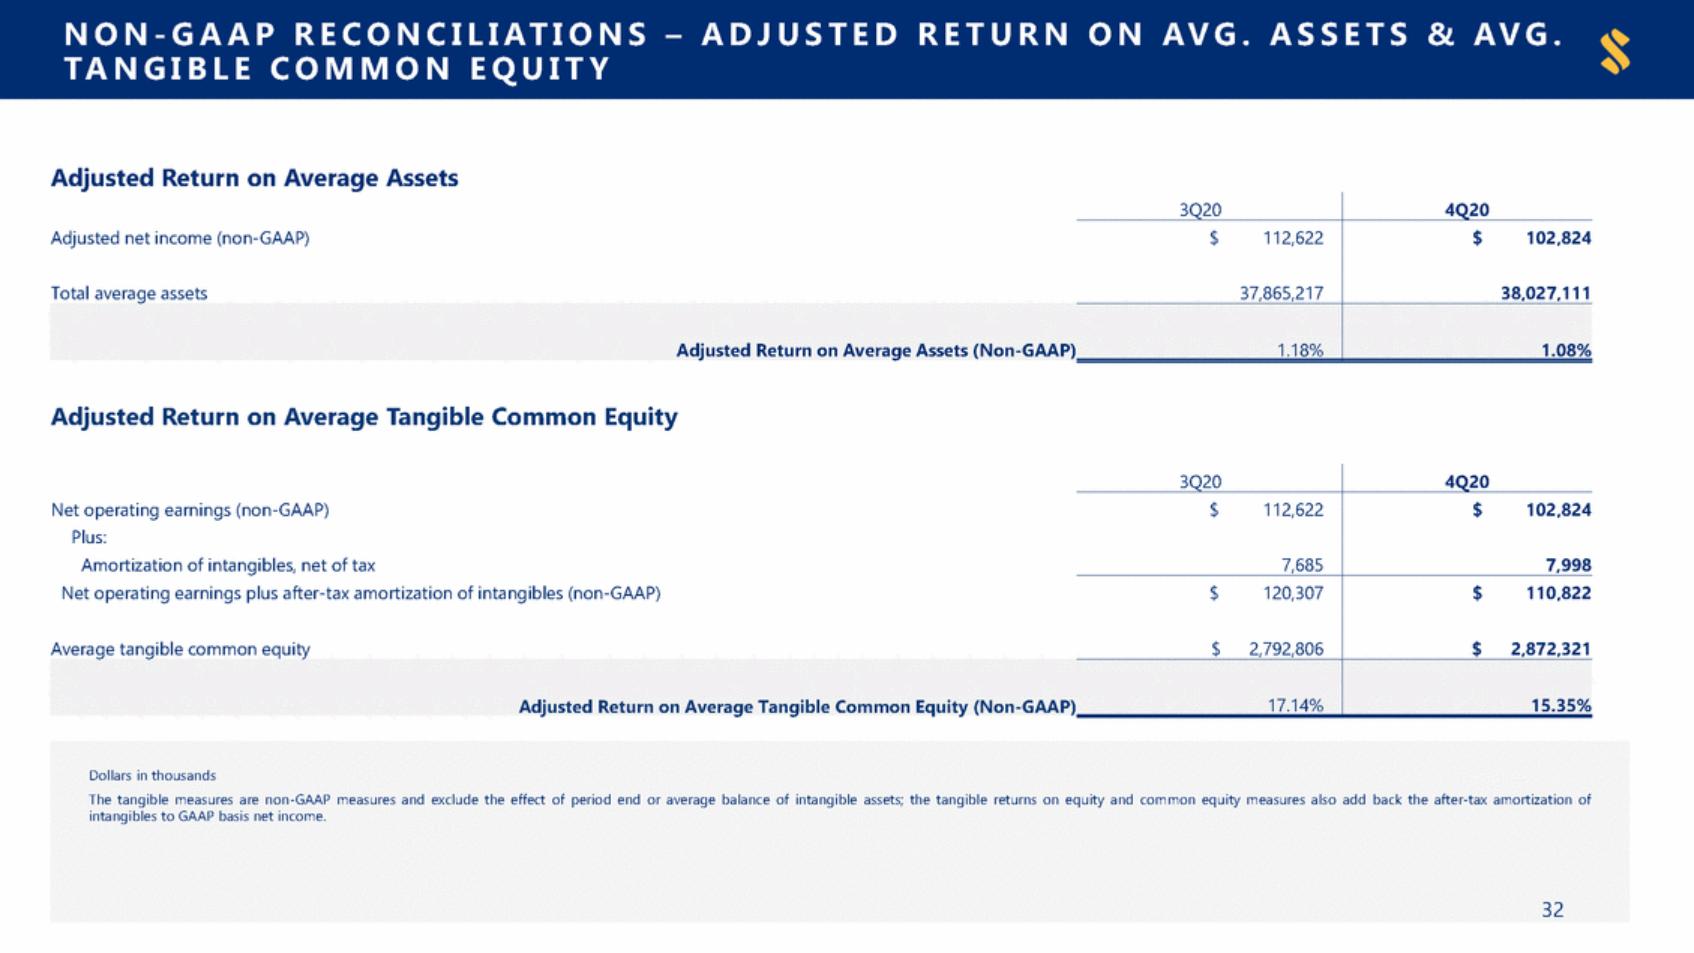
| N ON - GA A PR E C O N CILI A T IO N S – AD J US TE D RE TURN O N A V G . AS S E TS & A V G . T A N GIBLEC O MMO N E Q U IT Y Adjusted Return on Average Assets Adjusted Return on Average Tangible Common Equity Dollars in thousands The tangible measures are non-GAAP measures and exclude the effect of period end or average balance of intangible assets; the tangible returns on equity and common equity measures also add back the after-tax amortization of intangibles to GAAP basis net income. 32 Net operating earnings (non-GAAP) Plus: Amortization of intangibles, net of tax Net operating earnings plus after-tax amortization of intangibles (non-GAAP) Average tangible common equity 3Q20 4Q20 $112,622 7,685 $102,824 7,998 $120,307 $2,792,806 $110,822 $2,872,321 Adjusted Return on Average Tangible Common Equity (Non-GAAP)17.14% 15.35% Adjusted net income (non-GAAP) Total average assets 3Q20 4Q20 $112,622 37,865,217 $102,824 38,027,111 Adjusted Return on Average Assets (Non-GAAP)1.18% 1.08% |
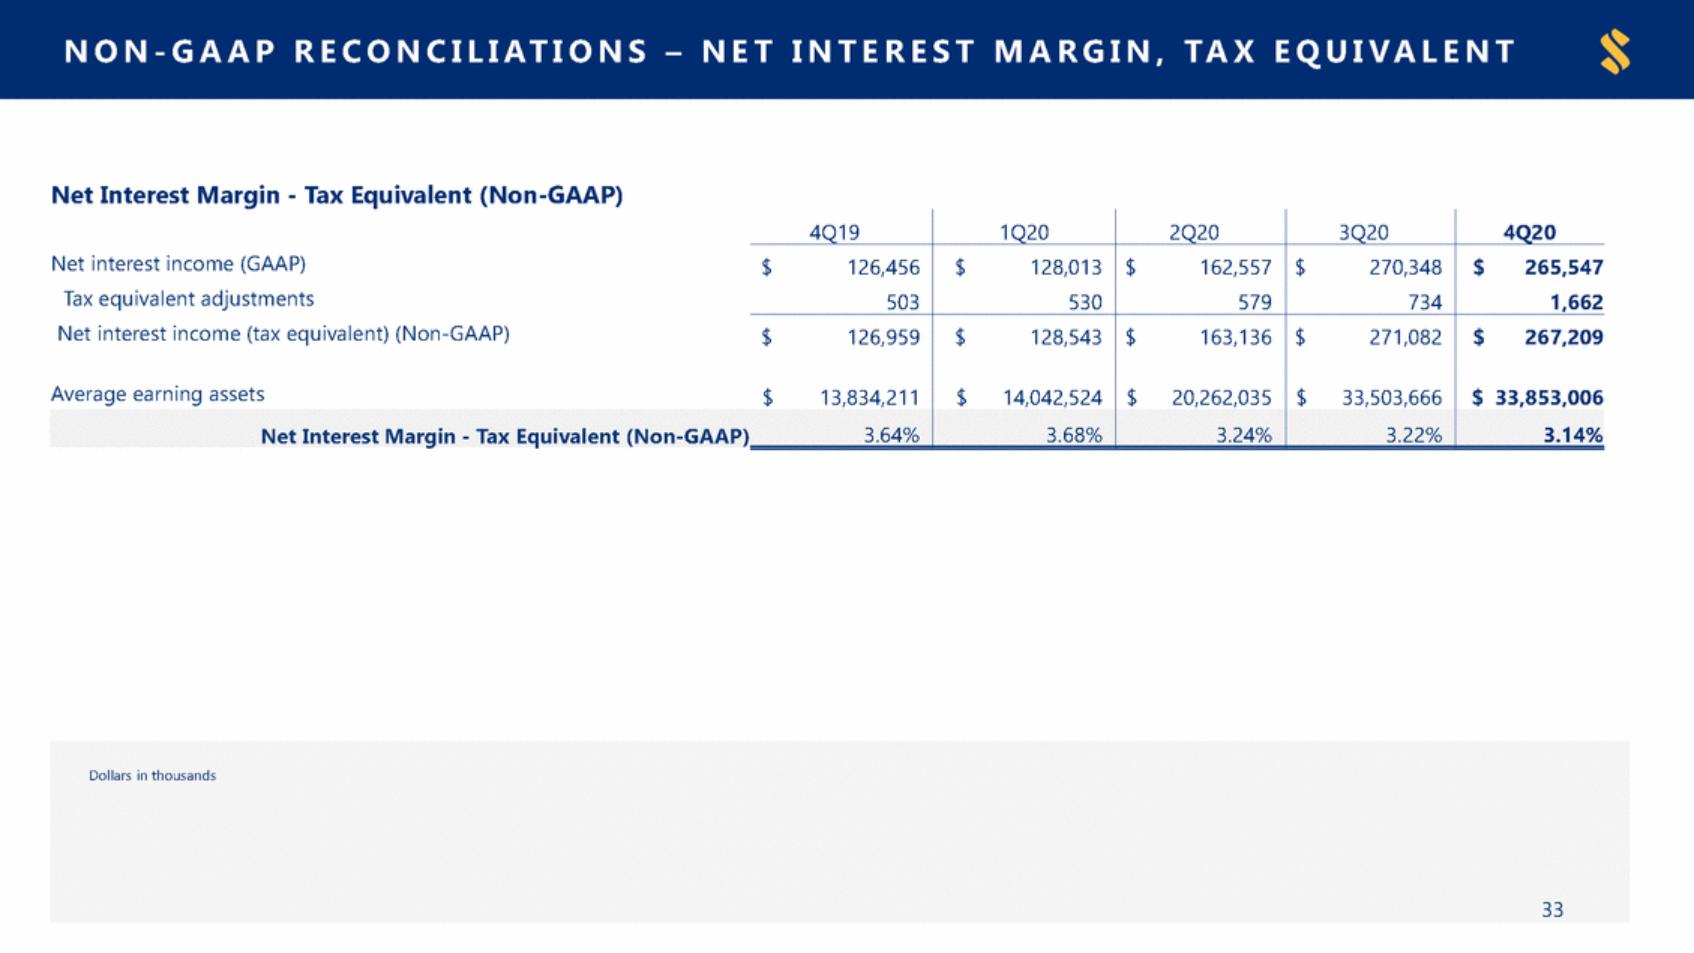
| N ON - GA A PR E C O N CILI A T IO N S–NE TI NTE RE S TM AR G I N,T AXE Q UI V AL E NT Net Interest Margin - Tax Equivalent (Non-GAAP) Dollars in thousands 33 Net interest income (GAAP) Tax equivalent adjustments Net interest income (tax equivalent) (Non-GAAP) Average earning assets 4Q19 1Q20 2Q20 3Q20 4Q20 $126,456 503 $128,013 530 $162,557 579 $270,348 734 $265,547 1,662 $126,959 $13,834,211 $128,543 $14,042,524 $163,136 $20,262,035 $271,082 $33,503,666 $267,209 $ 33,853,006 Net Interest Margin - Tax Equivalent (Non-GAAP)3.64% 3.68% 3.24% 3.22% 3.14% |
| [LOGO] |