Attached files
| file | filename |
|---|---|
| 8-K - 8-K - Regional Management Corp. | d19652d8k.htm |

Exhibit 99.1 ABS Investor Presentation January 25, 2021Exhibit 99.1 ABS Investor Presentation January 25, 2021

Legal Disclosures This document contains summarized information concerning Regional Management Corp. (the “Company”) and the Company’s business, operations, financial performance, and trends. No representation is made that the information in this document is complete. For additional financial, statistical, and business information, please see the Company’s most recent Annual Report on Form 10-K and Quarterly Reports on Form 10-Q filed with the U.S. Securities and Exchange Commission (the “SEC”), as well as the Company’s other reports filed with the SEC from time to time. Such reports are or will be available on the Company’s website (www.regionalmanagement.com) and on the SEC’s website (www.sec.gov). The information and opinions contained in this document are provided as of the date of this presentation and are subject to change without notice. This document has not been approved by any regulatory or supervisory authority. This presentation, the related remarks, and the responses to various questions may contain various “forward-looking statements” within the meaning of the Private Securities Litigation Reform Act of 1995. Forward-looking statements are not statements of historical fact but instead represent the Company’s expectations or beliefs concerning future events. Forward-looking statements include, without limitation, statements concerning future plans, objectives, goals, projections, strategies, events, or performance, and underlying assumptions and other statements related thereto. Words such as “may,” “will,” “should,” “likely,” “anticipates,” “expects,” “intends,” “plans,” “projects,” “believes,” “estimates,” “outlook,” and similar expressions may be used to identify these forward-looking statements. Such forward-looking statements speak only as of the date on which they were made and are about matters that are inherently subject to risks and uncertainties, many of which are outside of the control of the Company. As a result, actual performance and results may differ materially from those contemplated by these forward-looking statements. Therefore, investors should not place undue reliance on such statements. Factors that could cause actual results or performance to differ from the expectations expressed or implied in forward-looking statements include, but are not limited to, the following: changes in general economic conditions, including levels of unemployment and bankruptcies; the impact of the recent outbreak of a novel coronavirus (COVID-19), including on the Company’s access to liquidity and the credit risk of the Company’s finance receivable portfolio; risks associated with the Company’s ability to timely and effectively implement, transition to, and maintain the necessary information technology systems, infrastructure, processes, and controls to support its operations and initiatives; risks associated with the Company’s loan origination and servicing software system, including the risk of prolonged system outages; risks related to opening new branches, including the ability or inability to open new branches as planned; risks inherent in making loans, including credit risk, repayment risk, and value of collateral, which risks may increase in light of adverse or recessionary economic conditions; risks associated with the implementation of new underwriting models and processes, including as to the effectiveness of new custom scorecards; risks relating to the Company’s asset-backed securitization transactions; changes in interest rates; the risk that the Company’s existing sources of liquidity become insufficient to satisfy its needs or that its access to these sources becomes unexpectedly restricted; changes in federal, state, or local laws, regulations, or regulatory policies and practices, and risks associated with the manner in which laws and regulations are interpreted, implemented, and enforced; changes in accounting standards, rules, and interpretations, and the failure of related assumptions and estimates, including those associated with the implementation of current expected credit loss (CECL) accounting; the impact of changes in tax laws, guidance, and interpretations; the timing and amount of revenues that may be recognized by the Company; changes in current revenue and expense trends (including trends affecting delinquencies and credit losses); changes in the Company’s markets and general changes in the economy (particularly in the markets served by the Company); changes in the competitive environment in which the Company operates or a decrease in the demand for its products; the timing and amount of future cash dividend payments; risks related to acquisitions; changes in operating and administrative expenses; and the departure, transition, or replacement of key personnel. The foregoing factors and others are discussed in greater detail in the Company’s filings with the SEC. The COVID-19 pandemic may also magnify many of these risks and uncertainties. The Company cannot guarantee future events, results, actions, levels of activity, performance, or achievements. The Company will not update or revise forward-looking statements to reflect events or circumstances after the date of this presentation or to reflect the occurrence of unanticipated events or the non-occurrence of anticipated events, whether as a result of new information, future developments, or otherwise, except as required by law. 2Legal Disclosures This document contains summarized information concerning Regional Management Corp. (the “Company”) and the Company’s business, operations, financial performance, and trends. No representation is made that the information in this document is complete. For additional financial, statistical, and business information, please see the Company’s most recent Annual Report on Form 10-K and Quarterly Reports on Form 10-Q filed with the U.S. Securities and Exchange Commission (the “SEC”), as well as the Company’s other reports filed with the SEC from time to time. Such reports are or will be available on the Company’s website (www.regionalmanagement.com) and on the SEC’s website (www.sec.gov). The information and opinions contained in this document are provided as of the date of this presentation and are subject to change without notice. This document has not been approved by any regulatory or supervisory authority. This presentation, the related remarks, and the responses to various questions may contain various “forward-looking statements” within the meaning of the Private Securities Litigation Reform Act of 1995. Forward-looking statements are not statements of historical fact but instead represent the Company’s expectations or beliefs concerning future events. Forward-looking statements include, without limitation, statements concerning future plans, objectives, goals, projections, strategies, events, or performance, and underlying assumptions and other statements related thereto. Words such as “may,” “will,” “should,” “likely,” “anticipates,” “expects,” “intends,” “plans,” “projects,” “believes,” “estimates,” “outlook,” and similar expressions may be used to identify these forward-looking statements. Such forward-looking statements speak only as of the date on which they were made and are about matters that are inherently subject to risks and uncertainties, many of which are outside of the control of the Company. As a result, actual performance and results may differ materially from those contemplated by these forward-looking statements. Therefore, investors should not place undue reliance on such statements. Factors that could cause actual results or performance to differ from the expectations expressed or implied in forward-looking statements include, but are not limited to, the following: changes in general economic conditions, including levels of unemployment and bankruptcies; the impact of the recent outbreak of a novel coronavirus (COVID-19), including on the Company’s access to liquidity and the credit risk of the Company’s finance receivable portfolio; risks associated with the Company’s ability to timely and effectively implement, transition to, and maintain the necessary information technology systems, infrastructure, processes, and controls to support its operations and initiatives; risks associated with the Company’s loan origination and servicing software system, including the risk of prolonged system outages; risks related to opening new branches, including the ability or inability to open new branches as planned; risks inherent in making loans, including credit risk, repayment risk, and value of collateral, which risks may increase in light of adverse or recessionary economic conditions; risks associated with the implementation of new underwriting models and processes, including as to the effectiveness of new custom scorecards; risks relating to the Company’s asset-backed securitization transactions; changes in interest rates; the risk that the Company’s existing sources of liquidity become insufficient to satisfy its needs or that its access to these sources becomes unexpectedly restricted; changes in federal, state, or local laws, regulations, or regulatory policies and practices, and risks associated with the manner in which laws and regulations are interpreted, implemented, and enforced; changes in accounting standards, rules, and interpretations, and the failure of related assumptions and estimates, including those associated with the implementation of current expected credit loss (CECL) accounting; the impact of changes in tax laws, guidance, and interpretations; the timing and amount of revenues that may be recognized by the Company; changes in current revenue and expense trends (including trends affecting delinquencies and credit losses); changes in the Company’s markets and general changes in the economy (particularly in the markets served by the Company); changes in the competitive environment in which the Company operates or a decrease in the demand for its products; the timing and amount of future cash dividend payments; risks related to acquisitions; changes in operating and administrative expenses; and the departure, transition, or replacement of key personnel. The foregoing factors and others are discussed in greater detail in the Company’s filings with the SEC. The COVID-19 pandemic may also magnify many of these risks and uncertainties. The Company cannot guarantee future events, results, actions, levels of activity, performance, or achievements. The Company will not update or revise forward-looking statements to reflect events or circumstances after the date of this presentation or to reflect the occurrence of unanticipated events or the non-occurrence of anticipated events, whether as a result of new information, future developments, or otherwise, except as required by law. 2

Company OverviewCompany Overview
Company Highlights Clear Path Forward for Sustainable Long-Term Growth Successful Abundant Differentiated Market Growth Opportunity Strategy Deep Advanced Management Credit Tools Experience Modern Infrastructure 4Company Highlights Clear Path Forward for Sustainable Long-Term Growth Successful Abundant Differentiated Market Growth Opportunity Strategy Deep Advanced Management Credit Tools Experience Modern Infrastructure 4

Company Overview • Consumer Finance Installment Lender • 30+ years of operating history • Operating subsidiaries in each state • Bricks-and-Clicks model • 368 branches in 11 States as of September 30, 2020 • $1.06 billion total portfolio size • Headquartered in Greer, SC • Operations in the Southeast, Southwest, Mid-Atlantic, and Midwest • Near-Prime to Non-Prime customer base • Parent company is a Delaware corporation • Initial Public Offering in 2012 • Listed on NYSE • Ticker symbol is “RM” 5Company Overview • Consumer Finance Installment Lender • 30+ years of operating history • Operating subsidiaries in each state • Bricks-and-Clicks model • 368 branches in 11 States as of September 30, 2020 • $1.06 billion total portfolio size • Headquartered in Greer, SC • Operations in the Southeast, Southwest, Mid-Atlantic, and Midwest • Near-Prime to Non-Prime customer base • Parent company is a Delaware corporation • Initial Public Offering in 2012 • Listed on NYSE • Ticker symbol is “RM” 5
Public Company Discipline and Transparency § Full Transparency – Public SEC Filings and Disclosures § Internal Controls – SOX controls in place since 2013 § External Audits – RSM US LLP § Internal Audit – Covers all corporate office functions and branch activities § Compliance – 16-member team with Chief Compliance Officer reporting to the Board of Directors § Enterprise Risk Management – Identifies and manages significant company risks § Cybersecurity – Guided by National Institute of Standards and Technology (NIST) framework, rd coupled with 3 party assessments 6Public Company Discipline and Transparency § Full Transparency – Public SEC Filings and Disclosures § Internal Controls – SOX controls in place since 2013 § External Audits – RSM US LLP § Internal Audit – Covers all corporate office functions and branch activities § Compliance – 16-member team with Chief Compliance Officer reporting to the Board of Directors § Enterprise Risk Management – Identifies and manages significant company risks § Cybersecurity – Guided by National Institute of Standards and Technology (NIST) framework, rd coupled with 3 party assessments 6
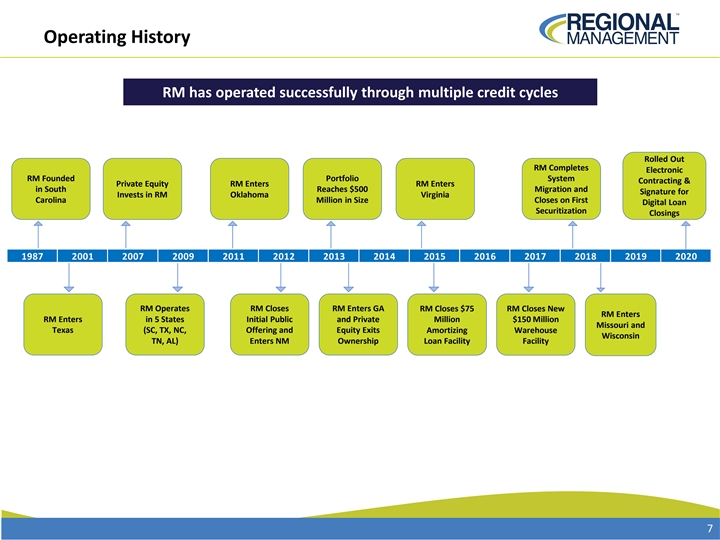
Operating History RM has operated successfully through multiple credit cycles Rolled Out RM Completes Electronic RM Founded Portfolio System Contracting & Private Equity RM Enters RM Enters in South Reaches $500 Migration and Signature for Invests in RM Oklahoma Virginia Carolina Million in Size Closes on First Digital Loan Securitization Closings 1987 2001 2007 2009 2011 2012 2013 2014 2015 2016 2017 2018 2019 2020 RM Operates RM Closes RM Enters GA RM Closes $75 RM Closes New RM Enters RM Enters in 5 States Initial Public and Private Million $150 Million Missouri and Texas (SC, TX, NC, Offering and Equity Exits Amortizing Warehouse Wisconsin TN, AL) Enters NM Ownership Loan Facility Facility 7Operating History RM has operated successfully through multiple credit cycles Rolled Out RM Completes Electronic RM Founded Portfolio System Contracting & Private Equity RM Enters RM Enters in South Reaches $500 Migration and Signature for Invests in RM Oklahoma Virginia Carolina Million in Size Closes on First Digital Loan Securitization Closings 1987 2001 2007 2009 2011 2012 2013 2014 2015 2016 2017 2018 2019 2020 RM Operates RM Closes RM Enters GA RM Closes $75 RM Closes New RM Enters RM Enters in 5 States Initial Public and Private Million $150 Million Missouri and Texas (SC, TX, NC, Offering and Equity Exits Amortizing Warehouse Wisconsin TN, AL) Enters NM Ownership Loan Facility Facility 7

Deep and Tested Management Experience • 30+ years of finance and accounting experience Rob Beck • Spent 29 years at Citi, including service as COO of the US Retail Bank President and CEO • Prior to joining Regional, was EVP and COO for the Leukemia and Lymphoma Society • 30+ years of consumer financial services experience John Schachtel • Prior to joining Regional, was COO at OneMain Financial COO • Extensive operations experience at CitiFinancial (now OneMain) • 20 years of financial services experience Harp Rana • Prior to joining Regional, was Managing Director, North America Retail Bank at Citigroup CFO • Held additional roles in business and finance at Citi, including Head of US Retail Deposit & Lending Products Manish • Nearly 20 years of credit and financial experience Parmar • Prior to joining Regional, was Chief Credit and Analytics Officer at Conn’s, Inc. Chief Credit • Held several senior roles at Discover Financial Services, including Head of Consumer Credit Risk Management Risk Officer Jim Ryan • 20+ years of consumer financial services experience Chief • Prior to joining Regional, was Chief Marketing Officer at OneMain Financial for 10 years Marketing • Held additional senior roles at CitiFinancial, including SVP of Operations and VP of Credit Risk Officer 8Deep and Tested Management Experience • 30+ years of finance and accounting experience Rob Beck • Spent 29 years at Citi, including service as COO of the US Retail Bank President and CEO • Prior to joining Regional, was EVP and COO for the Leukemia and Lymphoma Society • 30+ years of consumer financial services experience John Schachtel • Prior to joining Regional, was COO at OneMain Financial COO • Extensive operations experience at CitiFinancial (now OneMain) • 20 years of financial services experience Harp Rana • Prior to joining Regional, was Managing Director, North America Retail Bank at Citigroup CFO • Held additional roles in business and finance at Citi, including Head of US Retail Deposit & Lending Products Manish • Nearly 20 years of credit and financial experience Parmar • Prior to joining Regional, was Chief Credit and Analytics Officer at Conn’s, Inc. Chief Credit • Held several senior roles at Discover Financial Services, including Head of Consumer Credit Risk Management Risk Officer Jim Ryan • 20+ years of consumer financial services experience Chief • Prior to joining Regional, was Chief Marketing Officer at OneMain Financial for 10 years Marketing • Held additional senior roles at CitiFinancial, including SVP of Operations and VP of Credit Risk Officer 8

Experienced Board of Directors Board of Directors (Non-Employee Directors) Jonathan Al de Molina Steve Freiberg Mike Dunn Carlos Maria Roel Campos Jonathan Brown Sandra Johnson, Maria Brown Palomares Contreras-Sweet Ph.D. Contreras-Sweet - Former CEO and - Former CEO and - Senior Advisor - Chairman of - Former - Senior Counsel - Partner with - Founder, CEO, • Partner with Executive COO of GMAC to The Boston RM's Board of Administrator of at Hughes Basswood Capital and CTO of Global • Former Basswood Chairman of RM Administrator Consulting Group Directors U.S. Small Hubbard & Reed Management, LLC Mobile Finance, Capital - Former CFO of of U.S. Small Business LLP law firm Inc. Management, - Former Partner Bank of America - Former CEO of - President and - Formerly at Business LLC Administration of Brysam Global E*TRADE CEO of SMC - Practices in Sandelman - Founder and Administration - Former CEO of • Formerly at Partners Resources - Founder of securities CEO of SKJ Banc of America - Former Co- - Formerly at • Founder of Sandelman ProAmerica Bank regulation and Visioneering, LLC Securities Chairman/CEO of - Former CFO of - Former SVP of Goldman Sachs ProAmerica Partners corporate Citigroup Global Bank Citigroup Global Capital One - Former - Former CTO for • Formerly at governance Consumer Group Consumer Group Financial Corp. Secretary of CA's IBM Central, East • Former Goldman Sachs Business, - Former SEC and West Africa Secretary of - Former COO of Transportation, Commissioner CA’s Business, Citibank Latin - IBM Master and Housing Transportation America Inventor Agency and Housing Consumer Bank Agency 9Experienced Board of Directors Board of Directors (Non-Employee Directors) Jonathan Al de Molina Steve Freiberg Mike Dunn Carlos Maria Roel Campos Jonathan Brown Sandra Johnson, Maria Brown Palomares Contreras-Sweet Ph.D. Contreras-Sweet - Former CEO and - Former CEO and - Senior Advisor - Chairman of - Former - Senior Counsel - Partner with - Founder, CEO, • Partner with Executive COO of GMAC to The Boston RM's Board of Administrator of at Hughes Basswood Capital and CTO of Global • Former Basswood Chairman of RM Administrator Consulting Group Directors U.S. Small Hubbard & Reed Management, LLC Mobile Finance, Capital - Former CFO of of U.S. Small Business LLP law firm Inc. Management, - Former Partner Bank of America - Former CEO of - President and - Formerly at Business LLC Administration of Brysam Global E*TRADE CEO of SMC - Practices in Sandelman - Founder and Administration - Former CEO of • Formerly at Partners Resources - Founder of securities CEO of SKJ Banc of America - Former Co- - Formerly at • Founder of Sandelman ProAmerica Bank regulation and Visioneering, LLC Securities Chairman/CEO of - Former CFO of - Former SVP of Goldman Sachs ProAmerica Partners corporate Citigroup Global Bank Citigroup Global Capital One - Former - Former CTO for • Formerly at governance Consumer Group Consumer Group Financial Corp. Secretary of CA's IBM Central, East • Former Goldman Sachs Business, - Former SEC and West Africa Secretary of - Former COO of Transportation, Commissioner CA’s Business, Citibank Latin - IBM Master and Housing Transportation America Inventor Agency and Housing Consumer Bank Agency 9
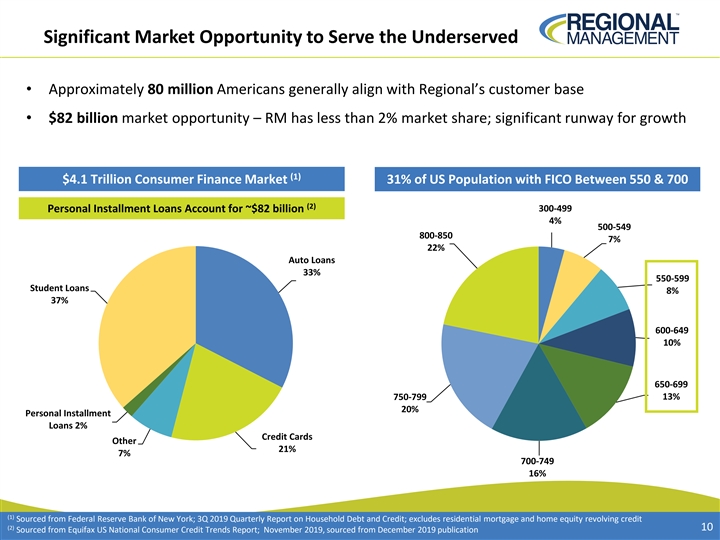
Significant Market Opportunity to Serve the Underserved • Approximately 80 million Americans generally align with Regional’s customer base • $82 billion market opportunity – RM has less than 2% market share; significant runway for growth (1) $4.1 Trillion Consumer Finance Market 31% of US Population with FICO Between 550 & 700 (2) Personal Installment Loans Account for ~$82 billion 300-499 4% 500-549 800-850 7% 22% Auto Loans 33% 550-599 Student Loans 8% 37% 600-649 10% 650-699 750-799 13% 20% Personal Installment Loans 2% Credit Cards Other 21% 7% 700-749 16% (1) Sourced from Federal Reserve Bank of New York; 3Q 2019 Quarterly Report on Household Debt and Credit; excludes residential mortgage and home equity revolving credit (2) 10 Sourced from Equifax US National Consumer Credit Trends Report; November 2019, sourced from December 2019 publicationSignificant Market Opportunity to Serve the Underserved • Approximately 80 million Americans generally align with Regional’s customer base • $82 billion market opportunity – RM has less than 2% market share; significant runway for growth (1) $4.1 Trillion Consumer Finance Market 31% of US Population with FICO Between 550 & 700 (2) Personal Installment Loans Account for ~$82 billion 300-499 4% 500-549 800-850 7% 22% Auto Loans 33% 550-599 Student Loans 8% 37% 600-649 10% 650-699 750-799 13% 20% Personal Installment Loans 2% Credit Cards Other 21% 7% 700-749 16% (1) Sourced from Federal Reserve Bank of New York; 3Q 2019 Quarterly Report on Household Debt and Credit; excludes residential mortgage and home equity revolving credit (2) 10 Sourced from Equifax US National Consumer Credit Trends Report; November 2019, sourced from December 2019 publication
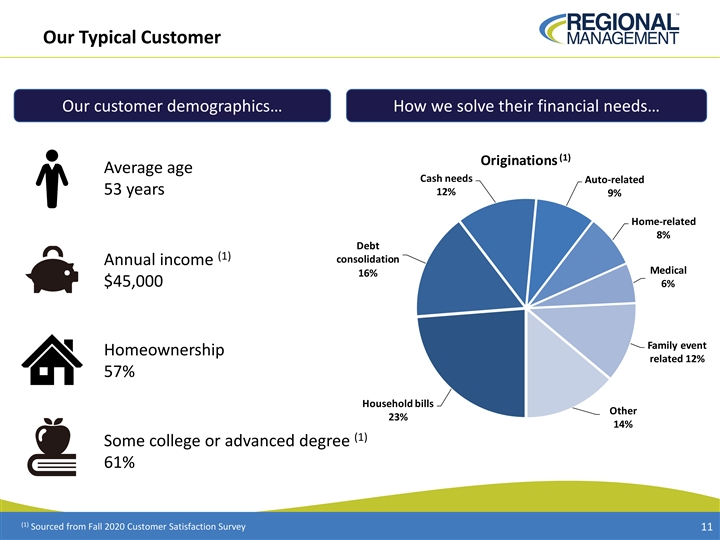
Our Typical Customer Our customer demographics… How we solve their financial needs… (1) Originations Average age Cash needs Auto-related 53 years 12% 9% Home-related 8% Debt (1) consolidation Annual income Medical 16% $45,000 6% Family event Homeownership related 12% 57% Household bills Other 23% 14% (1) Some college or advanced degree 61% (1) Sourced from Fall 2020 Customer Satisfaction Survey 11Our Typical Customer Our customer demographics… How we solve their financial needs… (1) Originations Average age Cash needs Auto-related 53 years 12% 9% Home-related 8% Debt (1) consolidation Annual income Medical 16% $45,000 6% Family event Homeownership related 12% 57% Household bills Other 23% 14% (1) Some college or advanced degree 61% (1) Sourced from Fall 2020 Customer Satisfaction Survey 11
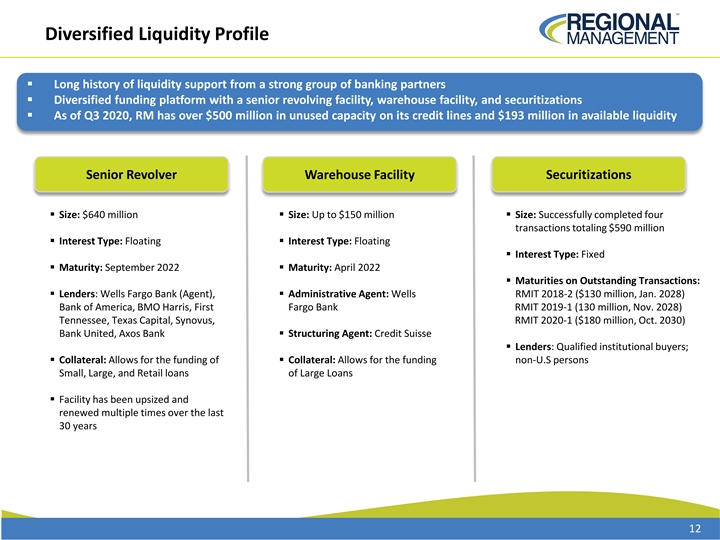
Diversified Liquidity Profile § Long history of liquidity support from a strong group of banking partners § Diversified funding platform with a senior revolving facility, warehouse facility, and securitizations § As of Q3 2020, RM has over $500 million in unused capacity on its credit lines and $193 million in available liquidity Senior Revolver Warehouse Facility Securitizations § Size: $640 million§ Size: Up to $150 million§ Size: Successfully completed four transactions totaling $590 million § Interest Type: Floating§ Interest Type: Floating § Interest Type: Fixed § Maturity: September 2022§ Maturity: April 2022 § Maturities on Outstanding Transactions: § Lenders: Wells Fargo Bank (Agent), § Administrative Agent: Wells RMIT 2018-2 ($130 million, Jan. 2028) Bank of America, BMO Harris, First Fargo Bank RMIT 2019-1 (130 million, Nov. 2028) Tennessee, Texas Capital, Synovus, RMIT 2020-1 ($180 million, Oct. 2030) Bank United, Axos Bank§ Structuring Agent: Credit Suisse § Lenders: Qualified institutional buyers; § Collateral: Allows for the funding of § Collateral: Allows for the funding non-U.S persons Small, Large, and Retail loans of Large Loans § Facility has been upsized and renewed multiple times over the last 30 years 12Diversified Liquidity Profile § Long history of liquidity support from a strong group of banking partners § Diversified funding platform with a senior revolving facility, warehouse facility, and securitizations § As of Q3 2020, RM has over $500 million in unused capacity on its credit lines and $193 million in available liquidity Senior Revolver Warehouse Facility Securitizations § Size: $640 million§ Size: Up to $150 million§ Size: Successfully completed four transactions totaling $590 million § Interest Type: Floating§ Interest Type: Floating § Interest Type: Fixed § Maturity: September 2022§ Maturity: April 2022 § Maturities on Outstanding Transactions: § Lenders: Wells Fargo Bank (Agent), § Administrative Agent: Wells RMIT 2018-2 ($130 million, Jan. 2028) Bank of America, BMO Harris, First Fargo Bank RMIT 2019-1 (130 million, Nov. 2028) Tennessee, Texas Capital, Synovus, RMIT 2020-1 ($180 million, Oct. 2030) Bank United, Axos Bank§ Structuring Agent: Credit Suisse § Lenders: Qualified institutional buyers; § Collateral: Allows for the funding of § Collateral: Allows for the funding non-U.S persons Small, Large, and Retail loans of Large Loans § Facility has been upsized and renewed multiple times over the last 30 years 12

Origination Channels and Branch Network Origination Channels and Branch Network

Omni-Channel Originations Provide Market Opportunities § Branches are the foundation of Regional’s multi-channel strategy. § Mail campaigns attract approximately 100,000 new customers per year to Regional. § Regional continues to expand digital channel / online lending capabilities to acquire customers. (1) (1) Branch Originated Non-Branch Originated Retailers Mail Web $202.3MM $343.0MM $7.3MM $133.6MM $23.3MM Furniture and Digital Lead Small Branch Large Branch Appliance Convenience Generation / Originated Loans Originated Loans Retailers Check Loans (368 branches as of (368 branches as of Partnership (Relationships with September 30, 2020) September 30, 2020) approx. 600 Affiliates retailers) Regional Branch Network Supports All Origination Channels Personal Relationships with Customers (1) YTD Origination Volume as of September 30, 2020 14Omni-Channel Originations Provide Market Opportunities § Branches are the foundation of Regional’s multi-channel strategy. § Mail campaigns attract approximately 100,000 new customers per year to Regional. § Regional continues to expand digital channel / online lending capabilities to acquire customers. (1) (1) Branch Originated Non-Branch Originated Retailers Mail Web $202.3MM $343.0MM $7.3MM $133.6MM $23.3MM Furniture and Digital Lead Small Branch Large Branch Appliance Convenience Generation / Originated Loans Originated Loans Retailers Check Loans (368 branches as of (368 branches as of Partnership (Relationships with September 30, 2020) September 30, 2020) approx. 600 Affiliates retailers) Regional Branch Network Supports All Origination Channels Personal Relationships with Customers (1) YTD Origination Volume as of September 30, 2020 14
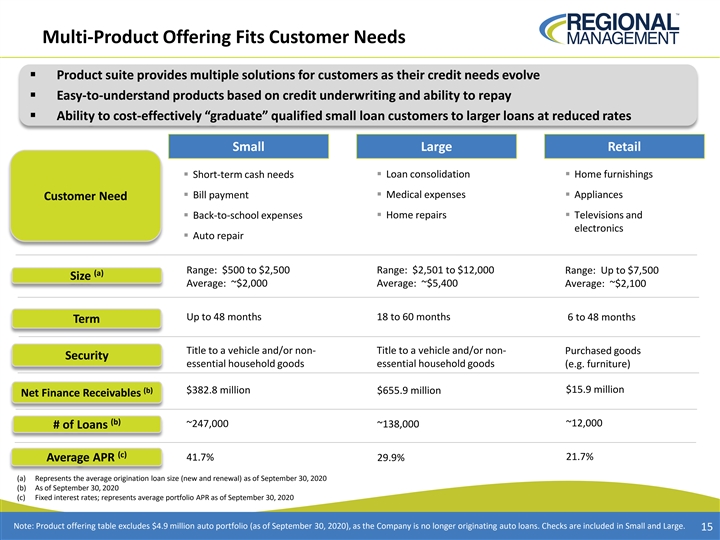
Multi-Product Offering Fits Customer Needs § Product suite provides multiple solutions for customers as their credit needs evolve § Easy-to-understand products based on credit underwriting and ability to repay § Ability to cost-effectively “graduate” qualified small loan customers to larger loans at reduced rates Small Large Retail § Short-term cash needs§ Loan consolidation§ Home furnishings § Bill payment§ Medical expenses§ Appliances Customer Need § Home repairs § Back-to-school expenses§ Televisions and electronics § Auto repair Range: $2,501 to $12,000 Range: $500 to $2,500 Range: Up to $7,500 (a) Size Average: ~$2,000 Average: ~$5,400 Average: ~$2,100 Up to 48 months 18 to 60 months 6 to 48 months Term Title to a vehicle and/or non- Title to a vehicle and/or non- Purchased goods Security essential household goods essential household goods (e.g. furniture) (b) $15.9 million $382.8 million $655.9 million Net Finance Receivables (b) ~247,000 ~12,000 ~138,000 # of Loans (c) 21.7% Average APR 41.7% 29.9% (a) Represents the average origination loan size (new and renewal) as of September 30, 2020 (b) As of September 30, 2020 (c) Fixed interest rates; represents average portfolio APR as of September 30, 2020 Note: Product offering table excludes $4.9 million auto portfolio (as of September 30, 2020), as the Company is no longer originating auto loans. Checks are included in Small and Large. 15Multi-Product Offering Fits Customer Needs § Product suite provides multiple solutions for customers as their credit needs evolve § Easy-to-understand products based on credit underwriting and ability to repay § Ability to cost-effectively “graduate” qualified small loan customers to larger loans at reduced rates Small Large Retail § Short-term cash needs§ Loan consolidation§ Home furnishings § Bill payment§ Medical expenses§ Appliances Customer Need § Home repairs § Back-to-school expenses§ Televisions and electronics § Auto repair Range: $2,501 to $12,000 Range: $500 to $2,500 Range: Up to $7,500 (a) Size Average: ~$2,000 Average: ~$5,400 Average: ~$2,100 Up to 48 months 18 to 60 months 6 to 48 months Term Title to a vehicle and/or non- Title to a vehicle and/or non- Purchased goods Security essential household goods essential household goods (e.g. furniture) (b) $15.9 million $382.8 million $655.9 million Net Finance Receivables (b) ~247,000 ~12,000 ~138,000 # of Loans (c) 21.7% Average APR 41.7% 29.9% (a) Represents the average origination loan size (new and renewal) as of September 30, 2020 (b) As of September 30, 2020 (c) Fixed interest rates; represents average portfolio APR as of September 30, 2020 Note: Product offering table excludes $4.9 million auto portfolio (as of September 30, 2020), as the Company is no longer originating auto loans. Checks are included in Small and Large. 15

Hybrid Approach to Growth § Multiple channels and products provide attractive market opportunities - Most loans serviced and collected through branches - Late-stage delinquencies collected through centralized collections group § Most branches with significant capacity to increase size of their portfolios (1) Ending Net Finance Receivables Per Branch Geographic Footprint $3,500 Date of 3,097 Entry: 2,981 2,879 $3,000 2,650 SC: 1987 11 2,439 $2,500 TX: 2001 2,151 NC: 2004 $2,000 17 19 TN: 2007 23 24 36 $1,500 15 AL: 2009 60 46 9 OK: 2011 108 $1,000 NM: 2012 $500 GA: 2013 VA: 2015 $- Current States of Operation MO: 2018 2016 2017 2018 2019 3Q 19 3Q 20 Attractive States for Expansion WI: 2018 (1) As of September 30, 2020 16 in thousandsHybrid Approach to Growth § Multiple channels and products provide attractive market opportunities - Most loans serviced and collected through branches - Late-stage delinquencies collected through centralized collections group § Most branches with significant capacity to increase size of their portfolios (1) Ending Net Finance Receivables Per Branch Geographic Footprint $3,500 Date of 3,097 Entry: 2,981 2,879 $3,000 2,650 SC: 1987 11 2,439 $2,500 TX: 2001 2,151 NC: 2004 $2,000 17 19 TN: 2007 23 24 36 $1,500 15 AL: 2009 60 46 9 OK: 2011 108 $1,000 NM: 2012 $500 GA: 2013 VA: 2015 $- Current States of Operation MO: 2018 2016 2017 2018 2019 3Q 19 3Q 20 Attractive States for Expansion WI: 2018 (1) As of September 30, 2020 16 in thousands

Branch Oversight and Audits Risk-Based Yearly Audits by Required Internal Audit Training Department Program Detailed Policy and Monthly Branch Self- Procedure Manuals Assessments Monthly Incentive Program Monitoring of Based on Delinquency, Critical Profitability & Growth Analytics Detailed Supervisory Visits at Least 2 Times per Year by District Supervisors 17Branch Oversight and Audits Risk-Based Yearly Audits by Required Internal Audit Training Department Program Detailed Policy and Monthly Branch Self- Procedure Manuals Assessments Monthly Incentive Program Monitoring of Based on Delinquency, Critical Profitability & Growth Analytics Detailed Supervisory Visits at Least 2 Times per Year by District Supervisors 17

UnderwritingUnderwriting

Robust Loan Approval Process § Custom automated decision engine used to determine if customer qualifies for product offerings § Product offering is based on risk profile of customer and their ability to repay § Credit exceptions are administered by central underwriting team Determine Review of Collateral to Customer Secure Loan Financials Review Credit Underwriting Custom Exceptions Credit / Home Application Initial Decision Sent to Underwriting Office Process Decision Engine Home Office Process Credit Credit Book New Loan Final Decision Underwriting Decision Send to Branch 19Robust Loan Approval Process § Custom automated decision engine used to determine if customer qualifies for product offerings § Product offering is based on risk profile of customer and their ability to repay § Credit exceptions are administered by central underwriting team Determine Review of Collateral to Customer Secure Loan Financials Review Credit Underwriting Custom Exceptions Credit / Home Application Initial Decision Sent to Underwriting Office Process Decision Engine Home Office Process Credit Credit Book New Loan Final Decision Underwriting Decision Send to Branch 19
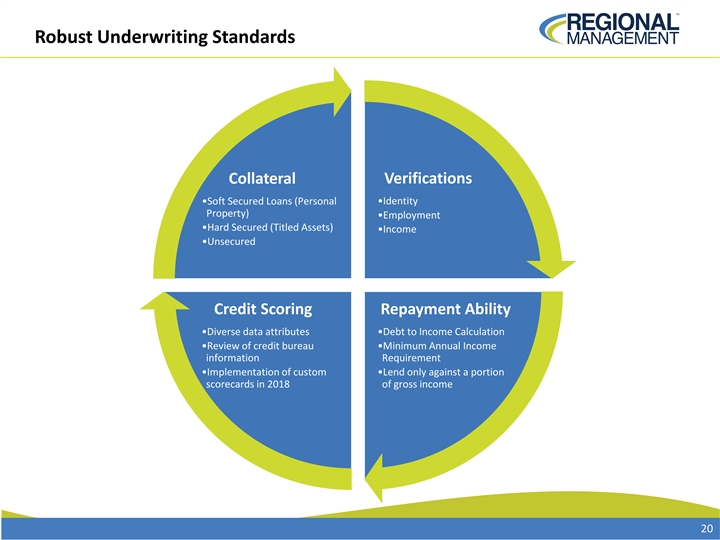
Robust Underwriting Standards Collateral Verifications •Identity •Soft Secured Loans (Personal Property) •Employment •Hard Secured (Titled Assets) •Income •Unsecured Credit Scoring Repayment Ability •Diverse data attributes •Debt to Income Calculation •Review of credit bureau •Minimum Annual Income information Requirement •Implementation of custom •Lend only against a portion scorecards in 2018 of gross income 20Robust Underwriting Standards Collateral Verifications •Identity •Soft Secured Loans (Personal Property) •Employment •Hard Secured (Titled Assets) •Income •Unsecured Credit Scoring Repayment Ability •Diverse data attributes •Debt to Income Calculation •Review of credit bureau •Minimum Annual Income information Requirement •Implementation of custom •Lend only against a portion scorecards in 2018 of gross income 20

Origination Characteristics Origination Characteristics

<=36% Portfolio Breakdown As of 9/30: $900 • Large: 66% $800 • Small: 19% $700 • Checks: 15% $600 $500 $400 $300 $200 $100 $0 Large Branch Small Branch Checks 80% of RM Total Portfolio is <=36% APR as of Q3 2020 22 In Millions<=36% Portfolio Breakdown As of 9/30: $900 • Large: 66% $800 • Small: 19% $700 • Checks: 15% $600 $500 $400 $300 $200 $100 $0 Large Branch Small Branch Checks 80% of RM Total Portfolio is <=36% APR as of Q3 2020 22 In Millions

<=36% Origination Metrics by Product FICO Original Term 680 50 45 660 40 640 35 620 30 25 600 20 580 15 560 Large WA Original Term Check WA Original Term Large WA FICO Check WA FICO Small WA FICO Small WA Original Term APR Monthly Payment 225 35 200 33 175 150 31 125 29 100 27 75 25 Large Avg. Monthly Pmt Check Avg. Monthly Pmt Large WA APR Check WA APR Small WA APR Small Avg. Monthly Pmt 23<=36% Origination Metrics by Product FICO Original Term 680 50 45 660 40 640 35 620 30 25 600 20 580 15 560 Large WA Original Term Check WA Original Term Large WA FICO Check WA FICO Small WA FICO Small WA Original Term APR Monthly Payment 225 35 200 33 175 150 31 125 29 100 27 75 25 Large Avg. Monthly Pmt Check Avg. Monthly Pmt Large WA APR Check WA APR Small WA APR Small Avg. Monthly Pmt 23
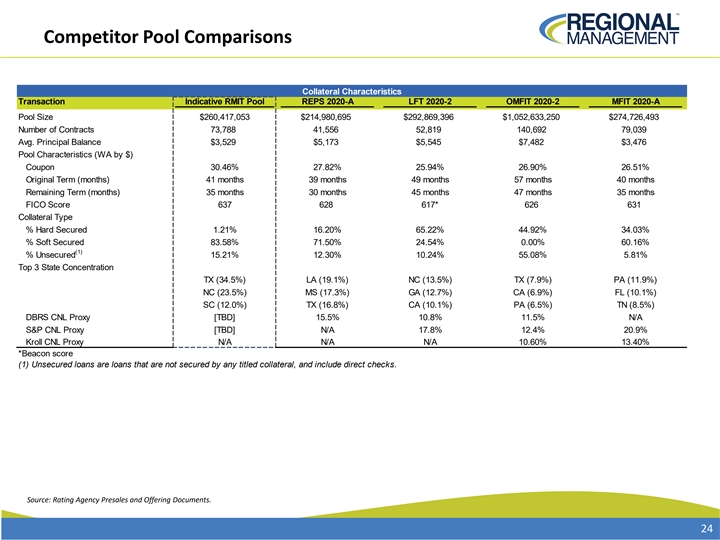
Competitor Pool Comparisons Collateral Characteristics Transaction Indicative RMIT Pool REPS 2020-A LFT 2020-2 OMFIT 2020-2 MFIT 2020-A Pool Size $260,417,053 $214,980,695 $292,869,396 $1,052,633,250 $274,726,493 Number of Contracts 73,788 41,556 52,819 140,692 79,039 Avg. Principal Balance $3,529 $5,173 $5,545 $7,482 $3,476 Pool Characteristics (WA by $) Coupon 30.46% 27.82% 25.94% 26.90% 26.51% Original Term (months) 41 months 39 months 49 months 57 months 40 months Remaining Term (months) 35 months 30 months 45 months 47 months 35 months FICO Score 637 628 617* 626 631 Collateral Type % Hard Secured 1.21% 16.20% 65.22% 44.92% 34.03% % Soft Secured 83.58% 71.50% 24.54% 0.00% 60.16% (1) % Unsecured 15.21% 12.30% 10.24% 55.08% 5.81% Top 3 State Concentration TX (34.5%) LA (19.1%) NC (13.5%) TX (7.9%) PA (11.9%) NC (23.5%) MS (17.3%) GA (12.7%) CA (6.9%) FL (10.1%) SC (12.0%) TX (16.8%) CA (10.1%) PA (6.5%) TN (8.5%) DBRS CNL Proxy [TBD] 15.5% 10.8% 11.5% N/A S&P CNL Proxy [TBD] N/A 17.8% 12.4% 20.9% Kroll CNL Proxy N/A N/A N/A 10.60% 13.40% *Beacon score (1) Unsecured loans are loans that are not secured by any titled collateral, and include direct checks. Source: Rating Agency Presales and Offering Documents. 24Competitor Pool Comparisons Collateral Characteristics Transaction Indicative RMIT Pool REPS 2020-A LFT 2020-2 OMFIT 2020-2 MFIT 2020-A Pool Size $260,417,053 $214,980,695 $292,869,396 $1,052,633,250 $274,726,493 Number of Contracts 73,788 41,556 52,819 140,692 79,039 Avg. Principal Balance $3,529 $5,173 $5,545 $7,482 $3,476 Pool Characteristics (WA by $) Coupon 30.46% 27.82% 25.94% 26.90% 26.51% Original Term (months) 41 months 39 months 49 months 57 months 40 months Remaining Term (months) 35 months 30 months 45 months 47 months 35 months FICO Score 637 628 617* 626 631 Collateral Type % Hard Secured 1.21% 16.20% 65.22% 44.92% 34.03% % Soft Secured 83.58% 71.50% 24.54% 0.00% 60.16% (1) % Unsecured 15.21% 12.30% 10.24% 55.08% 5.81% Top 3 State Concentration TX (34.5%) LA (19.1%) NC (13.5%) TX (7.9%) PA (11.9%) NC (23.5%) MS (17.3%) GA (12.7%) CA (6.9%) FL (10.1%) SC (12.0%) TX (16.8%) CA (10.1%) PA (6.5%) TN (8.5%) DBRS CNL Proxy [TBD] 15.5% 10.8% 11.5% N/A S&P CNL Proxy [TBD] N/A 17.8% 12.4% 20.9% Kroll CNL Proxy N/A N/A N/A 10.60% 13.40% *Beacon score (1) Unsecured loans are loans that are not secured by any titled collateral, and include direct checks. Source: Rating Agency Presales and Offering Documents. 24

Historical Credit Performance Historical Credit Performance

<=36% Portfolio Trends (Small, Large, Check) 12.0% 10.0% 8.0% 6.0% 4.0% 2.0% 0.0% Gross Loss % 60+ Delinquency % All quarter end values are annualized for losses Note: Gross loss numbers do not include benefit of non-file payments 26<=36% Portfolio Trends (Small, Large, Check) 12.0% 10.0% 8.0% 6.0% 4.0% 2.0% 0.0% Gross Loss % 60+ Delinquency % All quarter end values are annualized for losses Note: Gross loss numbers do not include benefit of non-file payments 26
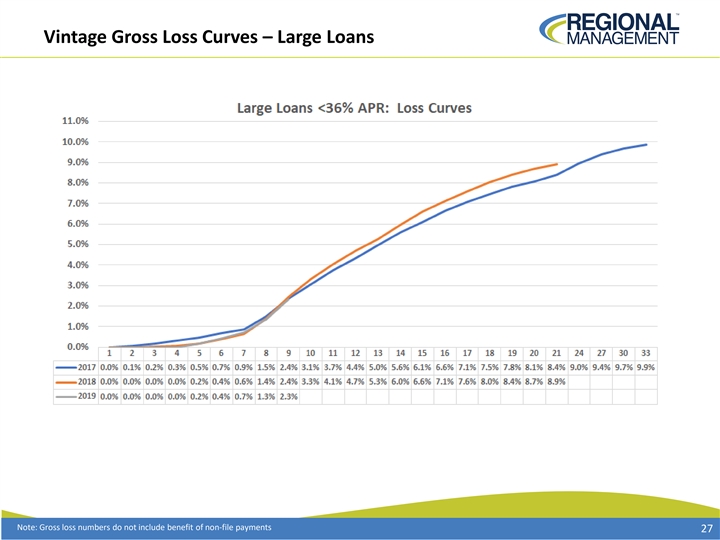
Vintage Gross Loss Curves – Large Loans Note: Gross loss numbers do not include benefit of non-file payments 27Vintage Gross Loss Curves – Large Loans Note: Gross loss numbers do not include benefit of non-file payments 27

Vintage Gross Loss Curves – Small Loans Note: Gross loss numbers do not include benefit of non-file payments 28Vintage Gross Loss Curves – Small Loans Note: Gross loss numbers do not include benefit of non-file payments 28

Vintage Gross Loss Curves – Checks Note: Gross loss numbers do not include benefit of non-file payments 29Vintage Gross Loss Curves – Checks Note: Gross loss numbers do not include benefit of non-file payments 29

RMC 30+ Delinquency Trend 30RMC 30+ Delinquency Trend 30

Historical Loss and Delinquency Peer Comparison Cumulative Net Loss • As seen in the following graphs, Regional’s term ABS transactions have performed in line with its branch-based 20% competitors on a cumulative net loss and delinquency 18% basis. 16% 14% 12% 10% 8% 6% 4% 2% 0% 1 3 5 7 9 11 13 15 17 19 21 23 25 27 29 31 33 35 RMIT 2018-1 RMIT 2018-2 RMIT 2019-1 RMIT 2020-1 OMFIT 2018-1 OMFIT 2018-2 OMFIT 2019-1 OMFIT 2019-2 OMFIT 2020-1 OMIT 2020-2 REPS 2019-A REPS 2020-A LFT 2018-1 LFT 2018-2 LFT 2019-1 LFT 2019-2 MFIT 2018-A MFIT 2019-A MFIT 2020-A % Delinquencies 30+ Days % Delinquencies 60+ Days 10% 10% 9% 9% 8% 8% 7% 7% 6% 6% 5% 5% 4% 4% 3% 3% 2% 2% 1% 1% 0% 0% 1 3 5 7 9 11 13 15 17 19 21 23 25 27 29 31 33 35 1 3 5 7 9 11 13 15 17 19 21 23 25 27 29 31 33 35 RMIT 2018-1 RMIT 2018-2 RMIT 2019-1 RMIT 2020-1 OMFIT 2018-1 RMIT 2018-1 RMIT 2018-2 RMIT 2019-1 RMIT 2020-1 OMFIT 2018-1 OMFIT 2018-2 OMFIT 2019-1 OMFIT 2019-2 OMFIT 2020-1 OMIT 2020-2 OMFIT 2018-2 OMFIT 2019-1 OMFIT 2019-2 OMFIT 2020-1 OMIT 2020-2 REPS 2019-A REPS 2020-A LFT 2018-1 LFT 2018-2 LFT 2019-1 REPS 2019-A REPS 2020-A LFT 2018-1 LFT 2018-2 LFT 2019-1 LFT 2019-2 MFIT 2018-A MFIT 2019-A MFIT 2020-A LFT 2019-2 MFIT 2018-A MFIT 2019-A MFIT 2020-A Source: Intex as of 1/15/2021. 31Historical Loss and Delinquency Peer Comparison Cumulative Net Loss • As seen in the following graphs, Regional’s term ABS transactions have performed in line with its branch-based 20% competitors on a cumulative net loss and delinquency 18% basis. 16% 14% 12% 10% 8% 6% 4% 2% 0% 1 3 5 7 9 11 13 15 17 19 21 23 25 27 29 31 33 35 RMIT 2018-1 RMIT 2018-2 RMIT 2019-1 RMIT 2020-1 OMFIT 2018-1 OMFIT 2018-2 OMFIT 2019-1 OMFIT 2019-2 OMFIT 2020-1 OMIT 2020-2 REPS 2019-A REPS 2020-A LFT 2018-1 LFT 2018-2 LFT 2019-1 LFT 2019-2 MFIT 2018-A MFIT 2019-A MFIT 2020-A % Delinquencies 30+ Days % Delinquencies 60+ Days 10% 10% 9% 9% 8% 8% 7% 7% 6% 6% 5% 5% 4% 4% 3% 3% 2% 2% 1% 1% 0% 0% 1 3 5 7 9 11 13 15 17 19 21 23 25 27 29 31 33 35 1 3 5 7 9 11 13 15 17 19 21 23 25 27 29 31 33 35 RMIT 2018-1 RMIT 2018-2 RMIT 2019-1 RMIT 2020-1 OMFIT 2018-1 RMIT 2018-1 RMIT 2018-2 RMIT 2019-1 RMIT 2020-1 OMFIT 2018-1 OMFIT 2018-2 OMFIT 2019-1 OMFIT 2019-2 OMFIT 2020-1 OMIT 2020-2 OMFIT 2018-2 OMFIT 2019-1 OMFIT 2019-2 OMFIT 2020-1 OMIT 2020-2 REPS 2019-A REPS 2020-A LFT 2018-1 LFT 2018-2 LFT 2019-1 REPS 2019-A REPS 2020-A LFT 2018-1 LFT 2018-2 LFT 2019-1 LFT 2019-2 MFIT 2018-A MFIT 2019-A MFIT 2020-A LFT 2019-2 MFIT 2018-A MFIT 2019-A MFIT 2020-A Source: Intex as of 1/15/2021. 31

Servicing Servicing

Servicing Overview Regional employs a hybrid strategy of localized collection efforts through the branches and centralized support for late-stage collections In-Branch Servicing Centralized Collections • Collection efforts primarily • Late stage co-collection support for the branches by performed in the branches centralized collectors located in the home office • High-touch relationship allows • 100% electronic payments branches to quickly anticipate and proactively resolve repayment • Bankruptcy and post-charge-off collections handled problems centrally • Combination of electronic • Qualifying charged-off accounts are sold to a third payments, cash, and checks party debt buyer 2 to 3 months after charge-off • Electronic Payments are above 70% 33Servicing Overview Regional employs a hybrid strategy of localized collection efforts through the branches and centralized support for late-stage collections In-Branch Servicing Centralized Collections • Collection efforts primarily • Late stage co-collection support for the branches by performed in the branches centralized collectors located in the home office • High-touch relationship allows • 100% electronic payments branches to quickly anticipate and proactively resolve repayment • Bankruptcy and post-charge-off collections handled problems centrally • Combination of electronic • Qualifying charged-off accounts are sold to a third payments, cash, and checks party debt buyer 2 to 3 months after charge-off • Electronic Payments are above 70% 33

Loss Mitigation / Borrower Assistance Tools § Tools are designed to lower overall loss in the portfolio by helping qualified customers § These programs are targeted toward helping customers navigate through short term cash flow issues Renewal Balance Only Deferral (Delinquent Renewal) § Refinance of previous loan similar to a § Utilized for customers with short term / renewal temporary hardships § Provides assistance to customers that are § Allows customer to defer their monthly payment experiencing short term financial which solves immediate cash flow concerns hardships and cash flow issues § Standard Policy: No more than 2 in a rolling 12 § Policy: Max of 1 per 6 months months. Generally a payment is required. 34Loss Mitigation / Borrower Assistance Tools § Tools are designed to lower overall loss in the portfolio by helping qualified customers § These programs are targeted toward helping customers navigate through short term cash flow issues Renewal Balance Only Deferral (Delinquent Renewal) § Refinance of previous loan similar to a § Utilized for customers with short term / renewal temporary hardships § Provides assistance to customers that are § Allows customer to defer their monthly payment experiencing short term financial which solves immediate cash flow concerns hardships and cash flow issues § Standard Policy: No more than 2 in a rolling 12 § Policy: Max of 1 per 6 months months. Generally a payment is required. 34

Payment Channel Mix Electronic Payments In Branch Payments 100% 100% 90% 90% 80% 80% 70% 70% 60% 60% 50% 50% 40% 40% 30% 30% 20% 20% 10% 10% 0% 0% % Electronic Payments In Branch Recurring Payments Increased Payment Channel Options 14% • Steady increase in electronic payments 12% 10% • Contributing to less In branch payments 8% 6% • And increasing recurring payments 4% 2% • Adding convenience to our customers 0% • Reducing risk of decentralized network to securitization investors Recurring 35 Mar-2018 Jun-2019 May-2018 Jul-2019 Jul-2018 Aug-2019 Sep-2018 Sep-2019 Nov-2018 Oct-2019 Jan-2019 Nov-2019 Mar-2019 Dec-2019 May-2019 Jan-2020 Jul-2019 Feb-2020 Sep-2019 Mar-2020 Nov-2019 Apr-2020 Jan-2020 May-2020 Mar-2020 Jun-2020 May-2020 Jul-2020 Jul-2020 Aug-2020 Sep-2020 Sep-2020 Mar-2018 May-2018 Jul-2018 Sep-2018 Nov-2018 Jan-2019 Mar-2019 May-2019 Jul-2019 Sep-2019 Nov-2019 Jan-2020 Mar-2020 May-2020 Jul-2020 Sep-2020Payment Channel Mix Electronic Payments In Branch Payments 100% 100% 90% 90% 80% 80% 70% 70% 60% 60% 50% 50% 40% 40% 30% 30% 20% 20% 10% 10% 0% 0% % Electronic Payments In Branch Recurring Payments Increased Payment Channel Options 14% • Steady increase in electronic payments 12% 10% • Contributing to less In branch payments 8% 6% • And increasing recurring payments 4% 2% • Adding convenience to our customers 0% • Reducing risk of decentralized network to securitization investors Recurring 35 Mar-2018 Jun-2019 May-2018 Jul-2019 Jul-2018 Aug-2019 Sep-2018 Sep-2019 Nov-2018 Oct-2019 Jan-2019 Nov-2019 Mar-2019 Dec-2019 May-2019 Jan-2020 Jul-2019 Feb-2020 Sep-2019 Mar-2020 Nov-2019 Apr-2020 Jan-2020 May-2020 Mar-2020 Jun-2020 May-2020 Jul-2020 Jul-2020 Aug-2020 Sep-2020 Sep-2020 Mar-2018 May-2018 Jul-2018 Sep-2018 Nov-2018 Jan-2019 Mar-2019 May-2019 Jul-2019 Sep-2019 Nov-2019 Jan-2020 Mar-2020 May-2020 Jul-2020 Sep-2020

Financial Performance Financial Performance
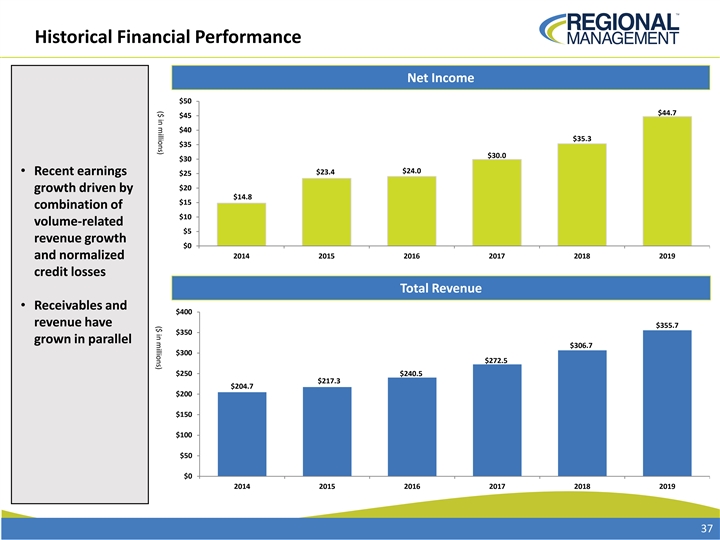
($ in millions) ($ in millions) Historical Financial Performance Net Income $50 $44.7 $45 $40 $35.3 $35 $30.0 $30 $24.0 • Recent earnings $23.4 $25 $20 growth driven by $14.8 $15 combination of $10 volume-related $5 revenue growth $0 and normalized 2014 2015 2016 2017 2018 2019 credit losses Total Revenue • Receivables and $400 revenue have $355.7 $350 grown in parallel $306.7 $300 $272.5 $250 $240.5 $217.3 $204.7 $200 $150 $100 $50 $0 2014 2015 2016 2017 2018 2019 37($ in millions) ($ in millions) Historical Financial Performance Net Income $50 $44.7 $45 $40 $35.3 $35 $30.0 $30 $24.0 • Recent earnings $23.4 $25 $20 growth driven by $14.8 $15 combination of $10 volume-related $5 revenue growth $0 and normalized 2014 2015 2016 2017 2018 2019 credit losses Total Revenue • Receivables and $400 revenue have $355.7 $350 grown in parallel $306.7 $300 $272.5 $250 $240.5 $217.3 $204.7 $200 $150 $100 $50 $0 2014 2015 2016 2017 2018 2019 37

Consolidated Income Statements in thousands 3Q 20 3Q 19 2019 2018 2017 2016 Revenue Interest and fee income $ 81,306 $ 83,089 $ 321,169 $ 280,121 $ 249,034 $ 220,963 Insurance income, net 6,861 5,087 20,817 14,793 13,061 9,456 Other income 2,371 3,531 13,727 11,792 10,364 10,099 Total revenue 90,538 91,707 355,713 306,706 272,459 240,518 Expenses Provision for credit losses 22,089 24,515 99,611 87,056 77,339 63,014 Personnel 26,207 23,791 94,000 84,068 75,992 68,979 Occupancy 6,851 6,367 24,618 22,519 21,530 20,059 Marketing 3,249 2,397 8,206 7,745 7,128 6,837 Other 7,447 7,612 30,160 25,952 26,305 22,757 Total general and administrative 43,754 40,167 156,984 140,284 130,955 118,632 Interest expense 9,300 10,348 40,125 33,464 23,908 19,924 Income before income taxes 15,395 16,677 58,993 45,902 40,257 38,948 Income taxes 4,157 4,105 14,261 10,557 10,294 14,917 Net income $ 11,238 $ 12,572 $ 44,732 $ 35,345 $ 29,963 $ 24,031 38Consolidated Income Statements in thousands 3Q 20 3Q 19 2019 2018 2017 2016 Revenue Interest and fee income $ 81,306 $ 83,089 $ 321,169 $ 280,121 $ 249,034 $ 220,963 Insurance income, net 6,861 5,087 20,817 14,793 13,061 9,456 Other income 2,371 3,531 13,727 11,792 10,364 10,099 Total revenue 90,538 91,707 355,713 306,706 272,459 240,518 Expenses Provision for credit losses 22,089 24,515 99,611 87,056 77,339 63,014 Personnel 26,207 23,791 94,000 84,068 75,992 68,979 Occupancy 6,851 6,367 24,618 22,519 21,530 20,059 Marketing 3,249 2,397 8,206 7,745 7,128 6,837 Other 7,447 7,612 30,160 25,952 26,305 22,757 Total general and administrative 43,754 40,167 156,984 140,284 130,955 118,632 Interest expense 9,300 10,348 40,125 33,464 23,908 19,924 Income before income taxes 15,395 16,677 58,993 45,902 40,257 38,948 Income taxes 4,157 4,105 14,261 10,557 10,294 14,917 Net income $ 11,238 $ 12,572 $ 44,732 $ 35,345 $ 29,963 $ 24,031 38

Consolidated Balance Sheets in thousands 3Q 20 3Q 19 2019 2018 2017 2016 Cash $ 4,292 $ 2,044 $ 2,263 $ 3,657 $ 5,230 $ 4,446 Net finance receivables 1,059,554 1,067,086 1,133,404 951,183 834,045 729,161 Unearned insurance premiums (30,024) (24,900) (28,591) (18,940) (16,582) (11,386) Allowance for credit losses (144,000) (60,900) (62,200) (58,300) (48,910) (41,250) * Net finance receivables, less unearned insurance premiums and allowance for credit losses 885,530 981,286 1,042,613 873,943 768,553 676,525 Restricted cash 58,219 43,659 54,164 46,484 16,787 8,297 Lease assets 27,855 25,688 26,438 - - - Property and equipment 15,054 14,512 15,301 13,926 12,294 11,693 Intangible assets 8,677 9,574 9,438 10,010 10,607 6,448 Deferred tax asset 22,960 1,445 619 - - 33 Other assets 14,972 7,964 7,704 8,375 16,012 4,782 Total assets $ 1,037,559 $ 1,086,172 $ 1,158,540 $ 956,395 $ 829,483 $ 712,224 Long-term debt $ 700,139 $ 743,835 $ 808,218 $ 660,507 $ 571,496 $ 491,678 Unamortized debt issuance costs (8,603) (7,828) (9,607) (9,158) (4,950) (2,152) Net long-term debt 691,536 736,007 798,611 651,349 566,546 489,526 Accounts payable and accrued expenses 43,576 25,764 28,676 25,138 18,565 15,223 Lease liabilities 29,983 27,714 28,470 - - - Deferred tax liability - - - 747 4,961 - Total liabilities 765,095 789,485 855,757 677,234 590,072 504,749 Common stock 1,382 1,351 1,350 1,332 1,321 1,300 Additional paid-in capital 105,866 101,682 102,678 98,778 94,384 92,432 Retained earnings 215,290 233,146 248,829 204,097 168,752 138,789 Treasury stock (50,074) (39,492) (50,074) (25,046) (25,046) (25,046) Total stockholders' equity* 272,464 296,687 302,783 279,161 239,411 207,475 Total liabilities and stockholders' equity $ 1,037,559 $ 1,086,172 $ 1,158,540 $ 956,395 $ 829,483 $ 712,224 * 3Q 20 Ending Reserve includes 60.1 related to CECL reserve accounting change in 1Q 2020 and $31.9 million of incremental COVID-19 reserves 39Consolidated Balance Sheets in thousands 3Q 20 3Q 19 2019 2018 2017 2016 Cash $ 4,292 $ 2,044 $ 2,263 $ 3,657 $ 5,230 $ 4,446 Net finance receivables 1,059,554 1,067,086 1,133,404 951,183 834,045 729,161 Unearned insurance premiums (30,024) (24,900) (28,591) (18,940) (16,582) (11,386) Allowance for credit losses (144,000) (60,900) (62,200) (58,300) (48,910) (41,250) * Net finance receivables, less unearned insurance premiums and allowance for credit losses 885,530 981,286 1,042,613 873,943 768,553 676,525 Restricted cash 58,219 43,659 54,164 46,484 16,787 8,297 Lease assets 27,855 25,688 26,438 - - - Property and equipment 15,054 14,512 15,301 13,926 12,294 11,693 Intangible assets 8,677 9,574 9,438 10,010 10,607 6,448 Deferred tax asset 22,960 1,445 619 - - 33 Other assets 14,972 7,964 7,704 8,375 16,012 4,782 Total assets $ 1,037,559 $ 1,086,172 $ 1,158,540 $ 956,395 $ 829,483 $ 712,224 Long-term debt $ 700,139 $ 743,835 $ 808,218 $ 660,507 $ 571,496 $ 491,678 Unamortized debt issuance costs (8,603) (7,828) (9,607) (9,158) (4,950) (2,152) Net long-term debt 691,536 736,007 798,611 651,349 566,546 489,526 Accounts payable and accrued expenses 43,576 25,764 28,676 25,138 18,565 15,223 Lease liabilities 29,983 27,714 28,470 - - - Deferred tax liability - - - 747 4,961 - Total liabilities 765,095 789,485 855,757 677,234 590,072 504,749 Common stock 1,382 1,351 1,350 1,332 1,321 1,300 Additional paid-in capital 105,866 101,682 102,678 98,778 94,384 92,432 Retained earnings 215,290 233,146 248,829 204,097 168,752 138,789 Treasury stock (50,074) (39,492) (50,074) (25,046) (25,046) (25,046) Total stockholders' equity* 272,464 296,687 302,783 279,161 239,411 207,475 Total liabilities and stockholders' equity $ 1,037,559 $ 1,086,172 $ 1,158,540 $ 956,395 $ 829,483 $ 712,224 * 3Q 20 Ending Reserve includes 60.1 related to CECL reserve accounting change in 1Q 2020 and $31.9 million of incremental COVID-19 reserves 39

Significant Capacity to Absorb Losses Our balance sheet is in a strong position to absorb losses Absorption Capacity (in millions) 3Q 20 Total stockholders' equity $272.5 Allowance for credit losses $144.0 Total absorption capacity $416.5 Absorption capacity as % of net finance receivables 39.3% (1) TTM Margin (revenue less G&A and interest expense) $163.2 Additional capacity using TTM margin 15.4% Total absorption capacity with TTM margin 54.7% (2) TTM Net credit loss rate 9.5% Net finance receivables $1,059.6 (1) TTM Margin defined as total revenue of $374.4 million, less general and administrative expenses of $172.4 million and interest expense of $38.9 million from 4Q 19 through 3Q 20 (2) Net credit losses as a percentage of average net finance receivables 40Significant Capacity to Absorb Losses Our balance sheet is in a strong position to absorb losses Absorption Capacity (in millions) 3Q 20 Total stockholders' equity $272.5 Allowance for credit losses $144.0 Total absorption capacity $416.5 Absorption capacity as % of net finance receivables 39.3% (1) TTM Margin (revenue less G&A and interest expense) $163.2 Additional capacity using TTM margin 15.4% Total absorption capacity with TTM margin 54.7% (2) TTM Net credit loss rate 9.5% Net finance receivables $1,059.6 (1) TTM Margin defined as total revenue of $374.4 million, less general and administrative expenses of $172.4 million and interest expense of $38.9 million from 4Q 19 through 3Q 20 (2) Net credit losses as a percentage of average net finance receivables 40
