Attached files
| file | filename |
|---|---|
| EX-99.1 - EX-99.1 - EQUITY BANCSHARES INC | eqbk-ex991_6.htm |
| 8-K - 8-K - EQUITY BANCSHARES INC | eqbk-8k_20210125.htm |
Fourth Quarter 2020 Results Presentation January 25, 2021 Exhibit 99.2
Disclaimers Special Note Concerning Forward-Looking Statements This press release contains “forward-looking statements” within the meaning of Section 27A of the Securities Act of 1933, as amended, and Section 21E of the Securities Exchange Act of 1934, as amended. These forward-looking statements reflect the current views of Equity’s management with respect to, among other things, future events and Equity’s financial performance. These statements are often, but not always, made through the use of words or phrases such as “may,” “should,” “could,” “predict,” “potential,” “believe,” “will likely result,” “expect,” “continue,” “will,” “anticipate,” “seek,” “estimate,” “intend,” “plan,” “project,” “forecast,” “goal,” “target,” “would” and “outlook,” or the negative variations of those words or other comparable words of a future or forward-looking nature. These forward-looking statements are not historical facts, and are based on current expectations, estimates and projections about Equity’s industry, management’s beliefs and certain assumptions made by management, many of which, by their nature, are inherently uncertain and beyond Equity’s control. Accordingly, Equity cautions you that any such forward-looking statements are not guarantees of future performance and are subject to risks, assumptions and uncertainties that are difficult to predict. Although Equity believes that the expectations reflected in these forward-looking statements are reasonable as of the date made, actual results may prove to be materially different from the results expressed or implied by the forward-looking statements. Factors that could cause actual results to differ materially from Equity’s expectations include COVID-19 related impacts; competition from other financial institutions and bank holding companies; the effects of and changes in trade, monetary and fiscal policies and laws, including interest rate policies of the Federal Reserve Board; changes in the demand for loans; fluctuations in value of collateral and loan reserves; inflation, interest rate, market and monetary fluctuations; changes in consumer spending, borrowing and savings habits; and acquisitions and integration of acquired businesses; and similar variables. The foregoing list of factors is not exhaustive. For discussion of these and other risks that may cause actual results to differ from expectations, please refer to “Cautionary Note Regarding Forward-Looking Statements” and “Risk Factors” in Equity’s Annual Report on Form 10-K filed with the Securities and Exchange Commission on March 10, 2020, and any updates to those risk factors set forth in Equity’s subsequent Quarterly Reports on Form 10-Q or Current Reports on Form 8-K. If one or more events related to these or other risks or uncertainties materialize, or if Equity’s underlying assumptions prove to be incorrect, actual results may differ materially from what Equity anticipates. Accordingly, you should not place undue reliance on any such forward-looking statements. Any forward-looking statement speaks only as of the date on which it is made, and Equity does not undertake any obligation to publicly update or review any forward-looking statement, whether as a result of new information, future developments or otherwise. New risks and uncertainties arise from time to time, such as COVID-19, and it is not possible for us to predict those events or how they may affect us. In addition, Equity cannot assess the impact of each factor on Equity’s business or the extent to which any factor, or combination of factors, may cause actual results to differ materially from those contained in any forward-looking statements. All forward-looking statements, expressed or implied, included in this press release are expressly qualified in their entirety by this cautionary statement. This cautionary statement should also be considered in connection with any subsequent written or oral forward-looking statements that Equity or persons acting on Equity’s behalf may issue. NON-GAAP FINANCIAL MEASURES This presentation contains certain non-GAAP financial measures intended to supplement, not substitute for, comparable GAAP measures. Reconciliations of non-GAAP financial measures to GAAP financial measures are provided at the end of this presentation. Numbers in the presentation may not sum due to rounding.
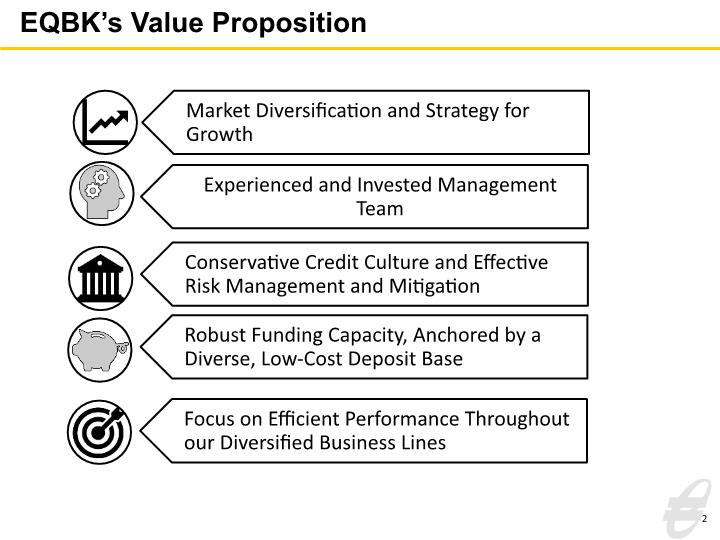
EQBK’s Value Proposition 2
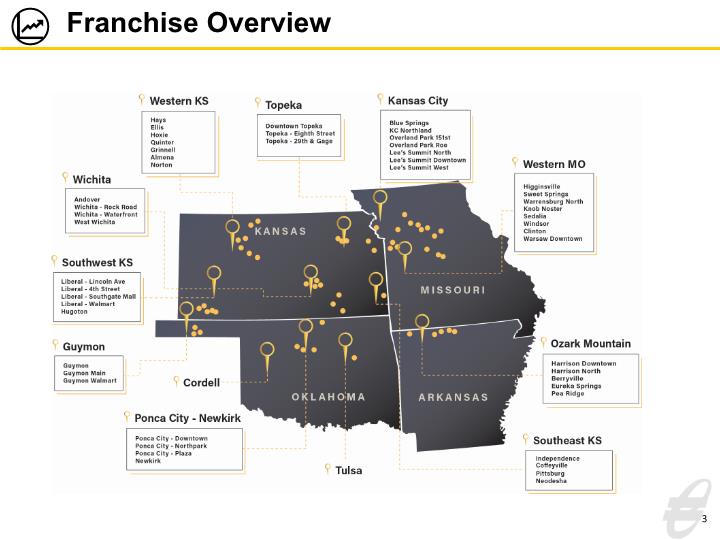
Franchise Overview 3
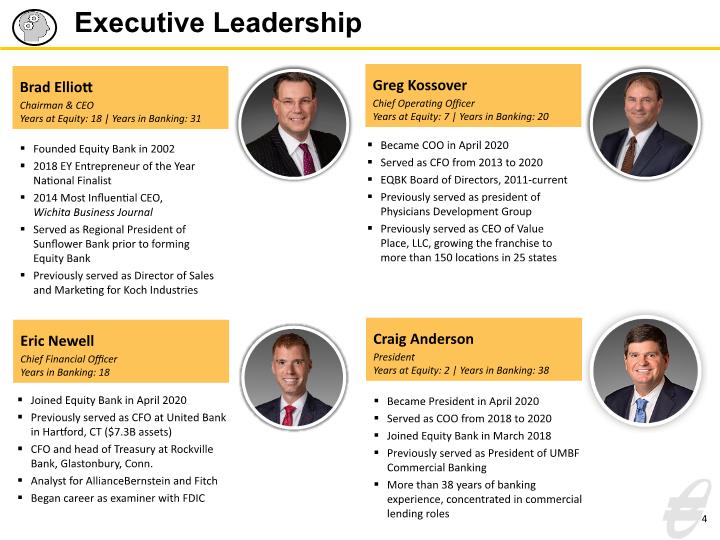
Executive Leadership 4 Founded Equity Bank in 2002 2018 EY Entrepreneur of the Year National Finalist 2014 Most Influential CEO, Wichita Business Journal Served as Regional President of Sunflower Bank prior to forming Equity Bank Previously served as Director of Sales and Marketing for Koch Industries Brad Elliott Chairman & CEO Years at Equity: 18 | Years in Banking: 31 Greg Kossover EVP, COO & CFO Became COO in April 2020 Served as CFO from 2013 to 2020 EQBK Board of Directors, 2011-current Previously served as president of Physicians Development Group Previously served as CEO of Value Place, LLC, growing the franchise to more than 150 locations in 25 states Greg Kossover Chief Operating Officer Years at Equity: 7 | Years in Banking: 20 Eric Newell Chief Financial Officer Years in Banking: 18 Craig Anderson President Years at Equity: 2 | Years in Banking: 38 Became President in April 2020 Served as COO from 2018 to 2020 Joined Equity Bank in March 2018 Previously served as President of UMBF Commercial Banking More than 38 years of banking experience, concentrated in commercial lending roles Joined Equity Bank in April 2020 Previously served as CFO at United Bank in Hartford, CT ($7.3B assets) CFO and head of Treasury at Rockville Bank, Glastonbury, Conn. Analyst for AllianceBernstein and Fitch Began career as examiner with FDIC
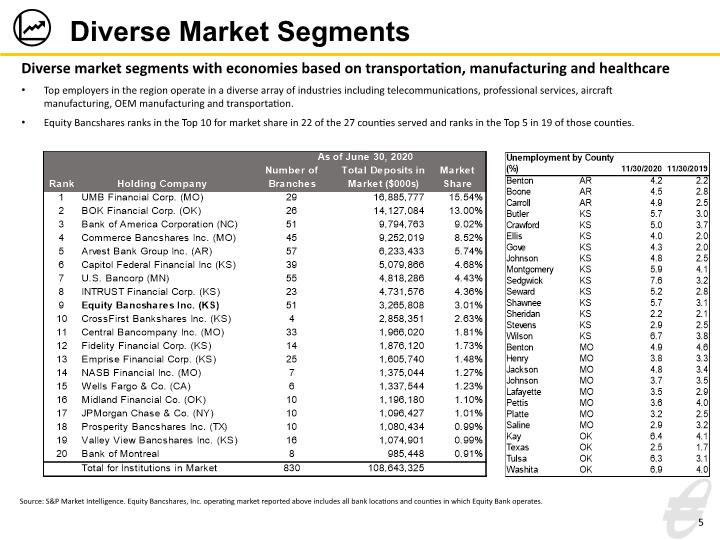
Diverse Market Segments Source: S&P Market Intelligence. Equity Bancshares, Inc. operating market reported above includes all bank locations and counties in which Equity Bank operates. Diverse market segments with economies based on transportation, manufacturing and healthcare Top employers in the region operate in a diverse array of industries including telecommunications, professional services, aircraft manufacturing, OEM manufacturing and transportation. Equity Bancshares ranks in the Top 10 for market share in 22 of the 27 counties served and ranks in the Top 5 in 19 of those counties. 5
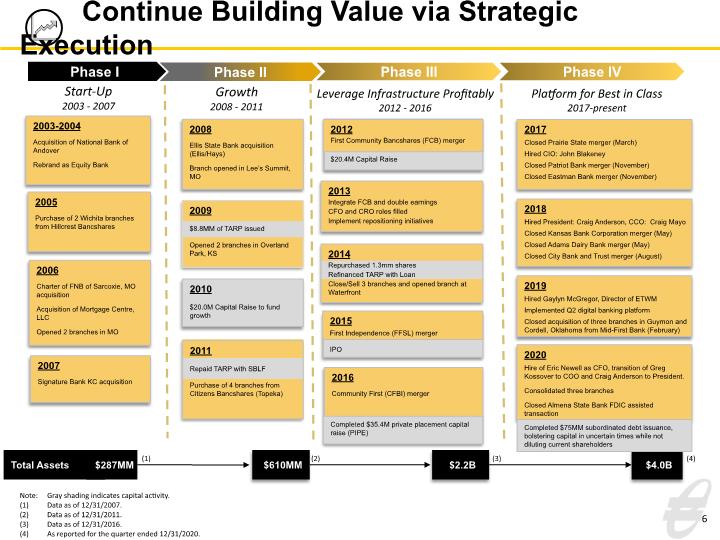
Continue Building Value via Strategic Execution 6 2009 $8.8MM of TARP issued Opened 2 branches in Overland Park, KS 2014 Repurchased 1.3mm shares Refinanced TARP with Loan Close/Sell 3 branches and opened branch at Waterfront 2012 First Community Bancshares (FCB) merger $20.4M Capital Raise 2011 Repaid TARP with SBLF Purchase of 4 branches from Citizens Bancshares (Topeka) 2003-2004 Acquisition of National Bank of Andover Rebrand as Equity Bank 2005 Purchase of 2 Wichita branches from Hillcrest Bancshares 2006 Charter of FNB of Sarcoxie, MO acquisition Acquisition of Mortgage Centre, LLC Opened 2 branches in MO 2008 Ellis State Bank acquisition (Ellis/Hays) Branch opened in Lee’s Summit, MO 2010 $20.0M Capital Raise to fund growth 2013 Integrate FCB and double earnings CFO and CRO roles filled Implement repositioning initiatives 2007 Signature Bank KC acquisition Phase I Phase II Phase III Start-Up 2003 - 2007 Growth 2008 - 2011 Leverage Infrastructure Profitably 2012 - 2016 2015 First Independence (FFSL) merger IPO 2016 Community First (CFBI) merger Completed $35.4M private placement capital raise (PIPE) Phase IV Platform for Best in Class 2017-present 2017 Closed Prairie State merger (March) Hired CIO: John Blakeney Closed Patriot Bank merger (November) Closed Eastman Bank merger (November) $2.2B $610MM (1) (2) (3) $4.0B (4) 2018 Hired President: Craig Anderson, CCO: Craig Mayo Closed Kansas Bank Corporation merger (May) Closed Adams Dairy Bank merger (May) Closed City Bank and Trust merger (August) 2019 Hired Gaylyn McGregor, Director of ETWM Implemented Q2 digital banking platform Closed acquisition of three branches in Guymon and Cordell, Oklahoma from Mid-First Bank (February) 2020 Hire of Eric Newell as CFO, transition of Greg Kossover to COO and Craig Anderson to President. Consolidated three branches Closed Almena State Bank FDIC assisted transaction Note: Gray shading indicates capital activity. (1) Data as of 12/31/2007. (2) Data as of 12/31/2011. (3) Data as of 12/31/2016. (4) As reported for the quarter ended 12/31/2020. Completed $75MM subordinated debt issuance, bolstering capital in uncertain times while not diluting current shareholders
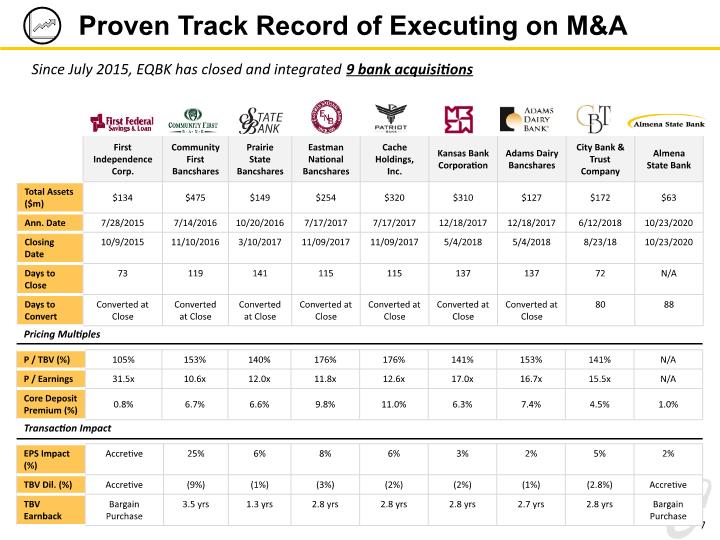
7 Proven Track Record of Executing on M&A Since July 2015, EQBK has closed and integrated 9 bank acquisitions Pricing Multiples Transaction Impact
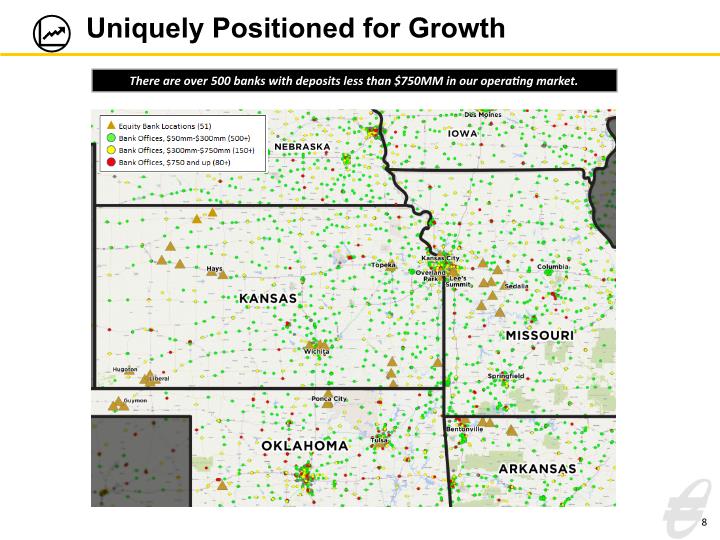
8 Uniquely Positioned for Growth There are over 500 banks with deposits less than $750MM in our operating market.
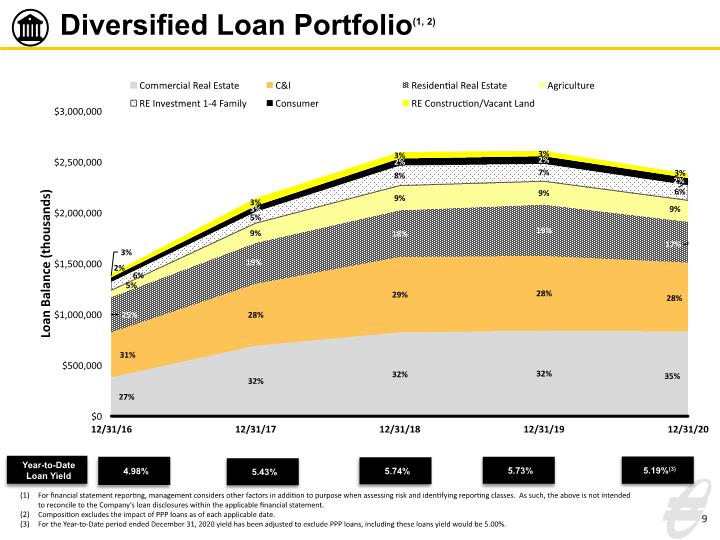
Diversified Loan Portfolio(1, 2) 9 Year-to-Date Loan Yield 4.98% 5.43% 5.74% 5.73% For financial statement reporting, management considers other factors in addition to purpose when assessing risk and identifying reporting classes. As such, the above is not intended to reconcile to the Company’s loan disclosures within the applicable financial statement. Composition excludes the impact of PPP loans as of each applicable date. For the Year-to-Date period ended December 31, 2020 yield has been adjusted to exclude PPP loans, including these loans yield would be 5.00%. 5.19%(3)
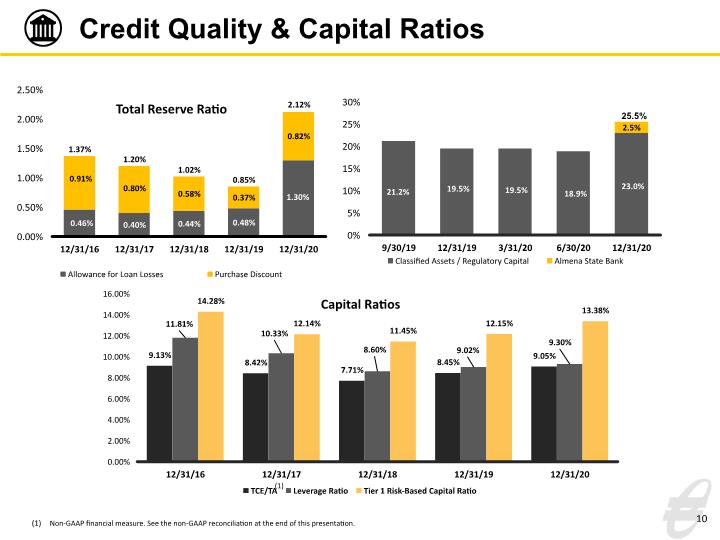
Credit Quality & Capital Ratios 10 Non-GAAP financial measure. See the non-GAAP reconciliation at the end of this presentation. (1)
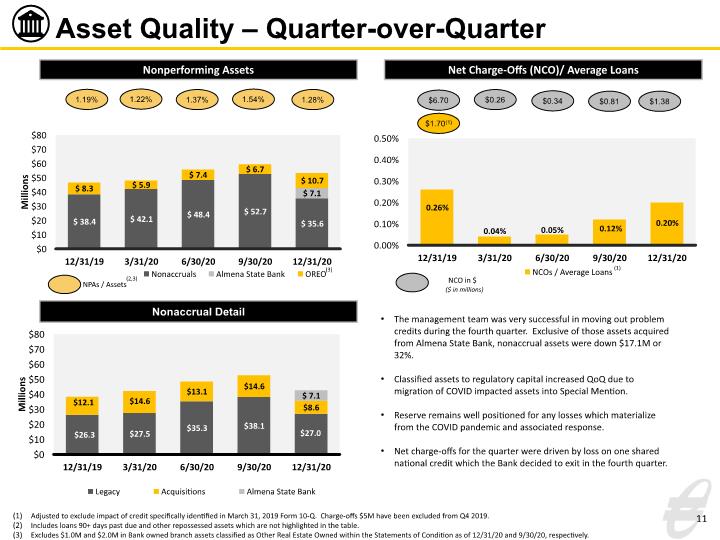
Asset Quality – Quarter-over-Quarter 11 Nonperforming Assets NPAs / Assets 1.19% Net Charge-Offs (NCO)/ Average Loans $0.34 NCO in $ ($ in millions) Nonaccrual Detail $6.70 1.22% 1.54% $0.81 1.37% $0.26 Adjusted to exclude impact of credit specifically identified in March 31, 2019 Form 10-Q. Charge-offs $5M have been excluded from Q4 2019. Includes loans 90+ days past due and other repossessed assets which are not highlighted in the table. Excludes $1.0M and $2.0M in Bank owned branch assets classified as Other Real Estate Owned within the Statements of Condition as of 12/31/20 and 9/30/20, respectively. (2,3) $1.70(1) 1.28% $1.38 (3) The management team was very successful in moving out problem credits during the fourth quarter. Exclusive of those assets acquired from Almena State Bank, nonaccrual assets were down $17.1M or 32%. Classified assets to regulatory capital increased QoQ due to migration of COVID impacted assets into Special Mention. Reserve remains well positioned for any losses which materialize from the COVID pandemic and associated response. Net charge-offs for the quarter were driven by loss on one shared national credit which the Bank decided to exit in the fourth quarter.
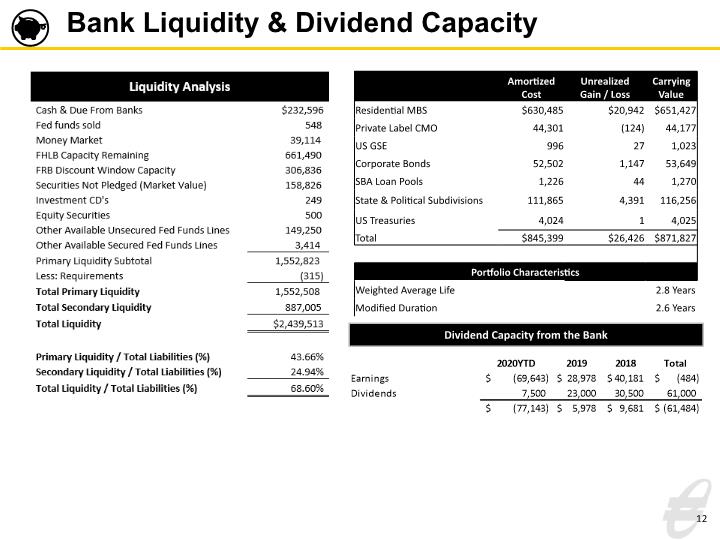
Bank Liquidity & Dividend Capacity 12 Dividend Capacity from the Bank
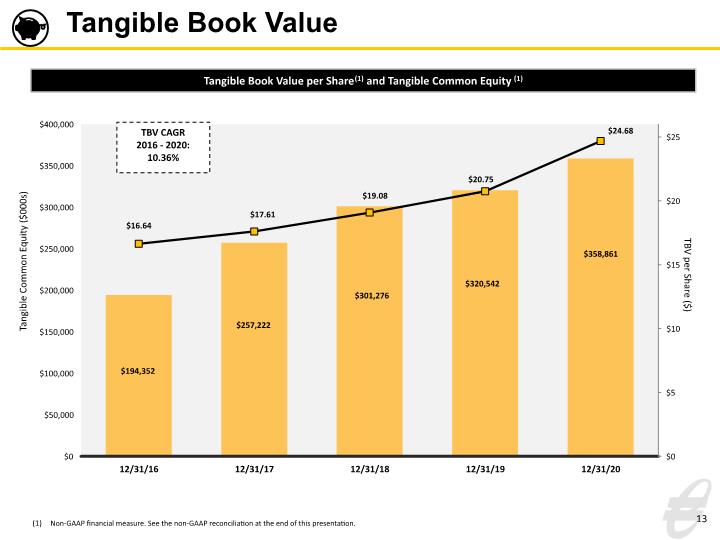
Tangible Book Value 13 Tangible Book Value per Share(1) and Tangible Common Equity (1) TBV CAGR 2016 - 2020: 10.36% Non-GAAP financial measure. See the non-GAAP reconciliation at the end of this presentation.
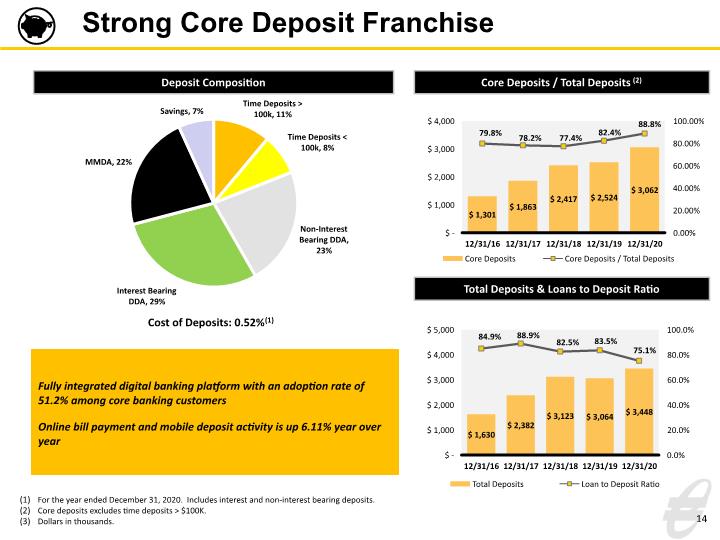
Fully integrated digital banking platform with an adoption rate of 51.2% among core banking customers Online bill payment and mobile deposit activity is up 6.11% year over year 14 Strong Core Deposit Franchise For the year ended December 31, 2020. Includes interest and non-interest bearing deposits. Core deposits excludes time deposits > $100K. Dollars in thousands. Cost of Deposits: 0.52%(1) Deposit Composition Core Deposits / Total Deposits (2) Total Deposits & Loans to Deposit Ratio
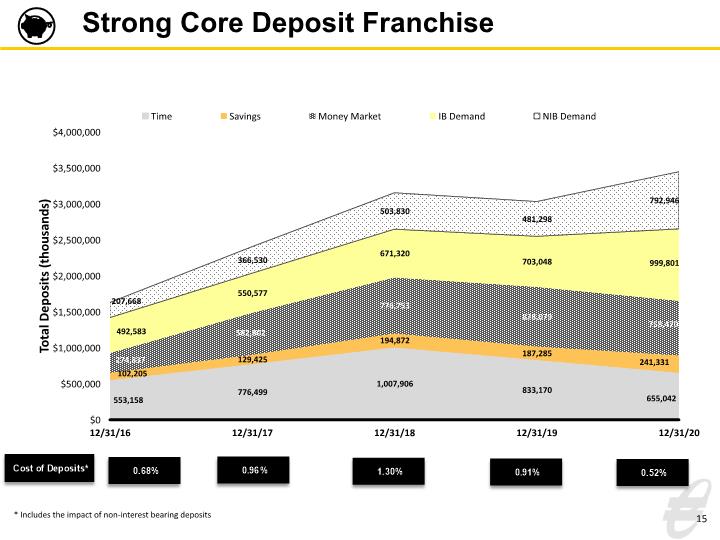
15 Strong Core Deposit Franchise * Includes the impact of non-interest bearing deposits
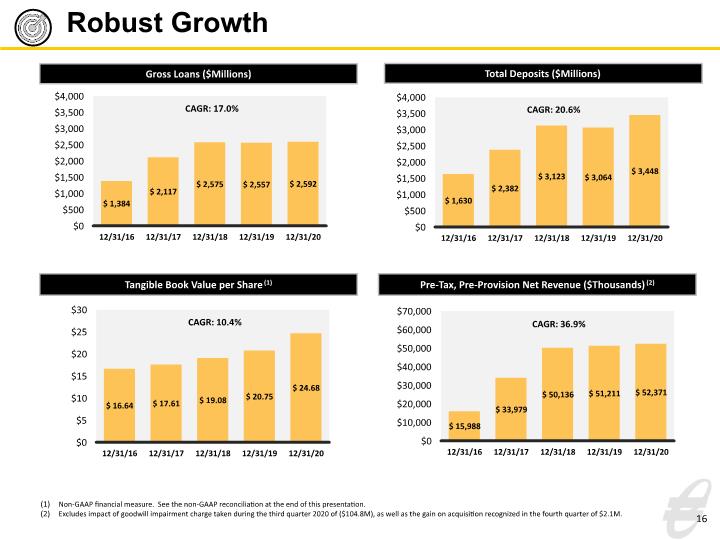
Robust Growth 16 Gross Loans ($Millions) Total Deposits ($Millions) Tangible Book Value per Share(1) Pre-Tax, Pre-Provision Net Revenue ($Thousands)(2) Non-GAAP financial measure. See the non-GAAP reconciliation at the end of this presentation. Excludes impact of goodwill impairment charge taken during the third quarter 2020 of ($104.8M), as well as the gain on acquisition recognized in the fourth quarter of $2.1M.
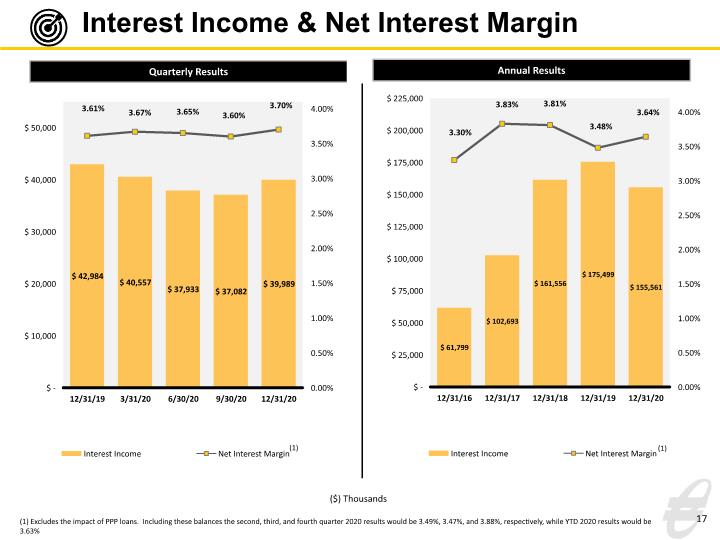
Interest Income & Net Interest Margin 17 ($) Thousands (1) (1) (1) Excludes the impact of PPP loans. Including these balances the second, third, and fourth quarter 2020 results would be 3.49%, 3.47%, and 3.88%, respectively, while YTD 2020 results would be 3.63% Annual Results
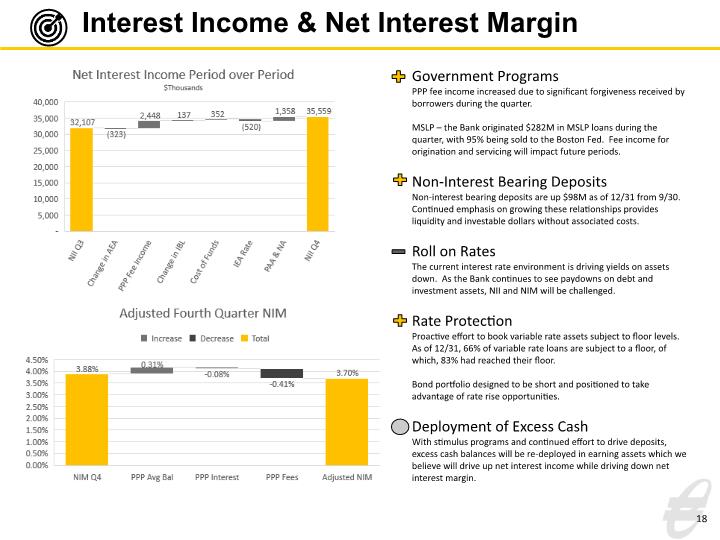
Interest Income & Net Interest Margin 18 Government Programs PPP fee income increased due to significant forgiveness received by borrowers during the quarter. MSLP – the Bank originated $282M in MSLP loans during the quarter, with 95% being sold to the Boston Fed. Fee income for origination and servicing will impact future periods. Non-Interest Bearing Deposits Non-interest bearing deposits are up $98M as of 12/31 from 9/30. Continued emphasis on growing these relationships provides liquidity and investable dollars without associated costs. Roll on Rates The current interest rate environment is driving yields on assets down. As the Bank continues to see paydowns on debt and investment assets, NII and NIM will be challenged. Rate Protection Proactive effort to book variable rate assets subject to floor levels. As of 12/31, 66% of variable rate loans are subject to a floor, of which, 83% had reached their floor. Bond portfolio designed to be short and positioned to take advantage of rate rise opportunities. Deployment of Excess Cash With stimulus programs and continued effort to drive deposits, excess cash balances will be re-deployed in earning assets which we believe will drive up net interest income while driving down net interest margin.
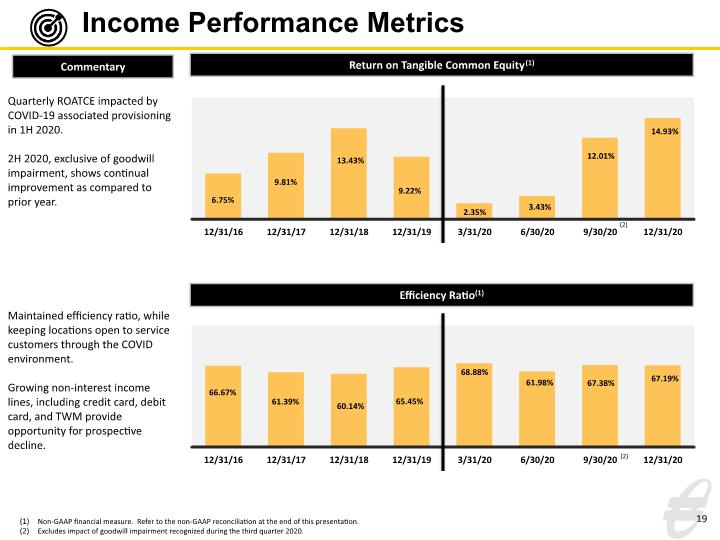
Income Performance Metrics 19 Non-GAAP financial measure. Refer to the non-GAAP reconciliation at the end of this presentation. Excludes impact of goodwill impairment recognized during the third quarter 2020. Return on Tangible Common Equity(1) Efficiency Ratio(1) Quarterly ROATCE impacted by COVID-19 associated provisioning in 1H 2020. 2H 2020, exclusive of goodwill impairment, shows continual improvement as compared to prior year. Commentary Maintained efficiency ratio, while keeping locations open to service customers through the COVID environment. Growing non-interest income lines, including credit card, debit card, and TWM provide opportunity for prospective decline. (2) (2)
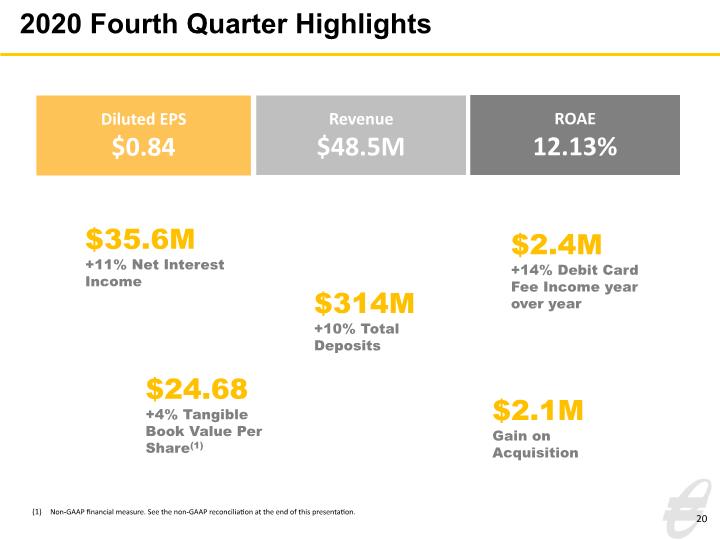
20 2020 Fourth Quarter Highlights Non-GAAP financial measure. See the non-GAAP reconciliation at the end of this presentation. Diluted EPS $0.84 Revenue $48.5M ROAE 12.13% $35.6M +11% Net Interest Income $314M +10% Total Deposits $2.4M +14% Debit Card Fee Income year over year $24.68 +4% Tangible Book Value Per Share(1) $2.1M Gain on Acquisition
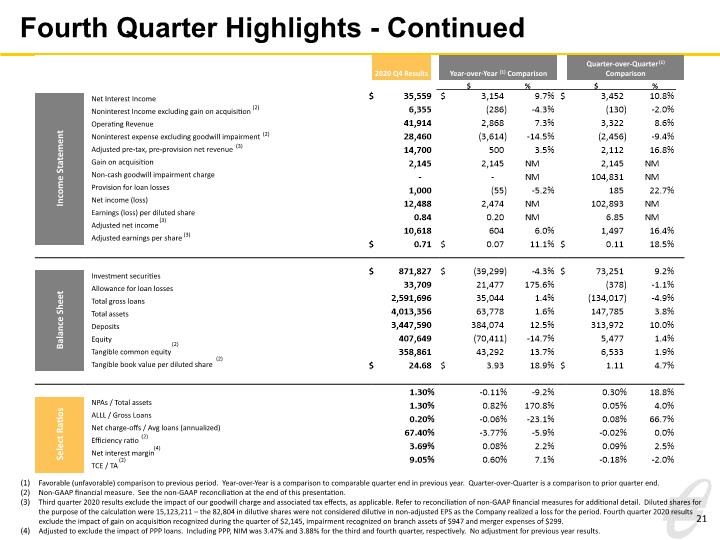
Fourth Quarter Highlights - Continued 21 Favorable (unfavorable) comparison to previous period. Year-over-Year is a comparison to comparable quarter end in previous year. Quarter-over-Quarter is a comparison to prior quarter end. Non-GAAP financial measure. See the non-GAAP reconciliation at the end of this presentation. Third quarter 2020 results exclude the impact of our goodwill charge and associated tax effects, as applicable. Refer to reconciliation of non-GAAP financial measures for additional detail. Diluted shares for the purpose of the calculation were 15,123,211 – the 82,804 in dilutive shares were not considered dilutive in non-adjusted EPS as the Company realized a loss for the period. Fourth quarter 2020 results exclude the impact of gain on acquisition recognized during the quarter of $2,145, impairment recognized on branch assets of $947 and merger expenses of $299. Adjusted to exclude the impact of PPP loans. Including PPP, NIM was 3.47% and 3.88% for the third and fourth quarter, respectively. No adjustment for previous year results. (2) (2) (3) (3) (3) (4) (2) (2) (2) (2)
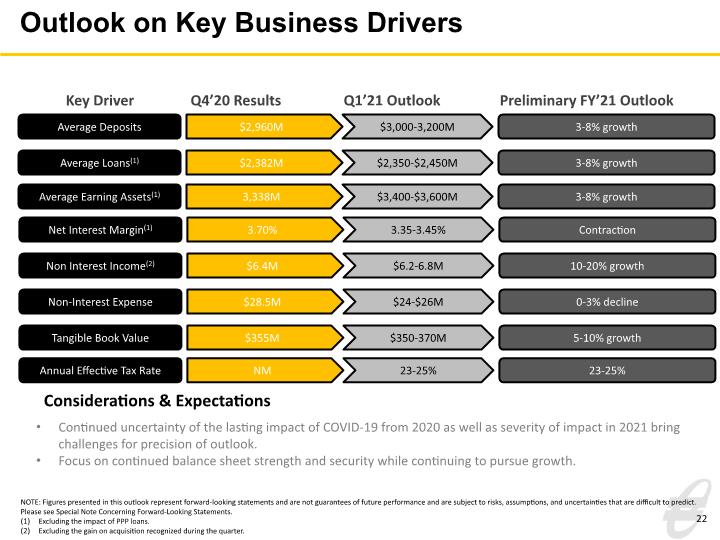
22 Outlook on Key Business Drivers Average Deposits $2,960M $3,000-3,200M 3-8% growth Key Driver Q4’20 Results Q1’21 Outlook Average Loans(1) $2,382M $2,350-$2,450M 3-8% growth Net Interest Margin(1) 3.70% 3.35-3.45% Contraction Non Interest Income(2) $6.4M $6.2-6.8M 10-20% growth Non-Interest Expense $28.5M $24-$26M 0-3% decline Tangible Book Value $355M $350-370M 5-10% growth Considerations & Expectations Continued uncertainty of the lasting impact of COVID-19 from 2020 as well as severity of impact in 2021 bring challenges for precision of outlook. Focus on continued balance sheet strength and security while continuing to pursue growth. Preliminary FY’21 Outlook NOTE: Figures presented in this outlook represent forward-looking statements and are not guarantees of future performance and are subject to risks, assumptions, and uncertainties that are difficult to predict. Please see Special Note Concerning Forward-Looking Statements. Excluding the impact of PPP loans. Excluding the gain on acquisition recognized during the quarter. Average Earning Assets(1) 3,338M $3,400-$3,600M 3-8% growth Annual Effective Tax Rate NM 23-25% 23-25%
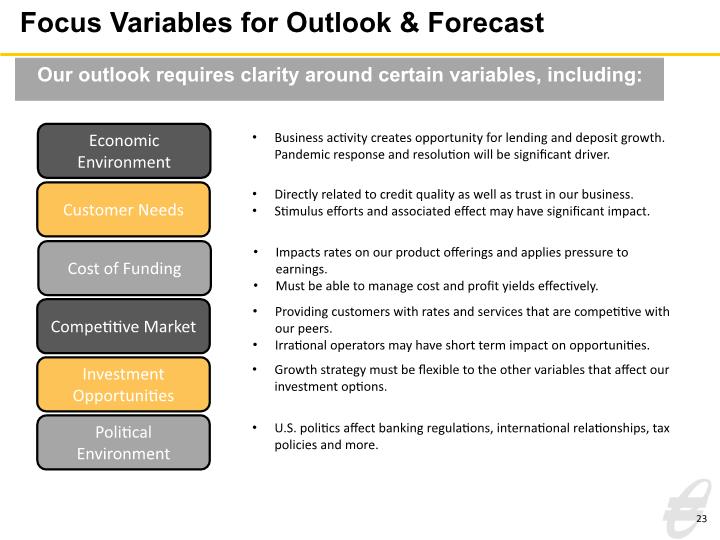
23 Focus Variables for Outlook & Forecast Business activity creates opportunity for lending and deposit growth. Pandemic response and resolution will be significant driver. Directly related to credit quality as well as trust in our business. Stimulus efforts and associated effect may have significant impact. Impacts rates on our product offerings and applies pressure to earnings. Must be able to manage cost and profit yields effectively. Providing customers with rates and services that are competitive with our peers. Irrational operators may have short term impact on opportunities. Growth strategy must be flexible to the other variables that affect our investment options. U.S. politics affect banking regulations, international relationships, tax policies and more. Economic Environment Customer Needs Cost of Funding Competitive Market Investment Opportunities Political Environment Our outlook requires clarity around certain variables, including:
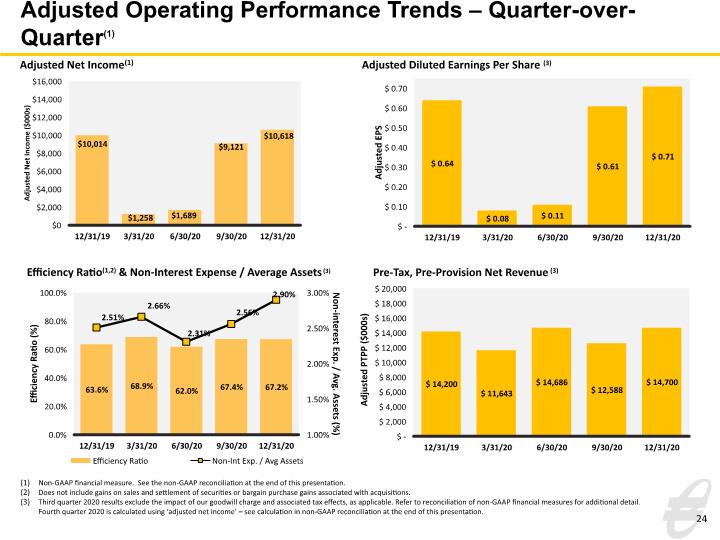
24 Adjusted Operating Performance Trends – Quarter-over-Quarter(1) Adjusted Diluted Earnings Per Share (3) Efficiency Ratio(1,2) & Non-Interest Expense / Average Assets(3) Non-GAAP financial measure. See the non-GAAP reconciliation at the end of this presentation. Does not include gains on sales and settlement of securities or bargain purchase gains associated with acquisitions. Third quarter 2020 results exclude the impact of our goodwill charge and associated tax effects, as applicable. Refer to reconciliation of non-GAAP financial measures for additional detail. Fourth quarter 2020 is calculated using ‘adjusted net income’ – see calculation in non-GAAP reconciliation at the end of this presentation. Adjusted Net Income(1) Pre-Tax, Pre-Provision Net Revenue(3)
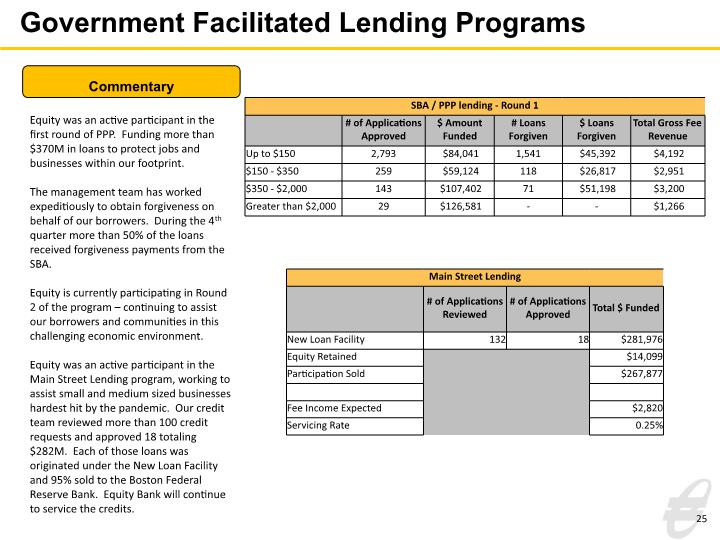
25 Government Facilitated Lending Programs Equity was an active participant in the first round of PPP. Funding more than $370M in loans to protect jobs and businesses within our footprint. The management team has worked expeditiously to obtain forgiveness on behalf of our borrowers. During the 4th quarter more than 50% of the loans received forgiveness payments from the SBA. Equity is currently participating in Round 2 of the program – continuing to assist our borrowers and communities in this challenging economic environment. Equity was an active participant in the Main Street Lending program, working to assist small and medium sized businesses hardest hit by the pandemic. Our credit team reviewed more than 100 credit requests and approved 18 totaling $282M. Each of those loans was originated under the New Loan Facility and 95% sold to the Boston Federal Reserve Bank. Equity Bank will continue to service the credits. Commentary
Appendix 26
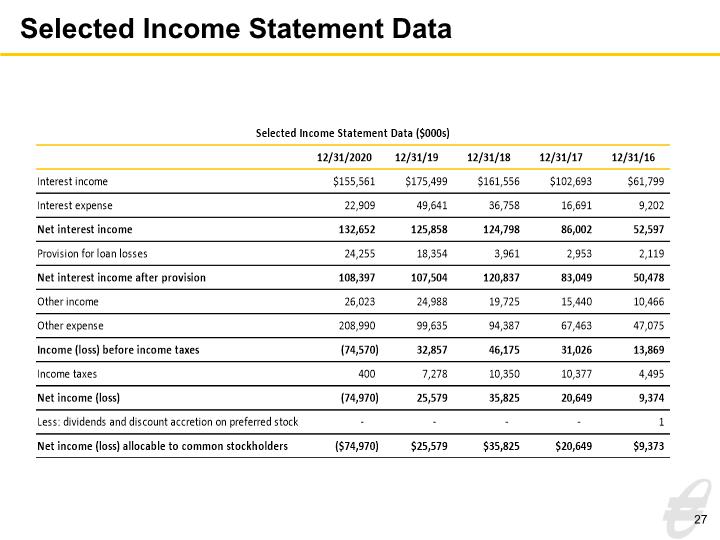
Selected Income Statement Data 27
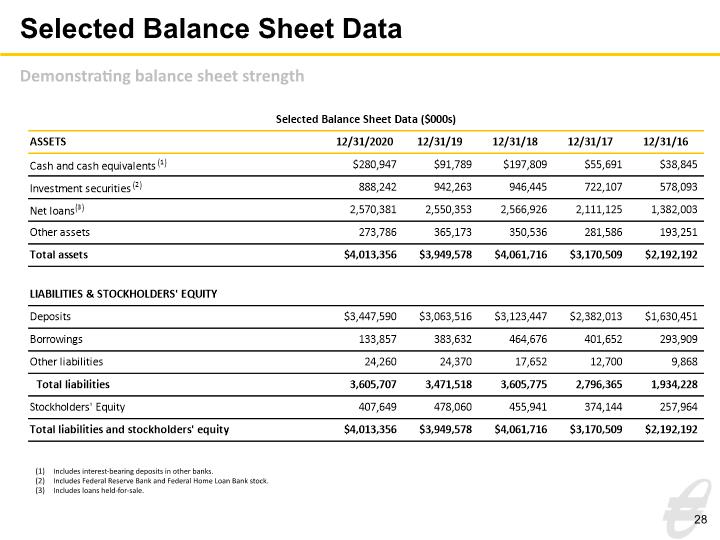
Selected Balance Sheet Data 28 Demonstrating balance sheet strength Includes interest-bearing deposits in other banks. Includes Federal Reserve Bank and Federal Home Loan Bank stock. Includes loans held-for-sale.
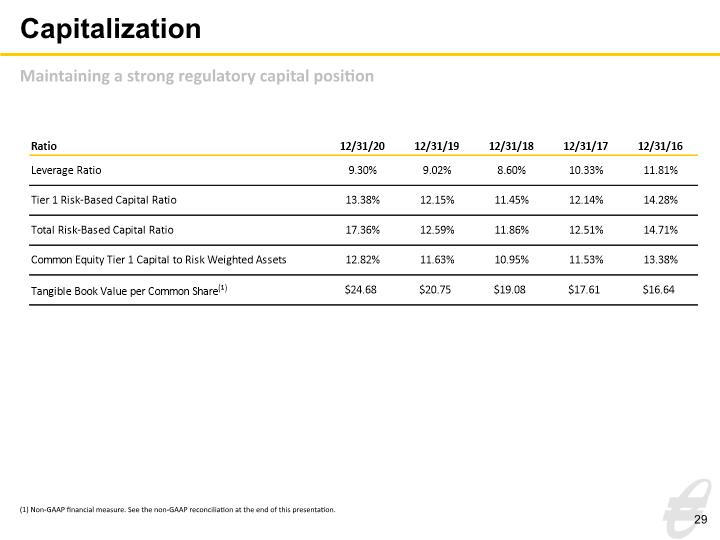
Capitalization 29 (1) Non-GAAP financial measure. See the non-GAAP reconciliation at the end of this presentation. Maintaining a strong regulatory capital position
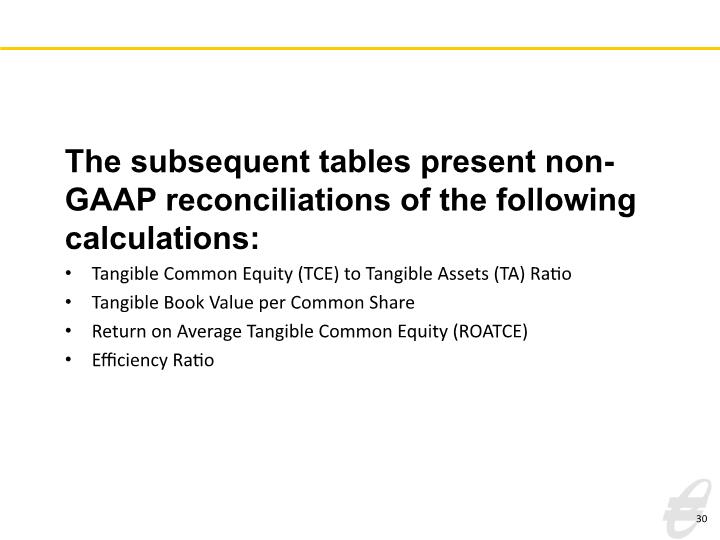
The subsequent tables present non-GAAP reconciliations of the following calculations: Tangible Common Equity (TCE) to Tangible Assets (TA) Ratio Tangible Book Value per Common Share Return on Average Tangible Common Equity (ROATCE) Efficiency Ratio 30
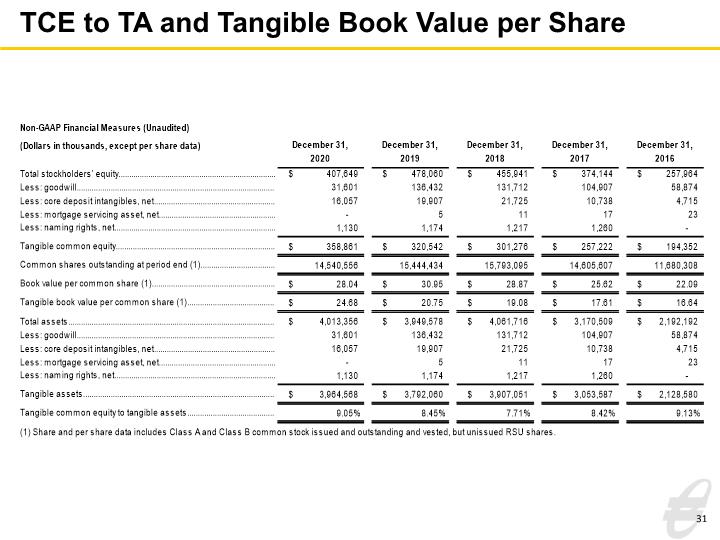
TCE to TA and Tangible Book Value per Share 31
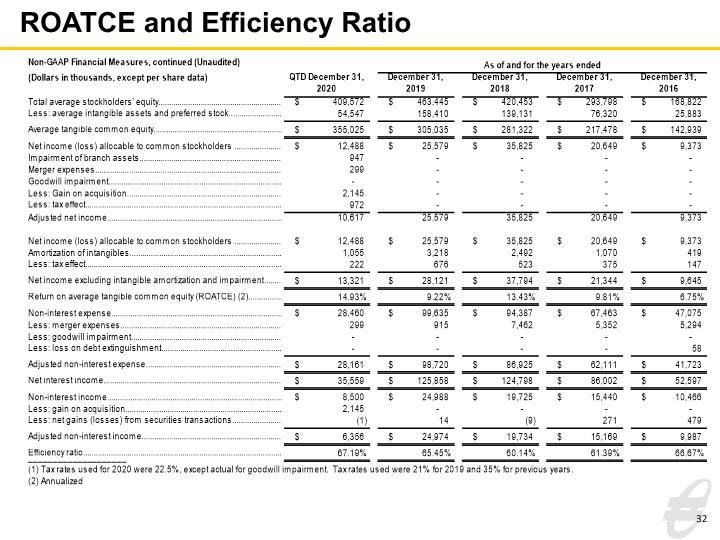
ROATCE and Efficiency Ratio 32

investor.equitybank.com
