Attached files
| file | filename |
|---|---|
| 8-K - 8-K - VERINT SYSTEMS INC | vrnt-20210118.htm |

© 2021 Verint Systems Inc. All Rights Reserved Worldwide. Verint Investor Day January 21, 2021 1

© 2021 Verint Systems Inc. All Rights Reserved Worldwide. 2 Forward Looking Statements The video presentation contains "forward-looking statements," including statements regarding expectations, predictions, views, opportunities, plans, strategies, beliefs, and statements of similar effect relating to Verint Systems Inc. These forward-looking statements are not guarantees of future performance and they are based on management's expectations that involve a number of known and unknown risks, uncertainties, assumptions, and other important factors, any of which could cause our actual results to differ materially from those expressed in or implied by the forward-looking statements. The forward- looking statements contained in this presentation are made as of the date of this presentation and, except as required by law, Verint assumes no obligation to update or revise them, or to provide reasons why actual results may differ. For a more detailed discussion of how these and other risks, uncertainties, and assumptions could cause Verint’s actual results to differ materially from those indicated in its forward-looking statements, see Verint’s filings with the Securities and Exchange Commission. Projections This video presentation contains projected financial information with respect to Verint. Such projected financial information constitutes forward-looking information, and is for illustrative purposes only and should not be relied upon as necessarily being indicative of future results. The assumptions and estimates underlying such financial forecast information are inherently uncertain and are subject to a wide variety of significant business, economic, competitive and other risks and uncertainties. See “Forward-Looking Statements” above. Actual results may differ materially from the results contemplated by the financial forecast information contained in this presentation, and the inclusion of such information in this presentation should not be regarded as a representation by any person that the results reflected in such forecasts will be achieved. Non-GAAP Financial Measures This video presentation includes financial measures which are not prepared in accordance with generally accepted accounting principles (“GAAP”), including certain constant currency measures. For a description of these non-GAAP financial measures, including the reasons management uses each measure, and reconciliations of these non-GAAP financial measures to the most directly comparable financial measures prepared in accordance with GAAP, please see the GAAP to non-GAAP reconciliation found under the Investor Relations tab on Verint’s website Verint.com.

© 2021 Verint Systems Inc. All Rights Reserved Worldwide. Agenda Introducing Verint: The Customer Engagement Company How Verint is Addressing the Engagement Capacity Gap Verint’s Go-to-Market Growth Strategy Customer Engagement Market Financial Model

© 2021 Verint Systems Inc. All Rights Reserved Worldwide. Introducing Verint: The Customer Engagement Company 4

© 2021 Verint Systems Inc. All Rights Reserved Worldwide. 5 Digital Transformation is Accelerating Driving a Rapid Increase in Interactions Across the Enterprise Brand’s Touchpoints with their Customers IT Compliance Fraud Back Office Contact Center Digital Marketing CX Branch/ Store
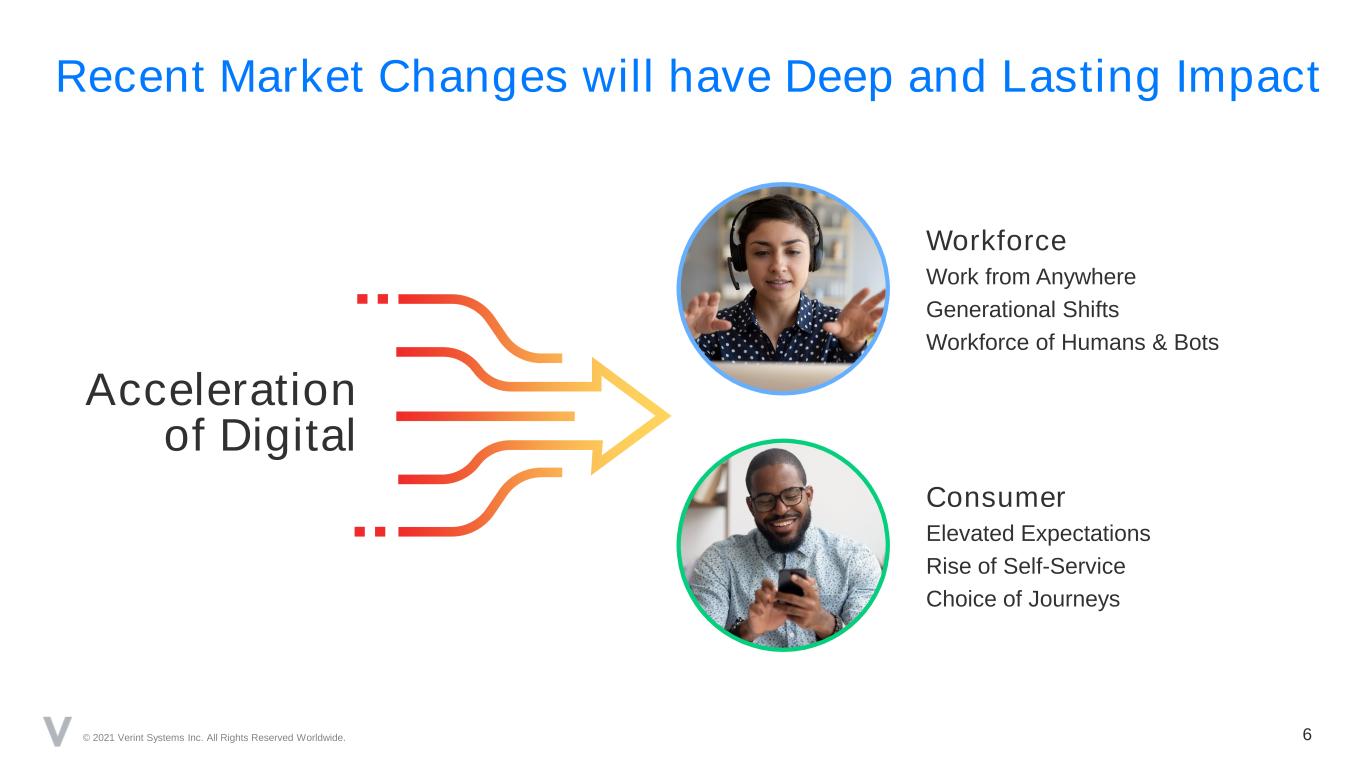
© 2021 Verint Systems Inc. All Rights Reserved Worldwide. 6 Recent Market Changes will have Deep and Lasting Impact Workforce Work from Anywhere Generational Shifts Workforce of Humans & Bots Consumer Elevated Expectations Rise of Self-Service Choice of Journeys Acceleration of Digital
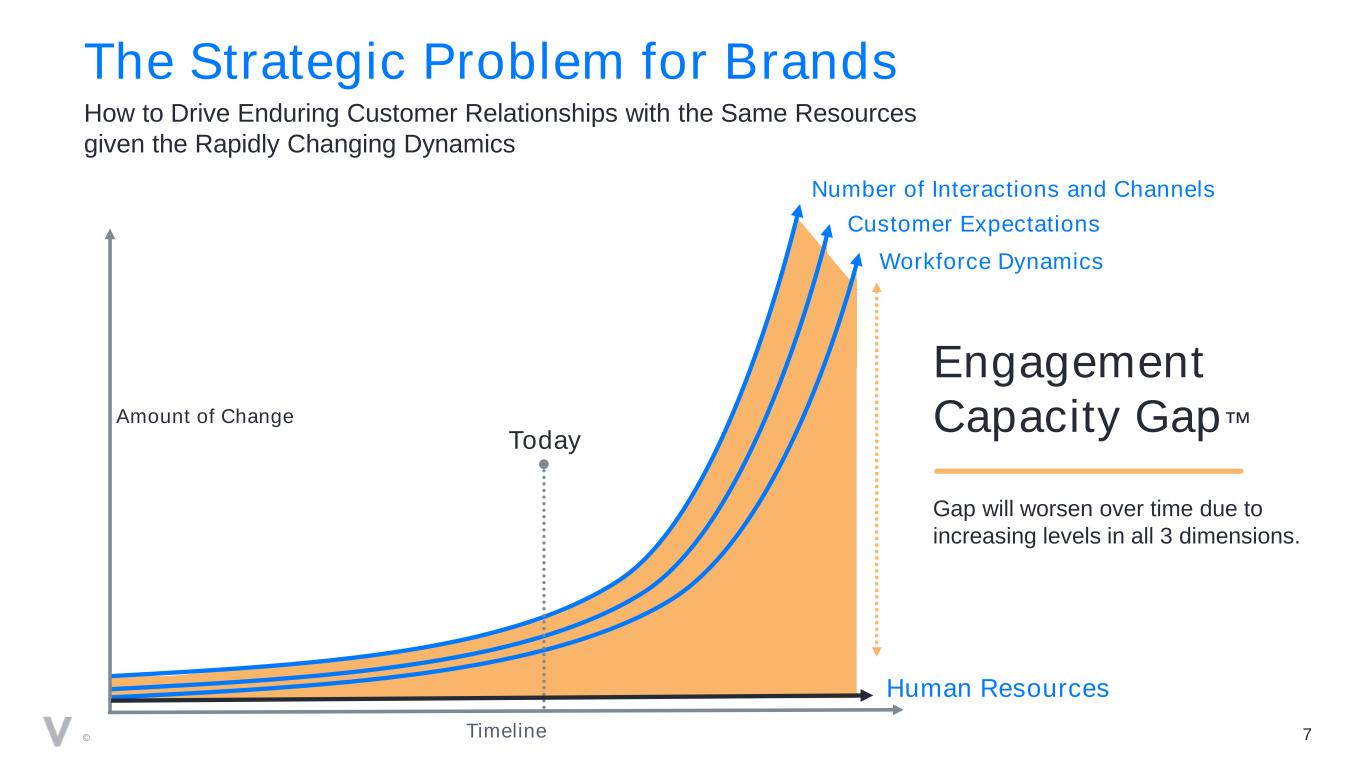
© 2021 Verint Systems Inc. All Rights Reserved Worldwide. Customer Expectations Number of Interactions and Channels Workforce Dynamics The Strategic Problem for Brands How to Drive Enduring Customer Relationships with the Same Resources given the Rapidly Changing Dynamics Amount of Change 7Timeline Today Engagement Capacity Gap™ Gap will worsen over time due to increasing levels in all 3 dimensions. Human Resources

© 2021 Verint Systems Inc. All Rights Reserved Worldwide. 8 Verint Cloud Transition: Positive Impact to Financial Model Better Economics, Faster Adoption of Portfolio and Improved Visibility $1 Billion of Revenue Note: Non-GAAP metrics unless otherwise noted. 90% of Software Revenue Recurring High Single Digit Revenue GrowthFYE24 Targets
© 2021 Verint Systems Inc. All Rights Reserved Worldwide. How Verint is Addressing the Engagement Capacity Gap 9
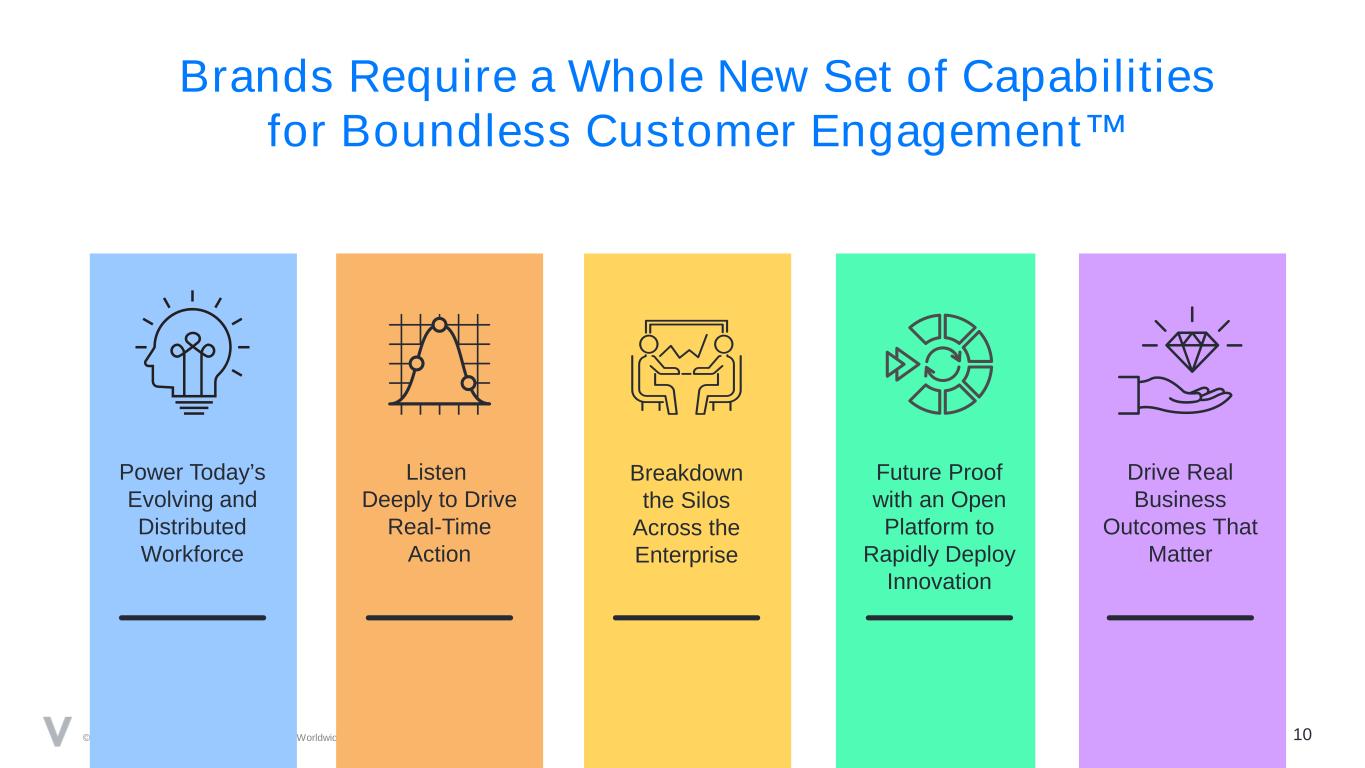
© 2021 Verint Systems Inc. All Rights Reserved Worldwide. 10 Brands Require a Whole New Set of Capabilities for Boundless Customer Engagement™ Power Today’s Evolving and Distributed Workforce Future Proof with an Open Platform to Rapidly Deploy Innovation Breakdown the Silos Across the Enterprise Drive Real Business Outcomes That Matter Listen Deeply to Drive Real-Time Action

© 2021 Verint Systems Inc. All Rights Reserved Worldwide. 11 Data ExperiencesWork Verint Portfolio: Our Differentiated Approach Verint portfolio is focused on closing the Engagement Capacity Gap by connecting work, data and experiences across the enterprise

© 2021 Verint Systems Inc. All Rights Reserved Worldwide. 12 Verint Customer Engagement Cloud Platform Connecting Work, Data, and Experiences for Boundless Customer Engagement™
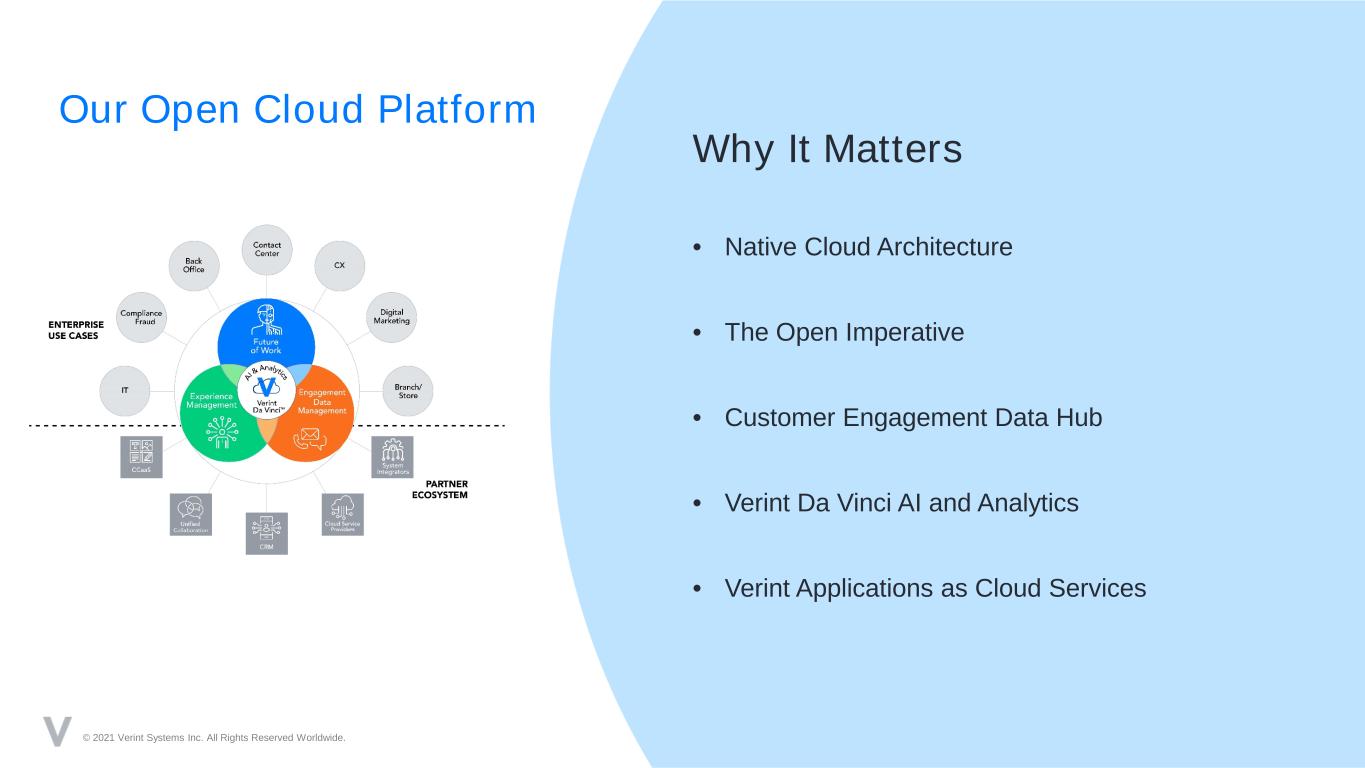
© 2021 Verint Systems Inc. All Rights Reserved Worldwide. Our Open Cloud Platform Why It Matters • Native Cloud Architecture • The Open Imperative • Customer Engagement Data Hub • Verint Da Vinci AI and Analytics • Verint Applications as Cloud Services
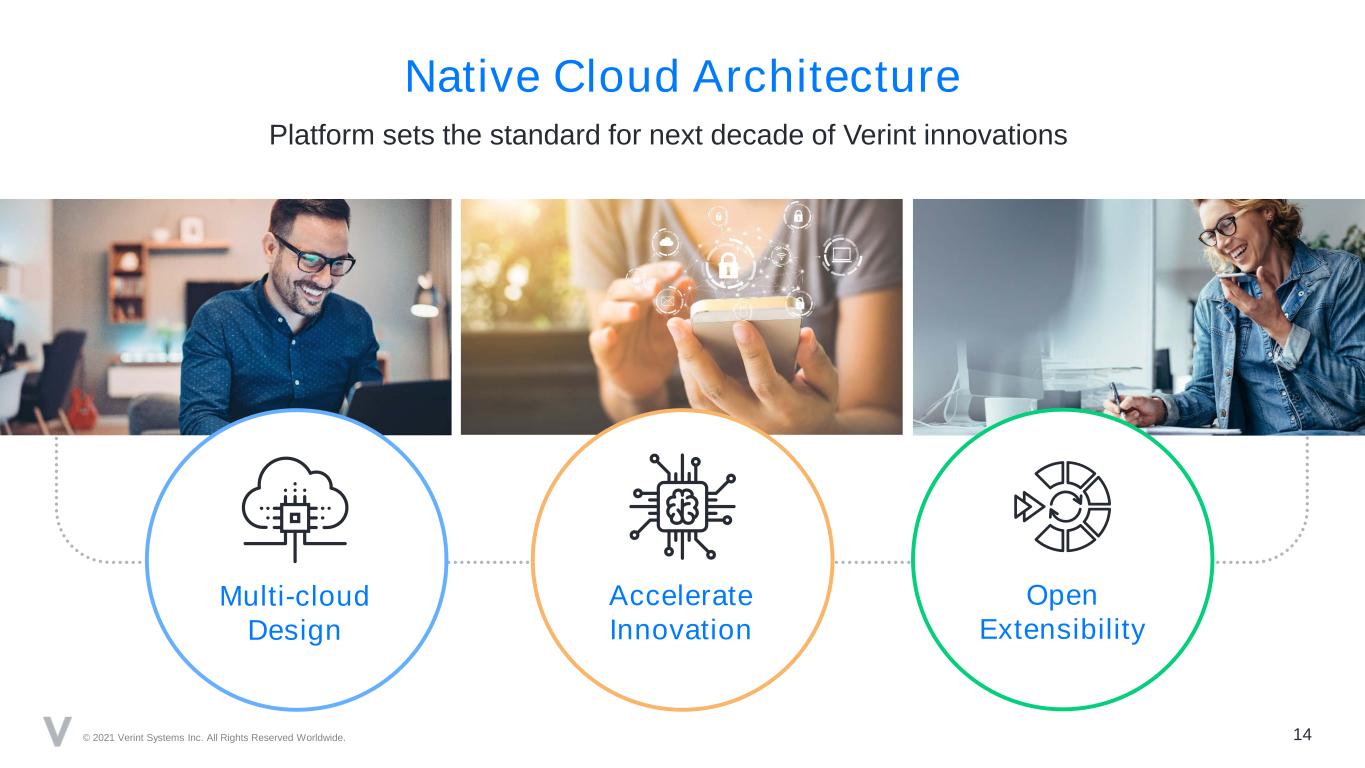
© 2021 Verint Systems Inc. All Rights Reserved Worldwide. 14 Native Cloud Architecture Accelerate Innovation Open Extensibility Multi-cloud Design Platform sets the standard for next decade of Verint innovations

15 Verint Da Vinci AI & Analytics In Action Biometric Authentication Sentiment Score Real-Time Transcription Intent Identification Embedded in the Verint Cloud Platform
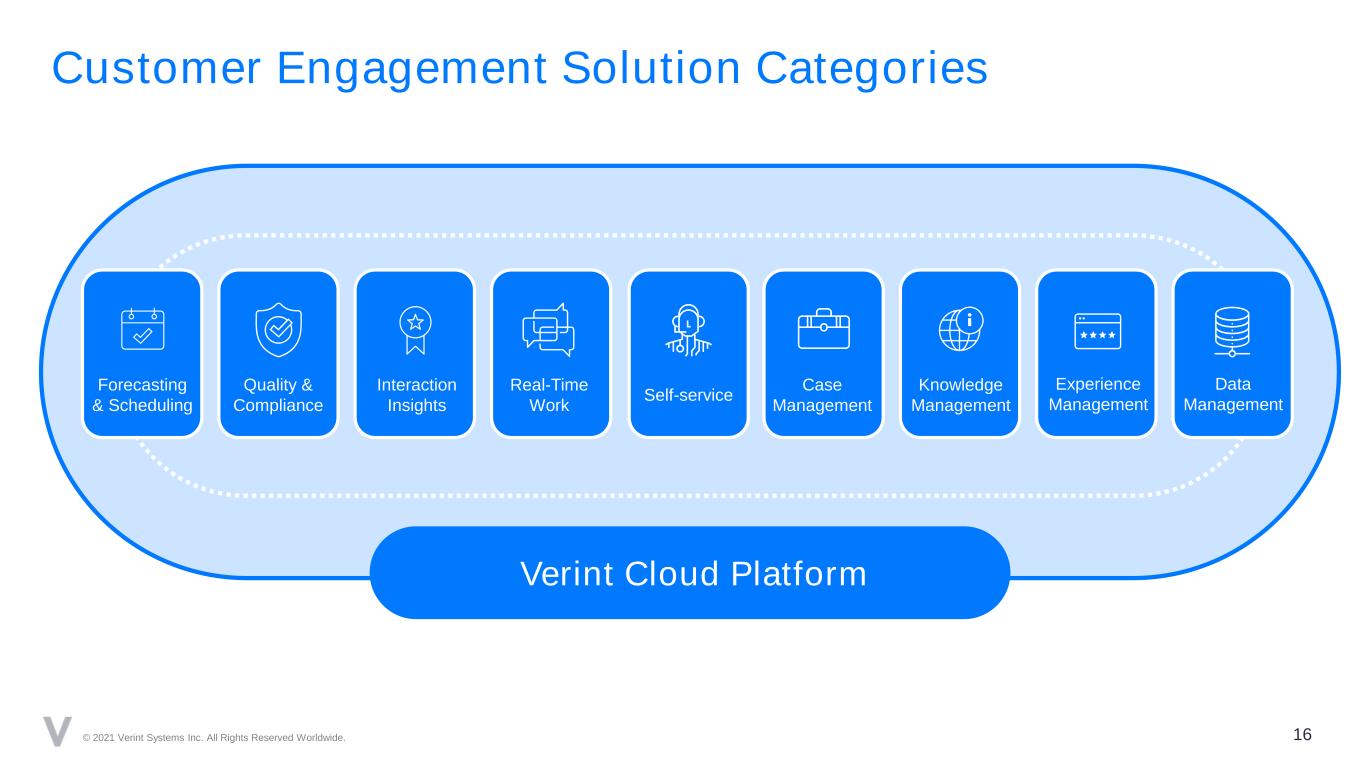
© 2021 Verint Systems Inc. All Rights Reserved Worldwide. 16 Customer Engagement Solution Categories Verint Cloud Platform Forecasting & Scheduling Quality & Compliance Interaction Insights Real-Time Work Self-service Data Management Experience Management Knowledge Management Case Management
© 2021 Verint Systems Inc. All Rights Reserved Worldwide. Verint’s Go-to-Market Growth Strategy 17

© 2021 Verint Systems Inc. All Rights Reserved Worldwide. 18 Go-to-Market Growth Strategy Customer Base PartnersNew Logos GROWTH PILLARS
© 2021 Verint Systems Inc. All Rights Reserved Worldwide. 19 Verint is Trusted by World’s Most Iconic Brands Mission Critical Solutions and Strong Renewal Rates • 85% of Fortune 100 companies • 10,000 customers • Across 175 countries • Financial Services • Healthcare • Utilities • Public Sector Large, Global Customer Base Across Many Industries
© 2021 Verint Systems Inc. All Rights Reserved Worldwide. 20 Winning New Logos Why We Win RESTRICTED INTERNAL USE ONLY. No external distribution of these materials permitted. Confidential and proprietary information of Verint Systems Inc. © 2020 Verint Systems Inc. All Rights Reserved Worldwide. • Openness of Cloud Platform • Breadth and Depth of Application Portfolio • Domain Expertise • Partner Ecosystem © 2021 Verint Systems Inc. All Rights Reserved Worldwide.
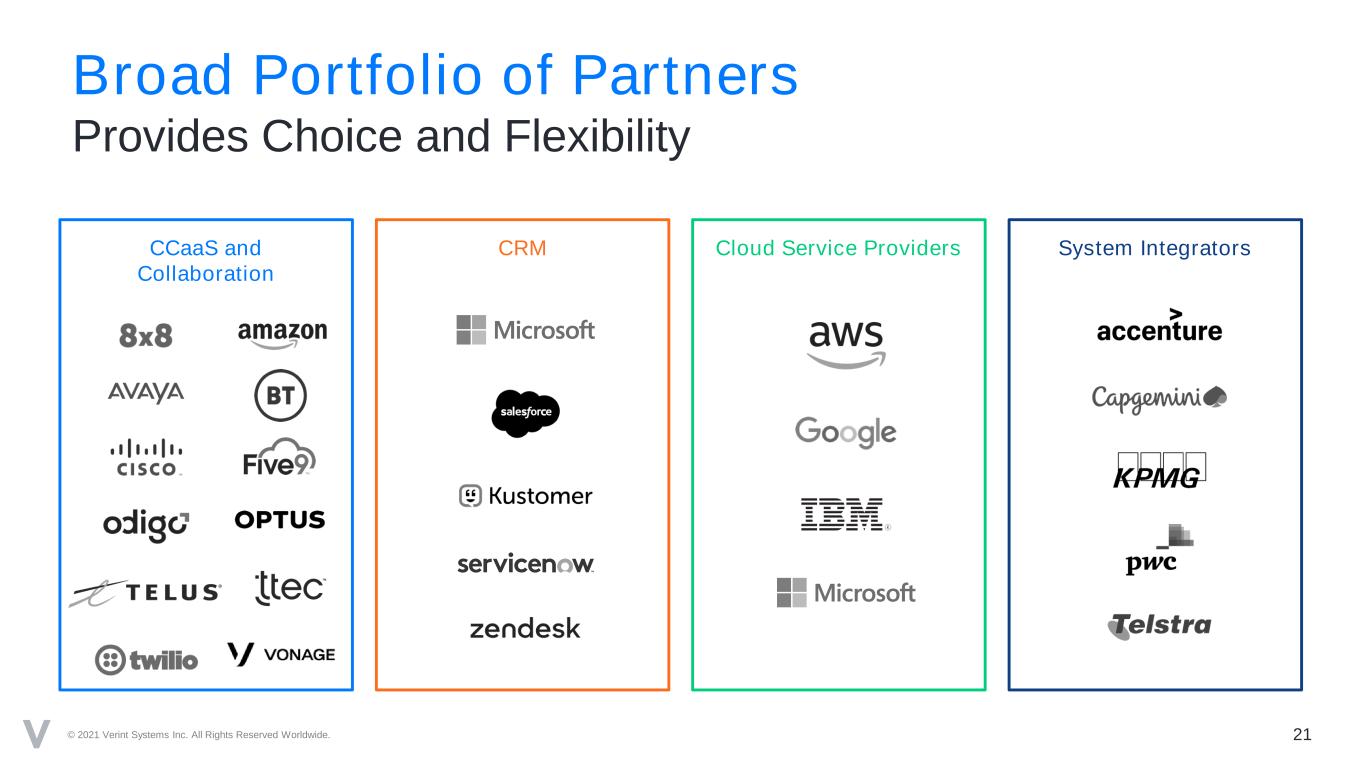
© 2021 Verint Systems Inc. All Rights Reserved Worldwide. 21 Broad Portfolio of Partners Provides Choice and Flexibility CCaaS and Collaboration CRM Cloud Service Providers System Integrators

Customer Engagement Market 22© 2021 Verint Systems Inc. All Rights Reserved Worldwide.
© 2021 Verint Systems Inc. All Rights Reserved Worldwide. 23 Customer Engagement is Being Disrupted by DX In today’s digital world, the rules of customer engagement are changing. To continue acquiring and retaining customers, organizations need to recognize this and adapt to these new dynamics. The Digital Transformation of Customer Service By 2022, 70% of all organizations will have accelerated use of digital technologies, transforming existing business processes to drive customer engagement, employee productivity….”
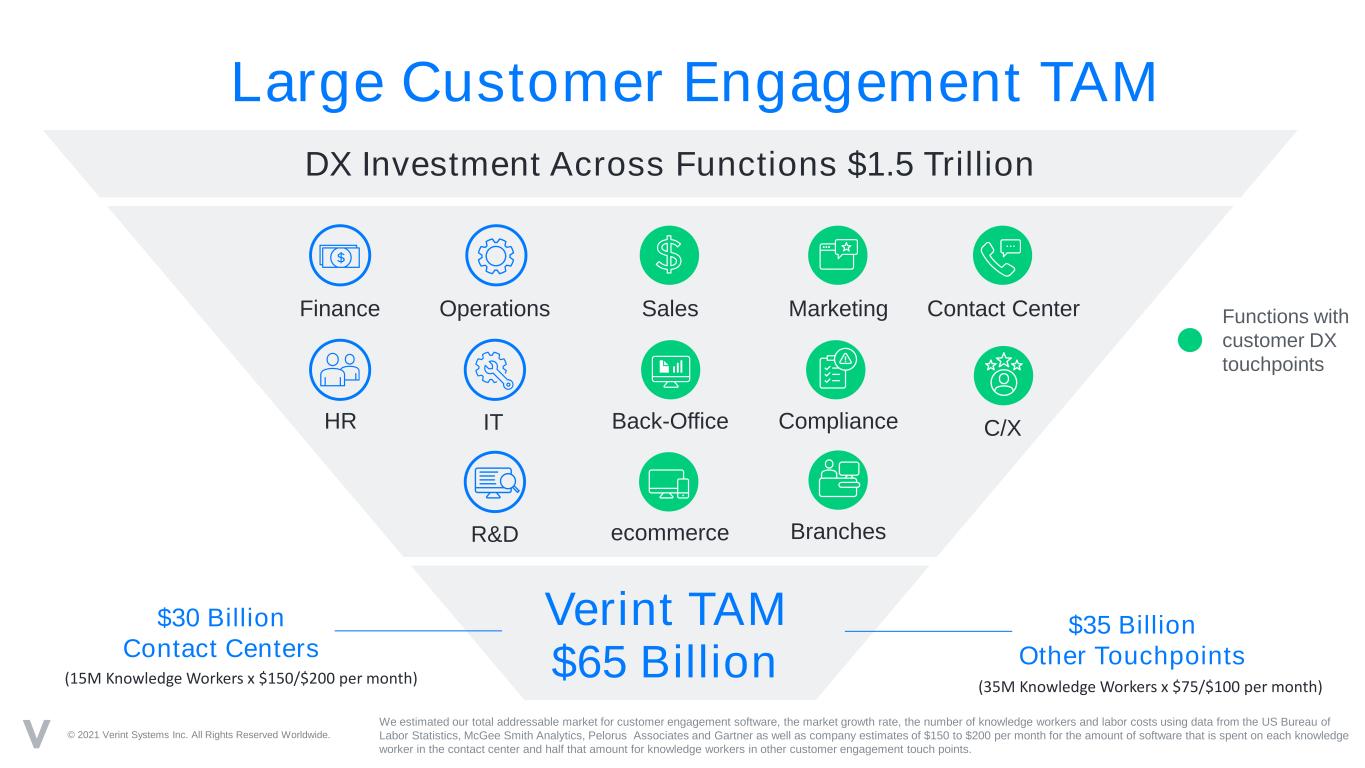
© 2021 Verint Systems Inc. All Rights Reserved Worldwide. 24 Large Customer Engagement TAM DX Investment Across Functions $1.5 Trillion Verint TAM $65 Billion Functions with customer DX touchpoints Contact Center Back-Office Compliance C/XIT MarketingFinance Operations ecommerceR&D Branches HR Sales $30 Billion Contact Centers $35 Billion Other Touchpoints We estimated our total addressable market for customer engagement software, the market growth rate, the number of knowledge workers and labor costs using data from the US Bureau of Labor Statistics, McGee Smith Analytics, Pelorus Associates and Gartner as well as company estimates of $150 to $200 per month for the amount of software that is spent on each knowledge worker in the contact center and half that amount for knowledge workers in other customer engagement touch points. (35M Knowledge Workers x $75/$100 per month)(15M Knowledge Workers x $150/$200 per month)
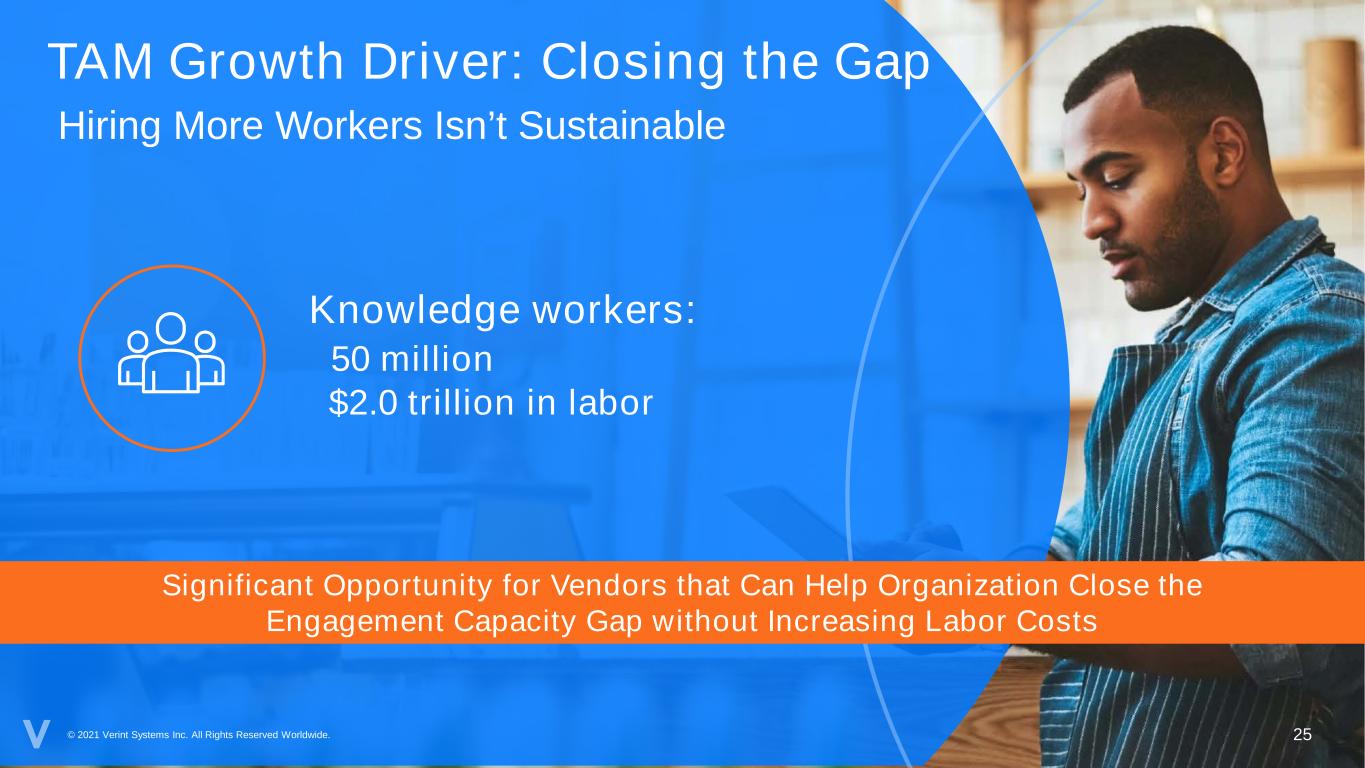
© 2021 Verint Systems Inc. All Rights Reserved Worldwide. TAM Growth Driver: Closing the Gap 25 Significant Opportunity for Vendors that Can Help Organization Close the Engagement Capacity Gap without Increasing Labor Costs Knowledge workers: 50 million $2.0 trillion in labor Hiring More Workers Isn’t Sustainable

© 2021 Verint Systems Inc. All Rights Reserved Worldwide. Financial Review 26
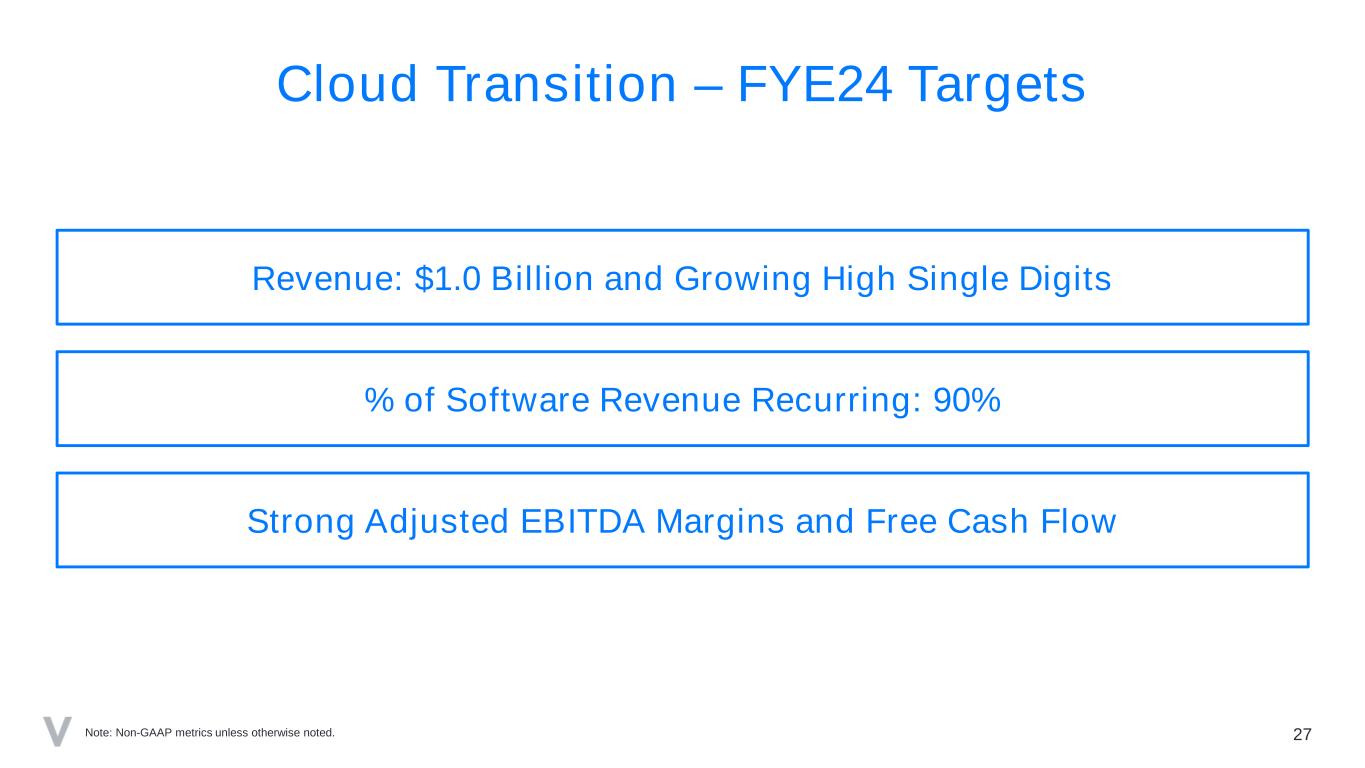
27 Cloud Transition – FYE24 Targets Revenue: $1.0 Billion and Growing High Single Digits % of Software Revenue Recurring: 90% Strong Adjusted EBITDA Margins and Free Cash Flow Note: Non-GAAP metrics unless otherwise noted.
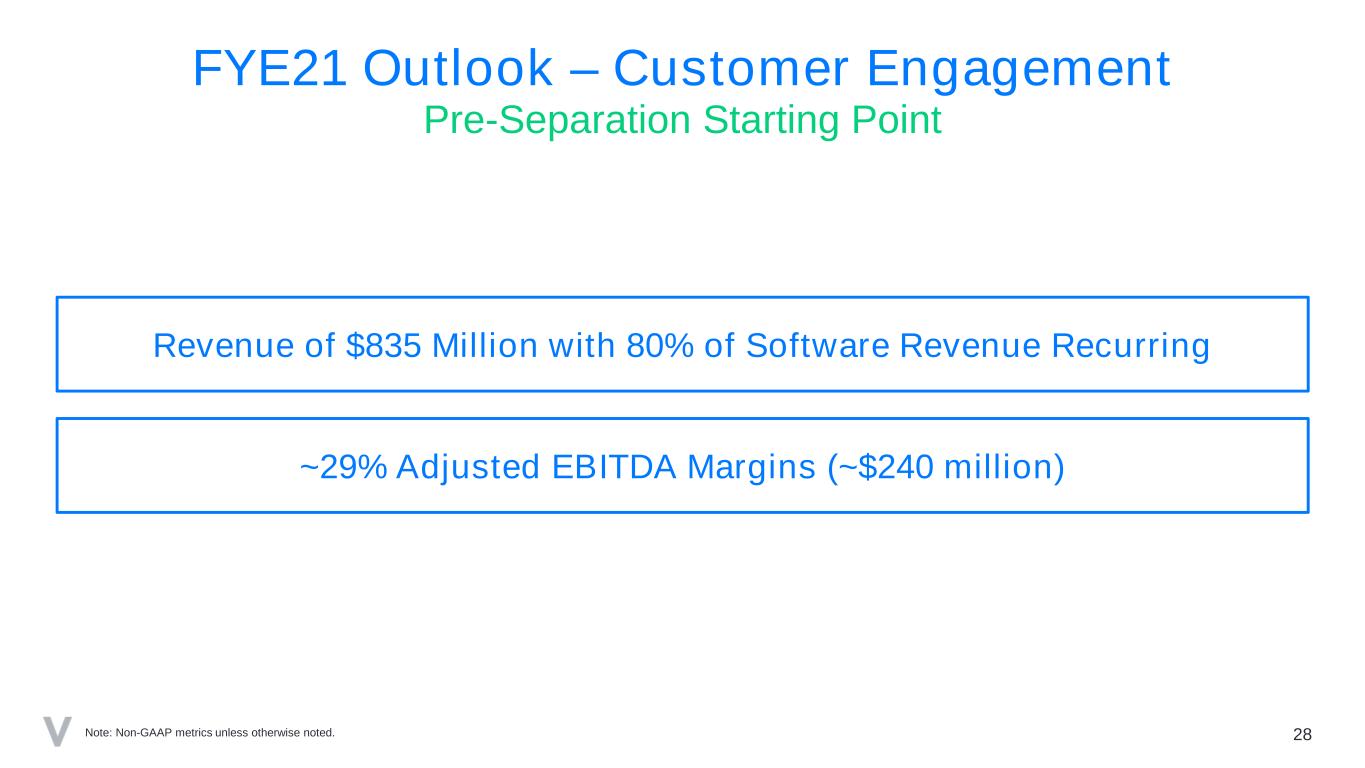
28 FYE21 Outlook – Customer Engagement Pre-Separation Starting Point Revenue of $835 Million with 80% of Software Revenue Recurring ~29% Adjusted EBITDA Margins (~$240 million) Note: Non-GAAP metrics unless otherwise noted.
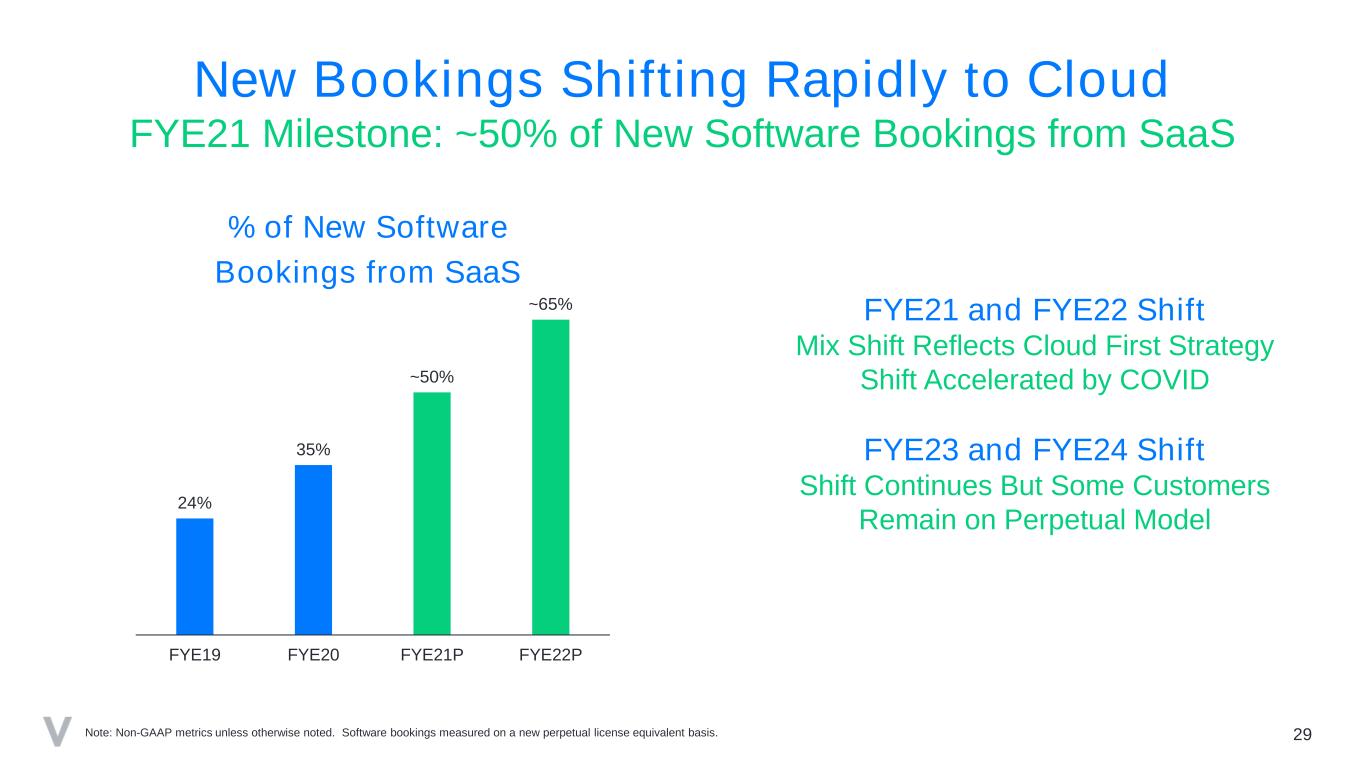
24% 35% ~50% ~65% FYE19 FYE20 FYE21P FYE22P 29 % of New Software Bookings from SaaS New Bookings Shifting Rapidly to Cloud Note: Non-GAAP metrics unless otherwise noted. Software bookings measured on a new perpetual license equivalent basis. FYE21 and FYE22 Shift Mix Shift Reflects Cloud First Strategy Shift Accelerated by COVID FYE23 and FYE24 Shift Shift Continues But Some Customers Remain on Perpetual Model FYE21 Milestone: ~50% of New Software Bookings from SaaS
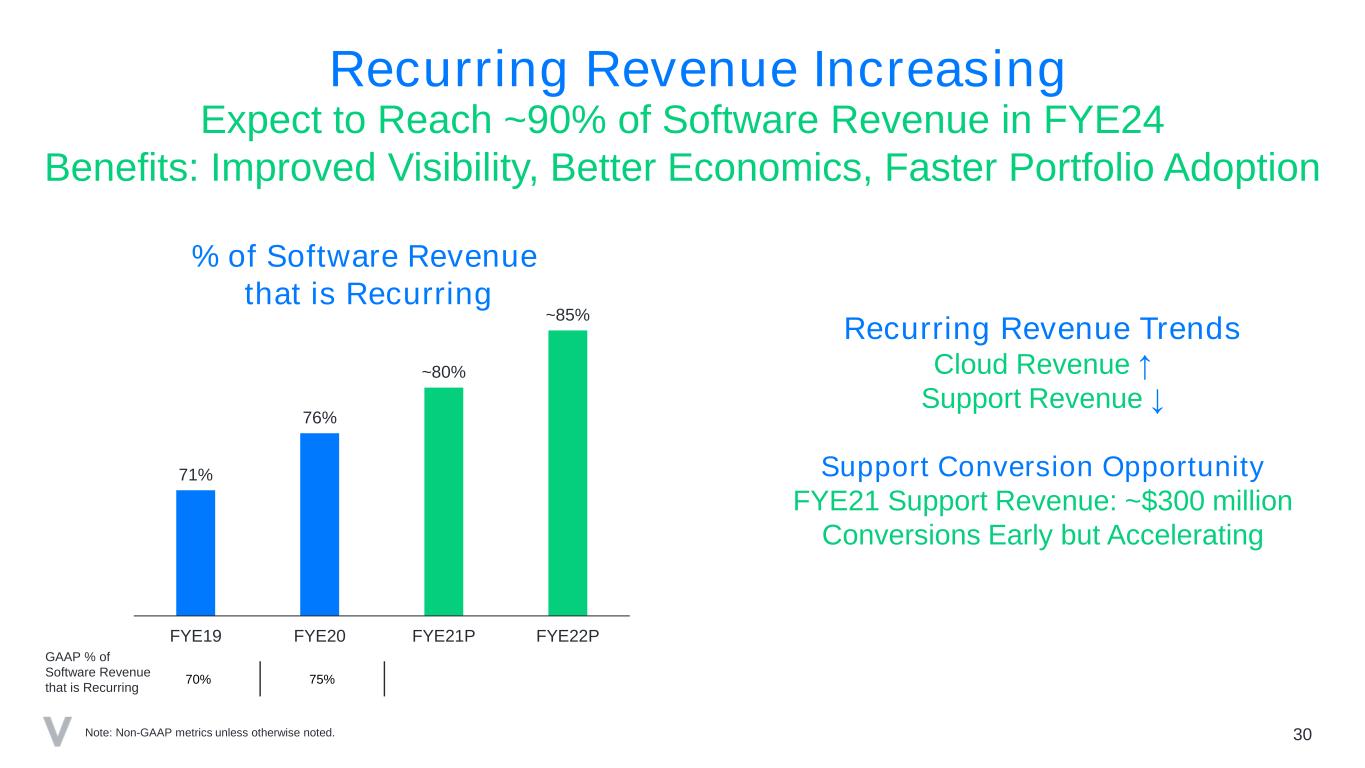
71% 76% ~80% ~85% FYE19 FYE20 FYE21P FYE22P 30 % of Software Revenue that is Recurring Recurring Revenue Increasing Note: Non-GAAP metrics unless otherwise noted. 70% 75% GAAP % of Software Revenue that is Recurring Recurring Revenue Trends Cloud Revenue ↑ Support Revenue ↓ Support Conversion Opportunity FYE21 Support Revenue: ~$300 million Conversions Early but Accelerating Expect to Reach ~90% of Software Revenue in FYE24 Benefits: Improved Visibility, Better Economics, Faster Portfolio Adoption

31 Three-Year Target CAGR: ~30% Cloud Revenue Growth Accelerating Note: Millions of USD. Non-GAAP metrics unless otherwise noted. FYE21 20% cloud revenue growth excludes ForeSee. Cloud revenue includes unbundled SaaS support revenue which had previously been reported in support revenue. FYE21 Growth: ~20% ~15% of Growth from New Deployments ~5% of Growth from Support Conversions FYE22 Growth: Expect Acceleration to ~30% ~15% of Growth from New Deployments ~15% of Growth from Support Conversions FYE22 – FYE24: Targeting ~30% CAGR ~$275 >$350 FYE21P FYE22P Cloud Revenue
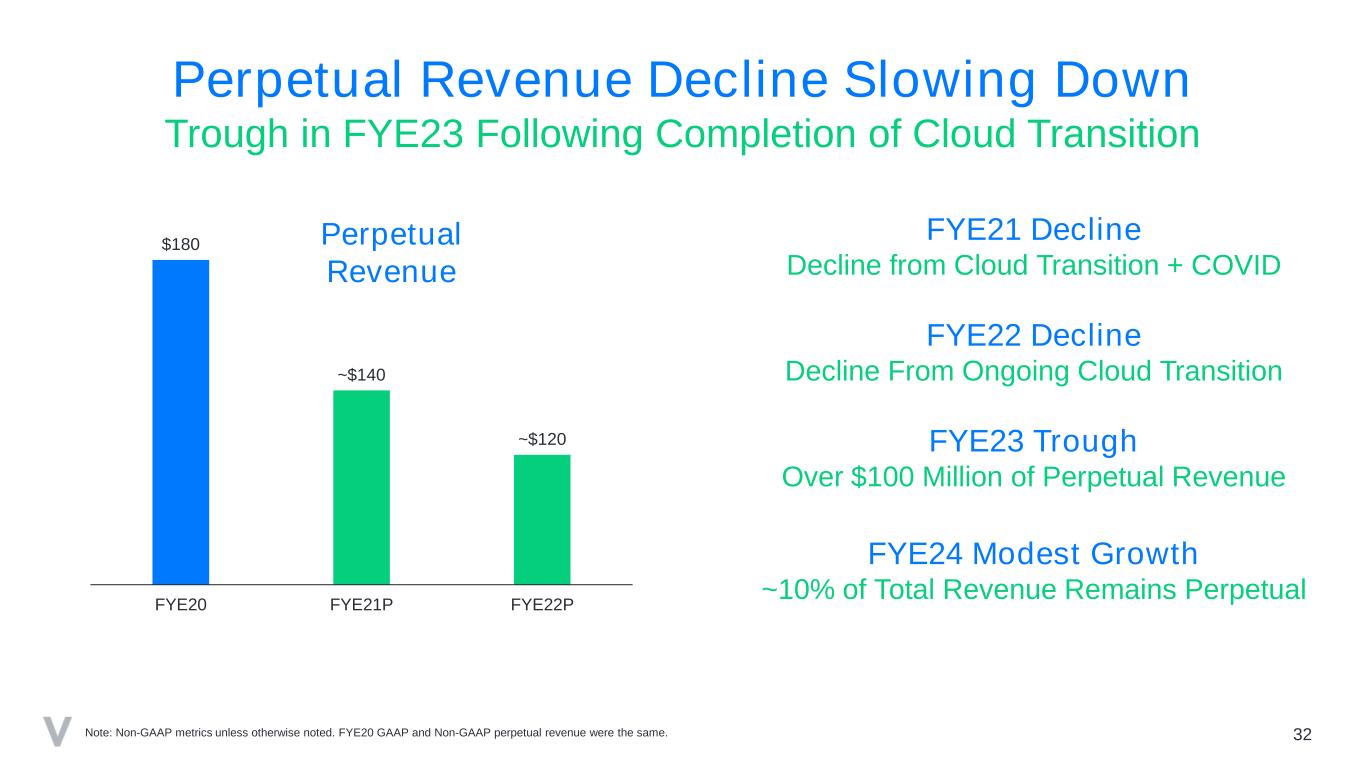
32Note: Non-GAAP metrics unless otherwise noted. FYE20 GAAP and Non-GAAP perpetual revenue were the same. FYE21 Decline Decline from Cloud Transition + COVID FYE22 Decline Decline From Ongoing Cloud Transition FYE23 Trough Over $100 Million of Perpetual Revenue FYE24 Modest Growth ~10% of Total Revenue Remains Perpetual $180 ~$140 ~$120 FYE20 FYE21P FYE22P Trough in FYE23 Following Completion of Cloud Transition Perpetual Revenue Decline Slowing Down Perpetual Revenue
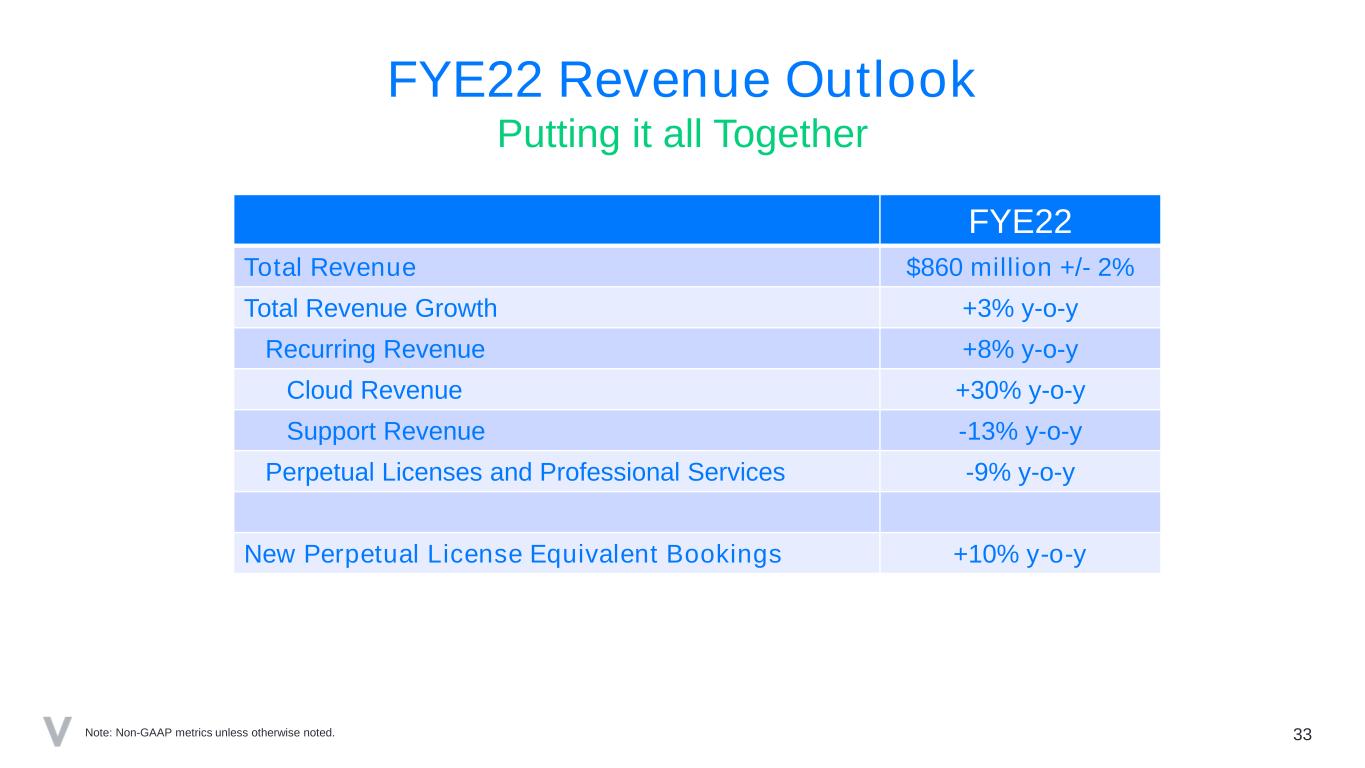
33 FYE22 Revenue Outlook Note: Non-GAAP metrics unless otherwise noted. FYE22 Total Revenue $860 million +/- 2% Total Revenue Growth +3% y-o-y Recurring Revenue +8% y-o-y Cloud Revenue +30% y-o-y Support Revenue -13% y-o-y Perpetual Licenses and Professional Services -9% y-o-y New Perpetual License Equivalent Bookings +10% y-o-y Putting it all Together

34 FYE22 – FYE24 Revenue Growth Outlook Note: Non-GAAP metrics unless otherwise noted. Revenue Growth Accelerates as Cloud Transition Completed FYE22 Overall Revenue Growth Rate: Low-Single Digits Recurring Revenue Growth of 8% with Non-Recurring Revenue Headwind FYE23 Overall Revenue Growth Rate: Mid-Single Digits Non-Recurring Revenue Headwind Reaches its Trough FYE24 Overall Revenue Growth Rate: High-Single Digits Targeting Total Revenue of $1 billion with 90% of Software Revenue Recurring
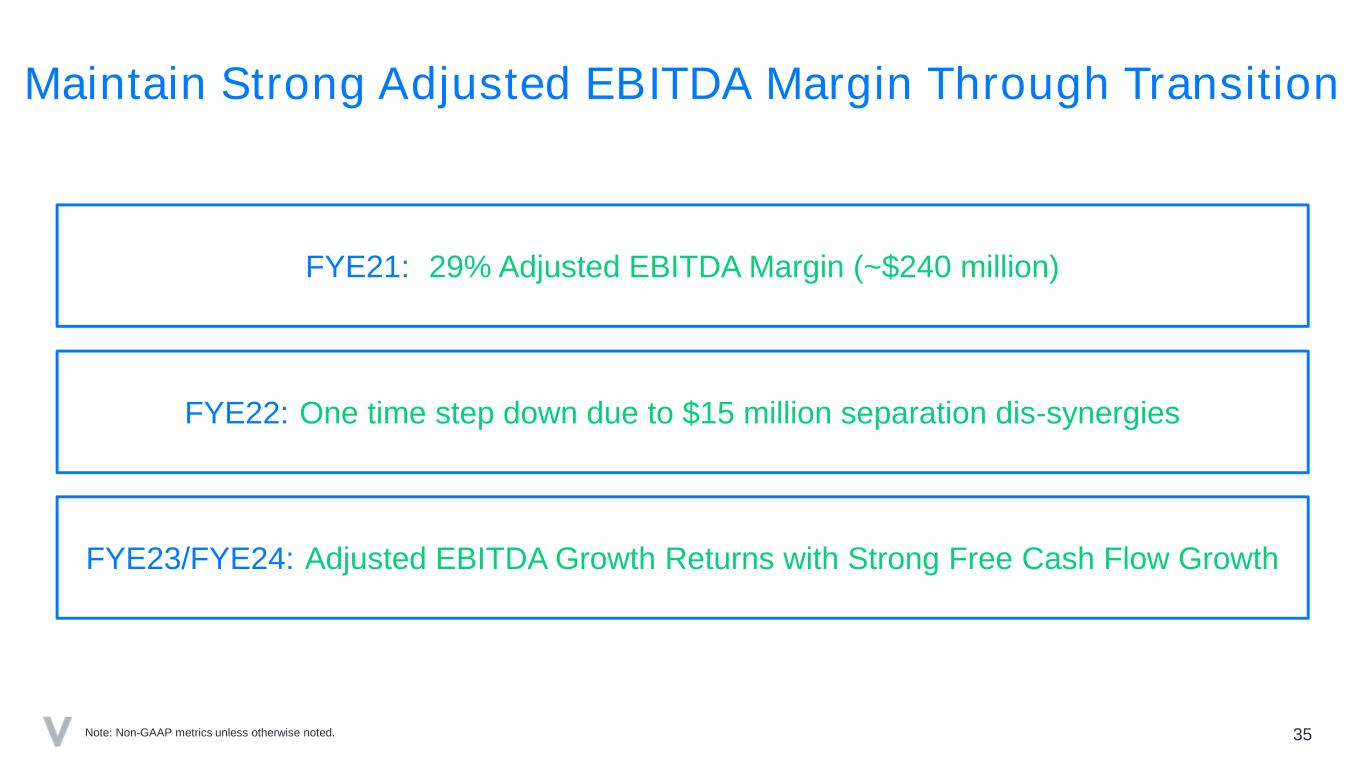
35 Maintain Strong Adjusted EBITDA Margin Through Transition FYE21: 29% Adjusted EBITDA Margin (~$240 million) FYE22: One time step down due to $15 million separation dis-synergies FYE23/FYE24: Adjusted EBITDA Growth Returns with Strong Free Cash Flow Growth Note: Non-GAAP metrics unless otherwise noted.

Separation Model 36© 2021 Verint Systems Inc. All Rights Reserved Worldwide.
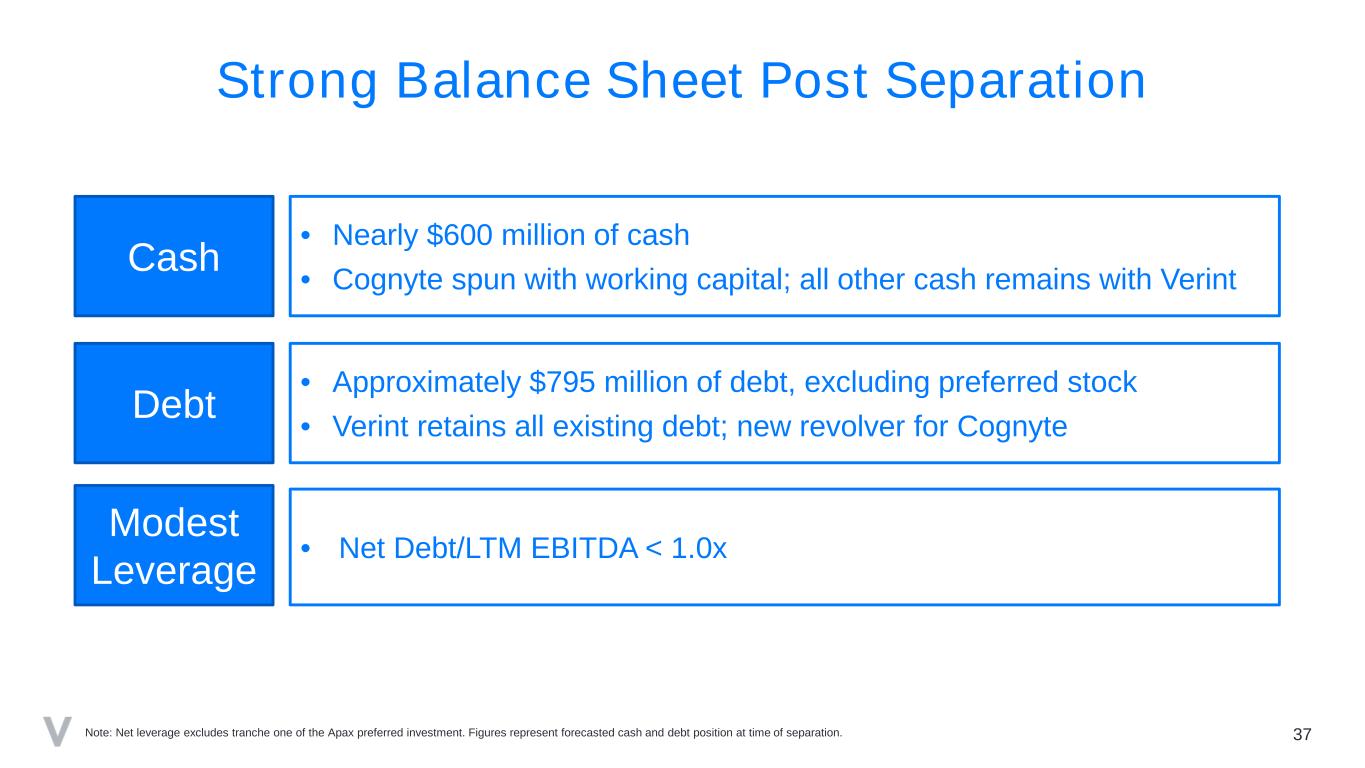
Strong Balance Sheet Post Separation • Approximately $795 million of debt, excluding preferred stock • Verint retains all existing debt; new revolver for Cognyte 37Note: Net leverage excludes tranche one of the Apax preferred investment. Figures represent forecasted cash and debt position at time of separation. Cash • Nearly $600 million of cash • Cognyte spun with working capital; all other cash remains with Verint Debt Modest Leverage • Net Debt/LTM EBITDA < 1.0x

FYE22 Diluted EPS Bridge ~$3.45 EPS “As Is” ~$2.45 EPS Before Dis-Synergies 38 ~$2.20 EPSSeparationDis-Synergies and Inefficiencies Interest Expense: ~$19 million Shares: ~73 million Tax Rate: ~10% Cognyte Separation Note: Non-GAAP metrics unless otherwise noted. EPS outlook does not reflect the second tranche of the APAX preferred investment which we expect to close in Q1.
39 Summary Pure Play Customer Engagement Company Large TAM and Clear Strategy Strong Capital Structure Positive Outlook
40 Appendix © 2020 Verint Systems Inc. All Rights Reserved Worldwide.
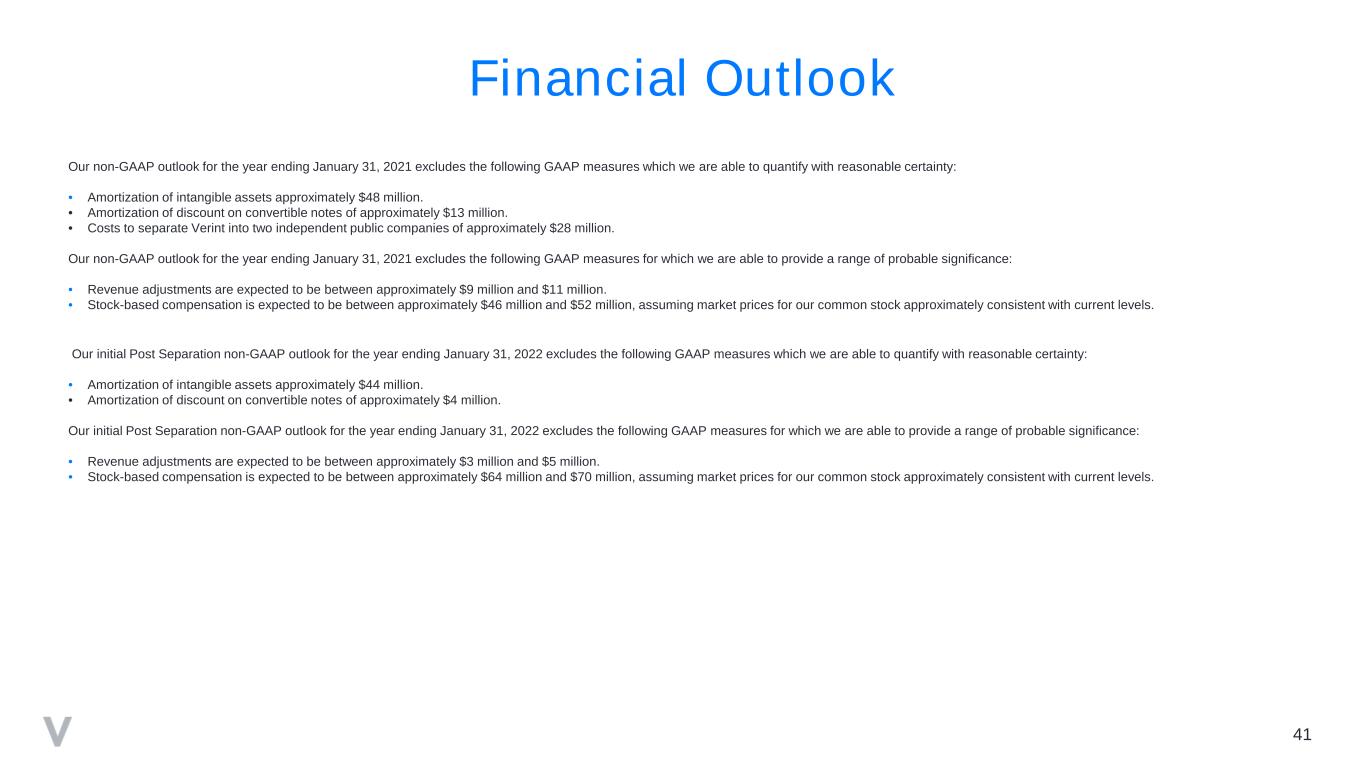
41 Financial Outlook Our non-GAAP outlook for the year ending January 31, 2021 excludes the following GAAP measures which we are able to quantify with reasonable certainty: • Amortization of intangible assets approximately $48 million. • Amortization of discount on convertible notes of approximately $13 million. • Costs to separate Verint into two independent public companies of approximately $28 million. Our non-GAAP outlook for the year ending January 31, 2021 excludes the following GAAP measures for which we are able to provide a range of probable significance: • Revenue adjustments are expected to be between approximately $9 million and $11 million. • Stock-based compensation is expected to be between approximately $46 million and $52 million, assuming market prices for our common stock approximately consistent with current levels. Our initial Post Separation non-GAAP outlook for the year ending January 31, 2022 excludes the following GAAP measures which we are able to quantify with reasonable certainty: • Amortization of intangible assets approximately $44 million. • Amortization of discount on convertible notes of approximately $4 million. Our initial Post Separation non-GAAP outlook for the year ending January 31, 2022 excludes the following GAAP measures for which we are able to provide a range of probable significance: • Revenue adjustments are expected to be between approximately $3 million and $5 million. • Stock-based compensation is expected to be between approximately $64 million and $70 million, assuming market prices for our common stock approximately consistent with current levels.
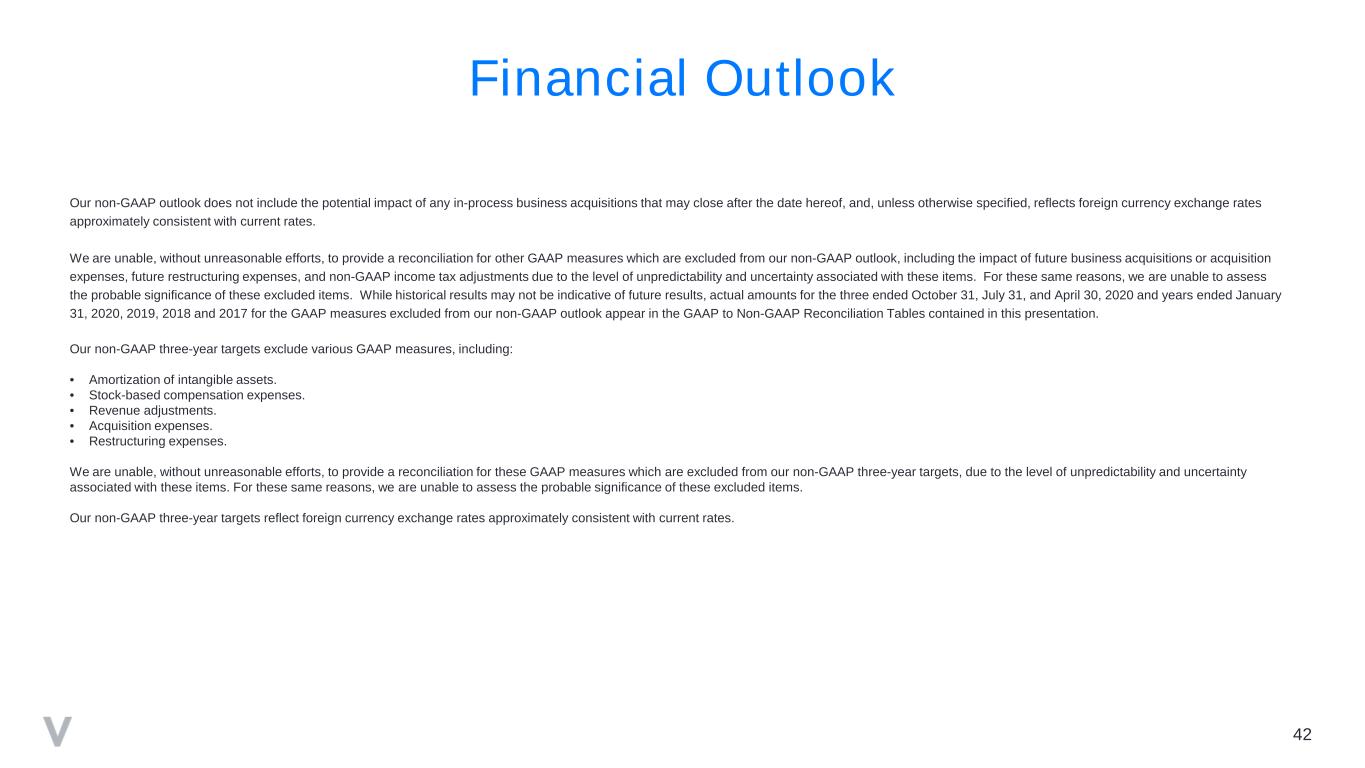
42 Financial Outlook Our non-GAAP outlook does not include the potential impact of any in-process business acquisitions that may close after the date hereof, and, unless otherwise specified, reflects foreign currency exchange rates approximately consistent with current rates. We are unable, without unreasonable efforts, to provide a reconciliation for other GAAP measures which are excluded from our non-GAAP outlook, including the impact of future business acquisitions or acquisition expenses, future restructuring expenses, and non-GAAP income tax adjustments due to the level of unpredictability and uncertainty associated with these items. For these same reasons, we are unable to assess the probable significance of these excluded items. While historical results may not be indicative of future results, actual amounts for the three ended October 31, July 31, and April 30, 2020 and years ended January 31, 2020, 2019, 2018 and 2017 for the GAAP measures excluded from our non-GAAP outlook appear in the GAAP to Non-GAAP Reconciliation Tables contained in this presentation. Our non-GAAP three-year targets exclude various GAAP measures, including: • Amortization of intangible assets. • Stock-based compensation expenses. • Revenue adjustments. • Acquisition expenses. • Restructuring expenses. We are unable, without unreasonable efforts, to provide a reconciliation for these GAAP measures which are excluded from our non-GAAP three-year targets, due to the level of unpredictability and uncertainty associated with these items. For these same reasons, we are unable to assess the probable significance of these excluded items. Our non-GAAP three-year targets reflect foreign currency exchange rates approximately consistent with current rates.
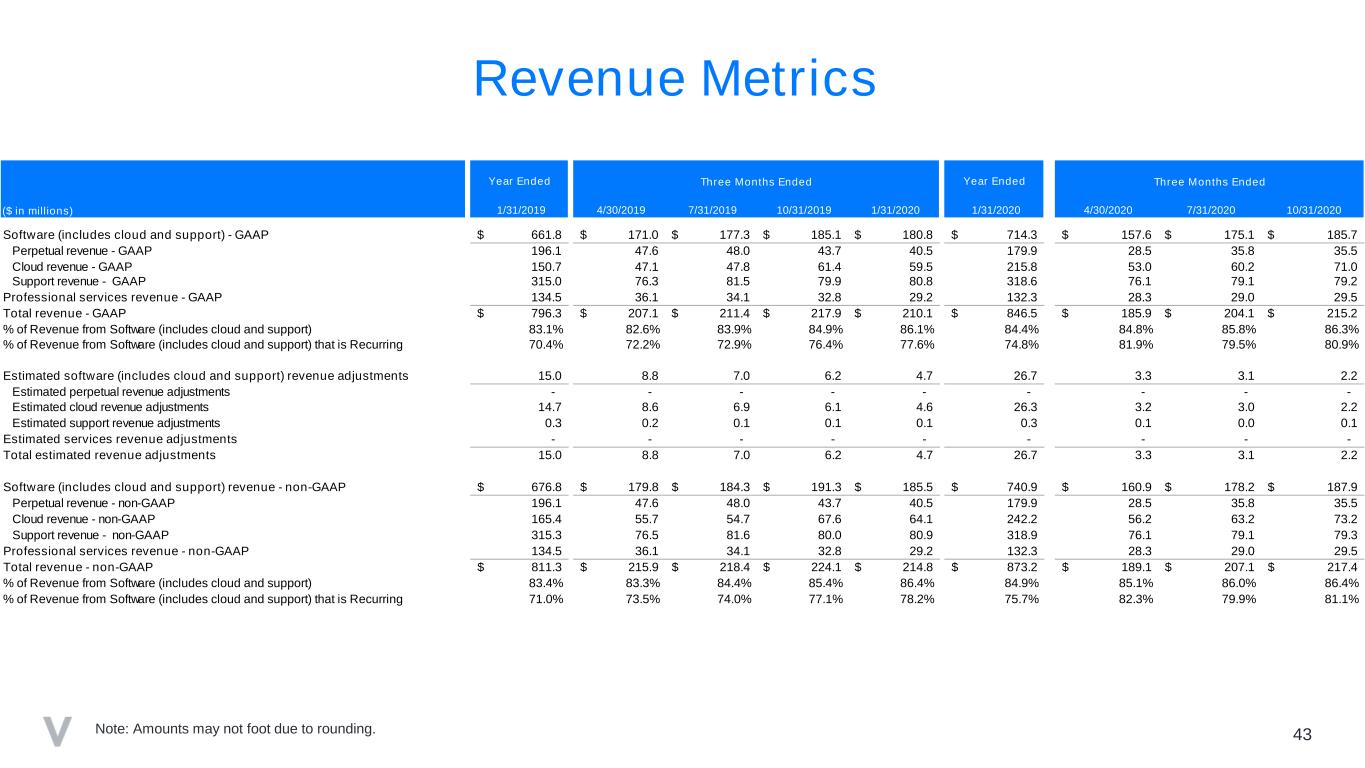
43 Revenue Metrics Note: Amounts may not foot due to rounding. Year Ended Year Ended ($ in millions) 1/31/2019 4/30/2019 7/31/2019 10/31/2019 1/31/2020 1/31/2020 4/30/2020 7/31/2020 10/31/2020 Software (includes cloud and support) - GAAP 661.8$ 171.0$ 177.3$ 185.1$ 180.8$ 714.3$ 157.6$ 175.1$ 185.7$ Perpetual revenue - GAAP 196.1 47.6 48.0 43.7 40.5 179.9 28.5 35.8 35.5 Cloud revenue - GAAP 150.7 47.1 47.8 61.4 59.5 215.8 53.0 60.2 71.0 Support revenue - GAAP 315.0 76.3 81.5 79.9 80.8 318.6 76.1 79.1 79.2 Professional services revenue - GAAP 134.5 36.1 34.1 32.8 29.2 132.3 28.3 29.0 29.5 Total revenue - GAAP 796.3$ 207.1$ 211.4$ 217.9$ 210.1$ 846.5$ 185.9$ 204.1$ 215.2$ % of Revenue from Software (includes cloud and support) 83.1% 82.6% 83.9% 84.9% 86.1% 84.4% 84.8% 85.8% 86.3% % of Revenue from Software (includes cloud and support) that is Recurring 70.4% 72.2% 72.9% 76.4% 77.6% 74.8% 81.9% 79.5% 80.9% Estimated software (includes cloud and support) revenue adjustments 15.0 8.8 7.0 6.2 4.7 26.7 3.3 3.1 2.2 Estimated perpetual revenue adjustments - - - - - - - - - Estimated cloud revenue adjustments 14.7 8.6 6.9 6.1 4.6 26.3 3.2 3.0 2.2 Estimated support revenue adjustments 0.3 0.2 0.1 0.1 0.1 0.3 0.1 0.0 0.1 Estimated services revenue adjustments - - - - - - - - - Total estimated revenue adjustments 15.0 8.8 7.0 6.2 4.7 26.7 3.3 3.1 2.2 Software (includes cloud and support) revenue - non-GAAP 676.8$ 179.8$ 184.3$ 191.3$ 185.5$ 740.9$ 160.9$ 178.2$ 187.9$ Perpetual revenue - non-GAAP 196.1 47.6 48.0 43.7 40.5 179.9 28.5 35.8 35.5 Cloud revenue - non-GAAP 165.4 55.7 54.7 67.6 64.1 242.2 56.2 63.2 73.2 Support revenue - non-GAAP 315.3 76.5 81.6 80.0 80.9 318.9 76.1 79.1 79.3 Professional services revenue - non-GAAP 134.5 36.1 34.1 32.8 29.2 132.3 28.3 29.0 29.5 Total revenue - non-GAAP 811.3$ 215.9$ 218.4$ 224.1$ 214.8$ 873.2$ 189.1$ 207.1$ 217.4$ % of Revenue from Software (includes cloud and support) 83.4% 83.3% 84.4% 85.4% 86.4% 84.9% 85.1% 86.0% 86.4% % of Revenue from Software (includes cloud and support) that is Recurring 71.0% 73.5% 74.0% 77.1% 78.2% 75.7% 82.3% 79.9% 81.1% Three Months Ended Three Months Ended

44 Cloud Metrics Note: Amounts may not foot due to rounding. Year Ended Year Ended ($ in millions) 1/31/2019 4/30/2019 7/31/2019 10/31/2019 1/31/2020 1/31/2020 4/30/2020 7/31/2020 10/31/2020 SaaS revenue - GAAP 109.6$ 33.5$ 33.6$ 47.2$ 45.0$ 159.3$ 38.9$ 45.9$ 56.1$ Bundled SaaS revenue - GAAP 84.7 27.2 27.2 30.1 31.4 115.9 33.4 35.8 37.4 Unbundled SaaS revenue - GAAP 24.9 6.3 6.4 17.1 13.6 43.4 5.5 10.1 18.7 Optional managed services revenue - GAAP 41.1 13.6 14.2 14.2 14.5 56.5 14.1 14.3 14.9 Cloud revenue - GAAP 150.7$ 47.1$ 47.8$ 61.4$ 59.5$ 215.8$ 53.0$ 60.2$ 71.0$ Estimated SaaS revenue adjustments 12.5 8.0 6.4 5.7 4.3 24.5 2.9 2.8 1.9 Estimated bundled SaaS revenue adjustments 9.7 7.2 6.4 5.7 4.2 23.5 2.9 2.7 1.9 Estimated unbundled SaaS revenue adjustments 2.8 0.8 0.1 0.0 0.0 1.0 0.0 0.0 0.0 Estimated optional managed services revenue adjustments 2.2 0.6 0.5 0.4 0.4 1.9 0.3 0.3 0.2 Estimated cloud revenue adjustments 14.7 8.6 6.9 6.1 4.6 26.3 3.2 3.0 2.2 SaaS revenue - non-GAAP 122.1 41.5 40.1 52.9 49.2 183.8 41.8 48.6 58.1 Bundled SaaS revenue - non-GAAP 94.4 34.4 33.6 35.8 35.6 139.4 36.3 38.5 39.3 Unbundled SaaS revenue - non-GAAP 27.7 7.1 6.5 17.1 13.6 44.3 5.5 10.1 18.8 Optional managed services revenue - non-GAAP 43.3 14.2 14.6 14.7 14.9 58.4 14.4 14.6 15.1 Cloud revenue - non-GAAP 165.4$ 55.7$ 54.7$ 67.6$ 64.1$ 242.2$ 56.2$ 63.2$ 73.2$ Three Months Ended Three Months Ended
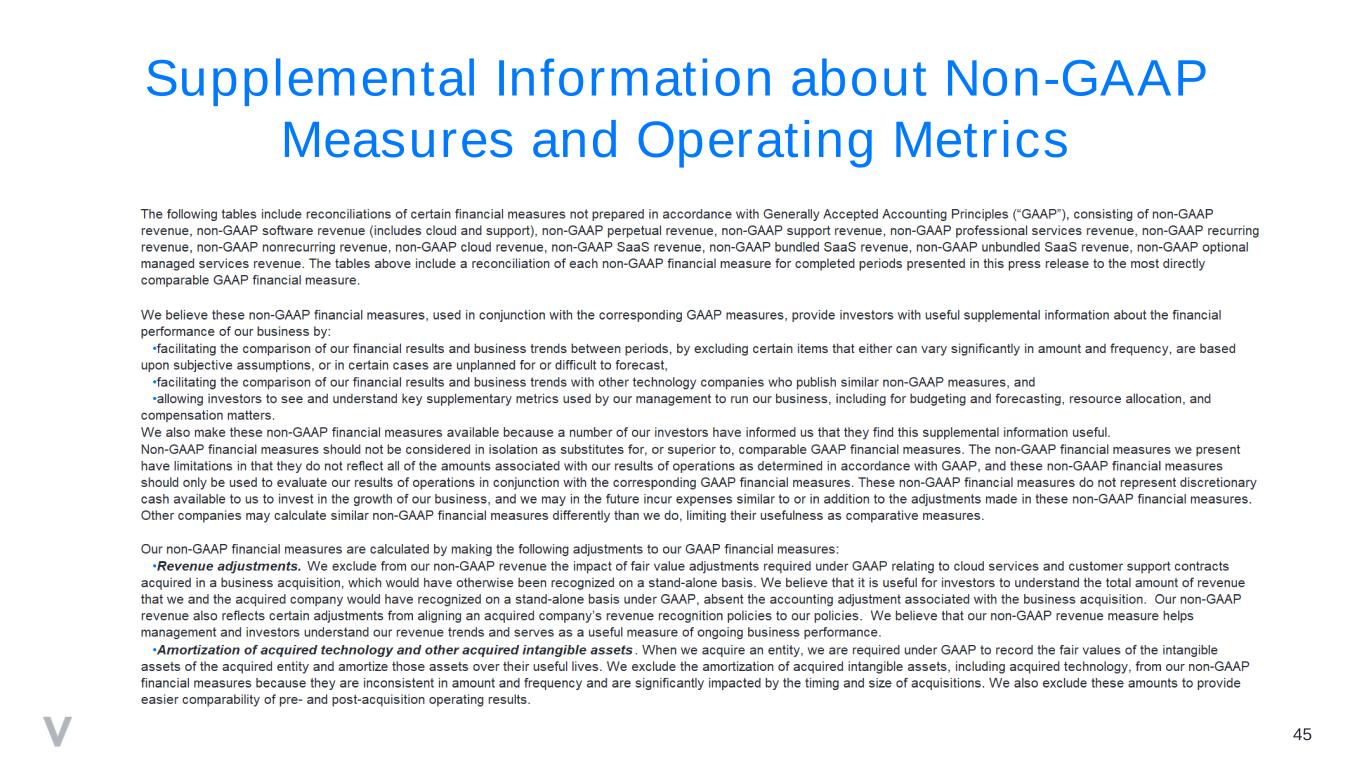
45 Supplemental Information about Non-GAAP Measures and Operating Metrics
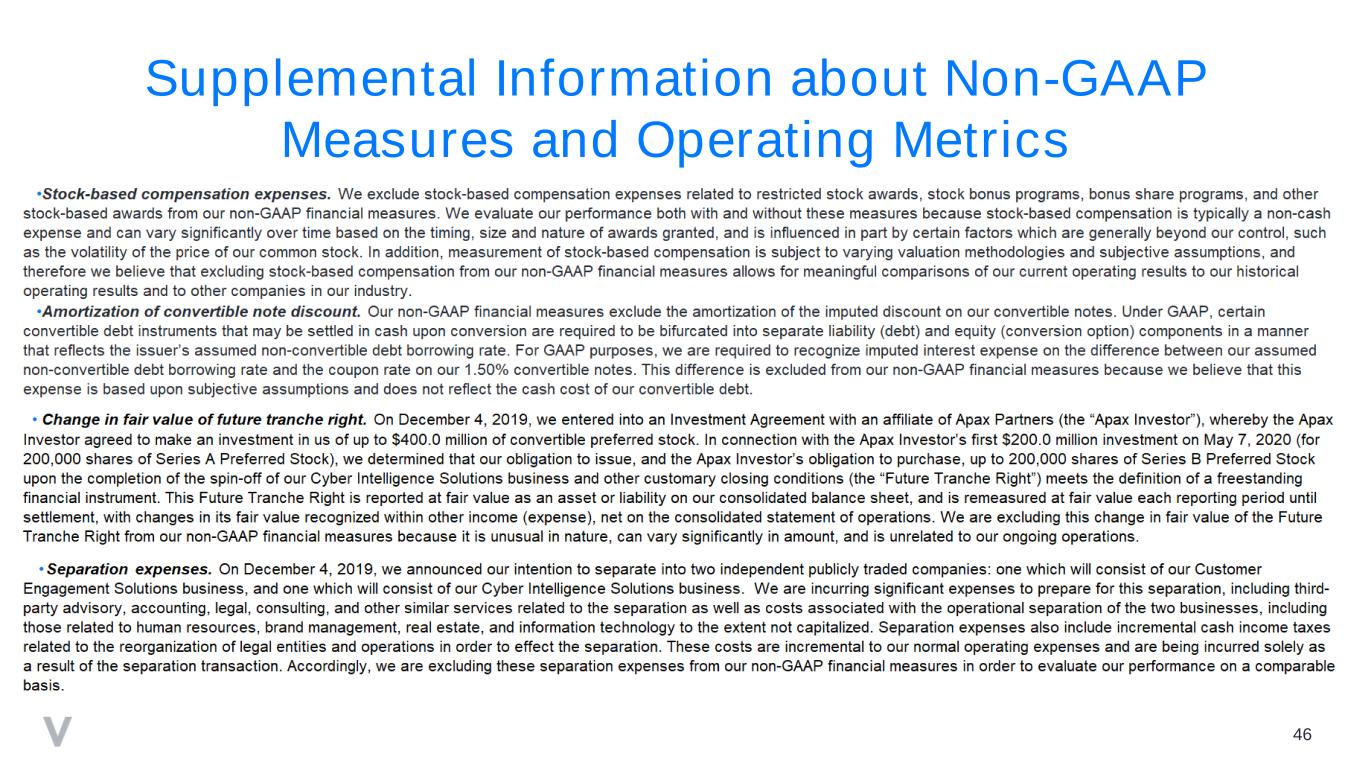
46 Supplemental Information about Non-GAAP Measures and Operating Metrics

47 Supplemental Information about Non-GAAP Measures and Operating Metrics
