Attached files
| file | filename |
|---|---|
| EX-99.3 - EX-99.3 - GOLDMAN SACHS GROUP INC | d40648dex993.htm |
| EX-99.1 - EX-99.1 - GOLDMAN SACHS GROUP INC | d40648dex991.htm |
| 8-K - 8-K - GOLDMAN SACHS GROUP INC | d40648d8k.htm |
Exhibit 99.2 Full Year and Fourth Quarter 2020 Earnings Results Presentation January 19, 2021Exhibit 99.2 Full Year and Fourth Quarter 2020 Earnings Results Presentation January 19, 2021
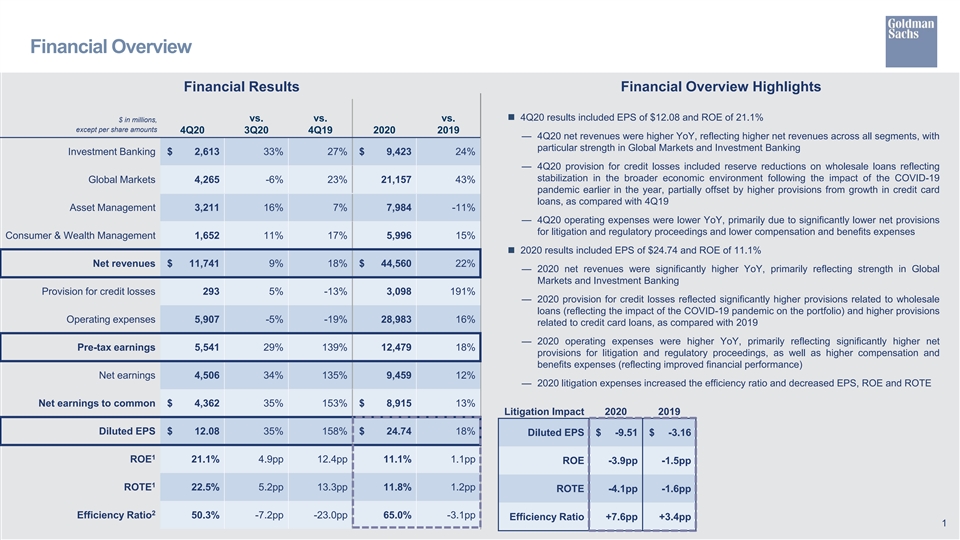
Financial Overview Financial Results Financial Overview Highlights n 4Q20 results included EPS of $12.08 and ROE of 21.1% $ in millions, vs. vs. vs. except per share amounts 4Q20 3Q20 4Q19 2020 2019 — 4Q20 net revenues were higher YoY, reflecting higher net revenues across all segments, with particular strength in Global Markets and Investment Banking Investment Banking $ 2,613 33% 27% $ 9,423 24% — 4Q20 provision for credit losses included reserve reductions on wholesale loans reflecting stabilization in the broader economic environment following the impact of the COVID-19 Global Markets 4,265 -6% 23% 21,157 43% pandemic earlier in the year, partially offset by higher provisions from growth in credit card loans, as compared with 4Q19 Asset Management 3,211 16% 7% 7,984 -11% — 4Q20 operating expenses were lower YoY, primarily due to significantly lower net provisions for litigation and regulatory proceedings and lower compensation and benefits expenses Consumer & Wealth Management 1,652 11% 17% 5,996 15% n 2020 results included EPS of $24.74 and ROE of 11.1% Net revenues $ 11,741 9% 18% $ 44,560 22% — 2020 net revenues were significantly higher YoY, primarily reflecting strength in Global Markets and Investment Banking Provision for credit losses 293 5% -13% 3,098 191% — 2020 provision for credit losses reflected significantly higher provisions related to wholesale loans (reflecting the impact of the COVID-19 pandemic on the portfolio) and higher provisions Operating expenses 5,907 -5% -19% 28,983 16% related to credit card loans, as compared with 2019 — 2020 operating expenses were higher YoY, primarily reflecting significantly higher net Pre-tax earnings 5,541 29% 139% 12,479 18% provisions for litigation and regulatory proceedings, as well as higher compensation and benefits expenses (reflecting improved financial performance) Net earnings 4,506 34% 135% 9,459 12% — 2020 litigation expenses increased the efficiency ratio and decreased EPS, ROE and ROTE Net earnings to common $ 4,362 35% 153% $ 8,915 13% Litigation Impact 2020 2019 Diluted EPS $ 12.08 35% 158% $ 24.74 18% Diluted EPS $ -9.51 $ -3.16 1 ROE 21.1% 4.9pp 12.4pp 11.1% 1.1pp ROE -3.9pp -1.5pp 1 ROTE 22.5% 5.2pp 13.3pp 11.8% 1.2pp ROTE -4.1pp -1.6pp 2 Efficiency Ratio 50.3% -7.2pp -23.0pp 65.0% -3.1pp Efficiency Ratio +7.6pp +3.4pp 1Financial Overview Financial Results Financial Overview Highlights n 4Q20 results included EPS of $12.08 and ROE of 21.1% $ in millions, vs. vs. vs. except per share amounts 4Q20 3Q20 4Q19 2020 2019 — 4Q20 net revenues were higher YoY, reflecting higher net revenues across all segments, with particular strength in Global Markets and Investment Banking Investment Banking $ 2,613 33% 27% $ 9,423 24% — 4Q20 provision for credit losses included reserve reductions on wholesale loans reflecting stabilization in the broader economic environment following the impact of the COVID-19 Global Markets 4,265 -6% 23% 21,157 43% pandemic earlier in the year, partially offset by higher provisions from growth in credit card loans, as compared with 4Q19 Asset Management 3,211 16% 7% 7,984 -11% — 4Q20 operating expenses were lower YoY, primarily due to significantly lower net provisions for litigation and regulatory proceedings and lower compensation and benefits expenses Consumer & Wealth Management 1,652 11% 17% 5,996 15% n 2020 results included EPS of $24.74 and ROE of 11.1% Net revenues $ 11,741 9% 18% $ 44,560 22% — 2020 net revenues were significantly higher YoY, primarily reflecting strength in Global Markets and Investment Banking Provision for credit losses 293 5% -13% 3,098 191% — 2020 provision for credit losses reflected significantly higher provisions related to wholesale loans (reflecting the impact of the COVID-19 pandemic on the portfolio) and higher provisions Operating expenses 5,907 -5% -19% 28,983 16% related to credit card loans, as compared with 2019 — 2020 operating expenses were higher YoY, primarily reflecting significantly higher net Pre-tax earnings 5,541 29% 139% 12,479 18% provisions for litigation and regulatory proceedings, as well as higher compensation and benefits expenses (reflecting improved financial performance) Net earnings 4,506 34% 135% 9,459 12% — 2020 litigation expenses increased the efficiency ratio and decreased EPS, ROE and ROTE Net earnings to common $ 4,362 35% 153% $ 8,915 13% Litigation Impact 2020 2019 Diluted EPS $ 12.08 35% 158% $ 24.74 18% Diluted EPS $ -9.51 $ -3.16 1 ROE 21.1% 4.9pp 12.4pp 11.1% 1.1pp ROE -3.9pp -1.5pp 1 ROTE 22.5% 5.2pp 13.3pp 11.8% 1.2pp ROTE -4.1pp -1.6pp 2 Efficiency Ratio 50.3% -7.2pp -23.0pp 65.0% -3.1pp Efficiency Ratio +7.6pp +3.4pp 1
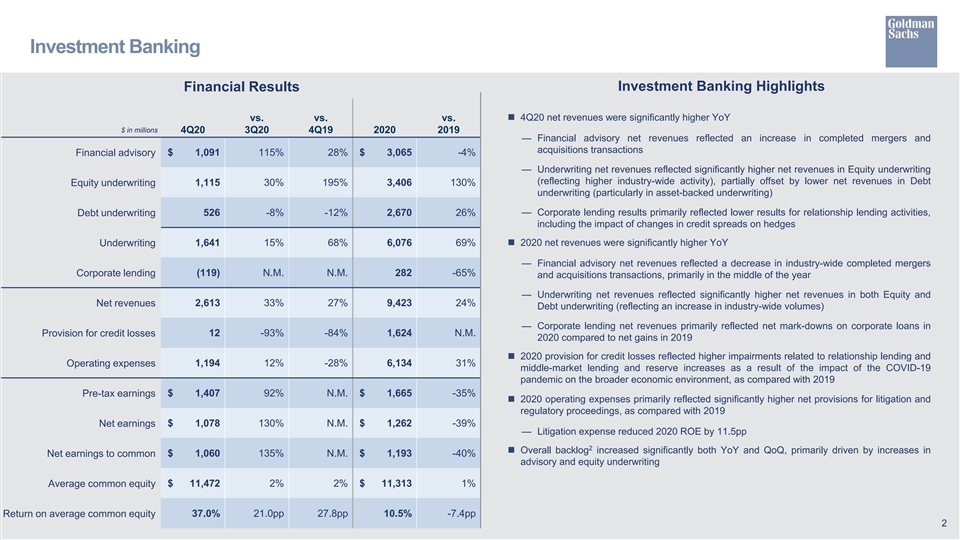
Investment Banking Financial Results Investment Banking Highlights vs. vs. vs.n 4Q20 net revenues were significantly higher YoY $ in millions 4Q20 3Q20 4Q19 2020 2019 — Financial advisory net revenues reflected an increase in completed mergers and acquisitions transactions Financial advisory $ 1,091 115% 28% $ 3,065 -4% — Underwriting net revenues reflected significantly higher net revenues in Equity underwriting (reflecting higher industry-wide activity), partially offset by lower net revenues in Debt Equity underwriting 1,115 30% 195% 3,406 130% underwriting (particularly in asset-backed underwriting) Debt underwriting 526 -8% -12% 2,670 26% — Corporate lending results primarily reflected lower results for relationship lending activities, including the impact of changes in credit spreads on hedges Underwriting 1,641 15% 68% 6,076 69%n 2020 net revenues were significantly higher YoY — Financial advisory net revenues reflected a decrease in industry-wide completed mergers Corporate lending (119) N.M. N.M. 282 -65% and acquisitions transactions, primarily in the middle of the year — Underwriting net revenues reflected significantly higher net revenues in both Equity and 2,613 33% 27% 9,423 24% Net revenues Debt underwriting (reflecting an increase in industry-wide volumes) — Corporate lending net revenues primarily reflected net mark-downs on corporate loans in 12 -93% -84% 1,624 N.M. Provision for credit losses 2020 compared to net gains in 2019 n 2020 provision for credit losses reflected higher impairments related to relationship lending and 1,194 12% -28% 6,134 31% Operating expenses middle-market lending and reserve increases as a result of the impact of the COVID-19 pandemic on the broader economic environment, as compared with 2019 Pre-tax earnings $ 1,407 92% N.M. $ 1,665 -35% n 2020 operating expenses primarily reflected significantly higher net provisions for litigation and regulatory proceedings, as compared with 2019 Net earnings $ 1,078 130% N.M. $ 1,262 -39% — Litigation expense reduced 2020 ROE by 11.5pp 2 n Overall backlog increased significantly both YoY and QoQ, primarily driven by increases in Net earnings to common $ 1,060 135% N.M. $ 1,193 -40% advisory and equity underwriting Average common equity $ 11,472 2% 2% $ 11,313 1% Return on average common equity 37.0% 21.0pp 27.8pp 10.5% -7.4pp 2Investment Banking Financial Results Investment Banking Highlights vs. vs. vs.n 4Q20 net revenues were significantly higher YoY $ in millions 4Q20 3Q20 4Q19 2020 2019 — Financial advisory net revenues reflected an increase in completed mergers and acquisitions transactions Financial advisory $ 1,091 115% 28% $ 3,065 -4% — Underwriting net revenues reflected significantly higher net revenues in Equity underwriting (reflecting higher industry-wide activity), partially offset by lower net revenues in Debt Equity underwriting 1,115 30% 195% 3,406 130% underwriting (particularly in asset-backed underwriting) Debt underwriting 526 -8% -12% 2,670 26% — Corporate lending results primarily reflected lower results for relationship lending activities, including the impact of changes in credit spreads on hedges Underwriting 1,641 15% 68% 6,076 69%n 2020 net revenues were significantly higher YoY — Financial advisory net revenues reflected a decrease in industry-wide completed mergers Corporate lending (119) N.M. N.M. 282 -65% and acquisitions transactions, primarily in the middle of the year — Underwriting net revenues reflected significantly higher net revenues in both Equity and 2,613 33% 27% 9,423 24% Net revenues Debt underwriting (reflecting an increase in industry-wide volumes) — Corporate lending net revenues primarily reflected net mark-downs on corporate loans in 12 -93% -84% 1,624 N.M. Provision for credit losses 2020 compared to net gains in 2019 n 2020 provision for credit losses reflected higher impairments related to relationship lending and 1,194 12% -28% 6,134 31% Operating expenses middle-market lending and reserve increases as a result of the impact of the COVID-19 pandemic on the broader economic environment, as compared with 2019 Pre-tax earnings $ 1,407 92% N.M. $ 1,665 -35% n 2020 operating expenses primarily reflected significantly higher net provisions for litigation and regulatory proceedings, as compared with 2019 Net earnings $ 1,078 130% N.M. $ 1,262 -39% — Litigation expense reduced 2020 ROE by 11.5pp 2 n Overall backlog increased significantly both YoY and QoQ, primarily driven by increases in Net earnings to common $ 1,060 135% N.M. $ 1,193 -40% advisory and equity underwriting Average common equity $ 11,472 2% 2% $ 11,313 1% Return on average common equity 37.0% 21.0pp 27.8pp 10.5% -7.4pp 2
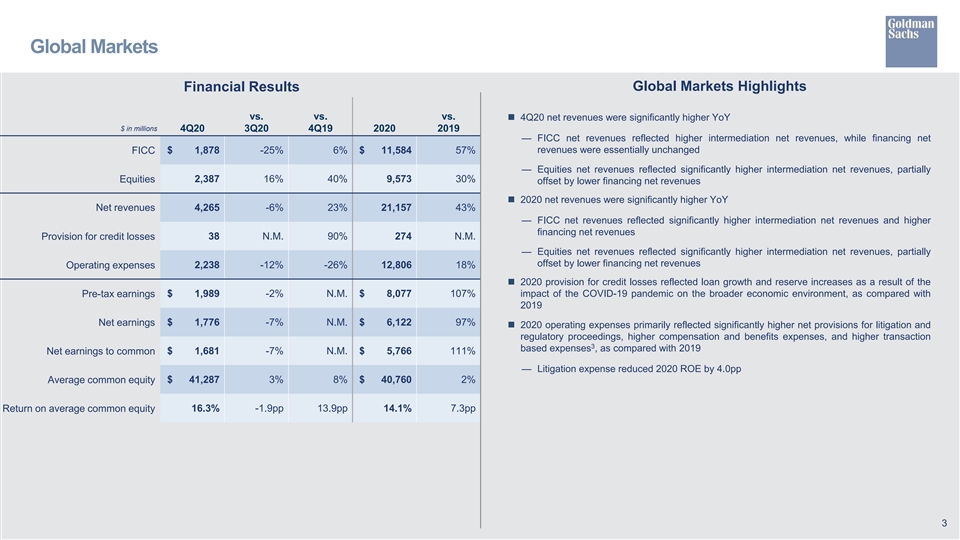
Global Markets Financial Results Global Markets Highlights vs. vs. vs. n 4Q20 net revenues were significantly higher YoY $ in millions 4Q20 3Q20 4Q19 2020 2019 — FICC net revenues reflected higher intermediation net revenues, while financing net revenues were essentially unchanged FICC $ 1,878 -25% 6% $ 11,584 57% — Equities net revenues reflected significantly higher intermediation net revenues, partially 2,387 16% 40% 9,573 30% Equities offset by lower financing net revenues n 2020 net revenues were significantly higher YoY Net revenues 4,265 -6% 23% 21,157 43% — FICC net revenues reflected significantly higher intermediation net revenues and higher financing net revenues Provision for credit losses 38 N.M. 90% 274 N.M. — Equities net revenues reflected significantly higher intermediation net revenues, partially offset by lower financing net revenues 2,238 -12% -26% 12,806 18% Operating expenses n 2020 provision for credit losses reflected loan growth and reserve increases as a result of the Pre-tax earnings $ 1,989 -2% N.M. $ 8,077 107% impact of the COVID-19 pandemic on the broader economic environment, as compared with 2019 Net earnings $ 1,776 -7% N.M. $ 6,122 97% n 2020 operating expenses primarily reflected significantly higher net provisions for litigation and regulatory proceedings, higher compensation and benefits expenses, and higher transaction 3 based expenses , as compared with 2019 $ 1,681 -7% N.M. $ 5,766 111% Net earnings to common — Litigation expense reduced 2020 ROE by 4.0pp Average common equity $ 41,287 3% 8% $ 40,760 2% Return on average common equity 16.3% -1.9pp 13.9pp 14.1% 7.3pp 3Global Markets Financial Results Global Markets Highlights vs. vs. vs. n 4Q20 net revenues were significantly higher YoY $ in millions 4Q20 3Q20 4Q19 2020 2019 — FICC net revenues reflected higher intermediation net revenues, while financing net revenues were essentially unchanged FICC $ 1,878 -25% 6% $ 11,584 57% — Equities net revenues reflected significantly higher intermediation net revenues, partially 2,387 16% 40% 9,573 30% Equities offset by lower financing net revenues n 2020 net revenues were significantly higher YoY Net revenues 4,265 -6% 23% 21,157 43% — FICC net revenues reflected significantly higher intermediation net revenues and higher financing net revenues Provision for credit losses 38 N.M. 90% 274 N.M. — Equities net revenues reflected significantly higher intermediation net revenues, partially offset by lower financing net revenues 2,238 -12% -26% 12,806 18% Operating expenses n 2020 provision for credit losses reflected loan growth and reserve increases as a result of the Pre-tax earnings $ 1,989 -2% N.M. $ 8,077 107% impact of the COVID-19 pandemic on the broader economic environment, as compared with 2019 Net earnings $ 1,776 -7% N.M. $ 6,122 97% n 2020 operating expenses primarily reflected significantly higher net provisions for litigation and regulatory proceedings, higher compensation and benefits expenses, and higher transaction 3 based expenses , as compared with 2019 $ 1,681 -7% N.M. $ 5,766 111% Net earnings to common — Litigation expense reduced 2020 ROE by 4.0pp Average common equity $ 41,287 3% 8% $ 40,760 2% Return on average common equity 16.3% -1.9pp 13.9pp 14.1% 7.3pp 3
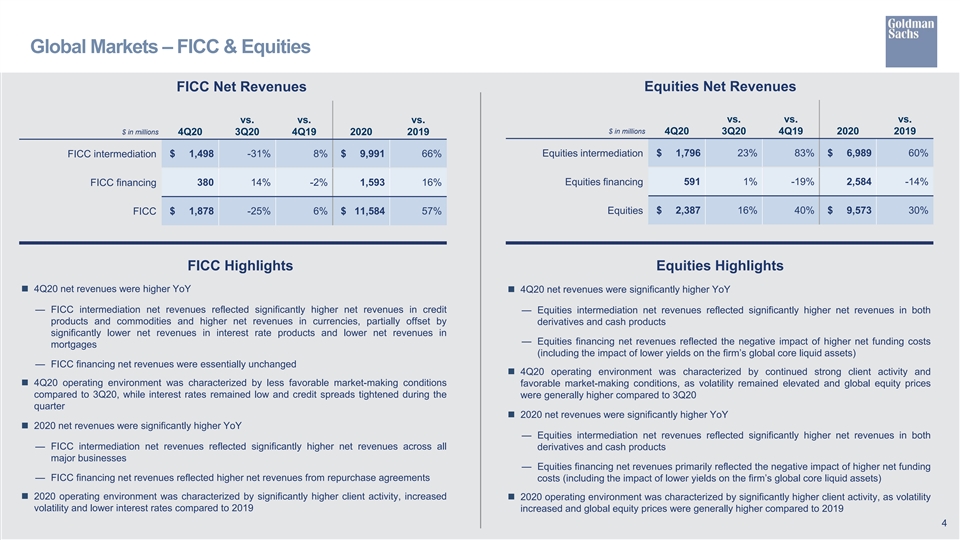
Global Markets – FICC & Equities FICC Net Revenues Equities Net Revenues vs. vs. vs. vs. vs. vs. $ in millions $ in millions 4Q20 3Q20 4Q19 2020 2019 4Q20 3Q20 4Q19 2020 2019 $ 1,796 23% 83% $ 6,989 60% FICC intermediation $ 1,498 -31% 8% $ 9,991 66% Equities intermediation Equities financing 591 1% -19% 2,584 -14% FICC financing 380 14% -2% 1,593 16% $ 1,878 -25% 6% $ 11,584 57% Equities $ 2,387 16% 40% $ 9,573 30% FICC FICC Highlights Equities Highlights n 4Q20 net revenues were higher YoY n 4Q20 net revenues were significantly higher YoY — FICC intermediation net revenues reflected significantly higher net revenues in credit — Equities intermediation net revenues reflected significantly higher net revenues in both products and commodities and higher net revenues in currencies, partially offset by derivatives and cash products significantly lower net revenues in interest rate products and lower net revenues in — Equities financing net revenues reflected the negative impact of higher net funding costs mortgages (including the impact of lower yields on the firm’s global core liquid assets) — FICC financing net revenues were essentially unchanged n 4Q20 operating environment was characterized by continued strong client activity and n 4Q20 operating environment was characterized by less favorable market-making conditions favorable market-making conditions, as volatility remained elevated and global equity prices compared to 3Q20, while interest rates remained low and credit spreads tightened during the were generally higher compared to 3Q20 quarter n 2020 net revenues were significantly higher YoY n 2020 net revenues were significantly higher YoY — Equities intermediation net revenues reflected significantly higher net revenues in both — FICC intermediation net revenues reflected significantly higher net revenues across all derivatives and cash products major businesses — Equities financing net revenues primarily reflected the negative impact of higher net funding — FICC financing net revenues reflected higher net revenues from repurchase agreements costs (including the impact of lower yields on the firm’s global core liquid assets) n 2020 operating environment was characterized by significantly higher client activity, increasedn 2020 operating environment was characterized by significantly higher client activity, as volatility volatility and lower interest rates compared to 2019 increased and global equity prices were generally higher compared to 2019 4Global Markets – FICC & Equities FICC Net Revenues Equities Net Revenues vs. vs. vs. vs. vs. vs. $ in millions $ in millions 4Q20 3Q20 4Q19 2020 2019 4Q20 3Q20 4Q19 2020 2019 $ 1,796 23% 83% $ 6,989 60% FICC intermediation $ 1,498 -31% 8% $ 9,991 66% Equities intermediation Equities financing 591 1% -19% 2,584 -14% FICC financing 380 14% -2% 1,593 16% $ 1,878 -25% 6% $ 11,584 57% Equities $ 2,387 16% 40% $ 9,573 30% FICC FICC Highlights Equities Highlights n 4Q20 net revenues were higher YoY n 4Q20 net revenues were significantly higher YoY — FICC intermediation net revenues reflected significantly higher net revenues in credit — Equities intermediation net revenues reflected significantly higher net revenues in both products and commodities and higher net revenues in currencies, partially offset by derivatives and cash products significantly lower net revenues in interest rate products and lower net revenues in — Equities financing net revenues reflected the negative impact of higher net funding costs mortgages (including the impact of lower yields on the firm’s global core liquid assets) — FICC financing net revenues were essentially unchanged n 4Q20 operating environment was characterized by continued strong client activity and n 4Q20 operating environment was characterized by less favorable market-making conditions favorable market-making conditions, as volatility remained elevated and global equity prices compared to 3Q20, while interest rates remained low and credit spreads tightened during the were generally higher compared to 3Q20 quarter n 2020 net revenues were significantly higher YoY n 2020 net revenues were significantly higher YoY — Equities intermediation net revenues reflected significantly higher net revenues in both — FICC intermediation net revenues reflected significantly higher net revenues across all derivatives and cash products major businesses — Equities financing net revenues primarily reflected the negative impact of higher net funding — FICC financing net revenues reflected higher net revenues from repurchase agreements costs (including the impact of lower yields on the firm’s global core liquid assets) n 2020 operating environment was characterized by significantly higher client activity, increasedn 2020 operating environment was characterized by significantly higher client activity, as volatility volatility and lower interest rates compared to 2019 increased and global equity prices were generally higher compared to 2019 4
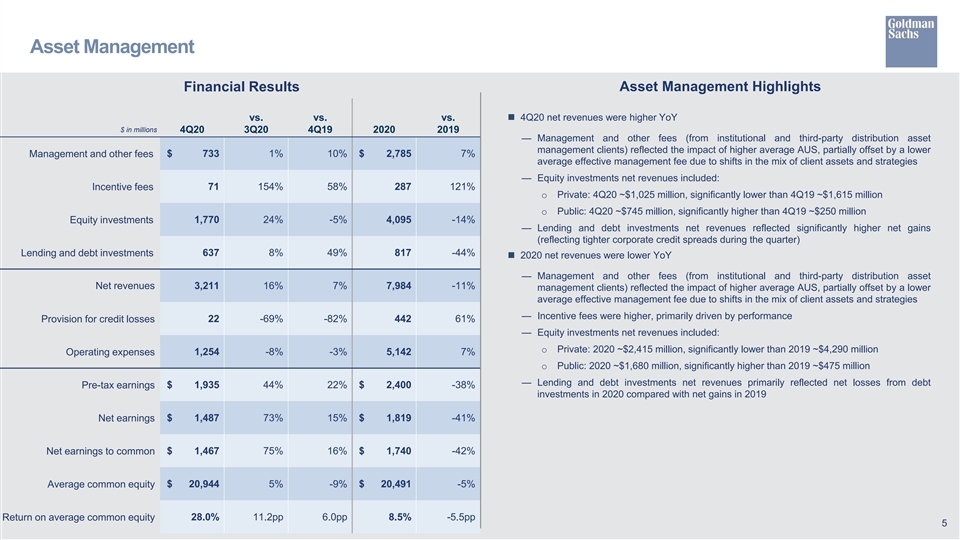
Asset Management Financial Results Asset Management Highlights vs. vs. vs.n 4Q20 net revenues were higher YoY $ in millions 4Q20 3Q20 4Q19 2020 2019 — Management and other fees (from institutional and third-party distribution asset management clients) reflected the impact of higher average AUS, partially offset by a lower Management and other fees $ 733 1% 10% $ 2,785 7% average effective management fee due to shifts in the mix of client assets and strategies — Equity investments net revenues included: Incentive fees 71 154% 58% 287 121% o Private: 4Q20 ~$1,025 million, significantly lower than 4Q19 ~$1,615 million o Public: 4Q20 ~$745 million, significantly higher than 4Q19 ~$250 million Equity investments 1,770 24% -5% 4,095 -14% — Lending and debt investments net revenues reflected significantly higher net gains (reflecting tighter corporate credit spreads during the quarter) Lending and debt investments 637 8% 49% 817 -44% n 2020 net revenues were lower YoY — Management and other fees (from institutional and third-party distribution asset Net revenues 3,211 16% 7% 7,984 -11% management clients) reflected the impact of higher average AUS, partially offset by a lower average effective management fee due to shifts in the mix of client assets and strategies — Incentive fees were higher, primarily driven by performance Provision for credit losses 22 -69% -82% 442 61% — Equity investments net revenues included: o Private: 2020 ~$2,415 million, significantly lower than 2019 ~$4,290 million Operating expenses 1,254 -8% -3% 5,142 7% o Public: 2020 ~$1,680 million, significantly higher than 2019 ~$475 million — Lending and debt investments net revenues primarily reflected net losses from debt $ 1,935 44% 22% $ 2,400 -38% Pre-tax earnings investments in 2020 compared with net gains in 2019 $ 1,487 73% 15% $ 1,819 -41% Net earnings $ 1,467 75% 16% $ 1,740 -42% Net earnings to common $ 20,944 5% -9% $ 20,491 -5% Average common equity 28.0% 11.2pp 6.0pp 8.5% -5.5pp Return on average common equity 5Asset Management Financial Results Asset Management Highlights vs. vs. vs.n 4Q20 net revenues were higher YoY $ in millions 4Q20 3Q20 4Q19 2020 2019 — Management and other fees (from institutional and third-party distribution asset management clients) reflected the impact of higher average AUS, partially offset by a lower Management and other fees $ 733 1% 10% $ 2,785 7% average effective management fee due to shifts in the mix of client assets and strategies — Equity investments net revenues included: Incentive fees 71 154% 58% 287 121% o Private: 4Q20 ~$1,025 million, significantly lower than 4Q19 ~$1,615 million o Public: 4Q20 ~$745 million, significantly higher than 4Q19 ~$250 million Equity investments 1,770 24% -5% 4,095 -14% — Lending and debt investments net revenues reflected significantly higher net gains (reflecting tighter corporate credit spreads during the quarter) Lending and debt investments 637 8% 49% 817 -44% n 2020 net revenues were lower YoY — Management and other fees (from institutional and third-party distribution asset Net revenues 3,211 16% 7% 7,984 -11% management clients) reflected the impact of higher average AUS, partially offset by a lower average effective management fee due to shifts in the mix of client assets and strategies — Incentive fees were higher, primarily driven by performance Provision for credit losses 22 -69% -82% 442 61% — Equity investments net revenues included: o Private: 2020 ~$2,415 million, significantly lower than 2019 ~$4,290 million Operating expenses 1,254 -8% -3% 5,142 7% o Public: 2020 ~$1,680 million, significantly higher than 2019 ~$475 million — Lending and debt investments net revenues primarily reflected net losses from debt $ 1,935 44% 22% $ 2,400 -38% Pre-tax earnings investments in 2020 compared with net gains in 2019 $ 1,487 73% 15% $ 1,819 -41% Net earnings $ 1,467 75% 16% $ 1,740 -42% Net earnings to common $ 20,944 5% -9% $ 20,491 -5% Average common equity 28.0% 11.2pp 6.0pp 8.5% -5.5pp Return on average common equity 5
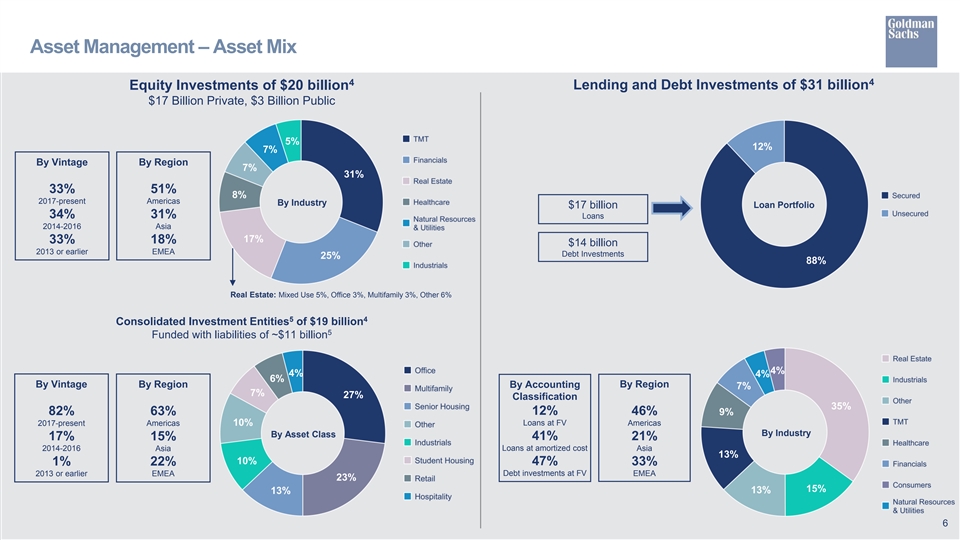
Asset Management – Asset Mix 4 4 Equity Investments of $20 billion Lending and Debt Investments of $31 billion $17 Billion Private, $3 Billion Public 5% 12% 7% By Vintage By Region 7% 31% 33% 51% 8% 2017-present Americas By Industry Loan Portfolio $17 billion 34% 31% Loans 2014-2016 Asia 17% 33% 18% $14 billion 2013 or earlier EMEA Debt Investments 25% 88% Real Estate: Mixed Use 5%, Office 3%, Multifamily 3%, Other 6% 5 4 Consolidated Investment Entities of $19 billion 5 Funded with liabilities of ~$11 billion 4% 4% 4% 6% By Vintage By Region By Accounting By Region 7% 7% 27% Classification 35% 82% 63% 12% 46% 9% 2017-present Americas 10% Loans at FV Americas By Industry By Asset Class 17% 15% 41% 21% 2014-2016 Asia Loans at amortized cost Asia 13% 10% 47% 33% 1% 22% 2013 or earlier EMEA Debt investments at FV EMEA 23% 15% 13% 13% 6Asset Management – Asset Mix 4 4 Equity Investments of $20 billion Lending and Debt Investments of $31 billion $17 Billion Private, $3 Billion Public 5% 12% 7% By Vintage By Region 7% 31% 33% 51% 8% 2017-present Americas By Industry Loan Portfolio $17 billion 34% 31% Loans 2014-2016 Asia 17% 33% 18% $14 billion 2013 or earlier EMEA Debt Investments 25% 88% Real Estate: Mixed Use 5%, Office 3%, Multifamily 3%, Other 6% 5 4 Consolidated Investment Entities of $19 billion 5 Funded with liabilities of ~$11 billion 4% 4% 4% 6% By Vintage By Region By Accounting By Region 7% 7% 27% Classification 35% 82% 63% 12% 46% 9% 2017-present Americas 10% Loans at FV Americas By Industry By Asset Class 17% 15% 41% 21% 2014-2016 Asia Loans at amortized cost Asia 13% 10% 47% 33% 1% 22% 2013 or earlier EMEA Debt investments at FV EMEA 23% 15% 13% 13% 6
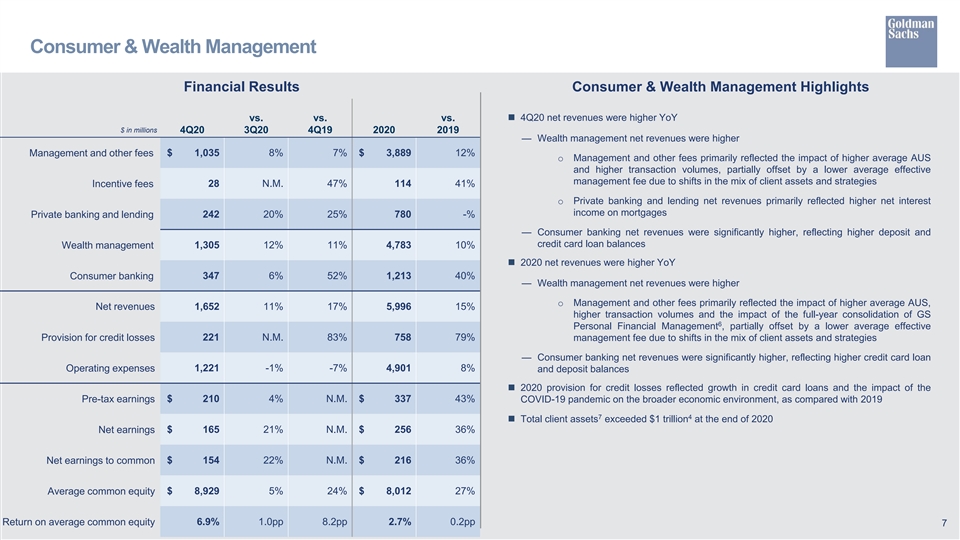
Consumer & Wealth Management Financial Results Consumer & Wealth Management Highlights vs. vs. vs.n 4Q20 net revenues were higher YoY $ in millions 4Q20 3Q20 4Q19 2020 2019 — Wealth management net revenues were higher Management and other fees $ 1,035 8% 7% $ 3,889 12% o Management and other fees primarily reflected the impact of higher average AUS and higher transaction volumes, partially offset by a lower average effective management fee due to shifts in the mix of client assets and strategies Incentive fees 28 N.M. 47% 114 41% o Private banking and lending net revenues primarily reflected higher net interest income on mortgages Private banking and lending 242 20% 25% 780 -% — Consumer banking net revenues were significantly higher, reflecting higher deposit and credit card loan balances 1,305 12% 11% 4,783 10% Wealth management n 2020 net revenues were higher YoY Consumer banking 347 6% 52% 1,213 40% — Wealth management net revenues were higher o Management and other fees primarily reflected the impact of higher average AUS, Net revenues 1,652 11% 17% 5,996 15% higher transaction volumes and the impact of the full-year consolidation of GS 6 Personal Financial Management , partially offset by a lower average effective Provision for credit losses 221 N.M. 83% 758 79% management fee due to shifts in the mix of client assets and strategies — Consumer banking net revenues were significantly higher, reflecting higher credit card loan 1,221 -1% -7% 4,901 8% Operating expenses and deposit balances n 2020 provision for credit losses reflected growth in credit card loans and the impact of the Pre-tax earnings $ 210 4% N.M. $ 337 43% COVID-19 pandemic on the broader economic environment, as compared with 2019 7 4 n Total client assets exceeded $1 trillion at the end of 2020 Net earnings $ 165 21% N.M. $ 256 36% Net earnings to common $ 154 22% N.M. $ 216 36% $ 8,929 5% 24% $ 8,012 27% Average common equity Return on average common equity 6.9% 1.0pp 8.2pp 2.7% 0.2pp 7Consumer & Wealth Management Financial Results Consumer & Wealth Management Highlights vs. vs. vs.n 4Q20 net revenues were higher YoY $ in millions 4Q20 3Q20 4Q19 2020 2019 — Wealth management net revenues were higher Management and other fees $ 1,035 8% 7% $ 3,889 12% o Management and other fees primarily reflected the impact of higher average AUS and higher transaction volumes, partially offset by a lower average effective management fee due to shifts in the mix of client assets and strategies Incentive fees 28 N.M. 47% 114 41% o Private banking and lending net revenues primarily reflected higher net interest income on mortgages Private banking and lending 242 20% 25% 780 -% — Consumer banking net revenues were significantly higher, reflecting higher deposit and credit card loan balances 1,305 12% 11% 4,783 10% Wealth management n 2020 net revenues were higher YoY Consumer banking 347 6% 52% 1,213 40% — Wealth management net revenues were higher o Management and other fees primarily reflected the impact of higher average AUS, Net revenues 1,652 11% 17% 5,996 15% higher transaction volumes and the impact of the full-year consolidation of GS 6 Personal Financial Management , partially offset by a lower average effective Provision for credit losses 221 N.M. 83% 758 79% management fee due to shifts in the mix of client assets and strategies — Consumer banking net revenues were significantly higher, reflecting higher credit card loan 1,221 -1% -7% 4,901 8% Operating expenses and deposit balances n 2020 provision for credit losses reflected growth in credit card loans and the impact of the Pre-tax earnings $ 210 4% N.M. $ 337 43% COVID-19 pandemic on the broader economic environment, as compared with 2019 7 4 n Total client assets exceeded $1 trillion at the end of 2020 Net earnings $ 165 21% N.M. $ 256 36% Net earnings to common $ 154 22% N.M. $ 216 36% $ 8,929 5% 24% $ 8,012 27% Average common equity Return on average common equity 6.9% 1.0pp 8.2pp 2.7% 0.2pp 7
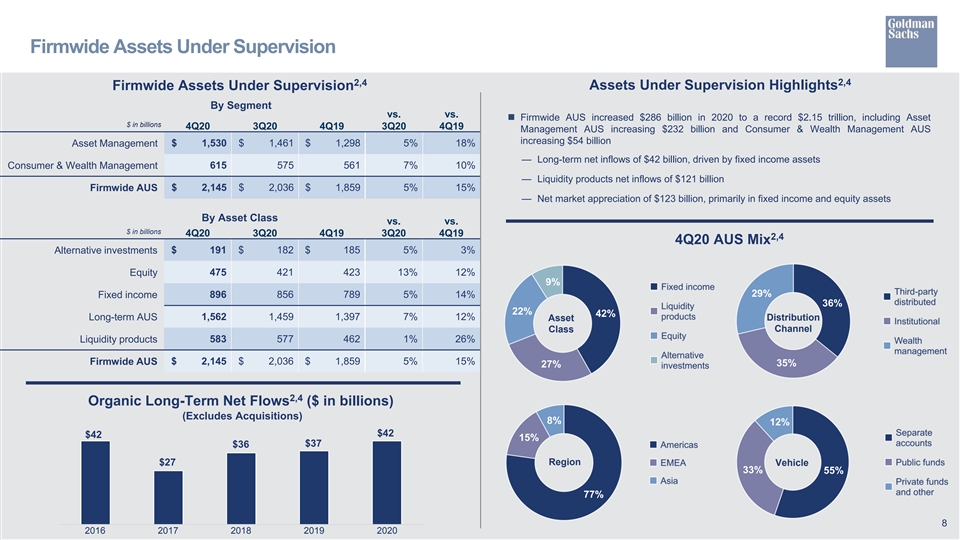
Firmwide Assets Under Supervision 2,4 2,4 Firmwide Assets Under Supervision Assets Under Supervision Highlights By Segment vs. vs. n Firmwide AUS increased $286 billion in 2020 to a record $2.15 trillion, including Asset $ in billions 4Q20 3Q20 4Q19 3Q20 4Q19 Management AUS increasing $232 billion and Consumer & Wealth Management AUS increasing $54 billion $ 1,530 $ 1,461 $ 1,298 5% 18% Asset Management — Long-term net inflows of $42 billion, driven by fixed income assets Consumer & Wealth Management 615 575 561 7% 10% — Liquidity products net inflows of $121 billion Firmwide AUS $ 2,145 $ 2,036 $ 1,859 5% 15% — Net market appreciation of $123 billion, primarily in fixed income and equity assets By Asset Class vs. vs. $ in billions 4Q20 3Q20 4Q19 3Q20 4Q19 2,4 4Q20 AUS Mix $ 191 $ 182 $ 185 5% 3% Alternative investments Equity 475 421 423 13% 12% 9% 29% Fixed income 896 856 789 5% 14% 36% 22% 42% Long-term AUS 1,562 1,459 1,397 7% 12% Asset Distribution Channel Class 583 577 462 1% 26% Liquidity products Firmwide AUS $ 2,145 $ 2,036 $ 1,859 5% 15% 35% 27% 2,4 Organic Long-Term Net Flows ($ in billions) (Excludes Acquisitions) 8% 12% $42 $42 15% $37 $36 Region $27 Vehicle 33% 55% 77% 8 2016 2017 2018 2019 2020Firmwide Assets Under Supervision 2,4 2,4 Firmwide Assets Under Supervision Assets Under Supervision Highlights By Segment vs. vs. n Firmwide AUS increased $286 billion in 2020 to a record $2.15 trillion, including Asset $ in billions 4Q20 3Q20 4Q19 3Q20 4Q19 Management AUS increasing $232 billion and Consumer & Wealth Management AUS increasing $54 billion $ 1,530 $ 1,461 $ 1,298 5% 18% Asset Management — Long-term net inflows of $42 billion, driven by fixed income assets Consumer & Wealth Management 615 575 561 7% 10% — Liquidity products net inflows of $121 billion Firmwide AUS $ 2,145 $ 2,036 $ 1,859 5% 15% — Net market appreciation of $123 billion, primarily in fixed income and equity assets By Asset Class vs. vs. $ in billions 4Q20 3Q20 4Q19 3Q20 4Q19 2,4 4Q20 AUS Mix $ 191 $ 182 $ 185 5% 3% Alternative investments Equity 475 421 423 13% 12% 9% 29% Fixed income 896 856 789 5% 14% 36% 22% 42% Long-term AUS 1,562 1,459 1,397 7% 12% Asset Distribution Channel Class 583 577 462 1% 26% Liquidity products Firmwide AUS $ 2,145 $ 2,036 $ 1,859 5% 15% 35% 27% 2,4 Organic Long-Term Net Flows ($ in billions) (Excludes Acquisitions) 8% 12% $42 $42 15% $37 $36 Region $27 Vehicle 33% 55% 77% 8 2016 2017 2018 2019 2020
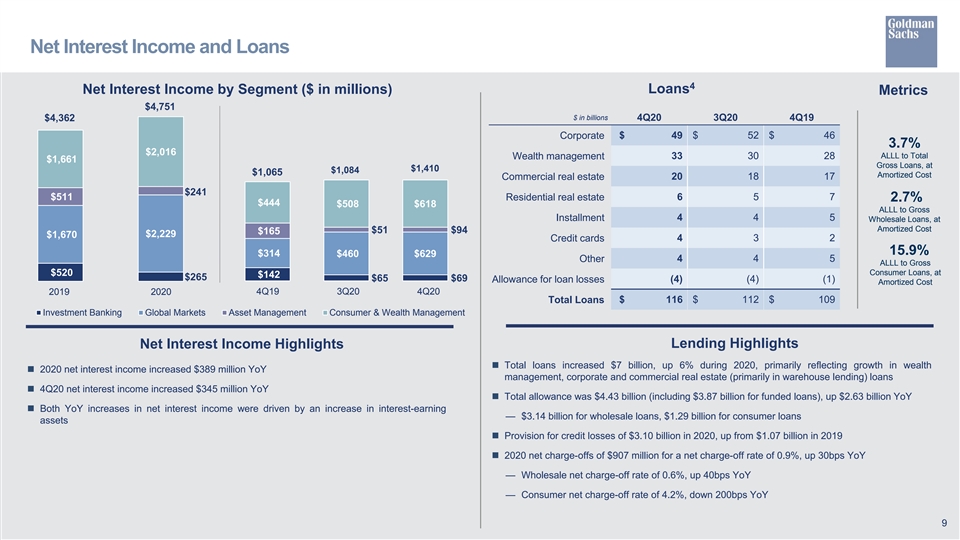
Net Interest Income and Loans 4 Loans Net Interest Income by Segment ($ in millions) Metrics $4,751 $ in billions $4,362 4Q20 3Q20 4Q19 Corporate $ 49 $ 52 $ 46 3.7% $2,016 33 30 28 ALLL to Total Wealth management $1,661 Gross Loans, at $1,410 $1,084 $1,065 Amortized Cost Commercial real estate 20 18 17 $241 $511 6 5 7 Residential real estate 2.7% $444 $508 $618 ALLL to Gross Installment 4 4 5 Wholesale Loans, at Amortized Cost $51 $94 $165 $2,229 $1,670 4 3 2 Credit cards 15.9% $314 $460 $629 Other 4 4 5 ALLL to Gross Consumer Loans, at $520 $142 $265 $65 $69 (4) (4) (1) Allowance for loan losses Amortized Cost 2019 2020 4Q19 3Q20 4Q20 Total Loans $ 116 $ 112 $ 109 Investment Banking Global Markets Asset Management Consumer & Wealth Management Lending Highlights Net Interest Income Highlights n Total loans increased $7 billion, up 6% during 2020, primarily reflecting growth in wealth n 2020 net interest income increased $389 million YoY management, corporate and commercial real estate (primarily in warehouse lending) loans n 4Q20 net interest income increased $345 million YoY n Total allowance was $4.43 billion (including $3.87 billion for funded loans), up $2.63 billion YoY n Both YoY increases in net interest income were driven by an increase in interest-earning — $3.14 billion for wholesale loans, $1.29 billion for consumer loans assets n Provision for credit losses of $3.10 billion in 2020, up from $1.07 billion in 2019 n 2020 net charge-offs of $907 million for a net charge-off rate of 0.9%, up 30bps YoY — Wholesale net charge-off rate of 0.6%, up 40bps YoY — Consumer net charge-off rate of 4.2%, down 200bps YoY 9Net Interest Income and Loans 4 Loans Net Interest Income by Segment ($ in millions) Metrics $4,751 $ in billions $4,362 4Q20 3Q20 4Q19 Corporate $ 49 $ 52 $ 46 3.7% $2,016 33 30 28 ALLL to Total Wealth management $1,661 Gross Loans, at $1,410 $1,084 $1,065 Amortized Cost Commercial real estate 20 18 17 $241 $511 6 5 7 Residential real estate 2.7% $444 $508 $618 ALLL to Gross Installment 4 4 5 Wholesale Loans, at Amortized Cost $51 $94 $165 $2,229 $1,670 4 3 2 Credit cards 15.9% $314 $460 $629 Other 4 4 5 ALLL to Gross Consumer Loans, at $520 $142 $265 $65 $69 (4) (4) (1) Allowance for loan losses Amortized Cost 2019 2020 4Q19 3Q20 4Q20 Total Loans $ 116 $ 112 $ 109 Investment Banking Global Markets Asset Management Consumer & Wealth Management Lending Highlights Net Interest Income Highlights n Total loans increased $7 billion, up 6% during 2020, primarily reflecting growth in wealth n 2020 net interest income increased $389 million YoY management, corporate and commercial real estate (primarily in warehouse lending) loans n 4Q20 net interest income increased $345 million YoY n Total allowance was $4.43 billion (including $3.87 billion for funded loans), up $2.63 billion YoY n Both YoY increases in net interest income were driven by an increase in interest-earning — $3.14 billion for wholesale loans, $1.29 billion for consumer loans assets n Provision for credit losses of $3.10 billion in 2020, up from $1.07 billion in 2019 n 2020 net charge-offs of $907 million for a net charge-off rate of 0.9%, up 30bps YoY — Wholesale net charge-off rate of 0.6%, up 40bps YoY — Consumer net charge-off rate of 4.2%, down 200bps YoY 9
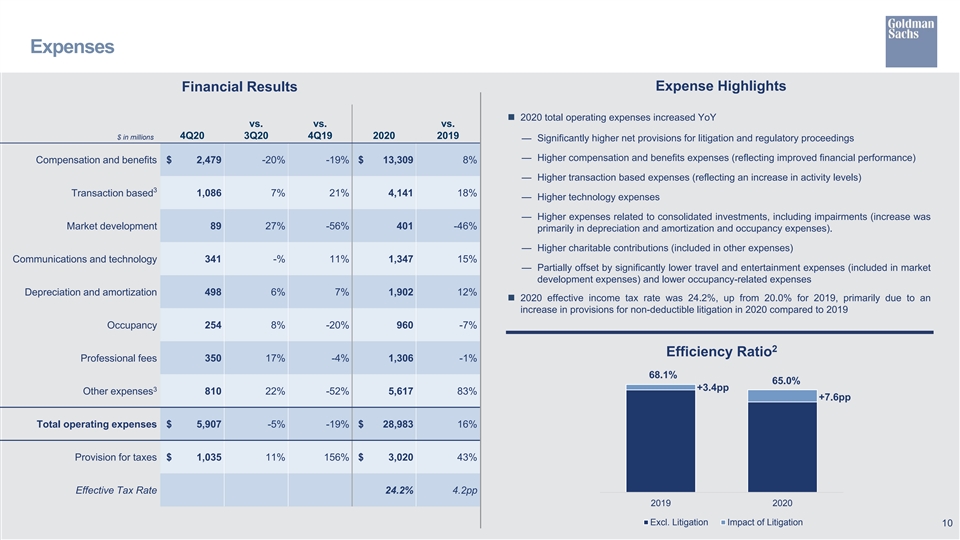
Expenses Expense Highlights Financial Results n 2020 total operating expenses increased YoY vs. vs. vs. 4Q20 3Q20 4Q19 2020 2019 $ in millions — Significantly higher net provisions for litigation and regulatory proceedings — Higher compensation and benefits expenses (reflecting improved financial performance) Compensation and benefits $ 2,479 -20% -19% $ 13,309 8% — Higher transaction based expenses (reflecting an increase in activity levels) 3 Transaction based 1,086 7% 21% 4,141 18% — Higher technology expenses — Higher expenses related to consolidated investments, including impairments (increase was 89 27% -56% 401 -46% Market development primarily in depreciation and amortization and occupancy expenses). — Higher charitable contributions (included in other expenses) 341 -% 11% 1,347 15% Communications and technology — Partially offset by significantly lower travel and entertainment expenses (included in market development expenses) and lower occupancy-related expenses Depreciation and amortization 498 6% 7% 1,902 12% n 2020 effective income tax rate was 24.2%, up from 20.0% for 2019, primarily due to an increase in provisions for non-deductible litigation in 2020 compared to 2019 Occupancy 254 8% -20% 960 -7% 2 Efficiency Ratio Professional fees 350 17% -4% 1,306 -1% 68.1% 65.0% +3.4pp 3 Other expenses 810 22% -52% 5,617 83% +7.6pp Total operating expenses $ 5,907 -5% -19% $ 28,983 16% Provision for taxes $ 1,035 11% 156% $ 3,020 43% Effective Tax Rate 24.2% 4.2pp 2019 2020 Excl. Litigation Impact of Litigation 10Expenses Expense Highlights Financial Results n 2020 total operating expenses increased YoY vs. vs. vs. 4Q20 3Q20 4Q19 2020 2019 $ in millions — Significantly higher net provisions for litigation and regulatory proceedings — Higher compensation and benefits expenses (reflecting improved financial performance) Compensation and benefits $ 2,479 -20% -19% $ 13,309 8% — Higher transaction based expenses (reflecting an increase in activity levels) 3 Transaction based 1,086 7% 21% 4,141 18% — Higher technology expenses — Higher expenses related to consolidated investments, including impairments (increase was 89 27% -56% 401 -46% Market development primarily in depreciation and amortization and occupancy expenses). — Higher charitable contributions (included in other expenses) 341 -% 11% 1,347 15% Communications and technology — Partially offset by significantly lower travel and entertainment expenses (included in market development expenses) and lower occupancy-related expenses Depreciation and amortization 498 6% 7% 1,902 12% n 2020 effective income tax rate was 24.2%, up from 20.0% for 2019, primarily due to an increase in provisions for non-deductible litigation in 2020 compared to 2019 Occupancy 254 8% -20% 960 -7% 2 Efficiency Ratio Professional fees 350 17% -4% 1,306 -1% 68.1% 65.0% +3.4pp 3 Other expenses 810 22% -52% 5,617 83% +7.6pp Total operating expenses $ 5,907 -5% -19% $ 28,983 16% Provision for taxes $ 1,035 11% 156% $ 3,020 43% Effective Tax Rate 24.2% 4.2pp 2019 2020 Excl. Litigation Impact of Litigation 10
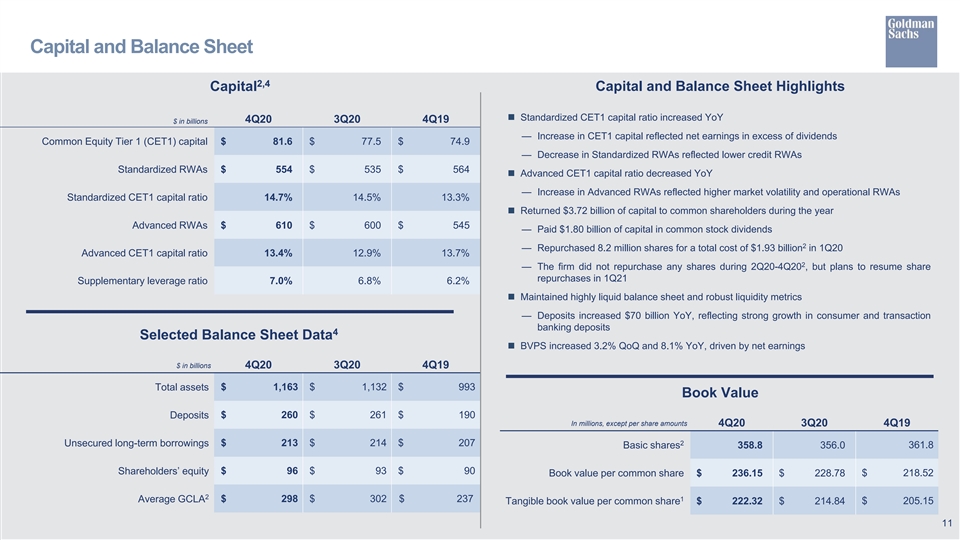
Capital and Balance Sheet 2,4 Capital Capital and Balance Sheet Highlights n Standardized CET1 capital ratio increased YoY 4Q20 3Q20 4Q19 $ in billions — Increase in CET1 capital reflected net earnings in excess of dividends Common Equity Tier 1 (CET1) capital $ 81.6 $ 77.5 $ 74.9 — Decrease in Standardized RWAs reflected lower credit RWAs Standardized RWAs $ 554 $ 535 $ 564 n Advanced CET1 capital ratio decreased YoY — Increase in Advanced RWAs reflected higher market volatility and operational RWAs Standardized CET1 capital ratio 14.7% 14.5% 13.3% n Returned $3.72 billion of capital to common shareholders during the year Advanced RWAs $ 610 $ 600 $ 545 — Paid $1.80 billion of capital in common stock dividends 2 — Repurchased 8.2 million shares for a total cost of $1.93 billion in 1Q20 Advanced CET1 capital ratio 13.4% 12.9% 13.7% 2 — The firm did not repurchase any shares during 2Q20-4Q20 , but plans to resume share repurchases in 1Q21 Supplementary leverage ratio 7.0% 6.8% 6.2% n Maintained highly liquid balance sheet and robust liquidity metrics — Deposits increased $70 billion YoY, reflecting strong growth in consumer and transaction banking deposits 4 Selected Balance Sheet Data n BVPS increased 3.2% QoQ and 8.1% YoY, driven by net earnings $ in billions 4Q20 3Q20 4Q19 $ 1,163 $ 1,132 $ 993 Total assets Book Value $ 260 $ 261 $ 190 Deposits In millions, except per share amounts 4Q20 3Q20 4Q19 $ 213 $ 214 $ 207 2 Unsecured long-term borrowings 361.8 Basic shares 358.8 356.0 Shareholders’ equity $ 96 $ 93 $ 90 $ 218.52 Book value per common share $ 236.15 $ 228.78 2 1 Average GCLA $ 298 $ 302 $ 237 Tangible book value per common share $ 222.32 $ 214.84 $ 205.15 11Capital and Balance Sheet 2,4 Capital Capital and Balance Sheet Highlights n Standardized CET1 capital ratio increased YoY 4Q20 3Q20 4Q19 $ in billions — Increase in CET1 capital reflected net earnings in excess of dividends Common Equity Tier 1 (CET1) capital $ 81.6 $ 77.5 $ 74.9 — Decrease in Standardized RWAs reflected lower credit RWAs Standardized RWAs $ 554 $ 535 $ 564 n Advanced CET1 capital ratio decreased YoY — Increase in Advanced RWAs reflected higher market volatility and operational RWAs Standardized CET1 capital ratio 14.7% 14.5% 13.3% n Returned $3.72 billion of capital to common shareholders during the year Advanced RWAs $ 610 $ 600 $ 545 — Paid $1.80 billion of capital in common stock dividends 2 — Repurchased 8.2 million shares for a total cost of $1.93 billion in 1Q20 Advanced CET1 capital ratio 13.4% 12.9% 13.7% 2 — The firm did not repurchase any shares during 2Q20-4Q20 , but plans to resume share repurchases in 1Q21 Supplementary leverage ratio 7.0% 6.8% 6.2% n Maintained highly liquid balance sheet and robust liquidity metrics — Deposits increased $70 billion YoY, reflecting strong growth in consumer and transaction banking deposits 4 Selected Balance Sheet Data n BVPS increased 3.2% QoQ and 8.1% YoY, driven by net earnings $ in billions 4Q20 3Q20 4Q19 $ 1,163 $ 1,132 $ 993 Total assets Book Value $ 260 $ 261 $ 190 Deposits In millions, except per share amounts 4Q20 3Q20 4Q19 $ 213 $ 214 $ 207 2 Unsecured long-term borrowings 361.8 Basic shares 358.8 356.0 Shareholders’ equity $ 96 $ 93 $ 90 $ 218.52 Book value per common share $ 236.15 $ 228.78 2 1 Average GCLA $ 298 $ 302 $ 237 Tangible book value per common share $ 222.32 $ 214.84 $ 205.15 11
Cautionary Note Regarding Forward-Looking Statements This presentation contains “forward-looking statements” within the meaning of the safe harbor provisions of the U.S. Private Securities Litigation Reform Act of 1995. Forward-looking statements are not historical facts or statements of current conditions, but instead represent only the firm’s beliefs regarding future events, many of which, by their nature, are inherently uncertain and outside of the firm’s control. It is possible that the firm’s actual results, financial condition and liquidity may differ, possibly materially, from the anticipated results, financial condition and liquidity in these forward-looking statements. For information about some of the risks and important factors that could affect the firm’s future results, financial condition and liquidity and the forward-looking statements below, see “Risk Factors” in Part II, Item 1A of the firm’s Quarterly Report on Form 10-Q for the period ended September 30, 2020 and in Part I, Item 1A of the firm’s Annual Report on Form 10-K for the year ended December 31, 2019, as well as the cautionary notes on forward-looking statements in the firm’s Quarterly Report on Form 10-Q for the period ended September 30, 2020 and the Strategic Update, dated January 19, 2021. Information regarding the firm’s assets under supervision, capital ratios, risk-weighted assets, supplementary leverage ratio, balance sheet data and global core liquid assets (GCLA) consists of preliminary estimates. These estimates are forward-looking statements and are subject to change, possibly materially, as the firm completes its financial statements. Statements regarding (i) estimated GDP growth, (ii) the impact of the COVID-19 pandemic on the firm’s business, results, financial position and liquidity, (iii) the timing, profitability, benefits and other prospective aspects of business initiatives and the achievability of medium- and long-term targets and goals, (iv) the future state of the firm’s liquidity and regulatory capital ratios, (v) the firm’s prospective capital distributions (including dividends and repurchases), (vi) the firm’s future effective income tax rate, and (vii) the firm’s investment banking transaction backlog are forward-looking statements. Statements regarding estimated GDP growth are subject to the risk that actual GDP growth may differ, possibly materially, due to, among other things, changes in general economic conditions. Statements about the effects of the COVID-19 pandemic on the firm’s business, results, financial position and liquidity are subject to the risk that the actual impact may differ, possibly materially, from what is currently expected. Statements about the timing, profitability, benefits and other prospective aspects of business initiatives and the achievability of medium and long-term targets and goals are based on the firm’s current expectations regarding the firm’s ability to implement these initiatives and achieve these targets and goals and may change, possibly materially, from what is currently expected. Statements about the future state of the firm’s liquidity and regulatory capital ratios, as well as its prospective capital distributions, are subject to the risk that the firm’s actual liquidity, regulatory capital ratios and capital distributions may differ, possibly materially, from what is currently expected. Statements about the firm’s future effective income tax rate are subject to the risk that the firm’s future effective income tax rate may differ from the anticipated rate indicated, possibly materially, due to, among other things, changes in the firm’s earnings mix or profitability, the entities in which the firm generates profits and the assumptions made in forecasting the firm’s expected tax rate, and potential future guidance from the U.S. IRS. Statements about the firm’s investment banking transaction backlog are subject to the risk that transactions may be modified or may not be completed at all and related net revenues may not be realized or may be materially less than expected. Important factors that could have such a result include, for underwriting transactions, a decline or weakness in general economic conditions, an outbreak of hostilities, volatility in the securities markets or an adverse development with respect to the issuer of the securities and, for financial advisory transactions, a decline in the securities markets, an inability to obtain adequate financing, an adverse development with respect to a party to the transaction or a failure to obtain a required regulatory approval. 12Cautionary Note Regarding Forward-Looking Statements This presentation contains “forward-looking statements” within the meaning of the safe harbor provisions of the U.S. Private Securities Litigation Reform Act of 1995. Forward-looking statements are not historical facts or statements of current conditions, but instead represent only the firm’s beliefs regarding future events, many of which, by their nature, are inherently uncertain and outside of the firm’s control. It is possible that the firm’s actual results, financial condition and liquidity may differ, possibly materially, from the anticipated results, financial condition and liquidity in these forward-looking statements. For information about some of the risks and important factors that could affect the firm’s future results, financial condition and liquidity and the forward-looking statements below, see “Risk Factors” in Part II, Item 1A of the firm’s Quarterly Report on Form 10-Q for the period ended September 30, 2020 and in Part I, Item 1A of the firm’s Annual Report on Form 10-K for the year ended December 31, 2019, as well as the cautionary notes on forward-looking statements in the firm’s Quarterly Report on Form 10-Q for the period ended September 30, 2020 and the Strategic Update, dated January 19, 2021. Information regarding the firm’s assets under supervision, capital ratios, risk-weighted assets, supplementary leverage ratio, balance sheet data and global core liquid assets (GCLA) consists of preliminary estimates. These estimates are forward-looking statements and are subject to change, possibly materially, as the firm completes its financial statements. Statements regarding (i) estimated GDP growth, (ii) the impact of the COVID-19 pandemic on the firm’s business, results, financial position and liquidity, (iii) the timing, profitability, benefits and other prospective aspects of business initiatives and the achievability of medium- and long-term targets and goals, (iv) the future state of the firm’s liquidity and regulatory capital ratios, (v) the firm’s prospective capital distributions (including dividends and repurchases), (vi) the firm’s future effective income tax rate, and (vii) the firm’s investment banking transaction backlog are forward-looking statements. Statements regarding estimated GDP growth are subject to the risk that actual GDP growth may differ, possibly materially, due to, among other things, changes in general economic conditions. Statements about the effects of the COVID-19 pandemic on the firm’s business, results, financial position and liquidity are subject to the risk that the actual impact may differ, possibly materially, from what is currently expected. Statements about the timing, profitability, benefits and other prospective aspects of business initiatives and the achievability of medium and long-term targets and goals are based on the firm’s current expectations regarding the firm’s ability to implement these initiatives and achieve these targets and goals and may change, possibly materially, from what is currently expected. Statements about the future state of the firm’s liquidity and regulatory capital ratios, as well as its prospective capital distributions, are subject to the risk that the firm’s actual liquidity, regulatory capital ratios and capital distributions may differ, possibly materially, from what is currently expected. Statements about the firm’s future effective income tax rate are subject to the risk that the firm’s future effective income tax rate may differ from the anticipated rate indicated, possibly materially, due to, among other things, changes in the firm’s earnings mix or profitability, the entities in which the firm generates profits and the assumptions made in forecasting the firm’s expected tax rate, and potential future guidance from the U.S. IRS. Statements about the firm’s investment banking transaction backlog are subject to the risk that transactions may be modified or may not be completed at all and related net revenues may not be realized or may be materially less than expected. Important factors that could have such a result include, for underwriting transactions, a decline or weakness in general economic conditions, an outbreak of hostilities, volatility in the securities markets or an adverse development with respect to the issuer of the securities and, for financial advisory transactions, a decline in the securities markets, an inability to obtain adequate financing, an adverse development with respect to a party to the transaction or a failure to obtain a required regulatory approval. 12
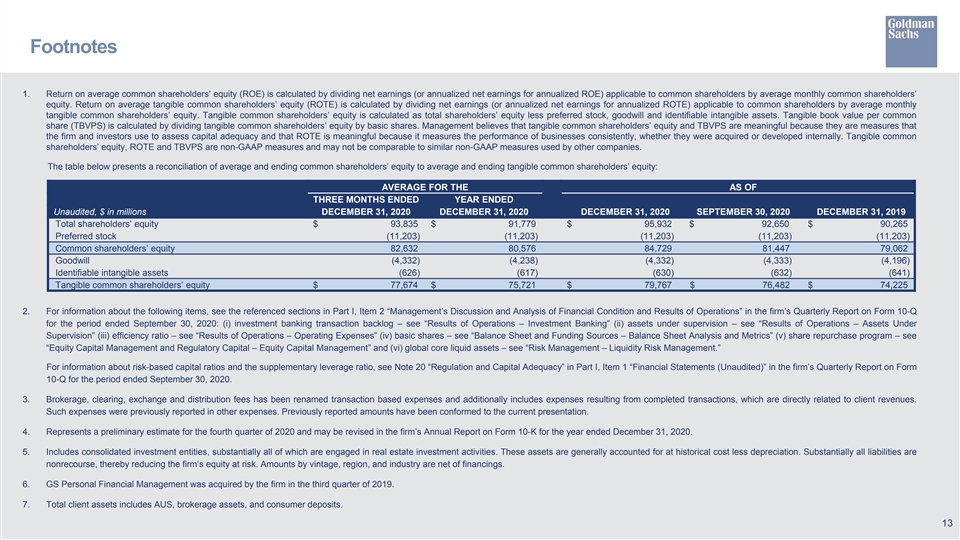
Footnotes 1. Return on average common shareholders’ equity (ROE) is calculated by dividing net earnings (or annualized net earnings for annualized ROE) applicable to common shareholders by average monthly common shareholders’ equity. Return on average tangible common shareholders’ equity (ROTE) is calculated by dividing net earnings (or annualized net earnings for annualized ROTE) applicable to common shareholders by average monthly tangible common shareholders’ equity. Tangible common shareholders’ equity is calculated as total shareholders’ equity less preferred stock, goodwill and identifiable intangible assets. Tangible book value per common share (TBVPS) is calculated by dividing tangible common shareholders’ equity by basic shares. Management believes that tangible common shareholders’ equity and TBVPS are meaningful because they are measures that the firm and investors use to assess capital adequacy and that ROTE is meaningful because it measures the performance of businesses consistently, whether they were acquired or developed internally. Tangible common shareholders’ equity, ROTE and TBVPS are non-GAAP measures and may not be comparable to similar non-GAAP measures used by other companies. The table below presents a reconciliation of average and ending common shareholders’ equity to average and ending tangible common shareholders’ equity: AVERAGE FOR THE AS OF THREE MONTHS ENDED YEAR ENDED Unaudited, $ in millions DECEMBER 31, 2020 DECEMBER 31, 2020 DECEMBER 31, 2020 SEPTEMBER 30, 2020 DECEMBER 31, 2019 Total shareholders’ equity $ 93,835 $ 91,779 $ 95,932 $ 92,650 $ 90,265 Preferred stock (11,203) (11,203) (11,203) (11,203) (11,203) Common shareholders’ equity 82,632 80,576 84,729 81,447 79,062 Goodwill (4,332) (4,238) (4,332) (4,333) (4,196) Identifiable intangible assets (626) (617) (630) (632) (641) Tangible common shareholders’ equity $ 77,674 $ 75,721 $ 79,767 $ 76,482 $ 74,225 2. For information about the following items, see the referenced sections in Part I, Item 2 “Management’s Discussion and Analysis of Financial Condition and Results of Operations” in the firm’s Quarterly Report on Form 10-Q for the period ended September 30, 2020: (i) investment banking transaction backlog – see “Results of Operations – Investment Banking” (ii) assets under supervision – see “Results of Operations – Assets Under Supervision” (iii) efficiency ratio – see “Results of Operations – Operating Expenses” (iv) basic shares – see “Balance Sheet and Funding Sources – Balance Sheet Analysis and Metrics” (v) share repurchase program – see “Equity Capital Management and Regulatory Capital – Equity Capital Management” and (vi) global core liquid assets – see “Risk Management – Liquidity Risk Management.” For information about risk-based capital ratios and the supplementary leverage ratio, see Note 20 “Regulation and Capital Adequacy” in Part I, Item 1 “Financial Statements (Unaudited)” in the firm’s Quarterly Report on Form 10-Q for the period ended September 30, 2020. 3. Brokerage, clearing, exchange and distribution fees has been renamed transaction based expenses and additionally includes expenses resulting from completed transactions, which are directly related to client revenues. Such expenses were previously reported in other expenses. Previously reported amounts have been conformed to the current presentation. 4. Represents a preliminary estimate for the fourth quarter of 2020 and may be revised in the firm’s Annual Report on Form 10-K for the year ended December 31, 2020. 5. Includes consolidated investment entities, substantially all of which are engaged in real estate investment activities. These assets are generally accounted for at historical cost less depreciation. Substantially all liabilities are nonrecourse, thereby reducing the firm’s equity at risk. Amounts by vintage, region, and industry are net of financings. 6. GS Personal Financial Management was acquired by the firm in the third quarter of 2019. 7. Total client assets includes AUS, brokerage assets, and consumer deposits. 13Footnotes 1. Return on average common shareholders’ equity (ROE) is calculated by dividing net earnings (or annualized net earnings for annualized ROE) applicable to common shareholders by average monthly common shareholders’ equity. Return on average tangible common shareholders’ equity (ROTE) is calculated by dividing net earnings (or annualized net earnings for annualized ROTE) applicable to common shareholders by average monthly tangible common shareholders’ equity. Tangible common shareholders’ equity is calculated as total shareholders’ equity less preferred stock, goodwill and identifiable intangible assets. Tangible book value per common share (TBVPS) is calculated by dividing tangible common shareholders’ equity by basic shares. Management believes that tangible common shareholders’ equity and TBVPS are meaningful because they are measures that the firm and investors use to assess capital adequacy and that ROTE is meaningful because it measures the performance of businesses consistently, whether they were acquired or developed internally. Tangible common shareholders’ equity, ROTE and TBVPS are non-GAAP measures and may not be comparable to similar non-GAAP measures used by other companies. The table below presents a reconciliation of average and ending common shareholders’ equity to average and ending tangible common shareholders’ equity: AVERAGE FOR THE AS OF THREE MONTHS ENDED YEAR ENDED Unaudited, $ in millions DECEMBER 31, 2020 DECEMBER 31, 2020 DECEMBER 31, 2020 SEPTEMBER 30, 2020 DECEMBER 31, 2019 Total shareholders’ equity $ 93,835 $ 91,779 $ 95,932 $ 92,650 $ 90,265 Preferred stock (11,203) (11,203) (11,203) (11,203) (11,203) Common shareholders’ equity 82,632 80,576 84,729 81,447 79,062 Goodwill (4,332) (4,238) (4,332) (4,333) (4,196) Identifiable intangible assets (626) (617) (630) (632) (641) Tangible common shareholders’ equity $ 77,674 $ 75,721 $ 79,767 $ 76,482 $ 74,225 2. For information about the following items, see the referenced sections in Part I, Item 2 “Management’s Discussion and Analysis of Financial Condition and Results of Operations” in the firm’s Quarterly Report on Form 10-Q for the period ended September 30, 2020: (i) investment banking transaction backlog – see “Results of Operations – Investment Banking” (ii) assets under supervision – see “Results of Operations – Assets Under Supervision” (iii) efficiency ratio – see “Results of Operations – Operating Expenses” (iv) basic shares – see “Balance Sheet and Funding Sources – Balance Sheet Analysis and Metrics” (v) share repurchase program – see “Equity Capital Management and Regulatory Capital – Equity Capital Management” and (vi) global core liquid assets – see “Risk Management – Liquidity Risk Management.” For information about risk-based capital ratios and the supplementary leverage ratio, see Note 20 “Regulation and Capital Adequacy” in Part I, Item 1 “Financial Statements (Unaudited)” in the firm’s Quarterly Report on Form 10-Q for the period ended September 30, 2020. 3. Brokerage, clearing, exchange and distribution fees has been renamed transaction based expenses and additionally includes expenses resulting from completed transactions, which are directly related to client revenues. Such expenses were previously reported in other expenses. Previously reported amounts have been conformed to the current presentation. 4. Represents a preliminary estimate for the fourth quarter of 2020 and may be revised in the firm’s Annual Report on Form 10-K for the year ended December 31, 2020. 5. Includes consolidated investment entities, substantially all of which are engaged in real estate investment activities. These assets are generally accounted for at historical cost less depreciation. Substantially all liabilities are nonrecourse, thereby reducing the firm’s equity at risk. Amounts by vintage, region, and industry are net of financings. 6. GS Personal Financial Management was acquired by the firm in the third quarter of 2019. 7. Total client assets includes AUS, brokerage assets, and consumer deposits. 13