Attached files
| file | filename |
|---|---|
| EX-99.2 - EX-99.2 - WASHINGTON FEDERAL INC | exhibit992_december20actsh.htm |
| EX-99.1 - EX-99.1 - WASHINGTON FEDERAL INC | exhibit991_december2020ear.htm |
| 8-K - 8-K - WASHINGTON FEDERAL INC | wfsl-20210114.htm |

January 2021 Earnings Release Supplemental Information 1

Portfolios at Risk: $ Loans % of Total Loans Outstanding Original LTV * (CRE Only) ** $ Loans Currently Deferred % Deferred Loans to Total Outstanding Accommodation and Food Service $334 million 2.6% 59.6% _ 0.0% Retail Trade $57 million 0.4% 70.8% _ 0.0% Arts, Entertainment & Recreation $108 million 0.8% 50.0% $16 million 0.1% Health Care $267 million 2.0% 36.0% _ 0.0% At Risk Portfolio Total: $766 million 5.8% 50.5% $16 million 0.1% Conducting ongoing reviews of portfolio and monitoring for potential credit impacts from COVID-19. 2 * Represents the average LTV at origination. Individual Loans may vary significantly. Does not represent current LTV due to changing loan amounts and credit profile. ** CRE loans in at risk portfolio total $369 million

Other Portfolios: $ Loans Outstanding % of Total Loans Outstanding Original LTV * $ Loans Currently Deferred % Deferred Loans to Total Outstanding Oil & Gas $325 million 2.5% N/A _ 0.0% Office Owner Occupied $190 million 1.5% 64.4% $8 million 0.1% Office Non-Owner Occupied $809 million 6.2% 61.3% $1 million 0.0% 3 * Represents the average LTV at origination. Individual Loans may vary significantly. Does not represent current LTV due to changing loan amounts and credit profile.

4 Loans Receivable By Risk Rating ($ Amortized Cost) As of December 31, 2020

Line of Credit Utilization 5

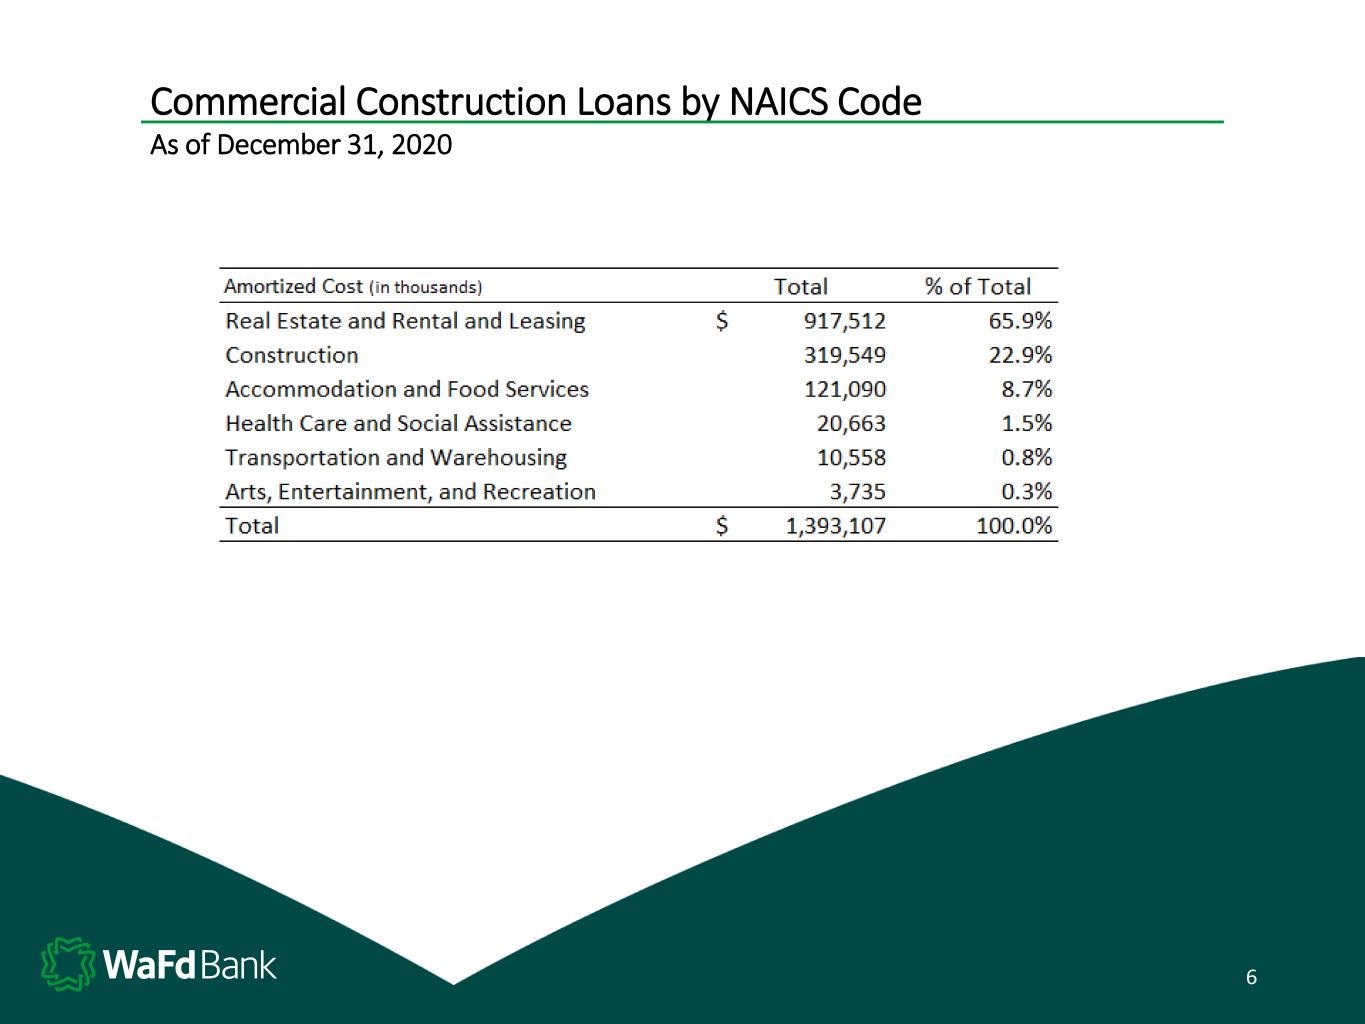
Commercial Construction Loans by NAICS Code As of December 31, 2020 6

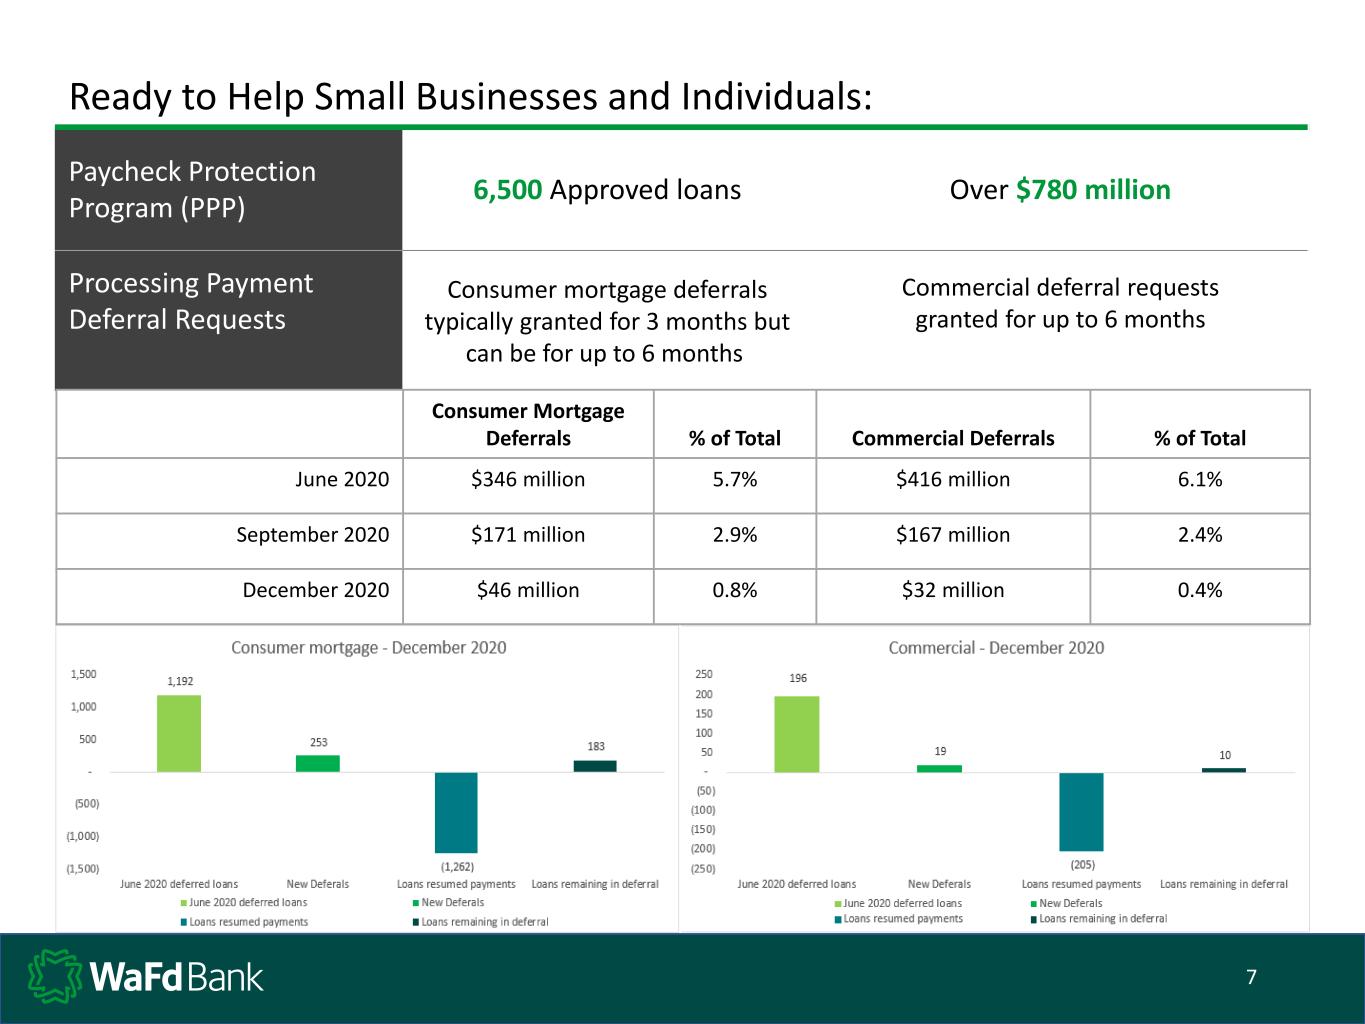
Ready to Help Small Businesses and Individuals: Paycheck Protection Program (PPP) 6,500 Approved loans Over $780 million Processing Payment Deferral Requests Consumer mortgage deferrals typically granted for 3 months but can be for up to 6 months Commercial deferral requests granted for up to 6 months 7 $171 million Consumer Mortgage Deferrals % of Total Commercial Deferrals % of Total June 2020 $346 million 5.7% $416 million 6.1% September 2020 $171 million 2.9% $167 million 2.4% December 2020 $46 million 0.8% $32 million 0.4%

1) Bank is very well capitalized with TCE + ACL to TCA ratio at 10.2%, which would rank us as the 32nd best capitalized publicly traded bank in the United States 2) Current cash dividend is at $0.22 per quarter which is a 43% payout ratio of the current quarter’s earnings of $0.51. The Company has paid out a cash dividend for 151 consecutive quarters and believes the current dividend is reasonable based on expected earnings going forward but the Board will act in the long-term interest of shareholders if earnings diminish substantially as a result of COVID-19 credit costs. 3) The Company's ongoing share repurchase program remains in place; however, management believes that it is prudent to pause repurchases for the time being as it continues to evaluate the extent of the COVID-19 related economic impact. Capital Management 8

Total ACL as a % of Gross Loans 1.24% 1.31% 1.29% 1.33% 1.33% Allowance for Credit Losses Rollforward 9

Allowance for Credit Losses Peer Comparison (excluding unfunded commitments) 10 As of September 30, 2020 ACL as % of Loans Columbia Bank 1.62% Western Alliance Bank 1.19% Umpqua Bank 1.54% Banner Bank 1.65% HomeStreet Bank 1.24% Cullen/Frost Bankers 1.45% First Interstate BancSystem 1.43% Washington Trust Bank 2.06% Glacier Bank 1.42% Heritage Bank 1.57% Peer Average 1.52% WaFd Bank 1.29% WaFd Bank (excluding PPP loans with zero ACL) 1.37% WaFd Bank (Commercial Loans) 1.56% WaFd Bank (Commercial Loans excluding PPP loans) 1.74% WaFd Bank (Consumer Loans) 0.96%

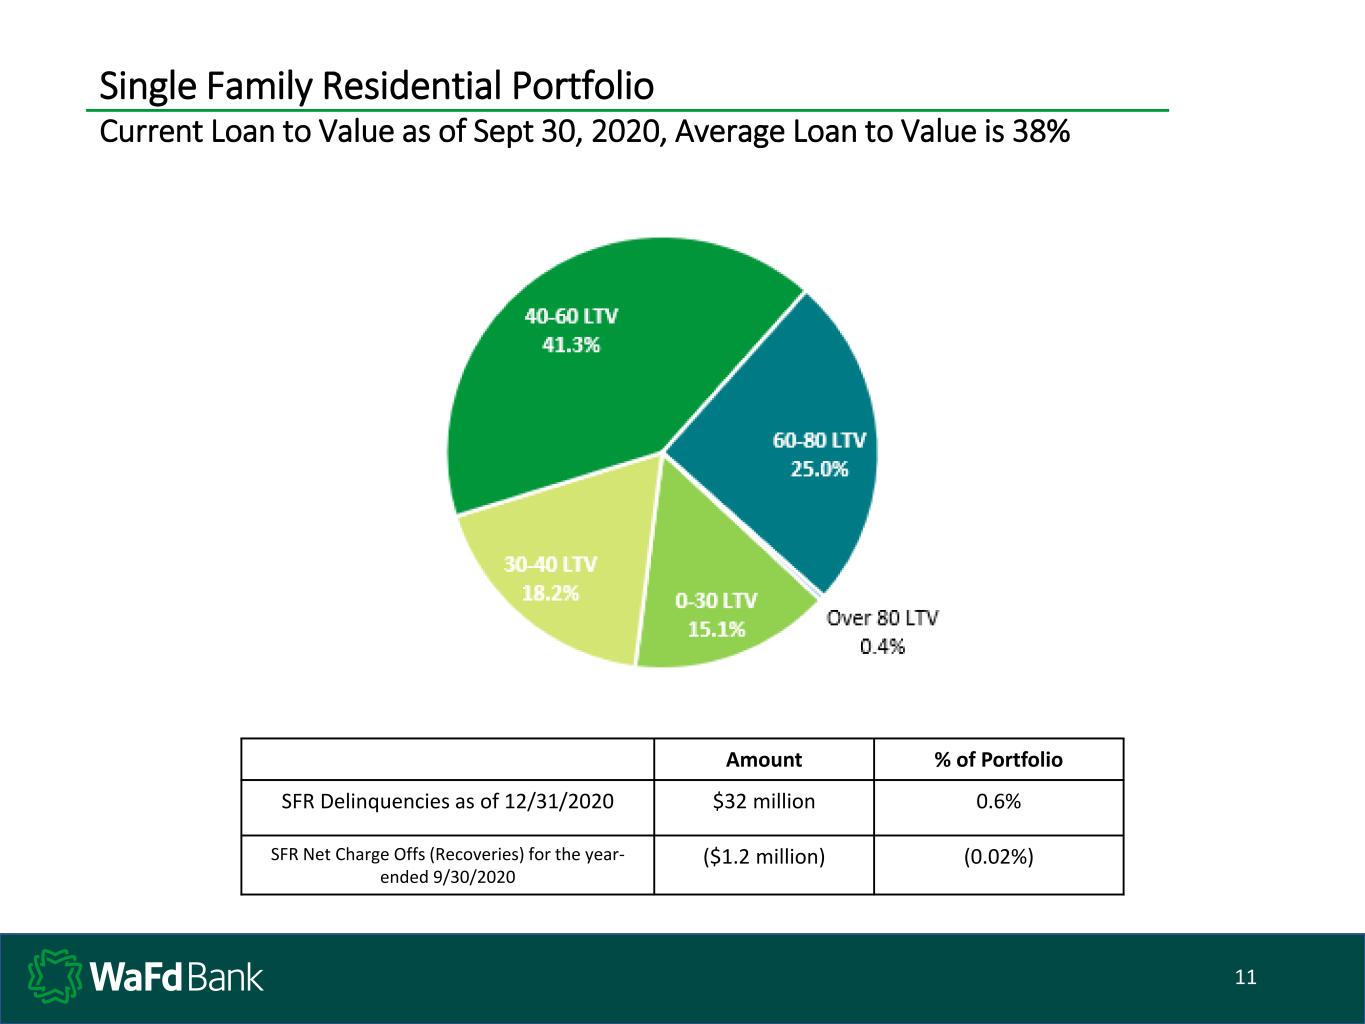
Single Family Residential Portfolio Current Loan to Value as of Sept 30, 2020, Average Loan to Value is 38% 11 Amount % of Portfolio SFR Delinquencies as of 12/31/2020 $32 million 0.6% SFR Net Charge Offs (Recoveries) for the year- ended 9/30/2020 ($1.2 million) (0.02%)
