Attached files
| file | filename |
|---|---|
| EX-99.1 - EXHIBIT 99.1 - Lipocine Inc. | tm212885d1_ex99-1.htm |
| 8-K - FORM 8-K - Lipocine Inc. | tm212885d1_8k.htm |

LPCN 1144 for Non - Cirrhotic NASH LiFT Topline Results at Week 12 January 2021 Exhibit 99.2

LPCN 1144 Presentation I Forward - Looking Statements This presentation contains forward - looking statements about Lipocine, Inc. (the “Company”). These forward - looking statements are made pursuant to the safe harbor provisions of the Private Securities Litigation Reform Act of 1995. These forward - looking statements relate to the Company’s products and product candidates, the availability of additional data for week 36, the results of the LiFT study, clinical and regulatory processes and objectives, and potential benefits of the Company’s product candidates, all of which involve known and unknown risks and uncertainties. Actual results may different materially from the forward - looking statements discussed in this presentation. Accordingly, the Company cautions investors not to place undue reliance on the forward - looking statements contained in, or made in connection with, this presentation. Several factors may affect the initiation and completion of clinical trials and studies, the potential advantages of the Company’s product candidates, and the Company’s capital needs. The forward - looking statements contained in this presentation are qualified by the detailed discussion of risks and uncertainties set for th in the Company’s annual report on Form 10 - K and other periodic reports filed by the Company with the Securities and Exchange Commission, all of which can be obtained on the Company’s website at www.lipocine.com or on the SEC website at www.sec.gov . The forward - looking statements contained in this document represent the Company’s estimates and assumptions only as of the date of this presentation and the Company undertakes no duty or obligation to update or revise publicly any forward - looking statements contained in this presentation as a result of new information, future events or changes in the Company’s expectations. 2

LPCN 1144 Presentation I Summary: Positive Topline Results Statistically significant reduction in liver fat was observed compared to placebo • Up to a mean 9.2% absolute and 46.9% relative reduction in liver fat Statistically significant reduction in markers of liver injury were observed compared to placebo • Up to a mean 22.4 U/L decrease in alanine aminotransferase (ALT), and 10.4 U/L decrease in aspartate aminotransferase (AST) Adverse events in both the treatment arms were comparable to the placebo arm 3 Both LPCN 1144 Treatment A rms M et the Primary E ndpoint with Statistical S ignificance

LPCN 1144 Presentation I LPCN 1144: LiFT ( Li ver F at Intervention with oral T estosterone) * 4 Phase 2 Paired Biopsy Study in Men with NASH (NCT04134091) * Website: www.lift - study.com SCREENING MRI - PDFF (W12) Dose Start MRI - PDFF, DXA, Biopsy Study Design • Biopsy confirmed 56 male NASH subjects with F1 - F3 • Three - arm, placebo controlled with 1:1:1 randomization ▪ Treatment A: 142 mg eq. T twice daily ▪ Treatment B: 142 mg eq. T + with 217 mg of d - alpha tocopherol equivalent twice daily ▪ Placebo twice daily • Treatment duration of 36 weeks 12 Weeks TREATMENT: 36 WEEKS Primary Endpoint: • Change in hepatic fat fraction via MRI - PDFF (W12) Secondary Endpoints: • Change in NASH activity and fibrosis via liver biopsy scoring (W36) • Change in hepatic fat fraction via MRI - PDFF (W36) • Change in liver injury markers, anthropomorphic measurements, lipids, insulin resistance, inflammatory/fibrosis markers • Patient Reported Outcomes (PROs) including quality - of - life and patient global impression scores (PGI) Biopsy FOLLOW - UP: 2 Weeks End of Study/ Start of OLE

LPCN 1144 Presentation I LiFT Study: Baseline Characteristics 5 Parameter Placebo Treatment A Treatment B Started the study (N) 19 18 19 Completed WK 12 (N) 18 18 19 Age (years) 53.6 51.3 53.4 BMI (kg/m 2 ) 37.3 36.9 34.5 Diabetes (%) 52.6 72.2 57.9 Hypertension (%) 68.4 66.7 57.9 Hepatic Fat Fraction (%) 20.06 16.73 20.87 ALT (U/L) 49.0 53.9 51.5 AST (U/L) 35.4 32.4 31.9

LPCN 1144 Presentation I Absolute Change in Liver Fat (%) 6 Baseline to Week 12* - 1.65 - 7.72 - 9.18 -10.0 -8.0 -6.0 -4.0 -2.0 0.0 Placebo (N=19) Treatment A (N=18) Treatment B (N=19) Absolute Change (%) p = 0.0001 p < 0.0001 NS *All Subjects: ITT Dataset, n = 56, missing data imputed using multiple imputation NS = Not Statistically Significant

LPCN 1144 Presentation I Percent of Subjects with ≥ 30% Relative Reduction in Liver Fat 7 Baseline to Week 12* 15.8 66.7 63.2 0 20 40 60 80 100 Placebo (N=19) Treatment A (N=18) Treatment B (N=19) % Responders p = 0.0058 p = 0.0026 NS *Subjects with missing MRI data are considered non - responders; All Subjects: ITT Dataset, n = 56 NS = Not Statistically Significant

LPCN 1144 Presentation I Absolute Change in Liver Fat (%) in Subjects with Baseline Liver Fat ≥ 5% 8 Baseline at Week 12* - 1.75 - 8.02 - 9.45 -12.0 -10.0 -8.0 -6.0 -4.0 -2.0 0.0 Placebo (N=18) Treatment A (N=17) Treatment B (N=17) Absolute Change (%) P < 0.0001 p < 0.0001 NS *Based on available data; n = 52 NS = Not Statistically Significant
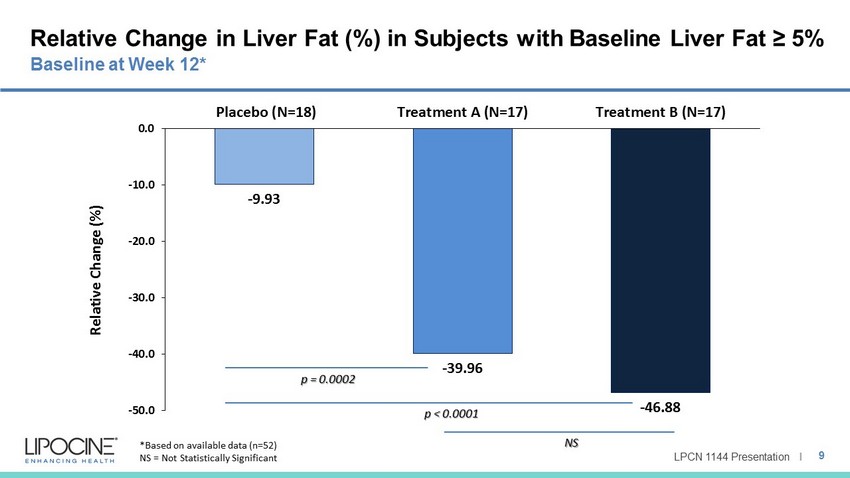
LPCN 1144 Presentation I Relative Change in Liver Fat (%) in Subjects with Baseline Liver Fat ≥ 5% 9 Baseline at Week 12* - 9.93 - 39.96 - 46.88 -50.0 -40.0 -30.0 -20.0 -10.0 0.0 Placebo (N=18) Treatment A (N=17) Treatment B (N=17) Relative Change (%) p = 0.0002 p < 0.0001 NS *Based on available data (n=52) NS = Not Statistically Significant
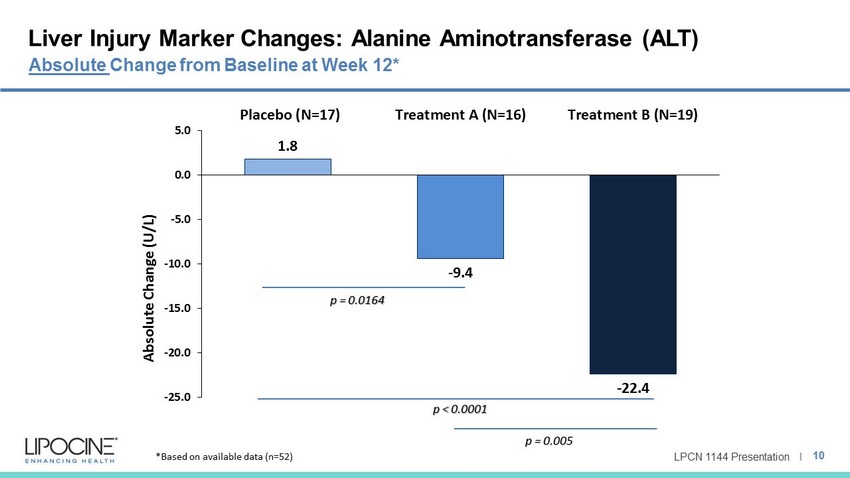
LPCN 1144 Presentation I Liver Injury Marker Changes: Alanine Aminotransferase (ALT) 10 Absolute Change from Baseline at Week 12* 1.8 - 9.4 - 22.4 -25.0 -20.0 -15.0 -10.0 -5.0 0.0 5.0 Placebo (N=17) Treatment A (N=16) Treatment B (N=19) Absolute Change (U/L) p = 0.0164 p < 0.0001 p = 0.005 *Based on available data (n=52)

LPCN 1144 Presentation I Liver Injury Marker Changes: Aspartate Aminotransferase (AST) 11 Absolute Change from Baseline at Week 12* 2.8 - 4.9 - 10.4 -12.0 -10.0 -8.0 -6.0 -4.0 -2.0 0.0 2.0 4.0 Placebo (N=17) Treatment A (N=16) Treatment B (N=19) Absolute Change (U/L) p = 0.0216 p = 0.0001 NS *Based on available data (n=52) NS = Not Statistically Significant

LPCN 1144 Presentation I Longitudinal Changes of Key Liver Injury Markers 12 N = 9 Absolute Changes (U/L) from Baseline up to Week 12 * < 0.05, ** < 0.01, *** < 0.001 vs placebo; † < 0.05, †† < 0.01 vs Treatment A -30 -20 -10 0 10 0 4 8 12 CBL (U/L) Week ALT Placebo Treatment A Treatment B * *** *** -15 -10 -5 0 5 0 4 8 12 CBL (U/L) Week AST Placebo Treatment A Treatment B ** ** *** *

LPCN 1144 Presentation I LiFT Study: Upcoming Data 13 Mid - 2021 Histological change in NASH activity and fibrosis at week 36 MRI - PDFF liver fat data for week 36 Body composition data from DXA scan (at 20 weeks and 36 weeks) • Whole body lean mass, fat mass, arm leg lean mass, and bone mineral density Liver and other markers including (fibrosis and inflammation markers) at week 36 PROs for periodic visits up to week 36 • Quality of life and patient global impression scores (PGI)