Attached files
| file | filename |
|---|---|
| EX-99.1 - EX-99.1 - Matson, Inc. | matx-20210111xex99d1.htm |
| 8-K - 8-K - Matson, Inc. | matx-20210111x8k.htm |
Exhibit 99.2
| 1 Preliminary Fourth Quarter 2020 Earnings Supplement Fourth Quarter 2020 Preliminary Earnings Supplement January 11, 2021 |
| 2 Preliminary Fourth Quarter 2020 Earnings Supplement Forward-Looking Statements Statements made during this presentation that set forth expectations, predictions, projections or are about future events are based on facts and situations that are known to us as of January 11, 2021. We believe that our expectations and assumptions are reasonable. Actual results may differ materially, due to risks and uncertainties, such as those described on pages 24-34 of our Form 10-Q filed on November 2, 2020 and other subsequent filings by Matson with the SEC. Statements made during this presentation are not guarantees of future performance. We do not undertake any obligation to update our forward-looking statements. |
| 3 Preliminary Fourth Quarter 2020 Earnings Supplement Preliminary Fourth Quarter 2020 Results • Capped off a strong year with continued solid performance in Ocean Transportation and Logistics • China service, consisting of CLX and CLX+, was the primary driver of the increase in consolidated operating income year-over-year • Favorable macro supply and demand dynamics in the transpacific tradelane during the quarter – Expect macro supply and demand trends in transpacific tradelane to remain largely favorable in the first half of 2021 as pandemic persists – As pandemic subsides with widespread vaccination, expect some supply and demand factors that we are currently benefitting from to remain and continue to drive demand for CLX and CLX+ • Ocean Transportation – China strength – CLX+ voyages and increased capacity in the CLX service – In other core tradelanes, continued to see elevated demand for sustenance and home improvement goods lead to higher quarterly YoY volume growth • Logistics – Improved performance as a result of elevated goods consumption and inventory restocking and tight supply and demand fundamentals in our core markets |
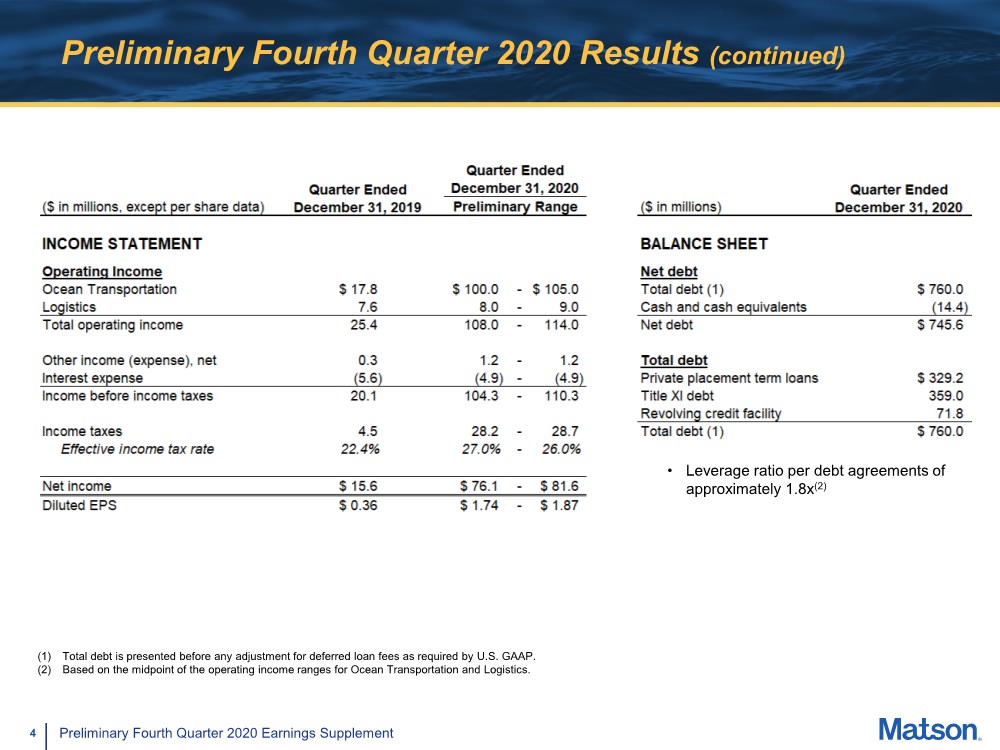
| 4 Preliminary Fourth Quarter 2020 Earnings Supplement Preliminary Fourth Quarter 2020 Results (continued) (1) Total debt is presented before any adjustment for deferred loan fees as required by U.S. GAAP. (2) Based on the midpoint of the operating income ranges for Ocean Transportation and Logistics. • Leverage ratio per debt agreements of approximately 1.8x(2) |
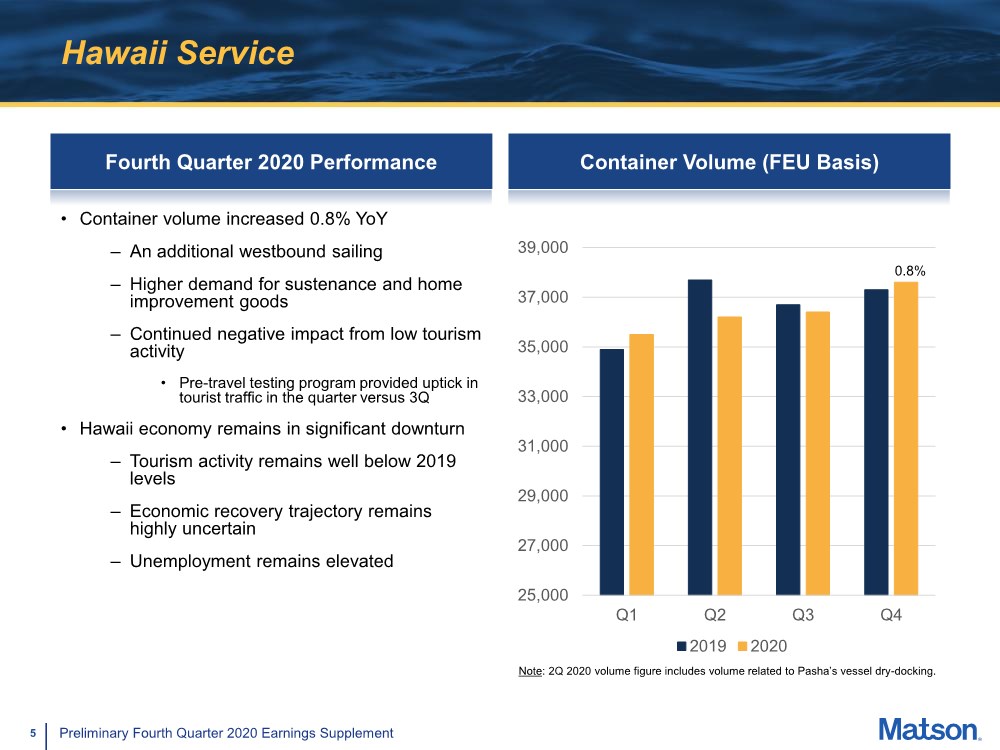
| 5 Preliminary Fourth Quarter 2020 Earnings Supplement Hawaii Service Fourth Quarter 2020 Performance • Container volume increased 0.8% YoY – An additional westbound sailing – Higher demand for sustenance and home improvement goods – Continued negative impact from low tourism activity • Pre-travel testing program provided uptick in tourist traffic in the quarter versus 3Q • Hawaii economy remains in significant downturn – Tourism activity remains well below 2019 levels – Economic recovery trajectory remains highly uncertain – Unemployment remains elevated Container Volume (FEU Basis) 25,000 27,000 29,000 31,000 33,000 35,000 37,000 39,000 Q1 Q2 Q3 Q4 2019 2020 Note: 2Q 2020 volume figure includes volume related to Pasha’s vessel dry-docking. 0.8% |
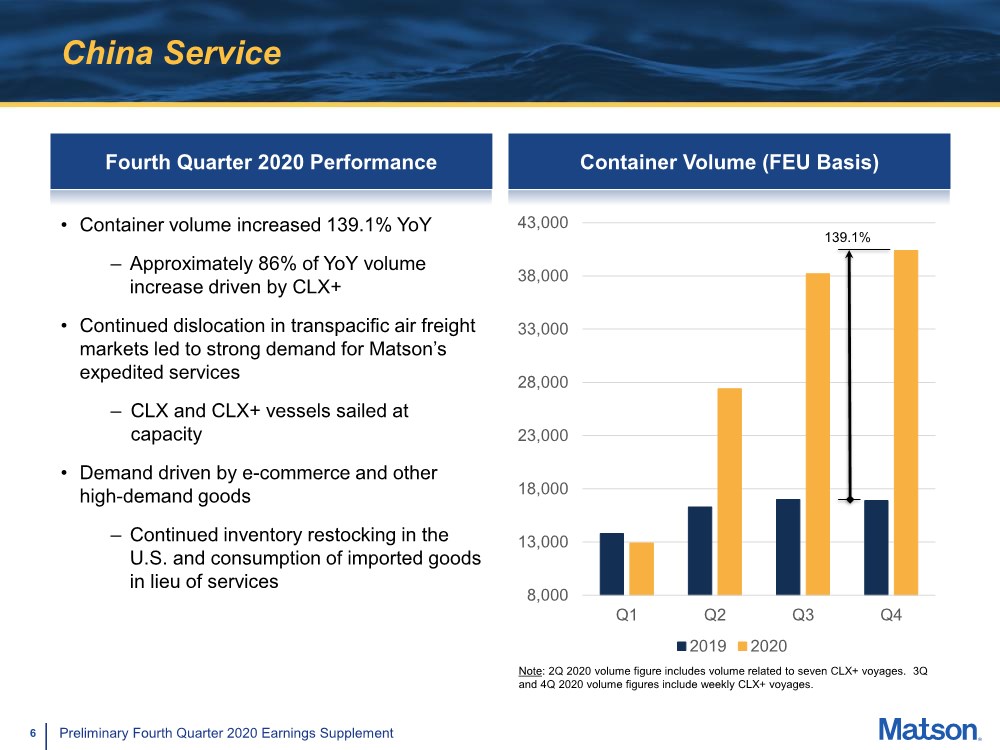
| 6 Preliminary Fourth Quarter 2020 Earnings Supplement China Service Fourth Quarter 2020 Performance • Container volume increased 139.1% YoY – Approximately 86% of YoY volume increase driven by CLX+ • Continued dislocation in transpacific air freight markets led to strong demand for Matson’s expedited services – CLX and CLX+ vessels sailed at capacity • Demand driven by e-commerce and other high-demand goods – Continued inventory restocking in the U.S. and consumption of imported goods in lieu of services Container Volume (FEU Basis) 8,000 13,000 18,000 23,000 28,000 33,000 38,000 43,000 Q1 Q2 Q3 Q4 2019 2020 Note: 2Q 2020 volume figure includes volume related to seven CLX+ voyages. 3Q and 4Q 2020 volume figures include weekly CLX+ voyages. 139.1% |
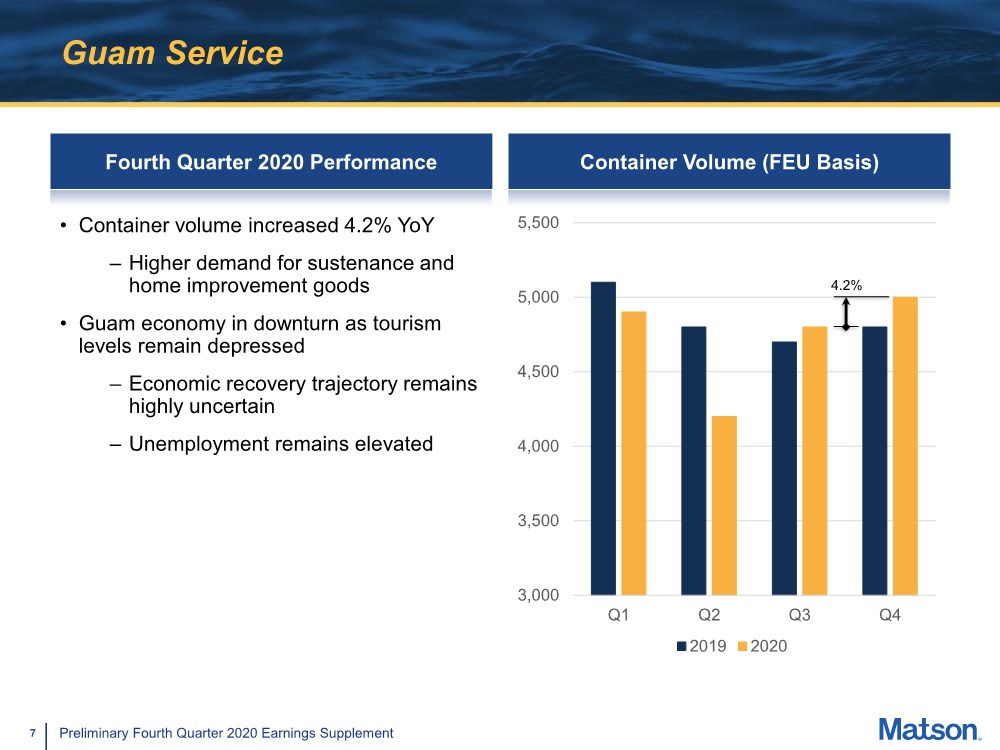
| 7 Preliminary Fourth Quarter 2020 Earnings Supplement Guam Service Fourth Quarter 2020 Performance Container Volume (FEU Basis) 3,000 3,500 4,000 4,500 5,000 5,500 Q1 Q2 Q3 Q4 2019 2020 4.2% • Container volume increased 4.2% YoY – Higher demand for sustenance and home improvement goods • Guam economy in downturn as tourism levels remain depressed – Economic recovery trajectory remains highly uncertain – Unemployment remains elevated |
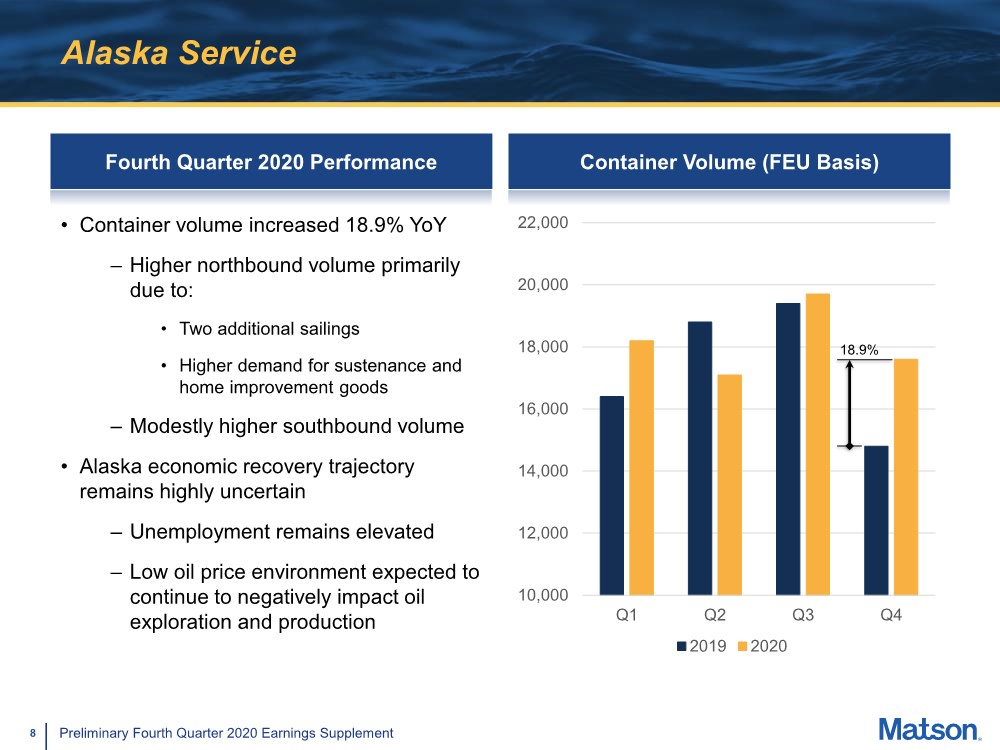
| 8 Preliminary Fourth Quarter 2020 Earnings Supplement Alaska Service Fourth Quarter 2020 Performance • Container volume increased 18.9% YoY – Higher northbound volume primarily due to: • Two additional sailings • Higher demand for sustenance and home improvement goods – Modestly higher southbound volume • Alaska economic recovery trajectory remains highly uncertain – Unemployment remains elevated – Low oil price environment expected to continue to negatively impact oil exploration and production Container Volume (FEU Basis) 10,000 12,000 14,000 16,000 18,000 20,000 22,000 Q1 Q2 Q3 Q4 2019 2020 18.9% |
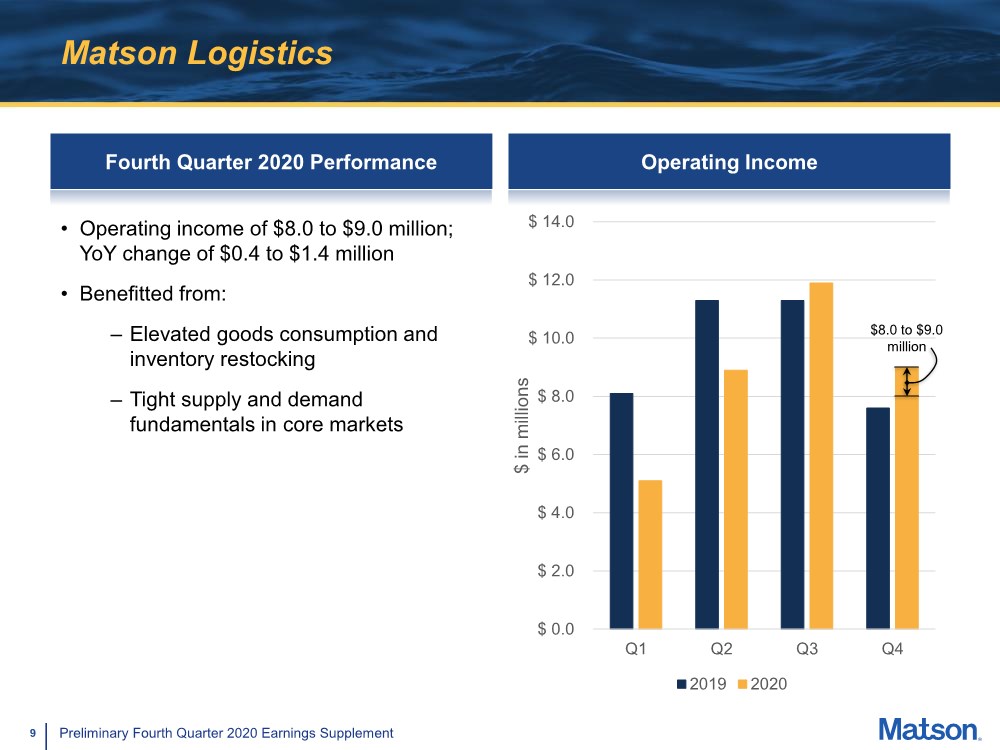
| 9 Preliminary Fourth Quarter 2020 Earnings Supplement Matson Logistics Fourth Quarter 2020 Performance Operating Income $ 0.0 $ 2.0 $ 4.0 $ 6.0 $ 8.0 $ 10.0 $ 12.0 $ 14.0 Q1 Q2 Q3 Q4 $ in millions 2019 2020 • Operating income of $8.0 to $9.0 million; YoY change of $0.4 to $1.4 million • Benefitted from: – Elevated goods consumption and inventory restocking – Tight supply and demand fundamentals in core markets $8.0 to $9.0 million |