Attached files
| file | filename |
|---|---|
| 8-K - FORM 8-K - IRONWOOD PHARMACEUTICALS INC | tm212238d1_8k.htm |

J.P. Morgan Healthcare Conference January 11, 2021 Exhibit 99.1
This presentation contains forward - looking statements . Investors are cautioned not to place undue reliance on these forward - looking statements, including statements about our ability to execute on our vision to become the leading U . S . GI healthcare company ; the Company’s strategy, business, financial position and operations, including with respect to maximizing LINZESS® (linaclotide), building an innovative GI pipeline and delivering sustainable profits and positive cash flow ; the demand, development, commercial availability and commercial potential of linaclotide and the drivers, timing, impact and results thereof ; the potential indications for, and benefits of, linaclotide ; our ability to successfully execute and the value - creation potential of our strategic priorities, including our efforts to advance innovative treatments for serious, organic diseases and openness to explore transformative transactions or other strategies ; the potential that we return capital to shareholders via a share repurchase program ; the strength of the intellectual property protection for linaclotide ; our ability to drive LINZESS growth, including through efforts to enhance the HCP / patient experience (including via our hybrid selling model, telehealth initiatives, and patient adherence and engagement programs), communicate overall abdominal symptom data, broaden payer access and strengthen clinical utility of linaclotide ; our ability to successfully innovate our commercial strategy by implementing a hybrid selling model and advancing telehealth initiatives and advancing lifecycle management efforts ; the potential of IW - 3300 to be an effective treatment of visceral pain conditions, as well as our plans to advance IW - 3300 into Phase I development (including the timing and results thereof) ; expectations regarding our global collaborations and our financial performance and results, and guidance and expectations related thereto, including expectations related to LINZESS net sales growth, total revenue and adjusted EBITDA, as well as Rx demand growth and net price expectations . These forward - looking statements speak only as of the date of this presentation, and Ironwood undertakes no obligation to update these forward - looking statements . Each forward - looking statement is subject to risks and uncertainties that could cause actual results to differ materially from those expressed or implied in such statement . Applicable risks and uncertainties include those related to the effectiveness of development and commercialization efforts by us and our partners ; preclinical and clinical development, manufacturing and formulation development of linaclotide and our product candidates ; the risk that clinical programs and studies may not progress or develop as anticipated, including that studies are delayed or discontinued for any reason, such as safety, tolerability, enrollment, manufacturing, economic or other reasons, including due to the impacts of the COVID - 19 pandemic ; the risk that findings from our completed nonclinical and clinical studies may not be replicated in later studies ; the risk that we or our partners are unable to obtain, maintain or manufacture sufficient LINZESS or our product candidates, or otherwise experience difficulties with respect to supply or manufacturing ; the efficacy, safety and tolerability of linaclotide and our product candidates ; the risk that the therapeutic opportunities for LINZESS or our product candidates are not as we expect ; decisions by regulatory and judicial authorities, including the potential impact of the COVID - 19 pandemic on governmental authorities ; the risk we may never get additional patent protection for linaclotide and other product candidates ; the risk that we may never get sufficient patent protection for linaclotide and other product candidates, that patents for linaclotide or other products may not provide adequate protection from competition, or that we are not able to successfully protect such patents ; outcomes in legal proceedings to protect or enforce the patents relating to our products and product candidates, including abbreviated new drug application litigation ; the possibility that we may not achieve some or all of the anticipated benefits of the separation of Cyclerion ; the risk that financial and operating results may differ from our projections ; developments in the intellectual property landscape ; challenges from and rights of competitors or potential competitors ; the risk that our planned investments do not have the anticipated effect on our company revenues ; the risk that we are unable to manage our expenses or cash use, or are unable to commercialize our products as expected ; and the risks listed under the heading "Risk Factors" and elsewhere in Ironwood's Quarterly Report on Form 10 - Q for the quarter ended September 30 , 2020 , and in our subsequent SEC filings . In addition, the COVID - 19 pandemic and the associated containment efforts have had a serious adverse impact on the economy, the severity and duration of which are uncertain . Government stabilization efforts will only partially mitigate the consequences . The extent and duration of the impact on our business and operations is highly uncertain . Factors that will influence the impact on our business, operations and financial results include the duration and extent of the pandemic, the extent of imposed or recommended containment and mitigation measures, and the general economic consequences of the pandemic . The pandemic could have a material adverse impact on our business, operations and financial results for an extended period of time . Ironwood uses non - GAAP financial measures in this presentation, which should be considered only a supplement to, and not a substitute for or superior to, GAAP measures . Refer to the Reconciliation of GAAP Results to Non - GAAP Financial Measures table and to the Reconciliation of GAAP Income from Continuing Operations, Net of Income Taxes to Adjusted EBITDA table and related footnotes on pages 39 and 40 of this presentation . Further, Ironwood considers the net profit for the U . S . LINZESS brand collaboration with AbbVie in assessing the product’s performance and calculates it based on inputs from both Ironwood and AbbVie . This figure should not be considered a substitute for Ironwood’s GAAP financial results . An explanation of our calculation of this figure is provided in the U . S . LINZESS Brand Collaboration table and related footnotes on page 41 of this presentation . LINZESS® is a registered trademark of Ironwood Pharmaceuticals, Inc . Any other trademarks referred to in this presentation are the property of their respective owners . All rights reserved . 2 Safe Harbor Statement
Ironwood: Leading in GI through Growth and Innovation

To Become the Leading U.S. Gastrointestinal Healthcare Company 4 To advance the treatment of GI diseases and redefine the standard of care for GI patients OUR VISION OUR MISSION
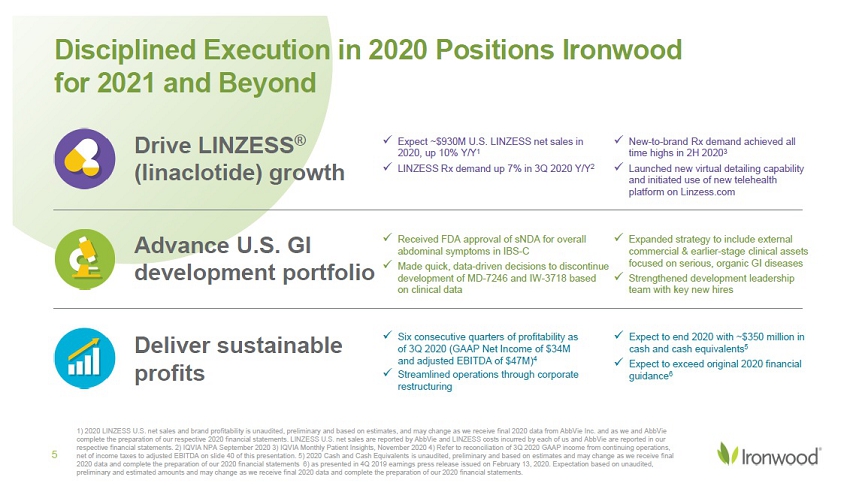
Disciplined Execution in 2020 Positions Ironwood for 2021 and Beyond 5 x New - to - brand Rx demand achieved all time highs in 2H 2020 3 x Launched new virtual detailing capability and initiated use of new telehealth platform on Linzess.com x Expanded strategy to include external commercial & earlier - stage clinical assets focused on serious, organic GI diseases x Strengthened development leadership team with key new hires x Expect to end 2020 with ~$350 million in cash and cash equivalents 5 x Expect to exceed original 2020 financial guidance 6 x Received FDA approval of sNDA for overall abdominal symptoms in IBS - C x Made quick, data - driven decisions to discontinue development of MD - 7246 and IW - 3718 based on clinical data Drive LINZESS ® (linaclotide) growth Advance U.S. GI development portfolio Deliver sustainable profits x Six consecutive quarters of profitability as of 3Q 2020 (GAAP Net Income of $34M and adjusted EBITDA of $47M) 4 x Streamlined operations through corporate restructuring x Expect ~$930M U.S. LINZESS net sales in 2020, up 10% Y/Y 1 x LINZESS Rx demand up 7% in 3Q 2020 Y/Y 2 1) 2020 LINZESS U.S. net sales and brand profitability is unaudited, preliminary and based on estimates, and may change as we re ceive final 2020 data from AbbVie Inc. and as we and AbbVie complete the preparation of our respective 2020 financial statements. LINZESS U.S. net sales are reported by AbbVie and LINZESS costs incurred by each of us and AbbVie are reported in our respective financial statements. 2) IQVIA NPA September 2020 3) IQVIA Monthly Patient Insights, November 2020 4) Refer to rec onc iliation of 3Q 2020 GAAP income from continuing operations, net of income taxes to adjusted EBITDA on slide 40 of this presentation. 5) 2020 Cash and Cash Equivalents is unaudited, preliminary and based on estimates and may change as we re ceive final 2020 data and complete the preparation of our 2020 financial statements 6) as presented in 4Q 2019 earnings press release is sue d on February 13, 2020. Expectation base on unaudited, preliminary and estimated amounts and may change as we receive final 2020 data and complete the preparation of our 2020 finan cia l statements.

LINZESS Performance Was Resilient in 2020, despite COVID - 19 Pandemic 6 LINZESS Net Sales Growth 2 LINZESS Extended Unit Growth 1 1) IQVIA NPA Dec 2020 2) 4Q 2020 LINZESS U.S. net sales is unaudited, preliminary and based on estimates, and may change as w e r eceive final 2020 data from AbbVie Inc. LINZESS U.S. net sales are reported by AbbVie. 1,700,000 1,900,000 2,100,000 2,300,000 2,500,000 2,700,000 2,900,000 3,100,000 3,300,000 1/6/2017 2/17/2017 3/31/2017 5/12/2017 6/23/2017 8/4/2017 9/15/2017 10/27/2017 12/8/2017 1/19/2018 3/2/2018 4/13/2018 5/25/2018 7/6/2018 8/17/2018 9/28/2018 11/9/2018 12/21/2018 2019-02-01 2019-03-15 2019-04-26 2019-06-07 2019-07-19 2019-08-30 2019-10-11 2019-11-22 1/3/2020 2/14/2020 3/27/2020 5/8/2020 6/19/2020 7/31/2020 9/11/2020 10/23/2020 12/4/2020 2020 $0 $50 $100 $150 $200 $250 $300 1Q 2Q 3Q 4Q 2020 2019 8 % 5 % 10% 16%

7 Advancing innovative treatments for GI diseases Supported by strong LINZESS business, growth in profits, GI expertise and high unmet needs Pursuing broader range of smaller on - market GI assets Expands opportunities, but limited durability & less innovative We Assessed the Value - Creation Potential of a Range of Strategic Options 7 Expanding into therapeutic adjacencies With strategic advantages in GI; would require significant value - creation potential to expand into TAs Exploring transformative transactions Remain open to potential transactions with value - creation potential
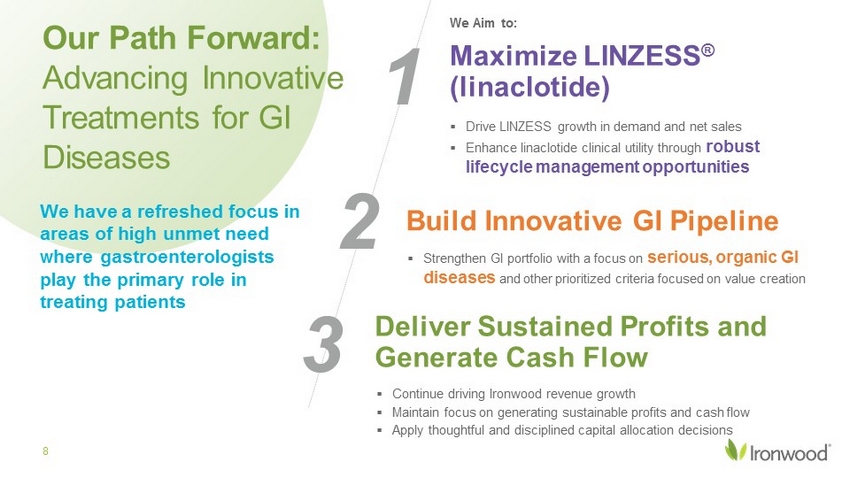
We have a refreshed focus in areas of high unmet need where gastroenterologists play the primary role in treating patients ▪ Strengthen GI portfolio with a focus on serious, organic GI diseases and other prioritized criteria focused on value creation Build Innovative GI Pipeline Our Path Forward: Advancing Innovative Treatments for GI Diseases 8 Maximize LINZESS ® (linaclotide) ▪ Drive LINZESS growth in demand and net sales ▪ Enhance linaclotide clinical utility through robust lifecycle management opportunities Deliver Sustained Profits and Generate Cash Flow ▪ Continue driving Ironwood revenue growth ▪ Maintain focus on generating sustainable profits and cash flow ▪ Apply thoughtful and disciplined capital allocation decisions 1 2 3 We Aim to:
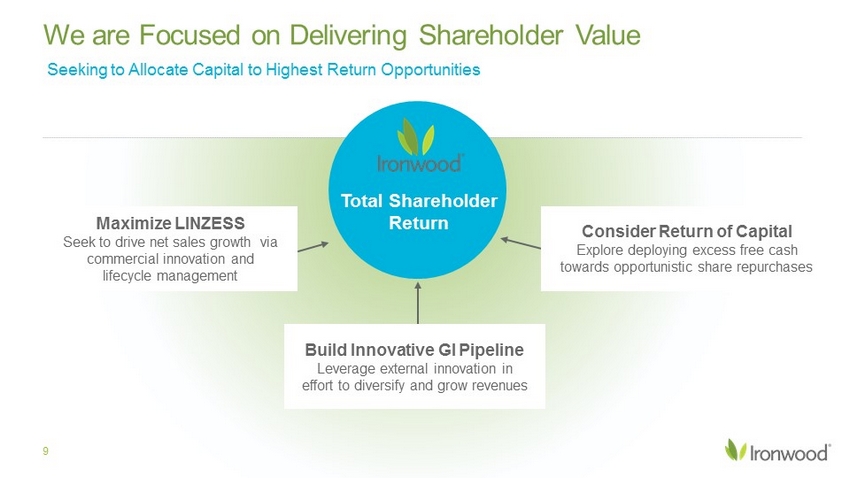
Maximize LINZESS Seek to drive net sales growth via commercial innovation and lifecycle management 9 We are Focused on Delivering Shareholder Value Seeking to Allocate Capital to Highest Return Opportunities Total Shareholder Return Build Innovative GI Pipeline Leverage external innovation in effort to diversify and grow revenues Consider Return of Capital Explore deploying excess free cash towards opportunistic share repurchases

$23 $76 $150 $274 $298 $347 $428 2013 2014 2015 2016 2017 2018 2019 Total Ironwood Revenue (in millions) 1 1) Ironwood revenues are generated primarily through its collaborative arrangements and license agreements related to linaclo tid e, as well as co - promotion arrangements in the U.S. 10 Ironwood Leading through Growth and Innovation On track to exceed $1 billion in U.S. net sales Innovative Pipeline Opportunities Pursuing assets for serious, organic GI diseases Linaclotide Lifecycle Management + +

Maximize LINZESS

Sustained growth since launch in 2012 LINZESS is the Prescription Market Leader in IBS - C / CIC Category in Rx Demand IBS - C / CIC Market Share ~40% HCP / Patient Satisfaction Oct 2020 MMIT, AbbVie Oct 2020 MM Dashboard SRI “LINZESS ATU” 2020; Brado “LINZESS Patient Journey” July 2020 IQVIA RAPID Weekly Market without PEG, Dec 2020 12 Prescribed Branded Treatment for IBS - C & CIC in Branded Payer Access >75% Combined, Unrestricted Access IQVIA NPA Nov 2020 #1 #1 #1 #1

1) IQVIA NPA Weekly, Dec 2020 2) IQVIA RAPID Weekly Market without PEG, Dec 2020 LINZESS Maintained Strong Demand Growth and Nearly 40% IBS - C / CIC Market Share in 2020 2 13 LINZESS Y/Y Total Rx Demand 1 2020 IBS - C/CIC Market Share 2 1,900,000 2,100,000 2,300,000 2,500,000 2,700,000 2,900,000 3,100,000 3,300,000 2018 EUTRx LINZESS 2019 EUTRx LINZESS 2020 EUTRx LINZESS all - Time High (41%) LACTULOSE (32%) AMITIZA ( 12 %) TRULANCE (4%) MOTEGRITY ( 2 %) ZELNORM ( 0 ) Other (9%) 0 5 10 15 20 25 30 35 40 45 Jan-19 Mar-19 May-19 Jul-19 Sep-19 Nov-19 Jan-20 Mar-20 May-20 Jul-20 Sep-20 Nov-20 Market Share %

1) Other Branded Products: Amitiza , Trulance, Motegrity, and Zelnorm . 2) IQVIA Monthly Patient Insights. 3) IQVIA Weekly NPA Nov 2019 vs Nov 2020 4) IQVIA Monthly NPA FY 2018, FY 2019, and FY 2020 (through 11/30/2020) Strong LINZESS New - to - brand Volume and 90 - Day Prescriptions Are Key Indicators of Future Growth Potential LINZESS NBRx Volume Growth 2 Average TRx fill size increased by 2.5% in Nov 2020 Y/Y to 42 pills/Rx 3 Average NRx fill size increased by 2.3% in Nov 2020 Y/Y to 46 pills/Rx 3 14 104,000 106,000 108,000 110,000 112,000 114,000 116,000 118,000 120,000 122,000 2Q20 3Q20 By comparison, other Branded Products 1 in aggregate grew ~8% 2 in NBRx growth over the same period ~10% growth 37.5 38.0 38.5 39.0 39.5 40.0 40.5 41.0 41.5 42.0 42.5 43.0 Average TRx Fill Size 15% 17% 19% 2018 2019 2020 Avg % of TRx that is 90 ct 4 LINZESS 90 - Day Prescription Growth 3
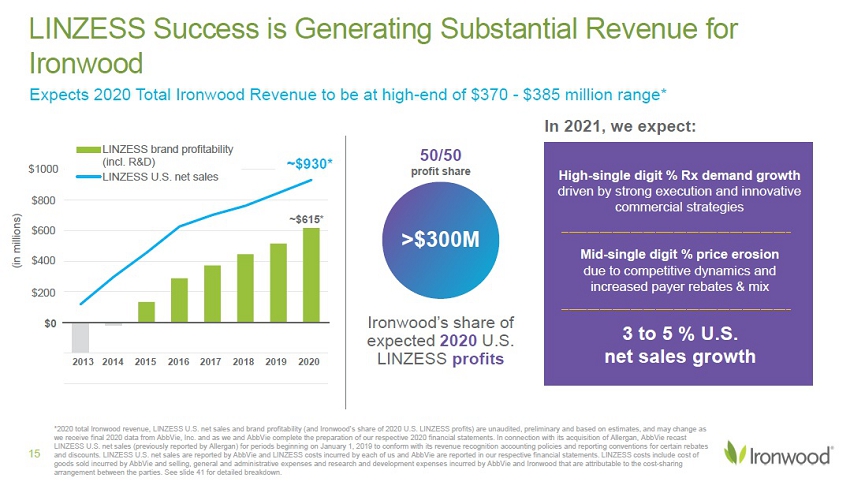
*2020 LINZESS U.S. net sales and brand profitability (and Ironwood’s share of 2020 U.S. LINZESS profits) are unaudited, preli min ary and based on estimates, and may change as we receive final 2020 data from AbbVie, Inc. and as we and AbbVie complete the preparation of our respective 2020 financial statements. In connection with its acquisition of Allergan, AbbVie recast LINZESS U.S. net sales (previously reported by Allergan) for periods beginning on January 1, 2019 to conform with its revenue recognition accounting po licies and reporting conventions for certain rebates and discounts. LINZESS U.S. net sales are reported by AbbVie and LINZESS costs incurred by each of us and AbbVie are reported in our respect ive financial statements. LINZESS costs include cost of goods sold incurred by AbbVie and selling, general and administrative expenses and research and development expenses incurred by AbbVie and Ironwood that are attributable to the cost - sharing arrangement between the parties. See slide 41 for detailed breakdown. >$300M Ironwood’s share of expected 2020 U.S. LINZESS profits 50/50 profit share In 2021, we expect: ~ $615 * ~ $930 LINZESS brand profitability (incl. R&D) LINZESS U.S. net sales $0 $200 $400 $600 $800 2013 2014 2015 2016 2017 2018 2019 High - single digit % Rx demand growth driven by strong execution and innovative commercial strategies Mid - single digit % price erosion due to competitive dynamics and increased payer rebates & mix 15 LINZESS Success is Generating Substantial Revenue for Ironwood 2020 3 to 5 % U.S. net sales growth ~$930* $1000 (in millions)

~75% >90% ~70% Communicating Overall Abdominal Symptom Data x FDA approved LINZESS sNDA for overall IBS - C abdominal symptoms x Full refresh of consumer campaign expected spring 2021 Enhancing HCP / Patient Experience x Expand hybrid selling model leveraging in - person & virtual technologies x Advance access to telehealth to drive increased LINZESS New Patient Starts x Increase adherence through 90 - day Rx & patient engagement programs Source: IMS Xponent ™, PlanTrak , as of August - 2020, Oct 2020 MMIT On Track to Exceed $1 Billion in LINZESS Net Sales 16 Broadening Payer Access x Maintain broad access while managing net price impact x Communicate value of LINZESS with payers in effort to maintain access & price x Educate on clinical profile & importance of overall abdominal symptom data Combined Medicare Part D Commercial Strengthening Clinical Utility via LCM x Enhance clinical utility of linaclotide through robust lifecycle management (LCM) x Advance efforts to explore new indications and populations LINZESS Unrestricted Access We seek to: We seek to: We seek to: Currently evaluating multiple opportunities to drive further growth
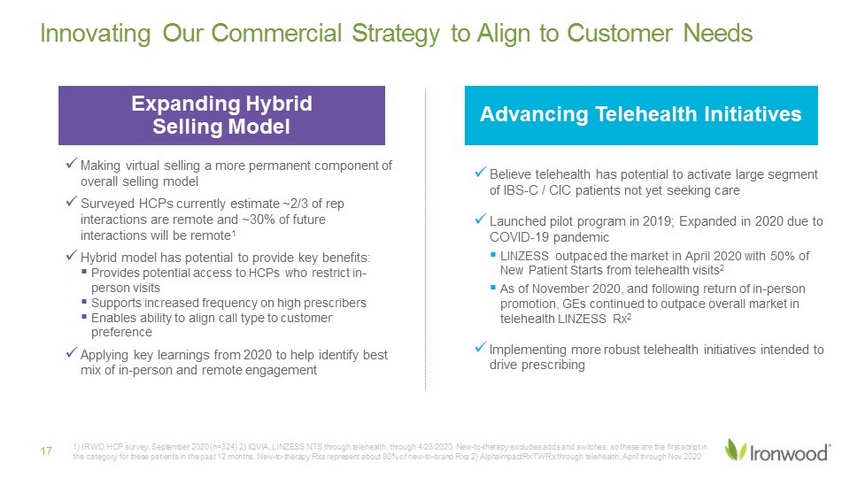
Innovating Our Commercial Strategy to Align to Customer Needs 17 Expanding Hybrid Selling Model Advancing Telehealth Initiatives x Making virtual selling a more permanent component of overall selling model x Surveyed HCPs currently estimate ~2/3 of rep interactions are remote and ~30% of future interactions will be remote 1 x Hybrid model has potential to provide key benefits: ▪ Provides potential access to HCPs who restrict in - person visits ▪ Supports increased frequency on high prescribers ▪ Enables ability to align call type to customer preference x Applying key learnings from 2020 to help identify best mix of in - person and remote engagement x Believe telehealth has potential to activate large segment of IBS - C / CIC patients not yet seeking care x Launched pilot program in 2019; Expanded in 2020 due to COVID - 19 pandemic ▪ LINZESS outpaced the market in April 2020 with 50% of New Patient Starts from telehealth visits 2 ▪ As of November 2020, and following return of in - person promotion, GEs continued to outpace overall market in telehealth LINZESS Rx 2 x Implementing more robust telehealth initiatives intended to drive prescribing 1) IRWD HCP survey, September 2020 (n=324) 2) IQVIA, LINZESS NTS through telehealth, through 4/23/2020. New - to - therapy excludes adds and switches, so these are the first script in the category for these patients in the past 12 months. New - to - therapy Rxs represent about 80% of new - to - brand Rxs 2) AlphaimpactRx TWRx through telehealth, April through Nov 2020

18 1) Chey, W. et al “Frequency and Bothersomeness of Symptoms, Health Care Seeking Behavior and Satisfaction with Therapy in IBS - C Patients Meeting ROME II Criteria: Results of a Population Based Survey”; Hoch, R, et al "Title: Symptom Frequency, Health Care Seeking Behavior, and Satisfaction with Ther apy among Chronic Constipation Patients with Both Constipation and Abdominal Symptoms: Results of a Population - Based Survey“; 2) IMS NPA MAT Sept - 2020; 3) IMS/IRI MAT June 2015; 4) Brado “LINZESS Patient Journey” July 2020; 5) Symphony Health SOB 9/2020 ~60% of new LINZESS RXs come from OTC 5 >$10.3B+ OTC Lax Market ~80% patients not very satisfied with OTC laxatives 4 18 OTC/Rx Laxative Market Remains Largest Opportunity for LINZESS Growth OTC and Rx Market Sales OTC ~22M units 1,3 (unit = 30 days) Rx ~5M TRxs 1,2 LINZESS 2 >$10.3B >$2.2B Assumptions • Branded medication priced $15.6/day • TRx (30 day) priced $467/ TRx

1) Results from two Phase III clinical trials with identical designs comparing LINZESS 290 mcg vs placebo for 12 weeks. The d ata above represent a prespecified secondary endpoint in individual trials. Trial 1: Trt Diff 12.7%, 95% CI (5.8%, 19.5%). Trial 2: Trt Diff 14.4%, 95% CI (7.6%, 21.1%). 2) Am J Gastroenterol advance online publication, 18 September 2012; doi : 10.1038/ajg.2012.254; Am J Gastroenterol 2012; 107:1714 – 1724; doi : 10.1038/ajg.2012.255; published online 18 September 2012 Linaclotide, the First - in - Class GC - C Agonist, Has Demonstrated Significant Improvement in Abdominal Pain in Phase III Trials 19 % Change Ab. Pain -60 -50 -40 -30 -20 -10 0 Trial Week BL 2 4 6 8 10 12 14 16 18 20 22 24 26 % Improvement In Pain Relief 2 % Abdominal Pain Responder 1,2 6 out of 12 weeks
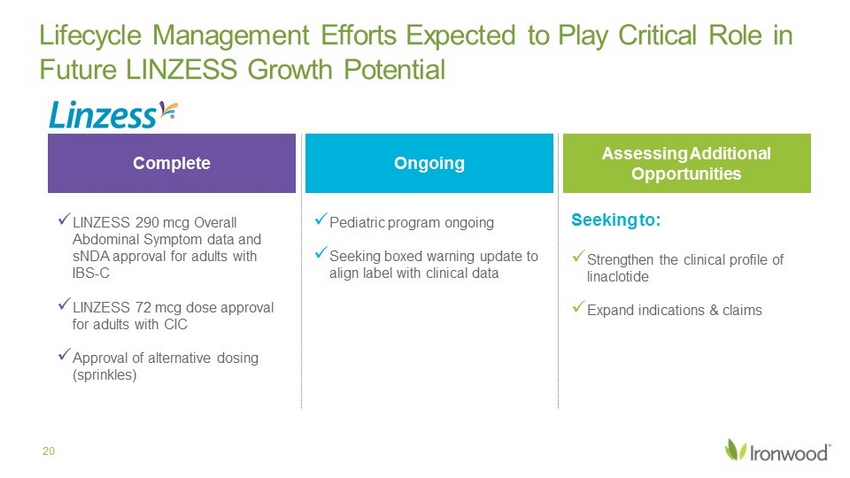
Ongoing Complete Assessing Additional Opportunities Lifecycle Management Efforts Expected to Play Critical Role in Future LINZESS Growth Potential 20 x LINZESS 290 mcg Overall Abdominal Symptom data and sNDA approval for adults with IBS - C x LINZESS 72 mcg dose approval for adults with CIC x Approval of alternative dosing (sprinkles) x Pediatric program ongoing x Seeking boxed warning update to align label with clinical data x Strengthen the clinical profile of linaclotide x Expand indications & claims Seeking to:

Japan Rest of world China (incl. Hong Kong & Macau) • LINZESS launched in Japan for IBS - C in March 2017 and chronic constipation in August 2018 • LINZESS net sales for six months ended 9/30/20 (as reported by Astellas) were ~¥3.1B, up 13% Y/Y • Astellas has exclusive rights to develop, manufacture & commercialize • IRWD eligible for royalties beginning in the mid single - digits escalating up to low double - digit %, based on annual net sales in Japan • LINZESS launched in China in November 2019 • Chinese National Healthcare Security Administration (NHSA) included LINZESS to 2020 reimbursement list • Expect modest ramp - up in 2021, with <$2 million in expected royalties to IRWD • AstraZeneca has exclusive rights to develop, manufacture, & commercialize • IRWD eligible for up to $90M in sales - based milestones and will receive royalties starting in mid single digits escalating up to 20%, based on annual net sales in China (including Hong Kong and Macau) Global Linaclotide Partnerships Designed to Enable Access Worldwide 21
Build an Innovative Pipeline
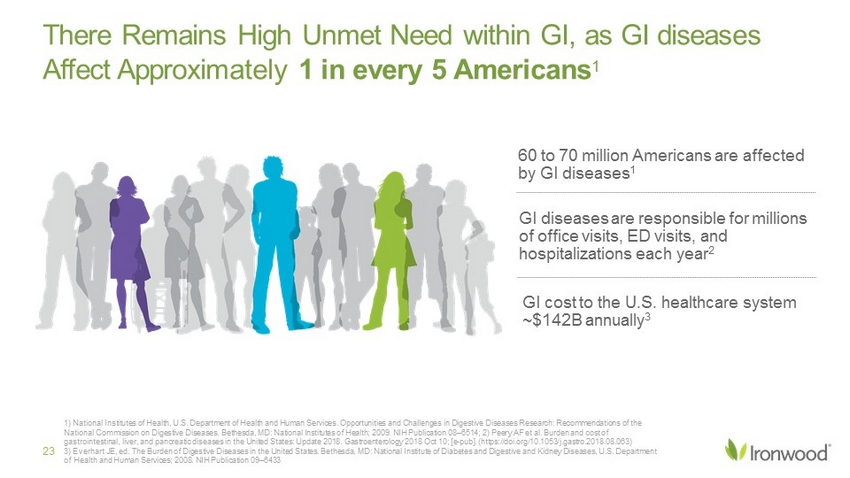
1) National Institutes of Health, U.S. Department of Health and Human Services. Opportunities and Challenges in Digestive Diseas es Research: Recommendations of the National Commission on Digestive Diseases. Bethesda, MD: National Institutes of Health; 2009. NIH Publication 08 – 6514 ; 2) Peery AF et al. Burden and cost of gastrointestinal, liver, and pancreatic diseases in the United States: Update 2018. Gastroenterology 2018 Oct 10; [e - pub]. (http s://doi.org/10.1053/j.gastro.2018.08.063) 3) Everhart JE, ed. The Burden of Digestive Diseases in the United States. Bethesda, MD: National Institute of Diabetes and D ige stive and Kidney Diseases, U.S. Department of Health and Human Services; 2008. NIH Publication 09 – 6433 There Remains High Unmet Need within GI, as GI diseases Affect Approximately 1 in every 5 Americans 1 23 GI cost to the U.S. healthcare system ~$142B annually 3 GI diseases are responsible for millions of office visits, ED visits, and hospitalizations each year 2 60 to 70 million Americans are affected by GI diseases 1

We Have Identified >100 GI Assets in >25 Prioritized Disease Areas, Including: 24 Prioritizing Serious, Organic GI Diseases Abdominal Pain Pruritis Celiac Disease Liver Injury / Failure Pancreatitis Esophageal / Allergic Mucositis / Gut Inflammation Rare GI Diseases Note: Organic GI diseases have measurable physiological changes; F unctional GI diseases can cause symptoms but are not associated with any identifiable or measurable changes.

Prioritize diseases that are primarily managed by gastroenterologists Focus on organic GI diseases , where mechanisms are well understood Target innovation, via first - in - class or differentiated opportunities Explore innovative, earlier - stage clinical assets and late - stage / commercial assets Maintain our ability to deliver profits and generate cash In assessing any new potential asset, we seek to: 25 Guided by Clear Principles Focused on Delivering Patient Benefit and Shareholder Value 1 2 3 4 5
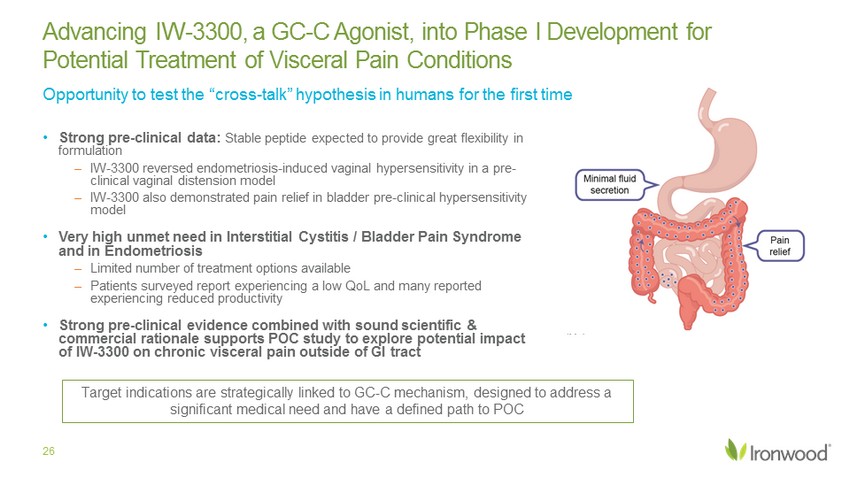
• Strong pre - clinical data: Stable peptide expected to provide great flexibility in formulation – IW - 3300 reversed endometriosis - induced vaginal hypersensitivity in a pre - clinical vaginal distension model – IW - 3300 also demonstrated pain relief in bladder pre - clinical hypersensitivity model • Very high unmet need in Interstitial Cystitis / Bladder Pain Syndrome and in Endometriosis – Limited number of treatment options available – Patients surveyed report experiencing a low QoL and many reported experiencing reduced productivity • Strong pre - clinical evidence combined with sound scientific & commercial rationale supports POC study to explore potential impact of IW - 3300 on chronic visceral pain outside of GI tract Advancing IW - 3300, a GC - C Agonist, into Phase I Development for Potential Treatment of Visceral Pain Conditions 26 Target indication is strategically linked to GC - C mechanism designed to address a significant medical need and has a defined path to POC Opportunity to test the “cross - talk” hypothesis in humans for the first time

KEY Sham (“normal response) Baseline (ENDO pre - treat.) Vehicle IW - 3300, 1 µg/kg IW - 3300, 3 µg/kg IW - 3300, 10 µg/kg S h a m B L E N D O B L V e h i c l e - D a y 1 - 1 h 3 3 0 0 a t 1 u g / k g - D a y 1 - 1 h 3 3 0 0 a t 3 u g / k g - D a y 1 - 1 h 3 3 0 0 a t 1 0 u g / k g - D a y 1 - 1 h V e h i c l e - D a y 5 - 1 h 3 3 0 0 a t 1 u g / k g - D a y 5 - 1 h 3 3 0 0 a t 3 u g / k g - D a y 5 - 1 h 3 3 0 0 a t 1 0 u g / k g - D a y 5 - 1 h V e h i c l e - D a y 1 3 - 1 h 3 3 0 0 a t 1 u g / k g - D a y 1 3 - 1 h 3 3 0 0 a t 3 u g / k g - D a y 1 3 - 1 h 3 3 0 0 a t 1 0 u g / k g - D a y 1 3 - 1 h 0 5 10 15 v o n F r e y V a g i n a l W i t h d r a w a l T h r e s h o l d ( g ) Sham Endo V 1 3 10 IW - 3300 (µg/kg/day) V 1 3 10 IW - 3300 (µg/kg/day) V 1 3 10 IW - 3300 (µg/kg/day) Distention Pressure (mmHg) Day 1 Day 5 Day 13 Mean ± SEM; N = 8 per group Endometriosis model: Vaginal balloon distension 27 In Pre - clinical Model, IW - 3300 Reversed Endometriosis - induced Vaginal Hypersensitivity Key

IW 3300 Demonstrates Pain Relief In Pre - Clinical Model of Bladder Hypersensitivity 0 1 2 3 4 5 6 7 0.16 0.4 1 2 4 8 15 Sham+vehicle (n=2) Sham+IW3300 (n=3) 40Gy+vehicle (n=4) 40Gy+IW3300 (n=5) IW - 3300 (3 µg/kg/day) reversed radiation - induced chronic bladder hypersensitivity, consistently reducing the number of withdrawal responses with increased forces Calibrated Forces (g) *p<0.05, **p<0.01, ***p<0.001 vs. Sham + Vehicle; RM 2 - Way ANOVA with Bonferroni post - hoc test # p<0.05, ## p<0.01, ### p<0.001 vs. 48 Gy + Vehicle; RM 2 - Way ANOVA with Bonferroni post - hoc test Study Method • Male rats were treated with 8 fractionated radiation doses of 6 Gy (48 Gy total) to create hypersensitivity of the bladder • IW - 3300 (3 ug/kg/day) or vehicle were administered intra - colonically once daily on days 56 - 72 after radiation • Bladder sensitivity was assessed on Days 42,56, 72 via application of von Frey filaments applied to the suprapubic area • The frequency of withdrawal responses to individual von Frey filaments with increasing calibrated forces of 0.16, 0.4, 1, 2, 4, 8, and 15 g was recorded. Hypersensitive rat Average number of withdrawal responses *** ** * * * * * ### ## # # 28
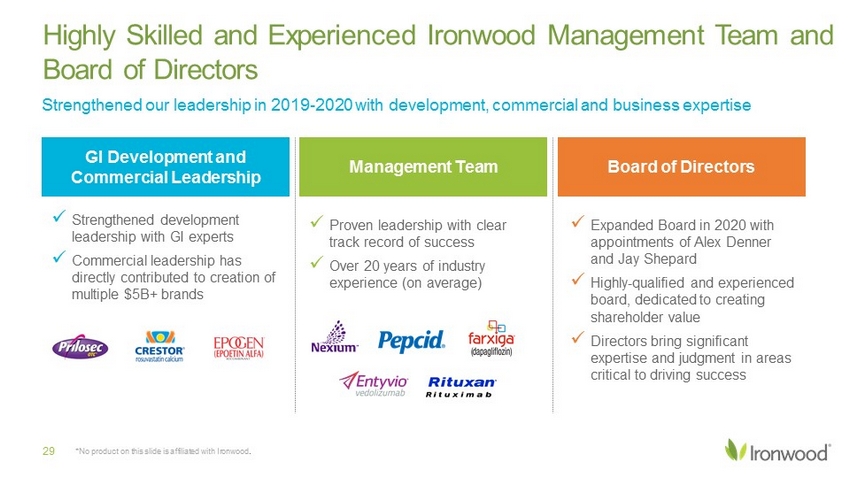
Strengthened our leadership in 2019 - 2020 with development, commercial and business expertise GI Development and Commercial Leadership Board of Directors Management Team x Strengthened development leadership with GI experts x Commercial leadership has directly contributed to creation of multiple $5B+ brands x Proven leadership with clear track record of success x Over 20 years of industry experience (on average) x Expanded Board in 2020 with appointments of Alex Denner and Jay Shepard x Highly - qualified and experienced board, dedicated to creating shareholder value x Directors bring significant expertise and judgment in areas critical to driving success 29 Highly Skilled and Experienced Ironwood Management Team and Board of Directors *No product on this slide is affiliated with Ironwood .

GI SCIENCE & CLINICAL DEVELOPMENT Deep understanding of GI diseases; >10 pivotal linaclotide studies REGULATORY STRATEGY Led development of new GI patient reported outcome (PRO) measures PARTNERING CAPABILITIES Multiple global GI partnerships and collaborations SALES EXCELLENCE Highly experienced, award - winning GI Specialty Sales Force Leading GI Capabilities and Expertise 30 ADVOCACY & EDUCATION Long - standing relationships with key experts to advance GI care PATIENT ACTIVATION Market leading, integrated channel approach that also supports access via telehealth Successful GI Partnerships: Nexium ® , Cologuard ® , Givlaari ®
Deliver Sustained Profits and Generate Cash Flow
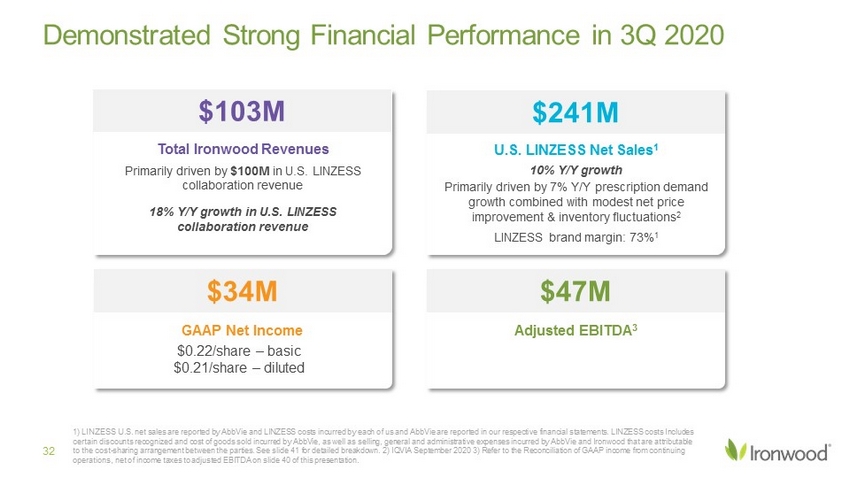
Demonstrated Strong Financial Performance in 3Q 2020 $34M GAAP Net Income $0.22/share – basic $0.21/share – diluted $47M Adjusted EBITDA 3 $103M Total Ironwood Revenues Primarily driven by $100M in U.S. LINZESS collaboration revenue 18% Y/Y growth in U.S. LINZESS collaboration revenue $241M U.S. LINZESS Net Sales 1 10% Y/Y growth Primarily driven by 7% Y/Y prescription demand growth combined with modest net price improvement & inventory fluctuations 2 LINZESS brand margin: 73% 1 1) LINZESS U.S. net sales are reported by AbbVie and LINZESS costs incurred by each of us and AbbVie are reported in our resp ect ive financial statements. LINZESS costs Includes certain discounts recognized and cost of goods sold incurred by AbbVie, as well as selling, general and administrative expens es incurred by AbbVie and Ironwood that are attributable to the cost - sharing arrangement between the parties. See slide 41 for detailed breakdown. 2) IQVIA September 2020 3) Refer to th e Reconciliation of GAAP income from continuing operations, net of income taxes to adjusted EBITDA on slide 40 of this presentation. 32

Strong Execution and Disciplined Investments Puts Ironwood in Strong Financial Position Total revenues and cash continued to grow in 2020 behind LINZESS strength and disciplined capital allocation 33 $177 $231 $253 $308 ~ $350 3 $0 $50 $100 $150 $200 $250 $300 $350 $400 4Q19 1Q20 2Q20 3Q20 4Q20 (millions) Cash and Cash Equivalents $80 $90 $103 $112 2 $0 $20 $40 $60 $80 $100 $120 1Q20 2Q20 3Q20 4Q20 (millions) Total Ironwood Revenue 1 1) Ironwood revenues are generated primarily through its collaborative arrangements and license agreements related to linaclo tid e, as well as co - promotion arrangements in the U.S. 2) 4Q 2020 Total Revenue amount assumes Ironwood ends 2020 with Total Revenue at the high - end of $370 - $385 million revenue guidance 3) 4Q 2020 Cash and Cash Equivalents is unaudited, preliminary and based on estimates and may change as we receive final 2020 data and complete the preparation of our 2020 financial statements.

($203) $11 $63 ($250) ($200) ($150) ($100) ($50) $0 $50 $100 2018 2019 2020 ($ in millions) GAAP Net Income from Continuing Operations, 1Q – 3Q, 2018, 2019 and 2020 1) Refer to the 3Q 2020 Reconciliation of GAAP results to non - GAAP financial measures table on slide 39 of this presentation Cyclerion Separation (4/1/19) 34 3Q 2020 Was 6 th Consecutive Quarter of Profitability 1

1) 2020 cash and cash equivalents is unaudited, preliminary and based on estimates and may change as we receive final 2020 da ta and complete the preparation of our 2020 financial statements. 2) Due dates of aggregate principal amounts of convertible senior notes outstanding as of 9/30/20 $121 $200 $200 $0 $100 $200 $300 $400 2021 2022 2023 2024 2025 2026 Principal in $ Ms Debt Maturity Profile 2 2.25% Convertible Notes Conv price: $14.51 Call spread strike: $18.82 0.75% Convertible Notes Conv price: $13.39 Capped call price: $17.05 1.50% Convertible Notes Conv price: $13.39 Capped call price: $17.05 Maintaining a Strong Capital Structure 35 Expect to end 2020 with ~$350 million in cash and cash equivalents 1

1) Adjusted EBITDA is calculated by subtracting net interest expense, taxes, depreciation, amortization, mark - to - market adjustme nts on derivatives related to Ironwood’s 2022 Convertible Notes, and restructuring expenses from GAAP income from continuing operations, net of income taxes. Ironwood does not provide guidance on GAAP income from continuing operations, net of income taxes or a reconciliation of expected adjusted EBITDA to expected GAAP income from continui ng operations, net of income taxes because, without unreasonable efforts, it is unable to predict with reasonable certainty the non - GAAP adjustments used to calculate adjusted EBIT DA including, without limitation, the mark - to - market adjustments on the derivatives related to its 2022 Convertible Notes. These adjustments are uncertain, depend on various factors and could have a material impact on GAAP income from continuing operations, net of income taxes for the guidance period. Original 2020 Guidance (Feb 2020) Previous 2020 Guidance (Nov 2020) Revised 2020 Guidance LINZESS U.S. net sales growth Mid - single digit % increase High - single digit % increase ~10% growth (~$930 million) Total Ironwood revenue $360 – 380 million $370 – 385 million High end of $370 - $385 million Adjusted EBITDA 1 >$105 million >$130 million ~$150 million Ironwood now expects: Increasing Full Year 2020 Financial Guidance 36
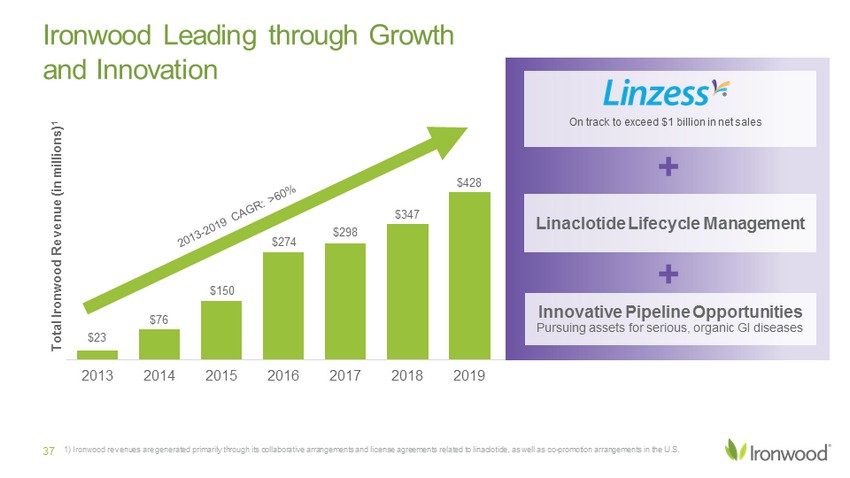
$23 $76 $150 $274 $298 $347 $428 2013 2014 2015 2016 2017 2018 2019 Total Ironwood Revenue (in millions) 1 1) Ironwood revenues are generated primarily through its collaborative arrangements and license agreements related to linaclo tid e, as well as co - promotion arrangements in the U.S. 37 Ironwood is Leading through Growth and Innovation On track to exceed $1 billion in net sales Innovative Pipeline Opportunities Pursuing assets for serious, organic GI diseases Linaclotide Lifecycle Management + +

Appendix 38

3Q 2020 Financial Summary Three Months Ended September 30, 2020 Nine Months Ended September 30, 2020 (000s, except per share amounts) (000s, except per share amounts) GAAP net income $ 34,423 $ 62,972 Adjustments: Mark - to - market adjustments on the derivatives related to convertible notes , net 2,616 6,549 Restructuring expenses 1,232 1,232 Non - GAAP net income $ 38,271 $ 70,753 GAAP net income per share – basic $ 0.22 $ 0.40 Adjustments to GAAP net income (detailed above) 0.02 0.05 Non - GAAP net income per share – basic $ 0.24 $ 0.45 GAAP net income per share – diluted $ 0.21 $ 0.39 Adjustments to GAAP net income (detailed above) 0.02 0.05 Non - GAAP net income per share – diluted $ 0.23 $ 0.44 1) The company presents non - GAAP net income and non - GAAP net income per share to exclude the impact of net gains and losses on t he derivatives related to our 2022 convertible notes that are required to be marked - to - market and restructuring expenses. Investors should consider these non - GAAP measures onl y as a supplement to, not as a substitute for or as superior to, measures of financial performance prepared in accordance with GAAP. In addition, these non - GAAP financial measur es are unlikely to be comparable with non - GAAP information provided by other companies. For a reconciliation of the company’s non - GAAP financial measures to the most comparabl e GAAP measures, please refer to the table above. Additional information regarding the non - GAAP financial measures is included in the company’s press release dated Novembe r 5, 2020. Reconciliation of GAAP results to non - GAAP financial measures 1 39

3Q 2020 Financial Summary Three Months Ended September 30, 2020 Nine Months Ended September 30, 2020 (000s) (000s) GAAP income from continuing operations, net of income taxes 1 $ 34,423 $ 62,972 Adjustments: Mark - to - market adjustments on the derivatives related to convertible notes , net 2,616 6,549 Restructuring expenses 1,232 1,232 Interest expense 7,419 21,957 Interest and investment income (231) (1,284) Income tax expense 1,389 1,389 Depreciation and amortization 589 1,911 Adjusted EBITDA $ 47,437 $ 94,726 1) Ironwood presents GAAP income from continuing operations, net of income taxes and adjusted EBITDA, a non - GAAP measure. Adjust ed EBITDA is calculated by subtracting net interest expense, taxes, depreciation, mark - to - market adjustments on derivatives related to Ironwood’s 2022 Convertible Notes an d restructuring expenses, from GAAP net income (from continuing operations, net of income taxes. Investors should consider these non - GAAP measures only as a supplement to, not as a substitute for or as superior to, measures of financial performance prepared in accordance with GAAP. In addition, these non - GAAP financial measures are unlikely to be compar able with non - GAAP information provided by other companies. For a reconciliation of the company’s non - GAAP financial measures to the most comparable GAAP measures, please refer to the table above. Additional information regarding the non - GAAP financial measures is included in the company’s press release dated November 5, 2020 Reconciliation of GAAP income from continuing operations, net of income taxes to adjusted EBITDA 40

3Q 2020 Financial Summary LINZESS U.S. Brand Collaboration Three Months Ended September 30, 2020 Nine Months Ended September 30, 2020 (000s) (000s) LINZESS U.S. net product sales $ 241,124 $ 652,891 AbbVie & Ironwood commercial costs, expenses and other discounts 2 52,939 162,833 AbbVie & Ironwood R&D expenses 5 11,207 39,406 Total net profit on sales of LINZESS 6 $ 176,978 $ 450,652 Commercial Profit & Collaboration Revenue 1 Ironwood & AbbVie Total Net Profit 1) The purpose of the Commercial Profit and Collaboration Revenue table is to present the calculation of Ironwood’s share of net profits generated from sales of LINZESS in the U.S. and Ironwood’s collaboration revenue / expense; 2) Includes certain discounts recognized and cost of goods sold incurred by AbbVie, as well as selling, general and administrati ve expenses incurred by AbbVie and Ironwood that are attributable to the cost - sharing arrangement between the parties. 3) Includes Ironwood’s selling, general and administrative expenses attributable to the cost - sharing arrangement with A bbVie. 4) In connection with its acquisition of Allergan, AbbVie recast LINZESS U.S. net sales (previously reported by Allergan) for periods beginning on January 1, 2019 to conform with its revenue recognition accounting policies an d r eporting conventions for certain rebates and discounts. This recast did not result in any change to Ironwood’s historically reported collaborative arrangements revenue or collaborative arrangements revenue policy. Ironwood continues to re cord collaborative arrangements revenue based on actual settlement payments received from AbbVie. 5) R&D expenses related to LINZESS in the U.S. are shared equally between Ironwood and AbbVie under the collaboration agreement. 6) Iro nwood has recalculated its share of net profit on sales of LINZESS in the U.S. to conform with AbbVie’s recast of historically reported LINZESS U.S. net sales (previously reported by Allergan). Three Months Ended September 30, 2020 Nine Months Ended September 30, 2020 (000s) (000s) LINZESS U.S. net product sales $ 241,124 $ 652,891 AbbVie & Ironwood commercial costs, expenses and other discounts 2 52,939 162,833 Commercial profit on sales of LINZESS $ 188,185 $ 490,058 Commercial Margin 78% 75% Ironwood’s share of net profit 94,092 245,029 Reimbursement for Ironwood’s selling, general, and administrative expenses 3 6,140 18,750 Adjustments to reconcile Ironwood’s previously reported share of net profit in conformance with AbbVie’s revenue recognition accounting policies and reporting conventions 4 Ironwood’s collaboration revenue - $ 100,232 (5,902) $ 257,877 41

LINZESS Net Sales Historical Reconciliation (all amounts below in $000s) Three Months Ended March 31, 2019 Three Months Ended June 30, 2019 Three Months Ended September 30, 2019 Three Months Ended December 31, 2019 Year Ended December 31, 2019 Three Months Ended March 31, 2020 Net Sales as previously reported by Allergan $161.3 $196.0 $214.7 $231.2 $803.2 $172.2 Adjustment to LINZESS net sales between quarters for certain rebates and discounts $7.6 $1.5 ($5.3) ($3.8) - $11.8 Certain discounts reclassified from LINZESS net sales to LINZESS U.S. commercial costs, expenses and other discounts within Ironwood’s calculation of collaborative arrangements revenue $8.5 $10.2 $10.6 $12.3 $41.6 $8.9 Net Sales as recast by AbbVie $177.4 $207.7 $220.0 $239.7 $844.8 $192.8 1) In connection with its acquisition of Allergan, AbbVie recast LINZESS net sales previously reported by Allergan for period s b eginning January 1, 2019 to conform with AbbVie’s revenue recognition accounting policies and reporting conventions for certain rebates and discounts. This recast did not result in an y c hange to Ironwood’s historically reported collaborative arrangements revenue, or collaborative arrangements revenue policy. Ironwood continues to record collaborative arrangements revenue based on actual settlement payments received from AbbVie. Reconciliation of previously reported LINZESS net sales by AbbVie to recast LINZESS net sales in connection with its acquisition of Allergan 1 42