Attached files
Table of Contents
As filed with the Securities and Exchange Commission on January 8, 2021.
Registration No. 333-
UNITED STATES
SECURITIES AND EXCHANGE COMMISSION
Washington, D.C. 20549
FORM S-1
REGISTRATION STATEMENT
UNDER
THE SECURITIES ACT OF 1933
INTERIOR LOGIC GROUP HOLDINGS, LLC
to be converted as described herein to a corporation named
Interior Logic Group Holdings, Inc.
(Exact name of registrant as specified in its charter)
| Delaware | 1520 | 82-5478232 | ||
| (State or other jurisdiction of incorporation or organization |
(Primary Standard Industrial Classification Code Number) |
(I.R.S. Employer Identification Number) |
10 Bunsen
Irvine, California 92618
(800) 959-8333
(Address, including zip code, and telephone number, including area code, of registrant’s principal executive offices)
Alan K. Davenport
Chief Executive Officer and Chairman
Interior Logic Group Holdings, LLC
10 Bunsen
Irvine, California 92618
(800) 959-8333
(Name, address, including zip code, and telephone number, including area code, of agent for service)
Copies to
| Robin M. Feiner, Esq. Holland & Knight LLP 31 W. 52nd St. 12th floor New York, New York, 10019 (212) 513-3200 |
Richard Strulson, Esq. Executive Vice President, General Counsel and Chief Compliance Officer Interior Logic Group Holdings, LLC 10 Bunsen Irvine, California 92618 (800) 959-8333 |
Michael J. Zeidel, Esq. Skadden, Arps, Slate, Meagher & Flom LLP One Manhattan West New York New York 10001 (212) 735-3000 |
Approximate date of commencement of proposed sale to the public: As soon as practicable after the effective date of this Registration Statement.
If any of the securities being registered on this Form are to be offered on a delayed or continuous basis pursuant to Rule 415 under the Securities Act, check the following box. ☐
If this Form is filed to register additional securities for an offering pursuant to Rule 462(b) under the Securities Act, check the following box and list the Securities Act registration statement number of the earlier effective registration statement for the same offering. ☐
If this Form is a post-effective amendment filed pursuant to Rule 462(c) under the Securities Act, check the following box and list the Securities Act registration statement number of the earlier effective registration statement for the same offering. ☐
If this Form is a post-effective amendment filed pursuant to Rule 462(d) under the Securities Act, check the following box and list the Securities Act registration statement number of the earlier effective registration statement for the same offering. ☐
Indicate by check mark whether the registrant is a large accelerated filer, an accelerated filer, a non-accelerated filer, a smaller reporting company or an emerging growth company. See the definitions of “large accelerated filer,” “accelerated filer”, “smaller reporting company” and “emerging growth company” in Rule 12b-2 of the Exchange Act.
| Large accelerated filer | ☐ | Accelerated filer | ☐ | |||
| Non-accelerated filer | ☒ | Smaller reporting company | ☐ | |||
| Emerging growth company | ☐ |
If an emerging growth company, indicate by check mark if the registrant has elected not to use the extended transition period for complying with any new or revised financial accounting standards provided pursuant to Section 7(a)(2)(B) of the Securities Act. ☐
CALCULATION OF REGISTRATION FEE
|
| ||||
| Title of Each Class of Securities to be Registered |
Proposed Maximum Offering Price(1)(2) |
Amount of Registration Fee | ||
| Common stock, $0.01 par value per share |
$100,000,000 | $10,910 | ||
|
| ||||
|
| ||||
| (1) | Estimated solely for purposes of determining the registration fee in accordance with Rule 457(o) under the Securities Act of 1933, as amended. |
| (2) | Includes the aggregate offering price of shares of common stock that may be purchased by the underwriters pursuant to their option to purchase additional shares of common stock. |
The Registrant hereby amends this Registration Statement on such date or dates as may be necessary to delay its effective date until the Registrant shall file a further amendment which specifically states that this Registration Statement shall thereafter become effective in accordance with Section 8(a) of the Securities Act of 1933, as amended, or until this Registration Statement shall become effective on such date as the Securities and Exchange Commission, acting pursuant to said Section 8(a), may determine.
Table of Contents
EXPLANATORY NOTE
Interior Logic Group Holdings, LLC, the registrant whose name appears on the cover of this Registration Statement, is a Delaware limited liability company. Prior to the effectiveness of this Registration Statement, Interior Logic Group Holdings, LLC will convert into a Delaware corporation and be renamed Interior Logic Group Holdings, Inc. (the “Corporate Conversion”). Shares of common stock of Interior Logic Group Holdings, Inc. are being offered by the prospectus. Except as otherwise disclosed in the prospectus, the consolidated financial statements and selected historical financial data and other financial information included in this Registration Statement are those of Interior Logic Group Holdings, LLC and its respective subsidiaries, as the case may be, and do not give effect to the Corporate Conversion.
Table of Contents
The information contained in this preliminary prospectus is not complete and may be changed. We may not sell these securities until the registration statement filed with the Securities and Exchange Commission is effective. This preliminary prospectus is not an offer to sell these securities and we are not soliciting offers to buy these securities in any jurisdiction where the offer or sale is not permitted.
| PRELIMINARY PROSPECTUS |
SUBJECT TO COMPLETION, DATED JANUARY 8, 2021 |
Shares

Interior Logic Group Holdings, Inc.
Common Stock
This is the initial public offering of our common stock. We are offering shares of our common stock.
No public market currently exists for our common stock. We have applied to list our common stock on the Nasdaq Global Select Market under the symbol “ILG.”
We currently expect the initial public offering price to be between $ and $ per share.
Investing in our common stock involves a high degree of risk. See “Risk Factors” beginning on page 23 of this prospectus.
| Per Share | Total | |||||||
| Public offering price |
$ | $ | ||||||
| Underwriting discounts and commissions(1) |
$ | $ | ||||||
| Proceeds, before expenses, to us |
$ | $ | ||||||
| (1) | See “Underwriting” for a complete description of the compensation payable to the underwriters. |
The underwriters may also purchase up to an additional shares of our common stock from us at the public offering price, less underwriting discounts and commissions, within 30 days from the date of this prospectus. If the underwriters exercise this option in full, the total underwriting discounts will be $ , and the total proceeds, after underwriting discounts but before expenses, to us will be $ .
Neither the Securities and Exchange Commission nor any state securities commission or other regulatory body has approved or disapproved of these securities or determined if this prospectus is truthful or complete. Any representation to the contrary is a criminal offense.
The underwriters expect to deliver the shares to purchasers on or about , 2021.
| Citigroup | Goldman Sachs & Co. LLC | BofA Securities |
| Baird | Evercore ISI | Jefferies | RBC Capital Markets | Stephens Inc. | Truist Securities | UBS Investment Bank |
Table of Contents
You should rely only on the information contained in this prospectus and any free writing prospectus we may authorize to be delivered to you. We have not, and the underwriters have not, authorized anyone to provide you with information different from, or in addition to, that contained in this prospectus and any related free writing prospectus. We and the underwriters take no responsibility for, and can provide no assurances as to the reliability of, any information that others may give you. This prospectus is an offer to sell only the shares offered hereby, but only under circumstances and in jurisdictions where it is lawful to do so. The information contained in this prospectus is only accurate as of the date of this prospectus, regardless of the time of delivery of this prospectus and any sale of shares of our common stock.
| 1 | ||||
| 23 | ||||
| 56 | ||||
| 58 | ||||
| 59 | ||||
| 60 | ||||
| 62 | ||||
| 64 | ||||
| MANAGEMENT’S DISCUSSION AND ANALYSIS OF FINANCIAL CONDITION AND RESULTS OF OPERATIONS |
66 | |||
| 90 | ||||
| 109 | ||||
| 117 | ||||
| 132 | ||||
| 135 | ||||
| 137 | ||||
| 142 | ||||
| 144 | ||||
| 148 | ||||
| 155 | ||||
| 155 | ||||
| 155 | ||||
| F-1 |
Presentation of Market and Industry Data and Certain Definitions
We use market data and industry forecasts and projections throughout this prospectus, particularly in the sections entitled “Prospectus Summary,” “Management’s Discussion and Analysis of Financial Condition and Results of Operations” and “Our Business.” The industry and market data are based on the good faith estimates of our management, research studies and surveys, independent industry publications and other publicly available information. Industry publications and research studies and surveys generally state that they have been obtained from sources believed to be reliable, although they do not guarantee the accuracy or completeness of such information. These data involve a number of assumptions and limitations, and investors are cautioned not to give undue weight to such estimates. Although we have not independently verified the accuracy or completeness of any third-party information, we believe that the information from these publications and studies included in this prospectus is generally reliable, and the conclusions contained in the third-party information are reasonable. In addition, projections, assumptions and estimates of our future performance and the future performance of the industry in which we operate are necessarily subject to a high degree of uncertainty and risk due to a variety of
i
Table of Contents
factors, including those described in the section entitled “Risk Factors” and elsewhere in this prospectus. In particular, some of the market and industry estimates in this prospectus were prepared prior to the COVID-19 pandemic. These and other factors could cause results to differ materially from those expressed in the estimates made by independent parties and by us. We expect that the COVID-19 pandemic may continue to materially reduce the growth of various of the markets discussed in this prospectus, and we cannot predict the extent to which these estimates will be affected. These and other factors could cause results to differ materially from those expressed in, or implied by, the estimates made by independent parties and by us. Furthermore, we cannot assure you that a third party using different methods to assemble, analyze or compute industry and market data would obtain the same results. See “Information Regarding Forward-Looking Statements.”
In this prospectus, we present a variety of housing market indicators, including housing starts and home closings.
| • | A housing start is counted at the point in time excavation begins for the footings or foundation of a home. |
| • | A home closing is counted when the new homeowner takes title to the home. |
Housing starts are considered a leading indicator of the state of the housing market. Rankings of MSAs (as defined below) by 2019 single-family housing starts are based on estimated 2019 single-family housing starts per MSA published in Metrostudy’s September 2020 Builder Home Building Outlook.
References to a housing market mean a Metropolitan Statistical Area (“MSA”), which is an area that generally consists of at least one urbanized area of 50,000 or more inhabitants, plus adjacent territory that has a high degree of social and economic integration with the core area as measured by commuting ties. MSA boundaries are based on U.S. Census Bureau determinations as of March 2020. References to our “geographic markets” mean the MSAs we serve. References to our “turnkey” supply chain management and installation services mean the provision of both materials and workforce sold together.
References to the largest homebuilders are based on Builder Magazine’s 2020 Builder 100 list, which ranks U.S. homebuilders based on total number of home closings.
We calculate the size of the approximately $23 billion U.S. new home interior finish solutions industry by multiplying the average installed cost of flooring, cabinets and countertops in a new single-family home in 2019, which was approximately $25,500 according to the National Association of Homebuilders (the “NAHB”), by the number of 2019 single-family housing starts (approximately 887,700 based on U.S. Census Bureau data).
In this prospectus, we define a “direct” competitor as a company whose primary business is the provision of residential design services and the supply and installation of multiple categories of interior finishes.
In this prospectus, we refer to our “design studio solutions” and “builder direct solutions.” We define our design studio solutions as our full suite of design, supply chain management and installation services, including our dedicated builder-branded and shared ILG-branded design studios where we interface directly with homebuyers in the design process. We define our builder direct solutions as our supply chain management and installation services for homebuilders. Some of our customers start as builder direct customers and then convert to our design studio solutions.
Service Marks, Trademarks and Trade Names
This prospectus includes trademarks and service marks owned by us and our subsidiaries, as well as trademarks, trade names and service marks of other companies, which are the property of their respective owners. Solely for convenience, trademarks, trade names and service marks referred to in this prospectus may appear without the ®, TM or SM symbols, but such references are not intended to indicate, in any way, that we will not assert, to the fullest extent under applicable law, our rights or the right of the applicable licensor to these
ii
Table of Contents
trademarks, trade names and service marks. We do not intend our use or display of other parties’ trademarks, trade names or service marks to imply, and such use or display should not be construed to imply, a relationship with, or endorsement or sponsorship of us by, these other parties.
The Business Combination
On May 31, 2018, we consummated a business combination transaction (the “Business Combination”) where Interior Specialists, Inc. (“ISI”) acquired Interior Logic Group, Inc. (“ILG”) and combined under a new holding company, Interior Logic Group Holdings, LLC (“ILG Holdings”), pursuant to a Contribution Agreement (the “Contribution Agreement”) dated April 30, 2018, by and among Faraday Holdings, LLC (“Faraday”), Installation Services Holdings, LLC (“ISH”), ISI, Installation Services Holdings, Inc., (the parent company of ILG), and ILG Holdings.
We refer to the business of ISI prior to the Business Combination as “legacy ISI” and the business of ILG prior to the Business Combination as “legacy ILG.” Unless otherwise indicated, or the context otherwise requires, references to “we,” “us,” “our,” or the “Company” refer to (i) with respect to periods prior to the Business Combination, legacy ISI, (ii) with respect to periods beginning with the completion of the Business Combination and ending immediately before the completion of our Corporate Conversion (as defined below), Interior Logic Group Holdings, LLC and its subsidiaries, and (iii) with respect to periods beginning with the completion of our Corporate Conversion and thereafter, Interior Logic Group Holdings, Inc. and its consolidated subsidiaries. In accordance with Rule 3-05 of Regulation S-X, separate financial statements are not required for any of our acquisitions individually or in the aggregate.
Prior to the Business Combination, for the fiscal year ended December 31, 2017, legacy ILG had revenues of $566 million and nearly 1,600 employees, while legacy ISI had revenues of $852 million and nearly 2,600 employees. At the time of the Business Combination, legacy ILG was legacy ISI’s largest direct competitor.
Basis of Presentation
Our consolidated financial statements accompanying this prospectus have been prepared in accordance with accounting principles generally accepted in the United States of America, or GAAP, and include the accounts of the Company and its wholly-owned subsidiaries. All significant intercompany transactions have been eliminated in consolidation. Our consolidated financial statements are based on a fiscal year ending December 31.
Additional information regarding our financial performance and non-GAAP measures, including reconciliations of non-GAAP measures to their most directly comparable GAAP measure, is included in “Non- GAAP Financial Measures” and in “Summary Historical Financial Data.” In addition, such financial information should be read in conjunction with the disclosures set forth under “Management’s Discussion and Analysis of Financial Condition and Results of Operations” and the consolidated financial statements and related notes appearing elsewhere in this prospectus.
Non-GAAP Measures
In addition to the results reported in accordance with GAAP, we have provided information in this prospectus relating to Adjusted EBITDA and Adjusted EBITDA margin.
We define EBITDA as earnings before interest, income taxes, depreciation and amortization. We define “Adjusted EBITDA” as EBITDA, adjusted for acquisition and integration costs, share-based compensation, management fees, pre-opening costs, refinancing costs and expenses associated with the submission of our prior draft registration statement to the SEC, which was discontinued. To calculate Adjusted EBITDA for the nine-month period ended September 30, 2020, we further adjusted EBITDA for direct COVID-19-related costs, which represent charges for severance costs, remote connectivity and health and safety modifications within our facilities, all of which are clearly and directly related to COVID-19 and are incremental and separable from
iii
Table of Contents
normal operations. To calculate Adjusted EBITDA for 2018, we further adjusted EBITDA for an impairment charge resulting from our rebranding in connection with our Business Combination. Adjusted EBITDA measures performance by adjusting EBITDA for certain income or expense items that are not considered part of our core operations.
Adjusted EBITDA margin takes Adjusted EBITDA and divides it by revenues. We believe that the presentation of these measures provides useful information to investors regarding our results of operations because it assists both investors and us in analyzing and benchmarking the performance and value of our business. We also believe these measures are useful to investors and us as measures of comparative operating performance from period to period, as they measure our changes in pricing decisions, cost controls and other factors that impact operating performance, and they remove the effect of our capital structure (primarily interest expense), asset base (primarily depreciation and amortization), items outside our control (primarily income taxes) and the volatility related to the timing and extent of other activities, such as asset impairments, and non-core income and expenses, such as acquisition and integration expenses. Accordingly, we believe that these measures are useful for comparing general operating performance from period to period. In addition, we use various Adjusted EBITDA- based measures in determining certain of our incentive compensation programs. Other companies may define Adjusted EBITDA and Adjusted EBITDA margin differently and, as a result, our measures may not be directly comparable to measures of other companies. In addition, Adjusted EBITDA may be defined differently for purposes of covenants contained in our Revolving Credit Facility or any future indebtedness.
Although we use these measures to assess the performance of our business, the uses of the measures are limited because they do not include certain material expenses, such as interest and taxes, necessary to operate our business. Adjusted EBITDA and Adjusted EBITDA margin should be considered in addition to, and not as substitutes for, net income (loss) in accordance with GAAP as a measure of performance. Our presentation of these measures should not be construed as an indication that our future results will be unaffected by unusual or non-recurring items.
These measures have limitations as analytical tools, and you should not consider them in isolation or as substitutes for analysis of our results as reported under GAAP. Because of these limitations, these measures are not intended as alternatives to net income (loss) as indicators of our operating performance, as alternatives to any other measure of performance in conformity with GAAP or as alternatives to cash flow provided by operating activities as measures of liquidity. You should therefore not place undue reliance on these measures or ratios calculated using those measures.
iv
Table of Contents
This prospectus summary highlights certain information appearing elsewhere in this prospectus. As this is a summary, it does not contain all of the information that you should consider in making an investment decision.
You should read the entire prospectus carefully, including the information under “Risk Factors,” “Management’s Discussion and Analysis of Financial Condition and Results of Operations” and our consolidated financial statements and the related notes thereto included elsewhere in this prospectus, before investing. This prospectus includes forward-looking statements that involve risks and uncertainties. See “Information Regarding Forward-Looking Statements.”
Our Vision
Our vision is to utilize our value-added technology platform combined with our national footprint and customer relationships to revolutionize the way homebuyers purchase and design their homes. By seamlessly connecting key constituents in the housing lifecycle, including homebuilders, homebuyers, suppliers and subcontractors, we believe we can unlock significant market opportunities.
Our Company
We are the leading national provider of technology-enabled sales and marketing, design and installation solutions for homebuilders. Our robust technology platform delivers interior design visualization, interior option selection, supply chain management and data analytics solutions from initial homebuyer engagement through the construction and delivery of homes. We are also the leading national installer for select high-value and aesthetically important interior finishes, such as flooring, cabinets and countertops, to our homebuilder customers, as well as multi-family, commercial and repair & remodel customers. Our scalable technology solutions enhance the homebuying experience, streamline the homebuying process and meaningfully drive homebuyer satisfaction, while improving homebuilders’ profitability, construction quality and cycle times. We serve a broad range of national, regional and local homebuilders across the home price spectrum, from entry-level to move-up and luxury homes, including each of the 20 largest U.S. homebuilders. We have the leading position in the estimated $23 billion U.S. new home interior finish solutions industry, and our technology solutions significantly expand our addressable market to other economic transactions associated with the housing lifecycle, including new construction pre-sales marketing, monetization of valuable consumer data and providing access to homebuyers for future design and renovation needs, amongst others. We generated 2019 revenues, net loss and Adjusted EBITDA of $1,785.4 million, $(15.8) million and $123.2 million, respectively.1
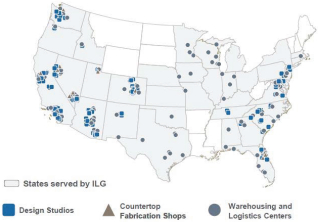
We have built the most expansive national footprint in our highly fragmented industry, which uniquely positions us to serve our national, regional and local homebuilding customers consistently and effectively across markets. Furthermore, we collect, analyze and report valuable data on over 100,000 new homes annually, creating the largest repository of homebuyer design preference data in our industry. Our national network is comprised of 110 design studios, 109 warehousing and logistics centers and nine countertop fabrication facilities, from which we serve approximately 285 Metropolitan Statistical Areas (“MSAs”), including 46 of the top 50 U.S. homebuilding markets based on 2019 single-family housing starts. We are more than three times the size of our next largest direct competitor, based on number of locations. With an estimated market share today of only 6% based on 2019 single-family residential revenues, we believe we have significant runway for growth.
Our design studios serve to manage a key part of the homebuying process where homebuyers design, select and upgrade the interior finishes of their new home. We operate 64 builder-branded design studios on behalf of
| 1 | For a definition of Adjusted EBITDA, as well a reconciliation to the most directly comparable GAAP measure, see “Non-GAAP Measures” and “—Summary Historical Financial Data.” |
1
Table of Contents
20 homebuilders across the country, as well as 46 ILG-branded design studios that provide the same profesionally-managed design experience for multiple homebuilders in a single location.
The following map illustrates our expansive national footprint.
We have an experienced team of approximately 4,200 employees, including approximately 300 design professionals and approximately 470 field managers, and utilize approximately 9,000 independent installation subcontractors. Additionally, our technology team includes approximately 140 software engineers, digital artists and technology specialists that facilitate the continual advancement of our industry-leading technology platform. In order to accelerate development of our technology solutions, we have added 40 new members to the technology team in 2020 alone and expect to continue to grow this group in 2021.
Our differentiated technology suite simplifies and enhances the home buying experience and has positioned us at the forefront of digitization in the homebuilding industry. Advancements in visualization technology and younger demographics reaching peak homebuying age have led to increasing demand for a more virtual homebuying and home design experience in recent years. Additionally, we believe the COVID-19 pandemic has been a catalyst for virtual engagement by homebuyers, resulting in a substantial increase in the use of our technology platform by our customers. We adapted our business model quickly to meet the increased demand for fully virtual offerings and we believe we will continue to benefit from our innovative business model. Many of our homebuilding customers are also reporting substantial increases in website traffic, virtual tours, and full virtual sales. Homebuyers are now spending, on average, four hours in our web-based design and option selection systems—a 24% increase in system usage in 2020 compared to 2019. Similarly, we have seen a notable increase in the percentage of our homebuyers who have completed their interior option selections via fully virtual appointments utilizing our technology platform in 2020 compared to 2019. Nearly 10% of all design sessions are now conducted virtually and the demand for online design appointments continues to increase. We believe we have the leading end-to-end technology platform that meets this demand and delivers a dynamic, digitally-enabled homebuying experience. Our engaging visualization technology allows homebuilders to offer photo-realistic virtual home tours as a marketing tool, eliminating the need to build costly model homes for every community, accelerating the pre-marketing window for each community and potentially shortening the overall sales cycle. Our cutting-edge option selection tools utilize visualization and real-time pricing technology to create a personalized, user-friendly design experience customized to the homebuyer’s community, floor plan and budget. Our streamlined integration with homebuilder back office systems creates valuable connectivity throughout the construction process, allowing us to improve construction quality, decrease cycle times and increase customer stickiness. In addition, our systems collect, analyze and report on vast quantities of valuable data, including homebuyer design preferences on over 100,000 new homes annually, which empowers
2
Table of Contents
homebuilders and suppliers with critical insight into evolving homebuyer preferences. Homebuilders use our proprietary analytics to tailor their product offerings and pricing by community to further drive incremental option sales and improve profitability. We have made significant technology investments to build our differentiated and scalable technology platform, which we believe will continue to further enhance our profitability and grow our revenue as we expand our footprint with existing and future customers and add new technology solutions.
We have grown considerably, more than doubling our business over the past three years, both organically and through acquisitions. Our organic growth has been driven by the addition of new design studios, new customer additions and increased penetration of existing customers, all of which is underpinned by our expanding technology offering. Technology-enabled solutions have further accelerated our organic growth, and adoption of these solutions by leading homebuilders has contributed to significant growth in our revenue generated by the top 10 U.S. homebuilders from 2015 to 2019. Our recent technology developments, including our photo-realistic visualization technology, have the potential to significantly accelerate the digitization of the homebuilding industry and drive further organic growth through increased adoption by new and existing homebuilders. In addition to our organic growth, we believe we are an acquirer of choice in our industry. We have completed over 18 acquisitions since 2013, which is more than any of our direct competitors, and we believe we have the opportunity to execute additional accretive acquisitions in our highly fragmented industry.
Historically, we have leveraged successful partnerships with homebuilders in specific markets to expand into additional geographies and product categories, which generally increases our profit margins by leveraging our infrastructure and personnel across a denser geographic footprint. We do not currently offer installation services for all three key product categories (i.e. flooring, cabinets and countertops) in all of our existing geographic markets. As such, we believe that expanding our service offering to capture incremental installation services offers significant growth opportunities. We also intend to drive margin expansion through purchasing efficiencies, economies of scale on both a local and national basis and the continued consolidation to a single integrated technology platform across our geographic markets.
3
Table of Contents
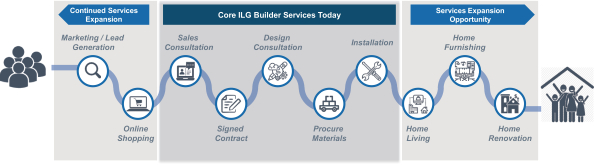
Our Value Proposition
The chart and graphic below summarize our value proposition and the technology-enabled solutions we deliver to the key constituents in the homebuilding value chain.
| Constituent |
ILG Value Proposition | |
| Homebuilders |
• Streamline marketing, sales generation, and design process • Improved homebuyer satisfaction levels • Maximize option profitability • Improve cycle times • Provide valuable data analytics and insights | |
| Homebuyers |
• Fully customize their home design and furnishings • Improve homebuyer satisfaction • Leverage fully remote visualization tools for options selection • Access to designers to facilitate decision making | |
| Designers |
• Collaborate on home design process • Ability to work with homebuyers in virtual setting • Real-time pricing capabilities • Data analytics inform design decisions | |
| Suppliers |
• Predictive analytics on homebuyer trends • Ability to showcase products in a physical or virtual design studio • Integrated systems facilitate efficiencies • Real-time pricing capabilities | |
| Installers |
• Provide consistent, predictable work • Increase productivity through technology | |

4
Table of Contents
Our comprehensive suite of solutions provides meaningful value to each of the following constituencies:
Homebuilders
We have long-standing customer relationships with national, regional and local homebuilders as a result of our proven ability to drive increased homebuilder profitability through our technology solutions. We provide customized, value-added design studio solutions, critical insight into homebuyer demand trends and superior service, from pre-sale marketing to homebuyer option selection to supply chain management and installation. Homebuilders benefit from our valuable design expertise and installation capabilities, allowing them to focus on their core competencies in land procurement and development, home sales and construction management. Our visualization technology offers builders the ability to provide photo-realistic virtual tours of multiple floorplans to prospective homebuyers without needing to visit a physical model home. Our option selection technology, real-time pricing engine, and skilled design professionals enhance the homebuyer experience and drive homebuilder profitability by increasing sales of options and upgrades, while our turnkey supply chain management and installation services drive construction quality and process efficiencies. On average, buyers who use our online systems spend 25% more on interior options and upgrades compared to buyers that do not. We also offer supply chain management and installation services to homebuilders through our builder direct solutions, where our customers benefit from our extensive supplier relationships, service excellence and multi-product capabilities. Our streamlined integration with homebuilder back office systems helps our customers and our teams improve construction quality, decrease cycle times and increase customer stickiness. We complement our integration capabilities with extensive data analytics to offer insight into evolving design trends and homebuyer preferences and assist homebuilders in optimizing their option offerings and making home design and community investment decisions. Our ability to deliver fully-integrated services enhances our ability to retain customers over time.
We serve each of the top 20 U.S. homebuilders based on 2019 home closings. The top 20 U.S. homebuilders accounted for approximately 30% of total home closings in 2019, up from approximately 17% in 2000, according to Builder Magazine Online. We believe this increase in market share is due to the largest homebuilders benefiting from the financial and operational efficiencies associated with combining a national platform and local market concentration in the nation’s most attractive housing markets.
Approximately 80% of our 2019 revenues were derived from sales to the new single-family residential market. The following graphic illustrates the critical link we represent in the interior finish value chain for homebuilders.
Homebuyers
Our direct and personal interactions with homebuyers enable us to meaningfully drive homebuyer satisfaction. Our design studio solutions streamline the often disjointed and overwhelming option selection
5
Table of Contents
process by creating a personalized and well-organized design experience. We offer tailored option selection tools, ranging from self-guided web portals for browsing interior finishes to one-on-one appointments with trained design professionals, which can take place in strategically laid out and conveniently-located showrooms or through virtual meetings. Homebuyers benefit from our design expertise and user-friendly visual selection tools that allow them to experience photo-realistic interior finish options and compare real-time pricing for options that are customized to their community and floor plan. Once option selections are made, our turnkey installation services facilitate timely and high-quality completion for the homebuyer.
Suppliers and Installers
We maintain strong relationships with our broad supplier base and we are the largest new single-family residential customer for many of our suppliers. Our supplier relationships typically are negotiated at the national level but coordinated at the regional level, driving both local efficiency and overall cost-effectiveness. We provided interior finishes for more than 100,000 new single-family homes in 2019, which is more than any U.S. homebuilder; the breadth of our direct homebuyer interactions enables us to provide suppliers with valuable insight into homebuyers’ evolving preferences. Suppliers value our ability to help them optimize product offerings to be leaders in the latest design trends. In addition, we believe independent installers are eager to work with us due to our extensive customer-base, consistent job volumes and rapid payments, which we believe is a competitive advantage in an increasingly competitive workforce market.
Multi-Family, Commercial and Repair & Remodel Customers
In addition to single-family homebuilders, we are a critical partner to a broad range of multi-family, commercial and repair & remodel customers, including new multi-family and light commercial contractors, multi-family owners and operators, senior living operators, home improvement retailers, single-family rental operators and single-family repair & remodel customers, where homeowners spend over $330 billion annually to repair and renovate their homes according to the Joint Center for Housing Studies of Harvard University. We provide turnkey supply chain management and installation services for these customers across a wide range of project types and job sizes. Whether we are managing the interior finish installation process for a large new multi-family apartment complex or providing replacement flooring on a tight timeline for single-family rental home turnover, we offer a streamlined process and high-quality end result from a trusted provider. In addition, we provide customized technology solutions such as online ordering options for property managers. We leverage our infrastructure to cost-effectively serve this customer base across multiple markets with strong service levels, efficiency and valuable local expertise.
Our Industry
The interior finish solutions industry is a large, growing and highly fragmented market in which we are the leading national provider. We primarily serve the new single-family residential market, while also serving the new multi-family residential, commercial, and repair & remodel markets. The average installed cost of flooring, cabinets and countertops in a new single-family home was approximately $25,500 in 2019, according to the NAHB. Assuming 2019 U.S. single-family housing starts of approximately 887,700 based on U.S. Census Bureau data, this implies a potential addressable market of approximately $23 billion, with future upside through the addition of adjacent product categories, increases in interior finish spend per home and incremental housing volumes. Additionally, our technology solutions significantly expand our addressable market to include other economic transactions associated with the housing lifecycle including new construction pre-sales marketing, monetization of valuable consumer data and the provision of access to homebuyers for future design and renovation needs, amongst others.
Purchasing and designing or renovating a home has historically been facilitated by model homes and physical design studios. While our services today are largely delivered through physical design studios, we are
6
Table of Contents
seeing an increased shift towards digitization and a more virtual and technology-oriented model, driven by evolving homebuyer preferences. We believe that the long-term shift to digital solutions is fundamentally changing our market, with more homebuyers and homeowners preferring to review options and make design selections online. Beyond the convenience that comes with making selections virtually, our options selection tools, powered by our visualization technology, provide a more visual and real-time experience, allowing homebuyers and homeowners to see digital renderings of their designs rather than relying on samples and swatches. The ongoing shift in preference towards digital solutions is especially true for younger homebuyers and homeowners. In a recent survey from the National Association of Realtors, approximately 30% of those in younger demographics stated that they would be comfortable buying a house completely virtually. These long-term shifts have accelerated in the current COVID-19 pandemic with social distancing guidelines. We expect that these trends will lead to significant interest from both homebuilders and homeowners to increasingly implement digital solutions in the process of purchasing and designing a new home.
New Single-Family Residential Market
The new single-family residential market, valued at approximately $306 billion as of September 2020, is the primary market in which we operate. According to the NAHB and the U.S. Census Bureau, since 2011, cumulative net U.S. household formations have exceeded total housing starts by greater than 1.5 million units, leading to a significant backlog of demand for new housing. We expect the continued growth in the overall population, the aging of approximately 70 million millennials into their prime household formation and homeownership years, and the long-term effects of the COVID-19 pandemic to provide support for continued growth in new single-family residential construction. In addition to the long-term effects of COVID-19 on the industry, the public homebuilders are currently experiencing a significant rebound in net new orders. We typically benefit from an increase in net new orders once those homes are completed, which have historically averaged approximately 6 months after an initial order, and therefore we believe the current trends will benefit us in 2021. Furthermore, public homebuilding companies have reported increasing backlog value throughout 2020, which further supports increased deliveries in 2021.
Single-family housing starts remain below their long-term historical average and, according to the NAHB, are projected to grow at a 3.9% compound annual growth rate (CAGR) from 2020 to 2022. In addition, our large homebuilder customers have been gaining market share due to a long-term shift in the way homeowners approach the home purchasing process.
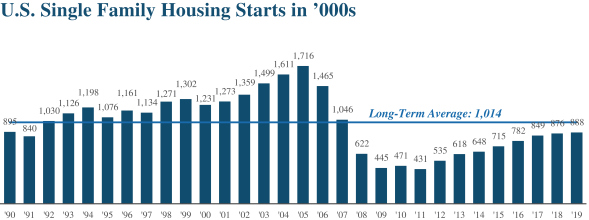
Source: U.S. Census Bureau Historical Data.
7
Table of Contents
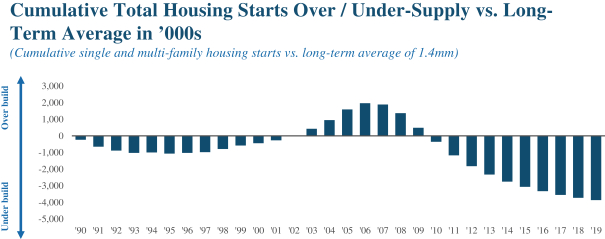
Source: U.S. Census Bureau Historical Data.
Repair & Remodel, Multi-Family and Commercial Markets
The residential repair & remodel market has been growing at a 4% CAGR since 2014. According to the Joint Center for Housing Studies of Harvard University, homeowner improvement and repair spend is expected to be approximately $338 billion in 2020. As new home construction has lagged historical build averages over the last decade, the average home age has steadily increased to over 40 years in the U.S. which we expect to result in an increase in repair and remodel spend over time. The market is also supported in the near term by a greater portion of the population staying at home due to the COVID-19 pandemic and spending incremental income on home repairs and renovations. Our core categories (flooring, cabinets and countertops) are typically high-priority items for homeowners to renovate due to their high visibility. We also expect continued growth in the multi-family repair & remodel market, driven primarily by the age of the housing base, with approximately 80% of the multi-family housing base built before 2000 as well as growth in demand for multi-family housing.
We provide supply chain management and installation services to the commercial and multi-family construction market, primarily focusing on apartment buildings, hotels, senior living facilities and light commercial contractors. According to the American Institute of Architects (AIA), non-residential construction spend is estimated to be approximately $400 billion in 2020 and the NAHB is expecting 393,000 multi-family housing starts in 2020.
Our Strengths
We benefit from the following key competitive strengths:
Clear Market Leader with an Unrivaled National Network
We are the leading national provider of technology-enabled sales and marketing, design and installation solutions for homebuilders. We have the leading market position in the approximately $23 billion U.S. new home interior finish solutions industry, and our scale and technology differentiation provide unique capabilities that attractively position us relative to our competitors.
Amidst an increasingly consolidated homebuilder landscape, our national footprint, leading technology platform and execution capabilities position us as a preferred partner to large national and regional homebuilders
8
Table of Contents
across the U.S. In addition, our national scale, combined with leading local market positions, drive strong supplier and local workforce relationships that allow us to capture meaningful supply chain efficiencies and deliver consistent, high-quality installation services. We believe independent contractors are eager to work with us due to our extensive customer-base, consistent job volumes and rapid payments, which we believe is a competitive advantage in an increasingly competitive workforce market.
Differentiated Technology-Enabled Solutions
We have made significant investments to build a robust technology platform that we believe differentiates our value proposition to homebuilders and enhances the user experience for homebuyers. Our end-to-end technology suite starts with pre-sales marketing solutions, offering photo-realistic virtual tours of floor plans to prospective homebuyers, eliminating the need for time-consuming in-person tours and potentially eliminating the need for costly model homes. Once a homebuyer has purchased a home, we offer online option selection tools that utilize visualization technology to allow homebuyers to conveniently browse thousands of customized product options in advance of design appointments—whether in-person or virtual—and create an online “wish list” for their new home with real-time pricing. Our design professionals have access to this key information and use it during design appointments to focus on a particular homebuyer’s preferences and tailor their sales approach to maximize upgrade sales. Our technology integrates with homebuilder back office systems to help improve construction quality, decrease cycle times and increase customer stickiness. The wealth of data captured by our technology also offers critical insight to homebuilders that influences their product offerings and community design and investment decisions. The over 100,000 homes we serve annually vastly outnumbers the number of homes built by even the largest national homebuilders, which enhances the value of the data we collect. We continue to invest in technological innovation to create new opportunities for expansion, from additional visualization applications, such as supplier product selections, to market and data analytics for homebuilders and product manufacturers. We believe that our investments in technology will significantly expand our addressable market as we seek to capture additional economic transactions in the housing lifecycle.
Superior Customer Value Proposition
Our comprehensive suite of sales, marketing, design and installation solutions delivers a superior value proposition to our customers. Our design solutions drive increased homebuilder sales and profitability, improved operating efficiency and an enhanced homebuyer experience. Our ability to increase efficiency and profitability for our homebuilder customers is critical to our value proposition. Our builder-branded design studios offer a dedicated solution for larger homebuilders, while our ILG-branded design studios provide the same professionally-managed design experience for multiple regional homebuilders in a single location. We have also proven the ability to serve our customers digitally, as we have seen a notable increase in the percentage of our customers that have completed fully virtual design selections in 2020 compared to 2019. Our expanding technological capabilities, particularly around visualization, are accelerating the digitization of the homebuilding industry and enhancing the homebuyer experience for homebuyers across the size and price spectrum. Interior option sales are an important driver of homebuilder profitability, and we focus on high-touch products, such as flooring, cabinets and countertops, that homebuyers view as critical to the design aesthetic and overall home satisfaction. Our commitment to providing excellent service and quality from the design appointment through installation enhances the overall homebuyer experience, further benefitting our homebuilder customers. As a result of our strong value proposition and proven track record, we have developed long-standing customer relationships, as demonstrated by our minimal customer turnover, and we frequently benefit from exclusivity across specified products and geographic markets. In addition, we utilize our strong supplier and independent contractor relationships to serve as a valued provider of supply chain management and installation services for homebuilders through our builder direct solutions, as well as for a diverse range of multi-family, commercial and repair & remodel customers.
9
Table of Contents
Robust Supply Chain Capabilities
We are the largest new single-family residential customer for many of our suppliers, which we believe allows us to achieve superior pricing, product selection and supply chain efficiencies relative to our competitors. We manage the complex process of matching product supply to homebuyer demand for our customers, leveraging our data-driven insights to guide simplified product offerings that focus on high-demand options. Similar to our homebuilder customers, we also provide value-added insights and data analytics to our suppliers that we believe we can monetize over time.
Successful Track Record of Identifying, Executing and Integrating Acquisitions
We operate in a highly fragmented industry, where we believe our resources, experience and access to capital position us to capitalize on the significant opportunity to execute accretive acquisitions and enhance our market position. We have completed approximately 18 acquisitions since 2013, which is more than any of our direct competitors. We have completed both tuck-in and transformative acquisitions, with an average purchase multiple below seven times adjusted annualized EBITDA. Our senior management team has significant experience executing a disciplined acquisition strategy and has institutionalized best practices for successful integration and synergy realization. As a result of our management tenure, history of successful acquisitions and local entrepreneurial cultures, we have extensive relationships in our industry and are an acquirer of choice among potential acquisition targets.
Strong Balance Sheet and Free Cash Flow Generation
On a pro forma basis to reflect the net proceeds from this initial public offering, we expect our net leverage will be approximately times 2019 Adjusted EBITDA.2 The capital requirements of our business are relatively low, as our primary investments are focused on technology innovation, design studios and countertop fabrication equipment. We are focused on managing our working capital as part of our efficient supply chain operations, as evidenced by our inventory turning more than 15 times per year and an overall cash conversion cycle of fewer than 30 days. We believe our relatively low leverage compared to public company peers, coupled with our strong free cash flow generation and prudent capital management, provides us significant advantages in today’s environment, including the flexibility to continue to grow organically and through acquisitions, as well as maximize our asset efficiency.
Proven Management Team and Entrepreneurial Culture
Our senior management team, led by CEO, Alan Davenport, and President and COO, Jason Peel, has been instrumental in developing our innovative business model. The deep industry knowledge and customer and supplier relationships of our management team are a competitive advantage in executing our strategy. Our key executives have an in-depth understanding of how to best serve our customers as a result of their extensive experience in the interior finish solutions industry as well as other areas of the homebuilding and building products supply chain. Our entrepreneurial culture and deeply experienced local and regional management teams drive service excellence and nimble decision-making, empowering local collaboration with customers, suppliers and installers. Our vision is not attainable without our employees, and our future success will in large part be determined by the talent, skills and culture of our workforce. We strive to foster a diverse and inclusive workforce and we recognize a responsibility to advance our human capital management strategies to attract, develop and safeguard the well-being of our talented and dedicated workforce, including our employees, partners and suppliers. The board is also engaged with management to create a corporate culture that embodies the attributes and behaviors necessary to advance our vision and execute on our strategies.
| 2 | For a definition of Adjusted EBITDA and net leverage, as well a reconciliation to the most directly comparable GAAP measures, see “Non-GAAP Measures” and “—Summary Historical Financial Data.” |
10
Table of Contents
Demonstrated and Growing Commitment to Environmental, Social and Governance Matters (ESG)
We continue to increase our focus on ESG initiatives to ensure that we as well as our services and solutions promote a commitment to these important areas. Regarding social initiatives, we are constantly focused on the health and safety of our employees in all aspects of the workplace. In response to the ongoing COVID-19 pandemic, we have provided many of our employees with the ability to work remotely, increased the cleaning and sanitizing of our offices and facilities and have implemented strict safety and health measures at remote worksites. We also seek to promote community involvement and diversity in our organization. We encourage our employees to give back to the community and foster social change by providing them with a paid day off to get involved in charitable and community activities. We have established a diversity committee chaired by our female CFO. We have implemented and are continuing to implement important corporate governance and risk management practices as well, including compensation programs with increased focus on performance-based equity compensation.
Our Growth Strategy
Our objective is to achieve profitable growth and increase stockholder value through the following key strategies:
Gain Market Share Through Unique Visualization Tools Addressing Changing Customer Preferences
We have a proven ability to expand our solutions with existing homebuilder customers over time, layering design studio and technology solutions on top of existing installation services to grow our wallet share and enhance our customer stickiness due to our technology integration with homebuilder back office systems. Technology is one of the hallmarks of our solutions-oriented business model, and we plan to continue to invest in further differentiating our offering. We believe the homebuilding industry is still in the early stages of leveraging technology and data analytics to more efficiently design, market, sell and deliver homes. We believe we are one of the industry leaders in this area and our scale positions us to continue to invest more than our competitors in technology and innovation, as evidenced by our technology spend of over $60 million over the past three years. We intend to continue to develop leading-edge technology tools that enrich the user experience, optimize sales and profitability, and enhance service levels and operational efficiency for our customers.
One of our key development priorities has been to expand our visualization features, which we have accelerated through our recent acquisition of Roomored, a leading visualization SaaS provider. The market continues to shift towards a more virtual homebuying experience as younger demographics begin to enter their prime homebuying years. For example, according to Apartment List, 80% of millennials state that buying a home is an important personal goal, and approximately 30% of the younger demographic population would be willing to buy a home fully online, according to a recent survey from the National Association of Realtors. These tailwinds emphasize the importance of rich, real-time visualization capabilities and digital marketing platforms in the current environment. Our superior virtual capabilities and design tools will continue to position us to take advantage of these trends, while also enabling us to gain additional data insights to understand changing homeowner preferences and provide feedback to our homebuilder, supplier and installer partners.
Execute on Our Technology Roadmap to Increase Revenue Streams Throughout the Entire Lifecycle of a Home
Our technology strategy is to expand our total addressable market to capture incremental economic transactions associated with the housing lifecycle. We believe that our access to over 100,000 homebuyers annually leaves us uniquely positioned to capitalize on this opportunity. Our technology roadmap is focused on continued enhancement of our design and selection capabilities, monetization of our significant repository of
11
Table of Contents
homebuyer data, and creating a digital marketplace to connect homebuyers, suppliers and installers for any future repair and remodel needs. In addition, we plan to capitalize on artificial intelligence-driven technology to show homeowners products and solutions of interest, to the benefit of both the homeowners, homebuilders and product partners.
Expand Our Extensive Relationships with Leading Homebuilders
We have a proven track record of growing our business with key customers, with our revenues from the top 10 U.S. homebuilders more than tripling from 2015 to 2019 through organic growth and acquisitions. Furthermore, from 2017 to 2019, we grew organic revenue from multiple key customers by more than 20%. Today we serve many of the leading national and regional homebuilders in the U.S. in multiple markets. We have an opportunity to substantially expand these relationships over time. In 2019, we served approximately 75,000 homes to our national accounts, which represent key scaled homebuilding customers that management has strategically aligned with across core markets. These customers delivered approximately 250,000 new homes in total, providing an opportunity to meaningfully increase penetration within our existing customers. We intend to continue to leverage our national footprint, technology platform and strong reputation for consistently superior execution to serve these customers in additional markets. Today, we operate 64 builder-branded design studios on behalf of 20 homebuilders across the country, as well as 46 ILG-branded design studios that provide the same professionally-managed design experience for multiple homebuilders in a single location. Our larger design customers collectively have operations in over 250 MSAs that we do not serve with our builder-branded model, providing significant runway for continued expansion, particularly in high growth attractive housing markets in the South and Southeast. Likewise, we provide builder direct solutions to national and regional homebuilders in multiple markets today, and we look to further penetrate these relationships in many more of the markets they serve. In addition, we have been successful in converting a number of builder direct customers to our design studio solutions, and in expanding the scope of our technology solutions to our design studio customers. Our investments in technology also significantly enhance our ability to serve new customers remotely outside of our design studio footprint. As an example, we recently executed a multi-year agreement with one of our national homebuilder customers to serve as their sole-source visualization provider for all interior finishes, regardless of whether we provide their installation services in a given market.
Expand Product Installation Capabilities Across Additional Markets
We perform supply chain management and installation services for flooring products across substantially all of our geographic markets. However, we offer cabinet and countertop installation services in only approximately 38% and 35% of these markets, respectively. We believe there is significant opportunity to grow our business in these and other products, through both expansion across geographic markets and increased penetration of the markets we currently serve. By expanding our supply chain management and installation services to additional products, we believe we can increase our potential revenues and profit per home and deepen our homebuilder relationships.
Drive Margin Enhancement Through Scale, Operational Initiatives and Technology Investments
We have demonstrated a proven ability to expand our margins over time and achieve industry-leading returns on invested capital. Our favorable margin profile is in part due to increasing our scale in specific markets, as we typically generate the highest margins in regions where we maintain leadership positions. Local economies of scale allow us to better leverage field managers, warehouses, and installation crews on a per home basis; as such, we expect to enhance our profitability as we achieve additional regional scale. We have also meaningfully expanded our margins through operational efficiencies and our investments in technology to improve our integration with homebuilder back office systems. Today, we believe we are optimized in the markets that collectively represent approximately 41% of our revenues for the nine months ended September 30, 2020. Our optimized markets demonstrate the aforementioned characteristics and generate margins in excess of our
12
Table of Contents
corporate average. Finally, the monetization of our technology initiatives, such as our visualization capabilities, are generating revenue at significantly higher margins, with technology-enabled revenue generating gross margins more than 800 bps higher than our builder direct revenue. We believe we can materially increase our overall margins in the long term through our technology initiatives.
Pursue Value-Enhancing Acquisitions in a Highly Fragmented Market
We estimate that approximately 80% of the interior finishes solutions industry remains highly fragmented. Our successful and disciplined acquisition strategy has provided us access to new technology, customers and markets, expanded our product capabilities, deepened our management team and enhanced our operational best practices. We will continue to focus on acquisitions that meet our criteria for growth, returns, technological advancement, market expansion, customer and product expansion and synergistic operations at attractive valuations. We believe our scale and access to capital relative to our competition, together with our senior management team’s strong relationships and reputation and vast and talented workforce, position us to take advantage of the many acquisition opportunities in our fragmented industry.
Pursue Growth Opportunities in Multi-Family, Commercial and Repair & Remodel End Markets
We employ our scale and supply chain management and installation expertise to serve a broad range of customers in multi-family, commercial and repair & remodel end-markets. These customers collectively represented approximately 20% of our 2019 revenues and provide another channel of growth outside of the new single-family residential market. We expect to continue to expand existing and develop new relationships where we can efficiently and effectively leverage our existing supply chain management and installation services to enhance our growth and profitability. Within these end markets, additional revenue opportunities include multi-family and light commercial contractors, multi-family owners and operators, senior living operators, single-family rental operators and home improvement retailers, where the largest companies have grown extensively through industry consolidation since the housing recession.
Our Sponsors
Founded in 1996, Littlejohn & Co., LLC (together with its affiliates, “Littlejohn”) is an investment firm headquartered in Greenwich, Connecticut. The firm’s current portfolio consists of 17 companies (excluding non-control investments) in a variety of industries, including multiple investments in the building products space. Littlejohn’s current and historical investments in the building products sector include Cook & Boardman and Contech. In addition, from 2011 to 2015, Littlejohn maintained an investment in Installed Building Products Inc. (NYSE: IBP), one of the nation’s largest insulation installers for the new single-family residential market and a diversified installer of complementary building products, which completed its initial public offering in 2014. Littlejohn invests primarily in North American headquartered businesses, many of which have global operations. Littlejohn will beneficially own approximately % of our common stock immediately upon the consummation of this offering. See “Principal Stockholders” for additional information regarding beneficial ownership.
Founded in 1995, Platinum Equity is a global investment firm with approximately $23 billion of assets under management and a portfolio of approximately 40 operating companies that serve customers around the world. The firm’s portfolio companies generated more than $25 billion of revenue during the trailing twelve-month period ended June 30, 2020. Platinum Equity specializes in mergers, acquisitions and operations—a trademarked strategy it calls M&A&O®—acquiring and operating companies in a broad range of business markets, including manufacturing, distribution, transportation and logistics, equipment rental, metals services, packaging, media and entertainment, technology, telecommunications, healthcare and other industries. Platinum Equity’s current and historical investments in the building products and construction sector include PrimeSource,
13
Table of Contents
NILCO, United Site Services, Fabcon, CanWel Building Materials, and Yak Access. Over the past 25 years, Platinum Equity has completed more than 300 acquisitions. Certain affiliates of Platinum Equity, LLC (collectively, “Platinum” and, together with Littlejohn, the “Sponsors”) will beneficially own approximately % of our common stock immediately upon the consummation of this offering. See “Principal Stockholders” for additional information regarding beneficial ownership.
Corporate Conversion
We currently operate as a Delaware limited liability company under the name Interior Logic Group Holdings, LLC. Faraday, which is owned by, among others, Littlejohn and members of legacy ISI management, owns 53% of our Class A Units, and ISH, which is owned by, among others, Platinum and members of legacy ILG management, owns 47% of our Class A Units. Certain employees of the Company hold options to purchase our Class B Units.
Prior to the effectiveness of the registration statement of which this prospectus is a part, Interior Logic Group Holdings, LLC will convert into a Delaware corporation pursuant to a statutory conversion and change its name to Interior Logic Group Holdings, Inc. (the “Corporate Conversion”). As a result of the Corporate Conversion, the holders of Class A Units of Interior Logic Group Holdings, LLC and options to purchase Class B Units will become holders of shares of common stock of Interior Logic Group Holdings, Inc. and options to purchase shares of our common stock, respectively. The number of shares of our common stock and options to purchase shares of our common stock that holders of units and options to purchase units will be entitled to receive in the Corporate Conversion will be determined in accordance with the Plan of Conversion and our Second Amended and Restated Limited Liability Company Agreement, dated May 31, 2018 (the “LLC Agreement”). In connection with the Corporate Conversion, Faraday intends to undertake a series of restructuring actions such that each of Littlejohn and the other holders of the equity interests of Faraday will own our common stock or options to purchase shares of our common stock through a new holding company (“New Faraday”). Following the Faraday restructuring, Faraday will become a non-operating subsidiary of the Company.
The information in this prospectus is based on our estimate that, in the Corporate Conversion, shares of our common stock will be issued to holders of units and options to purchase shares of our common stock will be issued to holders of options to purchase units, in either case, based on an initial public offering price per share of common stock of $ , which is the midpoint of the price range set forth on the cover page of this prospectus. To the extent that the actual initial public offering price per share for this offering is greater or less than $ , the actual number of shares of common stock and options to be issued in connection with the Corporate Conversion will be adjusted accordingly. See “Description of Capital Stock” for additional information regarding our common stock following the Corporate Conversion.
In connection with the Corporate Conversion, Interior Logic Group Holdings, Inc. will continue to hold all property and assets of Interior Logic Group Holdings, LLC and will assume all of the debts and obligations of Interior Logic Group Holdings, LLC. Interior Logic Group Holdings, Inc. will be governed by a certificate of incorporation filed in the State of Delaware and bylaws, the material portions of which are described in “Description of Capital Stock.” On the effective date of the Corporate Conversion, the members of the board of managers of Interior Logic Group Holdings, LLC will become the members of the board of directors of Interior Logic Group Holdings, Inc., and the officers of Interior Logic Group Holdings, LLC will become the officers of Interior Logic Group Holdings, Inc.
14
Table of Contents
Our organizational and ownership structure, after giving effect to the Corporate Conversion and this offering, is presented below:
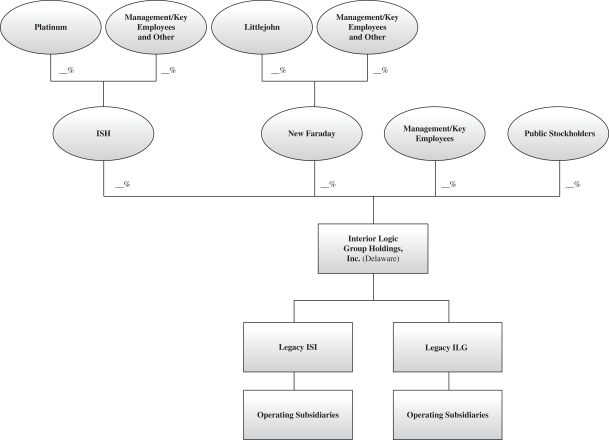
The purpose of the Corporate Conversion is to reorganize our corporate structure so that the entity that is offering our common stock to the public in this offering is a corporation rather than a limited liability company and so that our existing investors will own our common stock rather than equity interests in a limited liability company. References in this prospectus to our capitalization and other matters pertaining to our equity prior to the Corporate Conversion relate to the capitalization, equity and limited liability company interests of Interior Logic Group Holdings, LLC, and after the Corporate Conversion, to the capitalization, equity and shares of Interior Logic Group Holdings, Inc.
Corporate Information
Our principal executive offices are located at 10 Bunsen, Irvine, California 92618. Our main telephone number is (800) 959-8333. Our corporate internet website address is www.interiorlogicgroup.com. The information contained in, or that can be accessed through, our website is not incorporated by reference and is not a part of this prospectus.
Risk Factors Summary
Investing in our common stock involves a high degree of risk, which are discussed more fully under “Risk Factors.” You should carefully consider all the information in this prospectus, including the risks described in
15
Table of Contents
“Risk Factors,” before making a decision to invest in our common stock. If any of these risks are realized, our business, financial condition, results of operations and prospects could be materially and adversely affected. In that event, the trading price of our common stock could decline and you could lose part or all of your investment. Below is a summary of some of the principal risks we face:
| • | the negative impacts of the COVID-19 pandemic on our business; |
| • | decreased new single-family residential construction activity; |
| • | downturns in the economy and credit markets; |
| • | decreased demand for interior option upgrades; |
| • | decline in the rate of growth in the housing market, in our geographic markets or of the homebuilding industry; |
| • | loss of, or decreased construction activity by, significant customers; |
| • | pricing pressures from customers; |
| • | changes in the cost of the products we install or in our product mix; |
| • | increased tariffs and other changes in foreign trade policy; |
| • | dependence on our senior management team and other key personnel; |
| • | inability to attract and retain qualified employees and the risks associated with our workforce supply and costs; |
| • | risks associated with completing the implementation of our enterprise resource planning (“ERP”) system and implementing other new initiatives for operating software; |
| • | dependence on the availability and skill of subcontractors and the risks associated with our use of subcontractors; |
| • | inability to execute our growth strategy; |
| • | competitive pressures in our industry; |
| • | risks associated with acquisitions, including our ability to realize anticipated synergies or the costs of integrating acquisitions; |
| • | inability to expand into new geographic markets; |
| • | product shortages, loss of key suppliers, failure to develop relationships with qualified suppliers, material disruptions in our supply or substantial changes to supply terms; |
| • | reliance on third-party license agreements; |
| • | the effect of seasonality of our business, severe weather conditions and climate change; |
| • | cybersecurity risks; |
| • | disruptions in our IT systems and software; |
| • | changes in, or failure to comply with, federal, state, local and other laws and regulations; |
| • | exposure to claims and legal proceedings; |
| • | our failure to adequately protect our intellectual property rights; |
| • | risks related to our indebtedness; |
16
Table of Contents
| • | our inability to maintain an effective system of internal controls and produce timely and accurate financial statements or comply with applicable regulations; |
| • | the obligations and increased costs associated with being a public company; |
| • | the significant ownership of our common stock by our Sponsors, whose interests may conflict with those of our stockholders; and |
| • | additional factors discussed under the sections captioned “Risk Factors,” “Management’s Discussion and Analysis of Financial Condition and Results of Operations” and “Our Business.” |
17
Table of Contents
The Offering
| Common stock offered by us |
shares (or shares if the underwriters exercise their option to purchase additional shares in full). |
| Common stock to be outstanding after this offering |
shares (or shares if the underwriters exercise their option to purchase additional shares in full). |
| Option to purchase additional shares. |
We have granted the underwriters a 30-day option to purchase up to additional shares of our common stock. |
| Use of proceeds |
We expect to receive net proceeds from this offering of approximately $ million, or approximately $ million if the underwriters exercise their option to purchase additional shares of our common stock in full, assuming an initial public offering price of $ per share, which is the midpoint of the price range set forth on the on the cover page of this prospectus, after deducting the estimated underwriting discounts and commissions and estimated offering expenses payable by us. We intend to use the net proceeds from this offering (including any additional proceeds that we may receive if the underwriters exercise their option to purchase additional shares of our common stock) to repay indebtedness under our Term Loan Facility and the balance for general corporate purposes, including working capital, operating expenses and capital expenditures. We may also use a portion of the net proceeds we receive from this offering for acquisitions or other strategic investments, although we do not currently have any specific transactions at this time. See “Use of Proceeds.” |
| Dividend policy |
We currently intend to retain any future earnings to finance the development and expansion of our business and, therefore, do not intend to pay dividends on our common stock after this offering and for the foreseeable future. Any future determination relating to dividend policy will be made at the discretion of our board of directors and will depend on a number of factors, including restrictions in our current and future debt instruments, our future earnings, capital requirements, financial condition, future prospects, and applicable Delaware law, which provides that dividends are only payable out of surplus or current net profits. See “Dividend Policy.” |
| Proposed symbol |
We have applied to list our common stock on the Nasdaq Global Select Market under the symbol “ILG.” |
| Risk factors |
Investing in our common stock involves a high degree of risk. See “Risk Factors” for a discussion of factors you should carefully consider before deciding to invest in our common stock. |
18
Table of Contents
The number of shares of our common stock outstanding after this offering is based on shares of our common stock outstanding as of , 2020 and excludes:
| • | shares of our common stock issuable upon the exercise of outstanding options at a weighted-average exercise price of $ per share as of , 2020; and |
| • | shares of our common stock that will be reserved for issuance under the Interior Logic Group Holdings, Inc. 2021 Omnibus Incentive Plan (the “2021 Plan”). |
Unless otherwise indicated, all information in this prospectus relating to the number of shares of our common stock indicated to be outstanding before or immediately after this offering, as applicable:
| • | gives effect to the Corporate Conversion, the filing and effectiveness of our certificate of incorporation and the adoption of our bylaws, all of which will occur immediately prior to the effectiveness of the registration statement of which this prospectus forms a part; and |
| • | assumes no exercise by the underwriters of their option to purchase additional shares of our common stock. |
19
Table of Contents
Summary Historical Financial Data
The summary consolidated statements of comprehensive income (loss) data for fiscal years 2019, 2018 and 2017 and the summary consolidated balance sheet data as of December 31, 2019 and December 31, 2018 have been derived from our consolidated financial statements included elsewhere in this prospectus. The summary consolidated statements of comprehensive income (loss) data for the nine months ended September 30, 2020 and September 30, 2019 and the summary consolidated balance sheet data as of September 30, 2020 have been derived from our unaudited consolidated financial statements included elsewhere in this prospectus. In the opinion of management, our unaudited consolidated financial statements were prepared on the same basis as our audited consolidated financial statements and include all adjustments necessary for a fair presentation of the financial information set forth in those statements.
Our historical results are not necessarily indicative of future operating results and our results for the nine months ended September 30, 2020 are not necessarily indicative of the results that may be expected for the full fiscal year or any other period. You should read the following summary historical financial data in conjunction with our consolidated historical financial statements and the related notes thereto, and with the sections titled, “Capitalization” and “Management’s Discussion and Analysis of Financial Condition and Results of Operations,” which are included elsewhere in this prospectus.
| (in thousands) | Nine Months Ended September 30 |
Year Ended December 31 | ||||||||||||||||||
| 2020 | 2019 | 2019 | 2018 | 2017 | ||||||||||||||||
| (Unaudited) | ||||||||||||||||||||
| Statement of Comprehensive Income (Loss) Data: |
||||||||||||||||||||
| Revenues |
$ | 1,231,855 | $ | 1,314,021 | $ | 1,785,388 | $ | 1,405,325 | $ | 851,918 | ||||||||||
| Cost of revenues |
941,552 | 1,026,120 | 1,390,606 | 1,099,337 | 670,274 | |||||||||||||||
| Gross profit |
290,303 | 287,901 | 394,782 | 305,988 | 181,644 | |||||||||||||||
| Selling, general and administrative |
219,128 | 238,798 | 321,143 | 246,234 | 152,218 | |||||||||||||||
| Amortization of intangibles |
42,636 | 47,486 | 63,545 | 40,843 | 9,080 | |||||||||||||||
| Impairment of intangible assets and trade name(1) |
816 | — | — | 10,000 | — | |||||||||||||||
|
|
|
|
|
|
|
|
|
|
|
|||||||||||
| Total operating expenses |
262,580 | 286,284 | 384,688 | 297,077 | 161,298 | |||||||||||||||
|
|
|
|
|
|
|
|
|
|
|
|||||||||||
| Income from operations |
27,723 | 1,617 | 10,094 | 8,911 | 20,346 | |||||||||||||||
| Other expense: |
||||||||||||||||||||
| Interest expense |
(18,712 | ) | (22,321 | ) | (29,088 | ) | (22,238 | ) | (10,458 | ) | ||||||||||
| (Loss) on extinguishment of debt |
— | — | — | (3,068 | ) | (552 | ) | |||||||||||||
| Other income, net |
1,488 | 9 | 8 | — | — | |||||||||||||||
|
|
|
|
|
|
|
|
|
|
|
|||||||||||
| Income (loss) before income taxes |
10,499 | (20,695 | ) | (18,986 | ) | (16,395 | ) | 9,336 | ||||||||||||
| Income tax (expense) benefit |
(2,552 | ) | 3,127 | 3,225 | 3,475 | 521 | ||||||||||||||
|
|
|
|
|
|
|
|
|
|
|
|||||||||||
| Net income (loss) |
$ | 7,947 | $ | (17,568 | ) | $ | (15,761 | ) | $ | (12,920 | ) | $ | 9,857 | |||||||
|
|
|
|
|
|
|
|
|
|
|
|||||||||||
| Net unrealized (loss) gain on derivative instruments |
(6,708 | ) | (108 | ) | 431 | — | (5 | ) | ||||||||||||
|
|
|
|
|
|
|
|
|
|
|
|||||||||||
| Comprehensive income (loss) |
$ | 1,239 | $ | (17,676 | ) | $ | (15,330 | ) | $ | (12,920 | ) | $ | 9,852 | |||||||
|
|
|
|
|
|
|
|
|
|
|
|||||||||||
| Other Financial Data: |
||||||||||||||||||||
| Adjusted EBITDA(2) |
$ | 101,974 | $ | 83,634 | $ | 123,230 | $ | 93,038 | $ | 45,147 | ||||||||||
| Adjusted EBITDA margin(2) |
8.3% | 6.4% | 6.9% | 6.6% | 5.3% | |||||||||||||||
20
Table of Contents
| (in thousands) | As of September 30 |
As of December 31 | ||||||||||||||
| 2020 | 2019 | 2018 | 2017 | |||||||||||||
| (Unaudited) | ||||||||||||||||
| Balance Sheet Data |
||||||||||||||||
| Total current assets |
$ | 349,366 | $ | 300,458 | $ | 286,197 | $ | 133,862 | ||||||||
| Property, plant and equipment, net |
49,385 | 53,688 | 58,001 | 31,578 | ||||||||||||
| Intangible assets, net |
263,592 | 300,744 | 354,388 | 56,437 | ||||||||||||
| Goodwill |
266,847 | 253,977 | 249,849 | 72,273 | ||||||||||||
| Total assets(3) |
999,997 | 986,442 | 956,642 | 299,030 | ||||||||||||
| Total current liabilities |
225,634 | 201,857 | 195,117 | 111,112 | ||||||||||||
| Long-term debt, net of current portion |
380,946 | 382,249 | 384,319 | 90,848 | ||||||||||||
| Total liabilities(3) |
709,285 | 682,206 | 638,412 | 211,309 | ||||||||||||
| Total members’ equity |
$ | 290,712 | $ | 304,236 | $ | 318,230 | $ | 87,721 | ||||||||
| (1) | Represents amounts for impairment of intangibles ($816 for September 30, 2020) and trade name ($10,000 for the year ended December 31, 2018). |
| (2) | Adjusted EBITDA measures performance by adjusting EBITDA for certain income or expense items that are not considered part of our core operations. Adjusted EBITDA margin takes Adjusted EBITDA and divides it by revenues. See “Non-GAAP Measures.” |
| (3) | On January 1, 2019, we adopted ASU 2016-02, Leases, and recognized total right of use assets of $68.5 million and total lease liabilities of $71.0 million related to our operating and finance leases. |
The following table presents a reconciliation of Adjusted EBITDA to net income, the most comparable GAAP measure, for each of the periods indicated.
| Nine Months Ended September 30 |
Year Ended December 31 | |||||||||||||||||||
| (in thousands) |
2020 | 2019 | 2019 | 2018 | 2017 | |||||||||||||||
| Net income (loss) |
$ | 7,947 | $ | (17,568 | ) | $ | (15,761 | ) | $ | (12,920 | ) | $ | 9,857 | |||||||
| Interest expense |
18,712 | 22,321 | 29,088 | 22,238 | 10,458 | |||||||||||||||
| Income tax expense (benefit) |
2,552 | (3,127 | ) | (3,225 | ) | (3,475 | ) | (521 | ) | |||||||||||
| Depreciation and amortization |
53,747 | 58,930 | 78,963 | 52,621 | 14,075 | |||||||||||||||
|
|
|
|
|
|
|
|
|
|
|
|||||||||||
| EBITDA |
82,958 | 60,556 | 89,065 | 58,464 | 33,869 | |||||||||||||||
| Acquisition and integration costs(a) |
13,540 | 19,621 | 28,015 | 18,141 | 8,533 | |||||||||||||||
| Share-based compensation |
237 | 985 | 1,506 | 1,131 | 825 | |||||||||||||||
| Management fees(b) |
1,735 | 1,690 | 2,279 | 1,404 | 366 | |||||||||||||||
| Pre-opening costs(c) |
152 | 782 | 1,208 | 830 | 884 | |||||||||||||||
| Refinancing and related costs(d) |
— | — | — | 3,068 | 670 | |||||||||||||||
| Direct COVID-19 related costs(e) |
2,259 | — | — | — | — | |||||||||||||||
| Intangible assets and trade name impairment(f) |
816 | — | — | 10,000 | — | |||||||||||||||
| Costs for an initial public filing(g) |
277 | — | 1,157 | — | — | |||||||||||||||
|
|
|
|
|
|
|
|
|
|
|
|||||||||||
| Adjusted EBITDA |
$ | 101,974 | $ | 83,634 | $ | 123,230 | $ | 93,038 | $ | 45,147 | ||||||||||
|
|
|
|
|
|
|
|
|
|
|
|||||||||||
| (a) | Represents (i) expenses associated with severance, facility consolidations, centralization of functions and technology systems, and other integration activities following the acquisition of businesses, and (ii) transaction-related legal, banking, accounting and other professional fees incurred in connection with the acquisition and integration of businesses. |
| (b) | Represents fees paid to the Sponsors for services provided pursuant to management agreements, which will be terminated in connection with this offering. See “Certain Relationships and Related Party Transactions.” |
21
Table of Contents
| (c) | Represents non-capitalized expenses related to start-up costs of new facilities. |
| (d) | Represents the loss on extinguishment of debt and fees for professional services, such as legal and banking, incurred in connection with the refinancing of debt. |
| (e) | Represents charges for severance costs, remote connectivity and health and safety modifications within our facilities, all of which are clearly and directly related to COVID-19 and are incremental and separable from normal operations. |
| (f) | Represents amounts for impairment of intangibles ($816 for September 30, 2020) and trade name ($10,000 for the year ended December 31, 2018). |
| (g) | Represents costs incurred for legal, accounting and other professional fees associated with the submission of our prior confidential draft registration statement on Form S-1 (“DRS”) to the SEC that were written off in subsequent periods as a result of discontinuing work on the DRS. |
22
Table of Contents
Investing in our common stock involves a high degree of risk. You should consider carefully the risks and uncertainties described below, together with all of the other information in this prospectus, including our consolidated financial statements and related notes included elsewhere in this prospectus, before making an investment decision. In addition to the risks relating to the COVID-19 pandemic that are specifically described in these Risk Factors, the effects of the COVID-19 pandemic may also have the effect of significantly heightening many of the other risks associated with our business and an investment in our common stock, including the other risks described in this prospectus. There may be additional risks and uncertainties of which we are not currently aware or which we currently believe to be immaterial. If any of the following risks are realized, our business, financial condition, results of operations and prospects could be materially and adversely affected. In that event, the trading price of our common stock could decline and you could lose part or all of your investment.
Risks Related to COVID-19 Pandemic
Our business, financial condition and results of operations have been, and are expected to continue to be, adversely affected by the current COVID-19 public health pandemic.
In December 2019, coronavirus was reported in China, and, in March 2020, the World Health Organization declared COVID-19 a pandemic. On March 12, 2020, the President of the United States declared the COVID-19 outbreak in the United States a national emergency. The COVID-19 pandemic has caused significant economic dislocation in the United States as many state and local governments have ordered non-essential businesses to close and residents to shelter in place at home for a period of time. This has resulted in an unprecedented slow-down in economic activity and a related increase in unemployment. Since the COVID-19 outbreak, more than 50 million people have filed claims for unemployment, and financial markets have experienced extreme volatility. Any outbreaks of contagious diseases, public health epidemics or pandemics and other adverse public health developments could have a material adverse effect on our business, financial condition and results of operations. The COVID-19 pandemic, and the reactions of governmental and other authorities to contain, mitigate or combat the pandemic, which have severely restricted the level of economic activity around the world, have impacted, and are expected to continue to impact, our operations, and the nature, extent and duration of the impact of COVID-19 or any future disease or adverse health condition is highly uncertain and beyond our control. In response to the COVID-19 pandemic, the governments of many countries, states, cities and other geographic regions have taken preventative or protective actions, such as imposing restrictions on travel and business operations. These restrictions have had negative impacts on our business, and may potentially continue to negatively impact our business operations in the future. While our operations have resumed in all of our markets as of the date of filing of this Registration Statement, future mandatory shutdowns, reductions in operations or other restrictions could have a material adverse effect on our business.
Although we have implemented measures to mitigate the impact of the COVID-19 pandemic on our business, financial condition and results of operations, including reducing our expenses, furloughing employees and expanding the use of our fully virtual design appointments in place of in-person design studios, these measures may not fully mitigate the impact of the COVID-19 pandemic on our business, financial condition and results of operations. We have also experienced increased costs as a result of the COVID-19 pandemic, including severance costs and costs related to ensuring the safety of our workforce. We cannot predict the degree to, or the period over, which we will be affected by the COVID-19 pandemic and resulting governmental and other measures.
We expect that the economic effects of the COVID-19 pandemic will likely continue to adversely affect demand for our services and products as well as the length of the construction cycle and the timing of our revenue over the balance of fiscal 2020 and through the first half of 2021. Some of our customers have elected to delay remodeling activity due to the COVID-19 pandemic and the government has imposed certain restrictions in some geographic regions to contain the spread of the pandemic. We anticipate that homebuilders and our other
23
Table of Contents
customers may choose to continue to delay new construction or repair and remodeling activity, in response to the COVID-19 pandemic and the measures to contain its spread.
In addition, the construction industry in our sector has been experiencing labor and supply constraints as a result of the COVID-19 pandemic. We have and may continue in the future to experience disruptions or delays in our supply chain in connection with the pandemic in the future, which may result in the need to seek alternate suppliers. Alternate suppliers may be more expensive, may not be available or may encounter delays in shipments to us, which would affect our business, financial condition and results of operations. We cannot estimate the extent and duration of the disruption to our supply chain, or the significance of the related financial impact. Should any such disruption continue for an extended period of time, the impact could have a material adverse effect on our business, financial condition and results of operations.
In the long term, our liquidity will depend on many factors, including our results of operations, our future growth and the timing and extent of our expenditures, the expansion of our sales and marketing activities and the extent to which we make acquisitions. Changes in our operating plans, material changes in anticipated sales, increased expenses, acquisitions or other events may cause us to seek additional equity and/or debt financing in future periods. We cannot assure you that we will have access to capital to satisfy our needs under the impacts of the COVID-19 pandemic.
We expect that the COVID-19 pandemic will continue to adversely affect many aspects of our business, including, but not limited to, the following:
| • | We experienced reductions in demand for our in-person design studio services during the initial peak of the COVID-19 pandemic. Although demand for our in-person design studio services has resumed at or above pre-COVID-19 levels, future mandatory shutdowns, or other government restrictions as a result of the spread of the virus could reduce demand for our in-person design studio services and many of our products, and could result in economic and financial issues experienced by our customers and suppliers. |
| • | Third parties, such as suppliers and other outside business partners, may experience significant disruptions in their ability to satisfy their obligations with respect to us or their customers, or they may be unable to do so altogether; for example, many of our suppliers have experienced significant extensions of backlog due to labor shortages. |
| • | The housing construction industry may continue to experience labor and material shortages and delays and this may continue to impact the length of the construction cycle and the timing of our revenue. Although we expect the long-term effects of the COVID-19 pandemic to provide support for continued growth in new single-family residential construction and homebuilders are currently experiencing a rebound in net new orders, we do not know if these positive trends will offset the negative effects of the pandemic on our business. |
| • | Measures that we have taken to address the COVID-19 pandemic, including, among other things, providing additional safety equipment, encouraging our employees who are able to work remotely to do so, enacting and enforcing employee physical distancing protocols in our design studios, and all of our facilities, and reducing the need for face-to-face interactions, are reducing the efficiency of our operations. |
| • | Additionally, we may be exposed to increased cybersecurity risks as a result of remote working requirements. |
| • | Illness, travel restrictions or other workforce disruptions could negatively affect our supply chain, our ability to timely and satisfactorily meet our customers’ demands or our other business processes. Even after the COVID-19 pandemic subsides, we could experience a longer-term impact on our operating expenses, including as a result of, among other things, the need for enhanced health and hygiene requirements in our facilities and in our corporate offices or the periodic revival of physical or social distancing or other measures in one or more regions, in attempts to counteract or prevent future outbreaks. |
24
Table of Contents
| • | We reduced the number of employees that we employ in order to reduce our operating expenses. We may experience difficulties associated with hiring additional employees or replacing employees. We have brought back all the employees that we furloughed but that might not be the case in the event of any future furloughs. Increased turnover rates of our employees could increase operating costs and create challenges for us in maintaining high levels of employee awareness of, and compliance with, our internal procedures and external regulatory compliance requirements, in addition to increasing our recruiting, training and supervisory costs. |
| • | In addition to existing travel restrictions implemented in response to the COVID-19 pandemic, states and other jurisdictions may continue to close borders, impose prolonged quarantines and further restrict travel and business activity, which could materially impair our ability to support our operations and customers, to source supplies through our supply chain and to identify, pursue and capture new business opportunities, and which could continue to restrict the ability of our employees to access their workplaces. We also face the possibility of increased overhead or other expenses resulting from compliance with any future government orders or other measures enacted in response to the COVID-19 pandemic. |
Our management of the impact of COVID-19 has required, and will continue to require, significant investment of time by our management and employees as well as other resources. The focus on managing and mitigating the impacts of COVID-19 on our business will likely cause us to divert or delay the application of our resources toward new initiatives and growth opportunities, which may adversely impact our financial condition and results of operations in future periods.
The continuing impact of the COVID-19 pandemic on our business and operations depends on numerous factors beyond our control, including, among other things: (1) the duration of, and any revisions in, governmental quarantine, shelter-in-place or similar social distancing orders or guidelines; (2) the occurrence and magnitude of future outbreaks; (3) the availability of vaccines or other medical remedies and preventive measures; and (4) broader economic conditions, including unemployment levels and the reaction of consumers to potentially longer-term economic uncertainty, which may adversely impact our financial condition and results of operations in future periods.
Additionally, we continue to review available benefits under the federal and state relief and stimulus legislation and programs, including, among other things, those under the Coronavirus Aid, Relief, and Economic Security (CARES) Act. We anticipate benefiting from certain payroll-related items, net operating loss carryback provisions, increased depreciation provisions, and relaxed interest expense limitation provisions of the CARES Act, but we do not know whether we will be able to access additional benefits in a manner that is advantageous to us.
Risks Related to Our Business and Industry
Our business and the industry in which we operate are highly dependent on the level of new single-family residential construction activity, the U.S. and regional economies, credit markets and other important factors, all of which are beyond our control.
Our business is highly dependent on the level of new single-family residential construction activity, which is cyclical and sensitive to general and local economic conditions over which we have no control, including:
| • | housing inventory and demand levels, including the number of new single-family residential housing starts, and average new home square footage and selling prices; |
| • | housing affordability; |
| • | rental housing demand, cost and occupancy rates; |
| • | short and long term effects of the COVID-19 pandemic; |
| • | availability and cost of land; |
25
Table of Contents
| • | availability and cost of workforce; |
| • | cost of raw materials; |
| • | availability and pricing of mortgage financing for homebuyers and commercial financing for residential and multi-family builders and subcontractors; |
| • | local zoning and permitting processes; |
| • | short- and long-term interest rates; |
| • | inflation; |
| • | employment levels and job and personal income growth; |
| • | foreclosure rates; |
| • | consumer confidence generally and the confidence of potential homebuyers in particular; |
| • | U.S. and global financial system and credit market stability; |
| • | private party and government mortgage loan programs and federal and state regulation, oversight and legal action regarding lending, appraisal, foreclosure and short sale practices; |
| • | federal and state personal income tax rates and provisions, including provisions for the deduction of mortgage loan interest payments, real estate taxes and other expenses; |
| • | national, regional and/or local economic conditions, including in the markets in which we operate and compete; and |
| • | natural disasters, pandemics, war, acts of terrorism and responses to these events. |
Unfavorable changes in demographics, credit markets, political conditions, consumer confidence, household formation, housing affordability or housing inventory levels, or a weakening of the national economy or of any regional or local economy in which we operate, could adversely affect consumers’ spending on new single-family residential projects and, as a result, our business, financial condition, results of operations and prospects. Adverse changes in these conditions may affect our business generally or may be more prevalent or concentrated in particular markets in which we operate.
Decrease in demand for interior option upgrades could decrease our profit margins.
Our profitability is impacted by the mix of products for which we provide interior finish solutions. For example, in the new single-family residential market, sales of option upgrades are more profitable for us than sales of standard options, which are built into the base price of a home and vary based on the size of homes consumers are looking for. A shift in consumer preference towards smaller starter homes could lead to a decrease in demand for interior option upgrades. Although our overall product mix has shifted toward option upgrade sales through our design studios and virtual design appointments, there can be no assurance that this trend will continue. Unfavorable changes in demographics, credit markets, consumer confidence, health care costs, housing affordability, housing inventory levels, mortgage interest rates, a weakening of the national economy or of any regional or local economy in which we operate and other factors beyond our control could adversely affect consumer spending, resulting in decreased demand for interior option upgrades. Any shift to options that generate lower revenues and/or profit margins could adversely impact our business, financial condition, results of operations and cash flows.
The growth in the housing market may not continue at the same rate, and any decline in the growth rate in our geographic markets or of the homebuilding industry may materially and adversely affect our business, financial condition, results of operations and cash flows.
The U.S. Census Bureau reported approximately 887,700 total single-family housing starts in 2019. This is an increase from approximately 875,800 starts in 2018, but still below the historical average over the past 60
26
Table of Contents
years. There is significant uncertainty regarding the timing and extent of any further recovery in new home construction and resulting product demand levels, and any decline may materially adversely affect our business, financial condition, results of operations and cash flows. In particular, increases in mortgage interest rates and rising home prices, along with other economic factors, may slow the recovery of the home construction market or lead to a decline. In addition, concerns over the affordability of housing as a consequence of increasing mortgage interest rates and rising home prices may reduce the demand in the markets we serve.
In addition, some analysts project that the demand for residential construction may be negatively impacted by lower home ownership rates resulting from increases in the number of renting households. Further, even if homebuilding activity fully recovers, the impact of such recovery on our business may be dampened if, for example, the average selling price or average size of new single-family homes decreases, which could cause our homebuilder customers to decrease spending on our interior finish solutions. Other factors that might impact growth in the homebuilding industry include: uncertainty in domestic and international financial, credit and consumer lending markets amid slow growth or recessionary conditions in various regions around the world; levels of mortgage repayment; tight lending standards and practices for mortgage loans that limit consumers’ ability to qualify for mortgage financing to purchase a home, including increased minimum credit score requirements, credit risk/mortgage loan insurance premiums and/or other fees and required down payment amounts, more conservative appraisals, higher loan-to- value ratios and extensive buyer income and asset documentation requirements; federal and state personal income tax rates and recent changes to the deductibility of certain state and local taxes; Federal Reserve policy changes; and severe weather and adverse climate conditions. Given these factors, we can provide no assurance that present growth trends will continue, whether overall or in our markets, or whether the new single-family residential market will ever return to historical levels.
If there is limited or no economic growth or if there are declines in employment and consumer income and/ or continued tight mortgage lending standards and practices in the geographic areas in which we operate, or if interest rates for mortgage loans continue to rise, there would likely be a corresponding adverse effect on the new single-family residential market, which could adversely affect our business, financial condition, results of operations and prospects. Economic conditions could also have a negative effect on homebuyers’ ability or desire to spend on interior option upgrades, even if there is not an overall impact on housing market volumes. These factors could also have a disproportionate impact on homeowners who otherwise would consider relocating to a house with a higher average selling price. For example, improvements in the overall new single-family residential market would not have as positive an impact on our operations if accompanied by an increase in entry-level housing starts as a proportion of the overall market mix for new homes.
We also rely on repair & remodel activity. High unemployment levels, high mortgage delinquency and foreclosure rates, lower home prices, limited availability of mortgage and home improvement financing, higher mortgage rates and significantly lower housing turnover may restrict consumer spending, particularly on discretionary items such as home improvement projects, and affect consumer confidence levels leading to reduced spending in the repair & remodel market. In addition, as the residential rental market continues to grow and demand for rental properties increases, property owners may not need to engage in substantial levels of repair & remodel activity in order to secure tenants. Furthermore, with even a slight decline in the economy, nationally or in any of the markets in which we operate, consumer preferences and purchasing practices and the strategies of our customers may adjust in a manner that could result in changes to the nature and prices of products demanded by the end consumer and our customers, and could adversely affect our business, financial condition and results of operations.
Any loss or decrease in the construction activity of or purchases by any of our significant customers could affect our business, financial condition, results of operations and cash flows.
The top 10 U.S. homebuilders accounted for approximately 43.7% and 42.7% of our revenues for the nine months ended September 30, 2020 and the year ended December 31, 2019, respectively. We cannot guarantee that we will maintain or improve our relationships with these customers or that we will continue to provide
27
Table of Contents
services to these customers at historical levels. The revenues from these customers generally are correlated to the level of building activity in their respective markets. In the future, homebuilder customers may exit or decrease their building activity in one or more of our markets depending on market conditions in the homebuilding industry.
In addition, our homebuilder and other customers may: (i) purchase some of the products for which we currently provide supply chain management and installation services directly from manufacturers; (ii) elect to establish their own building products design, manufacturing, fabrication, distribution and/or installation facilities, or online and technology platforms in lieu of our design solutions; (iii) give advantages to design, manufacturing, fabrication, distribution and/or installation intermediaries in which they have an economic stake; or (iv) elect to utilize the technology platforms and/or services of our competitors. Continued consolidation among homebuilders could also result in a loss of some of our customers. The loss of, or a decrease in, the business of one or more of our significant customers, or deterioration in our relations with any of them, could significantly adversely affect our business, financial condition, results of operations and cash flows. There can also be no assurance that the continued impact of COVID-19 will not impact homebuilders’ financial health or result in changes from the past practice.
Furthermore, our customers are not required to purchase any minimum amount of product from us. Should our customers purchase the products for which we provide supply chain management and installation services in significantly lower quantities than they have in the past, or should the customers of any business that we acquire purchase products from us in significantly lower quantities than they had prior to our acquisition of such business, such decreased purchases could have a material adverse effect on our financial condition, results of operations and cash flows.
Our customers may terminate their agreements with us.
Although we have agreements with our customers, there are not minimum commitments under all of these agreements, and such agreements are typically terminable by either party upon 30 to 90 days’ notice and may contain cross-default provisions. In addition, certain of our design studio services agreements obligate us to provide reasonable transition services to our homebuilder customers or their new service providers for a limited period of time following termination, and grant our homebuilder customers the ability to engage the services of or hire any or all of the design studio staff in place prior to termination.
We make investments to open and subsequently update and improve our design studios. However, the use of design studios in our business has been and may continue to be impacted by the COVID-19 pandemic. We experienced reductions in demand for our in-person design studio services during the initial peak of the COVID-19 pandemic. As a result of the ongoing COVID-19 pandemic and related quarantines, shelter-in-place orders, and similar restrictions, our customers have increasingly chosen to use our online and technology-based design and photo-realistic virtual tour platform. Also, demand for our in-person design studio services has resumed at or above pre-COVID-19 levels. Nevertheless, our customers may decide to use the technology of our competitors, or elect to establish their own building products design technologies, instead of visiting our physical design studios. While we have managed the increased volume of demand for our visual tour technology platform, there are no assurances that we will continue to do so. Disruptions, failures or other performance issues with our customer-facing technology systems, either due to the increased volume or other factors, could impair the benefits they provide, adversely impact our sales, and negatively affect our relationship with our customers. In addition, as more business activities have shifted online due to COVID-19 restrictions, and as many of our team members are working remotely, we face an increased risk due to the potential failure of internal or external information technology infrastructure as well as increased cybersecurity threats and attempts to breach our security networks.
As a result of the COVID-19 pandemic, we have experienced a customer terminating its design studio services agreement and choosing to establish its own design studio capabilities. If homebuilder customers
28
Table of Contents
terminate their design studio services agreements, depending on the terms of such agreements, we could experience a loss of our capital investment in the design studios operating under such agreement. The consequences of a termination of one or more design studio services agreements could impact our business, financial condition, results of operations, cash flows and prospects.
We are subject to significant pricing pressures from our customers.
Large homebuilders and other large customers historically have been able to exert significant pressure on their outside product and service providers to keep prices low in the highly fragmented building products supply and services industry. In addition, continued consolidation in the homebuilding industry and changes in customers’ purchasing policies and payment practices could result in even further pricing pressure. For example, there has been a trend of large publicly-traded homebuilders acquiring other large homebuilders, which increases their market share and buying power and, as a result, could adversely impact our margins. In addition, local providers may provide labor and materials services at extremely low prices. A decline in the prices of the products we source and the services we provide could adversely impact our results of operations. Alternatively, due to the rising market price environment, our suppliers may increase prices or reduce discounts on the products we source, and we may be unable to pass on any cost increase to our customers, thereby resulting in reduced margins and profits. Similarly, if our workforce costs increase, we may be unable to pass on any cost increase to our customers. Overall, these pricing pressures may adversely affect our financial condition, results of operations and cash flows.
Changes in the cost of products we install could decrease our profit margins.
The products that we install have been subject to price changes in the past, some of which have been significant. In particular, for certain products that require longer lead times, we may be subject to price increases between the time we place an order from our suppliers and the time we take delivery of the materials. We may not be able to pass any such price increases along to our customers. Accordingly, our operating results for individual quarterly periods can be adversely affected by a delay between when building product cost increases are implemented and when we are able to increase prices for our products and services. Further, our supplier purchase prices often depend on volume requirements. If we do not meet these volume requirements, our costs could increase and our margins may be adversely affected. While we have been able to achieve cost savings through volume purchasing and our relationships with suppliers, we may not be able to continue to receive advantageous pricing for the products that we install, which could have a material adverse effect on our financial condition, results of operations and cash flows. In addition, some of our customers may work directly with suppliers to specify products for their projects. To the extent that our customers enter into agreements directly with suppliers, we may lose some of the benefits of our purchasing advantages, which could adversely impact our profit margins.
Tariffs and other changes in foreign trade policy could adversely affect our business and results of operations in the future.
Dynamic changes in legislation and government policy may have a material adverse effect on our business. The imposition of tariffs on certain materials has increased our product costs. The current U.S. administration has taken action with respect to certain trade policies, such as the imposition of tariffs on imported products and the withdrawal from or renegotiation of certain trade agreements, including the North American Free Trade Agreement. For example, the United States has increased tariffs on certain imports from China, as well as on steel and aluminum products imported from various countries. With an upcoming change of administration in January 2021, proposed legislation and regulatory changes could have a material impact on us including, but not limited to, modifications to international trade policy and increased regulation. Furthermore, existing tariffs imposed on goods imported from abroad that are used in our businesses may be extended or expanded.
We procure certain of the raw materials we use in the manufacturing of our products directly or indirectly from outside of the United States. The imposition of tariffs and other potential changes in U.S. trade policy could
29
Table of Contents
increase the cost or limit the availability of raw materials, which could hurt our competitive position and adversely impact our business, financial condition and results of operations.
These changes in trade policy and any recently enacted, proposed and future trade agreements or tariffs on imported products could negatively impact our business and results of operations if they seriously disrupt the movement of products through our supply chain or increase their cost. In addition, while we may be able to shift some of our sourcing options, executing such a shift would be time consuming and would be difficult or impracticable for many products and may result in an increase in our manufacturing costs. In the event that we are required to pay higher prices for the products that we install, we may not be able to pass on price increases to our customers in a timely manner or at all due to the competitive nature of our industry.
Our success depends on the continued services of our senior management team and other key personnel.
Our success depends to a significant degree upon the contributions of our senior management team and other key personnel, each of whom would be difficult to replace. To encourage the retention of our senior management team and key personnel, we have entered into various equity-based compensation agreements designed to encourage their retention. We do face the risk, however, that members of our senior management and other key personnel may not continue in their current positions, and the loss of their services could cause us to lose customers and reduce our sales and/or margins, negatively affect relationships with our customers or our suppliers, lead to employee morale problems and/or the loss of other key employees, or cause disruptions to our business. Also, we may be unable to find qualified individuals to replace members of our senior management team or other key personnel who leave our company on a timely basis or at all.
Our success depends on our ability to attract and retain qualified employees while controlling workforce costs.
Our success depends on our ability to attract, hire, train and retain qualified managerial, operational, sales, design and other personnel, while at the same time controlling our workforce costs. Further, in order to accelerate development of our technology solution, we have added and expect to continue to add, in the future, new members for our technology team. The labor market for the construction industry and the technology space is tight, resulting in significant competition for these types of employees and increased employee-related costs. Our ability to control workforce costs is subject to numerous external factors, including competitive wage rates and health and other insurance and benefit costs. A significant increase in competition, minimum wage or overtime rates in localities where we have employees could have a significant impact on our operating costs and may require that we take steps to mitigate such increases, all of which may cause us to incur additional costs, expend resources responding to such increases and lower our margins. We may be unsuccessful in attracting and retaining the personnel we require to conduct and expand our operations successfully. If we are unable to attract or retain qualified employees in the future, it could adversely impact our business, financial condition and results of operations.
We and our customers may be affected by shortages in workforce supply, increased workforce costs or workforce disruptions, which could affect our business, financial condition, results of operations and cash flows.
Our customers require a qualified labor force to build, repair and remodel homes and communities, and we require a qualified workforce to install our products in those homes and communities. Access to qualified workers and subcontractors by our customers and us may be affected by circumstances beyond their or our control, including:
| • | work stoppages resulting from workforce disputes; |
| • | shortages of qualified trades people, such as carpenters, roofers, electricians and plumbers, especially in key markets; |
| • | changes in laws relating to union organizing activity; |
30
Table of Contents
| • | enforcement and/or audits of our implementation of current federal and state immigration laws and regulations by regulatory agencies, including the U.S. Immigration and Customs Enforcement, or ICE, and the Department of Labor; |
| • | changes in immigration laws and trends in workforce migration; |
| • | changes in state laws regulating the classification of “independent contractors”; and |
| • | increases in subcontractor and professional services costs. |
Workforce shortages can be further exacerbated if demand for housing or repair and remodel activity increases. Any of these circumstances could give rise to delays in the start or completion of, or could increase the cost of, building, repairing and remodeling homes and communities. Such delays and cost increases would also have an effect on our ability to generate interior option sales from end customers and could have a material adverse effect on our business, financial condition, results of operations and cash flows.
We face risks in completing the implementation of our ERP system.
We are in the process of completing the implementation of a company-wide ERP system. Presently, more
than 50% of our revenues are processed through our ERP system. The implementation of this system is complex and time-consuming, and we have incurred and expect to incur additional expenses in connection with the implementation. Furthermore, the COVID-19 pandemic caused some delay in its implementation. Many companies have experienced delays and difficulties with the implementation of ERP systems that have had a negative effect on their business. Despite any delays we have experienced, our implementation of the ERP system has not to date had a material negative impact on our operations; nonetheless, we are still in the process of completing the implementation and successful implementation remains subject to significant risks.
If the ERP system rollout is not effectively implemented as planned, or the system does not operate as intended, the effectiveness of our internal controls over financial reporting could be adversely affected or our ability to assess those controls adequately could be delayed. If there are significant delays in documenting, reviewing and testing our internal controls over financial reporting, we may fail to prevent or detect material misstatements in our financial statements, in which case investors may lose confidence in the accuracy and completeness of our financial reports and the market price of our securities may decline.
If we are unable to successfully complete the implementation of the ERP system, it could have a material adverse effect on our business, financial condition, results of operations and cash flows.
The implementation of new initiatives related to our operating software systems and related technology could disrupt our operations, and these initiatives might not provide the anticipated benefits or might fail.
We have made, and we plan to continue to make, significant investments in our visualization and option selection technology platform and enhancing our streamlined integration with homebuilders’ back office systems and ability to aggregate extensive data analytics to offer insights into evolving design trends and homeowner preferences. This includes the integration and expansion of technology obtained through acquisitions and the hiring of new members for our technology team. The cost and potential issues and interruptions associated with this technology development and integration, as well as those associated with managing third-party service providers, employing new cloud-based tools and services and aggregating large amounts of data, could disrupt or reduce the efficiency of our operations. In addition, our new and upgraded technology might cost more than anticipated or might not provide the anticipated benefits, or it might take longer than expected to realize the anticipated benefits or the initiatives might fail altogether. Furthermore, as more business activities have shifted online due to COVID-19 restrictions, we face an increased risk due to the potential failure or disruption of internal or external information technology infrastructure, as well as increased cybersecurity threats such as a breach to our company networks or systems. Because the success of our growth strategy depends in part on our IT infrastructure, issues that arise with ant related initiatives or our IT systems may adversely affect our business.
31
Table of Contents
Our business and results of operations are dependent on the availability and skill of subcontractors.
We primarily engage subcontractors to perform the installation of the products that we source for our customers. Accordingly, the timing and quality of our installations depends on the availability and skill of our subcontractors. Competition for skilled subcontractors can be significant in our markets. While we believe that our relationships with subcontractors are good, we generally do not have long-term contractual commitments with any subcontractors, and we can provide no assurance that skilled subcontractors will continue to be available at reasonable rates in our markets. The inability to contract with skilled subcontractors at reasonable rates on a timely basis could have a material adverse effect on our business, financial condition and results of operations.
Despite our quality control efforts, we may discover that our subcontractors have engaged in improper construction practices or have installed defective materials. The adverse costs of satisfying our warranty and other legal obligations in these instances may be significant and we may be unable to recover the costs of warranty-related repairs from subcontractors, suppliers and insurers, which could have a material impact on our business, financial condition and results of operations.
Our use of subcontractors for certain functions may expose us to additional risks.
We primarily rely on subcontractors to perform installation services. We structure our relationships with subcontractors in a manner that we believe results in an independent contractor relationship, not an employee relationship. An independent contractor is generally distinguished from an employee by, among other things, his or her degree of autonomy and independence in providing services. A high degree of autonomy and independence is generally indicative of a contractor relationship, while a high degree of control by the hiring entity is generally indicative of an employment relationship. However, laws regarding independent contractor status vary from state to state and are subject to change and interpretation based on court decisions and regulation. For example, the California Supreme Court recently adopted a new standard for determining in certain circumstances whether a company “employs” individuals for purposes of the California Wage Orders in its decision in the Dynamex Operations West, Inc. v. Superior Court case. The Dynamex decision, codified in AB 5, generally alters the analysis of whether an individual, who is classified by a hiring entity as an independent contractor in California, has been properly classified as an independent contractor by requiring satisfaction of a three-part test. Adverse determinations regarding the independent contractor status of any of our subcontractors could entitle such individuals to, among other things, the reimbursement of certain expenses and to the benefit of wage-and-hour laws, and could result in us being liable for employment and withholding tax and benefits for such individuals. Any such adverse determination could result in a material reduction of the number of subcontractors we can use for our business or significantly increase our costs to serve our customers, which could have a material adverse effect on our business, financial condition, results of operations and cash flows. Additionally, we cannot assure you that there will not be further changes in laws relating to characterization and treatment of independent contractors.
The subcontractors we rely on to perform our installation services are also subject to a significant and evolving number of local, state and federal laws and regulations, including laws involving matters that are not within our control. If these subcontractors fail to comply with applicable laws, or if they take other improper actions, we may suffer reputational damage and may be exposed to liability.
We may be unable to effectively execute our growth strategy, which could have an adverse effect on our business, results of operations and prospects.
Some of the challenges we may encounter in executing our growth strategy include:
| • | existing and new customers may not adopt our interior finish solutions at the rate or levels that we expect, or at all; |
| • | we may be unable to develop new customer relationships and expand our existing customer relationships; |
32
Table of Contents
| • | we may not be able to develop new technologies to keep pace with our customers’ demand or as quickly as our competitors; |
| • | we may face increased competition from new or existing competitors as we move into new geographies and end markets or as competitors enter our existing geographic markets; |
| • | we may not be successful in identifying and expanding into providing interior finish solution services for new product categories; |
| • | we may be unable to successfully integrate new technology or businesses, or realize expected synergies from acquisitions; |
| • | we may not be able to expand in the multi-family, commercial or repair & remodel end-markets, or such expansion may require more resources than we expect; |
| • | we may have difficulties in consistently and effectively implementing our growth initiatives across our geographically dispersed network of design studios, operating centers, warehousing and logistics centers, and sales offices; |
| • | we may be unable to effectively manage the costs of growth; |
| • | growth could put additional strains on our management, capital resources, IT systems and customer service; and |
| • | there may be insufficient qualified employees and subcontractors to accommodate our growth. |
If we fail to overcome the risks associated with the effective execution of our growth strategy, our financial position, results of operations and prospects could be adversely affected.
We face competition from a variety of competitors and increased competitive pressure may adversely affect our business, financial condition, results of operations and cash flows.
Our industry is highly fragmented and competitive. We face significant competition from other national, regional and local companies that (i) provide design studio solutions (both in-person and virtually) and supply chain management and installation services, (ii) provide repair and remodel services, or (iii) sell and install building products directly to and for consumers. We expect to face increased competition from current and future companies in the property technology industry as the demand for virtual and digital technology grows. In addition, homebuilders may perform interior design services or develop new technologies in-house. Any of these competitors may:
| • | foresee the course of market developments more accurately than we do; |
| • | offer products, design studio solutions, or supply chain management and installation services that are deemed superior to ours; |
| • | produce or supply products or provide services similar to our offerings at a lower cost or within a better time frame; |
| • | develop stronger relationships with homebuilders, property managers, contractors, or product suppliers; |
| • | adapt more quickly to new technologies, new techniques or evolving consumer preferences, or develop new technologies or techniques; |
| • | operate in markets to which we seek to expand or have preexisting customer relationships that we do not have; or |
| • | have access to financing on more favorable terms than we can obtain in the market. |
As a result, we may not be able to compete successfully with our competitors. If we are unable to compete effectively, our business, financial condition, results of operations and cash flows may be adversely affected.
33
Table of Contents
Acquisitions involve a number of risks which could have an adverse effect on our business, financial condition, results of operations and cash flow.
Acquisitions have contributed to our growth, and as part of our growth strategy, we intend to continue to pursue acquisitions. At any given time, we may be evaluating or in discussions with one or more acquisition candidates. However, we may not be able to identify suitable acquisition candidates and may face increased competition for acquisition candidates that meet our criteria. In addition, acquired businesses may not perform in accordance with expectations, and our business judgments concerning the value, strengths and weaknesses of acquired businesses may not prove to be correct. We may also be unable to achieve expected improvements or anticipated cost savings in businesses that we acquire.
Acquisitions involve a number of other special risks, including:
| • | the possibility that we may not be able to manage acquired businesses or control integration costs and other costs relating to acquisitions; |
| • | potential adverse short-term effects on operating results from increased costs or otherwise; |
| • | diversion of management’s attention; |
| • | failure to retain existing key personnel of the acquired business and recruit qualified new employees at the acquired business locations; |
| • | failure to successfully implement infrastructure, logistics and systems integration; |
| • | potential impairment of goodwill; |
| • | risks associated with the culture and/or internal controls of acquired businesses; |
| • | disruption of our relationships with, or losses of, key customers or suppliers; |
| • | exposure to legal claims for activities of the acquired business prior to acquisition and inability to realize on any indemnification claims; and |
| • | our inability to obtain financing necessary to complete acquisitions on attractive terms or at all. |
Our failure to integrate any acquired businesses effectively or to manage other consequences of our acquisitions, including as a result of the foregoing factors, could prevent us from implementing our growth strategy, remaining competitive and, ultimately, could adversely affect our business, financial condition, results of operations and cash flows.
Future acquisitions may result in the incurrence of debt and contingent liabilities, legal liabilities, goodwill impairments, increased interest and/or amortization expense and significant integration costs. In particular, we may be subject to claims or liabilities arising from the ownership or operation of acquired businesses for the periods prior to our acquisition of them, including tax liabilities, product liabilities, asbestos liabilities, environmental liabilities, pension liabilities, liabilities for employment and immigration practices and other liabilities and claims not covered by insurance. These claims or liabilities could be significant, and our ability to seek indemnification from the former owners of our acquired businesses for these claims or liabilities may be limited by various factors, including the specific time, monetary or other limitations contained in the respective acquisition agreements and the financial ability of the former owners to satisfy our indemnification claims. In addition, insurance companies may be unwilling to cover claims that have arisen from acquired businesses or locations, or claims may exceed the coverage limits that our acquired businesses had in effect prior to the date of acquisition.
In addition, we may require additional debt or equity financing for future acquisitions, and such financing may not be available on favorable terms, if at all. If we finance acquisitions by issuing our equity securities or securities convertible into our equity securities, the ownership of our existing stockholders would be diluted, which, in turn, could adversely affect the market price of our common stock. We could also finance an acquisition with debt, resulting in higher leverage and interest costs relating to an acquisition.
34
Table of Contents
Possible future acquisitions or dispositions may also trigger a review by the U.S. Department of Justice, the U.S. Federal Trade Commission, and/or the state attorneys general under their respective regulatory authority, focusing on the effects on competition, including the size or structure of the relevant markets and the pro- competitive benefits of the transaction. Any delay, prohibition or modification required by regulatory authorities could adversely affect the terms of a proposed acquisition or could require us to modify or abandon an otherwise attractive acquisition opportunity.
We intend to expand into new geographic markets, and our expansion may be costly and unsuccessful.
Our growth depends, in part, on our ability to expand into new geographic markets. Our expansion into new geographic markets will require us to make incremental expenditures for the workforce and facilities. In addition, we may face challenges operating in new business environments with which we are unfamiliar, including facing difficulties securing adequate workers, subcontractors and managing our new operations, expanding our sales channels and sourcing capabilities and stemming from our exposure to new legal and regulatory environments. Expansion into new geographic markets may also expose us to direct competition with companies with whom we have limited or no past experience as competitors. If we fail to manage the risks inherent in our geographic expansion, we could incur substantial capital and operating costs without any related increase in revenues, which would harm our results of operations. Further, even if our geographic expansion is successful in generating additional revenues, failure to effectively manage our growth in a cost-effective manner could result in declines in customer satisfaction, increased costs or disruptions of our operations.
Increases in the construction of modular and manufactured homes could adversely affect our business, financial condition, results of operations and cash flows.
If concerns over the affordability of housing increase due to rising mortgage interest rates or home prices, homebuyers may choose to purchase modular or manufactured homes, which are built, in whole or in part, in offsite factories. To the extent these types of homes become more popular among homebuyers, it may reduce the construction activity of our homebuilder customers. In addition, an increase in the construction of homes at offsite locations would reduce our opportunity to perform on-site installation services for such homes, which could have an adverse effect on our business, financial condition, results of operations and cash flows.
Product shortages, the loss of key suppliers or failure to develop relationships with qualified suppliers or substantial changes to supply terms could affect our business, financial condition, results of operations and cash flows.
We primarily rely on third-party suppliers for the products for which we provide interior finish solutions, and as such, our business depends on our ability to obtain adequate product supply from manufacturers and other suppliers. Our two largest suppliers collectively accounted for approximately 39% and 37% of our product purchases for the nine months ended September 30, 2020 and the year ended December 31, 2019, respectively. We typically do not enter into long-term agreements with our suppliers, as the products that we offer are generally available from various sources and in sufficient quantities. However, suppliers have been subject to increased consolidation and, during construction downturns, some of our suppliers experienced bankruptcy. The loss of, or a substantial decrease in the availability of, products from our suppliers, or the loss of key supplier arrangements, could adversely impact our business, financial condition, results of operations and cash flows. In prior downturns in the housing industry, building products manufacturers have reduced capacity by closing plants and production lines within plants. Even if such capacity reductions are not permanent, there may be a delay in manufacturers’ ability to increase capacity in times of rising demand. If the demand for products from manufacturers and other suppliers exceeds the available supply, we may be unable to source additional products in sufficient quantity or quality in a timely manner and the prices for the products that we install could rise. These developments could affect our ability to take advantage of market opportunities and limit our growth prospects.
35
Table of Contents
Although in many instances we have agreements with our suppliers, these agreements are generally terminable by either party on limited notice. Many of our suppliers also offer us favorable purchasing terms based on our large scale and the volume of our purchases. If market conditions change, suppliers may stop offering us favorable terms. Failure by our suppliers to continue to supply us with products on favorable terms, commercially reasonable terms, or at all, could put pressure on our operating margins or have a material adverse effect on our business, financial condition, results of operations and cash flows.
Our business also depends on our ability to identify and develop relationships with qualified suppliers in order to provide our services with high-quality products in a timely manner. Disruptions at distribution centers, shipping ports, transportation carriers or elsewhere along our supply chain due to labor disputes, work stoppages, natural disasters or otherwise may affect our ability to deliver products to our customers on a timely basis, which may in turn adversely affect our relationships and reputation with customers and our results of operations.
A material disruption at one of our suppliers’ facilities or loss of a supplier relationship could prevent us from meeting customer demand, reduce our sales, increase our costs and negatively affect our overall results of operations.
Any of the following events could cease or limit the operations of our suppliers unexpectedly: fires, floods, earthquakes, hurricanes, on-site or off-site environmental incidents or other catastrophes; utility and transportation infrastructure disruptions; labor difficulties; other operational problems; pandemics; or war, acts of terrorism or other unexpected events. Any downtime or facility damage at our suppliers could prevent us from meeting customer demand for our products or require us to make more expensive purchases from a competing supplier. If our suppliers were to incur significant downtime, our ability to satisfy customer requirements could be impaired, resulting in customers seeking products and services from other sources, as well as decreased customer satisfaction and lower revenues. In addition, a loss of a supplier relationship could harm our operations. Because we purchase from a limited number of suppliers, the effects of any particular shutdown or facility damage or loss of a supplier relationship could be significant to our operating margins and our overall operations. In addition, our suppliers’ inability to produce or procure the necessary raw materials to supply finished goods to us may adversely impact our business, financial condition, results of operations and cash flows.
We rely on third-party license agreements. Any changes to these agreements could adversely affect our business.
We rely on third-party license agreements for certain trademarks and technologies we employ in our business, including software that we utilize in connection with our design and installation services that could be difficult to replace. There is a risk that third parties may modify or terminate such licenses, which may harm our operating results. Certain of the software we use is not licensed to us on an exclusive basis or is used jointly with our customers. Accordingly, if our licenses are terminated, or if our commercial relationships with the licensors and/or our customers become adverse, such software may be used by our customers or competitors to compete against us, which may, in turn, have a material adverse effect on our business, financial condition, results of operations and cash flows. In addition, while these license agreements generally provide that the licensors will indemnify us, subject to certain limitations, for certain infringement liabilities, our ability to seek indemnification from the respective licensors is limited by various factors, including the financial condition of the licensor as well as by the terms and limits of such indemnities or obligations. As a result, there can be no assurance that we could receive any indemnification from licensors, and any related infringement liabilities, costs or penalties could have a material adverse effect on our business, financial condition, results of operations and cash flows.
Our industry is both seasonal and cyclical and may be affected by severe weather conditions and a changing climate.
Our industry is both seasonal and cyclical. Seasonal changes and other weather-related conditions can adversely affect our businesses and operations through a decline in the demand for our services. Our products are
36
Table of Contents
installed near the end of the construction process and therefore typically lag housing starts by several months. Housing starts have historically been highest in the second and third quarters due to weather as well as seasonal selling peaks in most areas of the country. Accordingly, our sales are generally highest in the third and fourth quarters. We expect this seasonal pattern to continue, but it may be affected by volatility in the weather as well as in the new construction industry, including the impacts from the COVID-19 pandemic and changing climate conditions in the geographic markets we serve, and we can make no assurance as to the degree to which these historical patterns will continue, if at all.
Construction-based businesses are also generally cyclical. Our financial performance will be impacted by economic changes nationally and locally in the geographic markets we serve and is subject to cyclical market pressures. Our operations are subject to fluctuations arising from changes in supply and demand, national and international economic conditions, workforce costs, competition, government regulation, trade policies, and other factors that affect the construction industry such as demographic trends, interest rates, housing starts, average home selling prices, interior options and upgrades, commercial construction activity, employment levels, consumer confidence, and the availability of credit to homebuilders, contractors and homeowners.
Although our interior finish solutions relate primarily to the interior of buildings, severe weather and natural disasters can cause delays or halts and increased costs in the construction process. Severe weather is often unpredictable, which contributes to earnings volatility and makes forecasting our results of operation more difficult. Severe weather and volatility in seasonality, which is projected to be exacerbated by climate change, may have an adverse impact on our business, financial position, results of operations and cash flows, and our results of operations in any given period may not be necessarily representative of other periods. We may also expand into geographic markets that are disproportionately impacted by severe weather and adverse climate effects.
Our systems and IT infrastructure may be subject to security breaches and other cybersecurity incidents.
We rely heavily on our systems and IT infrastructure to interact with our customers and suppliers, including our design platform. The use of our systems and IT infrastructure involve the transmission and/or storage of valuable data, including in certain instances, customers’ confidential business information. Thus, maintaining the security of computers, computer networks and data storage resources is a critical issue for us and our customers, as security breaches could result in vulnerabilities and loss of and/or unauthorized access to confidential information. We may face attempts by experienced hackers, cybercriminals or others with unauthorized access to our systems to misappropriate our proprietary information and technology, interrupt our business, and/or gain unauthorized access to confidential information. The reliability and security of our IT infrastructure and software, and our ability to expand and continually update technologies in response to our changing needs, is critical to our business. Furthermore, our technology is integrated with homebuilder back office systems to help improve construction quality, decrease cycle times and increase customer stickiness. To the extent that any security disruptions or breaches result in a loss or damage to our data, it could cause harm to our reputation and cause customers to fear that their systems may be compromised. This could lead to some existing customers discontinuing doing, and prospective customers choosing not to do, business with us. We may also be subject to state or federal enforcement actions, which could result in fines, penalties and/or other liabilities and which may cause us to incur legal fees and costs, and/or additional costs associated with responding to the cyberattack. Increased regulation regarding cybersecurity may increase our costs of compliance, including fines and penalties, as well as costs of cybersecurity audits. Any of these actions could materially adversely impact our business, financial condition, results of operations and cash flows.
To date, to our knowledge we have not experienced a material breach that affected our IT systems. As cyberattacks become more sophisticated generally, we expect to incur significant costs to strengthen our systems to protect against outside intrusions and/or maintain insurance coverage related to the threat of such attacks. While we have invested in industry appropriate protections and monitoring practices of our data and IT to reduce these risks and continue to monitor our systems on an ongoing basis for any current or potential threats, there can be no assurance that our efforts will prevent breakdowns or breaches of our or our third-party providers’ databases or systems that could adversely affect our business.
37
Table of Contents
There is also a risk that our software or IT systems could be subject to a virus or other malware or a cyberattack or other security breach. The measures that we implement to reduce and mitigate this risk may not be effective. If such an event occurred, it could have a material adverse effect on our business, financial condition, results of operations and cash flows.
Any major disruption or failure of our information technology systems or our website, or our failure to implement technology effectively, could adversely affect our business and operations.
We rely on various information technology systems, owned by us and third parties, to manage our operations, maintain books and records, record transactions, provide information to management and prepare our financial statements. We own our core ERP system, which is a tier 1 ERP system from a global vendor, and we are in the process of completing our ERP implementation and the associated core technology tools across our company. Presently, more than 50% of our revenues are processed through our ERP system. When we complete the deployment in 2021, approximately 85% of our revenues will be transacted through this system. We also own our retail flooring specialty software systems that support the remaining 15% of our revenues.
Our human capital management system is a cloud-based SAAS offering by a nationally recognized vendor and our payroll and related tax filings are outsourced to an experienced nationally recognized vendor. To support our installation and field management processes, we utilize various proprietary and third-party software solutions with direct interfaces into our core ERP platform. Our web-based marketing and pre-sales systems have been developed in-house and are built on our proprietary technology. Our design studio solutions encompass our proprietary visualization platform and proprietary design software that is used to configure, price and quote at the end of the design process. Our interior option selection systems which are used during at-home or in-studio design sessions leverage both in-house and third-party technology. Our ERP system and all of our design systems, including any third-party components, are hosted on major cloud-computing platforms such as AWS and Azure. For our third-party technology, including software that we utilize in connection with our design and installation services, we rely on third-party license agreements with the software owners.
In addition, we have made a significant investment in our website which we believe is critical for lead generation and is the primary forum through which we interact with end consumers. As more business activities have shifted online, in part due to COVID-19 restrictions, a failure of internal or external information technology infrastructure or a cybersecurity attack could have a more significant impact on our business operations than in the past. A failure of our information technology systems or our website to operate as expected could disrupt our business and adversely affect our financial condition and results of operations. These systems and our website are vulnerable to damage from hardware failure; fire; power loss; Internet; data network and telecommunications failure; loss or corruption of data and impacts of terrorism; natural disasters or other disasters. We may not have sufficient redundant operations to cover a loss or failure in a timely manner. In addition, the operation of these systems and our website is dependent upon third party technologies, systems and services, and support by third party vendors, and we cannot be sure that these third party systems, services and support will continue to be available to us without interruption, particularly in light of the disruptions stemming from the COVID-19 pandemic. Any damage to our information technology systems or website could cause interruptions to our operations that materially adversely affect our ability to meet customers’ requirements, resulting in an adverse impact to our business, financial condition and results of operations. Periodically, these systems and our website need to be expanded, updated or upgraded as our business needs change. We may not be able to successfully implement changes in our information technology systems and to our website without experiencing difficulties, which could require significant financial and human resources.
Our fabrication operations involve significant risks.
A portion of our business involves the fabrication of certain products that we install, including countertops. We currently operate nine countertop fabrication facilities. These fabrication activities require significant resources to maintain. For instance, we must continuously review and improve our fabrication processes in order
38
Table of Contents
to maintain satisfactory yields and product performance, try to lower our costs and otherwise remain competitive. As we fabricate new and more complex products, the risk of encountering delays, difficulties or higher costs increases. In addition, the start-up costs associated with implementing new fabrication technologies, methods and processes, including the purchase of new equipment and any resulting delays and inefficiencies, could negatively impact our results of operations.
Additionally, we could experience a prolonged disruption, material malfunction, interruption or other loss of operations at our fabrication facilities, or we may need to add capacity to satisfy any increased demand for our products. Under these circumstances, we may be forced to rely on third parties for our fabrication needs, which could increase our costs, decrease our gross margin, decrease our control over fabrication processes, limit our ability to satisfy customer requirements and demand and delay new product development until we could secure a relationship with a third-party manufacturer, which we may not be able to do in a timely manner, on acceptable terms or at all. If any of these risks occur, our operations, performance and customer relationships could be severely harmed.
We also may need to expand our existing fabrication facilities or establish new facilities in the future. Any need to expand or replace our existing facilities would be expensive and time-consuming. Further, we may not be able to replace or increase our fabrication capacity at all. The occurrence of any of these events could have a material adverse effect on our business, financial condition and results of operations.
We operate our design studios and other facilities under leases with typical durations of three to five years. We may be unable to renew leases at the end of their terms or to terminate a lease if a homebuilder customer terminates a design studio services agreement.
Most of our design studios and other facilities are located in leased premises with typical lease durations of three to five years. At the end of the lease term and any renewal period, we may be unable to renew the lease without substantial additional cost, if at all. If we are unable to renew our design studio or other leases, we may be required to close or relocate such design studio or facility, which could subject us to construction, relocation and other costs, disruption of our operations and other risks, which in turn could have a material adverse effect on our business and results of operations.
Additionally, our leases are terminable only in certain circumstances. As a result of the COVID-19 pandemic, we have experienced a customer terminating its design studio services agreement and choosing to establish its own design studio capabilities. Although demand for our in-person design studio services has resumed at or above pre-COVID-19 levels, future mandatory shutdowns, or other government restrictions as a result of the spread of the virus could reduce demand for our in-person design studio services. We also may experience a reduction in demand from customers for our physical design studios in the future in order to transition to use of our technology-based design platforms or our competitors. If additional homebuilder customers terminate design studio services agreements, and we are unable to terminate a lease and/or be reimbursed for termination-related costs, we will be subject to costs associated with a vacant lease, which could have a material adverse effect on our business and results of operations.
The estimates and forecasts of market opportunity and market growth included in this prospectus may prove to be inaccurate, and we cannot assure you our business will grow at similar rates, or at all.
The interior finish solutions industry is a large, growing and highly fragmented market. We estimate the market to be approximately $23 billion in size, based on the average installed cost of flooring, cabinets and countertops in a new single-family home. However, estimates and forecasts of market size and opportunity and of market growth are subject to significant uncertainty and are based on assumptions and estimates that may not prove to be accurate. The estimates and forecasts in this prospectus of the size of the markets that we may be able to address and the growth in these markets are subject to many assumptions and may prove to be inaccurate. In addition, we expect that the COVID-19 pandemic may materially affect the growth of various of the markets
39
Table of Contents
discussed in this prospectus, and we cannot predict the extent to which those estimates will be affected. Further, we may not be able to address fully the markets that we believe we can address, and we cannot be sure that these markets will grow at historical rates or the rates we expect for the future. We believe that the long-term shift to digital solutions is fundamentally changing our market, with more homebuyers and homeowners preferring to review options and make design selections online. We may not be able to address this shift with a shift in our products and services as swiftly as the market’s demand. Even if we are able to address the markets that we believe represent our market opportunity and even if these markets experience the growth we expect, we may not grow our business at similar rates, or at all. Our growth is subject to many factors, including our success in implementing our business strategy, which is subject to many risks and uncertainties. Accordingly, the estimates and forecasts of market size and opportunity and of market growth included in this prospectus may not be indicative of our future growth.
Risks Related to Legal and Regulatory Matters
Changes in employment laws or failure to properly verify the employment eligibility of our employees may adversely affect our business.
Various federal and state labor laws govern the relationship with our employees and impact operating costs.
These laws include:
| • | employee classification as exempt or non-exempt for overtime and other purposes; |
| • | minimum wage requirements; |
| • | unemployment tax rates; |
| • | workers’ compensation rates; |
| • | immigration status; |
| • | mandatory health benefits; |
| • | paid leaves of absence, including paid sick leave; |
| • | tax reporting; and |
| • | other wage and benefit requirements. |
Significant additional government-imposed increases in the preceding areas could have a material adverse effect on our business, financial condition and results of operations.
In addition, various states in which we operate are considering or have already adopted new immigration laws or enforcement programs, and, from time to time, the U.S. Congress, Department of Homeland Security and the Executive Branch of the U.S. government consider and implement changes to federal immigration laws, regulations or enforcement programs. These changes may increase our compliance and oversight obligations, which could subject us to additional costs and make our hiring process more cumbersome, or reduce the availability of potential employees. Although we take steps to verify the employment eligibility status of all our employees, some of our employees may, without our knowledge, be unauthorized workers, and we cannot guarantee that we will properly identify all applicants who are ineligible for employment. Unauthorized workers are subject to deportation and may subject us to fines or penalties and adverse publicity that negatively impacts our brand and may make it more difficult to hire and retain qualified employees. Termination of a significant number of employees who were unauthorized employees may disrupt our operations, cause temporary increases in our labor costs as we train new employees and result in additional adverse publicity. We could also become subject to fines, penalties and other costs related to claims that we did not fully comply with all recordkeeping obligations of federal and state immigration laws. These factors could have a material adverse effect on our business, financial condition and results of operations.
40
Table of Contents
Furthermore, we are subject to regulations of U.S. Immigration and Customs Enforcement, or ICE, and Department of Labor, and we are audited from time to time by these parties for compliance with work authentication requirements. While we believe we are in compliance with applicable laws and regulations, if we are found not to be in compliance as a result of any audits, we may be subject to fines or other remedial actions, which could be material.
We are exposed to warranty, casualty, construction defect, contract, tort and other claims, and legal proceedings related to our business, the services we provide, and services provided for us by third parties.
In the ordinary course of business, we are subject to various claims and litigation. Any such claims, whether with or without merit, could be time consuming and expensive to defend and could divert management’s attention and resources. We may not always be able to successfully defend or be excused from the lawsuits related to these claims and could be subject to substantial losses.
Our customers may be subject to construction defect and warranty claims in the ordinary course of their business. Our contractual arrangements with these customers may include our agreement to defend and indemnify them against various liabilities. These claims, often asserted several years after completion of construction, can result in complex lawsuits or claims against our customers and many of their subcontractors, including us, and may require us to incur defense and indemnity costs even when our services or installed products are not the principal basis for the claims. In addition, we are exposed to potential claims arising from the conduct of our employees and subcontractors. In the process of negotiating contracts with our customers and our subcontractors, we may be unable to secure favorable indemnity, limitation of liability and/or insurance provisions.
We rely on manufacturers and other suppliers, including overseas suppliers, to provide us with the products for which we provide interior finish solutions. As we do not have direct control over the quality of the products manufactured or supplied by such third-party suppliers, we are exposed to risks relating to the quality of those products. It is possible that products from a manufacturer or supplier could be sold to our customers and later be alleged to have quality problems or to have caused personal injury, subjecting us to potential claims from customers or third parties. We have in the past been, and may in the future be, subject to such claims.
Although we currently maintain what we believe to be suitable and adequate insurance in excess of our self-insured amounts, there can be no assurance that we will be able to obtain and maintain insurance on acceptable terms, including premiums and deductibles, or that such insurance will provide adequate protection against potential liabilities. Construction defect, product liability and other claims and legal proceedings can be expensive to defend and can divert the attention of management and other personnel for significant periods, regardless of the ultimate outcome. Claims of this nature could also have a negative impact on customer confidence in our products and our company. In addition, we are involved on an ongoing basis in other types of legal proceedings. We cannot assure you that any current or future claims will not adversely affect our financial condition, results of operations or cash flows.
We may fail to adequately protect our intellectual property rights or may be accused of infringing the intellectual property rights of third parties.
We rely on trademark and service mark protection in the conduct of our business. We also rely on trade secret and copyright protection for certain of our IT systems and software, as well as contractual obligations with many customers, service providers and other business partners. These protections may not adequately safeguard our intellectual property and we may incur significant costs to defend our intellectual property rights, which may harm our operating results. There is a risk that third parties, including our current competitors, will infringe on our intellectual property rights, in which case we may have to defend these rights. There is also a risk that third parties will claim that our products and services infringe their intellectual property rights or that we are overusing or misusing licenses. These third parties may assert infringement claims against us, our customers, our employees or businesses we have acquired. Despite carrying insurance coverage to manage risk exposure for certain claims, the outcome of litigation or other legal proceedings intrinsically uncertain. These claims, if resolved in a manner adverse to us, could result in significant liabilities and could restrict or prohibit our ability to use the technology on which we rely, which could have a material
41
Table of Contents
adverse effect on our business, financial condition, results of operations and cash flows. Even if these claims are resolved in our favor, such claims result in significant expenses and could distract our management until resolved.
As we continue to expand our technology solutions, acquire companies and grow our team and business, we may be increasingly subject to claims and lawsuits, including intellectual property infringement claims, and threats to our intellectual property rights. We rely on a combination of laws and contractual restrictions on access to and use of confidential information and our proprietary technology with employees, contractors, business partners and other third parties to establish and protect our and their various intellectual property rights. No guarantees can be given that these efforts will result in adequate protections. Despite these measures, challenges to our intellectual property rights could still arise, third parties could copy or otherwise obtain and use our intellectual property without authorization, and/or laws regarding the enforceability of existing intellectual property rights could change or be applied in an adverse manner. In addition, to the extent that our employees, contractors, business partners or other third parties with which we do business use intellectual property owned by others in their work for us, we may be subject to third party infringement, breach of contract or misappropriation allegations given our relationships, with claims that could be expensive and timing-consuming to defend against, and with uncertain outcomes.
The occurrence of any of these events could impede our expansion and place limitations on our ability to operate our business, as well as impede our ability to effectively compete, any of which could adversely affect our business, financial condition and results of operations.
Compliance with occupational safety and health requirements and best practices can be costly, and noncompliance with such requirements may result in potentially significant penalties, operational delays and adverse publicity.
The fabrication and installation of building products may pose certain health and safety risks to our employees and subcontractors. For example, our countertop fabrication facilities are subject to regulations concerning air quality, including maximum permissible quantities of silica dust. Our operations are subject to regulation under the U.S. Occupational Safety and Health Act (“OSHA”) and equivalent state laws. Changes to OSHA requirements, or stricter interpretation or enforcement of existing laws or regulations, could result in increased costs. If we fail to comply with applicable OSHA regulations, even if no work-related serious injury or death occurs, we may be subject to civil or criminal enforcement and be required to pay substantial penalties, incur significant capital expenditures, or suspend or limit operations. Any accidents, citations, violations, injuries or failure to comply with industry best practices may subject us to adverse publicity, damage our reputation and competitive position and adversely affect our business. We have not in the past been subject to material fines or penalties, although we cannot assure that we will not be in the future. See also “Our Business—Regulatory Matters.”
Federal, state, local and other laws and regulations could impose substantial costs, liabilities and/or restrictions on our operations that would adversely affect our financial condition, results of operations and cash flows.
Our industry is subject to various federal, state and local statutes, ordinances, rules and regulations concerning zoning, building design and safety, construction, contractors’ licensing, energy conservation and similar matters. Difficulties or failures in obtaining required permits, licenses or other regulatory approvals could delay or prevent our interior product installation activity in a particular locale, and the suspension of, or inability to renew, a license or permit could interrupt previously contracted installation services. Regulatory restrictions and industry standards may require us to alter our supply chain management and installation processes, which could increase our operating expenses and negatively affect the level of construction activity of our customers, any of which could negatively affect our business, financial condition and results of operations.
We are also subject to employment regulations promulgated by the U.S. Equal Employment Opportunity Commission. More burdensome regulatory requirements in this or other areas, including workers’ compensation, may increase our expenses and adversely affect our business, financial condition, results of operations and cash flows. Moreover, failure to comply with the regulatory requirements applicable to our business could expose us to substantial fines and penalties that could adversely affect our business and reputation.
42
Table of Contents
We are also subject to various federal, state and local environmental laws, ordinances, rules and regulations including those promulgated by the United States Environmental Protection Agency and analogous state agencies. As current and former owners, lessees and operators of real property, we can be held liable for the investigation or remediation of contamination at or from such properties, in some circumstances irrespective of whether we knew of or caused such contamination. No assurance can be provided that investigation and remediation will not be required in the future as a result of spills or releases of petroleum products or hazardous substances, the discovery of currently unknown environmental conditions, more stringent standards regarding existing contamination, or changes in legislation, laws, ordinances, rules or regulations or their interpretation or enforcement. More burdensome environmental regulatory requirements may increase our costs and adversely affect our financial condition, results of operations and cash flows. See also “Our Business—Regulatory Matters.”
Changes in legislation and government policy may have a material adverse effect on our business, financial condition and results of operations.
Our markets are affected by legislative and regulatory policies that promote or do not promote home ownership, such as U.S. tax rules allowing for deductions of mortgage interest or interest on home equity loans. For example, the Tax Cuts and Jobs Act, which was enacted into law on December 22, 2017 (the “Tax Act”), imposes limitations on the deductibility of interest on mortgages qualifying of the home mortgage interest deduction. The Tax Act provides that taxpayers may only deduct interest on $750,000 of qualified residence loans, including home equity loans that are used to substantially improve the taxpayer’s home that secures the loan, a reduction from the prior limit of $1.0 million. As many consumers finance renovation projects that use our products with home equity loans, limitations on the deductibility of interest on those loans could reduce demand for our products. In addition, recent U.S. federal and state legislative and regulatory policies enacted in response to the COVID-19 pandemic provide various measures of relief for homeowners, primarily in the form of mortgage payment forbearance for homeowners with federally-backed mortgages and temporary moratoria on foreclosures and evictions. It remains uncertain whether or to what extent such relief measures could protect homeowners and what impact they will have on the U.S. real estate market and the U.S. and global economies generally, and our business, financial condition and results of operations may be materially and adversely affected as a result. Future changes to laws or policies relating to these or similar matters could reduce demand for our products and have a material adverse effect on our business, financial condition and results of operations.
Changes in international trade policy, increased regulation and any trade agreements or tariffs on imported products could negatively impact our business and results of operations if they seriously disrupt the movement of products through our supply chain or increase their cost. With the upcoming change in administration in January 2021, we are currently unable to predict whether any meaningful changes to existing legislative and regulatory environments relevant to our business will materialize, or if any such changes would favorably or unfavorably impact our business. To the extent that such changes have a negative impact on us or the industries we serve, these changes may materially and adversely impact our business, financial condition, result of operations and cash flows. We are also impacted by changes in local laws and policies in markets in which we operate, which could subject us to rules and regulations that are not uniform across our footprint.
We may be limited in our ability to use our net operating loss carryforwards, which could adversely affect our profitability.
We have state net operating loss carryforwards due to prior period losses, which could expire unused and be unavailable to offset future income tax liabilities, which could adversely affect our profitability. In addition, under Section 382 of the Internal Revenue Code of 1986, as amended (the “Code”), our ability to utilize net operating loss (“NOL”) carryforwards or other tax attributes in any taxable year may be limited if we experience an “ownership change.” A Section 382 “ownership change” generally occurs if one or more stockholders or groups of stockholders who own at least 5% of our stock increase their ownership by more than 50 percentage points over their lowest ownership percentage within a rolling three-year period. Similar rules may apply under state tax laws in the United States. It is possible that any future ownership changes or issuances of our capital stock, could have a material effect on the use of our NOL carryforwards or other tax attributes, which could adversely affect our future profitability.
43
Table of Contents
Contracting on government programs is subject to significant regulation, and any non-compliance could subject us to fines and penalties.
We are party to several contracts with federal, state and local governments and are subject to risks associated with this contracting, including substantial civil and criminal fines and penalties. These fines and penalties could be imposed for failing to follow procurement integrity and bidding rules, employing improper billing practices or otherwise failing to follow cost accounting standards, not complying with workforce obligations, receiving or paying kickbacks or filing false claims. We expect to be subjected to audits and investigations by federal, state and local governmental agencies and authorities. The failure to comply with the terms of our government contracts could harm our business reputation. It could also result in our progress payments being withheld or our suspension or debarment from future government contracts, which could have a material adverse effect on our results of operations.
Union organizing activity and work stoppages could delay or reduce demand for or availability of products that we install and negatively affect our results of operations.
None of our employees are currently covered by collective bargaining or other similar labor agreements. However, if our employees were to unionize, including as a result of any future legislation that makes it easier for employees to unionize, our business could be negatively affected.
In general, our customers do not have employees that are covered by collective bargaining or similar labor agreements. However, our customers conduct virtually all construction work through unaffiliated third-party subcontractors that in some instances have unionized employees. Any inability by our customers to negotiate collective bargaining arrangements could cause strikes or other work stoppages, and new contracts could result in increased operating costs. If any such strikes or other work stoppages occur, or if employees or other subcontractors become represented by a union, our customers could experience a disruption in their operations and higher labor costs, which could have an adverse effect on our results of operations.
In addition, certain of our suppliers have unionized employees, and certain of our products are transported by unionized truckers. Strikes, work stoppages or other labor disputes of our suppliers’ work forces or truckers could result in slowdowns or closures of facilities where the products for which we provide supply chain management and installation services are manufactured or could affect the ability of our suppliers to deliver such products to us. Any interruption in the production or delivery of these products could delay or reduce availability of these products and increase our costs or cause us to fail to meet a customer’s construction schedule.
Political and economic uncertainty and unrest in foreign countries where some of our direct and indirect suppliers are located could adversely affect our results of operations.
Our products and building materials are sourced directly and indirectly from a wide variety of suppliers, including certain overseas providers. Such products or materials may be imported because they are not available for domestic purchase in the United States, because of significantly reduced cost or because there is a shortfall of inventory available locally. Despite our efforts to ensure the merchantability of these products, such products may not adhere to U.S. standards or laws. We are subject to risks and uncertainties associated with changing economic and political conditions in the foreign countries from which we source, or in the future may source, any of our products, such as:
| • | increased import duties, tariffs, trade restrictions, and quotas; |
| • | work stoppages; |
| • | economic uncertainties (including inflation); |
| • | adverse foreign government regulations, government control, or sudden changes in laws and regulations; |
| • | wars, fears of war, and terrorist attacks; |
| • | pandemics and other global crises, including, without limitation, the COVID-19 pandemic; and |
44
Table of Contents
| • | political unrest. |
In addition, pricing of these products and materials may be impacted by changes to the relative value of the U.S. dollar over the applicable foreign currency in the long-term, which could negatively impact our margins. Importation of such products or materials could subject us to greater risk, including currency risk, and lawsuits by customers or governmental entities.
We cannot predict if, when, or the extent to which the countries in which we source our products and building materials will experience any of the above events. Any event causing a disruption, delay or cessation of imports from foreign locations would likely increase the cost or reduce the supply of products available to us, and cause us to seek alternative sources for our products, which may only be available on less advantageous terms, and would adversely affect our results of operations.
Risks Related to Our Indebtedness
Restrictions in our existing credit arrangements, or any other indebtedness we may incur in the future, could adversely affect our business, financial condition, results of operations, our ability to make distributions to stockholders and the value of our common stock.
Our Revolving Credit Facility and Term Loan Facility (each as defined herein), or any future credit facility or other indebtedness we enter into, may limit our ability to, among other things:
| • | incur or guarantee additional debt; |
| • | make distributions or dividends on or redeem or repurchase shares of common stock; |
| • | make certain investments and acquisitions; |
| • | incur certain liens or permit them to exist; |
| • | enter into certain types of transactions with affiliates; |
| • | guarantee leases; |
| • | acquire, merge or consolidate with another company; and |
| • | transfer, sell or otherwise dispose of all or substantially all of our assets. |
Our Revolving Credit Facility contains, and any future credit facility or other debt instruments we may enter into will also likely contain, covenants requiring us to maintain certain financial ratios and meet certain tests, such as a fixed charge coverage ratio, under certain circumstances. Our ability to comply with those financial ratios and tests can be affected by events beyond our control, and we may not be able to comply with those ratios and tests when required to do so under the applicable debt instruments. See “Management’s Discussion and Analysis of Financial Condition and Results of Operations—Liquidity and Capital Resources.”
The provisions of our Revolving Credit Facility, Term Loan Facility or other debt instruments may affect our ability to obtain future financing and pursue attractive business opportunities and our flexibility in planning for, and reacting to, changes in business conditions. In addition, a failure to comply with the provisions of our Revolving Credit Facility, Term Loan Facility, any future credit facility or other debt instruments could result in a default or an event of default that could enable our lenders or other debt holders to declare the outstanding principal of that debt, together with accrued and unpaid interest, to be immediately due and payable. If the payment of our debt is accelerated, our assets may be insufficient to repay such debt in full, and our stockholders could experience a partial or total loss of their investment.
We have, and may in the future incur, substantial indebtedness and could be subject to risks associated with incurring such indebtedness, which may adversely affect our business.
As of September 30, 2020, our total debt outstanding was approximately $383.5 million (net of original issue discount of $1.3 million and debt issuance costs of $7.6 million). Following this offering, we will have, and
45
Table of Contents
may in the future incur, substantial indebtedness and could be subject to risks associated with incurring such indebtedness, including:
| • | we could be required to dedicate a substantial portion of our cash flow from operations to making interest and principal payments on our indebtedness, thereby reducing the availability of our cash flow to fund working capital, capital expenditures and other general corporate purposes; |
| • | it may be more difficult and expensive to obtain additional funds through financings, if such funds are available at all; |
| • | we could be more vulnerable to economic downturns and fluctuations in interest rates, less able to withstand competitive pressures and less flexible in reacting to changes in our industry and general economic conditions; |
| • | we could be prevented from capitalizing on business opportunities; |
| • | if we default under any of our existing indebtedness or if our creditors demand payment of a portion or all of our indebtedness, we may not have sufficient funds to make such payments; and |
| • | we could be placed at a competitive disadvantage to less leveraged competitors. |
We and our subsidiaries may incur substantial additional indebtedness in the future, subject to the terms and restrictions contained in the agreements governing our indebtedness. If we or our subsidiaries incur additional indebtedness, the related risks that we and they now face could intensify.
Our ability to make scheduled payments on our existing indebtedness as well as any future indebtedness that we may incur and to fund planned capital expenditures and other liquidity needs will depend on our ability to generate cash from operations or asset sales as well as our ability to refinance our indebtedness on favorable terms, all of which are subject to economic, financial, competitive and other factors that are beyond our control. We may not generate sufficient funds to service our debt and meet our business needs, such as funding working capital or the expansion of our operations. We cannot assure you that our businesses will generate sufficient cash flow from operations or that future borrowings will be available to us through capital markets financings or under our credit facilities or otherwise in an amount sufficient to enable us to pay our indebtedness, or to fund our other liquidity needs. We cannot assure you that we will be able to refinance any of the indebtedness that we will incur on commercially reasonable terms, or at all. In addition, we may incur additional indebtedness in order to finance our operations or to repay our indebtedness. If we are not able to repay or refinance our debt as it becomes due, the lenders who hold our debt could accelerate amounts due which could potentially trigger a default or acceleration of the maturity of our other debt. Further, if we cannot service our indebtedness, we may have to take actions such as selling assets, seeking additional debt or equity or reducing or delaying capital expenditures, strategic acquisitions, investments and alliances. We cannot assure you that any such actions, if necessary, could be effected on commercially reasonable terms, or at all, or on terms that would be advantageous to our stockholders or on terms that would not require us to breach the terms and conditions of our existing or future financing arrangements.
Interest expense on debt we will incur may limit our cash available to fund our growth strategies.
Our current financing arrangements have, and any additional debt we subsequently incur may have, a variable rate of interest. Higher interest rates could increase debt service requirements on our current variable rate indebtedness and on any debt we subsequently incur, and could reduce funds available for operations, future business opportunities or other purposes. If we need to repay debt during periods of rising interest rates, we could be required to refinance our then-existing debt on unfavorable terms or liquidate one or more of our assets to repay such debt at times which may not permit realization of the maximum return on such assets and could result in a loss. The occurrence of either or both of such events could materially and adversely affect our cash flows and results of operations.
46
Table of Contents
The interest rates under our Revolving Credit Facility and Term Loan Facility are calculated using LIBOR. On July 27, 2017, the Financial Conduct Authority (the authority that regulates LIBOR) announced that it intends to stop compelling banks to submit rates for the calculation of LIBOR after 2021. It is unclear whether new methods of calculating LIBOR will be established such that it continues to exist after 2021. If LIBOR ceases to exist, the administrative agents under our Revolving Credit Facility and Term Loan Facility may replace LIBOR with one or more Secured Overnight Financing Rate (SOFR) values or another alternate benchmark rate, giving due consideration to any evolving or then-existing convention for similar U.S. dollar denominated syndicated credit facilities for such alternative benchmarks. The U.S. Federal Reserve, in conjunction with the Alternative Reference Rates Committee, is considering replacing U.S. Dollar LIBOR with a newly created index, calculated based on repurchase agreements backed by treasury securities. It is not possible to predict the effect of these changes, other reforms or the establishment of alternative reference rates in the United Kingdom, the United States or elsewhere. However, if LIBOR ceases to exist after 2021, the interest rates under the alternative rate could be higher than LIBOR. To the extent these interest rates increase, our interest expense will increase, in which event we may have difficulties making interest payments and funding our other fixed costs, and our available cash flow for general corporate requirements may be adversely affected.
Our Term Loan Facility bears interest at a variable rate, however interest rate hedges in place mitigate the risk of interest rate fluctuations associated with a portion of the outstanding debt balance. For some instruments, the method of transitioning to an alternative reference rate may be challenging, especially if we cannot agree with the respective counterparty about how to make the transition. If a contract is not transitioned to an alternative reference rate and LIBOR is discontinued, the impact on our contracts is likely to vary by contract. If LIBOR is discontinued or if the methods of calculating LIBOR change from their current form, interest rates on our current or future indebtedness may be adversely affected. While we expect LIBOR to be available in substantially its current form until the end of 2021, it is possible that LIBOR will become unavailable prior to that point. This could result, for example, if sufficient banks decline to make submissions to the LIBOR administrator. In that case, the risks associated with the transition to an alternative reference rate will be accelerated and magnified.
We may require additional capital in the future and may not be able to secure adequate funds on terms acceptable to us.
The expansion and development of our businesses may require significant capital, which we may be unable to obtain, to fund our capital expenditures, operating expenses, working capital needs, and potential strategic acquisitions. In accordance with our growth strategy, we may opportunistically raise additional equity or debt capital to help fund the growth of our businesses, subject to market and other conditions, but such capital may not be available to us on a timely basis, or at all, to meet our cash requirements. Further, our capital requirements may vary materially from those currently planned if, for example, our revenues do not reach expected levels or we have to incur unforeseen capital expenditures and make investments to maintain our competitive position. If this is the case, we may require additional financing sooner than anticipated or we may have to delay or abandon some or all of our development and expansion plans or otherwise forego market opportunities.
To a large extent, our cash flow generation ability is subject to general economic, financial, competitive, legislative and regulatory factors and other factors that are beyond our control. We cannot assure you that our businesses will generate cash flow from operations in an amount sufficient to enable us to fund our liquidity needs. As a result, we may need to refinance all or a portion of our debt on or before its maturity or obtain additional equity or debt financing. We cannot assure you that we will be able to do so on favorable terms, if at all. Any inability to generate sufficient cash flow, refinance our debt or incur additional debt on favorable terms could adversely affect our financial condition and could cause us to be unable to service our debt and may delay or prevent the expansion of our businesses.
47
Table of Contents
Risks Related to Our Company’s Organization and Structure
We are a holding company and conduct all of our operations through our subsidiaries.
We are a holding company and all of our operating assets are held by certain of our direct and indirect subsidiaries. We derive all of our operating income from our operating subsidiaries. We and our other holding company subsidiaries rely on the earnings and cash flows of our subsidiaries, which are paid to us by our operating subsidiaries in the form of dividends and other payments or distributions, to meet our debt service and other obligations. The ability of our subsidiaries to pay dividends or make other payments or distributions to us will depend on their respective operating results and may be restricted by, among other things, the laws of their jurisdiction of organization (which may limit the amount of funds available for the payment of dividends and other distributions to us), the terms of existing and future indebtedness, including the Term Loan Facility and the Revolving Credit Facility, and other agreements of our subsidiaries and the covenants of any future outstanding indebtedness that our subsidiaries incur.
Provisions of our charter documents and Delaware law could delay, discourage or prevent an acquisition of us, even if the acquisition would be beneficial to our stockholders, and could make it more difficult for our stockholders to change our management.
Our certificate of incorporation and bylaws that will be in effect immediately prior to the effectiveness of this registration statement may discourage, delay or prevent a merger, acquisition or other change in control that stockholders may consider favorable, including transactions in which stockholders might otherwise receive a premium for their shares of our common stock. In addition, these provisions may frustrate or prevent any attempt by our stockholders to replace or remove our current management by making it more difficult to replace or remove our board of directors. These provisions may include the following:
| • | a classified board of directors with three-year staggered terms; |
| • | no cumulative voting in the election of directors, which limits the ability of minority stockholders to elect director candidates; |
| • | the exclusive right of our board of directors to fill a vacancy created by the expansion of the board of directors or the resignation, death or removal of a director, which prevents stockholders from being able to fill vacancies on our board of directors; |
| • | the ability of our board of directors to authorize the issuance of shares of preferred stock and to determine the price and other terms of those shares, including preferences and voting rights, without stockholder approval, which could be used to significantly dilute the ownership of the holders of our stock or a hostile acquirer; |
| • | a prohibition on stockholder action by written consent, which forces stockholder action to be taken at an annual or special meeting of our stockholders; |
| • | a requirement that a special meeting of stockholders may be called only by the chairman of our board of directors, our Chief Executive Officer or upon a resolution approved by a majority of the total number of directors that we would have if there were no vacancies, and not by our stockholders; |
| • | advance notice procedures that stockholders must comply with in order to nominate candidates to our board of directors or to propose matters to be acted upon at a stockholders’ meeting, which may discourage or deter a potential acquirer from conducting a solicitation of proxies to elect the acquirer’s own slate of directors or otherwise attempting to obtain control of us; and |
| • | super-majority voting requirements to amend our bylaws and certain provisions of our certificate of incorporation. |
In addition, we will be subject to Section 203 of the Delaware General Corporation Law (the “DGCL”), which generally prohibits a Delaware corporation from engaging in any of a broad range of business combinations with a stockholder owning 15% or more of such corporation’s outstanding voting stock for a period
48
Table of Contents
of three years following the date on which such stockholder became an “interested” stockholder. This provision could have the effect of delaying or preventing a change of control, whether or not it is desired by or beneficial to our stockholders. Any delay or prevention of a change of control transaction or changes in our board of directors and management could deter potential acquirers or prevent the completion of a transaction in which our stockholders could receive a substantial premium over the then-current market price for their shares of our common stock. See “Description of Capital Stock—Anti-Takeover Effects of Provisions of our Charter, our Bylaws and Delaware Law.”
Our certificate of incorporation provides that the Court of Chancery of the State of Delaware is the exclusive forum for a wide range of disputes between us and our stockholders, which could limit our stockholders’ ability to obtain a favorable judicial forum for disputes with us or our directors, officers or employees.
Our certificate of incorporation provides that the Court of Chancery of the State of Delaware (or, if no state court located within the State of Delaware has jurisdiction, the federal district court for the District of Delaware) is the exclusive forum for the following types of actions or proceedings under Delaware statutory or common law: (i) any derivative action or proceeding brought on our behalf; (ii) any action asserting a claim of breach of a fiduciary duty owed by any of our directors, officers, employees or agents to us or our stockholders; (iii) any action asserting a claim arising pursuant to any provision of the DGCL or of our certificate of incorporation or our bylaws; (iv) any action or proceeding to interpret, apply, enforce or determine the validity of our certificate of incorporation or our bylaws (including any right, obligation or remedy under our certificate of incorporation or our bylaws); (v) any action asserting a claim against us or any of our directors, officers or other employees governed by the internal-affairs doctrine; or (vi) any action or proceeding as to which the DGCL confers jurisdiction to the Court of Chancery of the State of Delaware.
This provision does not apply to suits brought to enforce a duty or liability created by the Exchange Act or any other claim for which the U.S. federal courts have exclusive jurisdiction.
The exclusive-forum provisions also provide that, unless we consent in writing to the selection of an alternative forum, the federal district courts of the United States will be the exclusive forum for the resolution of any complaint asserting a cause of action arising under the Securities Act. Section 22 of the Securities Act created concurrent jurisdiction for federal and state courts over all suits brought to enforce any duty or liability created by the Securities Act or the rules and regulations thereunder. Accordingly, there is uncertainty as to whether a court would enforce this exclusive forum provision, and the enforceability of similar choice of forum provisions in other companies’ charter documents have been challenged in legal proceedings. While the Delaware courts have determined that such exclusive forum provisions are facially valid, a stockholder may nevertheless seek to bring a claim in a venue other than those designated in the exclusive forum provision, and there can be no assurance that such provision will be enforced by a court in those other jurisdictions. Any person or entity purchasing or otherwise acquiring any interest in our securities shall be deemed to have notice of and consented to this provision; however, we note that investors cannot waive our compliance with the federal securities laws and the rules and regulations thereunder.
These exclusive-forum provisions may limit a stockholder’s ability to bring a claim in a judicial forum that it finds favorable for disputes with us or our directors, officers or employees, which may discourage lawsuits against us and our directors, officers and employees.
Risks Related to this Offering, Being a Public Company and our Common Stock
Before this offering, there has been no public market for our common stock, and an active trading market for our common stock may not develop or be sustained, which could impede your ability to sell shares and depress the market price of your shares.
Prior to this offering, there has been no public market for our common stock. An active trading market for our common stock may not develop upon completion of this offering or, if it does develop, it may not be
49
Table of Contents
sustained. Furthermore, we cannot be certain that we will continue to satisfy the continued listing standards of Nasdaq.
Accordingly, no assurance can be given as to the following:
| • | the likelihood that an active trading market for our common stock will develop or be sustained; |
| • | the liquidity of any such market; |
| • | the ability of our stockholders to sell their shares of our common stock; or |
| • | the price that our stockholders may obtain for their common stock. |
If an active trading market does not develop or is not maintained, you may have difficulty selling any shares of our common stock that you purchase, and the value of such shares might be materially impaired. Even if an active trading market develops for our common stock, the market price may be highly volatile and subject to wide fluctuations. Our financial performance, government regulatory action, tax laws, interest rates and market conditions in general could have a significant impact on the future market price of our common stock. The initial public offering price of our common stock will be determined by negotiations between us and representatives of the underwriters and may not reflect the prevailing price in the open market. See “Underwriting” for a discussion of the factors considered in determining the initial public offering price.
The market price of our common stock may fluctuate substantially, and your investment may decline in value.
The initial public offering price for our common stock will be determined through negotiations among the underwriters and us, and may vary from the market price of our common stock following this offering. If you purchase shares of common stock in this offering, you may not be able to resell those shares at or above the initial public offering price. The market price of our common stock may fluctuate or decline significantly in response to numerous factors, many of which are beyond our control, including:
| • | the impacts of the COVID-19 pandemic on us and the national and global economies; |
| • | market conditions affecting the new single-family residential, building products, repair & remodel and related industries; |
| • | quarterly variations in our results of operations; |
| • | changes in market valuations of similar companies; |
| • | passage of legislation or changes in regulations, including tax and international trade policies; |
| • | the announcement of acquisitions by us or our competitors; |
| • | changes in general economic and political conditions; |
| • | volatility in the financial markets; |
| • | results of our operations and the operations of other companies in the homebuilding, building products and related industries; |
| • | changes in interest rates; |
| • | threatened or actual litigation and government investigations; |
| • | adverse market reaction to our level of indebtedness; |
| • | the addition or departure of key personnel; |
| • | actions taken by our stockholders, including the sale or disposition of their shares of our common stock; |
| • | speculation in the press or investment community; |
50
Table of Contents
| • | negative publicity regarding us specifically or our business generally; |
| • | differences between our actual financial and operating results and those expected by investors and analysts, and changes in analysts’ recommendations or projections; |
| • | passage of legislation or other regulatory developments that adversely affect us or the building products supply and services industry; and |
| • | natural disasters, pandemics, war, acts of terrorism and responses to these events. |
These and other factors may lower the market price of our common stock, regardless of our actual operating performance. As a result, our common stock may trade at prices significantly below the public offering price.
Furthermore, in recent years, the stock market has experienced significant price and volume fluctuations.
This volatility has had a significant impact on the market price of securities issued by many companies, including companies in our and related industries. The changes frequently appear to occur without regard to the operating performance of the affected companies. Hence, the price of our common stock could fluctuate based upon factors that have little or nothing to do with us, and these fluctuations could materially reduce the price of our common stock and materially affect the value of your investment.
The obligations associated with being a public company will require significant resources and management attention.
As a public company, we will face increased legal, accounting, administrative and other costs and expenses that we have not incurred as a private company. We expect to incur substantial incremental costs related to operating as a public company. After the completion of this offering, we will be subject to the reporting requirements of the Securities Exchange Act of 1934, as amended (the “Exchange Act”), which requires that we file annual, quarterly and current reports with respect to our business and financial condition, and proxy and other information statements. In addition, we will be subject to the rules and regulations implemented by the SEC, the Sarbanes-Oxley Act, the Dodd-Frank Act, the Public Company Accounting Oversight Board and , each of which imposes additional reporting and other obligations on public companies. As a public company, we will be required to:
| • | prepare and distribute periodic reports, proxy statements and other stockholder communications in compliance with the federal securities laws and Nasdaq rules; |
| • | expand the roles and duties of our board of directors and committees thereof; |
| • | meet independence and qualification requirements for our board of directors and committees thereof; |
| • | maintain an internal audit function; |
| • | institute more comprehensive financial reporting and disclosure compliance functions; |
| • | involve and retain to a greater degree outside counsel and accountants in the activities listed above; |
| • | enhance our investor relations function; |
| • | establish new internal policies, including those relating to trading in our securities and disclosure controls and procedures; |
| • | retain additional personnel; |
| • | comply with Nasdaq listing standards; and |
| • | comply with the Sarbanes-Oxley Act. |
We expect these rules and regulations and changes in laws, regulations and standards relating to corporate governance and public disclosure to increase legal and financial compliance costs and make some activities more
51
Table of Contents
time consuming and costly. Compliance with existing and evolving regulatory requirements will result in increased administrative expenses and may result in a diversion of management’s time and attention from revenue-generating activities to compliance activities, which could have a material adverse effect on our business, financial condition, results of operations and cash flows.
These increased costs will require us to divert a significant amount of money that we could otherwise use to expand our business and achieve our strategic objectives. We also expect that it will be expensive to maintain director and officer liability insurance, and we may be required to accept reduced policy limits and coverage or incur substantially higher costs to obtain the same or similar coverage. As a result, it may be more difficult for us to attract and retain qualified persons to serve on our board of directors or as executive officers. Furthermore, if we are unable to satisfy our obligations as a public company, we could be subject to delisting of our common stock, fines, sanctions and other regulatory action and civil litigation.
We will have broad discretion in the use of the net proceeds of this offering and may not use them effectively.
Our management will have broad discretion in the application of the net proceeds received by us from this offering. We may use the proceeds for any of the purposes described in “Use of Proceeds” or other purposes as determined from time to time by our management. You will not have the opportunity as part of your investment decision to assess whether the net proceeds are being used appropriately. Because of the number and variability of factors that will determine our use of the net proceeds from this offering, their ultimate use may vary substantially from their currently intended use. The failure by our management to apply these funds effectively could adversely affect our ability to operate and grow our business.
If we are unable to implement and maintain effective internal controls over financial reporting, investors may lose confidence in the accuracy and completeness of our financial reports, which could adversely affect the market price of our common stock.
We are not currently required to comply with Section 404 of the Sarbanes-Oxley Act (“Section 404”), and are therefore not required to make an assessment of the effectiveness of our internal controls over financial reporting for that purpose. However, as a public company, we will be required to maintain internal controls over financial reporting and to report any material weaknesses in such internal controls. In addition, we will be required to furnish a report by management on the effectiveness of our internal controls over financial reporting pursuant to Section 404, at the time of our second annual report on Form 10-K, which will be for our fiscal year ending December 31, 2021. We are in the process of designing, implementing and testing the internal controls over financial reporting required to comply with this obligation, which process is time consuming, costly and complex.
If (i) we are unable to design, implement and test our internal controls over financial reporting; (ii) we identify material weaknesses in our internal controls over financial reporting; (iii) we are unable to comply with the requirements of Section 404 in a timely manner or assert that our internal controls over financial reporting are effective; or (iv) our independent registered public accounting firm is unable to express an opinion as to the effectiveness of our internal controls over financial reporting, investors may lose confidence in the accuracy and completeness of our financial reports and the market price of our common stock could be negatively affected; and we could become subject to investigations by the SEC, Nasdaq or other regulatory authorities, which could require additional financial and management resources.
Future sales of our common stock, or the perception in the public markets that these sales may occur, may depress our stock price.
The market price of our common stock could decline significantly as a result of sales of a large number of shares of our common stock in the market after this offering. These sales, or the perception that these sales might
52
Table of Contents
occur, could depress the market price of our common stock or make it more difficult for us to sell equity securities in the future at a time and at a price that we deem appropriate.
Upon the completion of this offering, we will have shares of common stock outstanding (or shares if the underwriters exercise their option to purchase additional shares in full). The shares of common stock offered in this offering will be freely tradable, except for any shares of common stock that may be held or acquired by our directors, executive officers and other affiliates, the sale of which will be restricted under the Securities Act. In addition, upon completion of this offering, we intend to file a registration statement on Form S-8 under the Securities Act to register a total of shares of our common stock that may be issued under our equity incentive plans. Shares registered under such registration statements will become eligible for sale in the public market in the future, subject to certain legal and contractual limitations.
Moreover, pursuant to the Stockholders Agreement (as defined below) to be entered into among us, Littlejohn and Platinum, for so long as Littlejohn or Platinum continues to hold at least 20% of the outstanding shares of our common stock, it will have the right to require us to register the shares it holds in our company under the Securities Act. See “Certain Relationships and Related Party Transactions—Stockholders Agreement—Registration Rights.” If our existing stockholders sell substantial amounts of our common stock in the public market, or if the public perceives that such sales could occur, this could have an adverse impact on the market price of our common stock, even if there is no relationship between such sales and the performance of our business.
In connection with this offering, we, our directors and executive officers and holders of substantially all of our outstanding common stock have each agreed to certain lock-up restrictions. We and they will not, subject to certain exceptions, during the period ending 180 days after the date of the final prospectus for this offering, directly or indirectly, offer, sell, hypothecate, pledge, contract or agree to sell (including any short sale), grant any option to purchase or otherwise dispose of or agree to dispose of, enter into any hedging transaction relating to, or file (or participate in the filing of) a registration statement with the SEC in respect of, any shares of our common stock or any other securities that are substantially similar to the common stock, or publicly announce an intention to effect any transaction specified above. The representatives of the underwriters may, in their sole discretion, release all or any portion of the shares of our common stock from the restrictions in any of the lock-up agreements described above. See “Underwriting.”
We may issue shares of our common stock or other securities from time to time as consideration for future acquisitions and investments. If any such acquisition or investment is significant, the number of shares of our common stock, or the number or aggregate principal amount, as the case may be, of other securities that we may issue may in turn be substantial. We may also grant registration rights covering those shares of our common stock or other securities in connection with any such acquisitions and investments.
We cannot predict the size of future issuances of our common stock or the effect, if any, that future issuances and sales of our common stock will have on the market price of our common stock. Sales of substantial amounts of our common stock (including shares of our common stock issued in connection with an acquisition or under a compensation or incentive plan), or the perception that such sales could occur, may adversely affect prevailing market prices for our common stock and could impair our ability to raise capital through future sales of our securities.
Littlejohn and Platinum will continue to have significant ownership of our common stock and may have interests that conflict with those of our other stockholders.
Upon the completion of this offering, Littlejohn and Platinum will beneficially own approximately % and % of our common stock, respectively, assuming no exercise of the underwriters’ option to purchase additional shares of our common stock. So long as Littlejohn and Platinum continue to hold, directly or indirectly, shares of common stock representing a significant percentage of the voting power of our common stock, they will be able to exercise control over all matters requiring stockholder
53
Table of Contents
approval, including the election of directors, amendment of our certificate of incorporation and approval of significant corporate transactions, and will have significant control over our management and policies. This concentration of voting power may have the effect of delaying or preventing a change in control of us or discouraging others from making tender offers for our shares of common stock, which could prevent stockholders from receiving a premium for their shares of common stock. Certain corporate actions may be taken even if other stockholders oppose them. The interests of Littlejohn and Platinum may not always coincide with the interests of other stockholders, and Littlejohn and Platinum may act in a manner that advances their best interests and not necessarily those of our other stockholders. In addition, under our certificate of incorporation, Littlejohn and Platinum are permitted to pursue corporate opportunities for themselves, rather than for us. Littlejohn and Platinum have in the past, and may in the future, invest in and be affiliated with other companies in our and related industries. See “Description of Capital Stock—Corporate Opportunity.”
We may issue preferred securities, the terms of which could adversely affect the voting power or value of our common stock.
Our certificate of incorporation will authorize us to issue, without the approval of our stockholders, one or more classes or series of preferred securities having such designations, preferences, limitations, and relative rights, including preferences over our common stock respecting dividends and distributions, as our board of directors may determine. The terms of one or more classes or series of preferred securities could adversely impact the voting power or value of our common stock. For example, we might grant holders of preferred securities the right to elect some number of our directors in all events or on the happening of specified events or the right to veto specified transactions. Similarly, the repurchase or redemption rights or liquidation preferences we might assign to holders of preferred securities could affect the residual value of the common stock.
Purchasing shares of our common stock in this offering will result in an immediate and substantial dilution of your investment.
The initial public offering price of our common stock is substantially higher than the net tangible book value per share of our common stock. Therefore, investors purchasing shares of our common stock in this offering will pay a price per share that substantially exceeds the book value of our tangible assets after subtracting our liabilities. As a result, investors purchasing common stock in this offering will incur immediate dilution of $ per share (assuming no exercise of the underwriters’ option to purchase additional shares of our common stock), based on an assumed initial public offering price of $ per share, which is the midpoint of the price range set forth on the cover page of this prospectus. See “Dilution.”
Furthermore, if we raise additional capital or acquire new businesses by issuing new convertible or equity securities, your interest will be further diluted. This may result in the loss of all or a portion of your investment in our common stock. In addition, newer securities may have rights, preferences or privileges senior to those of securities held by investors in our common stock.
We do not expect to pay any dividends in the foreseeable future.
We currently intend to retain our future earnings, if any, in order to reinvest in the development and growth of our business and, therefore, do not intend to pay dividends on our common stock for the foreseeable future. Any future determination to pay dividends will be at the discretion of our board of directors and will depend on our financial condition, results of operations, capital requirements, the limits imposed by the terms of our Revolving Credit Facility and Term Loan Facility, or any then-existing debt instruments, and such other factors as our board of directors deems relevant. Accordingly, investors in our common stock may need to sell their shares to realize a return on their investment in our common stock, and investors may not be able to sell their shares at or above the prices paid for them.
54
Table of Contents
If securities analysts do not publish favorable reports about us or if we, or our industry, are the subject of unfavorable commentary, the price of our common stock could decline.
The trading price and volume for our common stock will depend in part on the research and reports about us that are published by analysts in the financial industry. Analysts could issue negative commentary about us or our industry, or they could downgrade our common stock. We may also not receive sufficient research coverage or visibility in the market. Any of these factors could result in the decline of the trading price of our common stock, causing investors in our common stock to lose all or a portion of their investment.
55
Table of Contents
INFORMATION REGARDING FORWARD-LOOKING STATEMENTS
This prospectus includes forward-looking statements within the meaning of U.S. federal securities laws, which involve risks and uncertainties. These forward-looking statements can be identified by the use of forward-looking terminology, including the terms “believe,” “estimate,” “project,” “aim,” “anticipate,” “expect,” “seek,” “predict,” “contemplate,” “continue,” “possible,” “intend,” “may,” “plan,” “objective,” “ongoing,” “potential,” “forecast,” “future,” “might,” “will,” “could,” “would” or “should” or, in each case, their negative, or other variations or comparable terminology. In particular, statements regarding the potential impact of the COVID-19 pandemic, statements about the markets in which we operate, including growth of our various markets, and our expectations, beliefs, plans, strategies, objectives, prospects, assumptions or future events or performance contained in this prospectus under the headings “Prospectus Summary,” “Risk Factors,” “Management’s Discussion and Analysis of Financial Condition and Results of Operations,” and “Business” are forward-looking statements.
These forward-looking statements include all matters that are not historical facts. They appear in a number of places throughout this prospectus and include statements regarding our intentions, beliefs or current expectations concerning, among other things, our results of operations, financial condition, liquidity, prospects, growth strategies, the industry in which we operate and potential acquisitions. We derive many of our forward-looking statements from our operating budgets and forecasts, which are based upon many detailed assumptions. While we believe that our assumptions are reasonable, we caution that it is difficult to predict the impact of known factors, and it is impossible for us to anticipate all factors that could affect our actual results. All forward-looking statements are based upon information available to us on the date of this prospectus.
By their nature, forward-looking statements involve risks and uncertainties because they relate to events and depend on circumstances that may or may not occur in the future. We caution you that forward-looking statements are not guarantees of future performance and that our actual results of operations, financial condition and liquidity, and the stability of the industry in which we operate may differ materially from those made in or suggested by the forward-looking statements contained in this prospectus. In addition, even if our results of operations, financial condition and liquidity and the development of the industry in which we operate are consistent with the forward-looking statements contained in this prospectus, those results or developments may not be indicative of results or developments in subsequent periods. Important factors that could cause our results to vary from expectations include, but are not limited to:
| • | the negative impacts of the COVID-19 pandemic on our business; |
| • | decreased new single-family residential construction activity; |
| • | downturns in the economy and credit markets; |
| • | decreased demand for interior option upgrades; |
| • | decline in the rate of growth in the housing market, in our geographic markets or of the homebuilding industry; |
| • | loss of, or decreased construction activity by, significant customers; |
| • | pricing pressures from customers; |
| • | changes in the cost of the products we install or in our product mix; |
| • | increased tariffs and other changes in foreign trade policy; |
| • | dependence on our senior management team and other key personnel; |
| • | inability to attract and retain qualified employees and the risks associated with our workforce supply and costs; |
| • | risks associated with completing the implementation of our ERP system and implementing other new initiatives for operating software; |
56
Table of Contents
| • | dependence on the availability and skill of subcontractors and the risks associated with our use of subcontractors; |
| • | inability to execute our growth strategy; |
| • | competitive pressures in our industry; |
| • | risks associated with acquisitions, including our ability to realize anticipated synergies or the costs of integrating acquisitions; |
| • | inability to expand into new geographic markets; |
| • | product shortages, loss of key suppliers, failure to develop relationships with qualified suppliers, material disruptions in our supply or substantial changes to supply terms; |
| • | reliance on third-party license agreements; |
| • | the effect of seasonality of our business, severe weather conditions and climate change; |
| • | cybersecurity risks; |
| • | disruptions in our IT systems and software; |
| • | changes in, or failure to comply with, federal, state, local and other laws and regulations; |
| • | exposure to claims and legal proceedings; |
| • | our failure to adequately protect our intellectual property rights; |
| • | risks related to our indebtedness; |
| • | our inability to maintain an effective system of internal controls and produce timely and accurate financial statements or comply with applicable regulations; |
| • | the obligations and increased costs associated with being a public company; |
| • | the significant ownership of our common stock by our Sponsors, whose interests may conflict with those of our stockholders; and |
| • | additional factors discussed under the sections captioned “Risk Factors,” “Management’s Discussion and Analysis of Financial Condition and Results of Operations” and “Our Business.” |
Other sections of this prospectus include additional factors that could adversely impact our business and financial performance. In light of these risks, uncertainties and assumptions, the forward-looking events described in this prospectus may not occur. Moreover, we operate in an evolving environment. New risk factors and uncertainties emerge from time to time, and it is not possible for our management to predict all risk factors and uncertainties, nor can we assess the impact of all factors on our business or the extent to which any factor, or combination of factors, may cause actual results to differ materially from those contained in any forward-looking statements. We qualify all of our forward-looking statements by these cautionary statements.
Estimates and forward-looking statements speak only as of the date they were made, and, except to the extent required by law, we undertake no obligation to update or to review any estimate and/or forward-looking statement because of new information, future events or other factors. Estimates and forward-looking statements involve risks and uncertainties and are not guarantees of future performance. As a result of the risks and uncertainties described above, the estimates and forward-looking statements discussed in this prospectus might not occur and our future results and our performance may differ materially from those expressed in these forward-looking statements due to, but not limited to, the factors mentioned above. Because of these uncertainties, you should not place undue reliance on these forward-looking statements when making an investment decision.
57
Table of Contents
We expect to receive net proceeds from this offering of approximately $ million, or approximately $ million if the underwriters exercise their option to purchase additional shares in full (assuming an initial public offering price of $ per share, which is the midpoint of the price range set forth on the cover page of this prospectus), after deducting the estimated underwriting discounts and commissions and estimated offering expenses payable by us.
We intend to use the net proceeds from this offering (including any additional proceeds that we may receive if the underwriters exercise their option to purchase additional shares of our common stock) to repay indebtedness outstanding under our Term Loan Facility, and the balance for general corporate purposes, including working capital, operating expenses and capital expenditures. We may also use a portion of the net proceeds we receive from this offering for acquisitions or other strategic investments, although we do not currently have any specific transactions at this time. However, we will have broad discretion over use of the net proceeds from this offering.
We entered into the Term Loan Facility in May 2018 in connection with the Business Combination and used the proceeds thereof to refinance the indebtedness of legacy ISI and legacy ILG and to pay related fees and expenses. As of September 30, 2020, we had an outstanding borrowing of $392 million under the Term Loan Facility. The Term Loan Facility matures in May 2025. Borrowings under the Term Loan Facility bear interest, at our option, at either (i) the base rate plus 3.00% per annum or (ii) LIBOR plus 4.00% per annum.
Each $1.00 increase (decrease) in the assumed initial public offering price of $ per share, which is the midpoint of the price range set forth on the cover page of this prospectus, would increase (decrease) the net proceeds received by us from this offering by approximately $ million, assuming the number of shares of our common stock offered by us, as set forth on the cover page of this prospectus, remains the same and after deducting the estimated underwriting discounts and commissions and estimated offering expenses payable by us.
We may also increase or decrease the number of shares we are offering. Each increase (decrease) of one million shares in the number of shares of our common stock offered by us would increase (decrease) the net proceeds received by us from this offering by approximately $ million, assuming an initial public offering price of $ per share, which is the midpoint of the price range set forth on the cover page of this prospectus, after deducting the estimated underwriting discounts and commissions and estimated offering expenses payable by us.
The information discussed above is illustrative only and subject to the actual public offering price and the actual number of shares sold in this offering.
58
Table of Contents
We currently do not anticipate paying dividends after this offering for the foreseeable future. Instead, we anticipate that our earnings will be used to provide working capital to support our operations and to finance the growth and development of our business. Any future determination relating to dividends will be made at the discretion of our board of directors and will depend on a number of factors, including our future earnings, capital requirements, financial condition, future prospects, contractual restrictions, legal requirements and other factors as our board of directors may deem relevant. The ability of our board of directors to declare any dividends will be subject to certain limits imposed by the terms of our Revolving Credit Facility, Term Loan Facility and any then-existing debt instruments.
59
Table of Contents
The following table describes our cash, cash equivalents and capitalization as of September 30, 2020:
| • | on an actual basis; and |
| • | on a pro forma basis to give effect to: |
| • | the payment of a special cash distribution of $31.8 million and $28.2 million to our membership equityholders, Faraday and ISH, respectively, or $60 million in the aggregate, in December 2020; |
| • | the Corporate Conversion; |
| • | the issuance and sale of shares of our common stock in this offering at an assumed initial public offering price of $ per share (the midpoint of the price range set forth on the cover page of this prospectus), after deducting the estimated underwriting discounts and commissions and estimated offering expenses payable by us; and |
| • | application of the net proceeds from this offering as described under “Use of Proceeds.” |
You should read this table in conjunction with the sections entitled “Use of Proceeds,” “Summary Historical Financial Data,” “Selected Historical Financial Data,” “Management’s Discussion and Analysis of Financial Condition and Results of Operations” and our consolidated financial statements and the related notes thereto included elsewhere in this prospectus. The table below does not give effect to any exercise by the underwriters of their option to purchase additional shares of our common stock.
| As of September 30, 2020 | ||||||||
| Actual | Pro Forma | |||||||
| (Unaudited) | ||||||||
| Cash and cash equivalents |
$ | 82,349 | $ | |||||
|
|
|
|
|
|||||
| Debt: |
||||||||
| Revolving Credit Facility(1) |
$ | — | $ | |||||
| Term Loan Facility |
383,040 | (2) | ||||||
| Other Long-term Debt |
434 | |||||||
|
|
|
|
|
|||||
| Total debt |
383,474 | |||||||
|
|
|
|
|
|||||
| Equity: |
||||||||
| Preferred stock, $0.01 par value: no shares authorized, issued and outstanding, actual; shares authorized, no shares issued and outstanding, pro forma |
— | |||||||
| Common stock, $0.01 par value: no shares authorized, issued and outstanding, actual; shares authorized, shares issued and outstanding, pro forma |
— | |||||||
| Additional paid-in capital |
314,994 | |||||||
| Accumulated deficit |
(18,005 | ) | ||||||
| Accumulated other comprehensive loss |
(6,277 | ) | ||||||
|
|
|
|
|
|||||
| Total equity |
290,712 | |||||||
|
|
|
|
|
|||||
| Total capitalization |
$ | $ | ||||||
|
|
|
|
|
|||||
| (1) | Provides for aggregate borrowings of up to $100 million. |
| (2) | Net of original issue discount of $1.3 million and debt issuance cost of $7.6 million. Includes the current portion of the Term Loan Facility. |
A $1.00 increase (decrease) in the assumed initial public offering price of $ per share (the midpoint of the price range set forth on the cover page of this prospectus) would increase (decrease) the pro forma amounts of each of cash, total equity and total capitalization by $ million, assuming that the number of shares offered by us, as set forth on the cover page of this prospectus, remains the same and after deducting estimated underwriting discounts and commissions and estimated offering expenses.
60
Table of Contents
A one million share increase (decrease) in the number of shares of common stock sold by us in this offering would increase (decrease) the pro forma amounts of each of cash, total equity and total capitalization by approximately $ million, assuming an initial public offering price of $ per share, the midpoint of the price range set forth on the cover page of this prospectus, and after deducting estimated underwriting discounts and estimated offering expenses.
The pro forma amounts discussed above are illustrative only and subject to the actual public offering price and the actual number of shares sold in this offering.
See “Prospectus Summary—The Offering” for a description of those shares that are or are not reflected as outstanding shares in the table above.
61
Table of Contents
Our pro forma net tangible book value as of September 30, 2020 was approximately $ million, or approximately $ per share. Pro forma net tangible book value per share represents the amount of our total tangible assets less the amount of our total liabilities, divided by the number of shares of common stock outstanding, prior to the sale by us of shares of common stock in this offering. Pro forma net tangible book value as of September 30, 2020 gives pro forma effect to the Corporate Conversion and the payment of a special cash distribution of $31.8 million and $28.2 million to our membership equityholders, Faraday and ISH, respectively, or $60 million in the aggregate, in December 2020.
After giving effect to the (i) sale by us of shares of common stock in this offering, based upon the assumed initial public offering price of $ per share, which is the midpoint of the price range set forth on the cover page of this prospectus, after deducting estimated underwriting discounts and commissions and estimated expenses payable by us in connection with this offering and (ii) application of the net proceeds from this offering as described under “Use of Proceeds,” our pro forma as adjusted net tangible book value as of September 30, 2020 would have been approximately $ million, or $ per share (assuming no exercise of the underwriters’ option to purchase additional shares of our common stock). This represents an immediate increase in pro forma net tangible book value of $ per share to existing stockholders and immediate dilution of $ per share to new investors purchasing shares of common stock in this offering at the assumed initial public offering price.
The following table illustrates this per share dilution.
| Assumed initial public offering price |
$ | |||||||
| Pro forma net tangible book value per share as of September 30, 2020 |
$ | |||||||
| Increase in pro forma net tangible book value per share attributable to new investors |
||||||||
|
|
|
|||||||
| Pro forma as adjusted net tangible book value per share as of September 30, 2020 |
||||||||
|
|
|
|||||||
| Dilution per share to new investors |
$ | |||||||
|
|
|
The dilution information discussed above is illustrative only and will change based on the actual initial public offering price and other terms of this offering determined at pricing. Each $1.00 increase or decrease in the assumed initial public offering price of $ per share would increase or decrease our pro forma as adjusted net tangible book value by approximately $ per share and increase or decrease dilution per share to new investors purchasing shares of common stock in this offering by $ , assuming that the number of shares offered by us, as set forth on the cover page of this prospectus, remains the same.
The following table sets forth, as of September 30, 2020, on a pro forma as adjusted basis as described above, the number of shares of our common stock purchased from us, the total consideration paid to us and the average price per share paid to us by existing stockholders and to be paid by new investors purchasing shares of our common stock in this offering. The table is based upon the assumed initial public offering price of $ per share, which is the midpoint of the price range set forth on the cover page of this prospectus, before deducting estimated underwriting discounts and commissions and estimated expenses payable by us in connection with this offering:
| Common Stock Purchased |
Total Consideration (in thousands) |
|||||||||||||||||||
| Number | Percent | Amount | Percent | Average Price Per Share |
||||||||||||||||
| Existing stockholders |
||||||||||||||||||||
| New investors |
% | $ | % | $ | ||||||||||||||||
|
|
|
|
|
|
|
|
|
|
|
|||||||||||
| Total |
100 | % | $ | 100 | % | $ | ||||||||||||||
|
|
|
|
|
|
|
|
|
|
|
|||||||||||
62
Table of Contents
A $1.00 increase (decrease) in the assumed initial public offering price of $ per share of common stock, which is the midpoint of the price range set forth on the cover page of this prospectus, would increase (decrease) total consideration paid by new investors in this offering by $ million and would increase (decrease) the average price per share paid by new investors by $ , assuming the number of shares of common stock offered, as set forth on the cover page of this prospectus, remains the same and without deducting the estimated underwriting discounts and commissions and offering expenses payable by us in connection with this offering.
If the underwriters exercise in full their option to purchase additional shares of our common stock in the offering, the following will occur (in each case assuming an initial public offering price of $ per share of common stock, which is the midpoint of the price range set forth on the cover page of this prospectus):
| • | the number of shares of our common stock held by new investors will increase to , or % of the total number of shares of our common stock outstanding after this offering; and |
| • | the pro forma as adjusted net tangible book value would be $ per share and the dilution to new investors in this offering would be $ per share. |
As of September 30, 2020, after giving effect to the Corporate Conversion and the payment of a special cash distribution of $31.8 million and $28.2 million to our membership equityholders, Faraday and ISH, respectively, or $60 million in the aggregate, in December 2020, shares of our common stock would be issuable upon the exercise of outstanding options at a weighted-average exercise price of $ per share. In addition, shares of our common stock will be reserved for future issuance under our 2021 Plan, which will be effective upon the completion of this offering. To the extent these options are exercised or these shares are issued, there will be further dilution to new investors. See “Executive Compensation—Equity Compensation Plans.”
We may choose to raise additional capital due to market conditions or strategic considerations even if we believe we have sufficient funds for our current or future operating plans. To the extent additional capital is raised through the sale of equity or convertible debt securities, the issuance of these securities could result in further dilution to our stockholders. See “Risk Factors—Risks Related to this Offering, Being a Public Company and our Common Stock—Purchasing shares of our common stock in this offering will result in an immediate and substantial dilution of your investment.”
63
Table of Contents
SELECTED HISTORICAL FINANCIAL DATA
The selected consolidated statements of comprehensive income (loss) data for fiscal years 2019, 2018 and 2017 and the selected consolidated balance sheet data as of December 31, 2019 and December 31, 2018 have been derived from our consolidated financial statements included elsewhere in this prospectus. The selected consolidated statement of comprehensive income (loss) data for fiscal years 2016 and 2015 and the selected consolidated balance sheet as of December 31, 2017, December 31, 2016 and December 31, 2015 have been derived from our consolidated financial statements not included in this prospectus. The selected consolidated statements of comprehensive income (loss) data for the nine months ended September 30, 2020 and September 30, 2019 and the selected consolidated balance sheet data as of September 30, 2020 have been derived from our unaudited consolidated financial statements included elsewhere in this prospectus. In the opinion of management, our unaudited consolidated financial statements were prepared on the same basis as our audited consolidated financial statements and include all adjustments necessary for a fair presentation of the financial information set forth in those statements.
Our historical results are not necessarily indicative of future operating results and our results for the nine months ended September 30, 2020 are not necessarily indicative of the results that may be expected for the full fiscal year or any other period. You should read the following selected historical financial data in conjunction with our consolidated historical financial statements and the related notes thereto, and with the sections titled, “Capitalization” and “Management’s Discussion and Analysis of Financial Condition and Results of Operations,” which are included elsewhere in this prospectus.
| Nine Months Ended September 30 |
Year Ended December 31 | |||||||||||||||||||||||||||
| (in thousands, except share |
2020 | 2019 | 2019 | 2018 | 2017 | 2016 | 2015 | |||||||||||||||||||||
| (Unaudited) | ||||||||||||||||||||||||||||
| Statements of Comprehensive Income (Loss) Data: |
||||||||||||||||||||||||||||
| Revenues |
$ | 1,231,855 | $ | 1,314,021 | $ | 1,785,388 | $ | 1,405,325 | $ | 851,918 | $ | 702,146 | $ | 390,962 | ||||||||||||||
| Cost of revenues |
941,552 | 1,026,120 | 1,390,606 | 1,099,337 | 670,274 | 538,164 | 302,972 | |||||||||||||||||||||
| Gross profit |
290,303 | 287,901 | 394,782 | 305,988 | 181,644 | 163,982 | 87,990 | |||||||||||||||||||||
| Selling, general and administrative(1) |
219,128 | 238,798 | 321,143 | 246,234 | 152,218 | 144,016 | 79,390 | |||||||||||||||||||||
| Amortization of intangibles |
42,636 | 47,486 | 63,545 | 40,843 | 9,080 | 10,286 | 9,267 | |||||||||||||||||||||
| Impairment of intangible assets and tradename(2) |
816 | — | — | 10,000 | — | — | — | |||||||||||||||||||||
| Total operating expenses |
262,580 | 286,284 | 384,688 | 297,077 | 161,298 | 154,302 | 88,657 | |||||||||||||||||||||
| Income (loss) from operations |
27,723 | 1,617 | 10,094 | 8,911 | 20,346 | 9,680 | (667 | ) | ||||||||||||||||||||
| Other expense: |
||||||||||||||||||||||||||||
| Interest expense |
(18,712 | ) | (22,321 | ) | (29,088 | ) | (22,238 | ) | (10,458 | ) | (11,033 | ) | (7,288 | ) | ||||||||||||||
| (Loss) on extinguishment of debt |
— | — | — | (3,068 | ) | (552 | ) | — | — | |||||||||||||||||||
| Other income, net |
1,488 | 9 | 8 | — | — | — | — | |||||||||||||||||||||
| Income (loss) before income taxes |
10,499 | (20,695 | ) | (18,986 | ) | (16,395 | ) | 9,336 | (1,353 | ) | (7,955 | ) | ||||||||||||||||
| Income tax benefit (expense) |
(2,552 | ) | 3,127 | 3,225 | 3,475 | 521 | 1,003 | 1,526 | ||||||||||||||||||||
| Net income (loss) |
$ | 7,947 | $ | (17,568 | ) | $ | (15,761 | ) | $ | (12,920 | ) | $ | 9,857 | $ | (350 | ) | $ | (6,429 | ) | |||||||||
| Net unrealized (loss) gain on derivative instrument |
(6,708 | ) | (108 | ) | 431 | — | (5 | ) | — | — | ||||||||||||||||||
| Comprehensive (loss) income |
$ | 1,239 | $ | (17,676 | ) | $ | (15,330 | ) | $ | (12,920 | ) | $ | 9,852 | $ | (350 | ) | $ | (6,429 | ) | |||||||||
| Net income (loss) per share (basic and diluted) |
$ | 7.95 | $ | (17.57 | ) | $ | (15.76 | ) | $ | (16.01 | ) | $ | 18.60 | $ | (0.66 | ) | $ | (12.13 | ) | |||||||||
| Weighted average number of shares outstanding (basic and diluted) |
1,000,000 | 1,000,000 | 1,000,000 | 806,849 | 530,000 | 530,000 | 530,000 | |||||||||||||||||||||
64
Table of Contents
| As of September 30 |
As of December 31 | |||||||||||||||||||||||
| (in thousands) |
2020 | 2019 | 2018 | 2017 | 2016 | 2015 | ||||||||||||||||||
| (Unaudited) | ||||||||||||||||||||||||
| Balance Sheet Data: |
||||||||||||||||||||||||
| Total current assets |
$ | 349,366 | $ | 300,458 | $ | 286,197 | $ | 133,862 | $ | 132,939 | $ | 79,704 | ||||||||||||
| Property, plant and equipment, net |
49,385 | 53,688 | 58,001 | 31,578 | 24,838 | 8,481 | ||||||||||||||||||
| Intangible assets, net |
263,592 | 300,744 | 354,388 | 56,437 | 63,440 | 70,025 | ||||||||||||||||||
| Goodwill |
266,847 | 253,977 | 249,849 | 72,273 | 69,778 | 68,145 | ||||||||||||||||||
| Total assets(3) |
999,997 | 986,442 | 956,642 | 299,030 | 299,720 | 228,487 | ||||||||||||||||||
| Total current liabilities |
225,634 | 201,857 | 195,117 | 111,112 | 117,376 | 67,211 | ||||||||||||||||||
| Long-term debt, net of current portion |
380,946 | 382,249 | 384,319 | 90,848 | 88,479 | 86,938 | ||||||||||||||||||
| Total liabilities(3) |
709,285 | 682,206 | 638,412 | 211,309 | 222,419 | 167,353 | ||||||||||||||||||
| Total stockholders’ equity |
$ | 290,712 | $ | 304,236 | $ | 318,230 | $ | 87,721 | $ | 77,301 | $ | 61,134 | ||||||||||||
| (1) | Selling, general and administrative also includes depreciation and amortization, acquisition-related expenses, integration expenses, and management fees and expenses. |
| (2) | Represents amounts for impairment of intangibles ($816 for September 30, 2020) and trade name ($10,000 for the year ended December 31, 2018). |
| (3) | On January 1, 2019, we adopted ASU 2016-02, Leases, and recognized total right of use assets of $68.5 million and total lease liabilities of $71.0 million related to our operating and finance leases. |
65
Table of Contents
MANAGEMENT’S DISCUSSION AND ANALYSIS OF FINANCIAL CONDITION AND RESULTS OF OPERATIONS
You should read the following in conjunction with the sections of this prospectus captioned “Risk Factors,” “Information Regarding Forward-Looking Statements,” “Selected Historical Financial Data” and “Our Business” and our consolidated financial statements and the related notes thereto included elsewhere in this prospectus. This discussion contains forward-looking statements reflecting current expectations that involve risks and uncertainties. Actual results and the timing of events may differ materially from those contained in these forward-looking statements due to a number of factors, including those discussed in the section captioned “Risk Factors” and elsewhere in this prospectus.
Overview
We are the leading national provider of technology-enabled sales and marketing, design and installation solutions for homebuilders. Our robust technology platform delivers interior design visualization, interior option selection, supply chain management and data analytics solutions from initial homebuyer engagement through the construction and delivery of homes. We are also the leading national installer for select high-value and aesthetically important interior finishes, such as flooring, cabinets and countertops, to our homebuilder customers, as well as multi-family, commercial and repair & remodel customers. Our scalable technology solutions enhance the homebuying experience, streamline the homebuying process and have the ability to meaningfully drive homebuyer satisfaction, while improving homebuilders’ profitability, construction quality and cycle times. We serve national, regional and local homebuilders across the home price spectrum, from entry-level to move-up and luxury homes, including each of the 20 largest U.S. homebuilders. We have the leading position in the estimated $23 billion U.S. new home interior finish solutions industry. We generated 2019 revenues, net loss and Adjusted EBITDA of $1,785.4 million, $(15.8) million and $123.2 million, respectively.
Our design studio solutions include a full suite of design, supply chain management and installation services. We operate dedicated builder-branded and shared ILG-branded design studios, interfacing directly with homebuyers in the design process. Our builder direct solutions include supply chain management and installation services for homebuilders. For our multi-family, commercial and repair & remodel customers, we provide supply chain management and installation services for new multi-family and light commercial contractors, multi-family owners and operators, senior living operators, single-family rental operators and single-family repair and remodel customers, and home improvement retailers. The Company’s operating segments are aggregated into a single reportable segment based on the uniformity of our products and services and the similar operating and economic characteristics of our business.
Key Factors Affecting our Operating Results
New single-family residential construction activity
Approximately 82.2% and 79.5% of our revenues for the nine months ended September 30, 2020 and September 30, 2019, respectively, were derived from sales to the new single-family residential market. Accordingly, our business is driven primarily by the new single-family residential market, which is in turn dependent upon a number of factors, including demographic trends, new home average selling prices, mortgage interest rates, consumer confidence, employment rates, foreclosure rates, age of existing housing stocks, availability of rental housing, the availability of skilled construction labor, and the health of the economy and mortgage markets. Housing starts remain below their long-term historical average and, according to the NAHB, are projected to grow at a 3.9% CAGR from 2020 to 2022. According to the NAHB and the U.S. Census Bureau, since 2011, cumulative net U.S. household formations have exceeded total housing starts by greater than 1.5 million units, leading to a significant backlog of demand for new housing.
We expect the continued growth in the overall population, the aging of approximately 70 million millennials into their prime household formation and homeownership years, and the long-term effects of the COVID-19
66
Table of Contents
pandemic to provide support for continued growth in new single-family residential construction. As millennials continue to form households in greater numbers, their home ownership rate is expected to become more aligned with the levels of other home-owning generations. Accordingly, we believe there remains significant potential for growth in this market, which we believe will favorably impact our market opportunity and results of operations.
Multi-family, commercial and repair & remodel activity
The multi-family new construction market has experienced strong growth since the 2007-2009 recession. According to the NAHB, multi-family housing starts are expected to be approximately 393,000 in 2020, and the outlook for multi-family construction suggests sustained new build activity in line with historical levels, supported by stable underlying industry and demographic trends.
We also serve the commercial construction market, primarily focusing on hotels, senior living facilities and light commercial contractors. According to the AIA, non-residential construction spend is estimated to be approximately $400 billion in 2020.
The residential repair & remodel market has been growing at a 4% CAGR since 2014. According to the Joint Center for Housing Studies of Harvard University, homeowner improvement and repair spend is expected to be approximately $338 billion in 2020. As new home construction has lagged historical build averages over the last decade, the average home age has steadily increased to over 40 years in the U.S. We believe that the disconnect between the age of existing housing inventory and the tastes of the most active homebuying generation, the millennial generation, will continue to drive repair & remodel demand. The market is also supported in the near term by a greater portion of the population staying at home due to the COVID-19 pandemic and spending incremental income on home repairs and renovations. Our core categories (flooring, cabinets and countertops) are typically high-priority items for homeowners to renovate due to their high visibility.
We also expect continued growth in the multi-family repair & remodel market, driven primarily by the age of the housing base, with approximately 80% of the multi-family housing base built before 2000 as well as growth in demand for multi-family housing. In the multi-family repair & remodel market, we expect to benefit from the increasing stream of repair & remodel work that will be required as a result of the aging of the multi-family housing base. In addition, we serve the single-family rental repair & remodel market, and believe we will benefit from the recent and continuing consolidation among single-family rental operators due to our national scale.
Long-term trends and expectations in the homebuilding industry
Over the past ten years, the homebuilding industry has undergone significant consolidation, and the larger homebuilders have increased their market share. We are aligned with this trend, as we service each of the U.S. top 20 homebuilders. We expect this consolidation trend to continue as larger homebuilders have better liquidity and land positions relative to the smaller, less capitalized homebuilders. We expect that this continued consolidation may result in competitive pressures related to servicing large homebuilders with certain profitability expectations. Our focus is on expanding relationships and market share with large national and regional homebuilders.
Overall economic conditions in the markets where we operate
Economic changes, both nationally and locally in the markets we serve, impact our financial performance. Unfavorable changes in demographics, credit markets, consumer confidence, health care costs, housing affordability, housing inventory levels, mortgage interest rates, a weakening of the national economy or of any regional or local economy in which we operate and other factors beyond our control could adversely affect consumer spending, result in decreased demand for homes and/or interior options and upgrades, which could adversely affect our business. We believe continued employment growth, prospective homebuyers’ access to
67
Table of Contents
financing and strong consumer confidence will be necessary to increase household formation rates and spending on interior options. We believe improved household formation rates in turn will increase demand for housing and stimulate residential new construction, repair & remodel activity and sales of interior options. In addition, we believe we will continue to see increased repair and remodel activity and demand for interior options in 2021 as a result of consumers spending more time at home during the ongoing COVID-19 pandemic. See also “COVID-19 Impacts” below in this management’s discussion and analysis of financial condition and results of operations (“MD&A”).
Product and service mix
Our performance is impacted by the type and quantity of interior options and upgrades that homebuyers select, as well as the type of service and products, such as flooring, countertops or cabinets, we provide to the homebuilder. Economic conditions and consumer preferences may impact homebuyer spending on interior options and, in turn, our margins. In addition, shifts in our service mix between design studio solutions and supply chain management and installation services can impact performance, as our design studio solutions typically generate higher margins.
Materials costs
We purchase a majority of the materials that we install, including flooring, cabinets, countertops and sundries, from manufacturers and distributors. We purchase the majority of our material on a project-specific basis, and therefore, our inventory on hand is a metric that we use to manage working capital. For the nine months ended September 30, 2020 and the year ended December 31, 2019, our inventory on hand was 24.3 days and 23.2 days, respectively. We are the largest new single-family residential customer for many of our suppliers, which we believe allows us to achieve favorable pricing, product selection and supply chain efficiency relative to our competitors. As a result of our national scale and long-standing supplier relationships, we believe we will continue to have access to an adequate supply of these materials at favorable prices to keep up with the growing demand for our services as the housing market recovers. Prices for our products have generally been subject to cyclical market fluctuations and track the health of the U.S. new single-family residential market. In addition, the imposition of tariffs on certain materials in 2018 has increased our product costs. In the event that we are required to pay higher prices for the products that we install, due to the competitive nature of our industry, we may have limited, if any, ability to pass on price increases in a timely manner or at all. In the past, we have generally been able to buy favorably compared to our competitors, source alternative products or pass on price increases to our customers over time. Our supply agreements generally have not contained restrictions on our ability to pass on price increases, but future supply agreements may contain such restrictions.
Workforce costs
Our business is workforce intensive. With respect to the installation workforce, we primarily contract with independent subcontractors to perform the installation of products that we offer to our customers. Accordingly, the timing and quality of our installations depends on the availability and skill of independent subcontractors. Depending on market conditions, we may find it necessary to augment our workforce with additional independent subcontractors to ensure we can meet customer demand. Tight workforce markets for independent subcontractors have increased, and may continue to increase, our workforce costs related to independent subcontractors and make it more difficult for us to contract with independent subcontractors who can perform on time and in a high-quality manner. In a few of our markets, we utilize our employees rather than independent subcontractors to perform installation services. Our ability to adequately recruit and retain employees across our entire business is subject to market pressures. Accordingly, we offer a comprehensive benefits package to our employees, which many of our local competitors are not able to provide and which will increase our costs as we hire additional personnel. As a result, our costs will increase if our workforce grows.
68
Table of Contents
Operating costs
Our costs incurred for operational support, sales, design, general management and administrative functions represent a significant component of our operating results. As we continue to grow organically and through acquisitions, we expect our operating and administrative costs will increase on an absolute basis but decrease as a percentage of total revenues. Integrating acquisitions and continuing to implement scalable technology and process improvements will be integral to increasing efficiency and gaining economies of scale. In addition, we expect to incur incremental annual costs related to operating as a public company. We also expect to continue to incur incremental costs, at least in the short-term, relating to COVID-19, which is discussed more below.
Acquisition and integration costs
In addition to our organic growth, we have grown, and expect to continue to grow, our business through acquisitions in an effort to better service our existing customers and to attract new customers. These acquisitions have allowed us to increase our density and leadership positions in existing local markets, enter into attractive new geographic markets and expand our portfolio of services. In accordance with GAAP, the results of the acquisitions we have completed are reflected in our financial statements from the date of acquisition forward and will therefore affect the comparability of our results of operations on a year-over-year basis.
We incur transaction costs in connection with identifying and completing acquisitions and ongoing integration costs as we integrate acquired companies and seek to achieve synergies. We may also incur impairment charges and record impairment of goodwill or intangible assets in connection with our acquisitions. We have completed over 18 acquisitions since 2013. Our more recent acquisitions are described below in this MD&A.
Seasonality and Cyclicality
Our business is both seasonal and cyclical. Our products are installed near the end of the construction process and therefore typically lag housing starts by several months. Housing starts have historically been highest in the second and third quarters due to weather as well as seasonal selling peaks in most areas of the country. Accordingly, our sales are generally highest in the third and fourth quarters. We expect this seasonal pattern to continue, but it may be affected by volatility and changes in the weather and climate, as well as in the new construction industry, including the impacts from the COVID-19 pandemic, and we can make no assurance as to the degree to which our historical seasonal patterns will continue, if at all.
Construction-based businesses are also generally cyclical. Our financial performance will be impacted by economic changes nationally and locally in the geographic markets we serve and is subject to cyclical market pressures. Our operations are subject to fluctuations arising from changes in supply and demand, national and international economic conditions, workforce costs, competition, government regulation, trade policies, and other factors that affect the construction industry, such as demographic trends, interest rates, housing starts, average home selling prices, interior options and upgrades, commercial construction activity, employment levels, consumer confidence, and the availability of credit to homebuilders, contractors and homeowners.
COVID-19 Impacts
In the second and third quarter of 2020, the U.S. economy was negatively impacted and unemployment rose significantly as a result of state and municipal government efforts to contain the spread and human toll of the COVID-19 pandemic. While the economy is still recovering from these containment measures, the homebuilding and construction industries were primarily impacted from mid-March 2020 through April 2020. Despite this shorter-than-expected stalling of activity, our customers’ new single-family residential sales during March through May 2020 slowed. By the end of April, most states and municipalities across the country deemed housing and construction as essential services. Beginning late in the second quarter, the market for new single-
69
Table of Contents
family homes began to steadily strengthen in many areas of the country, likely as a result of low interest rates and short supply, together with what appeared to be an increasing desire by many people to move out of crowded urban areas into new homes in the suburbs and even rural areas. The strength in the residential construction market may also be partially attributable to built-up demand from the earlier part of the second quarter when more restrictive stay at home orders were in place in many markets and when public concern over COVID-19 was at a peak.
The housing construction industry has experienced unique labor and material constraints due to COVID-19. We have seen material delays in our suppliers’ ability to produce and deliver a wide variety of construction-related raw materials and goods, from concrete to appliances. In addition, the construction labor associated with the front-end services struggled in the second and third quarter of 2020 to source crews and maintain schedules in light of COVID furloughs and layoffs, coupled with surprisingly strong housing demand. Because our services are provided later in the construction cycle, front-end trade delays have resulted in schedule date pushbacks for the provision of our services, which have extended the construction cycle time and adversely impacted our results for the three months ended September 30, 2020. Before the onset of COVID-19, we typically completed our services and recognized revenue within a range of 4 to 6 months following the date when our customers sell a home to a homebuyer. During the three months ended September 30, 2020, we saw this cycle time extend as much as 30 days. We expect similar extensions of the cycle time for the remainder of 2020 and believe it may continue through the first half of 2021. In addition, we saw a divergence between housing starts and housing completions during the third quarter of 2020. This divergence indicates a growing builder backlog. This growing backlog has put additional strains on a housing market recovering from construction pauses, construction furloughs and layoffs and supply chain delays across our major suppliers. Moreover, our multi-family repair and remodel business was adversely affected because COVID limited our access to senior living facilities and owner-occupied homes for repairs and remodeling. Our senior living facilities business continues to be significantly impacted by COVID-19, as many of these facilities have restrictions from the facilities or governmental authorities that hinder our repair and remodel activities.
Since the onset of the COVID-19 pandemic, we have been focused on protecting our employees’ health and safety, meeting our customers’ needs as they navigate an uncertain financial and operating environment, working closely with our suppliers to protect our ongoing business operations and rapidly adjusting our short-, medium- and long-term operational plans to proactively and effectively respond to the current and potential future public health crises. We have implemented measures to mitigate the impact of the COVID-19 pandemic on our business, financial condition and results of operations, including reducing expenses through cash conservation activities, such as a 60-day furlough of 8% of our workforce, temporary suspension of our 401k plan employer match, temporary wage reductions for executives, reduction of approximately 10% of our workforce as volume slowed down, and elimination of non-essential travel, and expanding the use of our technology-enabled design services in place of in-person design studio services. We expect that these measures may not fully mitigate the impact of the COVID-19 pandemic.
We cannot predict the degree to, or the period over, which we will be affected by the pandemic and resulting governmental and other measures. We expect that the economic effects of the COVID-19 pandemic will likely continue to adversely affect construction cycle times over the balance of fiscal 2020 and through the first half of fiscal 2021. While the COVID-19 pandemic continues to present concerns for our business and operations, our employees and their families, our customers and our suppliers, we believe that we have adapted well to the wide-ranging changes that the U.S. economy is currently undergoing, and we remain confident that we will continue to maintain business continuity, provide our services safely and in compliance with applicable laws and governmental orders and mandates, maintain our flexible supply chains and be in a position to maintain financial flexibility even in the event of a potentially extended economic downturn. We believe that we are in a strong market position to capitalize on increased housing demand and housing starts and the industry’s drive to work out the material and supply chain delays impacting build cycle that have resulted from COVID-19. The global impact of the COVID-19 pandemic continues to evolve, and we will continue to monitor the situation closely. As the COVID-19 pandemic continues, it may also have the effect of heightening many of the risks described in
70
Table of Contents
“Risk Factors” in this prospectus. See “Risk Factors” for a further discussion of the adverse impacts of the COVID-19 pandemic on our business.
2018 Business Combination
On May 31, 2018, we consummated the Business Combination, where legacy ISI acquired legacy ILG and combined under a new holding company, ILG Holdings. Prior to the Business Combination, for the fiscal year ended December 31, 2017, legacy ILG had revenues of $566 million and nearly 1,600 employees, while legacy ISI had revenues of $852 million and nearly 2,600 employees. At the time of the Business Combination, legacy ILG was legacy ISI’s largest direct competitor. The Business Combination increased our scale, geographic diversification, and product offerings. See “The Business Combination” for additional information.
2020 Acquisition of Roomored
On July 23, 2020 we acquired the remaining outstanding equity interests of Roomored, Inc., a company that provides online visualization technology focused on increasing buyer engagement in the new home sale and design process for a total of $16.5 million. We expect the technology to enhance our homebuilder customers’ marketing and sales, particularly during the COVID-19 pandemic and beyond, by providing homebuilders alternative tools to serve their clients, in addition to model homes and design studios. The technology allows homebuilders to offer photo-realistic virtual home tours as a marketing tool, accelerating the pre-marketing window for each community, eliminating the need for time-consuming in-person tours, and potentially eliminating the need to build costly model homes for every community and shortening the overall sales cycle. We also expect the technology to enhance the experience of the homebuyer. Our option selection tools utilize visualization and real-time pricing technology to create a personalized, user-friendly design experience customized to the homebuyer’s community, floor plan and budget and allows the homebuyer to conveniently browse thousands of customized product options in advance of design appointments – whether in-person or virtual. Roomored’s visualization capabilities enhance the visual solutions we were already providing to our homebuilder customers.
Other 2019 and 2018 Acquisitions
Closs Enterprises, Inc.
On August 1, 2019, we acquired substantially all of the assets of Closs Enterprises, Inc. dba Flooring Systems (“Flooring Systems”), a full service commercial and residential installation services, design services and design center business for interior finishes, for $3.3 million. With this acquisition, we expanded our presence in the Texas market.
Mike’s Flooring Companies, Inc.
On September 1, 2019, we acquired substantially all of the assets of Mike’s Flooring Companies, Inc., Mike’s Carpets of Virginia, Inc., Mike’s Carpets of Florida, LLC and Potomac Flooring Covering, Inc. (collectively, “Mike’s Flooring”), a full service commercial and multi-family flooring installation sales and services business for carpet, tile and vinyl flooring, hardwood flooring, flooring and floor covering, for $9.0 million. As a result of this acquisition, we expanded our presence in Virginia, Florida, North Carolina, New Jersey, Rhode Island and Georgia.
Chris & Dick’s
On May 1, 2018, we acquired substantially all of the assets of Chris & Dick’s Cabinets and Countertops LLC, a leading provider of cabinet and countertop installation services in the Salt Lake City market, for $16.0 million. With this acquisition, we expanded our presence in Utah and our cabinet and countertop capabilities.
71
Table of Contents
Sterling Manufacturing
On July 1, 2018, we acquired substantially all of the assets of Sterling Purchasing Corp., a fabricator of solid surface countertops and installer of countertops and cabinets in Florida, for $14.1 million. This acquisition expanded our countertop business and our presence in southwest Florida.
Coleman Flooring
On November 1, 2018, we acquired substantially all of the assets of Coleman Floor, LLC, a design center services and flooring installation business serving the Mid-Atlantic and the Carolinas, for $7.8 million. We increased our local density within the Carolinas and Mid-Atlantic markets as a result of this acquisition.
Key Components of Results of Operations
Revenues
Revenues are derived from the provision of design studio solutions to homebuilders, supply chain management and the installation of interior products.
Cost of revenues
Cost of revenues primarily includes direct costs of materials, subcontractors, internal labor and related fringe benefits, overhead and depreciation related to our fabrication facilities and certain direct costs related to our supply chain management services.
Selling, general and administrative expenses (SG&A)
SG&A includes wages and benefits for operational support, general management and administrative personnel, facility costs, non-cash stock compensation costs, general liability insurance costs, and other overhead costs such as sales and marketing, information technology, legal, accounting and other corporate functions. SG&A also includes costs incurred for acquiring and integrating businesses as part of our growth strategy as well as, in 2020, costs related to COVID-19 safety measures and the Corporate Conversion.
Amortization of intangibles
Amortization expense represents the decline in value over time of definite-lived intangible assets such as trade names, customer relationships and non-competition agreements obtained as a result of past acquisitions.
Impairment of Intangible Assets or Trade Name
Impairment of intangible assets or trade name represents the write-off of certain intangible assets such as customer lists and an indefinite-lived trade name intangible asset that no longer provides ongoing value.
Interest expense
Interest expense primarily represents interest on our revolving credit facilities and term loans outstanding from time to time, as well as the amortization of debt issuance costs.
Loss on extinguishment of debt
Loss on extinguishment of debt represents the unamortized debt discount and deferred financing fees that are written off in connection with the Business Combination in 2018 and refinancing of our debt in 2017.
72
Table of Contents
Income taxes
Income taxes are recorded using the asset and liability method of accounting for income taxes. Under the asset and liability method, deferred tax assets and liabilities are recognized for the deferred tax consequences attributable to temporary differences between the financial statement carrying amounts of existing assets and liabilities and their respective tax basis. Deferred tax assets and liabilities are measured using enacted tax rates expected to apply to taxable income in the years in which those differences are expected to be recovered or settled.
Results of Operations
Nine Months Ended September 30, 2020 Compared with Nine Months Ended September 30, 2019
The following table sets forth our operating results in dollars and as a percentage of revenues for the periods indicated.
| (Dollars in thousands) |
Nine Months Ended September 30, |
$
Variance Increase (Decrease) |
%
Variance Increase (Decrease) |
|||||||||||||
| 2020 | 2019 | |||||||||||||||
| (Unaudited) | ||||||||||||||||
| Revenue |
$ | 1,231,855 | $ | 1,314,021 | $ | (82,166 | ) | (6.3 | )% | |||||||
| Cost of revenues |
941,552 | 1,026,120 | (84,568 | ) | (8.2 | )% | ||||||||||
|
|
|
|
|
|
|
|
|
|||||||||
| 290,303 | 287,901 | 2,402 | 0.8 | % | ||||||||||||
| Selling, general and administrative expenses |
219,128 | 238,798 | (19,670 | ) | (8.2 | )% | ||||||||||
| Amortization of intangibles |
42,636 | 47,486 | (4,850 | ) | (10.2 | )% | ||||||||||
| Intangible asset impairment |
816 | — | 816 | N/M | ||||||||||||
|
|
|
|
|
|
|
|
|
|||||||||
| Income from operations |
27,723 | 1,617 | 26,106 | N/M | ||||||||||||
| Interest expense, net |
(18,712 | ) | (22,321 | ) | 3,609 | (16.2 | )% | |||||||||
| Other income, net |
1,488 | 9 | 1,479 | N/M | ||||||||||||
|
|
|
|
|
|
|
|
|
|||||||||
| Income (loss) before income taxes |
10,499 | (20,695 | ) | 31,194 | 150.8 | % | ||||||||||
| Income tax (expense) benefit |
(2,552 | ) | 3,127 | (5,679 | ) | N/M | ||||||||||
|
|
|
|
|
|
|
|
|
|||||||||
| Net income (loss) |
$ | 7,947 | $ | (17,568 | ) | $ | 25,515 | 145.3 | % | |||||||
|
|
|
|
|
|
|
|
|
|||||||||
| Net unrealized (loss) gain on derivative instruments |
(6,708 | ) | (108 | ) | (6,600 | ) | N/M | |||||||||
|
|
|
|
|
|
|
|
|
|||||||||
| Comprehensive (loss) income |
$ | 1,239 | $ | (17,676 | ) | $ | 18,915 | 107 | % | |||||||
|
|
|
|
|
|
|
|
|
|||||||||
| (1) | “N/M” indicates that variance as a percentage is not meaningful. |
Revenues
Revenues are highly dependent upon (i) the overall housing market, specifically new single-family residential home construction, (ii) the level of tenant turn-over and occupancy rates at multi-family apartments, and (iii) general economic conditions that support commercial multi-family construction activity levels.
Revenues for the nine months ended September 30, 2020 were $1.2 billion, a decrease of $82.2 million or 6.3%, compared to $1.3 billion for the nine months ended September 30, 2019, predominantly due to the impact of COVID-19, which slowed down our customers’ new single-family residential sales during March through May 2020, limited our access to senior living facilities and owner-occupied homes for repair and remodel, and limited tenant turn-over and occupancy rates at multi-family apartments. This decrease was partially offset by an increase in revenue from our 2019 acquisitions. In addition to the slowdown of single family residential sales, we experienced an extension of the construction cycle time where COVID-19 had an impact to the labor and materials supply chain for other installations in the home, such as foundation, framing and appliances. Before the
73
Table of Contents
onset of COVID-19, we typically completed our services and recognized revenue 4 to 6 months following the date when our customers sell a home to a homebuyer. During the three months ended September 30, 2020, we saw this cycle time extend as much as 30 days.
Cost of Revenues
Cost of revenues for the nine months ended September 30, 2020 were $941.6 million, a decrease of $84.5 million or 8.2%, compared to $1,026.1 million for the nine months ended September 30, 2019. As a percentage of revenues for the nine months ended September 30, 2020 and September 30, 2019, cost of revenues were 76.4% and 78.1%, respectively. The decrease of 1.7% over the same period of the prior year was driven by supply chain cost reductions and improvements in customer and product mix, largely related to a growing portion of technology-enabled revenue.
Gross profit
Gross profit for the nine months ended September 30, 2020 was $290.3 million, an increase of $2.4 million or 0.8%, compared to $287.9 million of gross profit for the nine months ended September 30, 2019. As a percentage of revenues for the nine months ended September 30, 2020 and September 30, 2019, gross profit was 23.6% and 21.9%, respectively, representing an increase of 1.7%, driven by improved operating performance, supply chain cost reductions and improved product upgrade mix.
Selling, General and Administrative Expenses
SG&A expenses for the nine months ended September 30, 2020 were $219.1 million, a decrease of $19.7 million or 8.2%, compared to $238.8 million for the nine months ended September 30, 2019, predominately due to cost reductions in response to the uncertainty of the impact of the COVID-19 pandemic on our results of operations. We also saw lower acquisition and integration costs as the integration of the Business Combination was substantially completed in 2019, partially offset by the impacts of our acquisitions of Flooring Systems and Mike’s Flooring and the continuing implementation of our ERP platform. As a percentage of revenues for the nine months ended September 30, 2020 and September 30, 2019, SG&A expenses were 17.8% and 18.2%, respectively, primarily due to the factors discussed above.
Amortization of Intangibles
Amortization of intangibles for the nine months ended September 30, 2020 was $42.6 million, a decrease of $4.9 million compared to $47.5 million for the nine months ended September 30, 2019. The decrease was attributed to a lower amortizable base of our customer relationships due to our amortization methodology. We recognize amortization expense on our customer relationships on an accelerated basis, which is reflective of the period over which the economic benefit is expected to be attained. In addition, the decrease was attributed to a lower amortizable base of our trademarks as certain of them became fully amortized.
Impairment of Intangible Assets
For the nine months ended September 30, 2020, we wrote-off $0.8 million of intangible assets associated with a prior investment in a visualization platform as our strategy changed with the acquisition of Roomored, Inc. and customer relationships related to the acquisition of a small countertop company in 2018.
Interest Expense
Interest expense for the nine months ended September 30, 2020 was $18.7 million, a decrease of $3.6 million compared to $22.3 million for the nine months ended September 30, 2019. The decrease was primarily driven by reduced interest rates associated with the Term Loan Facility resulting from the reduction in LIBOR during the nine months ended September 30, 2020 compared to the nine months ended September 30, 2019.
74
Table of Contents
Income Taxes
Income tax expense for the nine months ended September 30, 2020 was $2.6 million, an increase of $5.7 million compared to the $3.1 million tax benefit for the nine months ended September 30, 2019. This increase was primarily driven by an increase in net income.
Net Unrealized Loss on Derivative Instrument
Effective January 2020 and expiring in December 2022, we entered into an interest rate swap agreement with respect to the Term Loan Facility to manage our exposure to interest rate changes. Since the interest rate swap qualifies for hedge accounting, changes in fair value are recorded in comprehensive income in the consolidated statement of comprehensive loss. The decrease in interest rates starting in March 2020 as a result of COVID-19 resulted in an unrealized loss on the interest rate swap of $6.7 million for the nine months ended September 30, 2020.
Year Ended December 31, 2019 Compared with Year Ended December 31, 2018
The following table sets forth our consolidated operating results for the periods indicated:
| Years Ended December 31, |
$
Variance Increase (Decrease) |
%
Variance Increase (Decrease) |
||||||||||||||
| (Dollars in thousands) |
2019 | 2018 | ||||||||||||||
| Revenue |
$ | 1,785,388 | $ | 1,405,325 | $ | 380,063 | 27.0 | % | ||||||||
| Cost of revenues |
1,390,606 | 1,099,337 | 291,269 | 26.5 | % | |||||||||||
|
|
|
|
|
|
|
|
|
|||||||||
| 394,782 | 305,988 | 88,794 | 29.0 | % | ||||||||||||
| Selling, general and administrative expenses |
321,143 | 246,234 | 74,909 | 30.4 | % | |||||||||||
| Amortization of intangibles |
63,545 | 40,843 | 22,702 | 55.6 | % | |||||||||||
| Trade name impairment |
— | 10,000 | (10,000 | ) | N/M | |||||||||||
|
|
|
|
|
|
|
|
|
|||||||||
| Income from operations |
10,094 | 8,911 | 1,183 | 13.3 | % | |||||||||||
| Interest expense, net |
(29,088 | ) | (22,238 | ) | (6,850 | ) | 30.8 | % | ||||||||
| Loss on extinguishment of debt |
— | (3,068 | ) | 3,068 | N/M | |||||||||||
| Other income |
8 | — | 8 | N/M | ||||||||||||
|
|
|
|
|
|
|
|
|
|||||||||
| Loss before income taxes |
(18,986 | ) | (16,395 | ) | (2,591 | ) | 15.8 | % | ||||||||
| Income tax benefit |
3,225 | 3,475 | (250 | ) | (7.2 | %) | ||||||||||
|
|
|
|
|
|
|
|
|
|||||||||
| Net loss |
$ | (15,761 | ) | $ | (12,920 | ) | $ | (2,841 | ) | 22.0 | % | |||||
|
|
|
|
|
|
|
|
|
|||||||||
| (1) | “N/M” indicates that variance as a percentage is not meaningful. |
The increases in our revenues, cost of revenues, gross profit, SG&A and amortization of intangibles for the year ended December 31, 2019 compared to the year ended December 31, 2018, as described below, were predominantly related to the Business Combination completed in 2018, as the revenues, gross profit, SG&A and amortization of intangibles for the year ended December 31, 2018 only included the period June 1, 2018 through December 31, 2018 for legacy ILG. To a lesser extent, these increases were also related to our 2018 acquisitions that have a full year of operations reflected in the revenues, cost of revenues, gross profit, SG&A and amortization of intangibles for the year ended December 31, 2019, and our 2019 acquisitions that have less than a full year of operations reflected in the revenues, cost of revenues, gross profit, SG&A and amortization of intangibles for the year ended December 31, 2019. As a result, a comparison of the results of operations for the year ended December 31, 2019 with the year ended December 31, 2018 may not be meaningful.
Revenues
Revenues for the year ended December 31, 2019 were $1.8 billion, an increase of $380.1 million or 27.0%, compared to $1.4 billion for the year ended December 31, 2018.
75
Table of Contents
Cost of Revenues
Cost of revenues for the year ended December 31, 2019 was $1.4 billion, an increase of $291.3 million or 26.5%, compared to $1.1 billion for the year ended December 31, 2018. As a percentage of revenues for the year ended December 31, 2019 and December 31, 2018, cost of revenues was comparable at 77.9% and 78.2%, respectively.
Gross Profit
Gross profit for the year ended December 31, 2019 was $394.8 million, an increase of $88.8 million or 29.0%, compared to $306.0 million of gross profit for year ended December 31, 2018. As a percentage of revenues for the year ended December 31, 2019 and December 31, 2018, gross profit was relatively consistent at 22.1% and 21.8%, respectively.
Selling, General and Administrative Expenses
SG&A expenses for the year ended December 31, 2019 were $321.1 million, an increase of $74.9 million or 30.4%, compared to $246.2 million for the year ended December 31, 2018. As a percentage of revenues for the year ended December 31, 2019 and December 31, 2018, SG&A expenses were 18.0% and 17.5%, respectively, and the increase was primarily driven by integration costs.
Amortization of Intangibles
Amortization of intangibles for the year ended December 31, 2019 was $63.5 million, an increase of $22.7 million compared to $40.8 million for the year ended December 31, 2018 primarily driven by a full year of amortization expense on the intangible assets from the Business Combination. In addition, the impact of the change from an indefinite lived trade name to a definite lived tradename resulted in $9.4 million of incremental amortization during the year ended December 31, 2019.
Trade Name Impairment
As a result of our decision to rebrand under the ILG name, we abandoned certain of our indefinite lived trade names. Accordingly, we recorded an impairment charge of $10.0 million during the year ended December 31, 2018.
Interest Expense
Interest expense for the year ended December 31, 2019 was $29.1 million, an increase of $6.8 million compared to $22.2 million for the year ended December 31, 2018. The increase was primarily driven by interest associated with the Term Loan Facility (as defined below).
Loss on Extinguishment of Debt
In connection with the Business Combination, our Prior Term Loan Facility (as defined below) was paid in full. We recognized a loss of $3.1 million on the extinguishment of debt in 2018 related to a prepayment penalty and write-off of unamortized debt issuance costs.
Income Taxes
Given our full year net losses during 2019 and 2018, we recorded an income tax benefit during the years ended December 31, 2019 and 2018. At December 31, 2019, we had no federal net operating loss carryforwards and state NOL carryforwards of approximately $33.8 million. At December 31, 2018, we had federal NOL carryforwards of approximately $12.3 million and state NOL carryforwards of approximately $10.1 million. The state NOL carryforwards begin expiring in 2030, unless previously utilized.
76
Table of Contents
Year Ended December 31, 2018 Compared with Year Ended December 31, 2017
The following table sets forth our consolidated operating results for the periods indicated:
| Years Ended December 31, |
$
Variance Increase (Decrease) |
%
Variance Increase (Decrease) |
||||||||||||||
| (Dollars in thousands) |
2018 | 2017 | ||||||||||||||
| Revenue |
$ | 1,405,325 | $ | 851,918 | $ | 553,407 | 65.0 | % | ||||||||
| Cost of revenues |
1,099,337 | 670,274 | 429,063 | 64.0 | % | |||||||||||
|
|
|
|
|
|
|
|
|
|||||||||
| 305,988 | 181,644 | 124,344 | 68.5 | % | ||||||||||||
| Selling, general and administrative expenses |
246,234 | 152,218 | 94,016 | 61.8 | % | |||||||||||
| Amortization of intangibles |
40,843 | 9,080 | 31,763 | N/M | ||||||||||||
| Trade name impairment |
10,000 | — | 10,000 | N/M | ||||||||||||
|
|
|
|
|
|
|
|
|
|||||||||
| Income from operations |
8,911 | 20,346 | (11,435 | ) | (56.2 | )% | ||||||||||
| Interest expense, net |
(22,238 | ) | (10,458 | ) | (11,780 | ) | 112.6 | % | ||||||||
| Loss on extinguishment of debt |
(3,068 | ) | (552 | ) | (2,516 | ) | N/M | |||||||||
|
|
|
|
|
|
|
|
|
|||||||||
| (Loss) income before income taxes |
(16,395 | ) | 9,336 | (25,731 | ) | N/M | ||||||||||
| Income tax benefit |
3,475 | 521 | 2,954 | N/M | ||||||||||||
|
|
|
|
|
|
|
|
|
|||||||||
| Net (loss) income |
$ | (12,920 | ) | $ | 9,857 | $ | (22,777 | ) | N/M | |||||||
| (1) | “N/M” indicates that variance as a percentage is not meaningful. |
The increases in our revenues, cost of revenues, gross profit, SG&A and amortization of intangibles for the year ended December 31, 2018 compared to the year ended December 31, 2017, as described below, were predominantly related to the Business Combination completed in 2018 and our 2018 acquisitions. As a result, a comparison of the results of operations for the year ended December 31, 2018 with the year ended December 31, 2017 may not be meaningful.
Revenues
Revenues for the year ended December 31, 2018 were $1.4 billion, an increase of $553.4 million or 65.0%, compared to $851.9 million for the year ended December 31, 2017. In addition to the factors described above, the increase in revenues was also due to ongoing improvement in the housing market, increased market share and geographical product expansion.
Cost of Revenues
Cost of revenues for the year ended December 31, 2018 was $1.1 billion, an increase of $429.1 million or 64.0%, compared to $670.3 million for the year ended December 31, 2017. As a percentage of revenues for the year ended December 31, 2018 and December 31, 2017, cost of revenues was 78.2% and 78.7%, respectively.
Gross profit
Gross profit for the year ended December 31, 2018 was $306.0 million, an increase of $124.4 million or 68.5%, compared to $181.6 million of gross profit for year ended December 31, 2017. As a percentage of revenues for the year ended December 31, 2018 and December 31, 2017, gross profit was 21.8% and 21.3%, respectively.
Selling, General and Administrative Expenses
SG&A expenses for the year ended December 31, 2018 were $246.2 million, an increase of $94.0 million or 61.8%, compared to $152.2 million for the year ended December 31, 2017. As a percentage of revenues for the year ended December 31, 2018 and December 31, 2017, SG&A expenses were 17.5% and 17.9%, respectively.
77
Table of Contents
Amortization of Intangibles
Amortization of intangibles for the year ended December 31, 2018 was $40.8 million, an increase of $31.7 million, compared to $9.1 million for the year ended December 31, 2017. The impact of the change from an indefinite lived trade name to a definite lived trade name resulted in $5.5 million of incremental amortization of intangibles during the year ended December 31, 2018.
Trade Name Impairment
As a result of our decision to rebrand our company under the ILG name following the Business Combination, we abandoned certain of our indefinite lived trade names. Accordingly, we recorded an impairment charge of $10.0 million during the year ended December 31, 2018.
Interest Expense
Interest expense for the year ended December 31, 2018 was $22.2 million, an increase of $11.7 million compared to $10.5 million for the year ended December 31, 2017. The increase was primarily driven by increased borrowings used to finance the Business Combination and our 2018 acquisitions, as well as interest associated with the Term Loan Facility.
Loss on Extinguishment of Debt
In connection with the Business Combination, our Prior Term Loan Facility was paid in full. We recognized a loss of $3.1 million on the extinguishment of debt in 2018 related to a prepayment penalty and write-off of unamortized debt issuance costs.
Income Taxes
We recorded an income tax benefit during the year ended December 31, 2017. At December 31, 2017, we had state NOL carryforwards of approximately $3.5 million. The state NOL carryforwards begin expiring in 2030, unless previously utilized.
Liquidity and Capital Resources
Our primary capital requirements are to fund working capital needs, operating expenses, capital expenditures, required interest payments and selective strategic acquisitions. Cash and cash equivalents totaled $82.3 million at September 30, 2020, compared to $5.7 million at December 31, 2019. Accounts receivable and inventory represented 57% of our current assets at September 30, 2020 compared to 74% at December 31, 2019, and accordingly, management of working capital is important to our business. Our working capital (which is current assets minus current liabilities) totaled $123.7 million at September 30, 2020, compared to $98.6 million at December 31, 2019. In December 2020, we paid a special cash distribution of $31.8 million and $28.2 million to our membership equityholders, Faraday and ISH, respectively, or $60 million in the aggregate. In the past, from time to time, we have utilized our borrowing availability under our credit facilities to cover short-term working capital needs. We have, and, after this offering will continue to have, significant debt and debt service requirements.
Our primary sources of liquidity are cash flows generated from our operations and borrowings under the Term Loan Facility and Revolving Credit Facility (as defined below). Construction-related services continues to be identified as essential services by most local or state government authorities, in response to the COVID-19 pandemic, and we continue to perform services for our customers in all of our markets. At this time, we expect that these sources will fund our ongoing cash requirements for operating activities and acquisitions of businesses over the next 12 months of operations after consideration of our debt service requirements and other cash requirements. In the longer term, our liquidity will depend on many factors, including our results of operations,
78
Table of Contents
our future growth, the timing and extent of our expenditures to develop new products and improve our service capabilities, the expansion of our sales and marketing activities and the extent to which we make acquisitions. Changes in our operating plans, material changes in anticipated sales, increased expenses, acquisitions or other events may cause us to seek additional equity and/or debt financing in future periods.
The table below summarizes our cash flows for the periods indicated.
| Nine Months Ended September 30, |
Year Ended December 31, 2019 |
Year Ended December 31, 2018 |
Year Ended December 31, 2017 |
|||||||||||||||||
| (in thousands) |
2020 | 2019 | ||||||||||||||||||
| (Unaudited) | ||||||||||||||||||||
| Net cash provided by operating activities |
$ | 116,764 | $ | 30,189 | $ | 44,639 | $ | 3,705 | $ | 51,553 | ||||||||||
| Net cash used in investing activities |
(21,847 | ) | (21,303 | ) | $ | (23,926 | ) | $ | (34,596 | ) | $ | (17,526 | ) | |||||||
| Net cash (used in) provided by financing activities |
(18,310 | ) | (10,569 | ) | $ | (21,836 | ) | $ | 37,756 | $ | (36,179 | ) | ||||||||
| Net increase (decrease) in cash |
76,607 | (1,683 | ) | $ | (1,123 | ) | $ | 6,865 | $ | (2,152 | ) | |||||||||
Nine Months Ended September 30, 2020 Compared with Nine Months Ended September 30, 2019
Net Cash Provided by Operating Activities
Net cash provided by operating activities for the nine months ended September 30, 2020 was $116.8 million compared to $30.2 million for the nine months ended September 30, 2019. The increase in net cash provided by operating activities of $86.6 million was primarily due to higher income from operations as a result of improved operating performance, cost reductions and cash conservation activities put in place in response to COVID-19, as well as improved working capital management.
Net Cash Used in Investing Activities
During the nine months ended September 30, 2020 and 2019, net cash used in investing activities was primarily related to acquisitions, as well as funding property and equipment purchases primarily comprised of leasehold improvements on design studio build-outs, machinery and equipment for our fabrication facilities and field management vehicles. However, due to COVID-19, we have limited capital expenditures except if related to safety projects or if critical to ongoing operations.
Net Cash Used in Financing Activities
Net cash used in financing activities during the nine months ended September 30, 2020 primarily included $15.0 million of distributions made to membership equityholders that were declared, approved and paid in January 2020 and $3.0 million of repayments of principal on the Term Loan Facility. Net cash used in financing activities during the nine months ended September 30, 2019 primarily included $7.3 million of net repayments on the Revolving Credit Facility and $3.0 million of repayments of principal on the Term Loan Facility.
Year Ended December 31, 2019 Compared with Year Ended December 31, 2018
Net Cash Provided by Operating Activities
Net cash provided by operating activities for the year ended December 31, 2019 was $44.6 million compared to $3.7 million of net cash provided by operating activities for the year ended December 31, 2018. The increase in net cash provided by operating activities of $40.9 million was primarily due to changes in working capital and operational growth.
79
Table of Contents
Net Cash Used in Investing Activities
Net cash used in investing activities for the year ended December 31, 2019 was $23.9 million compared to $34.6 million in the prior year. The decrease in investing activities was primarily driven by two smaller acquisitions in 2019 compared to three acquisitions in 2018 and lower capitalized software and leasehold improvements on design studios partially offset by increased purchases of machinery for our fabrication facilities and computer hardware in conjunction with the integration of the Business Combination.
Net Cash (Used in) Provided by Financing Activities
Net cash used in financing activities during the year ended December 31, 2019 included $4.2 million of payments on the Term Loan Facility and $17.6 million of net repayments on the Revolving Credit Facility as we generated cash from strong working capital management compared to net cash provided during the year ended December 31, 2018. Net cash of $37.7 million provided during the year ended December 31, 2018 was primarily driven by financing activities related to the Business Combination as we entered into a new Term Loan Facility and new Revolving Credit Facility, described below, while extinguishing the Prior Revolving Credit Facility (as defined below) and Prior Term Loan Facility.
Year Ended December 31, 2018 Compared with Year Ended December 31, 2017
Net Cash Provided by Operating Activities
Net cash provided by operating activities for the year ended December 31, 2018 was $3.7 million compared to $51.6 million of net cash provided by operating activities for the year ended December 31, 2017. The decrease in net cash provided by operating activities of $47.9 million was primarily due to a net loss in 2018, which was driven by acquisition and integration costs related to the Business Combination and increased interest expense related to the increase in long-term debt. In addition, as a result of the Business Combination and continued integration activities, during the year ended December 31, 2018, accounts receivable, inventory, prepaid expense and other assets increased compared to December 31, 2017.
Net Cash Used in Investing Activities
During the year ended December 31, 2018, net cash used in investing activities was primarily related to our acquisitions in 2018 and to fund property and equipment purchases primarily comprised of leasehold improvements on design studio build-outs and capitalized software. During the year ended December 31, 2017, net cash used in investing activities was primarily related to property and equipment purchases primarily comprised of leasehold improvements on design studio build-outs and to a lesser extent an asset acquisition we completed in September 2017.
Net Cash Provided by (Used in) Financing Activities
Net cash provided by financing activities during the year ended December 31, 2018 was related to the Business Combination and included $60.7 million of net proceeds provided by the Term Loan Facility, net of the repayments of our Prior Term Loan. The net cash provided by financing activities was partially offset primarily by payments of debt issuance costs of $12.5 million, net repayments on our Prior Revolving Credit Facility and the Revolving Credit Facility of $5.8 million, and the payment of a prepayment penalty related to our previous term loan of $0.9 million. For the year ended December 31, 2017, net cash used in financing activities was primarily related to net borrowings on our Prior Revolving Credit Facility and payments on our Prior Term Loan Facility.
80
Table of Contents
Indebtedness
Existing Indebtedness
The table below sets forth the carrying amounts of long-term debt as of September 30, 2020 (in thousands, unaudited):
| Term Loan Facility |
$ | 392,000 | ||
| Unamortized original issue discount |
(1,333 | ) | ||
| Unamortized debt issuance costs |
(7,627 | ) | ||
| Other long-term debt |
434 | |||
|
|
|
|||
| Long-term debt |
$ | 383,474 | ||
| Less: current maturities of long-term debt |
(2,528 | ) | ||
|
|
|
|||
| Long-term debt, net of current portion |
$ | 380,946 | ||
|
|
|
The table below sets forth the carrying amounts of long-term debt as of December 31, 2019 (in thousands):
| Term Loan Facility |
$ | 395,000 | ||
| Unamortized original issue discount |
(1,547 | ) | ||
| Unamortized deferred financing fees |
(8,849 | ) | ||
| Other long-term debt |
78 | |||
|
|
|
|||
| Long-term debt |
$ | 384,682 | ||
| Less: current maturities of long-term debt |
(2,433 | ) | ||
|
|
|
|||
| Long-term debt, net of current portion |
$ | 382,249 | ||
|
|
|
In connection with the Business Combination, we undertook a series of transactions to refinance our indebtedness. The following summarizes our prior and existing indebtedness.
Revolving Credit Facility
Effective May 31, 2018, ILG Holdings IV, LLC and certain of its subsidiaries, as borrowers, along with ILG Holdings III, LLC and certain of its subsidiaries, as guarantors, entered into a Revolving Credit Agreement (the “Revolving Credit Agreement”) with Bank of America, as administrative agent and collateral agent, and the other lenders party thereto (the “Revolving Credit Facility”) providing for aggregate borrowings of up to $100 million. As of September 30, 2020 and December 31, 2019, we did not have any borrowings under our Revolving Credit Facility, with $96.8 million available under the Revolving Credit Facility. The Revolving Credit Facility provides a sublimit of up to $30.0 million in letters of credit. As of September 30, 2020 and December 31, 2019, we had $3.2 million of letters of credit issued under the Revolving Credit Facility. Our Revolving Credit Facility matures in May 2023.
Availability under our Revolving Credit Facility is limited to the lesser of $100 million and a borrowing base determined by reference to, among other things, the value of our eligible receivables, inventory and cash, reduced by certain reserve amounts. Availability under our Revolving Credit Facility is further limited by the amount of outstanding borrowings and letters of credit.
The obligations of borrowers and guarantors under the Revolving Credit Facility are guaranteed by us and our subsidiaries and secured on (i) a first-priority basis by liens on, among other things, cash, accounts receivable, inventory and other related assets, in each case except to the extent such items constitute identifiable proceeds of the Term Loan Facility Priority Collateral (the “Revolving Credit Facility Priority Collateral”) and (ii) a second-priority basis by liens on all our assets other than the Revolving Credit Facility Priority Collateral (the “Term Loan Facility Priority Collateral”). All guarantees by us and our subsidiaries are joint and several and fully unconditional.
81
Table of Contents
The interest rate under our Revolving Credit Facility is, at our option, based on either (i) the base rate plus an applicable margin ranging between 0.50% and 1.00% per annum based on average usage of the Revolving Credit Facility or (ii) LIBOR plus an applicable margin ranging between 1.50% and 2.00% per annum based on average usage of the Revolving Credit Facility. If LIBOR ceases to exist, the administrative agent may replace LIBOR with an alternate benchmark rate, giving due consideration to any evolving or then-existing convention for similar U.S. dollar denominated syndicated credit facilities for such alternative benchmarks. In addition, we are required to pay an unused commitment fee ranging from 0.250% to 0.375% per annum of the average unused portion of the lending commitments.
The Revolving Credit Facility contains covenants that restrict our ability, subject to specified exceptions, to incur additional debt; incur additional liens or contingent liabilities; sell or dispose of assets; merge with or acquire other companies; liquidate or dissolve; engage in businesses that are not reasonably related to our current business activities; make loans, advances, or guarantees; pay dividends or make other distributions; engage in transactions with affiliates; and make certain investments. The Revolving Credit Facility also requires that we maintain a fixed-charge coverage ratio of not less than 1.0 to 1.0 to be tested if and when excess availability, as defined under the Revolving Credit Agreement, falls below 10% of the facility’s maximum availability, or $8.0 million.
Events of default under the Revolving Credit Facility include, but are not limited to, payment defaults, covenant defaults, breaches of representations and warranties, cross-defaults to certain indebtedness, certain events of bankruptcy and insolvency, defaults under any security documents and a change of control. As of September 30, 2020 and December 31, 2019, we were in compliance with all covenants and no “event of default” (as such term is defined in the Revolving Credit Agreement) had occurred.
Term Loan Facility
Effective May 31, 2018, ILG Holdings IV, LLC and certain of its subsidiaries, as borrowers, along with ILG Holdings III, LLC and certain of its subsidiaries, as guarantors, entered into a Term Loan Credit Agreement (the “Term Loan Credit Agreement”) with Bank of America, as administrative agent and collateral agent, and the lenders party thereto (the “Term Loan Facility”). The Term Loan Facility provides for (i) initial term loan commitments of $400.0 million and (ii) the right to request up to two incremental term loan facilities in an aggregate amount not to exceed the greater of $130.0 million and 100% of consolidated trailing twelve months EBITDA. As of September 30, 2020 and December 31, 2019, borrowings under our Term Loan Facility totaled $392 million and $395 million, respectively, and accrued interest at a rate of 4.2% and 6.3%, respectively. The Term Loan Facility matures in May 2025.
Borrowings under the Term Loan Facility bear interest, at our option, at either (i) the base rate plus 3.00% per annum or (ii) LIBOR plus 4.00% per annum. If LIBOR ceases to exist, the administrative agent may replace LIBOR with an alternate benchmark rate, giving due consideration to any evolving or then-existing convention for similar U.S. dollar denominated syndicated credit facilities for such alternative benchmarks.
The obligations under the Term Loan Facility are guaranteed by us and our subsidiaries and secured on a (i) first-priority basis by liens on the Term Loan Facility Priority Collateral and (ii) second-priority basis by liens on the Revolving Credit Facility Priority Collateral. All guarantees by us are joint and several and fully unconditional.
The Term Loan Facility contains covenants that, among other things, restrict our ability, subject to specified exceptions, to incur additional debt; incur additional liens and contingent liabilities; sell or dispose of assets; merge with or acquire other companies; liquidate or dissolve; engage in businesses that are not reasonably related to our existing business activities; make loans, advances, or guarantees; pay dividends or make other distributions; engage in transactions with affiliates and make capital expenditures and other investments. The Term Loan Facility does not contain any maintenance covenants.
Events of default under the Term Loan Facility include, but are not limited to, payment defaults, covenant defaults, breaches of representations and warranties, cross-defaults to certain indebtedness, certain events of
82
Table of Contents
bankruptcy and insolvency, defaults under security documents and a change of control. As of September 30, 2020 and December 31, 2019, we were in compliance with all covenants and no “event of default” (as such term is defined in the Term Loan Credit Agreement) had occurred.
Prior Indebtedness
Prior Revolving Credit Facility
Prior to the Business Combination, we were party to a revolving credit facility with an asset-based lender (the “Prior Revolving Credit Facility”). Maximum availability under the Prior Revolving Credit Facility was $65.0 million. Obligations under the Prior Revolving Credit Facility were guaranteed by us and our subsidiaries and secured on a first-lien priority basis by, among other things, cash, accounts receivable, inventory and other related assets, in each case except to the extent such items constituted identifiable proceeds of collateral securing our Prior Term Loan Facility (the “Prior Revolving Credit Facility Priority Collateral”) and on a second-priority basis by liens on all of our assets other than the Prior Revolving Credit Facility Priority Collateral (the “Prior Term Loan Facility Priority Collateral”). Interest under the Prior Revolving Credit Facility was based on the three-month LIBOR plus a spread over such rate that ranged from 2.50% to 3.00%, based on excess availability. The Prior Revolving Credit Facility was repaid in full on May 31, 2018 with proceeds of the Term Loan Facility.
Prior Term Loan Facility
Prior to the Business Combination, we were party to a term loan facility with an asset-based lender (the “Prior Term Loan Facility”), which provided for $94.0 million in principal amount of borrowings, a portion of which was drawn in October 2017 to repay the Sponsor Credit Agreement (as defined below). Obligations under the Prior Term Loan Facility were guaranteed by us and our subsidiaries and secured on a first-priority basis by the Prior Term Loan Facility Priority Collateral and on a second-priority basis by the Prior Revolving Credit Facility Priority Collateral. Borrowings under the Prior Term Loan Facility bore interest at LIBOR (not to fall below 1.00%) plus a margin of 6.00%. The Prior Term Loan Facility was repaid in full on May 31, 2018 with the proceeds of the Term Loan Facility.
Sponsor Credit Agreement
In August 2014, certain affiliates of Littlejohn & Co., LLC executed an assignment agreement with each of the lenders under our then-existing credit facility (the “Sponsor Credit Agreement”) pursuant to which Littlejohn acquired the prior lenders’ loan interests and assumed the lenders’ rights and obligations under the Sponsor Credit Agreement. The Sponsor Credit Agreement balance of $21.4 million, including accrued interest, was repaid in full on October 16, 2017 with funds from the Prior Term Loan Facility.
Letters of Credit and Performance Bonds
As of September 30, 2020, we had $3.2 million outstanding letters of credit issued under our Revolving Credit Facility primarily to secure performance bonds in place under certain customer contracts and to secure our performance under a prior workers’ compensation program which was a high deductible program and had three outstanding claims. We occasionally use performance bonds to ensure completion of our work on certain larger customer contracts that can span multiple accounting periods. As of September 30, 2020, we had performance bonds outstanding totaling $20 million. Performance bonds generally do not have stated expiration dates; rather, we are released from the bonds as the contractual performance is completed.
Contractual Obligations
In the table below, we set forth our enforceable and legally binding obligations as of December 31, 2019. Some of the amounts included in the table are based on management’s estimates and assumptions about these
83
Table of Contents
obligations, including their duration, the possibility of renewal, anticipated actions by third parties and other factors. Because these estimates and assumptions are necessarily subjective, our actual payments may vary from those reflected in the table. The figures in the table below do not reflect the anticipated proceeds of this offering and the application thereof.
| Payments due by period | ||||||||||||||||||||
| Total | Less than 1 year |
1-3 years |
3-5 years |
More than 5 years |
||||||||||||||||
| Long-term debt obligations(1) |
$ | 395,000 | $ | 4,000 | $ | 8,000 | $ | 8,000 | $ | 375,000 | ||||||||||
| Finance lease obligations(2) |
$ | 883 | $ | 283 | 405 | $ | 174 | $ | 21 | |||||||||||
| Operating lease obligations(3) |
$ | 71,728 | $ | 21,634 | $ | 34,127 | $ | 13,887 | $ | 2,080 | ||||||||||
| (1) | Amounts represent contractual amounts due under our Term Loan Facility, which matures in May 2025. |
| (2) | We maintain certain production vehicles under a finance lease structure. The leases expire on various dates. Finance lease obligations include estimated interest expense payments. In determining expected interest expense payments, we utilize the rates embedded in the lease documentation. |
| (3) | We lease certain locations and equipment under operating lease agreements, including, but not limited to, corporate offices, design studios, fabrication facilities, warehousing and logistics centers and various office and operating equipment. In some instances, these lease agreements exist with related parties. For additional information, see Note 10, Related Party Transactions, to our audited consolidated financial statements included in this prospectus. |
Off-Balance Sheet Arrangements
As of September 30, 2020 and December 31, 2019, other than letters of credit issued under our Revolving Credit Facility and performance bonds, we had no other material off-balance sheet arrangements with unconsolidated entities. Effective January 1, 2019, we adopted ASU No. 2016-02, Leases (“ASC 842”) and our operating leases are no longer considered off-balance sheet arrangements. The FASB issued this Accounting Standards Update (“ASU”) to increase transparency and comparability among organizations by requiring lessees to recognize lease assets and lease liabilities on the balance sheet for those leases classified as operating leases and finance leases and disclosing key information about leasing arrangements.
Our discussion and analysis of our results of operations and our liquidity and capital resources is based on our consolidated financial statements included in this prospectus, which have been prepared in accordance with GAAP. These principles require us to make estimates and judgments that affect our reported amounts of assets and liabilities, our disclosure of contingent assets and liabilities and our reported amounts of revenues and expenses. On an ongoing basis, we evaluate our estimates and judgments, including those related to revenue recognition, accounts receivable and the allowance for doubtful accounts, the valuation of intangible assets, goodwill, long-lived assets and income taxes. We base our estimates on historical and anticipated results and trends and on various other assumptions that we believe are reasonable under the circumstances, including assumptions as to future events. These estimates form the basis for making judgments about the carrying values of assets and liabilities that are not readily apparent from other sources. By their nature, estimates are subject to an inherent degree of uncertainty. Actual results may differ from our estimates.
Critical Accounting Policies
We believe that the following critical accounting policies and estimates involve a higher degree of judgment or complexity than others used in the preparation of our consolidated financial statements.
Revenue and Cost Recognition
Prior to the adoption of ASC 606 on January 1, 2018, revenues from the sale and installation of products were recognized when all of the following have occurred: (i) persuasive evidence of an arrangement exists;
84
Table of Contents
(ii) delivery has occurred or services have been rendered; (iii) the price is fixed or determinable; and (iv) the ability to collect is reasonably assured. Revenues from fixed-price installation contracts are recognized on the units-of-delivery method. Under the units-of-delivery method, substantive contract milestones are identified and revenues are recognized when the milestone deliverables have been installed according to specifications or accepted by the customer.
Contract costs include all direct material and workforce costs and are recognized as cost of revenues when installation is complete. Vendor rebates on material purchases are recognized as a reduction in contract costs when earned based on the terms of the rebate agreement. Contract costs incurred prior to completing installation are recorded as work-in-progress inventories. Indirect contract costs are insignificant to contract costs and are expensed as incurred. General and administrative costs are expensed as incurred.
On January 1, 2018, we adopted Accounting Standards Update 2014-09, Revenue from Contracts with Customers, using the modified retrospective transition method applied to those contracts that were not completed as of January 1, 2018. We have determined that control for our design and installation services passes over time for the installed products, and revenue is recognized to the extent costs have been incurred until installation is complete and represents the estimated consideration we expect to receive for the exchange of the performance obligation.
Accounts Receivable and Allowance for Doubtful Accounts
Accounts receivable are carried at the original invoice amount less payments applied, and an estimate is made for doubtful receivables based on a review of all amounts outstanding. Receivables are considered past due if any portion of the receivable is outstanding for more than thirty days. No interest on past-due amounts is charged. Management determines the allowance for doubtful accounts by regularly evaluating individual customer receivables and considering a customer’s financial condition and credit history as well as current economic conditions that we expect will impact the level of credit losses over the life of our receivables. Accounts receivable are written off when deemed uncollectible. Recoveries of accounts receivable previously written off are recorded when received.
Leases
On January 1, 2019, we adopted ASC 842, “Leases” which, among other changes, requires us to record liabilities classified as operating leases on our Condensed Consolidated Balance Sheets along with a corresponding right-of-use asset. Results for reporting periods beginning after January 1, 2019 are presented under Topic 842, while prior period amounts are not adjusted and continue to be reported in accordance with our historic accounting under Topic 840. See Note 8, “Operating and Finance Leases,” to our audited consolidated financial statements included in this prospectus for additional information.
As a result of the adoption of the new accounting standard, we elected transition-related practical expedients as accounting policies which allowed us to not reassess, as of the adoption date, (1) whether any expired or existing contracts are or contain leases, (2) the classification of any expired or existing leases, and (3) if previously capitalized initial direct costs qualify for capitalization under ASC 842. We elected the practical expedient option to not separate lease and non-lease components for all of our leases, and also elected the short-term lease recognition exemption that keeps leases with an initial term of 12 months or less excluded from the balance sheet.
Impairment of Goodwill
Goodwill results from business combinations and represents the excess of the purchase price over the fair value of acquired tangible assets and liabilities and identifiable intangible assets. The allocation of purchase price for acquisitions requires the use of accounting estimates and judgments to allocate the purchase price to the tangible assets and liabilities and identifiable intangible assets based on their respective fair values. Goodwill is deemed to have an indefinite life and, therefore, is not amortized.
85
Table of Contents
Annually, in the fourth quarter of each year, or if conditions indicate an earlier review is necessary, we assess qualitative factors to determine if it is more likely than not the fair value of a reporting unit is less than its carrying amount and if it is necessary to perform the quantitative two-step goodwill impairment test. If we perform the quantitative test, we compare the carrying value of the reporting unit to the reporting unit’s fair value to identify potential impairment. The estimate of the reporting unit’s fair value is determined by using a market approach using current industry information classified as unobservable inputs (Level 3 inputs). In determining the estimated future cash flow, we consider and apply certain estimates and judgments, including the current and projected future levels of income based on management’s plans, business trends, prospects, and market and economic conditions and market-participant considerations. If the estimated fair value of the reporting unit is less than the carrying value, a second step is performed to measure goodwill impairment.
Intangible Assets
Intangible assets include our trade names, customer relationships, developed technology and noncompete agreements. Amortization of intangible assets with definite lives is recognized on a straight-line basis over the respective lives of the asset or on an accelerated basis that reflects the economic benefit when there is a pattern of declining cash flows that is reliably determinable (generally one to nineteen years). We assess the definite lived intangibles for impairment whenever events or circumstances indicate that their carrying amount may not be recoverable. An intangible impairment is recorded when the undiscounted cash flows generated from the definite lived intangible asset are less than the asset’s carrying value. The impairment loss is the difference between the discounted cash flows generated from the asset, which approximates fair value and the asset’s carrying amount.
Impairment of Long-lived Assets
We review our depreciating long-lived assets when there is evidence that events or changes in circumstances indicate that their carrying values may not be recoverable. An impairment loss may be required to be recognized when the undiscounted cash flows expected to be generated by a long-lived asset (or group of such assets) are less than its carrying value. Any required impairment loss would be measured as the amount by which the asset’s carrying value exceeds its fair value and would be recorded as a reduction in the carrying value of the related asset and charged to results of operations.
Income Taxes
We account for income taxes using the asset and liability method. Under this method, the amount of taxes currently payable or refundable are accrued, and deferred tax assets and liabilities are recognized for the estimated future tax consequences of temporary differences that exist between the tax basis and financial reporting basis of our assets and liabilities.
Valuation allowances are established against deferred tax assets when it is more likely than not that the realization of those deferred tax assets will not occur. In evaluating our ability to recover deferred tax assets within the jurisdiction from which they arise, both positive and negative evidence is considered as well as sources of taxable income, including income in carryback years, future reversals of existing taxable temporary differences, tax planning strategies and projected taxable income from future operations. In projecting future taxable income, we begin with historical results adjusted for the results of discontinued operations and changes in accounting policies and incorporates assumptions, including the amount of future federal and state pretax operating income, the reversal of temporary differences and the implementation of feasible and prudent tax planning strategies.
Deferred tax assets and liabilities are measured using the enacted tax rates in effect in the years when those temporary differences are expected to reverse. The effect on deferred taxes from a change in tax rate is recognized through continuing operations in the period that includes the enactment date of the change.
A tax benefit from an uncertain tax position may be recognized when it is more likely than not that the position will be sustained upon examination, including resolutions of any related appeals or litigation based on its
86
Table of Contents
technical merits. We recognize tax liabilities for uncertain tax positions and adjusts these liabilities when our judgments change as a result of the evaluation of any new information.
Our income tax expense, deferred tax assets and liabilities and allowances for unrecognized tax benefits reflect management’s best assessment of estimated future taxes to be paid. We are subject to income taxes in the United States which includes numerous state and local jurisdictions. Significant judgments and estimates are required in determining income tax expense.
Recently Adopted Accounting Pronouncements
In February 2016, the FASB issued ASU 2016-02, Leases (Topic 842), which was further modified in ASU 2018—10, Codification Improvements to Topic 842, Leases and ASU 2018-11, Leases (Topic 842) Targeted Improvements to clarify implementation guidance. The guidance requires a lessee to recognize assets and liabilities on the balance sheet for leases with lease terms greater than 12 months. The new standard was effective for us for fiscal years beginning January 1, 2019. We adopted Topic 842 using a modified retrospective approach by recognizing a cumulative-effect adjustment to retained earnings. As of the effective date, January 1, 2019, we recognized total ROU assets of $68.2 million and $0.3 million related to operating and finance leases respectively. We also recognized total lease liabilities of $70.7 million and $0.3 million related to operating and finance leases respectively. The adoption of this standard did not have a material impact on our consolidated statements of comprehensive loss and consolidated statements of cash flows. As of September 30, 2020, future minimum lease payments under operating and finance leases were approximately $63.7 million and $1.1 million, respectively.
In June 2016, the FASB issued ASU 2016-13, Financial Instruments—Credit Losses (Topic 326), which amends the accounting for credit losses on available-for-sale securities and purchased financial assets with credit deterioration. In addition, these amendments require the measurement of all expected credit losses for financial assets, including trade accounts receivable, held at the reporting date based on historical experience, current conditions and reasonable and supportable facts. The ASU is effective for fiscal years beginning after December 15, 2019, including interim periods therein. We adopted the new credit loss standard effective January 1, 2020 and the impact of the adoption was not material to our consolidated financial statements.
In January 2017, the FASB issued ASU 2017-04, Intangibles—Goodwill and Other (Topic 350): Simplifying the Test for Goodwill Impairment, which simplifies the process used to test for goodwill. Under the new standard, if the carrying amount of a reporting unit exceeds its fair value, an impairment loss shall be recognized in an amount equal to that excess, limited to the total amount of goodwill allocated to that reporting unit, therefore eliminating Step 2 of the goodwill impairment test. The ASU is effective for annual impairment tests for periods beginning after December 15, 2019. We adopted the new standard effective January 1, 2020 and the impact of the adoption was not material to our consolidated financial statements.
In August 2018, the FASB issued ASU 2018-13, Fair Value Measurement (Topic 820): Disclosure Framework—Changes to the Disclosure Requirements for Fair Value Measurement, which eliminates, adds, and modifies certain disclosure requirements for fair value measurements. This ASU is effective fiscal years, and interim periods within those fiscal years, beginning after December 15, 2019. We adopted this new standard effective January 1, 2020 and the impact of the adoption was not material to our consolidated financial statements.
In December 2019, the FASB issued ASU 2019-12, Income Taxes (Topic 740): Simplifying the Accounting for Income Taxes, which is intended to simplify various aspects related to accounting for income taxes. The new standard removes certain exceptions to the general principles in Topic 740 and also clarifies and amends existing guidance to improve consistent application. This guidance is effective for fiscal years, and interim periods within those fiscal years, beginning after December 15, 2020, with early adoption permitted. We adopted the standard on January 1, 2019, and the adoption of the standard did not have a material impact on our consolidated financial statements.
87
Table of Contents
In August 2018, the FASB issued ASU No. 2018-15, Intangibles—Goodwill and Other—Internal-Use Software (Subtopic 350-40): Customer’s Accounting for Implementation Costs Incurred in a Cloud Computing Arrangement That is a Service Contract. This standard aligns the requirements for capitalizing implementation costs incurred in a hosting arrangement that is a service contract with the requirements for capitalizing implementation costs incurred to develop or obtain internal-use software. For public entities, the updated standard is effective for fiscal years beginning after December 15, 2019, including interim periods within that fiscal year. The standard can be adopted either retrospectively or prospectively to all implementation costs incurred after the date of adoption. Early adoption is permitted. We elected to early adopt this ASU using the prospective method as of December 31, 2018 and, as such, have capitalized certain implementation costs associated with service contracts in a cloud computing arrangement. The adoption of this standard did not have a material impact on our consolidated financial statements.
Recently Issued But Not Yet Adopted Accounting Pronouncements
In January 2020, the FASB issued ASU 2020-01, Clarifying the Interactions between Topic 321, Topic 323, and Topic 815. The new guidance clarifies the interactions between accounting standards that apply to equity investments without readily determinable fair values. Specifically, it addresses the accounting for the transition into and out of the equity method. This standard is effective on a prospective basis for fiscal years, and interim periods within those fiscal years, beginning after December 15, 2020, with early adoption permitted. We do not believe the adoption of this ASU will have a material impact on our consolidated financial statements.
In March 2020, the FASB issued ASU No. 2020-04, Reference Rate Reform (Topic 848), Facilitation of the Effects of Reference Rate Reform on Financial Reporting. This standard provides optional expedients and exceptions for applying generally accepted accounting principles to contract modifications and hedging relationships, subject to meeting certain criteria, that reference LIBOR or another reference rate expected to be discontinued. The ASU is effective for all entities as of March 12, 2020, and will apply through December 31, 2022. We are currently evaluating the impact this adoption will have on our consolidated financial statements.
There have been no other new accounting pronouncements issued but not yet adopted that are expected to materially affect our consolidated financial condition or results of operations.
Inflation
Our revenues are dependent to a significant extent upon the level of U.S. new single-family residential spending, which is affected by factors such as interest rates, inflation, consumer confidence and unemployment. We do not believe that inflation has had a material impact on our business, financial condition or results of operations during the past three fiscal years.
Quantitative and Qualitative Disclosure on Market Risks
We are exposed to market risks related to fluctuations in interest rates on borrowings under our Revolving Credit Facility and our Term Loan Facility, which bear interest at variable rates. As of September 30, 2020 and December 31, 2019, we had no borrowings under our Revolving Credit Facility, $3.2 million in letters of credits issued under the Revolving Credit Facility and $392 million and $395 million, respectively, outstanding under our Term Loan Facility. Based on the amounts outstanding under our Term Loan Facility as of September 30, 2020 and December 31, 2019, a hypothetical change in the respective blended interest rates applicable to these borrowings of 1.0% would result in a change in annual interest expense of $3.0 million and $4.0 million, respectively.
For variable rate debt, interest rate changes generally do not affect the fair value of the debt instrument, but do impact future earnings and cash flows, assuming other factors are held constant. As disclosed above, effective January 2020 and expiring in December 2022, we entered into an interest rate swap agreement with respect to our
88
Table of Contents
Term Loan Facility to manage our exposure to interest rate changes. The interest rates under our Revolving Credit Facility and Term Loan Facility are calculated using LIBOR. It is not possible to predict the effect of possible changes or other reforms to LIBOR or the establishment of alternative reference rates in the United Kingdom, the U.S. or elsewhere. To the extent these interest rates increase, our interest expense will increase, in which event we may have difficulties making interest payments and funding our other fixed costs, and our available cash flow for general corporate requirements may be adversely affected. See “Risk Factors—Risks Related to Our Indebtedness—Restrictions in our existing credit arrangements, or any other indebtedness we may incur in the future, could adversely affect our business, financial condition, results of operations, our ability to make distributions to stockholders and the value of our common stock.”
89
Table of Contents
Our Vision
Our vision is to utilize our value-added technology platform combined with our national footprint and customer relationships to revolutionize the way homebuyers purchase and design their homes. By seamlessly connecting key constituents in the housing lifecycle, including homebuilders, homebuyers, suppliers and subcontractors, we believe we can unlock significant market opportunities.
Our Company
We are the leading national provider of technology-enabled sales and marketing, design and installation solutions for homebuilders. Our robust technology platform delivers interior design visualization, interior option selection, supply chain management and data analytics solutions from initial homebuyer engagement through the construction and delivery of homes. We are also the leading national installer for select high-value and aesthetically important interior finishes, such as flooring, cabinets and countertops, to our homebuilder customers, as well as multi-family, commercial and repair & remodel customers. Our scalable technology solutions enhance the homebuying experience, streamline the homebuying process and meaningfully drive homebuyer satisfaction, while improving homebuilders’ profitability, construction quality and cycle times. We serve a broad range of national, regional and local homebuilders across the home price spectrum, from entry-level to move-up and luxury homes, including each of the 20 largest U.S. homebuilders. We have the leading position in the estimated $23 billion U.S. new home interior finish solutions industry, and our technology solutions significantly expand our addressable market to other economic transactions associated with the housing lifecycle, including new construction pre-sales marketing, monetization of valuable consumer data and providing access to homebuyers for future design and renovation needs, amongst others. We generated 2019 revenues, net loss and Adjusted EBITDA of $1,785.4 million, $(15.8) million and $123.2 million, respectively.3
We have built the most expansive national footprint in our highly fragmented industry, which uniquely positions us to serve our national, regional and local homebuilding customers consistently and effectively across markets. Furthermore, we collect, analyze and report valuable data on over 100,000 new homes annually, creating the largest repository of homebuyer design preference data in our industry. Our national network is comprised of 110 design studios, 109 warehousing and logistics centers and nine countertop fabrication facilities, from which we serve approximately 285 Metropolitan Statistical Areas (“MSAs”), including 46 of the top 50 U.S. homebuilding markets based on 2019 single-family housing starts. We are more than three times the size of our next largest direct competitor, based on number of locations. With an estimated market share today of only 6% based on 2019 single-family residential revenues, we believe we have significant runway for growth.
Our design studios serve to manage a key part of the homebuying process where homebuyers design, select and upgrade the interior finishes of their new home. We operate 64 builder-branded design studios on behalf of 20 homebuilders across the country, as well as 46 ILG-branded design studios that provide the same professionally-managed design experience for multiple homebuilders in a single location.
| 3 | For a definition of Adjusted EBITDA, as well a reconciliation to the most directly comparable GAAP measure, see “Non-GAAP Measures” and “—Summary Historical Financial Data.” |
90
Table of Contents
The following map illustrates our expansive national footprint.
We have an experienced team of approximately 4,200 employees, including approximately 300 design professionals and approximately 470 field managers, and utilize approximately 9,000 independent installation subcontractors. Additionally, our technology team includes approximately 140 software engineers, digital artists and technology specialists that facilitate the continual advancement of our industry-leading technology platform. In order to accelerate development of our technology solutions, we have added 40 new members to the technology team in 2020 alone and expect to continue to grow this group in 2021.
Our differentiated technology suite simplifies and enhances the home buying experience and has positioned us at the forefront of digitization in the homebuilding industry. Advancements in visualization technology and younger demographics reaching peak homebuying age have led to increasing demand for a more virtual homebuying and home design experience in recent years. Additionally, we believe the COVID-19 pandemic has been a catalyst for virtual engagement by homebuyers, resulting in a substantial increase in the use of our technology platform by our customers. We adapted our business model quickly to meet the increased demand for fully virtual offerings and we believe we will continue to benefit from our innovative business model. Many of our homebuilding customers are also reporting substantial increases in website traffic, virtual tours, and full virtual sales. Homebuyers are now spending, on average, four hours in our web-based design and option selection systems—a 24% increase in system usage in 2020 compared to 2019. Similarly, we have seen a notable increase in the percentage of our homebuyers who have completed their interior option selections via fully virtual appointments utilizing our technology platform in 2020 compared to 2019. Nearly 10% of all design sessions are now conducted virtually and the demand for online design appointments continues to increase. We believe we have the leading end-to-end technology platform that meets this demand and delivers a dynamic, digitally-enabled homebuying experience. Our engaging visualization technology allows homebuilders to offer photo-realistic virtual home tours as a marketing tool, eliminating the need to build costly model homes for every community, accelerating the pre-marketing window for each community and potentially shortening the overall sales cycle. Our cutting-edge option selection tools utilize visualization and real-time pricing technology to create a personalized, user-friendly design experience customized to the homebuyer’s community, floor plan and budget. Our streamlined integration with homebuilder back office systems creates valuable connectivity throughout the construction process, allowing us to improve construction quality, decrease cycle times and increase customer stickiness. In addition, our systems collect, analyze and report on vast quantities of valuable data, including homebuyer design preferences on over 100,000 new homes annually, which empowers homebuilders and suppliers with critical insight into evolving homebuyer preferences. Homebuilders use our proprietary analytics to tailor their product offerings and pricing by community to further drive incremental option sales and improve profitability. We have made significant technology investments to build our differentiated and scalable technology platform, which we believe will continue to further enhance our
91
Table of Contents
profitability and grow our revenue as we expand our footprint with existing and future customers and add new technology solutions.
We have grown considerably, more than doubling our business over the past three years, both organically and through acquisitions. Our organic growth has been driven by the addition of new design studios, new customer additions and increased penetration of existing customers, all of which is underpinned by our expanding technology offering. Technology-enabled solutions have further accelerated our organic growth, and adoption of these solutions by leading homebuilders has contributed to significant growth in our revenue generated by the top 10 U.S. homebuilders from 2015 to 2019. Our recent technology developments, including our photo-realistic visualization technology, have the potential to significantly accelerate the digitization of the homebuilding industry and drive further organic growth through increased adoption by new and existing homebuilders. In addition to our organic growth, we believe we are an acquirer of choice in our industry. We have completed over 18 acquisitions since 2013, which is more than any of our direct competitors, and we believe we have the opportunity to execute additional accretive acquisitions in our highly fragmented industry.
Historically, we have leveraged successful partnerships with homebuilders in specific markets to expand into additional geographies and product categories, which generally increases our profit margins by leveraging our infrastructure and personnel across a denser geographic footprint. We do not currently offer installation services for all three key product categories (i.e. flooring, cabinets and countertops) in all of our existing geographic markets. As such, we believe that expanding our service offering to capture incremental installation services offers significant growth opportunities. We also intend to drive margin expansion through purchasing efficiencies, economies of scale on both a local and national basis and the continued consolidation to a single integrated technology platform across our geographic markets.
Our Value Proposition
The chart and graphic below summarize our value proposition and the technology-enabled solutions we
deliver to the key constituents in the homebuilding value chain.
| Constituent |
ILG Value Proposition | |
| Homebuilders |
• Streamline marketing, sales generation, and design process • Improved homebuyer satisfaction levels • Maximize option profitability • Improve cycle times • Provide valuable data analytics and insights | |
| Homebuyers |
• Fully customize their home design and furnishings • Improve homebuyer satisfaction • Leverage fully remote visualization tools for options selection • Access to designers to facilitate decision making | |
| Designers |
• Collaborate on home design process • Ability to work with homebuyers in virtual setting • Real-time pricing capabilities • Data analytics inform design decisions | |
| Suppliers |
• Predictive analytics on homebuyer trends • Ability to showcase products in a physical or virtual design studio • Integrated systems facilitate efficiencies • Real-time pricing capabilities | |
| Installers |
• Provide consistent, predictable work • Increase productivity through technology | |
92
Table of Contents

Our comprehensive suite of solutions provides meaningful value to each of the following constituencies:
Homebuilders
We have long-standing customer relationships with national, regional and local homebuilders as a result of our proven ability to drive increased homebuilder profitability through our technology solutions. We provide customized, value-added design studio solutions, critical insight into homebuyer demand trends and superior service, from pre-sale marketing to homebuyer option selection to supply chain management and installation. Homebuilders benefit from our valuable design expertise and installation capabilities, allowing them to focus on their core competencies in land procurement and development, home sales and construction management. Our visualization technology offers builders the ability to provide photo-realistic virtual tours of multiple floorplans to prospective homebuyers without needing to visit a physical model home. Our option selection technology, real-time pricing engine, and skilled design professionals enhance the homebuyer experience and drive homebuilder profitability by increasing sales of options and upgrades, while our turnkey supply chain management and installation services drive construction quality and process efficiencies. On average, buyers who use our online systems spend 25% more on interior options and upgrades compared to buyers that do not. We also offer supply chain management and installation services to homebuilders through our builder direct solutions, where our customers benefit from our extensive supplier relationships, service excellence and multi-product capabilities. Our streamlined integration with homebuilder back office systems helps our customers and our teams improve construction quality, decrease cycle times and increase customer stickiness We complement our integration capabilities with extensive data analytics to offer insight into evolving design trends and homebuyer preferences and assist homebuilders in optimizing their option offerings and making home design and community investment decisions. Our ability to deliver fully-integrated services enhances our ability to retain customers over time.
We serve each of the top 20 U.S. homebuilders based on 2019 home closings. The top 20 U.S. homebuilders accounted for approximately 30% of total home closings in 2019, up from approximately 17% in 2000, according to Builder Magazine Online. We believe this increase in market share is due to the largest homebuilders benefiting from the financial and operational efficiencies associated with combining a national platform and local market concentration in the nation’s most attractive housing markets.
93
Table of Contents
Approximately 80% of our 2019 revenues were derived from sales to the new single-family residential market. The following graphic illustrates the critical link we represent in the interior finish value chain for homebuilders.
Homebuyers
Our direct and personal interactions with homebuyers enable us to meaningfully drive homebuyer satisfaction. Our design studio solutions streamline the often disjointed and overwhelming option selection process by creating a personalized and well-organized design experience. We offer tailored option selection tools, ranging from self-guided web portals for browsing interior finishes to one-on-one appointments with trained design professionals, which can take place in strategically laid out and conveniently-located showrooms or through virtual meetings. Homebuyers benefit from our design expertise and user-friendly visual selection tools that allow them to experience photo-realistic interior finish options and compare real-time pricing for options that are customized to their community and floor plan. Once option selections are made, our turnkey installation services facilitate timely and high-quality completion for the homebuyer.
Suppliers and Installers
We maintain strong relationships with our broad supplier base and we are the largest new single-family residential customer for many of our suppliers. Our supplier relationships typically are negotiated at the national level but coordinated at the regional level, driving both local efficiency and overall cost-effectiveness. We provided interior finishes for more than 100,000 new single-family homes in 2019, which is more than any U.S. homebuilder; the breadth of our direct homebuyer interactions enables us to provide suppliers with valuable insight into homebuyers’ evolving preferences. Suppliers value our ability to help them optimize product offerings to be leaders in the latest design trends. In addition, we believe independent installers are eager to work with us due to our extensive customer-base, consistent job volumes and rapid payments, which we believe is a competitive advantage in an increasingly competitive market for workers. Our strong relationships across our supply chain position us favorably relative to our competitors.
Multi-Family, Commercial and Repair & Remodel Customers
In addition to single-family homebuilders, we are a critical partner to a broad range of multi-family, commercial and repair & remodel customers, including new multi-family and light commercial contractors, multi-family owners and operators, senior living operators, home improvement retailers, single-family rental operators and single-family repair & remodel customers, where homeowners spend over $330 billion annually to repair and renovate their homes according to the Joint Center for Housing Studies of Harvard University. We provide turnkey supply chain management and installation services for these customers across a wide range of project types and job sizes. Whether we are managing the interior finish installation process for a large new multi-family apartment complex or providing replacement flooring on a tight timeline for single-family rental home turnover, we offer a streamlined process and high-quality end result from a trusted provider. In addition, we provide customized technology solutions such as online ordering options for property managers. We leverage
94
Table of Contents
our infrastructure to cost-effectively serve this customer base across multiple markets with strong service levels, efficiency and valuable local expertise.
Our Industry
The interior finish solutions industry is a large, growing and highly fragmented market in which we are the leading national provider. We primarily serve the new single-family residential market, while also serving the new multi-family residential, commercial, and repair & remodel markets. The average installed cost of flooring, cabinets and countertops in a new single-family home was approximately $25,500 in 2019, according to the NAHB. Assuming 2019 U.S. single-family housing starts of approximately 887,700 based on U.S. Census Bureau data, this implies a potential addressable market of approximately $23 billion, with future upside through the addition of adjacent product categories, increases in interior finish spend per home and incremental housing volumes. Additionally, our technology solutions significantly expand our addressable market to include other economic transactions associated with the housing lifecycle, including new construction pre-sales marketing, monetization of valuable consumer data and providing access to homebuyers for future design and renovation needs, amongst others.
Purchasing and designing or renovating a home has historically been facilitated by model homes and physical design studios. While our services today are largely delivered through physical design studios, we are seeing an increased shift towards digitization and a more virtual and technology-oriented model, driven by evolving homebuyer preferences. We believe that the long-term shift to digital solutions is fundamentally changing our market, with more homebuyers and homeowners preferring to review options and make design selections online. Beyond the convenience that comes with making selections virtually, our options selection tools, powered by our visualization technology, provide a more visual and real-time experience, allowing homebuyers and homeowners to see digital renderings of their designs rather than relying on samples and swatches. The ongoing shift in preference towards digital solutions is especially true for younger homebuyers and homeowners. In a recent survey from the National Association of Realtors, approximately 30% of those in younger demographics stated that they would be comfortable buying a house completely virtually. These long-term shifts have accelerated in the current COVID-19 pandemic with social distancing guidelines. We expect that these trends will lead to significant interest from both homebuilders and homeowners to increasingly implement digital solutions in the process of purchasing and designing a new home.
New Single-Family Residential Market
The new single-family residential market, valued at approximately $306 billion as of September 2020, is the primary market in which we operate. According to the NAHB and the U.S. Census Bureau, since 2011, cumulative net U.S. household formations have exceeded total housing starts by greater than 1.5 million units, leading to a significant backlog of demand for new housing. We expect the continued growth in the overall population, the aging of approximately 70 million millennials into their prime household formation and homeownership years, and the long-term effects of the COVID-19 pandemic to provide support for continued growth in new single-family residential construction. In addition to the long-term effects of COVID-19 on the industry, the public homebuilders are currently experiencing a significant rebound in net new orders. We typically benefit from an increase in net new orders once those homes are completed, which have historically averaged approximately 6 months after an initial order, and therefore we believe the current trends will benefit us in 2021. Furthermore, public homebuilding companies have reported increasing backlog value throughout 2020, which further supports increased deliveries in 2021.
Single-family housing starts remain below their long-term historical average and, according to the NAHB, are projected to grow at a 3.9% compound annual growth rate (CAGR) from 2020 to 2022. In addition, our large homebuilder customers have been gaining market share due to a long-term shift in the way homeowners approach the home purchasing process.
95
Table of Contents
Source: U.S. Census Bureau Historical Data.
Source: U.S. Census Bureau Historical Data.
Repair & Remodel, Multi-Family and Commercial Markets
The residential repair & remodel market has been growing at a 4% CAGR since 2014. According to the Joint Center for Housing Studies of Harvard University, homeowner improvement and repair spend is expected to be approximately $338 billion in 2020. As new home construction has lagged historical build averages over the last decade, the average home age has steadily increased to over 40 years in the U.S. which we expect to result in an increase in repair and remodel spend over time. The market is also supported in the near term by a greater portion of the population staying at home due to the COVID-19 pandemic and spending incremental income on home repairs and renovations. Our core categories (flooring, cabinets and countertops) are typically high-priority items for homeowners to renovate due to their high visibility. We also expect continued growth in the multi-family repair & remodel market, driven primarily by the age of the housing base, with approximately 80% of the multi-family housing base built before 2000 as well as growth in demand for multi-family housing.
We provide supply chain management and installation services to the commercial and multi-family construction market, primarily focusing on apartment buildings, hotels, senior living facilities and light commercial contractors. According to the American Institute of Architects (AIA), non-residential construction spend is estimated to be approximately $400 billion in 2020 and the NAHB is expecting 393,000 multi-family housing starts in 2020.
96
Table of Contents
Our Strengths
We benefit from the following key competitive strengths:
Clear Market Leader with an Unrivaled National Network
We are the leading national provider of technology-enabled sales and marketing, design and installation solutions for homebuilders. We have the leading market position in the approximately $23 billion U.S. new home interior finish solutions industry, and our scale and technology differentiation provide unique capabilities that attractively position us relative to our competitors.
Amidst an increasingly consolidated homebuilder landscape, our national footprint, leading technology platform and execution capabilities position us as a preferred partner to large national and regional homebuilders across the U.S. In addition, our national scale, combined with leading local market positions, drive strong supplier and local workforce relationships that allow us to capture meaningful supply chain efficiencies and deliver consistent, high-quality installation services. We believe independent contractors are eager to work with us due to our extensive customer-base, consistent job volumes and rapid payments, which we believe is a competitive advantage in an increasingly competitive market for workers.
Differentiated Technology-Enabled Solutions
We have made significant investments to build a robust technology platform that we believe differentiates our value proposition to homebuilders and enhances the user experience for homebuyers. Our end-to-end technology suite starts with pre-sales marketing solutions, offering photo-realistic virtual tours of floor plans to prospective homebuyers, eliminating the need for time-consuming in-person tours and potentially eliminating the need for costly model homes. Once a homebuyer has purchased a home, we offer online option selection tools that utilize visualization technology to allow homebuyers to conveniently browse thousands of customized product options in advance of design appointments—whether in-person or virtual—and create an online “wish list” for their new home with real-time pricing. Our design professionals have access to this key information and use it during design appointments to focus on a particular homebuyer’s preferences and tailor their sales approach to maximize upgrade sales. Our technology integrates with homebuilder back office systems to help improve construction quality, decrease cycle times and increase customer stickiness. The wealth of data captured by our technology also offers critical insight to homebuilders that influences their product offerings and community design and investment decisions. The over 100,000 homes we serve annually vastly outnumbers the number of homes built by even the largest national homebuilders, which enhances the value of the data we collect. We continue to invest in technological innovation to create new opportunities for expansion, from additional visualization applications, such as supplier product selections, to market and data analytics for homebuilders and product manufacturers. We believe that our investments in technology will significantly expand our addressable market as we seek to capture additional economic transactions in the housing lifecycle.
Superior Customer Value Proposition
Our comprehensive suite of sales, marketing, design and installation solutions delivers a superior value proposition to our customers. Our design solutions drive increased homebuilder sales and profitability, improved operating efficiency and an enhanced homebuyer experience. Our ability to increase efficiency and profitability for our homebuilder customers is critical to our value proposition. Our builder-branded design studios offer a dedicated solution for larger homebuilders, while our ILG-branded design studios provide the same professionally-managed design experience for multiple regional homebuilders in a single location. We have also proven the ability to serve our customers digitally, as we have seen a notable increase in the percentage of our customers that have completed fully virtual design selections in 2020 compared to 2019. Our expanding technological capabilities, particularly around visualization, are accelerating the digitization of the homebuilding industry and enhancing the homebuyer experience for homebuyers across the size and price spectrum. Interior
97
Table of Contents
option sales are an important driver of homebuilder profitability, and we focus on high-touch products, such as flooring, cabinets and countertops, that homebuyers view as critical to the design aesthetic and overall home satisfaction. Our commitment to providing excellent service and quality from the design appointment through installation enhances the overall homebuyer experience, further benefitting our homebuilder customers. As a result of our strong value proposition and proven track record, we have developed long-standing customer relationships, as demonstrated by our minimal customer turnover, and we frequently benefit from exclusivity across specified products and geographic markets. In addition, we utilize our strong supplier and independent contractor relationships to serve as a valued provider of supply chain management and installation services for homebuilders through our builder direct solutions, as well as for a diverse range of multi-family, commercial and repair & remodel customers.
Robust Supply Chain Capabilities
We are the largest new single-family residential customer for many of our suppliers, which we believe allows us to achieve superior pricing, product selection and supply chain efficiencies relative to our competitors. We manage the complex process of matching product supply to homebuyer demand for our customers, leveraging our data-driven insights to guide simplified product offerings that focus on high-demand options. Similar to our homebuilder customers, we also provide value-added insights and data analytics to our suppliers that we believe we can monetize over time.
Successful Track Record of Identifying, Executing and Integrating Acquisitions
We operate in a highly fragmented industry, where we believe our resources, experience and access to capital position us to capitalize on the significant opportunity to execute accretive acquisitions and enhance our market position. We have completed approximately 18 acquisitions since 2013, which is more than any of our direct competitors. We have completed both tuck-in and transformative acquisitions, with an average purchase multiple below seven times the adjusted annualized EBITDA. Our senior management team has significant experience executing a disciplined acquisition strategy and has institutionalized best practices for successful integration and synergy realization. As a result of our management tenure, history of successful acquisitions and local entrepreneurial cultures, we have extensive relationships in our industry and are an acquirer of choice among potential acquisition targets.
Strong Balance Sheet and Free Cash Flow Generation
On a pro forma basis to reflect the net proceeds from this initial public offering, we expect our net leverage will be approximately times 2019 Adjusted EBITDA.4 The capital requirements of our business are relatively low, as our primary investments are focused on technology innovation, design studios and countertop fabrication equipment. We are focused on managing our working capital as part of our efficient supply chain operations, as evidenced by our inventory turning more than 15 times per year and an overall cash conversion cycle of fewer than 30 days. We believe our relatively low leverage compared to public company peers, coupled with our strong free cash flow generation and prudent capital management, provides us significant advantages in today’s environment, including the flexibility to continue to grow organically and through acquisitions, as well as maximize our asset efficiency.
Proven Management Team and Entrepreneurial Culture
Our senior management team, led by CEO, Alan Davenport, and President and COO, Jason Peel, has been instrumental in developing our innovative business model. The deep industry knowledge and customer and supplier relationships of our management team are a competitive advantage in executing our strategy. Our key
| 4 | For a definition of Adjusted EBITDA and net leverage, as well a reconciliation to the most directly comparable GAAP measures, see “Non-GAAP Measures” and “—Summary Historical Financial Data.” |
98
Table of Contents
executives have an in-depth understanding of how to best serve our customers as a result of their extensive experience in the interior finish solutions industry as well as other areas of the homebuilding and building products supply chain. Our entrepreneurial culture and deeply experienced local and regional management teams drive service excellence and nimble decision-making, empowering local collaboration with customers, suppliers and installers. Our vision is not attainable without our employees, and our future success will in large part be determined by the talent, skills and culture of our workforce. We strive to foster a diverse and inclusive workforce and we recognize a responsibility to advance our human capital management strategies to attract, develop and safeguard the well-being of our talented and dedicated workforce, including our employees, partners and suppliers. The board is also engaged with management to create a corporate culture that embodies the attributes and behaviors necessary to advance our vision and execute on our strategies.
Demonstrated and Growing Commitment to Environmental, Social and Governance Matters (ESG)
We continue to increase our focus on ESG initiatives to ensure that we as well as our services and solutions promote a commitment to these important areas. Regarding social initiatives, we are constantly focused on the health and safety of our employees in all aspects of the workplace. In response to the ongoing COVID-19 pandemic, we have provided many of our employees with the ability to work remotely, increased the cleaning and sanitizing of our offices and facilities and have implemented strict safety and health measures at remote worksites. We also seek to promote community involvement and diversity in our organization. We encourage our employees to give back to the community and foster social change by providing them with a paid day off to get involved in charitable and community activities. We have established a diversity committee chaired by our female CFO. We have implemented and are continuing to implement important corporate governance and risk management practices as well, including compensation programs with increased focus on performance-based equity compensation.
Our Growth Strategy
Our objective is to achieve profitable growth and increase stockholder value through the following key strategies:
Gain Market Share Through Unique Visualization Tools Addressing Changing Customer Preferences
We have a proven ability to expand our solutions with existing homebuilder customers over time, layering design studio and technology solutions on top of existing installation services to grow our wallet share and enhance our customer stickiness due to our technology integration with homebuilder back office systems. Technology is one of the hallmarks of our solutions-oriented business model, and we plan to continue to invest in further differentiating our offering. We believe the homebuilding industry is still in the early stages of leveraging technology and data analytics to more efficiently design, market, sell and deliver homes. We believe we are one of the industry leaders in this area and our scale positions us to continue to invest more than our competitors in technology and innovation, as evidenced by our technology spend of over $60 million over the past three years. We intend to continue to develop leading-edge technology tools that enrich the user experience, optimize sales and profitability, and enhance service levels and operational efficiency for our customers.
One of our key development priorities has been to expand our visualization features, which we have accelerated through our recent acquisition of Roomored, a leading visualization SaaS provider. The market continues to shift towards a more virtual homebuying experience as younger demographics begin to enter their prime homebuying years. For example, according to Apartment List, 80% of millennials state that buying a home is an important personal goal, and approximately 30% of the younger demographic population would be willing to buy a home fully online, according to a recent survey from the National Association of Realtors. These tailwinds emphasize the importance of rich, real-time visualization capabilities and digital marketing platforms in the current environment. Our superior virtual capabilities and design tools will continue to position us to take advantage of these trends, while also enabling us to gain additional data insights to understand changing homeowner preferences and provide feedback to our homebuilder, supplier and installer partners.
99
Table of Contents
Execute on Our Technology Roadmap to Increase Revenue Streams Throughout the Entire Lifecycle of a Home
Our technology strategy is to expand our total addressable market to capture incremental economic transactions associated with the housing lifecycle. We believe that our access to over 100,000 homebuyers annually leaves us uniquely positioned to capitalize on this opportunity. Our technology roadmap is focused on continued enhancement of our design and selection capabilities, monetization of our significant repository of homebuyer data, and creating a digital marketplace to connect homebuyers, suppliers and installers for any future repair and remodel needs. In addition, we plan to capitalize on artificial intelligence-driven technology to show homeowners products and solutions of interest, to the benefit of both the homeowners, homebuilders and product partners.
Expand Our Extensive Relationships with Leading Homebuilders
We have a proven track record of growing our business with key customers, with our revenues from the top 10 U.S. homebuilders more than tripling from 2015 to 2019 through organic growth and acquisitions. Furthermore, from 2017 to 2019, we grew organic revenue from multiple key customers by more than 20%. Today we serve many of the leading national and regional homebuilders in the U.S. in multiple markets. We have an opportunity to substantially expand these relationships over time. In 2019, we served approximately 75,000 homes to our national accounts, which represent key scaled homebuilding customers that management has strategically aligned with across core markets. These customers delivered approximately 250,000 new homes in total, providing an opportunity to meaningfully increase penetration within our existing customers. We intend to continue to leverage our national footprint, technology platform and strong reputation for consistently superior execution to serve these customers in additional markets. Today, we operate 64 builder-branded design studios on behalf of 20 homebuilders across the country, as well as 46 ILG-branded design studios that provide the same professionally-managed design experience for multiple homebuilders in a single location. Our larger design customers collectively have operations in over 250 MSAs that we do not serve with our builder-branded model, providing significant runway for continued expansion, particularly in high growth attractive housing markets in the South and Southeast. Likewise, we provide builder direct solutions to national and regional homebuilders in multiple markets today, and we look to further penetrate these relationships in many more of the markets they serve. In addition, we have been successful in converting a number of builder direct customers to our design studio solutions, and in expanding the scope of our technology solutions to our design studio customers. Our investments in technology also significantly enhance our ability to serve new customers remotely outside of our design studio footprint. As an example, we recently executed a multi-year agreement with one of our national homebuilder customers to serve as their sole-source visualization provider for all interior finishes, regardless of whether we provide their installation services in a given market.
Expand Product Installation Capabilities Across Additional Markets
We perform supply chain management and installation services for flooring products across substantially all of our geographic markets. However, we offer cabinet and countertop installation services in only approximately 38% and 35% of these markets, respectively. We believe there is significant opportunity to grow our business in these and other products, through both expansion across geographic markets and increased penetration of the markets we currently serve. By expanding our supply chain management and installation services to additional products, we believe we can increase our potential revenues and profit per home and deepen our homebuilder relationships.
Drive Margin Enhancement Through Scale, Operational Initiatives and Technology Investments
We have demonstrated a proven ability to expand our margins over time and achieve industry-leading returns on invested capital. Our favorable margin profile is in part due to increasing our scale in specific markets, as we typically generate the highest margins in regions where we maintain leadership positions. Local economies of scale allow us to better leverage field managers, warehouses, and installation crews on a per home basis; as
100
Table of Contents
such, we expect to enhance our profitability as we achieve additional regional scale. We have also meaningfully expanded our margins through operational efficiencies and our investments in technology to improve our integration with homebuilder back office systems. Today, we believe we are optimized in the markets that collectively represent approximately 41% of our revenues for the nine months ended September 30, 2020. Our optimized markets demonstrate the aforementioned characteristics and generate margins in excess of our corporate average. Finally, the monetization of our technology initiatives, such as our visualization capabilities, are generating revenue at significantly higher margins, with technology-enabled revenue generating gross margins more than 800 bps higher than our builder direct revenue. We believe we can materially increase our overall margins in the long term through our technology initiatives.
Pursue Value-Enhancing Acquisitions in a Highly Fragmented Market
We estimate that approximately 80% of the interior finishes solutions industry remains highly fragmented. Our successful and disciplined acquisition strategy has provided us access to new technology, customers and markets, expanded our product capabilities, deepened our management team and enhanced our operational best practices. We will continue to focus on acquisitions that meet our criteria for growth, returns, technological advancement, market expansion, customer and product expansion and synergistic operations at attractive valuations. We believe our scale and access to capital relative to our competition, together with our senior management team’s strong relationships and reputation and vast and talented workforce, position us to take advantage of the many acquisition opportunities in our fragmented industry.
Pursue Growth Opportunities in Multi-Family, Commercial and Repair & Remodel End Markets
We employ our scale and supply chain management and installation expertise to serve a broad range of customers in multi-family, commercial and repair & remodel end-markets. These customers collectively represented approximately 20% of our 2019 revenues and provide another channel of growth outside of the new single-family residential market. We expect to continue to expand existing and develop new relationships where we can efficiently and effectively leverage our existing supply chain management and installation services to enhance our growth and profitability. Within these end markets, additional revenue opportunities include multi-family and light commercial contractors, multi-family owners and operators, senior living operators, single-family rental operators and home improvement retailers, where the largest companies have grown extensively through industry consolidation since the housing recession.
Interior Finish Expertise
We have expertise in design studio management, supply chain management and turnkey installation of the following interior finishes:
| • | Flooring (carpet, wood, tile, vinyl, laminate) and vertical tile and stone |
| • | Cabinets |
| • | Countertops |
| • | Window treatments |
The turnkey installation of flooring, including vertical tile and stone, accounted for approximately 74% of our 2019 revenues. We perform supply chain management and installation services for flooring products across substantially all of our geographic markets, while we currently offer cabinet and countertop installation services in approximately 38% and 35% of these markets, respectively.
We offer supply chain management and installation services for these products in both our design studio solutions and our builder direct solutions. The products we offer in a particular region or design studio vary based on several factors, including local market capabilities and expertise and the preferences and profiles of our
101
Table of Contents
customers. We collaborate closely with homebuilders to tailor their product offerings and pricing by community. In some of our design studios, we offer homebuyers a variety of options for flooring, cabinets, countertops and window treatments, as well as option selection services for other builder options, such as plumbing and electrical fixtures, appliances and millwork.
Our operations also include strong expertise serving commercial, multi-family and repair & remodel customers. Our supply chain management and installation services for these customers utilize similar products, including flooring and countertops. We leverage our extensive branch network, service centers and countertop fabrication facilities to provide turnkey product installation services for these customers.
Technology Platform
Our differentiated technology creates significant value for our homebuilders and other customers. Our technology platform delivers interior design visualization, interior option selection, supply chain management and data analytics solutions from initial homebuyer engagement through the construction and delivery of homes. We have developed an end-to-end technology platform that offers a dynamic experience from homebuyer option selection through product installation.
Our engaging visualization technology allows homebuilders to offer photo-realistic virtual home tours as a marketing tool, eliminating the need to build costly model homes for every community, accelerating the pre-marketing window for each community and potentially shortening the overall sales cycle. Once a buyer has signed a contract to purchase a home, homebuilder representatives can schedule design studio appointments for the homebuyer through our design appointment scheduling tool that provides real-time availability for each of the design professionals at the applicable design studios. Prior to their design studio appointment, homebuyers can conveniently review interior finish options in the comfort of their own home using our visualization technology, which is integrated with homebuilder back office systems to help improve construction process and decrease cycle times. Homebuyers can browse available product options, such as cabinets, plumbing fixtures, lighting fixtures and appliances, and view pricing, features and specifications, use and care instructions, warranty information and images. All of this information remains accessible to the homebuyer for the duration of the option selection process. As they browse, homebuyers can use our visualization technology to conveniently browse thousands of customized product options in advance of design appointments—whether in-person or virtual – and create an online “wish list” for their new home with real-time pricing. Our visualization engine provides homebuyers and homeowners with a more visual and real-time experience, allowing homebuyers and homeowners to see themselves in their designs rather than relying on samples and swatches. Our design professionals have access to this key information and use it during design studio appointments to focus on a particular homebuyer’s preferences and tailor their sales approach to maximize upgrade sales.
During virtual or in-person appointments with homebuyers at our design studios, we utilize both the information generated by our software solution as well as our proprietary design software, to assist in coordinating selections. A homebuyer’s customized home floor plan is loaded into our design system prior to a design studio appointment, enabling homebuyers and design professionals to visually configure and price flooring, cabinets, countertops and wall tile in real time. Our design systems employ our proprietary algorithms that allow homebuyers to view certain option selections within their specific floor plan, make changes to such selections and immediately quantify the pricing impact of any such change.
In addition to our design studio tools, our integrated ERP system, along with our supply chain management and installation-related technology tools, enable us to manage workflows across our business processes. We are in the process of completing the implementation of an ERP system and associated core technology tools across our company. Presently, more than 50% of our revenues are processed through our ERP system. While this implementation is complex and time-consuming, we believe this will assist us in improving our integrated supply chain management and installation services capabilities to better serve our homebuilder customers.
102
Table of Contents
Our technology solutions allow us to collect and analyze vast quantities of data concerning homebuyer preferences for particular options across geographies, homebuyer demographics and home prices, allowing us to monitor trends, continually improve our product and services offerings and, ultimately, assist homebuilders in optimizing interior finish options to drive homebuilder profitability. This information is shared with our homebuilder customers to enable them to improve merchandising selections, drive revenue upgrades and improve installation quality and timeliness. We have continued to invest in the development of software platforms that will integrate with our visualization technology and support web-based, model-home marketing and the homebuyer interior option selection process.
Sales and Marketing
Our sales strategy is focused on expanding relationships and market share with large national and regional homebuilders. Option sales are a significant source of profitability for homebuilders. A decision to outsource the interior finish selection function involves a homebuilder entrusting a third-party to have direct contact with their homebuyer customers in an important phase of the home purchasing process. Accordingly, a homebuilder’s decision to outsource its interior finish selection function is typically made at the most senior levels of a homebuilder’s organization. Our senior executives maintain close relationships with their counterparts at our customers and prospective customers. Our sales process often begins with senior-level discussions, and our decision to enter a new market is often driven by the presence in such market of one or more large customers with whom we have pre-existing relationships. We currently serve each of the top 20 largest U.S. homebuilders, and our core growth strategy is to leverage those existing relationships to new markets.
Our end-to-end technology suite starts with pre-sales marketing solutions, offering photo-realistic virtual tours of floor plans to prospective homebuyers, eliminating the need for time-consuming in-person tours and potentially eliminating the need for costly model homes.
We target national, regional and local customers with meaningful scale in a given market for our builder- branded design studio solutions. We utilize a data-driven sales approach to tailor customized solutions specific to builders’ land positions and community designs, demonstrating our ability to increase homebuilder revenue and margins through our technology and consistent execution.
Target customers for our ILG-branded design studios are typically national, regional or local homebuilders without the scale in a given market to substantiate the investment in a builder-branded design studio. Generally, our regional leadership teams and sales executives leverage our technology tools combined with our local expertise and capabilities to develop these customer relationships.
Our sales efforts include national, regional and local relationships. While we have dedicated national account teams, the majority of our sales personnel are based in a local region or market. These account executives maintain strong regional customer relationships and help sell our solutions to national, regional and local customers. This includes selling to design studio customers, to builder direct customers, as well as our multi-family, commercial and repair & remodel customers. Generally, the compensation of our sales personnel is comprised of a base salary plus a commission, which is determined based on certain sales and profit metrics. The compensation structures for our sales personnel are highly varied depending on a number of factors, including geographic market, product category and seniority level. Our local supply chain management and installation capabilities, service excellence, deep relationships, and technology tools are instrumental in winning and expanding our business across all of our customer categories and geographic markets.
Customers
We serve national, regional and local homebuilders across the home price spectrum, from entry level to move-up and luxury homes. In addition to our homebuilder solutions, we are also a valued provider of supply chain management and installation services for a diverse range of multi-family, commercial and repair &
103
Table of Contents
remodel customers. No single customer represented more than 10% of our revenues for the fiscal year ended December 31, 2019 and for the nine months ended September 30, 2020, and the top 10 U.S. homebuilders accounted for approximately 42.7% of 2019 revenues. We have long-standing relationships with our customers, having served many of them for over 20 years.
We provide scalable solutions for our homebuilder customers. We generally provide design studio solutions to our homebuilder customers pursuant to design studio service agreements, which typically have multiple-year terms and set forth applicable agreed upon terms. These agreements are typically three to five years in tenor, but allow each party to cancel earlier. These agreements generally include the ability to pass along material cost increases from our suppliers. In addition to our design studio solutions, we offer supply chain management and installation services to homebuilders through our builder direct solutions.
In addition to single-family homebuilders, we are a critical partner to a broad range of multi-family, commercial and repair & remodel customers, including new multi-family and light commercial contractors, multi-family owners and operators, senior living operators, single-family rental operators and home improvement retailers. We provide turnkey supply chain management and installation services for these customers across a wide range of project types and job sizes.
Suppliers
We select suppliers based on several factors, including product quality, availability, customer service, local market preferences and price. We maintain strong relationships with our broad supplier base, and we are the largest new single-family residential customer for many of our suppliers. We have found that national suppliers are well positioned to meet our just-in-time ordering needs and respond to increased order volumes, and these suppliers often lead the market with respect to new product introductions and customer specifications. We generally purchase most product categories (e.g., carpet, wood, tile, cabinets, etc.) from more than one supplier in order to reduce our dependence on any single company and to maximize purchasing leverage. For the year ended December 31, 2019, our top ten suppliers accounted for approximately 68% of our purchases.
Our supplier relationships typically are negotiated at the national level but coordinated at the regional level, driving both local efficiency and overall cost-effectiveness. Our supply agreements are typically negotiated on an annual basis, and generally we have been able to pass on any increased product costs to our customers. We frequently negotiate multiple supply agreements with a supplier, each of which may cover a particular product category and/or a specified geographic region. We have not experienced any significant supply-related disruption. As we continue to grow, we expect to continue to benefit from additional supply chain management and efficiency advantages.
Workforce and Installation
Our products are installed in some of the most visible areas of a home and thus require high-quality products and installation. With respect to the installation workforce, we primarily contract with independent subcontractors to perform the installation of products that we offer to our customers. Accordingly, the timing and quality of our installations depend on the availability and skill of our independent subcontractors. Depending on market conditions, we may find it necessary to augment our workforce with additional independent subcontractors to ensure we can meet customer demand. In a few of our markets, we utilize our employees rather than independent subcontractors to perform installation services. Subcontractors comprised approximately 90% of our installation workforce as of December 31, 2019.
We seek to ensure specified quality levels by utilizing subcontractors who have proven their ability to reliably install products for us over an extended period of time. We have dedicated production management teams within all of our regions who are responsible for recruiting and managing our relationships with our independent subcontractors.
104
Table of Contents
We employ field managers to oversee and inspect our projects and track the performance of our subcontractor crews and we replace subcontractors and employee installers that fail to meet our installation standards.
Seasonality and Cyclicality
Our business is both seasonal and cyclical. Our products are installed near the end of the construction process and therefore typically lag housing starts by several months. Housing starts have historically been highest in the second and third quarters due to weather as well as seasonal selling peaks in most areas of the country. Accordingly, our sales are generally highest in the third and fourth quarters. We expect this seasonal pattern to continue, but it may be affected by volatility in the weather as well as in the new construction industry, including the impacts from the COVID-19 pandemic, and we can make no assurance as to the degree to which our historical seasonal patterns will continue, if at all.
Construction-based businesses are also generally cyclical. Our financial performance will be impacted by economic changes nationally and locally in the geographic markets we serve and is subject to cyclical market pressures. Our operations are subject to fluctuations arising from changes in supply and demand, national and international economic conditions, workforce costs, competition, government regulation, trade policies, and other factors that affect the construction industry such as demographic trends, interest rates, housing starts, average home selling prices, interior options and upgrades, commercial construction activity, employment levels, consumer confidence, and the availability of credit to homebuilders, contractors and homeowners.
Competition
The market for interior finish solutions and related supply chain management and installation services is highly competitive. The interior finish solutions industry is highly fragmented, consisting primarily of regional and local private businesses that typically have a small geographic footprint and limited product offerings and supplier relationships. While we are currently the leading national provider of interior finish solutions for homebuilders, our competitors include two national providers and several regional and local competitors that offer interior finish, supply chain management and installation services. In addition, we expect to face increased competition from current and future companies in the property technology industry as the demand for virtual and digital technology grows.
We believe competition for interior finish solutions is based on the ability to deliver value to homebuilders and their homebuyer customers, including design studio merchandizing and product selection, state-of-the-art technology tools, ability to drive profitable upgrade sales, installation timeliness, quality and price. We have established a strong track record with homebuilders and homebuyers through our high-quality and on-time installation process. We believe we will continue to compete effectively in our markets because of our leading market position, national scale, technology tools, strong homebuilder relationships, volume purchasing advantages, installation expertise, and differentiated service offerings.
Our builder-direct solutions tend to be more price-competitive than design studio solutions, although customer service and the timeliness and quality of installation remain competitive factors. Although the supply chain management and installation market is highly competitive, we believe our scale, technology tools, supply chain management and installation expertise, and customer service capabilities are significant competitive advantages because we are able to leverage both our national supplier relationships and existing infrastructure to compete effectively on service as well as price.
In the multi-family, commercial and repair & remodel markets, we compete against local, regional and national players. While we compete with several larger companies, we are able to leverage our infrastructure to cost-effectively serve our customers across multiple markets.
105
Table of Contents
We believe our coast-to-coast footprint allows us to compete favorably, as large national and regional customers often prefer to reduce their administrative burden by utilizing a provider that can service multiple markets with high-quality and consistent service.
Employees
As of the date of this prospectus, we had approximately 4,200 employees, including approximately 300 design professionals and approximately 470 field managers, and utilize approximately 9,000 independent installation subcontractors. None of our employees are covered under a collective bargaining agreement. We have never experienced a work stoppage or strike and we believe that we have good relations with our employees.
Intellectual Property
We possess intellectual property rights, including trademarks, trade names, trade secrets and know-how, as well as contractual provisions and restrictions on access to and use of proprietary information.
We own the source code related to our proprietary design software and several of our other front- and back- end software application tools. We license the remainder of the software applications we utilize in our business through license agreements with the software owners. Where certain functionality that we have developed is extended to externally-owned systems, we do not release the applicable code to third parties.
In addition to the protection provided by our intellectual property rights, we enter into confidentiality agreements with our respective employees, contractors and business partners who are given access to confidential information. Further, employees and contractors who contribute to the development of material intellectual property on our behalf are also subject to invention assignment and/or license agreements, as appropriate. We further control the use of our proprietary technology and intellectual property through our terms of use and policies.
We will continue to make efforts to protect our intellectual property rights; however, the actions taken by us may be inadequate to prevent others from using similar intellectual property. In addition, third parties may assert claims against our use of intellectual property and we may be unable to successfully resolve such claims.
106
Table of Contents
Properties
We lease space for our offices, design studios, fabrication centers and warehousing and logistics centers (referred to as “warehouse” in the table below for brevity) in 31 states, including our headquarters in Irvine, California, and own an Aurora, Colorado facility that includes office, warehousing and logistics operations, and fabrication operations. Our leases are typically short term (five years or less) in duration with customary extensions at our option. We believe suitable alternative space is available in all of our markets. The table below summarizes our locations as of the date of this prospectus.
| State |
Number of facilities |
Square footage of facilities |
| |||||
| Arizona |
22 | 238,340 | Office / Warehouse / Design Studio | |||||
| California |
41 | 423,520 | Office / Warehouse / Design Studio / Fabrication | |||||
| Colorado |
11 | 214,987 | Office / Warehouse / Design Studio / Fabrication | |||||
| Delaware |
1 | 1,200 | Design Studio | |||||
| Florida |
17 | 385,946 | Office / Warehouse / Design Studio / Fabrication | |||||
| Georgia |
6 | 65,902 | Office / Warehouse / Design Studio | |||||
| Idaho |
1 | 16,866 | Office / Warehouse / Design Studio | |||||
| Illinois |
2 | 5,185 | Warehouse | |||||
| Indiana |
5 | 27,940 | Office / Warehouse | |||||
| Iowa |
3 | 12,164 | Office / Warehouse | |||||
| Maryland |
2 | 88,683 | Office / Warehouse / Design Studio | |||||
| Massachusetts |
1 | 6,949 | Office / Warehouse | |||||
| Minnesota |
3 | 64,425 | Office / Warehouse | |||||
| Missouri |
1 | 3,690 | Office / Warehouse | |||||
| Nebraska |
1 | 6,795 | Office / Warehouse | |||||
| Nevada |
12 | 216,917 | Office / Warehouse / Design Studio / Fabrication | |||||
| New Jersey |
3 | 49,498 | Office / Warehouse / Design Studio | |||||
| New Mexico |
3 | 29,823 | Office / Warehouse / Design Studio | |||||
| North Carolina |
7 | 94,432 | Office / Warehouse / Design Studio | |||||
| Oklahoma |
2 | 10,046 | Office / Warehouse / Design Studio | |||||
| Oregon |
2 | 24,709 | Office / Warehouse / Design Studio | |||||
| Pennsylvania |
1 | 30,000 | Office / Warehouse / Design Studio | |||||
| Rhode Island |
1 | 11,000 | Office / Warehouse | |||||
| South Carolina |
4 | 45,600 | Office / Warehouse / Design Studio | |||||
| South Dakota |
1 | 2,500 | Warehouse | |||||
| Tennessee |
1 | 9,320 | Office / Warehouse | |||||
| Texas |
12 | 206,116 | Office / Warehouse / Design Studio | |||||
| Utah |
3 | 84,908 | Office / Warehouse / Design Studio / Fabrication | |||||
| Virginia |
5 | 75,052 | Office / Warehouse / Design Studio | |||||
| Washington |
12 | 123,669 | Office / Warehouse / Design Studio / Fabrication | |||||
| Wisconsin |
4 | 30,076 | Office / Warehouse | |||||
|
|
|
|
||||||
| Total |
190 | 2,606,258 | ||||||
|
|
|
|
||||||
Regulatory Matters
We are subject to various federal, state and local government regulations applicable in the jurisdictions in which we operate, including laws and regulations governing our business and contractors’ licenses and laws and regulations relating to our relationships with subcontractors, our employees, public health and safety, transportation, zoning and fire codes. We strive to operate in accordance with applicable laws, codes and regulations.
107
Table of Contents
Our operations are also subject to regulation by local, state and federal and worker health and safety laws in all jurisdictions in which we operate. For instance, we are required to comply with the OSHA regulations and any applicable more stringent requirements that may be imposed by individual states. For example, our countertop fabrication facilities are subject to regulations concerning air quality, including maximum permissible quantities of silica dust within each facility. We have designed controls and engage in continual improvement programs in order to better address these risks.
Our operations and leased properties are also subject to federal, state and local laws and regulations relating to the use, storage, handling, generation, transportation, treatment, emission, release, discharge and disposal of hazardous or toxic materials, substances and wastes and petroleum products and the investigation, remediation, removal and monitoring of the presence or release of such materials, substances, wastewater and other waste, and petroleum products. These laws and regulations pertain to currently or formerly owned or occupied premises and off-site disposal locations and any known or newly discovered environmental conditions at or relating to any of our properties, including those arising from activities conducted by previous occupants or at adjoining properties, without regard to whether we knew of or were responsible for such release. We have not previously incurred material costs to comply with environmental laws and regulations. However, we may be required to investigate, remove, remediate or monitor the presence or release of such hazardous or toxic substances or petroleum products and may be held liable by a governmental entity for fines and penalties or to any third parties for damages, including for bodily injury, property damage and natural resource damage in connection with the presence or release of hazardous or toxic substances or petroleum products.
In conjunction with our contracting arrangements with customers, lease agreements and other transactions, we often provide reasonable and customary indemnifications relating to various matters, including regulatory and environmental issues. To date, we have not had to pay a material amount pursuant to any such indemnification obligations.
In addition, our suppliers are subject to various laws and regulations, including in particular, environmental laws and regulations, compliance with which could result in increased costs for supplies and potential exposure to us for supplier non-compliance.
Legal Proceedings
We are involved in various claims and lawsuits incidental to the conduct of our business in the ordinary course. We carry insurance coverage in excess of our self-insured coverage, which we believe to be reasonable under the circumstances, although insurance may or may not cover any or all of our liabilities in respect of claims and lawsuits. We do not believe that the ultimate resolution of these matters individually or in the aggregate will have a material adverse effect on our consolidated financial position, results of operations or cash flows.
108
Table of Contents
Executive Officers and Directors
Set forth below are the names, ages and positions of our executive officers and directors as of December 31, 2020.
| Name |
Age | Position(s) held | ||||
| Alan K. Davenport |
55 | Chief Executive Officer and Chairman | ||||
| Jason D. Peel |
48 | President and Chief Operating Officer | ||||
| Anne M. Liu |
59 | Executive Vice President and Chief Financial Officer | ||||
| Richard D. Strulson |
52 | Executive Vice President, General Counsel and Chief Compliance Officer | ||||
| Jeff Trapp |
43 | Executive Vice President, Sales and Business Development | ||||
| Christine R. Clem |
54 | Senior Vice President of Human Resources | ||||
| Paul T. Bader |
61 | Director | ||||
| Margot L. Carter |
53 | Director | ||||
| Brandon J. Crawley |
39 | Director | ||||
| Robert E. Davis |
57 | Director | ||||
| Todd D. Golditch |
41 | Director | ||||
| Janine S. Jovanovic |
50 | Director | ||||
| Steven G. Raich |
47 | Director | ||||
| James B. Wigdale III |
30 | Director | ||||
Biographical Information
Alan K. Davenport has served as our Chief Executive Officer since December 2013, and as the Chairman of our Board of Directors since January 2021. Previously, Mr. Davenport served as our President from December 2013 to August 2019. Prior to joining the Company, Mr. Davenport served as Senior Vice President for Henry Company, a national supplier of air and vapor barrier, roofing and waterproofing products, from January 2008 to March 2013. Prior to that, Mr. Davenport served as Group President and Chief Operating Officer of Central Operations of Builders FirstSource, Inc. (Nasdaq: BLDR), a supplier of structural building materials and services to homebuilders and remodelers in the United States. We believe that Mr. Davenport’s extensive experience in the homebuilding and building products industry, as well as his executive leadership experience, make him qualified to serve as a member of our board of directors.
Jason D. Peel has served as our President and Chief Operating Officer since August 2019. Previously, Mr. Peel served as our Chief Financial Officer from October 2018 to August 2019. Prior to joining the Company, Mr. Peel served in senior leadership roles for the Henry Company, including Chief Financial Officer from April 2013 to October 2018 and Vice President of Finance from October 2006 to March 2013. Prior to joining Henry, Mr. Peel was a senior management consultant with PricewaterhouseCoopers in the United States and Europe and was project leader on global ERP implementations in the high tech, manufacturing and financial services sectors. Mr. Peel began his career as an auditor with Coopers & Lybrand.
Anne M. Liu has served as our Executive Vice President and Chief Financial Officer since August 2019, and previously served as our Chief Accounting Officer from September 2015 to August 2019. Ms. Liu played a key role in the transition and integration of people, processes and systems in connection with our Business Combination and has integrated our systems and controls over several acquisitions over time. Prior to joining the Company, Ms. Liu served as Senior Vice President and Chief Accounting Officer at Leap Wireless/Cricket Communications (formerly NASDAQ: LEAP) from November 2012 to December 2014. While at Leap Wireless she also served as assistant controller and, later, controller from December 2006 to December 2008 and December 2008 to November 2012, respectively. Previously, and for an extensive part of her career from March 1990 to December 2006, Ms. Liu served as Vice President of Finance and Corporate Accounting of Science Applications International Corporation (NYSE: SAIC), where she led the growth and transformation of people,
109
Table of Contents
processes and systems for the central accounting organization for SAIC during the period of growth from $1 billion to $8 billion in revenues and worked on SAIC’s IPO in 2006. Ms. Liu started her career with Deloitte in September 1983 and worked there until March 1990, serving as an audit manager for private and public clients in the manufacturing and government contractor industries.
Richard D. Strulson has served as our General Counsel since December 2017, our Executive Vice President and our Chief Compliance Officer since January 2019, and our Corporate Secretary since April 2018. Previously, Mr. Strulson served as our Head of Human Resources from January 2019 to September 2019. Prior to joining the Company, Mr. Strulson served as the Executive Vice President, General Counsel, Chief Compliance Officer and Secretary of Nature’s Sunshine Products, Inc. (Nasdaq: NATR), a natural health and wellness company, from November 2013 to December 2017. From 2004 to October 2013, Mr. Strulson held various senior positions at Herbalife International of America, Inc. (NYSE: HLF), one of the world’s largest direct selling companies, including Senior Vice President, Chief Privacy Officer and Counsel. Prior to that, he served in a variety of senior legal counsel positions for The Walt Disney Company and FOX Cable Networks. Mr. Strulson started his career as a corporate associate at Latham & Watkins LLP.
Jeff Trapp has served as our Executive Vice President, Sales and Business Development since March 2019. Mr. Trapp previously served as our Senior Vice President of National Sales from January 2017 to March 2019 and Vice President of Sales, Western Region from June 2016 to January 2017. Prior to joining the Company, Mr. Trapp served in several senior positions at HD Supply—Interior Solutions division, which we acquired in 2016, including National Sales Director from 2010 to 2016, National Account Sales Manager from 2007 to 2010 and Senior Sales Manager from 2006 to 2007. Previously, Mr. Trapp had a long-standing career at General Electric Company in their consumer and industrial division serving in various leadership and management roles from 1998 to 2006.
Christine B. Clem has served as our Senior Vice President of Human Resources since July 2020, and previously served as our Vice President of Human Resources from January 2020 to July 2020, and Senior Director of Human Resources from August 2017 to January 2020. Prior to joining the Company, Ms. Clem was at Arbonne International LLC, where she served as Senior Director of Human Resources from March 2014 to May 2017, and Director of Human Resources from July 2011 to March 2014. Previously, Ms. Clem served as the Director of Human Resources for The Irvine Company from July 2008 to July 2011, as a Senior Manager of Human Resources from July 2007 to June 2008, and as a Manager of Human Resources from March 2006 to June 2007. Previously, Ms. Clem served as a recruiting manager with KPMG LLC from 1998 to 2006.
Paul T. Bader has served as a director since October 2019. Mr. Bader is currently an adjunct professor at the Leventhal School of Accounting at the University of Southern California, where he has taught since January 2018. He was a partner in the New York office of Ernst & Young LLP until his retirement in 2016. Mr. Bader started his career at Ernst & Young in 1981 and held many leadership roles during his more than 30 years at the firm, including Partner in Charge of the NY International Tax Practice, Managing Partner of the NY Tax Practice, Managing Partner of the Metro NY area, Vice Chair of the Americas M&A and Private Equity practice, and the Americas Director of Strategy. Mr. Bader spent his most recent years at Ernst & Young consulting with digital media companies on their global operations. He also serves on the board of PAE Incorporated (NASDAQ: PAE) and previously served on the board of Key Energy Services, Inc. (OTCMKTS: KEGX). We believe that Mr. Bader’s extensive experience in tax, accounting, finance and operations, as well as his public company board experience, make him qualified to serve as a member of our board of directors.
Margot L. Carter has served as a director since November 2017. Since 1998, Ms. Carter has served as the President of Living Mountain Capital, L.L.C., a business advisory firm. Ms. Carter has served as lead director, chair of the nominating and corporate governance committee and a member of the audit committee of Installed Building Products, Inc. (NYSE: IBP), a building products installation business, since 2014. Since 2017, Ms. Carter has served as a director of Eagle Materials Inc. (NYSE: EXP), a provider of building materials, and is a member of the nominating and governance and compensation committees. From 2010 to 2015, Ms. Carter
110
Table of Contents
served as Executive Vice President, Chief Legal Officer and Secretary for RealPage, Inc. (Nasdaq: RP), a global provider of software and data analytics for the real estate industry. In addition, Ms. Carter previously held executive-level positions at The Princeton Review (Nasdaq: TPR), Soundview Technology Group (Nasdaq: SNDV) and Cantor Fitzgerald. We believe that Ms. Carter’s extensive experience as a business builder in the technology, real estate and construction industries, board member of public companies, and executive leadership experience in business strategy, finance, acquisitions, and corporate governance, make her qualified to serve as a member of our board of directors.
Brandon J. Crawley has served as a director since May 2018. Mr. Crawley joined Platinum Equity in January 2013 and is a Managing Director at the firm. Prior to joining Platinum Equity, Mr. Crawley worked at Alvarez & Marsal. We believe that Mr. Crawley’s extensive experience in financial, investment and operational experience from involvement with numerous Platinum portfolio companies makes him qualified to serve as a member of our board of directors.
Robert E. Davis has served as a director since May 2014. Mr. Davis is currently a Managing Director of Littlejohn, which he joined as a partner in 2005. Prior to joining Littlejohn, Mr. Davis was a managing director and founder of Oaktree Capital Management’s Mezzanine Fund, where he was responsible for originating, executing and monitoring mezzanine investments. Previously, Mr. Davis was a principal at Halycon Asset Management LLC, focusing on distressed and special situation investments. Mr. Davis started his post-M.B.A. career at Prudential Insurance Company, where he was a founding member of its Financial Restructuring Group. Additionally, Mr. Davis spent two years as a distressed debt and high yield analyst at Oppenheimer and Co., and began his investment career at Bear Stearns & Co. We believe that Mr. Davis’ extensive experience in corporate strategy, finance and acquisitions makes him qualified to serve as a member of our board of directors.
Todd D. Golditch has served as a director since May 2018. Mr. Golditch is a Managing Director at Platinum Equity, which he joined in 2001. Mr. Golditch focuses on the acquisition, strategic direction, and disposition of investments for Platinum Equity, primarily in the industrial and building products sectors. We believe that Mr. Golditch’s extensive experience in finance, operations and acquisitions makes him qualified to serve as a member of our board of directors.
Janine S. Jovanovic has served as a director since October 2019 and an advisor of the Company since April 2019. Since September 2015, Ms. Jovanovic has served as Principal and Founder of JSJ Advisors, providing corporate strategy solutions to real estate organizations and the technology providers that enable them. Previously, from 2007 to 2015, Ms. Jovanovic served as Executive Vice President of Asset Optimization at RealPage (NASDAQ: RP). From 2001 to 2007, Ms. Jovanovic was Senior Vice President of Administrative Services at JPI, where she evolved the company’s infrastructure to support rapid growth and expansion, including a comprehensive overhaul of all systems, business processes and organizational structure. Before JPI, Ms. Jovanovic worked with both Price Waterhouse and KPMG’s Real Estate Consulting practices, to maximize results through business transformation, facilitated by innovative technology, process and workforce redesign. We believe that Ms. Jovanovic’s extensive technology, real estate corporate strategy, and operational experience make her qualified to serve as a member of our board of directors.
Steven G. Raich has served as a director since November 2014. Mr. Raich became a partner of Littlejohn in January 2008 after having been with the firm since 2000. From November 2011 to June 2017, Mr. Raich served as a director of Installed Building Products, Inc. (NYSE: IBP). Mr. Raich joined Littlejohn from Golub Capital, a private equity and debt fund where he analyzed new investment opportunities and worked with portfolio company managers. Previously, Mr. Raich was at Ernst & Young LLP in the mergers and acquisitions advisory services group. We believe that Mr. Raich’s extensive experience in corporate strategy, finance and acquisitions makes him qualified to serve as a member of our board of directors.
James B. Wigdale III has served as a director since May 2018. Mr. Wigdale joined Littlejohn in July 2014 and was promoted to vice president in January 2020. Prior to Littlejohn, Mr. Wigdale was at Robert W. Baird &
111
Table of Contents
Company, where he assisted in M&A transactions in the Industrials Group. We believe that Mr. Wigdale’s experience in corporate strategy, finance and acquisitions makes him qualified to serve as a member of our board of directors.
Composition of the Board of Directors
After the completion of this offering, our board of directors will be comprised of directors, of whom were designated by our stockholders pursuant to the board designation provisions of the LLC Agreement. and have agreed to become members of our board of directors upon completion of this offering. After this offering, we expect to add additional directors to our board of directors who will be “independent” as defined in the Nasdaq listing rules.
Our business and affairs are managed under the direction of our board of directors. Our bylaws provide that the authorized size of our board of directors is to be determined from time to time by resolution of the board of directors. The authorized number of directors may be changed by resolution duly adopted by at least a majority of our entire board of directors then in office, although no decrease in the authorized number of directors will have the effect of removing an incumbent director from our board of directors until the incumbent director’s term of office expires. Vacancies on our board of directors can be filled by resolution of our board of directors.
Upon the completion of this offering, our board of directors will be divided into three classes, each serving staggered, three-year terms:
| • | Our class I directors will be and , and their terms will expire at the first annual meeting of stockholders following the date of this prospectus; |
| • | Our class II directors will be and , and their terms will expire at the second annual meeting of stockholders following the date of this prospectus; and |
| • | Our class III directors will be and , and their terms will expire at the third annual meeting of stockholders following the date of this prospectus. |
As a result, only one class of directors will be elected at each annual meeting of stockholders, with the other classes continuing for the remainder of their respective terms.
Director Independence
Based upon information requested from and provided by each director and director nominee concerning his or her background, employment and affiliations, our board of directors has determined that each of and have no material relationship that would interfere with the exercise of independent judgment and is “independent” as defined in the Nasdaq listing rules. We intend to rely on the Nasdaq transition rules, which provide for phase-in compliance for companies listing in connection with their initial public offering. Accordingly, we intend to have a majority of our board comprised of independent directors within one year of our listing.
The SEC rules and Nasdaq listing rules require that at least one member of our audit committee be independent as of the date of this prospectus and that each of our audit, compensation and, nominating and corporate governance committees be comprised of a majority of independent directors within 90 days of our listing and solely of independent directors within one year of our listing. We intend to comply with these transition rules.
Board Leadership Structure
Alan Davenport serves as our Chief Executive Officer and Chairman. Our Board believes that combining these positions provides an efficient and effective leadership model for the Company, and promotes clear
112
Table of Contents
accountability, unified leadership and alignment on corporate strategy. In addition, our customers, stockholders, and other business partners view our Chairman and Chief Executive Officer as a leader in our industry. While our bylaws and corporate governance guidelines do not require that our Chairman and Chief Executive Officer positions be combined, our board of directors believes that having a combined position is the appropriate leadership structure for us at this time.
Role of Our Board of Directors in Risk Oversight
Risk assessment and oversight are an integral part of our governance and management processes. Our board of directors encourages management to promote a culture that incorporates risk management into our corporate strategy and day-to-day business operations. Management discusses strategic and operational risks at regular management meetings, and conducts specific strategic planning and review sessions during the year that include a focused discussion and analysis of the risks facing us. Throughout the year, senior management reviews these risks with the board of directors at regular board meetings as part of management presentations that focus on particular business functions, operations or strategies, and presents the steps taken by management to mitigate or eliminate such risks.
Our board of directors does not have a standing risk management committee, but rather administers this oversight function directly through our board of directors as a whole, as well as through various standing committees of our board of directors that address risks inherent in their respective areas of oversight. In particular, our board of directors is responsible for monitoring and assessing strategic risk exposure. Our audit committee is responsible for overseeing our major financial risk exposures and the steps our management has taken to monitor and control these exposures and our compensation committee assesses and monitors whether any of our compensation policies and programs has the potential to encourage unnecessary risk-taking. In addition, upon completion of this offering, our audit committee will oversee the performance of our internal audit function and consider and approve or disapprove any related-party transactions and our nominating and governance committee will monitor the effectiveness of our corporate governance guidelines.
Committees of Our Board of Directors
After completion of this offering, the standing committees of our board of directors will consist of an audit committee, compensation committee, and nominating and corporate governance committee. The board of directors will adopt written charters for the audit committee, compensation committee, and nominating and corporate governance committee, which will be available on our website upon the completion of this offering. The information contained in, or that can be accessed through, our website is not incorporated by reference and is not a part of this prospectus. In addition, from time to time, special committees may be established under the direction of our board of directors when necessary to address specific issues.
Audit Committee
Our audit committee will oversee our corporate accounting and financial reporting process. Upon completion of this offering, the audit committee will be responsible for, among other things:
| • | appointing our independent registered public accounting firm; |
| • | evaluating and monitoring the independent registered public accounting firm’s qualifications, independence and performance; |
| • | determining the engagement of the independent registered public accounting firm; |
| • | reviewing and approving the scope of the annual audit and the audit fee; |
| • | reviewing and discussing the scope, adequacy and effectiveness of our accounting and financial reporting processes and internal controls and the audits of our financial statements; |
113
Table of Contents
| • | reviewing and discussing with management and the independent auditor the annual audited financial statements, and recommending to the board whether the audited financial statements should be included in our annual reports; |
| • | determining the oversight of the work of the independent registered public accounting firm (including resolution of disagreements between management and the independent registered public accounting firm regarding financial reporting) for the purpose of preparing or issuing an audit report or related work; |
| • | reviewing and approving, in advance, all audit and non-audit services to be performed by our independent auditor, taking into consideration whether the independent auditor’s provision of non-audit services to us is compatible with maintaining the independent auditor’s independence; |
| • | ensuring the rotation of partners of the independent registered public accounting firm on our engagement team as required by law; |
| • | establishing and overseeing procedures for the receipt, retention and treatment of complaints received by the Company regarding accounting, internal accounting controls or auditing matters, including procedures for the confidential, anonymous submission by our employees regarding accounting, auditing or other matters; |
| • | reviewing and approving related-party transactions for potential conflict of interest situations on an ongoing basis; |
| • | investigating any matter brought to its attention within the scope of its duties and engaging independent counsel and other advisors as the audit committee deems necessary; |
| • | reviewing significant findings by the internal audit function, as well as management’s responses; |
| • | reviewing our major financial risk exposures, including the guidelines and policies to govern the process by which risk assessment and risk management is implemented; |
| • | reviewing our financial statements and reports, including the disclosures contained under the caption “Management’s Discussion and Analysis of Financial Condition and Results of Operations” to be included in our annual and quarterly reports to be filed with the SEC; |
| • | on an annual basis reviewing and evaluating the audit committee charter and the committee’s performance; and |
| • | handling such other matters that are specifically delegated to the audit committee by our board of directors from time to time. |
Upon completion of this offering, our audit committee will consist of , who will serve as chairperson of the committee, and . All members of our audit committee meet the requirements for financial literacy under the applicable rules and regulations of the SEC and Nasdaq. Our board of directors has determined that is an audit committee financial expert as defined under the applicable rules of the SEC and has the requisite financial sophistication as defined under the applicable rules and regulations of Nasdaq. Under the rules of the SEC and Nasdaq, members of the audit committee must also meet independence standards under Rule 10A-3 of the Exchange Act, subject to the transition rules described above.
Compensation Committee
Our compensation committee will review and recommend policies relating to compensation and benefits of our officers, directors and employees. Upon completion of this offering, the compensation committee will be responsible for, among other things:
| • | reviewing and approving the compensation, employment agreements and severance arrangements and other benefits of all of our executive officers subject to approval by our board of directors with respect to our CEO; |
114
Table of Contents
| • | reviewing and approving, on an annual basis, the corporate goals and objectives relevant to the compensation of our executive officers, and evaluating their performance in light of such goals and objectives; |
| • | reviewing and making recommendations annually to our board of directors with respect to director compensation, including board fees and equity incentive compensation, subject to approval by our board of directors; |
| • | reviewing and discussing with management our Compensation Discussion and Analysis (“CD&A”), or such other similar section, and recommending that the CD&A be included or incorporated by reference in our proxy statement and annual report on Form 10-K; |
| • | reviewing and approving the proposals regarding the “say on pay” advisory vote and the frequency of the “say on pay” advisory vote to be included in our annual proxy statement; |
| • | reviewing and recommending to our board of directors for approval the frequency with which we will conduct stockholder advisory votes on executive compensation, taking into account results of the most recent stockholder advisory vote on the frequency of such votes; |
| • | reviewing our incentive compensation arrangements to confirm that incentive pay does not encourage unnecessary risk-taking and reviewing and discussing periodically the relationship between risk management policies and practices, business strategy and our executive officers’ compensation; |
| • | reviewing and evaluating, at least annually, the performance of the compensation committee and its members, including compliance by the compensation committee with its charter; |
| • | retaining or obtaining, in its sole discretion, the advice of a compensation consultant, independent legal counsel or other adviser after taking into consideration the factors required by any applicable requirements of the Exchange Act and any applicable exchange rules; |
| • | reviewing and making recommendations periodically to our board of directors concerning our equity and other incentive compensation plans, including the need to amend existing plans or adopt new plans or arrangements, and ensure that such plans are incentivizing the accomplishment of agreed upon corporate objectives; |
| • | reviewing at least annually our pension and retirement plans, including any supplemental executive retirement plans, and making recommendations to our board of directors regarding the need to amend existing plans or adopt new ones for the purpose of implementing our strategy regarding pension and retirement benefits; and |
| • | handling such other matters that are specifically delegated to the compensation committee by our board of directors from time to time. |
Upon completion of this offering, our compensation committee will consist of , who will serve as chairperson of the committee, and . Each of the members of our compensation committee will be independent under the rules of Nasdaq, and will be a “non-employee director” as defined in Rule 16b-3 promulgated under the Exchange Act.
Nominating and Corporate Governance Committee
Upon the completion of this offering, the nominating and corporate governance committee will be responsible for, among other things:
| • | identifying and screening candidates for our board of directors and recommending nominees for election as directors; |
| • | establishing procedures to exercise oversight of the evaluation of our board of directors and management; |
| • | developing and recommending to our board of directors a set of corporate governance guidelines, as well as reviewing these guidelines and recommending any changes to our board of directors; |
115
Table of Contents
| • | reviewing the structure of our board of directors’ committees and recommending to our board of directors for its approval directors to serve as members of each committee, and where appropriate, making recommendations regarding the removal of any member of any committee; |
| • | reviewing and assessing the adequacy of its formal written charter on an annual basis; and generally advising our board of directors on corporate governance and related matters. |
Upon completion of this offering, our nominating and corporate governance committee will consist of , who will serve as chairperson of the committee, and . Each of the members of our nominating and corporate governance committee will be an independent director under the rules of Nasdaq relating to nominating and corporate governance committee independence, subject to the transition rules described above.
Compensation Committee Interlocks and Insider Participation
None of the members of our compensation committee is or has been an officer or employee of our company. None of our executive officers currently serves, or in the past year has served, as a member of the board of directors or compensation committee (or other board committee performing equivalent functions) of any entity that has one or more executive officers serving on our board of directors or compensation committee.
Board Qualifications
Upon completion of this offering, our nominating and corporate governance committee will be responsible for reviewing with our board of directors, on an annual basis, the appropriate characteristics, skills and experience required for the board of directors as a whole and its individual members. In evaluating the suitability of individual candidates (both new candidates and current members), the nominating and corporate governance committee, in recommending candidates for election, and the board of directors, in approving (and, in the case of vacancies, appointing) such candidates, will take into account many factors, including the following:
| • | personal and professional integrity; |
| • | ethics and values; |
| • | experience in corporate management, such as serving as an officer or former officer of a publicly held company; |
| • | experience in the industries in which we compete; |
| • | experience as a board member or executive officer of another publicly held company; |
| • | diversity of background and expertise and experience in substantive matters pertaining to our business relative to other board members; |
| • | conflicts of interest; and |
| • | practical and mature business judgment. |
Family Relationships
There are no family relationships among any of our executive officers or any of our directors.
Code of Business Conduct and Ethics
We will adopt a code of business conduct and ethics, effective upon completion of this offering, applicable to all of our employees, officers, directors and consultants, including our principal executive, financial and accounting officers and all persons performing similar functions. A copy of that code will be available on our website prior to completion of this offering. We expect that any amendments to the code, or any waivers of its requirements, will be disclosed on our website or as required by applicable law or Nasdaq listing requirements.
116
Table of Contents
Our named executive officers (the “Named Executive Officers”) for the year ended December 31, 2020, are:
| • | Alan Davenport, our Chief Executive Officer; |
| • | Jason Peel, our President and Chief Operating Officer; |
| • | Anne Liu, our Executive Vice President and Chief Financial Officer; |
| • | Richard Strulson, our Executive Vice President, General Counsel, and Chief Compliance Officer; and |
| • | Jeffrey Trapp, our Executive Vice President, Sales and Business Development. |
Our executive compensation programs have historically been determined by our Board of Managers. This Compensation Discussion and Analysis addresses the compensation philosophy and programs with respect to fiscal year 2020, and the decisions made by our Board of Managers with respect to our executive compensation programs. In connection with the offering, we are forming a Compensation Committee, which will be responsible for making decisions with respect to executive compensation following the offering.
Compensation Discussion and Analysis
Objectives and Philosophy
We are the leading national provider of technology-enabled sales and marketing, design, and installation services for homebuilders. Securing key talent that can assist us in managing and expanding our growing business is extremely important to the success of our business. Our leadership team is responsible for leading a complex company with a national footprint that combines a national platform and local market concentration in what is a highly fragmented market. We need uniquely talented individuals, who can perform at a high level and think strategically with respect to growing our business through sales and partnerships as well as acquisitions, and we have designed our executive compensation program to attract and retain these individuals.
Our executive compensation program is guided by the following principles:
| • | Attract, Reward, and Retain Talented Management Team. We compete for talent with other companies in our market, as well as companies in related industries of a similar size and structure. In order to attract the executives with the experience necessary to achieve our business goals, our compensation must be at a competitive level, and must provide opportunity for greater reward with a longer commitment from the executives. |
| • | Pay-for-Performance. Compensation opportunities must be designed to reward executives consistent with the Company’s performance, so that executives are focused on producing sustainable long-term growth. |
| • | Align Interests with Interests of Shareholders. When executives have a financial stake in the Company, the interests of the executive are aligned with the interests of shareholders. Therefore, our executives are granted equity-based awards upon their hire or promotion. |
Our executive compensation program has three key elements, which have been designed according to these principles: base salary, annual cash incentive compensation, and long-term equity compensation. We also provide limited perquisites and retirement benefits to our Named Executive Officers.
We expect that, following the offering, our Compensation Committee will evaluate these principles and our overall compensation philosophy, as well as each element of our compensation program, to determine whether adjustments should be made to take into account our status as a publicly traded company.
Who Makes Compensation Decisions
Prior to the Offering, our Board of Managers has had the responsibility to approve executive compensation decisions and our compensation programs. The CEO provides input and recommendations to the Board with
117
Table of Contents
respect to specific decisions and recommendations related to the compensation of the Named Executive Officers, including base salaries, target bonus percentages, actual bonus payments, and other awards.
The CEO makes recommendations based on his expertise and knowledge with respect to compensation in the general market for talent, as well as the individual executive’s role with the company, duties, responsibilities, experience, and performance. The Board believes that the input of the CEO with respect to the assessment of individual performance and retention is a key component of the compensation process. However, the Board makes all final determinations with respect to compensation of our Named Executive Officers in its sole discretion. Our Named Executive Officer compensation has not historically been benchmarked to the compensation of similar executives at a peer group, and, prior to December 2020, the Board did not engage a compensation consultant to assist with the determination of executive compensation.
In connection with the offering, we are forming a Compensation Committee of our Board of Directors (the “Compensation Committee”), which will be responsible for making all determinations with respect to our executive compensation programs and the compensation of our Named Executive Officers (with decisions regarding compensation of our CEO approved by our Board of Directors). Our CEO will not be a member of the Compensation Committee, but will remain involved with compensation decisions after the completion of the offering by providing insight to the Compensation Committee and recommendations regarding compensation for the other Named Executive Officers.
The Compensation Committee will have the authority to retain, compensate, and terminate an independent compensation consultant and any other advisors necessary to assist in its evaluation of executive compensation, but no such consultant has been retained at this time.
Elements of Compensation
The Company’s executive compensation program consists of three main elements: base salary, annual incentive bonus, and equity-based long-term incentives. The Company also provides various benefit and retirement programs, as well as limited perquisites. The table below provides an overview of the elements of the Company’s executive compensation program, a brief description of each compensation element, and the reason for inclusion in the executive compensation program.
| Element |
Description |
Purpose | ||
| Base Salary |
• Fixed compensation • Based on competitive base salaries for executives in similar positions in the market |
• Attract and retain talented executives • Provide fixed level of compensation regardless of market conditions | ||
| Annual Incentive Bonus |
• Variable compensation • Based on achievement of short-term Company objectives |
• Focus attention to achievement of short-term goals • Recognize performance of individuals in delivery of key strategic priorities • Performance-based and not guaranteed | ||
| Long-Term Incentives |
• Variable compensation • Based on the value of our equity, that vests over a longer time horizon |
• Align interests of executives to interests of shareholders • Focus attention to achievement of long-term sustainable performance • Retain key talent | ||
118
Table of Contents
Base Salaries
Base salary is the main element of fixed compensation in our executive compensation program, and helps to retain our executive team. Our Named Executive Officers were entitled to the following annual base salaries for the 2020 fiscal year:
| Named Executive Officer |
2020 Base Salary (Effective January 1, 2020) |
2020 Base Salary (COVID adjustment) |
||||||
| Alan Davenport |
$ | 600,000 | $ | 510,000 | ||||
| Jason Peel |
$ | 450,000 | $ | 382,500 | ||||
| Anne Liu |
$ | 350,000 | $ | 297,500 | ||||
| Richard Strulson |
$ | 375,000 | $ | 318,750 | ||||
| Jeffrey Trapp |
$ | 300,000 | $ | 255,000 | ||||
Due to the challenging market conditions in 2020 related to COVID-19, each of our Named Executive Officers was subject to a temporary 15% reduction in base salary, beginning on April 19, 2020. These salary reductions were removed on October 4, 2020 and each Named Executive Officer’s base salary was restored.
Annual Incentive Awards
Each Named Executive Officer is eligible to receive an annual incentive bonus under the Interior Logic Group 2020 Bonus Incentive Plan based on Adjusted EBITDA achievement during the applicable fiscal year. Adjusted EBITDA is a non-GAAP measure. For additional information regarding Adjusted EBITDA, including a reconciliation to the most directly comparable GAAP measure, see “Summary Historical Financial Data” and “Non- GAAP Financial Measures.” We use Adjusted EBITDA as the performance metric for our short-term incentive program because it drives results that have the most significant impact on our success.
| Named Executive Officer |
2020 Target Bonus (as % of Base Salary) |
|||
| Alan Davenport |
85 | % | ||
| Jason Peel |
75 | % | ||
| Anne Liu |
50 | % | ||
| Richard Strulson |
50 | % | ||
| Jeffrey Trapp |
50 | % | ||
The annual incentive bonus is paid out at 100% if the Adjusted EBITDA target is met, with a maximum payout of up to 143.5% of the bonus target if the Adjusted EBITDA target is achieved at 150% or higher. If only 85% of the Adjusted EBITDA target is achieved, payout will be 25% of the bonus target. If Adjusted EBITDA is less than 85% of the target, there will be no annual incentive bonus payout. The Adjusted EBITDA target is selected by the Board based on our annual operating budget.
As of the date of this filing, the actual Adjusted EBITDA results for the 2020 fiscal year, and actual payout of the 2020 annual incentive bonus to each Named Executive Officer, had not yet been determined.
In addition to the annual incentive bonus, if any, our board of directors may make certain discretionary bonus awards to the Named Executive Officers from time to time. No such discretionary bonuses were made during 2020.
Long-Term Incentive Compensation
Our long-term incentive compensation program is designed to provide a significant portion of our executives’ compensation opportunity in equity-based awards. Long-term equity compensation is important in order to the align the long-term interests of our executives with those of our stockholders: the potential value of the long-term compensation increases in accordance with the value created for our stockholders.
119
Table of Contents
Historically, we have not made long-term equity incentive award grants on an annual basis. Equity-based awards are generally granted when an executive is hired or promoted, and at other times that the Board determines that such awards are necessary to retain and incentivize our Named Executive Officers.
Equity-based awards are granted under the 2018 Equity Incentive Plan in the form of stock options relating to Class B Units. The exercise price of such stock options is equal to the fair market value of Class B Units on the date of grant, and the stock options vest and become exercisable as to 20% of the stock options on each of the first four anniversaries of the applicable vesting commencement date. The remaining 20% of the stock options will vest and become exercisable at such time as Littlejohn, Platinum Equity, and their affiliates own less than 30% of the Class A Units that they held as of the date of grant.
None of our Named Executive Officers received stock options or other equity-based awards during 2020.
Upon the completion of the offering, the outstanding equity awards with respect to our Class B Units will be converted into equity awards with respect to shares of our common stock.
Following this offering, the Compensation Committee may decide to implement an annual equity award grant process, which may occur in conjunction with our annual assessment of individual performance. We expect that the grant of long-term equity-based compensation will take into account the competitive compensation landscape, in addition to each executive’s individual contributions. In addition to annual grants, the Company may make equity grants in certain other circumstances, such as for new hires or promotions or to recognize an individual’s extraordinary contributions to the Company.
Employee Benefits and Perquisites
The Company maintains the Interior Specialists, Inc. 401(k) Plan, a qualified defined contribution plan under the provisions of Code Section 401(k) that covers employees who meet certain eligibility requirements. Under the plan, participants may defer their salary subject to statutory limitations and may direct the contributions among various investment accounts. The Company matches 33% of the participant’s deferrals, up to 6% of the participant’s compensation. The matching contribution vests ratably over four years. The Named Executive Officers participate in the 401(k) Plan on the same basis as other employees of the Company.
Additionally, the Company provides relocation benefits when a move is required, as well as certain limited perquisites to the Named Executive Officers, including a car allowance for Messrs. Davenport, Peel, and Trapp.
Employment Agreements and Severance Arrangements
We do not have a standard form of offer letter or employment agreement that we enter into with our Named Executive Officers. Instead, we negotiate the terms of each Named Executive Officer’s employment separately when they join the Company. The employment offer letters for Messrs. Peel, Strulson, and Trapp, and Ms. Liu were updated during 2020 to reflect the terms of their employment following their promotions to their current positions. We do not offer standard severance benefits, and any severance benefits are offered through the offer letter or employment agreement, if any.
Other Policies
In connection with the offering, we expect that the Board of Directors will develop certain policies and practices, which may include an insider trading and equity transaction pre-approval policy, an anti-hedging and pledging policy, and a pay recoupment policy, to ensure that our compensation programs appropriately align the interests of our executives with the interests of our stockholders. Our Compensation Committee may also evaluate the share ownership of our Named Executive Officers and directors to determine whether stock ownership guidelines should be adopted in order to encourage share ownership and to ensure that the interests of our Named Executive Officers and directors are aligned with the interests of our shareholders.
120
Table of Contents
Tax and Accounting Considerations
Section 162(m) of the Code limits to $1 million per year the federal income tax deduction available to public corporations for compensation paid to the certain executives designated in Section 162(m) of the Code, including its chief executive officer, chief financial officer, and the next three highly compensated executives of such corporation whose compensation is required to be disclosed in its proxy statement. We expect that, following the offering, our Compensation Committee will consider the potential effects of Section 162(m) of the Code on the deductibility of compensation paid to our Named Executive Officers, but the Compensation Committee will have the flexibility to award compensation that is not tax deductible if it determines that such award is in our shareholders’ best interests.
Risk Mitigation in Compensation Program Design
Our compensation policies and practices do not create risks that are reasonably likely to have a material adverse effect on the Company. Our annual incentive bonus and long-term equity incentives provide an effective and appropriate balance of short-term and long-term incentives to ensure that our executive compensation program is aligned with the Company’s strategic goals without encouraging or rewarding excessive risk.
Compensation of Our Named Executive Officers
Summary Compensation Table for the Year Ended December 31, 2020
The following table contains information about the compensation paid to or earned by each of our Named Executive Officers during the most recently completed fiscal year. All numbers have been rounded to the nearest dollar.
| Name and Principal Position |
Year | Salary ($) |
Bonus ($) |
Option Awards ($)(1) |
Non-Equity Incentive Plan Compensation ($)(2) |
All Other Compensation ($)(3) |
Total ($) |
|||||||||||||||||||||
| Alan Davenport |
2020 | 563,077 | — | — | (2 | ) | 203,672 | 766,749 | ||||||||||||||||||||
| Chief Executive Officer |
2019 | 600,000 | — | 1,176,233 | 469,200 | 14,400 | 2,259,833 | |||||||||||||||||||||
| Jason Peel |
2020 | 422,308 | — | — | (2 | ) | 14,964 | 437,272 | ||||||||||||||||||||
| President and Chief Operating Officer, Former Chief Financial Officer |
2019 | 421,154 | — | 967,174 | 310,500 | 4,431 | 1,703,259 | |||||||||||||||||||||
| Anne Liu |
2020 | 328,462 | — | — | (2 | ) | 15,992 | 344,454 | ||||||||||||||||||||
| Executive Vice President and Chief Financial Officer |
2019 | 326,503 | — | 524,771 | 161,000 | 26,109 | 1,038,383 | |||||||||||||||||||||
| Richard Strulson |
2020 | 351,923 | — | — | (2 | ) | 695 | 352,618 | ||||||||||||||||||||
| Executive Vice President, General Counsel, and Chief Compliance Officer |
2019 | 370,962 | — | 294,463 | 172,500 | — | 837,925 | |||||||||||||||||||||
| Jeffrey Trapp |
2020 | 281,539 | — | — | (2 | ) | 14,786 | 296,325 | ||||||||||||||||||||
| Executive Vice President, Sales and Business Development |
2019 | 293,632 | — | 305,594 | 138,000 | 13,846 | 751,072 | |||||||||||||||||||||
| (1) | Amounts in this column reflect the grant date fair value of the stock options under FASB ASC Topic 718. For a description of the methodology and assumptions used to determine the amounts reflected in this column, see Note 12 to the consolidated financial statements for the fiscal year ended December 31, 2020. |
| (2) | Amounts in this column represent amounts earned with respect to the annual incentive bonus plan. The amounts earned with respect to 2020 have not yet been determined. |
| (3) | Amounts in this column represent imputed income on Company-paid life insurance, car allowance for Mr. Davenport, Mr. Peel, and Mr. Trapp, housing allowance for Ms. Liu (which was paid until July 2020), as well as, for Mr. Davenport, forgiveness of the principal and interest promissory note ($123,261) and a payment equal to the taxes related to such forgiveness ($65,154). For more information regarding the promissory note, see “Certain Relationships and Related Party Transactions – Promissory Note” on page 133. |
121
Table of Contents
Grants of Plan Based Awards in Fiscal Year 2020 Table
The following table shows grants of plan-based awards granted to our Named Executive Officers during fiscal year 2020. All numbers have been rounded to the nearest whole dollar or unit.
| Estimated Possible
Payouts Under Non-Equity Incentive Plan Awards(1) |
All Other Stock Awards: Number of Shares of Stock or Units (#) |
All Other Option Awards: Number of Securities Underlying Options (#) |
Exercise or Base Price of Option Awards ($/Sh) |
Grant Date Fair Value of Stock and Option Awards ($) |
||||||||||||||||||||||||||
| Name |
Grant Type |
Threshold ($) |
Target ($) |
Maximum ($) |
||||||||||||||||||||||||||
| Alan Davenport |
Bonus Plan | 127,500 | 510,000 | 731,850 | — | — | — | — | ||||||||||||||||||||||
| Jason Peel |
Bonus Plan | 84,375 | 337,500 | 484,313 | — | — | — | — | ||||||||||||||||||||||
| Anne Liu |
Bonus Plan | 43,750 | 175,000 | 251,125 | — | — | — | — | ||||||||||||||||||||||
| Richard Strulson |
Bonus Plan | 46,875 | 187,500 | 269,063 | — | — | — | — | ||||||||||||||||||||||
| Jeffrey Trapp |
Bonus Plan | 37,500 | 150,000 | 215,250 | — | — | — | — | ||||||||||||||||||||||
| (1) | The amount included in these columns is the threshold, target, and maximum cash value payable to each Named Executive Officer for the 2020 annual incentive bonus. Each amount represents the individual’s current salary multiplied by the bonus opportunity. A more detailed description of the terms of the 2020 annual incentive bonus is included above under the heading “Annual Incentive Awards.” The actual payout amounts with respect to the 2020 annual incentive bonus will be set forth in the “Non-Equity Incentive Plan Compensation” column of the Summary Compensation Table when such amounts have been determined. |
Employment Agreements and Offer Letters
We entered into employment agreements or offer letters with several of our Named Executive Officers at the time that they were hired. These employment agreements or offer letters set an initial base salary, target bonus, and in certain circumstances outline sign-on equity grants and potential severance payments. We have no standard form of employment agreement or offer letter for our executives, and instead negotiate with each executive at the time of hiring.
Offer Letter with Jason Peel
We entered into an offer letter with Mr. Peel dated September 12, 2018, which was updated on November 16, 2020 to reflect the terms of Mr. Peel’s promotion in 2019. Pursuant to the offer letter, Mr. Peel served as the Chief Financial Officer, until he was made President and Chief Operating Officer on August 9, 2019. His initial base salary was $400,000, increased to $450,000 effective August 9, 2019, and he is eligible for an annual performance-based bonus, with a target bonus of 75% his base salary. In addition, pursuant to the offer letter, Mr. Peel was entitled to be granted stock options, which vest 20% on each of the first four anniversaries of the date of grant, and the remaining 20% will vest in the event that Littlejohn and Platinum Equity and their affiliates own less than 30% of our Class A Units.
Pursuant to the offer letter, if we terminate Mr. Peel’s employment for cause, we shall have no obligation to provide severance pay. If we terminate Mr. Peel’s employment without cause or if Mr. Peel terminates his employment for good reason, then, subject to his standard release of claims in favor of the company, Mr. Peel shall be entitled to receive, as severance, an amount equal to 12 months’ base salary and, pursuant to the update to the offer letter in 2020, one year of continued coverage under Company welfare plans pursuant to COBRA. Good reason includes a reduction in base salary (other than due to a broader compensation reduction), relocation of the primary business location by more than 50 miles, substantial reduction in duties and responsibilities, or a change in reporting line that represents a demotion.
Mr. Peel’s offer letter also contains non-solicitation restrictions during his employment and for a period of one year after termination of employment.
122
Table of Contents
Employment Agreement with Anne Liu
We were party to an employment agreement with Ms. Liu dated October 1, 2015. Pursuant to the employment agreement, Ms. Liu initially served as our Chief Accounting Officer for an initial term of five years unless earlier terminated or extended pursuant to the terms of the employment agreement. She was promoted to our Chief Financial Officer on August 9, 2019. The employment agreement expired on October 1, 2020.
Pursuant to the employment agreement, Ms. Liu was entitled to an initial annual base salary of $260,000, and was eligible for an annual performance-based bonus, with a target bonus opportunity of 35% of her base salary, paid at the discretion of our board of directors and dependent upon the achievement of certain financial targets and other objectives. In addition, Ms. Liu received a grant of restricted units, which vested as to 20% of the units on each of the first four anniversaries of the employment agreement, and the remaining 20% will vest in the event that Littlejohn Management Company disposes of at least 50% of our common units.
Ms. Liu’s employment agreement also contains non-solicitation restrictions for the term of her employment agreement and for a period of one year after termination of employment, which survive the expiration of the agreement.
We entered into a letter agreement with Ms. Liu on November 16, 2020, reflecting her promotion to Chief Financial Officer in 2019 and outlining the terms of her employment pursuant to such promotion. Pursuant to the letter agreement, Ms. Liu is entitled to a base salary of $350,000, and for an annual performance-based bonus, with a target opportunity of 50% of her base salary. Pursuant to the letter agreement, if we terminate Ms. Liu’s employment for cause, we shall have no obligation to provide severance pay. If we terminate Ms. Liu’s employment without cause or if Ms. Liu terminates her employment for good reason, then, subject to her standard release of claims in favor of the company, Ms. Liu shall be entitled to receive, as severance, an amount equal to 12 months’ base salary and one year of continued coverage under Company welfare plans pursuant to COBRA. Good reason includes a reduction in base salary (other than due to a broader compensation reduction), relocation of the primary business location by more than 50 miles, substantial reduction in duties and responsibilities, or a change in reporting line that represents a demotion.
Offer Letter with Richard Strulson
We entered into an offer letter with Mr. Strulson dated October 10, 2017, which was updated on November 16, 2020 to reflect the terms of Mr. Strulson’s promotion in 2019. Pursuant to the offer letter, Mr. Strulson serves as Senior Vice President and General Counsel, and he has since that time been promoted to Executive Vice President. His initial base salary was $340,000, increased to $375,000 in the 2020 update, and he is eligible for an annual performance-based bonus, with a target bonus of 50% his base salary. In addition, Mr. Strulson received a grant of stock options.
Pursuant to the offer letter, if we terminate Mr. Strulson’s employment for cause, we shall have no obligation to provide severance pay. If we terminate Mr. Strulson’s employment without cause or if Mr. Strulson dies or becomes disabled, then Mr. Strulson shall be entitled to receive, as severance, an amount equal to six months’ base salary. Pursuant to the update to the offer letter in 2020, this severance amount was modified such that, if we terminate Mr. Strulson’s employment without cause or Mr. Strulson terminates his employment for good reason, then, subject to his standard release of claims in favor of the company, Mr. Strulson shall be entitled to receive an amount equal to 12 months’ base salary and one year of continued coverage under Company welfare plans pursuant to COBRA. Good reason includes a reduction in base salary (other than due to a broader compensation reduction), relocation of the primary business location by more than 50 miles, substantial reduction in duties and responsibilities, or a change in reporting line that represents a demotion.
Mr. Strulson’s offer letter also contains non-solicitation restrictions for the term of his agreement and for a period of one year after termination of employment.
123
Table of Contents
Offer Letter with Jeffrey Trapp
We entered into an offer letter with Mr. Trapp dated May 16, 2016, in connection the acquisition of Creative Touch Interiors, Inc. Pursuant to the offer letter, Mr. Trapp served as the Director, Sales of HDIS, until his promotion to Executive Vice President, Sales and Business, in March 2019. His initial base salary was $193,000. Mr. Trapp’s offer letter also contains non-competition and non-solicitation restrictions during his employment and for a period of one year after termination of employment.
We entered into a letter agreement with Mr. Trapp on November 16, 2020, reflecting his promotion in 2019 and outlining the terms of his employment pursuant to such promotion. Pursuant to the letter agreement, Mr. Trapp is entitled to a base salary of $300,000, and for an annual performance-based bonus, with a target opportunity of 50% of his base salary. Pursuant to the letter agreement, if we terminate Mr. Trapp’s employment for cause, we shall have no obligation to provide severance pay. If we terminate Mr. Trapp’s employment without cause or if Mr. Trapp terminates his employment for good reason, then, subject to his standard release of claims in favor of the company, Mr. Trapp shall be entitled to receive, as severance, an amount equal to 12 months’ base salary and one year of continued coverage under Company welfare plans pursuant to COBRA. Good reason includes a reduction in base salary (other than due to a broader compensation reduction), relocation of the primary business location by more than 50 miles, substantial reduction in duties and responsibilities, or a change in reporting line that represents a demotion.
Outstanding Awards at Fiscal Year End Table
The following table summarizes the total outstanding equity awards as of December 31, 2020 for each of the Named Executive Officers. All numbers have been rounded to the nearest whole dollar or unit.
| Option Awards | Stock Awards | |||||||||||||||||||||||||||||||
| Name |
Grant Date |
Number of Securities Underlying Unexercised Options: (#) Exercisable |
Number of Securities Underlying Unexercised Options: (#) Unexercisable |
Option Exercise Price ($) |
Option Expiration Date |
Number of Shares or Units of Stock That Have Not Vested (#) |
Market Value of Shares or Units of Stock That Have Not Vested ($) |
Equity Incentive Plan Awards: Number of Unearned Shares, Units or Other Rights That Have Not Vested (#) |
Equity Incentive Plan Awards: Market or Payout Value of Unearned Shares, Units or Other Rights That Have Not Vested ($) |
|||||||||||||||||||||||
| Alan Davenport |
7/12/2016(1) | 12,000 | 3,000 | $ | 58.98 | 7/12/2026 | — | — | — | — | ||||||||||||||||||||||
| 5/23/2019(4) | 1,162 | 4,650 | $ | 574.68 | 5/22/2029 | — | — | — | — | |||||||||||||||||||||||
| Jason Peel |
10/22/2018(4) | 5,250 | 7,875 | $ | 551.95 | 10/21/2028 | — | — | — | — | ||||||||||||||||||||||
| 11/6/2019(4) | 956 | 3,823 | $ | 574.68 | 11/5/2029 | — | — | — | — | |||||||||||||||||||||||
| Anne Liu |
7/12/2016(1) | 800 | 200 | $ | 58.98 | 7/12/2026 | 600 | 86,970 | (5) | — | — | |||||||||||||||||||||
| 11/6/2019(4) | 519 | 2,074 | $ | 574.68 | 11/5/2029 | — | — | — | — | |||||||||||||||||||||||
| Richard Strulson |
12/4/2017(3) | 3,000 | 2,000 | $ | 106.56 | 11/14/2027 | — | — | — | — | ||||||||||||||||||||||
| 11/6/2019(4) | 291 | 1,164 | $ | 574.68 | 11/5/2029 | — | — | — | — | |||||||||||||||||||||||
| Jeffrey Trapp |
7/12/2016(1) | 3,200 | 800 | $ | 58.98 | 7/12/2026 | — | — | — | — | ||||||||||||||||||||||
| 11/14/2017(2) | 2,400 | 1,600 | $ | 106.56 | 11/14/2027 | — | — | — | — | |||||||||||||||||||||||
| 11/6/2019(4) | 302 | 1,208 | $ | 574.68 | 11/5/2029 | — | — | — | — | |||||||||||||||||||||||
| (1) | Represents an award under the 2015 Equity Incentive Plan relating to Class E Limited Voting Common Units of Faraday. The award vests 20% on each of the first five anniversaries of the date of grant. |
| (2) | Represents an award under the 2015 Equity Incentive Plan relating to Class E Limited Voting Common Units of Faraday. The award vests 20% on each of September 30, 2018, September 30, 2019, September 30, 2020, September 30, 2021, and September 30, 2022. |
| (3) | Represents an award under the 2015 Equity Incentive Plan relating to Class E Limited Voting Common Units of Faraday. The award vests 20% on each of the first five anniversaries of the date of grant. |
| (4) | Represents an award under the 2018 Equity Incentive Plan relating to Class B Limited Voting Common Units of the Company. The award vests 20% on each of the first four anniversaries of the date of grant, and the remaining 20% vests on the date that Littlejohn, Platinum Equity, and their affiliates own less than 30% of the Class A Units that they held as of the date of grant. |
| (5) | Represents an award under the 2015 Equity Incentive Plan relating to Class C Limited Voting Common Units of Faraday. The unvested portion of the award vests in the event that Littlejohn and its affiliates sell at least 50% of the common units of Faraday. |
124
Table of Contents
Options Exercised and Stock Vested in Fiscal 2020 Table
The following table sets forth information regarding stock options that were exercised and stock awards that vested during fiscal year 2020 for the Named Executive Officers. All numbers have been rounded to the nearest whole dollar or unit, where applicable.
| Option Awards | Stock Awards | |||||||||||||||
| Name |
Number of Shares Acquired on Exercise (#) |
Value Realized on Exercise ($) |
Number of Shares Acquired on Vesting (#) |
Value Realized on Vesting ($) |
||||||||||||
| Alan Davenport |
— | — | — | — | ||||||||||||
| Jason Peel |
— | — | — | — | ||||||||||||
| Anne Liu |
— | — | — | — | ||||||||||||
| Richard Strulson |
— | — | — | — | ||||||||||||
| Jeffrey Trapp |
— | — | — | — | ||||||||||||
Potential Payments Upon Termination or Change in Control
Severance Payments and Benefits under Offer Letters. Pursuant to the offer letters with Messrs. Peel, Strulson, and Trapp and Ms. Liu, as in effect as of December 31, 2020, he or she would be entitled to severance benefits upon a termination of employment without Cause, or in the event that he or she terminates employment with Good Reason, each as defined in the applicable offer letter. Upon such termination of employment, the executive would be entitled to receive a severance payment equal to 12 months of his or her base salary and one year of continued coverage under Company welfare plans pursuant to COBRA. In order to receive the severance benefits, the executive is required to execute a general release of claims in favor of the company. For additional information regarding the severance benefits, see the description above in the section titled “Employment Agreements and Offer Letters.”
Equity Awards. The awards outstanding under the 2012 Equity Incentive Plan, the 2015 Equity Incentive Plan, and the 2018 Equity Incentive Plan do not automatically accelerate and vest upon any termination of employment. However, pursuant to the terms of the awards currently outstanding, all unvested stock options and RSUs will accelerate and vest if there is a change in control or a liquidity event.
125
Table of Contents
Potential Payments Upon Termination or Change in Control Table
The following table summarizes the severance benefits that would have been payable to each of the Named Executive Officers upon termination of employment or upon a change in control, assuming that the triggering event or events occurred on December 31, 2020.
| Name |
Termination
of Employment Without Cause (or for Good Reason) ($) |
Termination of Employment for Cause or Without Good Reason ($) |
Change in Control (Single Trigger)(1) ($) |
|||||||||
| Alan Davenport |
||||||||||||
| Cash Severance |
— | — | — | |||||||||
| Equity Acceleration |
— | — | 2,000,079 | |||||||||
| Jason Peel |
||||||||||||
| Cash Severance |
450,000 | — | — | |||||||||
| Equity Acceleration |
— | — | 4,561,771 | |||||||||
| Anne Liu |
||||||||||||
| Cash Severance |
350,000 | — | — | |||||||||
| Equity Acceleration |
— | — | 881,209 | |||||||||
| Richard Strulson |
||||||||||||
| Cash Severance |
375,000 | — | — | |||||||||
| Equity Acceleration |
— | — | 512,884 | |||||||||
| Jeffrey Trapp |
||||||||||||
| Cash Severance |
300,000 | — | — | |||||||||
| Equity Acceleration |
— | — | 582,789 | |||||||||
| (1) | The amounts in this column represent the value of restricted stock units and stock options that would have been accelerated upon a change in control or liquidity event, based on the value of the underlying units as of December 31, 2020: Class B Limited Voting Common Units of the Company, $949.34, based on the valuation performed as of Sept. 30, 2020; and Class C Limited Voting Units and Class E Limited Voting Units of Faraday, $144.95. |
Equity Compensation Plans
The following descriptions of our equity compensation plans are qualified by reference to the full text of those plans, which will be filed as exhibits to this registration statement.
2012 Equity Incentive Plan and 2015 Equity Incentive Plan (As Amended July 2016 and September 2017). Certain employees and non-employee directors hold awards under the Faraday Holdings, LLC 2012 Equity Incentive Plan, effective as of May 17, 2012 (the “2012 Equity Incentive Plan”), which was replaced by the Faraday Holdings, LLC 2015 Equity Incentive Plan (the “2015 Equity Incentive Plan”) effective as of January 28, 2015, and as amended July 27, 2016 and September 14, 2017. No awards were granted under the 2012 Equity Incentive Plan after the 2015 Equity Incentive Plan was adopted. The 2012 Equity Incentive Plan and the 2015 Equity Incentive Plan are referred to collectively as the “2012 and 2015 Plans.” The 2012 and 2015 Plans are administered by the board of managers of Faraday. Subject to the provisions of the 2012 and 2015 Plans, the Faraday board of managers has the power to interpret and administer the plans and any award agreement thereunder and to determine the terms of awards. Restricted units for Class C Limited Voting Common Units of Faraday were granted under the 2012 and 2015 Plans to eligible employees and non-employee directors, as well as unit options, in the form of nonstatutory unit options or incentive unit options, to purchase Class E Limited Voting Common Units. The term of an option under the 2012 and 2015 Plans may not exceed ten years. The exercise price per share of all options generally must be equal to at least 100% of the fair market value per Class E Limited Voting Common Unit on the date of grant. Each award under the 2012 and 2015 Plans contains such other terms and provisions as approved by the board of managers of Faraday at the time of grant.
As of September 30, 2020, 50,500 Class C Limited Voting Common Units of Faraday remained available for issuance under the 2012 and 2015 Plans, and 5,600 Class C Limited Voting Common Units of Faraday were outstanding subject to unvested restricted unit awards, and 92,667 Class E Limited Voting Common Units of
126
Table of Contents
Faraday remained available for issuance under the 2012 and 2015 Plans, and 57,422 Class E Limited Voting Common Units of Faraday were outstanding subject to option awards. No new awards have been granted under the 2012 and 2015 Plans since the adoption of the 2018 Equity Incentive Plan.
2018 Equity Incentive Plan. We adopted the Interior Logic Group Holdings, LLC 2018 Equity Incentive Plan (the “2018 Equity Incentive Plan”) effective as of May 31, 2018. Our board of directors administers the 2018 Equity Incentive Plan. Subject to the provisions of the 2018 Equity Incentive Plan, our board of directors has the power to interpret and administer the 2018 Equity Incentive Plan and any award agreement thereunder and to determine the terms of awards. Unit options, in the form of nonstatutory unit options or incentive unit options, unit appreciation rights, restricted units and incentive units may be granted to eligible employees, non- employee directors and consultants. The term of an option under the 2018 Equity Incentive Plan may not exceed ten years. The exercise price per unit of all options generally must be equal to at least 100% of the fair market value per Class B Limited Voting Common Unit on the date of grant. Each grant under the 2018 Equity Incentive Plan contains such other terms and provisions as our board of directors may approve.
The maximum number of Class B Limited Voting Common Units with respect to which awards may be granted under the 2018 Equity Incentive Plan is 50,000. As of September 30, 2020, awards with respect to 42,387 Class B Limited Voting Common Units remained outstanding under the 2018 Equity Incentive Plan and 7,613 Class B Limited Voting Common Units remained available for grant as awards under the plan. Units subject to awards under the 2018 Equity Incentive Plan that (i) are forfeited or terminate for any reason, (ii) are surrendered by a participant to pay the exercise price applicable thereto or are withheld to pay taxes, or (iii) that are delivered as a result of the Company’s assumption or substitution for awards previously granted by another entity will not be counted against the unit limit and will be available for future grants. In connection with this offering, the outstanding awards under the 2018 Equity Incentive Plan will be converted into awards with respect to shares of our common stock.
2021 Omnibus Incentive Plan.
Our board of directors plans to adopt, and our current stockholders plan to approve, the 2021 Omnibus Incentive Plan (the “Omnibus Incentive Plan”) to become effective upon the consummation of this offering. Upon adoption of the Omnibus Incentive Plan, we do not expect to issue additional options under the 2018 Equity Incentive Plan. This summary is qualified in its entirety by reference to the Omnibus Incentive Plan that is ultimately adopted by our board of directors.
Administration. The Compensation Committee will administer the Omnibus Incentive Plan. The Compensation Committee will have the authority to determine the terms and conditions of any agreements evidencing any awards granted under the Omnibus Incentive Plan and to adopt, alter and repeal rules, guidelines and practices relating to the Omnibus Incentive Plan. The Compensation Committee will have full discretion to administer and interpret the Omnibus Incentive Plan and to adopt such rules, regulations and procedures as it deems necessary or advisable and to determine, among other things, the time or times at which the awards may be exercised and whether and under what circumstances an award may be exercised.
Eligibility. Any employees, directors, officers, consultants or advisors of the Company or its subsidiaries who are selected by the Compensation Committee will be eligible for awards under the Omnibus Incentive Plan. The Compensation Committee will have the sole and complete authority to determine who will be granted an award under the Omnibus Incentive Plan.
Number of Shares Authorized. The Omnibus Incentive Plan will provide for an aggregate of shares of our common stock which will be increased each fiscal year beginning with the 2022 fiscal year in an amount equal to the lesser of 4% of the outstanding shares of our common stock on the last day of the preceding fiscal year, or an amount determined by the Board. No more than shares of our common stock may be issued with respect to incentive stock options under the Omnibus Incentive Plan. The grant date fair value of awards granted
127
Table of Contents
to each non-employee member of the Board during a fiscal year, taken together with any cash fees paid to such director during such fiscal year, shall not exceed $ . If any award granted under the Omnibus Incentive Plan expires, terminates, or is canceled or forfeited without being settled or exercised, or if a stock appreciation right is settled in cash or otherwise without the issuance of shares, shares of our common stock subject to such award will again be made available for future grants. If any shares are surrendered or tendered to pay the exercise price of an award or to satisfy withholding taxes owed, such shares will not again be available for grants under the Omnibus Incentive Plan.
Change in Capitalization. If there is a change in the number or kind of shares of our stock outstanding in the event of a stock dividend, spinoff, recapitalization, stock split, or combination or exchange of shares, a merger, reorganization, or consolidation, a reclassification or change in par value, or any other extraordinary or unusual event affecting the our common stock as a class without the Company’s receipt of consideration, or if the value of outstanding shares of our stock is substantially reduced as a result of a spinoff or our payment of an extraordinary dividend or distribution, then the Board shall make adjustments in a manner that it deems equitable. Such adjustments may be to the number of shares reserved for issuance under the Omnibus Incentive Plan, the number of shares covered by awards then outstanding under the Omnibus Incentive Plan, the limitations on awards under the Omnibus Incentive Plan, or the exercise price of outstanding options, or such other equitable substitution or adjustments as it may determine appropriate.
Awards Available for Grant. The Compensation Committee may grant awards of non-qualified stock options, incentive (qualified) stock options, stock appreciation rights (“SARs”), restricted stock awards, restricted stock units, other stock-based awards, or any combination of the foregoing. Awards may be granted under the Omnibus Incentive Plan in assumption of, or in substitution for, outstanding awards previously granted by an entity acquired by the Company or with which the Company combines, which are referred to herein as “Substitute Awards.”
Stock Options. The Compensation Committee will be authorized to grant options to purchase shares of our common stock that are either “qualified,” meaning they are intended to satisfy the requirements of Section 422 of the Code for incentive stock options, or “non-qualified,” meaning they are not intended to satisfy the requirements of Section 422 of the Code. All options granted under the Omnibus Incentive Plan shall be non-qualified unless the applicable award agreement expressly states that the option is intended to be an “incentive stock option.” Options granted under the Omnibus Incentive Plan will be subject to the terms and conditions established by the Compensation Committee. Under the terms of the Omnibus Incentive Plan, the exercise price of the options will not be less than the fair market value of our common stock at the time of grant (except with respect to Substitute Awards). Options granted under the Omnibus Incentive Plan will be subject to such terms, including the exercise price and the conditions and timing of exercise, as may be determined by the Compensation Committee and specified in the applicable award agreement. The maximum term of an option granted under the Omnibus Incentive Plan will be ten years from the date of grant (or five years in the case of a qualified option granted to a 10% stockholder). Payment in respect of the exercise of an option may be made in cash, by delivery of shares of our common stock valued at the fair market value at the time the option is exercised, by any cashless mechanism, or any combination of these methods.
Stock Appreciation Rights. The Compensation Committee will be authorized to award SARs under the Omnibus Incentive Plan. SARs will be subject to the terms and conditions established by the Compensation Committee. A SAR is a contractual right that allows a participant to receive, in the form of either cash or shares, the appreciation, if any, in the value of a share over a certain period of time. SARs may be awarded in tandem with an option granted under the Omnibus Incentive Plan, and SARs may also be awarded to a participant independent of the grant of an option. SARs granted in connection with an option shall be subject to terms similar to the option corresponding to such SARs, including with respect to vesting and expiration. The strike price per share of our common stock underlying each SAR shall not be less than 100% of the fair market value of such share, determined as of the date of grant and the maximum term of a SAR granted under the Omnibus Incentive Plan will be ten years from the date of grant. The remaining terms of each grant of SARs shall be established by the Compensation Committee and reflected in the award agreement.
128
Table of Contents
Restricted Stock. The Compensation Committee will be authorized to grant restricted stock under the Omnibus Incentive Plan, which will be subject to the terms and conditions established by the Compensation Committee. Restricted stock is common stock that is generally non-transferable and is subject to other restrictions determined by the Compensation Committee for a specified period.
Restricted Stock Unit Awards. The Compensation Committee will be authorized to grant restricted stock unit awards, which will be subject to the terms and conditions established by the Compensation Committee. A restricted stock unit award, once vested, may be settled in a number of shares of our common stock equal to the number of units earned, or in cash equal to the fair market value of the number of shares of our common stock, earned in respect of such restricted stock unit award of units earned, at the election of the Compensation Committee. Restricted stock units may be settled at the expiration of the period over which the units are to be earned or at a later date selected by the Compensation Committee.
Other Stock-Based Awards. The Compensation Committee will be authorized to grant awards of unrestricted shares of our common stock or other awards valued in whole or in part by reference to the fair market value of our common stock under such terms and conditions as the Compensation Committee may determine and as set forth in the applicable award agreement.
Effect of a Change in Control. Unless otherwise provided in an award agreement, in the event of a change of control where the Company is not the surviving corporation, unless otherwise determined by the Compensation Committee, Awards granted under the Omnibus Incentive Plan will be assumed by or replaced with comparable Awards by, the surviving corporation (or a parent or subsidiary of the surviving corporation). If the Awards are not assumed or replaced by the surviving corporation, (i) the Company will provide each participant who holds outstanding Awards with notice of the change of control, (ii) all options and SARs will become immediately vested and exercisable, (iii) restricted stock and RSUs with time-based vesting will become fully vested, (iv) except as otherwise provided in the applicable Award Agreement, restricted stock and RSUs with performance-based vesting will vest at the target performance level. In addition, the Compensation Committee may, in its discretion, cancel any outstanding options, SARs, or restricted stock awards and pay the holders, in cash, , the value of such awards based upon the price per share of the Company’s common stock received or to be received by other shareholders of the Company in connection with the transaction.
Nontransferability. Each award may be exercised during the participant’s lifetime by the participant or, if permissible under applicable law, by the participant’s guardian or legal representative. No award may be assigned, alienated, pledged, attached, sold or otherwise transferred or encumbered by a participant other than by will or by the laws of descent and distribution unless the Compensation Committee permits the award to be transferred to a permitted transferee (as defined in the Omnibus Incentive Plan).
Amendment. The Omnibus Incentive Plan will have a term of ten years. The board of directors may amend, suspend or terminate the Omnibus Incentive Plan at any time, subject to stockholder approval if necessary to comply with any tax, exchange rules, or other applicable regulatory requirement; provided that, without stockholder approval, no amendment or modification may reduce the exercise price of any option or SAR, and the Compensation Committee may not exchange any outstanding option or SAR for a new Award with a lower exercise price or for cash. No amendment, suspension or termination will materially and adversely affect the rights of any participant or recipient of any award without the consent of the participant or recipient.
U.S. Federal Income Tax Consequences
The following is a general summary of the material U.S. federal income tax consequences of the grant, exercise and vesting of awards under the Omnibus Incentive Plan and the disposition of shares acquired pursuant to the exercise or settlement of such awards and is intended to reflect the current provisions of the Code and the regulations thereunder. This summary is not intended to be a complete statement of applicable law, nor does it address foreign, state, local or payroll tax considerations. This summary assumes that all awards described in
129
Table of Contents
the summary are exempt from, or comply with, the requirement of Section 409A of the Code. Moreover, the U.S. federal income tax consequences to any particular participant may differ from those described herein by reason of, among other things, the particular circumstances of such participant.
Stock Options. Holders of incentive stock options will generally incur no federal income tax liability at the time of grant or upon vesting or exercise of those options. However, the spread at exercise will be an “item of tax preference,” which may give rise to “alternative minimum tax” liability for the taxable year in which the exercise occurs. If the holder does not dispose of the shares before the later of two years following the date of grant and one year following the date of exercise, the difference between the exercise price and the amount realized upon disposition of the shares will constitute long-term capital gain or loss, as the case may be. Assuming the holding period is satisfied, no deduction will be allowed to us for federal income tax purposes in connection with the grant or exercise of the incentive stock option. If, within two years following the date of grant or within one year following the date of exercise, the holder of shares acquired through the exercise of an incentive stock option disposes of those shares, the participant will generally realize taxable compensation at the time of such disposition equal to the difference between the exercise price and the lesser of the fair market value of the share on the date of exercise or the amount realized on the subsequent disposition of the shares, and that amount will generally be deductible by us for federal income tax purposes, subject to the possible limitations on deductibility under Sections 280G and 162(m) of the Code for compensation paid to executives designated in those Sections. Finally, if an incentive stock option becomes first exercisable in any one year for shares having an aggregate value in excess of $100,000 (based on the grant date value), the portion of the incentive stock option in respect of those excess shares will be treated as a non-qualified stock option for federal income tax purposes.
No income will be realized by a participant upon grant or vesting of an option that does not qualify as an incentive stock option (“a non-qualified stock option”). Upon the exercise of a non-qualified stock option, the participant will recognize ordinary compensation income in an amount equal to the excess, if any, of the fair market value of the underlying exercised shares over the option exercise price paid at the time of exercise, and the participant’s tax basis will equal the sum of the compensation income recognized and the exercise price. We will be able to deduct this same excess amount for U.S. federal income tax purposes, but such deduction may be limited under Sections 280G and 162(m) of the Code for compensation paid to certain executives designated in those Sections. In the event of a sale of shares received upon the exercise of a non-qualified stock option, any appreciation or depreciation after the exercise date generally will be taxed as capital gain or loss and will be long-term gain or loss if the holding period for such shares is more than one year.
SARs. No income will be realized by a participant upon grant or vesting of a SAR. Upon the exercise of a SAR, the participant will recognize ordinary compensation income in an amount equal to the fair market value of the payment received in respect of the SAR. We will be able to deduct this same amount for U.S. federal income tax purposes, but such deduction may be limited under Sections 280G and 162(m) of the Code for compensation paid to certain executives designated in those Sections.
Restricted Stock. A participant will not be subject to tax upon the grant of an award of restricted stock unless the participant otherwise elects to be taxed at the time of grant pursuant to Section 83(b) of the Code. On the date an award of restricted stock becomes transferable or is no longer subject to a substantial risk of forfeiture (i.e., the vesting date), the participant will have taxable compensation equal to the difference between the fair market value of the shares on that date over the amount the participant paid for such shares, if any, unless the participant made an election under Section 83(b) of the Code to be taxed at the time of grant. If the participant made an election under Section 83(b), the participant will have taxable compensation at the time of grant equal to the difference between the fair market value of the shares on the date of grant over the amount the participant paid for such shares, if any. If the election is made, the participant will not be allowed a deduction for amounts subsequently required to be returned to us. (Special rules apply to the receipt and disposition of restricted shares received by officers and directors who are subject to Section 16(b) of the Exchange Act). We will be able to deduct, at the same time as it is recognized by the participant, the amount of taxable compensation to the participant for U.S. federal income tax purposes, but such deduction may be limited under Sections 280G and 162(m) of the Code for compensation paid to certain executives designated in those Sections.
130
Table of Contents
Restricted Stock Units. A participant will not be subject to tax upon the grant or vesting of a restricted stock unit award. Rather, upon the delivery of shares or cash pursuant to a restricted stock unit award, the participant will have taxable compensation equal to the fair market value of the number of shares (or the amount of cash) the participant actually receives with respect to the award. We will be able to deduct the amount of taxable compensation to the participant for U.S. federal income tax purposes, but the deduction may be limited under Sections 280G and 162(m) of the Code for compensation paid to certain executives designated in those Sections.
COMPENSATION OF NON-MANAGEMENT DIRECTORS
Prior to the offering, each of our non-employee directors was appointed by Littlejohn or Platinum Equity, or their respective affiliates. Five of our directors (Messrs. Crawley, Davis, Golditch, Raich and Wigdale) are directly affiliated with Littlejohn or Platinum Equity, or their respective affiliates, and do not receive additional compensation for their service on the Board. Three of our directors (Mr. Bader, Ms. Carter, and Ms. Jovanovic) are not affiliated with Littlejohn or Platinum Equity, or their respective affiliates, and each was eligible to receive a cash payment of $50,000 for service on the Board during 2020. Ms. Carter received a grant of 500 options in 2020, which vest in five equal annual installments beginning on the date of grant. In recognition of additional services she provided as member of the Board in 2020, Ms. Carter received an additional amount of cash compensation.
The following table summarizes the compensation earned by, or awarded or paid to our non-employee directors for the year ended December 31, 2020.
| Name |
Fees Earned or Paid in Cash ($) |
Option Awards(1) ($) |
All
Other Compensation ($) |
Total ($) |
||||||||||||
| Paul Bader |
50,000 | — | — | 50,000 | ||||||||||||
| Margot Carter |
215,000 | 235,950 | — | 450,950 | ||||||||||||
| Brandon Crawley |
— | — | — | — | ||||||||||||
| Robert Davis |
— | — | — | — | ||||||||||||
| Todd Golditch |
— | — | — | — | ||||||||||||
| Janine Jovanovic |
50,000 | — | 276,667 | (2) | 326,667 | |||||||||||
| Steven Raich |
— | — | — | — | ||||||||||||
| James Wigdale |
— | — | — | — | ||||||||||||
| (1) | Amounts in this column reflect the grant date fair value of the stock options under FASB ASC Topic 718. For a description of the methodology and assumptions used to determine the amounts reflected in this column, see Note 12 to the consolidated financial statements for the fiscal year ended December 31, 2020. |
| (2) | Represents consulting fees paid to Ms. Jovanovic for advisory services. |
131
Table of Contents
CERTAIN RELATIONSHIPS AND RELATED PARTY TRANSACTIONS
Business Combination and Limited Liability Company Agreement
On May 31, 2018, we completed the Business Combination. See “The Business Combination.” In connection with the Business Combination, we entered into the LLC Agreement pursuant to which Littlejohn and an affiliate of Platinum Equity were granted the right to designate members of our Board and certain registration rights in the event of a public offering. In connection with the Corporate Conversion, the LLC Agreement will be terminated and replaced with the Stockholders Agreement, as discussed below.
Corporate Conversion
On , 2020, we entered into a Plan of Conversion with the Sponsors, pursuant to which we and the Sponsors agreed to convert Interior Logic Group Holdings, LLC from a limited liability company to a corporation in accordance with the terms of the LLC Agreement. In connection with the Corporate Conversion, we intend to adopt a certificate of incorporation and bylaws, which will replace the LLC Agreement.
Stockholders Agreement
In connection with this offering, we expect to enter into a stockholders agreement (the “Stockholders Agreement”) with Littlejohn and Platinum providing for, among other things, registration rights. The Stockholders Agreement will contain other customary rights and obligations among the Company and the stockholders.
Registration Rights
Pursuant to the Stockholders Agreement, for so long as Littlejohn or Platinum continues to hold at least 20% of the outstanding shares of our common stock, such person will be entitled to three demand registration rights pursuant to a registration statement on Form S-1, an unlimited number of demand registration rights pursuant to a registration statement on Form S-3, to the extent we are so eligible, and unlimited piggyback registration rights, subject to customary underwriter cutbacks and issuer blackout periods. We will pay certain fees and expenses relating to registrations under the Stockholders Agreement.
Management Agreement
On May 31, 2018, we entered into an Amended and Restated Management Services and Fee Agreement (the “Amended Management Agreement”) with Littlejohn Management Holdings, LLC (“LJMH”), an affiliate of Littlejohn. Pursuant to the Amended Management Agreement, LJMH agreed to provide us with certain services, including: assistance in development of corporate strategy and governance; finance and tax oversight; high-level managerial and operational oversight; and support for our human resources, facilities, sales, customer relations and other functions. In exchange for these services, we agreed to pay LJMH a fee of $250,000 per quarter and reimburse LJMH for certain expenses reasonably incurred in connection with the provision of services pursuant to the Amended Management Agreement. The Amended Management Agreement has a ten-year term and will terminate automatically upon the consummation of this offering.
The Amended Management Agreement replaced the Management Services and Fee Agreement with LJMH, dated January 1, 2015 (the “Original Management Agreement”), which provided for LJMH’s provision of management and financial advisory services in exchange for an annual fee of $250,000 and reimbursement of certain expenses.
During the nine months ended September 30, 2020 and 2019 and the years ended December 31, 2019 and 2018, we paid an aggregate of $291,333, $781,382, $1,063,506, and $671,992, respectively, including amounts for expense reimbursement, to LJMH under the Amended Management Agreement and Original Management Agreement, as applicable.
132
Table of Contents
Monitoring Services Agreement
On May 31, 2018, we entered into an Amended and Restated Monitoring Services and Fee Agreement (the “Amended Monitoring Agreement”) with Platinum Equity Advisors, LLC (“PEA”), an affiliate of Platinum Equity, LLC. Pursuant to the Amended Monitoring Agreement, PEA agreed to provide us with certain services, including: assistance in development of corporate strategy and governance; finance and tax oversight; high-level managerial and operational oversight; and support for the company’s human resources, facilities, sales, customer relations and other functions. In exchange for these services, we agreed to pay PEA a fee of $250,000 per quarter and reimburse PEA for certain expenses reasonably incurred in connection with the provision of services pursuant to the Amended Monitoring Agreement. The Amended Monitoring Agreement has a ten-year term and will terminate automatically upon the consummation of this offering. The Amended Monitoring Agreement replaced the Monitoring Services and Fee Agreement between PEA and legacy ILG, dated March 3, 2017.
During the nine months ended September 30, 2020 and 2019 and the years ended December 31, 2019 and 2018, we paid an aggregate of $796,822, $783,907, $1,034,498 and $515,649 to PEA under the Amended Monitoring Agreement.
Sponsor Credit Agreement
On August 13, 2014, certain affiliates of Littlejohn & Co., LLC executed an assignment agreement with each of the lenders under the Sponsor Credit Agreement, pursuant to which Littlejohn acquired the prior lenders’ loan interests and assumed the lenders’ rights and obligations under the Sponsor Credit Agreement. As of December 31, 2016, the aggregate outstanding principal balance of the loans under the Sponsor Credit Agreement, plus accrued interest, totaled $19.2 million, and the effective interest rate thereunder was 12.83%.
The Sponsor Credit Agreement balance of $21.4 million, including accrued interest, was repaid in full on October 16, 2017 with the funds of the Prior Term Loan Facility.
Distributions to Faraday and ISH
In January 2020, we paid a special cash distribution of $7.95 million and $7.05 million to our membership equityholders, Faraday and ISH, respectively, or $15.0 million in the aggregate. In December 2020, we paid a special cash distribution of $31.8 million and $28.2 million to Faraday and ISH, respectively, or $60.0 million in the aggregate. The distributions were paid on a pro rata basis in accordance with the equityholders’ percentage interest ownership in the Company.
Promissory Note
On May 29, 2014, we made a $120,000 loan to Mr. Davenport in the form of a secured promissory note, which matures on or before May 29, 2023 and accrues interest at 1.93%, compounded annually. The loan was made in connection with the purchase of an aggregate of 10,000 Class C limited voting units of Faraday by Mr. Davenport. The loan, including principal and interest in the aggregate amount of $123,261, was forgiven in full in December 2020. Mr. Davenport was also compensated $65,154 in December 2020 as a gross-up on the income taxes he incurred in connection with the loan forgiveness.
Indemnification Agreements
We have entered into an indemnification agreement with each of our officers and directors. These agreements generally require us to indemnify these individuals to the fullest extent permitted under Delaware law against liabilities that may arise by reason of their service to us, and to advance expenses incurred as a result of any proceeding against them as to which they could be indemnified. See “Description of Capital Stock — Limitations on Liability, Indemnification of Officers and Directors and Insurance.”
Policies and Procedures for Related-Party Transactions
Our board of directors expects to adopt a written related-party transaction policy, to be effective upon the completion of this offering, setting forth the policies and procedures for the review and approval or ratification of
133
Table of Contents
transactions involving us and “related persons.” For the purposes of this policy, “related persons” will include our executive officers, directors and director nominees or their immediate family members, or stockholders owning five percent or more of our outstanding common stock and their immediate family members.
The policy will cover, with certain exceptions set forth in Item 404 of Regulation S-K under the Securities Act, any transaction, arrangement or relationship, or any series of similar transactions, arrangements or relationships in which we were or are to be a participant, where the amount involved exceeds $120,000 and a related person had or will have a direct or indirect material interest, including, without limitation, purchases of goods or services by or from the related person or entities in which the related person has a material interest, indebtedness, guarantees of indebtedness and employment by us of a related person. In reviewing and approving any such transactions, our audit committee will be tasked to consider all relevant facts and circumstances, including, but not limited to, whether the transaction is on terms comparable to those that could be obtained in an arm’s length transaction with an unrelated party and the extent of the related person’s interest in the transaction. All related-party transactions may only be consummated if our audit committee has approved or ratified such transaction in accordance with the guidelines set forth in the policy. Any member of the audit committee who is a related person with respect to a transaction under review will not be permitted to participate in the deliberations or vote respecting approval or ratification of the transaction. However, such director may be counted in determining the presence of a quorum at a meeting of the audit committee that considers the transaction. All of the transactions described in this section occurred prior to the expected adoption of this policy.
134
Table of Contents
The following table lists information regarding the beneficial ownership of our common stock as of , 2020, and after giving effect to the Corporate Conversion, by (i) each person whom we know to beneficially own 5% or more of our outstanding common stock (each, a “5% Stockholder”), (ii) each named executive officer, each director and director nominee and (iv) all executive officers, directors and director nominees as a group. Unless otherwise indicated, the address of each officer and director is that of our headquarters, c/o Interior Logic Group Holdings, Inc., 10 Bunsen, Irvine, California 92618.
The number of shares of common stock “beneficially owned” by each stockholder is determined under rules issued by the SEC regarding the beneficial ownership of securities. This information is not necessarily indicative of ownership for any other purpose. Under these rules, beneficial ownership of shares of our common stock includes (i) any shares as to which the person or entity has sole or shared voting power or investment power and (ii) any shares as to which the person or entity has the right to acquire beneficial ownership within 60 days after , 2020 including any shares that could be purchased by the exercise of options or warrants held by that person. Shares issuable pursuant to stock options and warrants are deemed outstanding for computing the percentage of the person holding such options or warrants but are not outstanding for computing the percentage of any other person. Each holder’s percentage ownership before this offering is based on shares of common stock outstanding as of , 2020. Each holder’s percentage ownership after this offering is based on shares of common stock to be outstanding immediately after the completion of this offering. The percentages assume no exercise by the underwriters of their option to purchase additional shares.
Unless otherwise indicated below, to our knowledge, all persons named in the table have sole voting and investment power with respect to their shares of common stock.
| Name of Beneficial Owner |
Shares of Common Stock Beneficially Owned |
Percentage of Common Stock Beneficially Owned |
||||||||||
| Prior to this Offering |
After this Offering |
|||||||||||
| 5% Stockholders: |
||||||||||||
| Entities affiliated with Littlejohn(1) |
||||||||||||
| Entities affiliated with Platinum Equity, LLC(2) |
||||||||||||
| Named Executive Officers, Directors and Director Nominees: |
||||||||||||
| Alan K. Davenport |
||||||||||||
| Jason D. Peel |
||||||||||||
| Anne M. Liu |
||||||||||||
| Richard D. Strulson |
||||||||||||
| Jeff Trapp |
||||||||||||
| Paul T. Bader |
||||||||||||
| Margot L. Carter |
||||||||||||
| Brandon J. Crawley |
||||||||||||
| Robert E. Davis |
||||||||||||
| Todd D. Golditch |
||||||||||||
| Janine S. Jovanovic |
||||||||||||
| Steven G. Raich |
||||||||||||
| James B. Wigdale III |
||||||||||||
| All executive officers, directors and director nominees as a group (13 persons) |
||||||||||||
| * | Denotes less than 1.0% beneficial owner. |
| (1) | Cetus Capital II, LLC, a Delaware limited liability company (“Cetus II”), and Littlejohn Opportunities Master Fund LP, a Cayman Islands limited partnership (“Littlejohn Opportunities”), are affiliates of Littlejohn & Co., LLC. Littlejohn Fund IV, L.P. (“Fund IV”), as the sole member of Cetus II, Littlejohn Associates IV, L.L.C. (“Associates IV”), the general partner of Fund IV, and Littlejohn Opportunities GP LLC (“LJO”), the general partner of Littlejohn Opportunities, may each be deemed an indirect beneficial |
135
Table of Contents
| owner of these shares. Robert E. Davis and Steven G. Raich, members of our board of directors, are partners of Littlejohn & Co., LLC and managers of Associates IV and LJO, and share voting and investment control with respect to these shares. Each of LJO, Fund IV, Associates IV, Messrs. Davis and Raich disclaims any beneficial ownership of such shares in which it or he does not have a pecuniary interest. The address of each of Cetus II, Littlejohn Opportunities, LJO, Fund IV and Associates IV is 8 Sound Shore Drive, Greenwich, Connecticut 06830. |
| (2) | Represents shares held by Platinum Equity Capital Partners IV, L.P., a Delaware limited partnership (“PECP IV”), which indirectly holds a controlling interest in Installation Services Holdings, LLC, which is the holder of record of our common stock. Platinum may be deemed to beneficially own the units of PECP IV and Tom Gores is the Chairman and Chief Executive Officer of Platinum Equity, LLC, which, through its affiliates, manages Platinum. Mr. Gores may be deemed to share voting power and investment power with PECP IV with respect to shares of our common stock that are beneficially held by Platinum. |
136
Table of Contents
The following description is intended as a summary of our certificate of incorporation (which we refer to as our “charter”) and our bylaws, in each case, which will become effective immediately prior to the effectiveness of the registration statement of which this prospectus forms a part and which will be filed as exhibits to such registration statement, and to the applicable provisions of the DGCL. Because the following is only a summary, it does not contain all of the information that may be important to you. For a complete description, you should refer to our charter and bylaws.
General
Immediately prior to the effectiveness of the registration statement of which this prospectus forms a part, we will file our charter that authorizes shares of common stock, $0.01 par value per share, and shares of preferred stock, $0.01 per value per share. As of , 2020, after giving effect to the Corporate Conversion and the issuance and sale of shares of common stock in this offering, we will have shares of common stock outstanding and no shares of preferred stock outstanding.
Common Stock
Voting Rights
Each holder of our common stock is entitled to one vote for each share on all matters submitted to a vote of the stockholders, including the election of directors. Our stockholders do not have cumulative voting rights in the election of directors. Accordingly, holders of a majority of the voting shares are able to elect all of the directors.
Dividends
Subject to preferences that may be applicable to any then outstanding preferred stock, holders of our common stock are entitled to receive dividends, if any, as may be declared from time to time by our board of directors out of legally available funds.
Liquidation
In the event of our liquidation, dissolution or winding up, holders of our common stock are entitled to share ratably in the net assets legally available for distribution to stockholders after the payment of all of our debts and other liabilities and the satisfaction of any liquidation preference granted to the holders of any then outstanding shares of preferred stock.
Rights and Preferences
Holders of our common stock have no preemptive, conversion, subscription or other rights, and there are no sinking fund provisions applicable to our common stock. The rights, preferences and privileges of the holders of our common stock are subject to and may be adversely affected by the rights of the holders of shares of any series of our preferred stock that we may designate in the future.
Fully Paid and Nonassessable
All of our outstanding shares of common stock are, and the shares of common stock to be issued in this offering will be, fully paid and nonassessable.
Preferred Stock
Our board of directors will have the authority, without further action by our stockholders, to issue up to shares of preferred stock in one or more series and to fix the rights, preferences, privileges and
137
Table of Contents
restrictions thereof. These rights, preferences and privileges could include dividend rights, conversion rights, voting rights, terms of redemption, liquidation preferences, sinking fund terms and the number of shares constituting, or the designation of, such series, any or all of which may be greater than the rights of common stock. The issuance of our preferred stock could adversely affect the voting power of holders of common stock and the likelihood that such holders will receive dividend payments and payments upon our liquidation. In addition, the issuance of preferred stock could have the effect of delaying, deferring or preventing a change in control of our company or other corporate action. Immediately after completion of this offering, no shares of preferred stock will be outstanding, and we have no present plan to issue any shares of preferred stock.
Anti-Takeover Effects of Provisions of Our Charter, Our Bylaws and Delaware Law
Our charter and bylaws contain provisions that may delay, defer or discourage another party from acquiring control of us. We expect that these provisions, which are summarized below, will discourage coercive takeover practices or inadequate takeover bids. These provisions are also designed to encourage persons seeking to acquire control of us to first negotiate with our board of directors, which we believe may result in an improvement of the terms of any such acquisition in favor of our stockholders. However, they also give our board of directors the power to discourage acquisitions that some stockholders may favor.
Undesignated Preferred Stock
The ability to authorize undesignated preferred stock will make it possible for our board of directors to issue preferred stock with super voting, special approval, dividend or other rights or preferences on a discriminatory basis that could impede the success of any attempt to acquire us. These and other provisions may have the effect of deferring, delaying or discouraging hostile takeovers, or changes in control or management of our company.
Board Size; Filling of Vacancies
Our charter and bylaws provide that the number of directors on our board of directors will be fixed exclusively by our board of directors. Newly created directorships resulting from any increase in our authorized number of directors will be filled solely by the vote of our remaining directors in office. Any vacancies in our board of directors resulting from death, resignation, retirement, disqualification or removal from office or other cause will be filled solely by a majority vote of our remaining directors, or a quorum of our remaining directors, in office.
Classified Board of Directors; Removal of Directors
Our charter provides that our board of directors will be divided into three classes, with each class serving three-year staggered terms. Our charter and bylaws provide that directors may be removed by stockholders only for cause.
Special Meetings of Stockholders
Our charter and bylaws provide that special meetings of the stockholders may be called only by the chairman of our board of directors, our Chief Executive Officer, any two directors or upon a resolution approved by a majority of the total number of directors that we would have if there were no vacancies, and not by our stockholders.
No Stockholder Action by Written Consent
Our charter provides that any action required or permitted to be taken by the stockholders may be effected only at a duly called annual or special meeting.
138
Table of Contents
Requirements for Advance Notification of Stockholder Nominations and Proposals
Our bylaws establish advance notice procedures with respect to stockholder proposals and the nomination of candidates for election as directors, other than nominations made by or at the direction of the Board of Directors or a committee of the Board of Directors. In order for any matter to be “properly brought” before a meeting, a stockholder has to comply with advance notice requirements and provide us with certain information. Generally, to be timely, a stockholder’s notice must be received at our principal executive offices not less than 90 days nor more than 120 days prior to the first anniversary date of the immediately preceding annual meeting of stockholders. Our bylaws also specify requirements as to the form and content of a stockholder’s notice.
Our bylaws allow the chairman of the meeting at a meeting of the stockholders to adopt rules and regulations for the conduct of meetings which may have the effect of precluding the conduct of certain business at a meeting if the rules and regulations are not followed. These provisions may defer, delay or discourage a potential acquirer from conducting a solicitation of proxies to elect the acquirer’s own slate of directors or otherwise attempting to influence or obtain control of our company.
Exclusive Forum
Our amended and restated certificate of incorporation requires, to the fullest extent permitted by law, that (i) any derivative action or proceeding brought on our behalf, (ii) any action asserting a claim of breach of a fiduciary duty owed by any of our directors, officers or other employees to us or our stockholders, (iii) any action asserting a claim against us arising pursuant to any provision of the DGCL or our amended and restated certificate of incorporation or our amended and restated bylaws, or (iv) any action asserting a claim against us governed by the internal affairs doctrine will have to be brought only in the Court of Chancery in the State of Delaware. The exclusive forum provision will not apply to suits brought to enforce any liability or duty created by the Exchange Act or any other claim for which the federal courts have exclusive jurisdiction. The exclusive forum provision also provides that, unless we consent in writing to the selection of an alternative forum, the federal courts will be the exclusive forum for the resolution of any complaint asserting a cause of action arising under the Securities Act. Although we believe this provision benefits us by providing increased consistency in the application of Delaware law in the types of lawsuits to which it applies, the provision may have the effect of discouraging lawsuits against our directors and officers.
Business combinations with interested stockholders
We will be subject to Section 203 of the Delaware General Corporation Law, which generally prohibits a Delaware corporation from engaging in any of a broad range of business combinations with a stockholder owning 15% or more of such corporation’s outstanding voting stock for a period of three years following the date on which such stockholder became an “interested” stockholder. In order for us to consummate a business combination with an “interested” stockholder within three years of the date on which the stockholder became “interested,” either (i) the business combination or the transaction that resulted in the stockholder becoming “interested” must be approved by our board of directors prior to the date the stockholder became “interested,” (ii) the “interested” stockholder must own at least 85% of our outstanding voting stock at the time the transaction commences (excluding voting stock owned by directors who are also officers and certain employee stock plans) or (iii) the business combination must be approved by our board of directors and authorized by at least two-thirds of our stockholders (excluding the “interested” stockholder). This provision could have the effect of delaying or preventing a change of control, whether or not it is desired by or beneficial to our stockholders. Any delay or prevention of a change of control transaction or changes in our board of directors and management could deter potential acquirers or prevent the completion of a transaction in which our stockholders could receive a substantial premium over the then-current market price for their shares of our common stock.
Requirements for Amendments to our Charter and Bylaws
Our charter provides that the provisions of our charter relating to the size and composition of our board of directors, limitation on liabilities of directors, stockholder action by written consent, the ability of stockholders to
139
Table of Contents
call special meetings, business combinations with interested stockholders, amendment of our bylaws or charter, corporate opportunity and the Court of Chancery as the exclusive forum for certain disputes, may only be amended, altered, changed or repealed by the affirmative vote of the holders of at least 66 2/3% of the voting power of all our outstanding shares of capital stock entitled to vote generally in the election of directors, voting together as a single class. Our charter provides that such provisions may be amended, altered, changed or repealed by the affirmative vote of the holders of a majority of the voting power of our then outstanding capital stock entitled to vote generally in the election of directors, voting together as a single class.
Our charter provides that our bylaws may be adopted, amended, altered or repealed by either (i) a vote of a majority of the total number of directors that the company would have if there were no vacancies or (ii) in addition to any other vote otherwise required by law, the affirmative vote of the holders of at least 66 2/3% of the voting power of our then outstanding capital stock entitled to vote generally in the election of directors, voting together as a single class.
Corporate Opportunity
Delaware law permits corporations to adopt provisions renouncing any interest or expectancy in certain opportunities that are presented to the corporation or its officers, directors or stockholders. Our charter provides that, to the fullest extent permitted by law, neither the Sponsors nor their respective affiliates have any duty to refrain from (i) engaging in a corporate opportunity in the same or similar business activities or lines of business in which we or our affiliates now engage or propose to engage or (ii) otherwise competing with us or our affiliates. In addition, to the fullest extent permitted by law, in the event that the Sponsors acquire knowledge of a potential transaction or other business opportunity that may be a corporate opportunity for themselves or their affiliates or for us or our affiliates, such person has no duty to communicate or offer such transaction or business opportunity to us or any of our affiliates and they may take any such opportunity for themselves or offer it to another person or entity. Our charter does not renounce our interest in any business opportunity that is expressly offered to a non-employee director solely in his or her capacity as a director or officer of the company.
Limitations on Liability, Indemnification of Officers and Directors and Insurance
The DGCL authorizes corporations to limit or eliminate the personal liability of directors to corporations and their stockholders for monetary damages for breaches of directors’ fiduciary duties as directors, subject to certain exceptions, by provision of the corporation’s certificate of incorporation. Our charter contains a provision eliminating the personal liability of our directors to the fullest extent permitted by the DGCL. In addition, our charter includes provisions that require us to indemnify, to the fullest extent allowable under the DGCL, our directors and officers for monetary damages for actions taken as our director or officer, or for serving at our request as a director or officer or another position at another corporation or enterprise, as the case may be. Our bylaws also provide that we may advance reasonable expenses to our directors and officers, subject to our receipt of an undertaking from the indemnified party as may be required under the DGCL.
We are also expressly authorized by the DGCL to carry directors’ and officers’ insurance to protect us, our directors, officers and certain employees for some liabilities. The limitation of liability and indemnification and advancement provisions in our charter and bylaws, respectively, may discourage stockholders from bringing a lawsuit against directors for breach of their fiduciary duties. These provisions may also have the effect of reducing the likelihood of derivative litigation against directors and officers, even though such an action, if successful, might otherwise benefit us and our stockholders. However, our charter provision eliminating the personal liability of our directors to the fullest extent permitted by the DGCL does not limit or eliminate our rights, or those of any stockholder, to seek non-monetary relief such as injunction or rescission in the event of a breach of a director’s fiduciary duties, including the duty of care. The indemnification provisions will not alter the liability of directors under the federal securities laws. We have entered into an indemnification agreement with each of our officers and directors. These agreements require us to indemnify these individuals to the fullest extent permitted under Delaware law against liabilities that may arise by reason of their service to us. We believe
140
Table of Contents
that the limitation of liability provision in our charter and the indemnification agreements will facilitate our ability to continue to attract and retain qualified individuals to serve as directors and officers.
Listing
We have applied to list our common stock on the Nasdaq Global Select Market under the symbol “ILG.”
Transfer Agent and Registrar
The transfer agent and registrar for the shares of our common stock will be .
141
Table of Contents
SHARES ELIGIBLE FOR FUTURE SALE
Prior to this offering, there has been no public market for our common stock, and a liquid trading market for our common stock may not develop or be sustained after this offering. Future sales of our common stock, including shares issued upon the exercise of outstanding options after this offering, or the perception that those sales may occur, could cause the prevailing market price for our common stock to fall or impair our ability to raise equity capital in the future. As described below, only those shares sold in this offering will be available for sale in the public market for a period of several months after completion of this offering due to contractual and legal restrictions on resale described below. We have applied to list our common stock on the Nasdaq Global Select Market under the symbol “ILG.” We cannot assure you that there will be an active public market for our common stock.
Sale of Restricted Securities
Based on the number of shares of our common stock outstanding as of , 2020, after giving effect to the Corporate Conversion, upon the completion of this offering and assuming no exercise of the underwriters’ option to purchase additional shares of common stock, we will have outstanding shares of common stock. Of these shares, all of the shares of common stock to be sold in this offering, and any shares sold upon exercise of the underwriters’ option to purchase additional shares, will be freely tradable in the public market without restriction or further registration under the Securities Act, unless the shares are held by any of our “affiliates” as such term is defined in Rule 144 of the Securities Act (“Rule 144”). All remaining shares of common stock held by existing stockholders immediately prior to the completion of this offering will be “restricted securities” as such term is defined in Rule 144. These restricted securities were issued and sold by us in private transactions and are eligible for public sale only if registered under the Securities Act or if they qualify for an exemption from registration under the Securities Act, including the exemption provided by Rule 144, which is summarized below. As a result of the contractual 180-day lock-up period described below and the provisions of Rule 144, the restricted securities will be available for sale in the public markets as follows:
| Date Available for Sale |
Shares Eligible for Sale |
Description | ||||
| Date of Prospectus |
Shares sold in the offering and shares saleable under Rule 144 (subject to applicable holding periods) that are not subject to a lock-up | |||||
| 180 Days after Date of Prospectus |
Expiration of the Lock-up; shares saleable under Rule 144 (assuming no prior waivers or releases from lock-up prior to 180 days from the date of this prospectus) | |||||
Rule 144
In general, under Rule 144, as currently in effect, once we have been subject to the public company reporting requirements of the Exchange Act for at least 90 days, a person (or persons whose shares are required to be aggregated) who is not deemed to have been one of our “affiliates” for purposes of Rule 144 at any time during the three months preceding a sale, and who has beneficially owned restricted securities within the meaning of Rule 144 for at least six months, including the holding period of any prior owner other than one of our “affiliates,” is entitled to sell those shares in the public market (subject to the lock-up agreement referred to below, if applicable) without complying with the manner of sale, volume limitations or notice provisions of Rule 144, but subject to compliance with the public information requirements of Rule 144. If such a person has beneficially owned the shares proposed to be sold for at least one year, including the holding period of any prior owner other than “affiliates,” then such person is entitled to sell such shares in the public market without complying with any of the requirements of Rule 144 (subject to the lock-up agreement referred to below, if applicable). In general, under Rule 144, as currently in effect, once we have been subject to the public company reporting requirements of the Exchange Act for at least 90 days, our “affiliates,” as defined in Rule 144, who
142
Table of Contents
have beneficially owned the shares proposed to be sold for at least six months, including the holding period of any prior owner other than one of our “affiliates,” are entitled to sell in the public market, upon expiration of any applicable lock-up agreements and within any three-month period, a number of those shares of our common stock that does not exceed the greater of:
| • | 1% of the number of common shares then outstanding, which will equal approximately shares of common stock immediately after this offering (calculated on the basis of the assumptions described above and assuming no exercise of the underwriters’ option to purchase additional shares and no exercise of outstanding options or warrants); or |
| • | the average weekly trading volume of our common stock on during the four calendar weeks preceding the filing of a notice on Form 144 with respect to such sale. |
Such sales under Rule 144 by our “affiliates” or persons selling shares on behalf of our “affiliates” are also subject to certain manner of sale provisions, notice requirements and to the availability of current public information about us. Notwithstanding the availability of Rule 144, the holders of substantially all of our restricted securities have entered into lock-up agreements as referenced below and their restricted securities will become eligible for sale (subject to the above limitations under Rule 144) upon the expiration of the restrictions set forth in those agreements.
Rule 701
Rule 701 of the Securities Act, as currently in effect, permits any of our employees, officers, directors or consultants who purchased or receive shares from us pursuant to a written compensatory plan or contract to resell such shares in reliance upon Rule 144, but without compliance with certain restrictions. Subject to any applicable lock-up agreements, Rule 701 provides that affiliates may sell their Rule 701 shares under Rule 144 beginning 90 days after the date of this prospectus without complying with the holding period requirement of Rule 144 and that non-affiliates may sell such shares in reliance on Rule 144 beginning 90 days after the date of this prospectus without complying with the holding period, public information, volume limitation or notice requirements of Rule 144.
Equity Incentive Plans
In connection with this offering, our board of directors and stockholders intend to adopt the 2021 Plan. We also intend to file a registration statement on Form S-8 under the Securities Act to register the total of shares of our common stock that may be issued under our equity incentive plans. That registration statement will become effective upon filing, and any shares of our common stock covered by such registration statement will be eligible for sale in the public market beginning immediately after the effective date of such registration statement, subject to Rule 144 volume limitations applicable to affiliates, vesting restrictions and the lock-up agreements described below. See “Executive Compensation—Equity Compensation Plans” for a description of our equity incentive plans.
Registration Rights
Certain of our current stockholders will, after the expiration of the lock-up period, be entitled to certain rights with respect to the registration of the offer and sale of their shares under the Securities Act. For a description of these registration rights, please see “Certain Relationships and Related Party Transactions — Stockholders Agreement —Registration Rights.”
Lock-up Agreements
In connection with this offering, we, our executive officers, directors and holders of substantially all of our common stock have agreed not to sell any shares of our common stock for a period of 180 days from the date of this prospectus, subject to certain exceptions or any waiver or release from such lock-up agreement. See “Underwriting.”
143
Table of Contents
U.S. FEDERAL INCOME TAX CONSEQUENCES TO NON-U.S. HOLDERS
The following discussion is a summary of the U.S. federal income tax consequences to non-U.S. holders (as defined below) of the purchase, ownership and disposition of our common stock issued pursuant to this offering, but does not purport to be a complete analysis of all potential tax effects. The effects of other U.S. federal tax laws, such as estate and gift tax laws, and any applicable state, local or foreign tax laws are not discussed. This discussion is based on the Code, Treasury Regulations promulgated thereunder, judicial decisions and published rulings and administrative pronouncements of the IRS in effect as of the date of this offering. These authorities may change or be subject to differing interpretations. Any such change may each be applied retroactively in a manner that could adversely affect a non-U.S. holder of our common stock. We have not sought and will not seek any rulings from the IRS regarding the matters discussed below. There can be no assurance that the IRS or a court will not take a contrary position regarding the tax consequences of the purchase, ownership and disposition of our common stock.
This discussion is limited to non-U.S. holders that hold our common stock as a “capital asset” within the meaning of the Code (generally property held for investment). This discussion does not address all U.S. federal income tax consequences relevant to a non-U.S. holder’s particular circumstances, including the impact of the unearned income Medicare contribution tax. In addition, it does not address consequences relevant to non-U.S. holders subject to particular rules, including, without limitation:
| • | U.S. expatriates and certain former citizens or long-term residents of the United States; |
| • | persons subject to the alternative minimum tax; |
| • | persons holding our common stock as part of a hedge, straddle or other risk reduction strategy or as part of a conversion transaction or other integrated investment; |
| • | banks, insurance companies and other financial institutions; |
| • | real estate investment trusts or regulated investment companies; |
| • | brokers, dealers or traders in securities; |
| • | “controlled foreign corporations,” “passive foreign investment companies” and corporations that accumulate earnings to avoid U.S. federal income tax; |
| • | partnerships or other entities or arrangements treated as partnerships for U.S. federal income tax purposes; |
| • | tax-exempt organizations or governmental organizations; |
| • | persons deemed to sell our common stock under the constructive sale provisions of the Code; |
| • | persons who hold or receive our common stock pursuant to the exercise of any employee stock option or otherwise as compensation; and |
| • | tax-qualified retirement plans. |
If a partnership (or other entity or arrangement treated as a partnership for U.S. federal income tax purposes) holds our common stock, the tax treatment of a partner in the partnership will depend on the status of the partner, the activities of the partnership and certain determinations made at the partner level. Accordingly, partnerships holding our common stock and the partners in such partnerships should consult their own tax advisors regarding the U.S. federal income tax consequences to them.
THIS DISCUSSION IS FOR INFORMATION PURPOSES ONLY AND IS NOT INTENDED AS TAX ADVICE. INVESTORS SHOULD CONSULT THEIR OWN TAX ADVISORS WITH RESPECT TO THE APPLICATION OF THE U.S. FEDERAL INCOME TAX LAWS TO THEIR PARTICULAR SITUATIONS AS WELL AS ANY TAX CONSEQUENCES OF THE PURCHASE, OWNERSHIP AND DISPOSITION OF OUR COMMON STOCK ARISING UNDER THE U.S. FEDERAL ESTATE OR GIFT TAX LAWS OR UNDER THE LAWS OF ANY STATE, LOCAL OR NON-U.S. TAXING JURISDICTION OR UNDER ANY APPLICABLE INCOME TAX TREATY.
144
Table of Contents
Definition of a Non-U.S. Holder
For purposes of this discussion, a “non-U.S. holder” is any beneficial owner of our common stock that is neither a “U.S. person” nor a partnership (or other pass-through entity) for U.S. federal income tax purposes. A
U.S. person is any of the following:
| • | an individual who is a citizen or resident of the United States; |
| • | a corporation (or other entity treated as a corporation for U.S. federal income tax purposes) created or organized under the laws of the United States, any state thereof, or the District of Columbia; |
| • | an estate, the income of which is subject to U.S. federal income tax regardless of its source; or |
| • | a trust if (1) a court within the United States is able to exercise primary supervision over the administration of the trust and one or more U.S. persons have the authority to control all substantial decisions of the trust, or (2) it has made a valid election under applicable Treasury Regulations to continue to be treated as a U.S. person. |
Distributions
As described in the section captioned “Dividend Policy,” we do not anticipate paying dividends to holders of our common stock in the foreseeable future.
If we do, however, make distributions on our common stock, such distributions of cash or property on our common stock will constitute dividends for U.S. federal income tax purposes to the extent paid from our current or accumulated earnings and profits, as determined under U.S. federal income tax principles.
Dividends paid to a non-U.S. holder of our common stock that are not effectively connected with the non- U.S. holder’s conduct of a trade or business within the United States will be subject to U.S. federal withholding tax at a rate of 30% of the gross amount of the dividends (or such lower rate as may be specified by an applicable income tax treaty).
If a distribution exceeds our current and accumulated earnings and profits, the excess will be treated first as a return of capital to the extent of a non-U.S. holder’s adjusted tax basis in its common stock, but not below zero, and thereafter, as capital gain from the sale or exchange of such common stock subject to the tax treatments described below in the section relating to the sale or other taxable disposition of our common stock.
Non-U.S. holders will be entitled to a reduction in or an exemption from withholding on dividends as a result of either (a) qualifying for the benefits of an applicable income tax treaty or (b) the non-U.S. holder holding our common stock in connection with the conduct of a trade or business within the United States and dividends being paid in connection with that trade or business. To claim such a reduction in or exemption from withholding, the non-U.S. holder must provide the applicable withholding agent with a properly executed (a) IRS Form W-8BEN or W-8BEN-E claiming an exemption from or reduction of the withholding tax under the benefit of an applicable income tax treaty (and that no withholding is required pursuant to FATCA (described below)), or (b) IRS Form W-8ECI stating that the dividends are effectively connected with the conduct by the non-U.S. holder of a trade or business within the United States. These certifications must be provided to the applicable withholding agent prior to the payment of dividends and must be updated periodically. Non-U.S. holders that do not timely provide the applicable withholding agent with the required certification, but that qualify for a reduced rate under an applicable income tax treaty, may obtain a refund of any excess amounts withheld by timely filing an appropriate claim for refund with the IRS.
Subject to the discussion below regarding payments made to certain foreign accounts, if dividends paid to a non-U.S. holder are effectively connected with the non-U.S. holder’s conduct of a trade or business within the United States (and, if required by an applicable income tax treaty, the non-U.S. holder maintains a permanent
145
Table of Contents
establishment in the United States to which such dividends are attributable), then, although exempt from U.S. federal withholding tax (provided the non-U.S. holder provides appropriate certification, as described above), the non-U.S. holder will be subject to U.S. federal income tax on such dividends on a net income basis at the regular graduated U.S. federal income tax rates. In addition, a non-U.S. holder that is or is treated as a corporation for U.S. federal income tax purposes may be subject to an additional branch profits tax at a rate of 30% (or such lower rate specified by an applicable income tax treaty) on its effectively connected earnings and profits for the taxable year that are attributable to such dividends, as adjusted for certain items. Non-U.S. holders should consult their own tax advisors regarding their entitlement to benefits under any applicable income tax treaty.
Sale or Other Taxable Disposition
Subject to the discussion below regarding backup withholding and payments made to certain foreign accounts, a non-U.S. holder generally will not be subject to U.S. federal income tax or withholding on any gain realized upon the sale or other taxable disposition of our common stock unless:
| • | the gain is effectively connected with the non-U.S. holder’s conduct of a trade or business within the United States (and, if required by an applicable income tax treaty, the non-U.S. holder maintains a permanent establishment in the United States to which such gain is attributable); |
| • | the non-U.S. holder is a nonresident alien individual present in the United States for 183 days or more during the taxable year of the disposition and certain other requirements are met; or |
| • | our common stock constitutes a U.S. real property interest within the meaning of the Foreign Investment in Real Property Tax Act by reason of our status as a U.S. real property holding corporation (“USRPHC”) for U.S. federal income tax purposes. |
Gain described in the first bullet point above will generally be subject to U.S. federal income tax on a net income basis in the same manner in which citizens or residents of the United States would be subject to U.S. federal income tax rates. A non-U.S. holder that is a foreign corporation also may be subject to an additional branch profits tax at a rate of 30% (or such lower rate specified by an applicable income tax treaty) on a portion of its effectively connected earnings and profits for the taxable year, as adjusted for certain items.
A non-U.S. holder described in the second bullet point above will be subject to U.S. federal income tax at a rate of 30% (or such lower rate as may be specified by an applicable income tax treaty) on any gain derived from the sale or other taxable disposition, which may be offset by certain U.S. source capital losses of the non-U.S. holder (even though the individual is not considered a resident of the United States) provided the non-U.S. holder timely files U.S. federal income tax returns with respect to such losses.
With respect to the third bullet point above, we are not, and do not anticipate that we will become, a USRPHC, however, there can be no assurance that we will not become a USRPHC in the future.
Non-U.S. holders should consult their own tax advisors regarding potentially applicable income tax treaties that may provide for different rules.
Additional Withholding Tax on Payments Made to Foreign Accounts
Withholding taxes may be imposed under the provisions of the law generally known as the Foreign Account Tax Compliance Act (“FATCA”), on certain types of payments made to non-U.S. financial institutions and certain other non-U.S. entities. Specifically, a 30% withholding tax may be imposed on dividends on, or gross proceeds from the sale or other disposition of, our common stock paid to a “foreign financial institution” or a “non-financial foreign entity” (each as defined in the Code), unless (1) the foreign financial institution undertakes certain diligence and reporting obligations, (2) the non-financial foreign entity either certifies it does not have any “substantial U.S. owners” (as defined in the Code) or furnishes identifying information regarding each
146
Table of Contents
substantial U.S. owner or (3) the foreign financial institution or non-financial foreign entity otherwise qualifies for an exemption from these rules. If the payee is a foreign financial institution and is subject to the diligence and reporting requirements in (1) above, it must enter into an agreement with the U.S. Department of the Treasury requiring, among other things, that it undertake to identify accounts held by certain “specified U.S. persons” or “U.S.-owned foreign entities” (each as defined in the Code), annually report certain information about such accounts and withhold 30% on payments to non-compliant foreign financial institutions and certain other account holders. An intergovernmental agreement between the United States and an applicable foreign country, or future Treasury Regulations or other guidance, may modify these requirements. Accordingly, the entity through which our common stock is held will affect the determination of whether such withholding is required.
Similarly, dividends in respect of our common stock held by an investor that is a non-financial non-U.S. entity that does not qualify under certain exceptions generally will be subject to withholding at a rate of 30%, unless such entity either (i) certifies to us or our paying agent that such entity does not have any “substantial United States owners” or (ii) provides certain information regarding the entity’s “substantial United States owners,” which we will in turn provide to the U.S. Department of the Treasury. Similar rules were scheduled to apply, on or after January 1, 2019, to gross proceeds from the sale or other disposition of our common stock. However, under proposed regulations upon which taxpayers are entitled to rely, such rules have been indefinitely postponed.
Prospective investors should consult their own tax advisors regarding the potential application of withholding under FATCA to their investment in our common stock.
147
Table of Contents
We are offering the shares of our common stock described in this prospectus through the underwriters named below. Citigroup Global Markets Inc., Goldman Sachs & Co. LLC and BofA Securities, Inc. are acting as representatives of the underwriters. We have entered into an underwriting agreement with the representatives. Subject to the terms and conditions of the underwriting agreement, each of the underwriters has severally agreed to purchase, and we have agreed to sell to the underwriters, the number of shares of common stock listed next to its name in the following table.
| Underwriter |
Number of Shares | |||
| Citigroup Global Markets Inc. |
||||
| Goldman Sachs & Co. LLC |
||||
| BofA Securities, Inc. |
||||
| Robert W. Baird & Co. Incorporated |
||||
| Evercore Group L.L.C. |
||||
| Jefferies LLC |
||||
| RBC Capital Markets, LLC |
||||
| Stephens Inc. |
||||
| Truist Securities, Inc. |
||||
| UBS Securities LLC |
||||
|
|
|
|||
| Total |
||||
|
|
|
|||
The underwriting agreement provides that the obligations of the underwriters to purchase the shares included in this offering are subject to approval of legal matters by counsel and to other conditions. The underwriters are obligated to purchase all the shares (other than those covered by the underwriters’ option to purchase additional shares described below) if they purchase any of the shares.
Shares sold by the underwriters to the public will initially be offered at the initial public offering price set forth on the cover of this prospectus. Any shares sold by the underwriters to securities dealers may be sold at a discount from the initial public offering price not to exceed $ per share. If all the shares are not sold at the initial offering price, the underwriters may change the offering price and the other selling terms. The representatives has advised us that the underwriters do not intend to make sales to discretionary accounts.
If the underwriters sell more shares than the total number set forth in the table above, we have granted to the underwriters an option, exercisable for 30 days from the date of this prospectus, to purchase up to additional shares at the public offering price less the underwriting discount. The underwriters may exercise the option solely for the purpose of covering over-allotments, if any, in connection with this offering. To the extent the option is exercised, each underwriter must purchase a number of additional shares approximately proportionate to that underwriter’s initial purchase commitment. Any shares issued or sold under the option will be issued and sold on the same terms and conditions as the other shares that are the subject of this offering.
We, our officers and directors, certain of our other stockholders have agreed that, for a period of 180 days from the date of this prospectus, we and they will not, without the prior written consent of a majority of the representatives, dispose of or hedge any shares or any securities convertible into or exchangeable for our common stock. A majority of the representatives may release any of the securities subject to these lock-up agreements at any time, which, in the case of officers and directors, shall be with notice.
Prior to this offering, there has been no public market for our shares. Consequently, the initial public offering price for the shares was determined by negotiations between us, and the representatives. Among the factors considered in determining the initial public offering price were our results of operations, our current financial condition, our future prospects, our markets, the economic conditions in and future prospects for the industry in which we compete, our management, and currently prevailing general conditions in the equity
148
Table of Contents
securities markets, including current market valuations of publicly traded companies considered comparable to our company. We cannot assure you, however, that the price at which the shares will sell in the public market after this offering will not be lower than the initial public offering price or that an active trading market in our shares will develop and continue after this offering.
We have applied to have our common shares listed on the Nasdaq Global Select Market under the symbol “ILG.”
The following table shows the underwriting discounts and commissions that we are to pay to the underwriters in connection with this offering. These amounts are shown assuming both no exercise and full exercise of the underwriters’ option to purchase additional shares.
| Paid by us | ||||||||
| No Exercise | Full Exercise | |||||||
| Per share |
$ | $ | ||||||
|
|
|
|
|
|||||
| Total |
$ | $ | ||||||
|
|
|
|
|
|||||
We estimate that the total expenses of the offering payable by us, not including the underwriting discounts and commissions, will be approximately $ million which includes an amount not to exceed $ that we have agreed to reimburse the underwriters for certain expenses (including fees of counsel for FINRA-related matters) incurred by them in connection with this offering.
In connection with the offering, the underwriters may purchase and sell shares in the open market. Purchases and sales in the open market may include short sales, purchases to cover short positions, which may include purchases pursuant to the underwriters’ option to purchase additional shares, and stabilizing purchases.
| • | Short sales involve secondary market sales by the underwriters of a greater number of shares than they are required to purchase in the offering. |
| • | “Covered” short sales are sales of shares in an amount up to the number of shares represented by the underwriters’ underwriters’ option to purchase additional shares. |
| • | “Naked” short sales are sales of shares in an amount in excess of the number of shares represented by the underwriters’ option to purchase additional shares. |
| • | Covering transactions involve purchases of shares either pursuant to the underwriters’ option to purchase additional shares or in the open market in order to cover short positions. |
| • | To close a naked short position, the underwriters must purchase shares in the open market. A naked short position is more likely to be created if the underwriters are concerned that there may be downward pressure on the price of the shares in the open market after pricing that could adversely affect investors who purchase in the offering. |
| • | To close a covered short position, the underwriters must purchase shares in the open market or must exercise the option to purchase additional shares. In determining the source of shares to close the covered short position, the underwriters will consider, among other things, the price of shares available for purchase in the open market as compared to the price at which they may purchase shares through the underwriters’ option to purchase additional shares. |
| • | Stabilizing transactions involve bids to purchase shares so long as the stabilizing bids do not exceed a specified maximum. |
Purchases to cover short positions and stabilizing purchases, as well as other purchases by the underwriters for their own accounts, may have the effect of preventing or retarding a decline in the market price of the shares. They may also cause the price of the shares to be higher than the price that would otherwise exist in the open
149
Table of Contents
market in the absence of these transactions. The underwriters may conduct these transactions on the Nasdaq Global Select Market, in the over-the-counter market or otherwise. If the underwriters commence any of these transactions, they may discontinue them at any time.
Conflicts of Interest
The underwriters are full service financial institutions engaged in various activities, which may include securities trading, commercial and investment banking, financial advisory, investment management, principal investment, hedging, financing and brokerage activities. The underwriters and their affiliates may, from time to time, engage in transactions with and perform services for us in the ordinary course of their business for which they may receive customary fees and reimbursement of expenses. In the ordinary course of their various business activities, the underwriters and their respective affiliates may make or hold a broad array of investments and actively trade debt and equity securities (or related derivative securities) and financial instruments (which may include bank loans and/or credit default swaps) for their own account and for the accounts of their customers and may at any time hold long and short positions in such securities and instruments. Such investments and securities activities may involve securities and/or instruments of ours or our affiliates. The underwriters and their affiliates may also make investment recommendations and/or publish or express independent research views in respect of such securities or financial instruments and may hold, or recommend to clients that they acquire, long and/or short positions in such securities and instruments.
We have agreed to indemnify the underwriters against certain liabilities, including liabilities under the Securities Act, or to contribute to payments the underwriters may be required to make because of any of those liabilities.
Notice to Prospective Investors in the European Economic Area
In relation to each member state of the European Economic Area that has implemented the Prospectus Directive (each, a relevant member state), with effect from and including the date on which the Prospectus Directive is implemented in that relevant member state (the relevant implementation date), an offer of shares described in this prospectus may not be made to the public in that relevant member state other than:
| • | to any legal entity which is a qualified investor as defined in the Prospectus Directive; |
| • | to fewer than 100 or, if the relevant member state has implemented the relevant provision of the 2010 PD Amending Directive, 150 natural or legal persons (other than qualified investors as defined in the Prospectus Directive), as permitted under the Prospectus Directive, subject to obtaining the prior consent of the relevant Dealer or Dealers nominated by us for any such offer; or |
| • | in any other circumstances falling within Article 3(2) of the Prospectus Directive, |
provided that no such offer of shares shall require us or any underwriter to publish a prospectus pursuant to Article 3 of the Prospectus Directive.
For purposes of this provision, the expression an “offer of securities to the public” in any relevant member state means the communication in any form and by any means of sufficient information on the terms of the offer and the shares to be offered so as to enable an investor to decide to purchase or subscribe for the shares, as the expression may be varied in that member state by any measure implementing the Prospectus Directive in that member state, and the expression “Prospectus Directive” means Directive 2003/71/EC (and amendments thereto, including the 2010 PD Amending Directive, to the extent implemented in the relevant member state) and includes any relevant implementing measure in the relevant member state. The expression 2010 PD Amending Directive means Directive 2010/73/EU.
The sellers of the shares have not authorized and do not authorize the making of any offer of shares through any financial intermediary on their behalf, other than offers made by the underwriters with a view to the final
150
Table of Contents
placement of the shares as contemplated in this prospectus. Accordingly, no purchaser of the shares, other than the underwriters, is authorized to make any further offer of the shares on behalf of the sellers or the underwriters.
Notice to Prospective Investors in the United Kingdom
This prospectus is only being distributed to, and is only directed at, persons in the United Kingdom that are qualified investors within the meaning of Article 2(1)(e) of the Prospectus Directive that are also (i) investment professionals falling within Article 19(5) of the Financial Services and Markets Act 2000 (Financial Promotion) Order 2005 (the “Order”) or (ii) high net worth entities, and other persons to whom it may lawfully be communicated, falling within Article 49(2)(a) to (d) of the Order (each such person being referred to as a “relevant person”). This prospectus and its contents are confidential and should not be distributed, published or reproduced (in whole or in part) or disclosed by recipients to any other persons in the United Kingdom. Any person in the United Kingdom that is not a relevant person should not act or rely on this document or any of its contents.
Notice to Prospective Investors in France
Neither this prospectus nor any other offering material relating to the shares described in this prospectus has been submitted to the clearance procedures of the Autorité des Marchés Financiers or of the competent authority of another member state of the European Economic Area and notified to the Autorité des Marchés Financiers. The shares have not been offered or sold and will not be offered or sold, directly or indirectly, to the public in France. Neither this prospectus nor any other offering material relating to the shares has been or will be:
| • | released, issued, distributed or caused to be released, issued or distributed to the public in France; or |
| • | used in connection with any offer for subscription or sale of the shares to the public in France. |
Such offers, sales and distributions will be made in France only:
| • | to qualified investors (investisseurs qualifiés) and/or to a restricted circle of investors (cercle restreint d’investisseurs), in each case investing for their own account, all as defined in, and in accordance with articles L.411-2, D.411-1, D.411-2, D.734-1, D.744-1, D.754-1 and D.764-1 of the French Code monétaire et financier; |
| • | to investment services providers authorized to engage in portfolio management on behalf of third parties; or |
| • | in a transaction that, in accordance with article L.411-2-II-1° -or-2° -or 3° of the French Code monétaire et financier and article 211-2 of the General Regulations (Règlement Général) of the Autorité des Marchés Financiers, does not constitute a public offer (appel public à l’épargne). |
The shares may be resold directly or indirectly, only in compliance with articles L.411-1, L.411-2, L.412-1 and L.621-8 through L.621-8-3 of the French Code monétaire et financier.
Notice to Prospective Investors in Hong Kong
The shares may not be offered or sold in Hong Kong by means of any document other than (i) in circumstances which do not constitute an offer to the public within the meaning of the Companies Ordinance (Cap. 32, Laws of Hong Kong), or (ii) to “professional investors” within the meaning of the Securities and Futures Ordinance (Cap. 571, Laws of Hong Kong) and any rules made thereunder, or (iii) in other circumstances which do not result in the document being a “prospectus” within the meaning of the Companies Ordinance (Cap. 32, Laws of Hong Kong) and no advertisement, invitation or document relating to the shares may be issued or may be in the possession of any person for the purpose of issue (in each case whether in Hong Kong or elsewhere), which is directed at, or the contents of which are likely to be accessed or read by, the public in Hong Kong (except if permitted to do so under the laws of Hong Kong) other than with respect to shares which are or
151
Table of Contents
are intended to be disposed of only to persons outside Hong Kong or only to “professional investors” within the meaning of the Securities and Futures Ordinance (Cap. 571, Laws of Hong Kong) and any rules made thereunder.
Notice to Prospective Investors in Japan
The shares offered in this prospectus have not been and will not be registered under the Financial Instruments and Exchange Law of Japan. The shares have not been offered or sold and will not be offered or sold, directly or indirectly, in Japan or to or for the account of any resident of Japan (including any corporation or other entity organized under the laws of Japan), except (i) pursuant to an exemption from the registration requirements of the Financial Instruments and Exchange Law and (ii) in compliance with any other applicable requirements of Japanese law.
Notice to Prospective Investors in Singapore
This prospectus has not been registered as a prospectus with the Monetary Authority of Singapore. Accordingly, this prospectus and any other document or material in connection with the offer or sale, or invitation for subscription or purchase, of the shares may not be circulated or distributed, nor may the shares be offered or sold, or be made the subject of an invitation for subscription or purchase, whether directly or indirectly, to persons in Singapore other than (i) to an institutional investor under Section 274 of the Securities and Futures Act, Chapter 289 of Singapore (the “SFA”), (ii) to a relevant person pursuant to Section 275(1), or any person pursuant to Section 275(1A), and in accordance with the conditions specified in Section 275 of the SFA or (iii) otherwise pursuant to, and in accordance with the conditions of, any other applicable provision of the SFA, in each case subject to compliance with conditions set forth in the SFA.
Where the shares are subscribed or purchased under Section 275 of the SFA by a relevant person which is:
| • | a corporation (which is not an accredited investor (as defined in Section 4A of the SFA)) the sole business of which is to hold investments and the entire share capital of which is owned by one or more individuals, each of whom is an accredited investor; or |
| • | a trust (where the trustee is not an accredited investor) whose sole purpose is to hold investments and each beneficiary of the trust is an individual who is an accredited investor, |
shares, debentures and units of shares and debentures of that corporation or the beneficiaries’ rights and interest (howsoever described) in that trust shall not be transferred within six months after that corporation or that trust has acquired the shares pursuant to an offer made under Section 275 of the SFA except:
| • | to an institutional investor (for corporations, under Section 274 of the SFA) or to a relevant person defined in Section 275(2) of the SFA, or to any person pursuant to an offer that is made on terms that such shares, debentures and units of shares and debentures of that corporation or such rights and interest in that trust are acquired at a consideration of not less than S$200,000 (or its equivalent in a foreign currency) for each transaction, whether such amount is to be paid for in cash or by exchange of securities or other assets, and further for corporations, in accordance with the conditions specified in Section 275 of the SFA; |
| • | where no consideration is or will be given for the transfer; or |
| • | where the transfer is by operation of law. |
Notice to Prospective Investors in Canada
The shares may be sold only to purchasers purchasing, or deemed to be purchasing, as principal that are accredited investors (as defined in National Instrument 45-106 Prospectus Exemptions or subsection 73.3(1) of the Securities Act (Ontario)), and are permitted clients (as defined in National Instrument 31-103 Registration Requirements, Exemptions and Ongoing Registrant Obligations). Any resale of the shares must be made in accordance with an exemption from, or in a transaction not subject to, the prospectus requirements of applicable securities laws.
152
Table of Contents
Securities legislation in certain provinces or territories of Canada may provide a purchaser with remedies for rescission or damages if this prospectus (including any amendment hereto) contains a misrepresentation, provided that the remedies for rescission or damages are exercised by the purchaser within the time limit prescribed by the securities legislation of the purchaser’s province or territory. The purchaser should refer to any applicable provisions of the securities legislation of the purchaser’s province or territory for particulars of these rights or consult with a legal advisor.
Pursuant to section 3A.3 of National Instrument 33-105 Underwriting Conflicts (NI 33-105), the underwriters are not required to comply with the disclosure requirements of NI 33-105 regarding underwriter conflicts of interest in connection with this offering.
Notice to Prospective Investors in Switzerland
The shares may not be publicly offered in Switzerland and will not be listed on the SIX Swiss Exchange, or SIX, or on any other stock exchange or regulated trading facility in Switzerland. This prospectus has been prepared without regard to the disclosure standards for issuance prospectuses under art. 652a or art. 1156 of the Swiss Code of Obligations or the disclosure standards for listing prospectuses under art. 27 ff. of the SIX Listing Rules or the listing rules of any other stock exchange or regulated trading facility in Switzerland. Neither this prospectus nor any other offering or marketing material relating to the shares or the offering may be publicly distributed or otherwise made publicly available in Switzerland.
Neither this prospectus nor any other offering or marketing material relating to the offering, the Company or the shares have been or will be filed with or approved by any Swiss regulatory authority. In particular, this prospectus will not be filed with, and the offer of shares will not be supervised by, the Swiss Financial Market Supervisory Authority, and the offer of shares has not been and will not be authorized under the Swiss Federal Act on Collective Investment Schemes, or CISA. The investor protection afforded to acquirers of interests in collective investment schemes under the CISA does not extend to acquirers of shares.
Notice to Prospective Investors in Australia
No placement document, prospectus, product disclosure statement or other disclosure document has been lodged with the Australian Securities and Investments Commission, or the ASIC, in relation to this offering. This prospectus does not constitute a prospectus, product disclosure statement or other disclosure document under the Corporations Act 2001, or the Corporations Act, and does not purport to include the information required for a prospectus, product disclosure statement or other disclosure document under the Corporations Act.
Any offer in Australia of the shares may only be made to persons, or the Exempt Investors, who are “sophisticated investors” (within the meaning of section 708(8) of the Corporations Act), “professional investors” (within the meaning of section 708(11) of the Corporations Act) or otherwise pursuant to one or more exemptions contained in section 708 of the Corporations Act so that it is lawful to offer the shares without disclosure to investors under Chapter 6D of the Corporations Act.
The shares applied for by Exempt Investors in Australia must not be offered for sale in Australia in the period of 12 months after the date of allotment under this offering, except in circumstances where disclosure to investors under Chapter 6D of the Corporations Act would not be required pursuant to an exemption under section 708 of the Corporations Act or otherwise or where the offer is pursuant to a disclosure document which complies with Chapter 6D of the Corporations Act. Any person acquiring shares must observe such Australian on-sale restrictions.
This prospectus contains general information only and does not take account of the investment objectives, financial situation or particular needs of any particular person. It does not contain any securities recommendations or financial product advice. Before making an investment decision, investors need to consider whether the information in this prospectus is appropriate to their needs, objectives and circumstances, and, if necessary, seek expert advice on those matters.
153
Table of Contents
Notice to Prospective Investors in the Dubai International Financial Centre
This prospectus relates to an Exempt Offer in accordance with the Offered Securities Rules of the Dubai Financial Services Authority, or the DFSA. This prospectus is intended for distribution only to persons of a type specified in the Offered Securities Rules of the DFSA. It must not be delivered to, or relied on by, any other person. The DFSA has no responsibility for reviewing or verifying any documents in connection with Exempt Offers. The DFSA has not approved this prospectus nor taken steps to verify the information set forth herein and has no responsibility for the prospectus. The shares to which this prospectus relates may be illiquid and/or subject to restrictions on their resale. Prospective purchasers of the shares offered should conduct their own due diligence on the shares. If you do not understand the contents of this prospectus you should consult an authorized financial advisor.
154
Table of Contents
Certain legal matters, including the validity of the shares of common stock offered herein, will be passed upon by Holland & Knight LLP, New York, New York, and certain legal matters will be passed upon for the underwriters by Skadden, Arps, Slate, Meagher & Flom LLP, New York, New York.
Ernst & Young LLP, independent registered public accounting firm, has audited our consolidated financial statements at December 31, 2019 and 2018, and for each of the three years in the period ended December 31, 2019, as set forth in their report. We’ve included our financial statements in the prospectus and elsewhere in the registration statement in reliance on Ernst & Young LLP’s report, given on their authority as experts in accounting and auditing.
WHERE YOU CAN FIND MORE INFORMATION
We have filed with the SEC a registration statement on Form S-1 under the Securities Act with respect to the shares of common stock offered by this prospectus. This prospectus, which constitutes a part of the registration statement, does not contain all of the information set forth in the registration statement, some of which is contained in exhibits to the registration statement as permitted by the rules and regulations of the SEC. For further information with respect to us and our common stock, we refer you to the registration statement, including the exhibits filed as a part of the registration statement. Statements contained in this prospectus concerning the contents of any contract or any other document is not necessarily complete. If a contract or a document has been filed as an exhibit to the registration statement, please see the copy of the contract or document that has been filed. Each statement in this prospectus relating to a contract or a document filed as an exhibit is qualified by the filed exhibit. The SEC also maintains an internet website that contains reports, proxy statements and other information about issuers, like us, that file electronically with the SEC. The address of that website is www.sec.gov.
Upon the completion of this offering, we will be subject to the information and periodic reporting requirements of the Exchange Act and, in accordance therewith, we will file proxy statements, periodic information and other information with the SEC. All documents filed with the SEC are available on the SEC’s website referred to above. We maintain a website at www.interiorlogicgroup.com. You may access our reports, proxy statements and other information free of charge at this website as soon as reasonably practicable after such material is electronically filed with, or furnished to, the SEC. The information contained in, or that can be accessed through, our website is not incorporated by reference into this prospectus or registration statement of which this prospectus forms a part, and you should not rely on any such information in making your decision whether to purchase our securities.
155
Table of Contents
INTERIOR LOGIC GROUP HOLDINGS, LLC
UNAUDITED CONDENSED CONSOLIDATED FINANCIAL STATEMENTS
TABLE OF CONTENTS
| Unaudited Condensed Consolidated Financial Statements: |
||||
| Unaudited Condensed Consolidated Balance Sheets as of September 30, 2020 and December 31, 2019 |
F-2 | |||
| F-3 | ||||
| F-4 | ||||
| F-5 | ||||
| Notes to Unaudited Condensed Consolidated Financial Statements |
F-6 | |||
CONSOLIDATED FINANCIAL STATEMENTS
| F-27 | ||||
| Consolidated Financial Statements: |
||||
| Consolidated Balance Sheets as of December 31, 2019 and 2018 |
F-28 | |||
| F-29 | ||||
| Consolidated Statements of Members’ Equity for the years ended December 31, 2019, 2018 and 2017 |
F-30 | |||
| Consolidated Statements of Cash Flows for the years ended December 31, 2019, 2018 and 2017 |
F-31 | |||
| F-32 | ||||
F-1
Table of Contents
INTERIOR LOGIC GROUP HOLDINGS, LLC
UNAUDITED CONDENSED CONSOLIDATED BALANCE SHEETS
(In thousands, except unit data)
| September 30, 2020 |
December 31, 2019 |
|||||||
| Assets |
||||||||
| Current assets: |
||||||||
| Cash |
$ | 82,349 | $ | 5,742 | ||||
| Accounts receivable, net of allowance for doubtful accounts of $3.1 million and $2.8 million as of September 30, 2020 and December 31, 2019, respectively |
150,858 | 174,405 | ||||||
| Other receivables |
15,276 | 14,111 | ||||||
| Inventories |
49,558 | 46,632 | ||||||
| Prepaid expenses |
19,982 | 14,631 | ||||||
| Other current assets |
31,343 | 44,937 | ||||||
|
|
|
|
|
|||||
| Total current assets |
349,366 | 300,458 | ||||||
| Property, plant and equipment, net |
49,385 | 53,688 | ||||||
| Lease right-of-use assets |
60,032 | 64,234 | ||||||
| Deposits and other assets |
10,775 | 13,341 | ||||||
| Intangible assets, net |
263,592 | 300,744 | ||||||
| Goodwill |
266,847 | 253,977 | ||||||
|
|
|
|
|
|||||
| Total assets |
$ | 999,997 | $ | 986,442 | ||||
|
|
|
|
|
|||||
| Liabilities and members’ equity |
||||||||
| Current liabilities: |
||||||||
| Accounts payable and accrued expenses |
$ | 181,560 | $ | 153,550 | ||||
| Current maturities of lease obligations |
20,534 | 19,391 | ||||||
| Current maturities of long-term debt |
2,528 | 2,433 | ||||||
| Other current liabilities |
21,012 | 26,483 | ||||||
|
|
|
|
|
|||||
| Total current liabilities |
225,634 | 201,857 | ||||||
| Long-term debt, net of current portion |
380,946 | 382,249 | ||||||
| Deferred tax liabilities, net |
37,815 | 30,476 | ||||||
| Long-term lease obligations |
44,285 | 49,262 | ||||||
| Other long-term liabilities |
20,605 | 18,362 | ||||||
|
|
|
|
|
|||||
| Total liabilities |
709,285 | 682,206 | ||||||
|
|
|
|
|
|||||
| Commitments and contingencies (Note 9) |
||||||||
| Members’ equity |
||||||||
| Class A voting common units, no par value, unlimited units authorized, 1,000,000 issued and outstanding at September 30, 2020 and December 31, 2019 |
— | — | ||||||
| Class B limited voting common units, no par value, 50,000 authorized, none issued and outstanding at September 30, 2020 and December 31, 2019 |
— | — | ||||||
| Additional paid-in capital |
314,994 | 329,757 | ||||||
| Accumulated deficit |
(18,005 | ) | (25,952 | ) | ||||
| Accumulated other comprehensive (loss) income |
(6,277 | ) | 431 | |||||
|
|
|
|
|
|||||
| Total members’ equity |
290,712 | 304,236 | ||||||
|
|
|
|
|
|||||
| Total liabilities and members’ equity |
$ | 999,997 | $ | 986,442 | ||||
|
|
|
|
|
|||||
See accompanying notes to unaudited condensed consolidated financial statements.
F-2
Table of Contents
INTERIOR LOGIC GROUP HOLDINGS, LLC
UNAUDITED CONDENSED CONSOLIDATED STATEMENTS OF COMPREHENSIVE INCOME (LOSS)
(In thousands, except unit and per unit data)
| Nine Months Ended September 30, | ||||||||
| 2020 | 2019 | |||||||
| Revenues |
$ | 1,231,855 | $ | 1,314,021 | ||||
| Cost of revenues |
941,552 | 1,026,120 | ||||||
|
|
|
|
|
|||||
| 290,303 | 287,901 | |||||||
| Selling, general and administrative |
219,128 | 238,798 | ||||||
| Amortization of intangible assets |
42,636 | 47,486 | ||||||
| Intangible asset impairment |
816 | — | ||||||
|
|
|
|
|
|||||
| Total operating expenses |
262,580 | 286,284 | ||||||
|
|
|
|
|
|||||
| Income from operations |
27,723 | 1,617 | ||||||
| Other income and (expenses): |
||||||||
| Interest expense |
(18,712 | ) | (22,321 | ) | ||||
| Other income, net |
1,488 | 9 | ||||||
|
|
|
|
|
|||||
| Income (loss) before income taxes |
10,499 | (20,695 | ) | |||||
| Income tax (expense) benefit |
(2,552 | ) | 3,127 | |||||
|
|
|
|
|
|||||
| Net income (loss) |
7,947 | (17,568 | ) | |||||
| Other comprehensive loss: |
||||||||
| Unrealized loss on derivative instrument, net |
(6,708 | ) | (108 | ) | ||||
|
|
|
|
|
|||||
| Comprehensive income (loss) |
$ | 1,239 | $ | (17,676 | ) | |||
|
|
|
|
|
|||||
| Earnings (loss) per unit |
||||||||
| Basic and diluted |
$ | 7.95 | $ | (17.57 | ) | |||
|
|
|
|
|
|||||
| Weighted average units outstanding |
||||||||
| Basic and diluted |
1,000,000 | 1,000,000 | ||||||
See accompanying notes to unaudited condensed consolidated financial statements.
F-3
Table of Contents
INTERIOR LOGIC GROUP HOLDINGS, LLC
UNAUDITED CONDENSED CONSOLIDATED STATEMENTS OF MEMBERS’ EQUITY
(In thousands, except unit data)
| Class A Voting Common Units |
Class B Limited Voting Common Units |
Additional Paid-in Capital |
Accumulated Deficit |
Accumulated Other Comprehensive (Loss) Income |
Total Members’ Equity |
|||||||||||||||||||
| Balance at December 31, 2018 |
1,000,000 | — | $ | 328,247 | $ | (10,017 | ) | $ | — | $ | 318,230 | |||||||||||||
| Contribution from member unitholders |
— | — | 4 | — | — | 4 | ||||||||||||||||||
| Share-based compensation expense |
— | — | 985 | — | — | 985 | ||||||||||||||||||
| Cumulative effect of accounting policy change, net of tax |
— | — | — | (26 | ) | — | (26 | ) | ||||||||||||||||
| Unrealized loss on derivative instrument, net |
— | — | — | — | (108 | ) | (108 | ) | ||||||||||||||||
| Net loss |
— | — | — | (17,568 | ) | — | (17,568 | ) | ||||||||||||||||
|
|
|
|
|
|
|
|
|
|
|
|
|
|||||||||||||
| Balance at September 30, 2019 |
1,000,000 | — | $ | 329,236 | $ | (27,611 | ) | $ | (108 | ) | $ | 301,517 | ||||||||||||
|
|
|
|
|
|
|
|
|
|
|
|
|
|||||||||||||
| Class A Voting Common Units |
Class B Limited Voting Common Units |
Additional Paid-in Capital |
Accumulated Deficit |
Accumulated Other Comprehensive Income (Loss) |
Total Members’ Equity |
|||||||||||||||||||
| Balance at December 31, 2019 |
1,000,000 | — | $ | 329,757 | $ | (25,952 | ) | $ | 431 | $ | 304,236 | |||||||||||||
| Distribution to member unitholders |
— | — | (15,000 | ) | — | — | (15,000 | ) | ||||||||||||||||
| Share-based compensation expense |
— | — | 237 | — | — | 237 | ||||||||||||||||||
| Unrealized loss on derivative instrument, net |
— | — | — | — | (6,708 | ) | (6,708 | ) | ||||||||||||||||
| Net income |
— | — | — | 7,947 | — | 7,947 | ||||||||||||||||||
|
|
|
|
|
|
|
|
|
|
|
|
|
|||||||||||||
| Balance at September 30, 2020 |
1,000,000 | — | $ | 314,994 | $ | (18,005 | ) | $ | (6,277 | ) | $ | 290,712 | ||||||||||||
|
|
|
|
|
|
|
|
|
|
|
|
|
|||||||||||||
See accompanying notes to unaudited condensed consolidated financial statements.
F-4
Table of Contents
INTERIOR LOGIC GROUP HOLDINGS, LLC
UNAUDITED CONDENSED CONSOLIDATED STATEMENTS OF CASH FLOWS
(In thousands)
| Nine Months Ended September 30, | ||||||||
| 2020 | 2019 | |||||||
| Operating activities |
||||||||
| Net income (loss) |
$ | 7,947 | $ | (17,568 | ) | |||
| Adjustment to reconcile net income (loss) to net cash provided by operating activities: |
||||||||
| Depreciation |
11,111 | 11,444 | ||||||
| Intangible assets amortization |
42,636 | 47,486 | ||||||
| Amortization of operating lease right-of-use assets |
17,740 | 18,419 | ||||||
| Impairment of intangible assets |
816 | — | ||||||
| Amortization of debt issuance costs |
1,380 | 1,380 | ||||||
| Amortization of term loan discount |
214 | 214 | ||||||
| Share-based compensation expense |
237 | 985 | ||||||
| Provision for doubtful accounts |
1,740 | 1,405 | ||||||
| Gain on remeasurement of noncontrolling equity interest |
(1,429 | ) | — | |||||
| Deferred income tax expense |
7,339 | (9,310 | ) | |||||
| Loss on sale of equipment |
243 | 13 | ||||||
| Changes in operating assets and liabilities, excluding effects of business acquired: |
||||||||
| Accounts receivable and other receivables |
20,500 | (10,405 | ) | |||||
| Inventories |
(3,261 | ) | (8,304 | ) | ||||
| Prepaid expenses and other assets |
9,057 | (18,600 | ) | |||||
| Accounts payable, accrued expenses and outstanding checks in excess of cash |
23,204 | 21,031 | ||||||
| Lease liabilities |
(17,240 | ) | (14,701 | ) | ||||
| Customer deposits |
(5,470 | ) | 6,700 | |||||
|
|
|
|
|
|||||
| Net cash provided by operating activities |
116,764 | 30,189 | ||||||
| Investing activities |
||||||||
| Acquisition of businesses, net of cash acquired |
(14,761 | ) | (12,325 | ) | ||||
| Purchases of property and equipment and capitalized software costs |
(7,425 | ) | (9,144 | ) | ||||
| Proceeds from sale of property and equipment |
339 | 166 | ||||||
|
|
|
|
|
|||||
| Net cash used in investing activities |
(21,847 | ) | (21,303 | ) | ||||
| Financing activities |
||||||||
| Borrowings on line of credit |
109,929 | 156,916 | ||||||
| Repayments of line of credit |
(109,929 | ) | (164,232 | ) | ||||
| Distribution to member unitholders |
(15,000 | ) | — | |||||
| Contribution from member unitholders |
— | 4 | ||||||
| Repayment of long-term debt |
(3,011 | ) | (3,207 | ) | ||||
| Payments on finance lease arrangements |
(299 | ) | (50 | ) | ||||
|
|
|
|
|
|||||
| Net cash used in financing activities |
(18,310 | ) | (10,569 | ) | ||||
| Net increase (decrease) in cash |
76,607 | (1,683 | ) | |||||
| Cash at beginning of each period |
5,742 | 6,865 | ||||||
|
|
|
|
|
|||||
| Cash at end of each period |
$ | 82,349 | $ | 5,182 | ||||
|
|
|
|
|
|||||
| Supplemental cash flow information |
||||||||
| Cash payments for interest |
$ | (14,970 | ) | $ | (20,412 | ) | ||
| Cash payments for income taxes |
$ | (8,816 | ) | $ | (4,837 | ) | ||
| Supplemental disclosure of noncash activities |
||||||||
| Accrued consideration payments for purchase of a business |
$ | — | $ | 400 | ||||
| Right-of-use assets obtained in exchange for operating lease obligations |
$ | 12,901 | $ | 12,133 | ||||
| Origination of finance lease arrangements |
$ | 636 | $ | 410 | ||||
See accompanying notes to unaudited condensed consolidated financial statements.
F-5
Table of Contents
INTERIOR LOGIC GROUP HOLDINGS, LLC
NOTES TO UNAUDITED CONDENSED CONSOLIDATED FINANCIAL STATEMENTS
1. The Company
Interior Logic Group Holdings, LLC (“the Company” or “ILGH”), a Delaware limited liability company, together with its subsidiaries, is a provider of interior finish solutions for U.S. homebuilders. The Company provides technology-enabled, interior design supply chain management and installation services for high value interior finishes and operates showrooms for homebuilders, enabling its homebuyer customers to select an array of high-value interior finishes, such as flooring, cabinetry, fixtures, countertops and other product options in a single location. In addition to the Company’s homebuilder solutions, the Company provides sourcing and installation services, both for its design center services customers and for a diverse range of multifamily, light commercial and repair & remodel customers as well as home improvement retailers. The Company indirectly, through various wholly owned subsidiaries, owns 100% of the outstanding capital of its operating subsidiaries, which include: Interior Specialists, Inc., and its wholly owned subsidiaries (“ISI”) and Installation Services Holdings, Inc., and its wholly owned subsidiaries (“ILG”).
Effective May 31, 2018 (“the Effective Date”), pursuant to a contribution agreement, 100% of the issued and outstanding equity interests of ISI held directly or indirectly by Faraday Holdings, LLC (“Faraday”), and 100% of the issued and outstanding equity interests of ILG held directly or indirectly by Installation Services Holdings, LLC (“ISH”) were exchanged for membership units in the Company. Through its ownership (directly or indirectly) of Faraday, Littlejohn & Co. (“Littlejohn”) (together with certain members of management of Faraday) own 53% of the equity interests in the Company and, an affiliate of Platinum Equity Advisors, LLC (“Platinum”) (together with certain members of management of ISH) own 47% of the equity interests of the Company. Faraday was deemed the accounting acquirer of ILG for accounting purposes and Faraday is deemed to have acquired the equity interests of ILG (such acquisition, “the ILG Acquisition”). The ILG Acquisition was accounted for as a business combination and a capital transaction with respect to ISI. The 2018 financial statements include the combined operations of ISI and ILG after the completion of the ILG Acquisition. The historical unit equity account of ISI has been retrospectively adjusted to reflect the one to .47 exchange of equity interests in the ILG Acquisition.
Operating segments are identified as components of an enterprise about which separate discrete financial information is available for evaluation by the chief operating decision-maker in making decisions regarding resource allocation and assessing performance. The Company’s operating segments are aggregated into a single reportable segment. Management has determined a single reportable segment is appropriate based on the uniformity of products and services and similar operating and economic characteristics.
2. Significant Accounting Policies
Basis of Presentation and Principles of Consolidation
The accompanying condensed consolidated financial statements have been prepared in accordance with accounting principles generally accepted in the United States of America, or GAAP, as determined by the Financial Accounting Standards Board (FASB) Accounting Standards Codification (ASC) for interim financial information and pursuant to the regulations of the U.S. Securities and Exchange Commission (SEC), and include the accounts of the Company and its wholly-owned subsidiaries. All significant intercompany transactions have been eliminated in consolidation.
Use of Estimates
The preparation of financial statements in conformity with GAAP requires that management make estimates and assumptions that affect the reported amounts of assets and liabilities and disclosure of contingent assets and
F-6
Table of Contents
INTERIOR LOGIC GROUP HOLDINGS, LLC
NOTES TO UNAUDITED CONDENSED CONSOLIDATED FINANCIAL STATEMENTS (Continued)
liabilities at the date of the financial statements and the reported amounts of revenues and expenses during the reporting period. Areas that are more complex and involve a higher degree of judgment include revenue recognition, the allowance for doubtful accounts, fair value and recoverability of goodwill, intangible assets and long-lived assets, share-based compensation, the valuation allowance on deferred tax assets and certain accruals and reserves for general liability, workers’ compensation and warranties. Actual results could differ from those estimates.
Unaudited Interim Condensed Consolidated Financial Statements
The accompanying interim condensed consolidated balance sheet as of September 30, 2020, the interim condensed consolidated statements of members’ equity, the interim condensed consolidated statements of comprehensive income (loss) and statements of cash flows for the nine months ended September 30, 2020 and 2019, are unaudited. The unaudited interim condensed consolidated financial statements have been prepared on the same basis as the audited annual consolidated financial statements and, in management’s opinion, include all adjustments consisting of only normal recurring adjustments necessary for the fair statement of the Company’s financial position as of September 30, 2020 and its results of operations and cash flows for the nine months ended September 30, 2020 and 2019. The financial data and the other financial information disclosed in the notes to these condensed consolidated financial statements related to the nine-month periods are also unaudited. The results of operations for the nine months ended September 30, 2020 are not necessarily indicative of the results to be expected for the full fiscal year or any other period.
These unaudited interim condensed consolidated financial statements should be read in conjunction with the consolidated financial statements and the related notes included in the Company’s annual consolidated financial statements for the fiscal year ended December 31, 2019.
Revenue recognition
On January 1, 2018, the Company adopted Accounting Standards Update (“ASU”) 2014-09, Revenue from Contracts with Customers (“Topic 606”), using the modified retrospective transition method applied to those contracts that were not completed as of January 1, 2018. The Company recorded a $0.6 million, net of $0.2 million in deferred taxes, cumulative effect adjustment as an increase to opening retained earnings on January 1, 2018 due to the impact of Topic 606, with the impact primarily related to the change in accounting for its contracts that were previously accounted for under a units-of-delivery method. The Company has determined that control for its design and installation services passes over time for the installed products, and revenue is recognized to the extent costs have been incurred until installation is complete and represents the estimated consideration the Company expects to receive for the exchange of the performance obligation. See Note 3, Revenue Recognition, for additional revenue recognition disclosures.
Accounts Receivable and Allowance for Doubtful Accounts
Accounts receivable are carried at the original invoice amount less payments applied, and an estimate is made for doubtful receivables based on a review of all amounts outstanding. Receivables are considered past due if any portion of the receivable is outstanding for more than thirty days. No interest on past-due amounts is charged. Management determines the allowance for doubtful accounts by regularly evaluating individual customer receivables and considering a customer’s financial condition and credit history as well as current economic conditions that we expect will impact the level of credit losses over the life of our receivables. Accounts receivable are written off when deemed uncollectible. Recoveries of accounts receivable previously written off are recorded when received.
F-7
Table of Contents
INTERIOR LOGIC GROUP HOLDINGS, LLC
NOTES TO UNAUDITED CONDENSED CONSOLIDATED FINANCIAL STATEMENTS (Continued)
The following table summarizes the allowance for doubtful accounts (in thousands):
| Balance as of January 1, 2020 |
$ | 2,800 | ||
| Provision |
1,740 | |||
| Write-offs, net |
(1,470 | ) | ||
|
|
|
|||
| Balance as of September 30, 2020 |
$ | 3,070 | ||
|
|
|
Concentration of Credit Risk
Credit risk is the risk of financial loss to the Company from non-performance of a contractual obligation on the part of the Company’s counterparty. Such risk arises principally from the Company’s receivables from customers and cash and bank balances. The Company believes it is not exposed to any significant concentrations of credit risk on its cash.
Substantially all of the Company’s trade accounts receivables are from entities engaged in residential and commercial construction. The Company performs periodic evaluations of its customers’ financial condition. The general credit risk of the Company’s counterparties is not considered to be significant. For the nine months ended September 30, 2020 and 2019, no customer comprised more than 10% of revenues.
Inventories
Inventories include materials purchased under homebuyer contracts, stock items and material supplies. Inventories are valued at net realizable value with cost determined using the first-in, first-out method. As of September 30, 2020 and December 31, 2019, the Company had $49.6 million and $46.6 million of finished goods, respectively.
Property, plant and equipment, net
Property, plant and equipment is stated at cost, less accumulated depreciation that is calculated using the straight-line method over the estimated useful lives of the related assets. Land is stated at acquired fair value and is not subject to depreciation. Improvements to leased property are stated at cost and are amortized over the lesser of the remaining lease term or the useful lives of the underlying improvements.
The following table summarizes the depreciable lives for property, plant and equipment, net (in years):
| Building |
45 | |
| Software |
2-7 | |
| Furniture and fixtures |
7 | |
| Machinery and equipment |
5-10 | |
| Vehicles |
4 | |
| Computer equipment |
3 |
Fair Value Measurements
The accounting guidance for fair value measurements and disclosures emphasizes that fair value is a market-based measurement, not an entity-specific measurement. Therefore, a fair value measurement should be determined based on the assumptions that market participants would use in pricing the asset or liability. As a basis for considering market participant assumptions in fair value measurements, the guidance establishes a fair value hierarchy that distinguishes between market participant assumptions based on market data obtained from
F-8
Table of Contents
INTERIOR LOGIC GROUP HOLDINGS, LLC
NOTES TO UNAUDITED CONDENSED CONSOLIDATED FINANCIAL STATEMENTS—(Continued)
sources independent of the reporting entity (observable inputs that are classified within Levels I and II of the hierarchy) and the reporting entity’s own assumptions about market participant assumptions (unobservable inputs classified within Level III of the hierarchy).
Hierarchical levels directly related to the amount of subjectivity associated with the inputs to fair value are as follows:
Level I—Observable inputs are unadjusted, quoted prices in active markets for identical equity instruments at the measurement date.
Level II—Inputs (other than quoted prices included in Level I) are either directly or indirectly observable for the instrument through correlation with market data at the measurement date.
Level III—Inputs are unobservable (such as a company’s own data) and used to measure fair value, to the extent that observable inputs are not available.
The level of the fair value hierarchy in which the fair value measurement falls is determined by the lowest level input that is significant to the fair value measurement.
With respect to the Company’s cash, accounts receivable, prepaid expense, rebates, accounts payable and accrued liabilities, carrying value approximates fair value due to the short maturity of these instruments. As it relates to the Company’s revolving line of credit and term loan facility (see Note 7), the carrying value is considered to approximate fair value as the interest rate approximates current market rates. The carrying amounts of the Company’s operating lease right-of-use assets and the obligations associated with its operating and finance leases approximate fair value as of September 30, 2020 and December 31, 2019. All debt classifications represent level II fair value measurements.
The fair value of the Company’s interest rate swap agreements were determined using level II inputs.
Goodwill
The following table summarizes the changes in the carrying amount of the Company’s goodwill (in thousands):
| As of September 30, 2020 |
||||
| Beginning balance as of January 1, 2020 |
$ | 253,977 | ||
| Measurement period adjustments related to initial fair value of assets acquired and liabilities assumed |
492 | |||
| Goodwill acquired |
11,655 | |||
| Deferred tax liabilities |
723 | |||
|
|
|
|||
| Ending balance |
$ | 266,847 | ||
|
|
|
|||
Derivative Instruments and Hedging Activities
Interest Rate Swap Agreement
The Company entered into an interest rate swap agreement with respect to its Term Loan Facility, as defined in Note 7, during the year ended December 31, 2019 to offset the variability of the periodic cash flows associated with variable interest payments. The interest on the Term Loan Facility is based on the “London Inter-Bank Offer Rate” (LIBOR) plus 4.0% per annum or (ii) the base rate plus 3.0%. This interest rate swap agreement expires in December 2022 and had an initial notional amount of $300 million. As of December 31, 2019, the interest rate
F-9
Table of Contents
INTERIOR LOGIC GROUP HOLDINGS, LLC
NOTES TO UNAUDITED CONDENSED CONSOLIDATED FINANCIAL STATEMENTS—(Continued)
swap of $0.4 million was recorded net of tax at fair value in deposits and other assets in the accompanying consolidated balance sheets. In 2019, the interest rate swap fair value decreased significantly as interest rates declined during the year. As such, as of September 30, 2020 the interest rate swap had a liability balance that was recorded net of tax of $2.2 million at a fair value of $6.3 million in accounts payable and accrued expenses and other long-term liabilities. Since the derivative was designated as a cash flow hedge and the hedging relationship qualified for hedge accounting, under the authoritative guidance, the effective portion of the change in fair value of the derivative was recorded in other comprehensive income. The entire change in the fair value was considered effective during the nine months ended September 30, 2020.
Recently Issued Accounting Pronouncements
In February 2016, the Financial Accounting Standards Board, “FASB” issued Accounting Standards Update, “ASU” 2016-02, Leases (Topic 842) which was further modified in ASU 2018—10, Codification Improvements to Topic 842, Leases and ASU 2018-11, Leases (Topic 842) Targeted Improvements to clarify implementation guidance. The guidance requires a lessee to recognize assets and liabilities on the balance sheet for leases with lease terms greater than 12 months. The new standard is effective for the Company for fiscal years beginning January 1, 2019. The Company adopted Topic 842 using a modified retrospective approach by recognizing a cumulative-effect adjustment to retained earnings. As of the effective date, January 1, 2019, the Company recognized total right-of-use (“ROU”) assets of $68.2 million and $0.3 million related to operating and finance leases respectively. The Company also recognized total lease liabilities of $70.7 million and $0.3 million related to operating and finance leases respectively. The adoption of this standard did not have a material impact on its consolidated statements of comprehensive loss and consolidated statements of cash flows. As of September 30, 2020, future minimum lease payments under operating and finance leases were approximately $63.7 million and $1.1 million, respectively.
In June 2016, the FASB issued ASU 2016-13, Financial Instruments – Credit Losses (Topic 326), which amends the accounting for credit losses on available-for-sale securities and purchased financial assets with credit deterioration. In addition, these amendments require the measurement of all expected credit losses for financial assets, including trade accounts receivable, held at the reporting date based on historical experience, current conditions and reasonable and supportable facts. The ASU is effective for fiscal years beginning after December 15, 2019, including interim periods therein. The Company adopted the new credit loss standard effective January 1, 2020 and the impact of the adoption was not material to the Company’s consolidated financial statements.
In January 2017, the FASB issued ASU 2017-04, Intangibles – Goodwill and Other (Topic 350): Simplifying the Test for Goodwill Impairment, which simplifies the process used to test for goodwill. Under the new standard, if the carrying amount of a reporting unit exceeds its fair value, an impairment loss shall be recognized in an amount equal to that excess, limited to the total amount of goodwill allocated to that reporting unit, therefore eliminating Step 2 of the goodwill impairment test. The ASU is effective for annual impairment tests for periods beginning after December 15, 2019. The Company adopted the new standard effective January 1, 2020 and the impact of the adoption was not material to the Company’s consolidated financial statements.
In August 2018, the FASB issued ASU 2018-13, Fair Value Measurement (Topic 820): Disclosure Framework – Changes to the Disclosure Requirements for Fair Value Measurement, which eliminates, adds, and modifies certain disclosure requirements for fair value measurements. This ASU is effective fiscal years, and interim periods within those fiscal years, beginning after December 15, 2019. The Company adopted this new standard effective January 1, 2020 and the impact of the adoption was not material to the Company’s consolidated financial statements.
F-10
Table of Contents
INTERIOR LOGIC GROUP HOLDINGS, LLC
NOTES TO UNAUDITED CONDENSED CONSOLIDATED FINANCIAL STATEMENTS—(Continued)
In December 2019, the FASB issued ASU 2019-12, Income Taxes (Topic 740): Simplifying the Accounting for Income Taxes, which is intended to simplify various aspects related to accounting for income taxes. The new standard removes certain exceptions to the general principles in Topic 740 and also clarifies and amends existing guidance to improve consistent application. This guidance is effective for fiscal years, and interim periods within those fiscal years, beginning after December 15, 2020, with early adoption permitted. The Company adopted the standard on January 1, 2019, and the adoption of the standard did not have a material impact on its consolidated financial statements.
In August 2018, the FASB issued ASU No. 2018-15, Intangibles—Goodwill and Other—Internal-Use Software (Subtopic 350-40): Customer’s Accounting for Implementation Costs Incurred in a Cloud Computing Arrangement That is a Service Contract. This standard aligns the requirements for capitalizing implementation costs incurred in a hosting arrangement that is a service contract with the requirements for capitalizing implementation costs incurred to develop or obtain internal-use software. For public entities, the updated standard is effective for fiscal years beginning after December 15, 2019, including interim periods within that fiscal year. The standard can be adopted either retrospectively or prospectively to all implementation costs incurred after the date of adoption. Early adoption is permitted. The Company elected to early adopt this ASU using the prospective method as of December 31, 2018. The adoption of this standard did not have a material impact on the Company’s consolidated financial statements.
3. Revenue Recognition
The Company provides similar products and services based on the similarity in the installation methods and similarity in types of customers being homebuilders, multifamily developers or multi-unit property managers. The table below provides disaggregated revenues from contracts by type of customer because the Company believes it best depicts how timing of revenue and cash flows are affected by economic factors (in thousands):
| Nine Months Ended September 30, | ||||||||
| 2020 | 2019 | |||||||
| Homebuilder customers |
$ | 1,012,701 | $ | 1,044,397 | ||||
| Multifamily, commercial and repair and remodel customers |
219,154 | 269,624 | ||||||
|
|
|
|
|
|||||
| Total revenues |
$ | 1,231,855 | $ | 1,314,021 | ||||
|
|
|
|
|
|||||
As the cost and installation time by product type can vary, which determines the amount of revenue and time period over which revenue is recognized, the Company believes disaggregated revenues by product type also depicts how timing of revenue and cash flows are affected by economic factors. Disaggregated revenues by product type are as follows (in thousands):
| Nine Months Ended September 30, | ||||||||||||||||
| 2020 | 2019 | |||||||||||||||
| Flooring |
$ | 901,089 | 73 | % | $ | 975,810 | 74 | % | ||||||||
| Countertops |
159,805 | 13 | % | 172,024 | 13 | % | ||||||||||
| Cabinets |
114,742 | 9 | % | 107,523 | 8 | % | ||||||||||
| Window treatments |
11,884 | 1 | % | 11,828 | 1 | % | ||||||||||
| Other |
44,335 | 4 | % | 46,836 | 4 | % | ||||||||||
|
|
|
|
|
|||||||||||||
| Total revenues |
$ | 1,231,855 | $ | 1,314,021 | ||||||||||||
Contract Assets and Liabilities
The Company’s contract assets consist of unbilled amounts typically resulting from installations where revenue recognized exceeds amounts billed to customers due to the contractual terms and timing of when the
F-11
Table of Contents
INTERIOR LOGIC GROUP HOLDINGS, LLC
NOTES TO UNAUDITED CONDENSED CONSOLIDATED FINANCIAL STATEMENTS—(Continued)
Company can bill the customer. The Company’s contract liabilities represent payments received by customers for performance obligations that have not been billed per the contract terms. The Company’s contract assets of $30.0 million and $38.8 million and contract liabilities of $21.0 million and $26.5 million are recorded in other current assets and other current liabilities, respectively, in the accompanying consolidated balance sheets as of September 30, 2020 and December 31, 2019, respectively. During the nine months ended September 30, 2019, the Company acquired $0.1 million of contract assets and, during the nine months ended September 30, 2020 and 2019, acquired $0.2 million and $30 thousand of contract liabilities, respectively, as part of the 2020 and 2019 acquisitions (See Note 5).
During the nine months ended September 30, 2020 and 2019, the Company recognized $26.5 million and $19.6 million, respectively, of revenue that was included in the contract liability as of December 31, 2019 and 2018, respectively. The Company did not recognize any impairment losses on its contract assets during the nine months ended September 30, 2020 and 2019.
4. Supplementary Financial Information
Supplemental balance sheet information (in thousands):
| As of September 30, 2020 |
As of December 31, 2019 |
|||||||
| Property, plant and equipment, net(1): |
||||||||
| Leasehold improvements |
$ | 29,183 | $ | 25,245 | ||||
| Machinery and equipment |
17,110 | 16,520 | ||||||
| Software |
13,619 | 12,591 | ||||||
| Building and building improvements |
10,135 | 10,141 | ||||||
| Vehicles |
7,642 | 8,311 | ||||||
| Computer equipment |
8,629 | 7,593 | ||||||
| Furniture and fixtures |
5,495 | 5,672 | ||||||
| Land |
2,150 | 2,150 | ||||||
| Construction-in-progress |
2,508 | 1,741 | ||||||
|
|
|
|
|
|||||
| 96,471 | 89,964 | |||||||
| Less accumulated depreciation |
(47,086 | ) | (36,276 | ) | ||||
|
|
|
|
|
|||||
| $ | 49,385 | $ | 53,688 | |||||
|
|
|
|
|
|||||
| Accounts payable and accrued expenses: |
||||||||
| Accounts payable |
$ | 69,028 | $ | 58,486 | ||||
| Accrued wages and commissions |
26,286 | 27,132 | ||||||
| Accrued purchases |
29,348 | 23,980 | ||||||
| Accrued expenses |
21,528 | 18,320 | ||||||
| Accrued subcontractor labor |
13,045 | 11,570 | ||||||
| Accrued warranty reserve |
7,632 | 5,917 | ||||||
| Accrued taxes |
11,598 | 5,849 | ||||||
| Accrued insurance |
2,410 | 1,782 | ||||||
| Current portion of restructuring accrual |
199 | 200 | ||||||
| Accrued interest |
165 | 240 | ||||||
| Other |
321 | 74 | ||||||
|
|
|
|
|
|||||
| $ | 181,560 | $ | 153,550 | |||||
|
|
|
|
|
|||||
| (1) | The Company recorded depreciation expense of approximately $11.1 million and $11.4 million for the nine months ended September 30, 2020 and 2019, respectively. |
F-12
Table of Contents
INTERIOR LOGIC GROUP HOLDINGS, LLC
NOTES TO UNAUDITED CONDENSED CONSOLIDATED FINANCIAL STATEMENTS—(Continued)
5. Acquisitions and Other Transactions
As part of the Company’s ongoing strategy to expand its countertop fabrication, cabinet, flooring, cabinet supply, design and installations services, the Company completed one acquisition during the nine months ended September 30, 2020 and two asset acquisitions during the year ended December 31, 2019. These acquisitions included the inputs and processes capable of producing a return to its owners and were therefore accounted for as business combinations. The goodwill recognized in conjunction with these business combinations represents the excess of consideration transferred for the acquired entity over the estimated fair value of the net assets acquired and liabilities assumed and is expected to be deductible for tax purposes.
On July 23, 2020, the Company entered into a merger agreement with Roomored, Inc., (“Roomored”) which was accounted for under the acquisition method as prescribed by ASC 805, Business Combinations (“ASC 805”). The Company paid $15.3 million of cash as consideration at the closing of the merger. Additionally, the Company had a previous cost method investment in Roomored of $1.2 million, which was remeasured at the acquisition date to a step-up in fair value of $2.6 million, which was also included as consideration of the acquisition, making total consideration for Roomored $17.9 million. Due to the step-up-in fair value for its previous cost method investment, the Company recorded a gain of $1.4 million during the nine months ended September 30, 2020, which was included in other income in the accompanying consolidated statement of comprehensive income (loss).
The following table summarizes the amounts of identified assets acquired and liabilities assumed based on the estimated fair value at the purchase date, as well as total purchase price consideration (in thousands):
| Roomored | ||||
| Estimated fair values: |
||||
| Current assets |
$ | 563 | ||
| Property and equipment |
10 | |||
| Trademarks |
200 | |||
| Developed technology |
4,300 | |||
| Non-compete covenants |
300 | |||
| Customer relationships |
1,100 | |||
| Goodwill |
11,655 | |||
| Current liabilities |
(180 | ) | ||
|
|
|
|||
| Total consideration |
$ | 17,948 | ||
|
|
|
|||
Upon closing, $1.7 million of the transaction consideration was placed in escrow in accordance with the terms of the merger agreement to provide for contingencies that could arise subsequent to the closing date. The $1.7 million, less any deductions made in accordance with the merger agreement, will be released to the sellers of Roomored within the 24 months following the closing of the merger. The preliminary allocation of the consideration transferred is based upon preliminary estimates. The preliminary allocation of consideration transferred is subject to change during the measurement period (up to one year from the acquisition date) as the Company finalizes the valuation of deferred tax assets and intangible assets acquired and deferred tax liabilities assumed in connection with the acquisition.
The assets of Flooring Systems, Inc. (“Flooring Systems”) and the assets of Mike’s Flooring Companies, Inc., (“Mike’s Flooring”) were acquired during the nine months ended September 30, 2019.
F-13
Table of Contents
INTERIOR LOGIC GROUP HOLDINGS, LLC
NOTES TO UNAUDITED CONDENSED CONSOLIDATED FINANCIAL STATEMENTS—(Continued)
Cash paid for acquisitions during the nine months ended September 30, 2019 (in thousands):
| Acquisition Name |
Acquisition Date | Cash Purchase Price | ||||||
| Flooring Systems, Inc.(1) |
August 1, 2019 | $ | 3,338 | |||||
| Mike’s Flooring Companies, Inc.(2) |
September 1, 2019 | 9,048 | ||||||
|
|
|
|||||||
| $ | 12,386 | |||||||
|
|
|
|||||||
| (1) | Upon closing, cash of $1.0 million of the transaction consideration was placed in escrow in accordance with the terms of the acquisition agreement to provide for contingencies related to the acquisition that could arise subsequent to the closing date. The $1.0 million, less any deductions made in accordance with the asset purchase agreement, was released to the sellers of Flooring Systems in November 2020. |
Additionally, a performance contingency was established in the asset purchase agreement to measure the business’s performance for 12 months after the acquisition date. If certain targets are met, the Company could be responsible to pay the sellers of Flooring Systems up to $2.5 million, and this contingency was determined to be compensatory in nature. However, based on its assessment of the probability of the contingency as of September 30, 2020, the Company does not deem it probable that the contingent payment will be made. As such, the Company has not recorded compensation expense associated with the contingent payment during the nine months ended September 30, 2020.
| (2) | Upon closing, cash of $0.4 million of the transaction consideration was retained by the Company in accordance with the terms of the acquisition agreement to provide for an audit that was ongoing related to pre-acquisition activities that could require satisfaction. During the nine months ended September 30, 2020, the audit was concluded and a portion of the funds were used to satisfy amounts identified during the audit and the remaining amounts were remitted to the sellers of Mike’s Flooring Companies. |
Additionally, a performance contingency was established in the asset purchase agreement to measure the business’s performance for the year ended December 31, 2020. If certain targets are met, the Company could be responsible to pay the sellers of Mike’s Flooring up to $1.9 million, and this contingency was determined to be compensatory in nature. However, based on its assessment of the probability of the contingency as of September 30, 2020, the Company does not deem it probable that the contingent payment will be made. As such, the Company has not recorded compensation expense associated with the contingent payment during the nine months ended September 30, 2020.
The following table summarizes the amounts of identified assets acquired and liabilities assumed based on the estimated fair value at the purchase date, as well as total purchase price paid (in thousands):
| Estimated fair values: |
Flooring Systems |
Mike’s Flooring |
Total | |||||||||
| Current assets |
$ | 1,103 | $ | 4,034 | $ | 5,137 | ||||||
| Property and equipment |
195 | 114 | 309 | |||||||||
| Other assets |
47 | 126 | 173 | |||||||||
| Customer relationships |
3,500 | 6,400 | 9,900 | |||||||||
| Goodwill |
— | 1,795 | 1,795 | |||||||||
| Current liabilities |
(1,486 | ) | (3,421 | ) | (4,907 | ) | ||||||
| Long-term liabilities |
(21 | ) | — | (21 | ) | |||||||
|
|
|
|
|
|
|
|||||||
| Cash paid |
$ | 3,338 | $ | 9,048 | $ | 12,386 | ||||||
|
|
|
|
|
|
|
|||||||
During the nine months ended September 30, 2020, the Company recorded $0.5 million in measurement period adjustments related to certain accruals that were not known at the time of the opening balance sheet date and that would have otherwise been charges to income during the post-acquisition period.
F-14
Table of Contents
INTERIOR LOGIC GROUP HOLDINGS, LLC
NOTES TO UNAUDITED CONDENSED CONSOLIDATED FINANCIAL STATEMENTS—(Continued)
Acquisition Costs
The Company recognized approximately $0.3 million and $1.0 million of acquisition related costs for the nine months ended September 30, 2020 and 2019, respectively. The costs, which were expensed as incurred, were included within selling, general, and administrative expense in the accompanying consolidated statements of comprehensive loss.
Corporate Restructure
During the nine months ended September 30, 2020 and 2019, the Company restructured operations to integrate the acquisition of subsidiaries and align the resources of the Company that includes the consolidation of facilities resulting in early lease terminations in various states and a reduction in force. In connection with the restructuring, the Company recorded charges to selling, general and administrative expenses on the accompanying consolidated statements of comprehensive loss to recognize the costs of exiting leased equipment and facilities and for termination benefits due to work force reductions. The restructuring liability is included in other current and other long-term liabilities in the accompanying consolidated balance sheet and is reduced as rent, other direct costs and employee termination benefits are paid.
Restructuring accrual activity for the nine months ended September 30, 2020 and 2019 was as follows (in thousands):
| Total | ||||
| Balance, as of December 31, 2018 |
$ | 1,100 | ||
| January 1, 2019 ASC 842 transition adjustment |
(692 | ) | ||
| Accruals |
59 | |||
| Payments |
(425 | ) | ||
|
|
|
|||
| Balance, as of September 30, 2019 |
$ | 42 | ||
|
|
|
|||
| Balance, as of December 31, 2019 |
$ | 882 | ||
| Accruals |
540 | |||
| Payments |
(717 | ) | ||
|
|
|
|||
| Balance, as of September 30, 2020 |
$ | 705 | ||
|
|
|
|||
As of September 30, 2020, $0.5 million was included in accounts payable and accrued expenses and $0.2 million and was included in other long-term liabilities. As of December 31, 2019, $0.9 million was included in accounts payable and accrued expenses.
6. Intangible Assets, net
Intangible assets, net consisted of the following (dollars in thousands):
| As of September 30, 2020 | ||||||||||||||||
| Weighted Average Life (in years) |
Gross Carrying Amount |
Accumulated Amortization |
Net Carrying Value |
|||||||||||||
| Finite lived assets |
||||||||||||||||
| Customer relationships |
16.9 | $ | 357,731 | $ | (130,892 | ) | $ | 226,839 | ||||||||
| Noncompetition agreements |
4.2 | 20,990 | (13,251 | ) | 7,739 | |||||||||||
| Trademarks |
7.3 | 56,450 | (31,593 | ) | 24,857 | |||||||||||
| Developed technology |
5.0 | 4,300 | (143 | ) | 4,157 | |||||||||||
|
|
|
|
|
|
|
|||||||||||
| $ | 439,471 | $ | (175,879 | ) | $ | 263,592 | ||||||||||
|
|
|
|
|
|
|
|||||||||||
F-15
Table of Contents
INTERIOR LOGIC GROUP HOLDINGS, LLC
NOTES TO UNAUDITED CONDENSED CONSOLIDATED FINANCIAL STATEMENTS—(Continued)
| As of December 31, 2019 | ||||||||||||||||
| Weighted Average Life (in years) |
Gross Carrying Amount |
Accumulated Amortization |
Net Carrying Value |
|||||||||||||
| Finite lived assets |
||||||||||||||||
| Customer relationships |
17.0 | $ | 357,048 | $ | (99,918 | ) | $ | 257,130 | ||||||||
| Noncompetition agreements |
4.3 | 20,200 | (8,848 | ) | 11,352 | |||||||||||
| Trademarks |
7.6 | 56,250 | (23,988 | ) | 32,262 | |||||||||||
|
|
|
|
|
|
|
|||||||||||
| $ | 433,498 | $ | (132,754 | ) | $ | 300,744 | ||||||||||
|
|
|
|
|
|
|
|||||||||||
Intangible assets subject to amortization had a total weighted-average life of 15.0 years and 15.2 years as of September 30, 2020 and December 31, 2019, respectively. The Company recorded approximately $42.6 million and $47.5 million of amortization expense related to intangible assets for the nine months ended September 30, 2020 and 2019, respectively. The Company recognized $0.8 million of intangible asset impairment expense during the nine months ended September 30, 2020 due to the abandonment of certain of its intangibles.
7. Borrowing Facility and Long-term Debt, net
Long-term debt
Long-term debt, net of current portion consists of the following (in thousands):
| As of September 30, 2020 |
As of December 31, 2019 |
|||||||
| Term loan facility |
$ | 392,000 | $ | 395,000 | ||||
| Other long-term debt |
434 | 78 | ||||||
| Unamortized discount on term loan |
(1,333 | ) | (1,547 | ) | ||||
| Unamortized debt issuance costs |
(7,627 | ) | (8,849 | ) | ||||
|
|
|
|
|
|||||
| $ | 383,474 | $ | 384,682 | |||||
| Current maturities of long-term debt |
(2,528 | ) | (2,433 | ) | ||||
|
|
|
|
|
|||||
| $ | 380,946 | $ | 382,249 | |||||
|
|
|
|
|
|||||
Revolving Credit Facility
The Revolving Credit Facility is collateralized by substantially all of the Company’s current assets and expires on May 31, 2023. The facility is limited to a borrowing base calculation with a maximum availability of $100 million. The facility also provides for up to $30.0 million in letter of credit usage.
Availability under the Revolving Credit Facility is limited to the lesser of $100 million and a borrowing base determined by reference to, among other things, the value of the Company’s eligible receivables, eligible inventory, and eligible cash, reduced by certain reserve amounts. Availability under the Revolving Credit Facility is further limited by outstanding borrowings.
Obligations under the Revolving Credit Facility are guaranteed by the Company and its subsidiaries and secured on (i) a first priority basis by liens on, among other things, accounts receivable and other rights to payments, inventory, intangibles and other related assets, in each case except to the extent such items constitute identifiable proceeds of the Term Loan Facility Priority Collateral (“Revolving Credit Facility Priority Collateral”) and (ii) a second priority basis by liens on all of the Company’s assets other than the Revolving Credit Facility Priority Collateral (“Term Loan Facility Priority Collateral”). All guarantees by the Company and its subsidiaries are joint and several and full and unconditional.
F-16
Table of Contents
INTERIOR LOGIC GROUP HOLDINGS, LLC
NOTES TO UNAUDITED CONDENSED CONSOLIDATED FINANCIAL STATEMENTS—(Continued)
The interest rate under the Revolving Credit Facility bears interest at the Company’s option, at either (i) the base rate plus an applicable margin between 0.5% and 1.0% per annum based on average usage of the Revolving Credit Facility or (ii) LIBOR plus an applicable margin that ranges from 1.5% to 2.0%, based on average usage under the Revolving Credit Facility. The weighted average interest rate was approximately 3.4% as of September 30, 2020. In addition, the Company is required to pay an unused commitment fee of 0.250% to 0.375% per annum of the average unused portion of the lending commitments.
The Revolving Credit Facility also contains covenants that restrict the Company’s ability to, subject to specified exceptions, incur additional debt; incur additional liens or contingent liabilities; sell or dispose of assets; merge with or acquire other companies; liquidate or dissolve; engage in businesses that are not reasonably related to its current business activities; make loans, advances, or guarantees; pay dividends or make other distributions; engage in transactions with affiliates; and make certain investments. The Revolving Credit Facility also requires that the Company maintain a fixed-charge coverage ratio of not less than 1.0 to 1.0 to be tested if and when excess availability, as defined, falls below 10% of the facility’s maximum availability or $8.0 million.
Events of default under the Revolving Credit Facility include, but are not limited to, payment defaults, covenant defaults, breaches of representations and warranties, cross-defaults to certain indebtedness, certain events of bankruptcy and insolvency, defaults under any security documents and a change of control. As of September 30, 2020, the Company was in compliance with all covenants and no event of default (as such term is defined in the Revolving Credit Facility) had occurred.
As of September 30, 2020 and December 31, 2019, the Company had no borrowings on the Company’s Revolving Credit Facility and letters of credit in the amount of $3.2 million. Since there were no outstanding borrowings on the Company’s Revolving Credit facility as of September 30, 2020 and December 31, 2019, the associated net deferred financing fees of $0.3 and $0.5 million were recorded in other current assets in the accompanying consolidated balance sheet. After taking into consideration the current borrowing base and actual borrowings under the Revolving Credit Facility, the Company had $96.6 million and $96.8 million of remaining borrowing capacity as of September 30, 2020 and December 31, 2019.
Term Loan Facility
On May 31, 2018, the Company entered into a credit agreement in conjunction with the ILG Acquisition with the ABL Lender Group (“the Term Loan Facility”).
The Term Loan Facility provides for (i) an initial term loan commitment of $400 million and (ii) the right to request two incremental borrowings up to the aggregate of $100 million and 75% of consolidated earnings before interest, taxes, depreciation and amortization further adjusted by terms in the agreement and subject to financial covenants. The Term Loan Facility is repayable in quarterly installments of $1.0 million. Payments commenced on December 31, 2018 with the remaining principal balance payable at maturity on May 31, 2025. Borrowings under the Term Loan Facility bear interest at the Company’s option, at either (i) LIBOR plus 4.0% per annum or (ii) the base rate plus 3.0%. The interest rate was approximately 4.2% at September 30, 2020.
The obligations under the Term Loan Facility are guaranteed by the Company and its subsidiaries and are secured on a (i) first priority basis by liens on the Term Loan Facility Priority Collateral and (ii) second-priority basis by liens on the Revolving Credit Facility Priority collateral. All guarantees by the Company are joint and several and full and unconditional.
The Term Loan Facility contains covenants that, among other things, restrict the Company’s ability, subject to specified exceptions, to incur additional debt; incur additional liens and contingent liabilities; sell or dispose of assets; merge with or acquire other companies; liquidate or dissolve; engage in businesses that are not reasonably
F-17
Table of Contents
INTERIOR LOGIC GROUP HOLDINGS, LLC
NOTES TO UNAUDITED CONDENSED CONSOLIDATED FINANCIAL STATEMENTS—(Continued)
related to the existing business activities; make loans, advances, or guarantees; pay dividends or make other distributions; engage in transactions with affiliates and make capital expenditures and other investments.
Events of default under the Term Loan Facility include, but are not limited to, payment defaults, covenant defaults, breaches of representations and warranties, cross-defaults to certain indebtedness, certain events of bankruptcy and insolvency, defaults under security documents and a change of control. As of September 30, 2020, the Company was in compliance with all covenants and no event of default (as such term is defined in the Term Loan Facility) had occurred.
The scheduled maturities of long-term debt outstanding, excluding amortization of debt issuance costs, as of September 30, 2020 are as follows (in thousands):
| Remainder of 2020 |
$ | 1,000 | ||||||
| 2021 |
4,000 | |||||||
| 2022 |
4,000 | |||||||
| 2023 |
4,000 | |||||||
| 2024 |
4,000 | |||||||
|
|
|
|
|
|||||
| Thereafter |
$ | 375,000 | ||||||
|
|
|
|
|
8. Operating and Finance Leases
The Company leases its facilities and certain equipment under noncancelable operating leases which require monthly payments, expiring at various dates through June 2027. Some of the lease agreements contain renewal options at the expiration of their leases. Most of the facility lease agreements require the Company to pay its pro-rata share of the landlord’s operating expenses which include taxes, insurance and maintenance costs.
Total rent expense under all noncancelable operating and finance leases amounted to approximately $20.7 million and $19.7 million for the nine months ended September 30, 2020 and 2019, respectively, and is included in selling, general, and administrative expense in the accompanying consolidated statements of comprehensive loss.
In February 2016, the FASB issued ASU No. 2016-02, Leases (“ASC 842”). The FASB issued this Accounting Standards Update (“ASU”) to increase transparency and comparability among organizations by requiring lessees to recognize lease assets and lease liabilities on the balance sheet for those leases classified as operating leases and finance leases under current GAAP and disclosing key information about leasing arrangements. Enhanced disclosures are also required to give financial statement users the ability to assess the amount, timing and uncertainty of cash flows arising from leases. The standards became effective for the Company beginning January 1, 2019.
As a result of the adoption of the new accounting standard, the Company elected transition-related practical expedients as accounting policies which allowed it to not reassess, as of the adoption date, (1) whether any expired or existing contracts are or contain leases, (2) the classification of any expired or existing leases, and (3) if previously capitalized initial direct costs qualify for capitalization under ASC 842. The Company elected the practical expedient option to not separate lease and non-lease components for all of its leases, and also elected the short-term lease recognition exemption that keeps leases with an initial term of 12 months or less excluded from balance sheet.
Operating and finance lease liabilities are recognized at lease commencement based on the present value of the fixed lease payments using the Company’s incremental borrowing rate at commencement. Related operating and finance lease ROU (“Right of Use”) assets are recognized based on the initial present value of the fixed lease
F-18
Table of Contents
INTERIOR LOGIC GROUP HOLDINGS, LLC
NOTES TO UNAUDITED CONDENSED CONSOLIDATED FINANCIAL STATEMENTS—(Continued)
payments, reduced by cash payments received from the landlords as lease incentives, plus any prepaid rent and other direct costs from executing the leases. Amortization of both operating and finance lease ROU assets is recorded as part of rent expense in selling, general, and administrative expense on the consolidated statements of comprehensive loss. The interest expense amortization component of the finance lease liabilities is recorded within interest expense on the consolidated statements of comprehensive loss. ROU assets are tested for impairment in the same manner as long-lived assets.
Leases with an initial term of 12 months or less are not recorded on the balance sheet; the Company recognizes lease expense for these leases on a straight-line basis over the lease term. Variable lease payments are recognized as lease expense as they are incurred.
ROU assets and lease liabilities as of September 30, 2020 consist of the following:
| As of September 30, 2020 |
||||
| Assets |
||||
| Operating lease assets |
$ | 58,905 | ||
| Finance lease assets |
1,127 | |||
|
|
|
|||
| Total lease assets |
$ | 60,032 | ||
|
|
|
|||
| Liabilities |
||||
| Current |
||||
| Operating |
$ | 20,139 | ||
| Finance |
395 | |||
|
|
|
|||
| Total short-term lease liabilities |
$ | 20,534 | ||
| Non-current |
||||
| Operating |
$ | 43,550 | ||
| Finance |
735 | |||
|
|
|
|||
| Total long-term lease liabilities |
$ | 44,285 | ||
|
|
|
|||
| Total lease liabilities |
$ | 64,819 | ||
|
|
|
|||
Total lease costs for the nine months ended September 30, 2019 and 2020 were:
| Nine Months Ended September 30, |
||||||||
| 2020 | 2019 | |||||||
| Finance lease costs |
||||||||
| Amortization of right-of-use assets |
$ | 277 | $ | 123 | ||||
| Interest on lease liabilities |
34 | 21 | ||||||
|
|
|
|
|
|||||
| Total finance lease cost |
$ | 311 | $ | 144 | ||||
| Operating lease cost |
$ | 19,318 | $ | 18,639 | ||||
| Short-term lease cost |
294 | 216 | ||||||
| Variable lease cost |
1,433 | 843 | ||||||
| Sublease income |
(656 | ) | (142 | ) | ||||
|
|
|
|
|
|||||
| Total lease cost |
$ | 20,700 | $ | 19,700 | ||||
|
|
|
|
|
|||||
F-19
Table of Contents
INTERIOR LOGIC GROUP HOLDINGS, LLC
NOTES TO UNAUDITED CONDENSED CONSOLIDATED FINANCIAL STATEMENTS—(Continued)
Approximate aggregate annual lease payments as of September 30, 2020:
| Year |
Operating Leases | Finance Leases | ||||||
| 2020 (Oct. 1 to Dec. 31, 2020) |
$ | 4,738 | $ | 111 | ||||
| 2021 |
24,015 | 411 | ||||||
| 2022 |
18,844 | 333 | ||||||
| 2023 |
12,776 | 301 | ||||||
| 2024 |
6,769 | 84 | ||||||
| Thereafter |
3,254 | 20 | ||||||
|
|
|
|
|
|||||
| Total |
$ | 70,396 | $ | 1,260 | ||||
| Less: Imputed interest |
(6,707 | ) | (130 | ) | ||||
|
|
|
|
|
|||||
| Present value of net lease payments |
$ | 63,689 | $ | 1,130 | ||||
|
|
|
|
|
|||||
The following table includes supplemental lease information:
| Nine Months Ended September 30, |
||||||||
| 2020 | 2019 | |||||||
| Cash paid for amounts included in the measurement of lease liabilities |
||||||||
| Operating cash flows from operating leases |
$ | 20,161 | 17,663 | |||||
| Operating cash flows from finance leases |
34 | 21 | ||||||
| Financing cash flows from finance leases |
299 | 50 | ||||||
|
|
|
|
|
|||||
| $ | 20,494 | $ | 17,734 | |||||
| Weighted average remaining lease term (in years) |
||||||||
| Operating leases |
3.37 | 3.47 | ||||||
| Finance leases |
3.43 | 3.91 | ||||||
| Weighted average discount rate |
||||||||
| Operating leases |
6.01 | % | 6.21 | % | ||||
| Finance leases |
4.12 | % | 5.66 | % | ||||
9. Commitments and Contingencies
Litigation
The Company is party to various legal proceedings, primarily relating to contractual matters and personnel and employment disputes. Management cannot predict the ultimate outcome of these proceedings, individually or in the aggregate, or their resulting effect on our business, financial position, results of operations or cash flows as litigation and related matters are subject to inherent uncertainties, and unfavorable rulings could occur. Were an unfavorable outcome to occur, there exists the possibility of a material adverse impact on our business, financial position, results of operations, or cash flows for the period in which the ruling occurs and/or future periods. We maintain general and excess liability insurance coverage. However, no assurances can be given that such insurance will continue to be available at an acceptable cost to us, that such coverage will be sufficient to cover one or more large claims, or that the insurers will not successfully disclaim coverage as to a pending or future claim.
F-20
Table of Contents
INTERIOR LOGIC GROUP HOLDINGS, LLC
NOTES TO UNAUDITED CONDENSED CONSOLIDATED FINANCIAL STATEMENTS—(Continued)
Surety Bonds
Certain commercial customers require the Company to post performance and payment bonds issued by a financial institution known as a surety. If the Company fails to perform under the terms of a contract or to pay subcontractors and vendors that provided goods or services under the specific contract, the customer may demand that the surety make payments or provide services under the bond. The Company must reimburse the surety for any expenses or outlays it incurs. To date, the Company is not aware of any losses to its sureties in connection with bonds and sureties that have been posted on the Company’s behalf, and it does not expect such losses to be incurred in the foreseeable future.
10. Related-Party Transactions
Certain leases for Company facilities are held with lessors that are affiliates of the Company. Lease payments included in selling, general, and administrative expenses to these lessors totaled approximately $1.8 million for the nine months ended September 30, 2020 and 2019.
Certain member unit holders of the Company provide management services to the Company. Expenses related to the management services were approximately $1.1 million and $1.6 million for the nine months ended September 30, 2020 and 2019, respectively.
Certain Faraday unit holders purchased Faraday units in exchange for nonrecourse promissory notes on May 29, 2014. Interest on the notes are paid annually by the Faraday unit holders and is reflected in additional paid in capital in the accompanying consolidated statements of members’ equity.
11. Income Taxes
The Company’s effective tax rate for the nine months ended September 20, 2020 and 2019 was 24.3% and 15.1%, respectively. The effective tax rate for the fiscal 2020 period was impacted by income tax expense related to the valuation allowance related to various state jurisdictions.
As of September 30, 2020, the Company maintained a valuation allowance against certain deferred tax assets in state jurisdictions, as management is not able to conclude that it is more likely than not these assets will be realized upon recent financial results.
Accounting policies for interim reporting require the Company to adjust its effective tax rate each quarter to be consistent with its estimated effective tax rate. Under this methodology, the Company applies its estimated annual income tax rate to its year-to-date ordinary earnings to derive its income tax provision each quarter. The Company records the tax impacts of certain significant, unusual or infrequently occurring items in the period in which they occur.
The Company’s unrecognized tax benefits decreased during the nine months ended September 30, 2020 as a result of filing an accounting method change. The Company does not anticipate a significant change in unrecognized tax benefits during the remainder of fiscal 2020.
On March 27, 2020, the U.S. President signed into law the CARES Act, an economic stimulus package in response to the COVID-19 global pandemic. The CARES Act contains several corporate income tax provisions, including making remaining alternative minimum tax credits immediately refundable; providing a 5-year carryback of net operating loss carryforwards (“NOLs”) generated in tax years 2018, 2019, and 2020, and removing the 80% taxable income limitation on utilization of those NOLs if carried back to prior tax years or
F-21
Table of Contents
INTERIOR LOGIC GROUP HOLDINGS, LLC
NOTES TO UNAUDITED CONDENSED CONSOLIDATED FINANCIAL STATEMENTS—(Continued)
utilized in tax years beginning before 2021; and temporarily liberalizing the interest deductibility rules under Section 163(j) of the Tax Cuts and Jobs Act, by raising the adjusted taxable income limitation from 30% to 50% for tax years 2019 and 2020 and giving taxpayers the election of using 2019 adjusted taxable income for purposes of computing 2020 interest deductibility. The Company is still evaluating the impact but does not currently expect the provisions of the CARES Act to have a material effect on the realizability of deferred income tax assets or tax expense. There is no material impact for the nine months ended September 30, 2020. As additional guidance is released, the Company will evaluate whether there would need to be a change in the period when such guidance is issued.
12. Share-Based Compensation
2018 Equity Incentive Plan
The Company maintains the 2018 Equity Incentive Plan (“ILGH Plan”), the ILGH Plan allows for the grant of unit options, unit appreciation rights, and restricted unit grants to key employees. As of September 30, 2020, a total of 50,000 Class B Limited Voting Common Units (“Class B common units”) were reserved for issuance, of which 7,613 available for future awards at September 30, 2020.
The Company’s unit options include both service and performance conditions. These unit options vest ratably over four years, with the last tranche of awards vesting only if Littlejohn, Platinum and their affiliates’, collectively, the indirect owners of the Company, equity interests in the Company as of the grant date decreases by 30%. Such a decrease is considered a performance condition. The Company assesses the probability of achievement of the performance conditions at the end of each reporting period. As of September 30, 2020 and December 31, 2019, none of the performance conditions for any of the unit options have been deemed probable of achievement. In the event such performance conditions become probable, the Company will recognize expense on the options at that time for the performance based options and in proportion to the extent service has already been completed for the time based options. The unit options are exercisable for up to ten years from the grant date.
2012 Equity Incentive Plan
Faraday allows for the grant of unit options and restricted unit awards to its employees and independent directors under its 2012 Equity Incentive Plan (the “2012 Plan”) and its Amended 2015 Equity Incentive Plan (the “2015 Amended Plan”). As of September 30, 2020, a total of 200,000 Class C common units were reserved for issuance, of which 50,500 were available for future awards, and 155,689 Class E common unit options were reserved for issuance, of which 92,667 common units were available for future awards.
Compensation cost related to the grant of unit options and restricted unit awards to employees of the Company are recognized in the Company’s financial statements with a corresponding credit to equity representing the capital contribution indirectly made by Faraday. Faraday is considered an economic interest holder in ISI, and, therefore, the Company accounts for unit options and restricted unit awards in the same manner as if the Company adopted the Plan.
Certain of the Company’s unit options and restricted unit awards include both service and performance conditions. These unit options and restricted unit awards generally vest four to five years from the grant date, with the last tranche of awards vesting only upon a liquidation event, which is considered a performance condition. In addition, the Company granted unit options and restricted unit awards that vest periodically over a fixed term, usually five years which do not contain performance conditions. Share-based awards also generally provide for accelerated vesting if there is a liquidity event (as defined in the 2012 Plan and 2015 Amended Plan). The unit options are exercisable for up to ten years from the grant date.
F-22
Table of Contents
INTERIOR LOGIC GROUP HOLDINGS, LLC
NOTES TO UNAUDITED CONDENSED CONSOLIDATED FINANCIAL STATEMENTS—(Continued)
Compensation expense is amortized on a straight-line basis over the requisite service period, which is generally the maximum vesting period of the award, and if necessary, is adjusted to ensure that the amount recognized is at least equal to the vested (earned) compensation. For awards containing a performance condition, the compensation expense associated with the contingent shares related to the performance condition is not recognized until the performance condition becomes probable.
Unit Options
The estimated fair value of the Company’s unit options and incentive units were determined using the Black-Sholes model. All unit options were granted at an exercise price equal to the fair value of the common units on the grant date. The weighted-average grant date fair value of employee unit options during the nine months ended September 30, 2020 and 2019, was $280.78 and $202.39, respectively, which was estimated using the following weighted-average grant date assumptions:
| Nine months ended September 30, | ||||||||
| 2020 | 2019 | |||||||
| Expected volatility |
36 | % | 33 | % | ||||
| Expected term (in years) |
6.5 | 6.0 | ||||||
| Risk-free interest rate |
0.46 | % | 1.83 | % | ||||
| Expected dividend yield |
— | — | ||||||
The determination of the fair value of unit options using an option valuation model is affected by the Company’s common unit price, as well as assumptions regarding a number of complex and subjective variables.
The volatility assumption is based on the volatilities of similar peer companies over a period equal to the expected term of the unit options. The expected term of employee unit options represents the weighted-average period the unit options are expected to remain outstanding. The expected term assumption is estimated based primarily on the options’ vesting terms and remaining contractual life and employees’ expected exercise and post-vesting employment termination behavior. The risk-free interest rate assumption is based upon observed interest rates at the grant date for the expected term of the option. The dividend yield assumption is based on the expectation of no future dividend payouts by the Company.
A summary of the Company’s unit option award activity under the 2012 plan for the nine months ended September 30, 2020, is as follows:
| Number of Units | Weighted- Average Exercise Price Per Unit |
Weighted-Average Remaining Contractual Term (In Years) |
||||||||||
| Options outstanding at December 31, 2019 |
57,422 | $ | 70.98 | 6.72 | ||||||||
| Options granted |
— | — | ||||||||||
| Options forfeited |
— | — | ||||||||||
| Options exercised |
— | — | ||||||||||
|
|
|
|
|
|
|
|||||||
| Options outstanding at September 30, 2020 |
57,422 | $ | 70.98 | 5.97 | ||||||||
|
|
|
|
|
|
|
|||||||
| Options exercisable or expected to be exercisable at September 30, 2020 |
55,484 | $ | 71.76 | 6.01 | ||||||||
|
|
|
|
|
|
|
|||||||
F-23
Table of Contents
INTERIOR LOGIC GROUP HOLDINGS, LLC
NOTES TO UNAUDITED CONDENSED CONSOLIDATED FINANCIAL STATEMENTS—(Continued)
A summary of the Company’s unit option award activity under the 2018 plan for the nine months ended September 30, 2020 is as follows:
| Number of Units | Weighted- Average Exercise Price Per Unit |
Weighted-Average Remaining Contractual Term (In Years) |
||||||||||
| Options outstanding at December 31, 2019 |
37,887 | $ | 566.81 | 9.39 | ||||||||
| Options granted |
7,500 | $ | 574.68 | 9.79 | ||||||||
| Options forfeited |
(3,600 | ) | $ | 574.68 | ||||||||
| Options exercised |
— | — | ||||||||||
|
|
|
|
|
|
|
|||||||
| Options outstanding at September 30, 2020 |
41,787 | $ | 567.64 | 8.82 | ||||||||
|
|
|
|
|
|
|
|||||||
| Options exercisable or expected to be exercisable at September 30, 2020 |
33,910 | $ | 567.64 | 8.82 | ||||||||
|
|
|
|
|
|
|
|||||||
The Company accounts for forfeitures as they occur, and compensation expense previously recognized for an award that is forfeited because of a failure to satisfy a service condition is reversed in the period of the forfeiture. Compensation expense related to unit options was $0.2 million and $0.7 million for the nine months ended September 30, 2020 and 2019, respectively. At September 30, 2020, total unrecognized compensation expense related to unvested unit options was $0.3 million, which is expected to be recognized over a weighted-average period of 1.22 years. As of September 30, 2020, total unrecognized compensation expense related to unvested unit options with performance conditions and with both service and performance conditions is $10.2 million, which will be recognized in the event the performance condition becomes probable and, as applicable, in proportion to the extent the underlying service period has been completed.
Incentive Unit Plan
ISH allows for the grant of unit options to employees and independent directors under its Incentive Unit Plan (“ISH Plan”). The ISH Plan allows for the issuance of up to 4,000,000 of common units of ISH. This plan is intended to provide incentives to officers, employees, consultants, and other key persons determined by ISH’s Board of Managers by providing such person with awards of membership interests in ISH denominated as incentive units. Pursuant to the terms of ISH Plan, the ISH Managers shall have the right to issue up to 1,000,000 common units as incentive units.
Compensation costs related to the grant of the incentive units to employees of the Company are recognized in the Company’s separate financial statements with a corresponding credit to equity, representing the capital contribution indirectly made by ISH. ISH is considered an economic interest holder in ILG and, therefore, the Company accounts for the incentive units to employees of the Company as if the Company adopted the plan.
As of September 30, 2020, there were 19,697 incentive units reserved for issuance, and 13,048 units were available to be issued under the ISH Plan. Two types of units are granted: Time-based vesting incentive units, and Performance-based vesting incentive units. Time based vesting incentive units grade vest equally over four years at the end of the first four anniversaries of the grant date and 20% upon the sale of the Company. The performance-based incentive units vest upon the owners of ISH receiving proceeds greater than a target multiple of invested capital as defined in the ISH Plan, this is considered a performance condition. The ILG Acquisition was not considered a sale transaction. The time based incentive units contain additional performance conditions that the Company assesses for probability of achievement each reporting period. As of September 30, 2020 and December 31, 2019, none of the performance conditions for any of the incentive units have been deemed
F-24
Table of Contents
INTERIOR LOGIC GROUP HOLDINGS, LLC
NOTES TO UNAUDITED CONDENSED CONSOLIDATED FINANCIAL STATEMENTS—(Continued)
probable of achievement. In the event such performance conditions become probable, the Company will recognize expense on the incentive units at that time for the performance based incentive units and in proportion to the extent service has already been completed for the time based options.
Restricted Unit Awards and Incentive Units
Under the authoritative guidance for share-based compensation, the fair value of the Company’s restricted unit awards is based on the grant date fair value of the Company’s common units. During the nine months ended September 30, 2020, no restricted unit awards were granted.
A summary of the Company’s incentive unit awards for the nine months ended September 30, 2020 is as follows:
| Number of Units | Weighted-Average Grant Date Fair Value Per Unit |
|||||||
| Restricted unit awards issued (unvested) at December 31, 2019 |
6,600 | $ | 26.59 | |||||
| Units granted |
— | — | ||||||
| Units forfeited |
— | — | ||||||
| Units vested |
— | — | ||||||
|
|
|
|
|
|||||
| Restricted unit awards issued (unvested) at September 30, 2020 |
6,600 | $ | 26.59 | |||||
|
|
|
|
|
|||||
A summary of the Company’s incentive unit awards for the nine months ended September 30, 2020 is as follows:
| Number of Units | Weighted-Average Grant Date Fair Value Per Unit |
|||||||
| Incentive unit awards issued (unvested) at December 31, 2019 |
3,204 | $ | 305.00 | |||||
| Units granted |
— | — | ||||||
| Units forfeited |
(106 | ) | $ | 315.00 | ||||
| Units vested |
(658 | ) | $ | 315.00 | ||||
|
|
|
|
|
|||||
| Incentive unit awards issued (unvested) at September 30, 2020 |
2,440 | $ | 301.70 | |||||
|
|
|
|
|
|||||
The fair value on the vesting date of vested restricted and incentive unit awards was $0.2 million and $0.6 million for the nine months ended September 30, 2020 and 2019, respectively.
As of September 30, 2020, total unrecognized compensation expense related to unvested restricted unit awards was $0.3 million. The $0.3 million unrecognized compensation is associated with awards containing a liquidation vesting condition. The compensation with contingent units is not recognized until the liquidation event becomes probable.
13. Employee Benefit Plan
The Company’s 401(k) plan allows for employees with at least 30 days of service and who have attained 21 years of age, to defer a portion of their compensation each year based upon provisions as outlined in the plan. During the nine months ended September 30, 2020, the Company matched employee 401(k) contributions at the rate of $0.50 on each dollar of the first 2% of the employee’s annual compensation contributed, then $0.33 on each dollar contributed above 2% up to 6% of the employee’s annual salary contributed. Matching is at the sole discretion of the ILG.
F-25
Table of Contents
INTERIOR LOGIC GROUP HOLDINGS, LLC
NOTES TO UNAUDITED CONDENSED CONSOLIDATED FINANCIAL STATEMENTS—(Continued)
During the nine months ended September 30, 2020, the Company recorded matching contribution expense of $1.3 million.
14. Earnings (Loss) Per Unit
Basic earnings (loss) per unit is calculated by dividing net income (loss) by the weighted average number of common units outstanding during the reporting period. The following table sets forth the computation of basic and diluted earnings (loss) per unit:
| Nine Months Ended September 30, |
||||||||
| 2020 | 2019 | |||||||
| Net income (loss) |
$ | 7,947 | $ | (17,568 | ) | |||
|
|
|
|
|
|||||
| Earnings (loss) per unit - basic |
$ | 7.95 | $ | (17.57 | ) | |||
|
|
|
|
|
|||||
| Earnings (loss) per unit - diluted |
$ | 7.95 | $ | (17.57 | ) | |||
|
|
|
|
|
|||||
| Weighted average common units outstanding - basic |
1,000,000 | 1,000,000 | ||||||
| Potential dilutive effect of potential common units |
— | — | ||||||
|
|
|
|
|
|||||
| Weighted average common units outstanding - diluted |
1,000,000 | 1,000,000 | ||||||
|
|
|
|
|
|||||
There is no earnings per unit presented for the Class B common units, both basic and diluted, as there are no units outstanding and the options are not probable of vesting as of September 30, 2020 and December 31, 2019. Share-based awards to purchase 50,000 units of Class B common units were not included in the above calculation of diluted earnings (loss) per unit for the nine months ended September 30, 2020 and 2019 because the effect of these instruments was anti-dilutive.
15. Subsequent Events
The Company has evaluated subsequent events after September 30, 2020 through December 2, 2020, the date that the consolidated financial statements were available to be issued, noting no additional material items required for disclosure.
F-26
Table of Contents
Report of Independent Registered Public Accounting Firm
To the Members and the Board of Managers of Interior Logic Group Holdings, LLC
Opinion on the Financial Statements
We have audited the accompanying consolidated balance sheets of Interior Logic Group Holdings, LLC (the Company) as of December 31, 2019 and 2018, the related consolidated statements of comprehensive income (loss), members’ equity and cash flows for each of the three years in the period ended December 31, 2019, and the related notes (collectively referred to as the “consolidated financial statements”). In our opinion, the consolidated financial statements present fairly, in all material respects, the financial position of the Company at December 31, 2019 and 2018, and the results of its operations and its cash flows for each of the three years in the period ended December 31, 2019, in conformity with U.S. generally accepted accounting principles.
Adoption of ASU No. 2014-09
As discussed in Note 2 to the consolidated financial statements, the Company changed its method for recognizing revenue as a result of the adoption of Accounting Standards Update (ASU) No. 2014-09, Revenue from Contracts with Customers (Topic 606), as amended, effective January 1, 2018.
Adoption of ASU No. 2016-02
As discussed in Note 2 to the consolidated financial statements, the Company changed its method of accounting for leases as a result of the adoption of ASU No. 2016-02, Leases (Topic 842), as amended, effective January 1, 2019.
Basis for Opinion
These financial statements are the responsibility of the Company’s management. Our responsibility is to express an opinion on the Company’s financial statements based on our audits. We are a public accounting firm registered with the Public Company Accounting Oversight Board (United States) (PCAOB) and are required to be independent with respect to the Company in accordance with the U.S. federal securities laws and the applicable rules and regulations of the Securities and Exchange Commission and the PCAOB.
We conducted our audits in accordance with the standards of the PCAOB. Those standards require that we plan and perform the audit to obtain reasonable assurance about whether the financial statements are free of material misstatement, whether due to error or fraud. The Company is not required to have, nor were we engaged to perform, an audit of its internal control over financial reporting. As part of our audits we are required to obtain an understanding of internal control over financial reporting but not for the purpose of expressing an opinion on the effectiveness of the Company’s internal control over financial reporting. Accordingly, we express no such opinion.
Our audits included performing procedures to assess the risks of material misstatement of the financial statements, whether due to error or fraud, and performing procedures that respond to those risks. Such procedures included examining, on a test basis, evidence regarding the amounts and disclosures in the financial statements. Our audits also included evaluating the accounting principles used and significant estimates made by management, as well as evaluating the overall presentation of the financial statements. We believe that our audits provide a reasonable basis for our opinion.
/s/ Ernst & Young LLP
We have served as the Company’s auditor since 2006.
San Diego, California
December 2, 2020
F-27
Table of Contents
INTERIOR LOGIC GROUP HOLDINGS, LLC
CONSOLIDATED BALANCE SHEETS
(In thousands, except unit data)
| December 31, | ||||||||
| 2019 | 2018 | |||||||
| Assets |
||||||||
| Current assets: |
||||||||
| Cash |
$ | 5,742 | $ | 6,865 | ||||
| Accounts receivable, net of allowance for doubtful accounts of $2.8 million and $1.0 million as of December 31, 2019 and 2018, respectively |
174,405 | 155,906 | ||||||
| Other receivables |
14,111 | 20,864 | ||||||
| Inventories |
46,632 | 46,480 | ||||||
| Prepaid expenses |
14,631 | 12,826 | ||||||
| Other current assets |
44,937 | 43,256 | ||||||
|
|
|
|
|
|||||
| Total current assets |
300,458 | 286,197 | ||||||
| Property, plant and equipment, net |
53,688 | 58,001 | ||||||
| Lease right-of-use assets |
64,234 | — | ||||||
| Deposits and other assets |
13,341 | 8,207 | ||||||
| Intangible assets, net |
300,744 | 354,388 | ||||||
| Goodwill |
253,977 | 249,849 | ||||||
|
|
|
|
|
|||||
| Total assets |
$ | 986,442 | $ | 956,642 | ||||
|
|
|
|
|
|||||
| Liabilities and members’ equity |
||||||||
| Current liabilities: |
||||||||
| Accounts payable and accrued expenses |
$ | 153,550 | $ | 154,922 | ||||
| Outstanding checks in excess of cash |
— | 1,560 | ||||||
| Line of credit |
— | 16,656 | ||||||
| Current maturities of lease obligations |
19,391 | — | ||||||
| Current maturities of long-term debt |
2,433 | 2,378 | ||||||
| Other current liabilities |
26,483 | 19,601 | ||||||
|
|
|
|
|
|||||
| Total current liabilities |
201,857 | 195,117 | ||||||
| Long-term debt, net of current portion |
382,249 | 384,319 | ||||||
| Deferred tax liabilities, net |
30,476 | 49,025 | ||||||
| Deferred rent |
— | 1,759 | ||||||
| Long-term lease obligations |
49,262 | |||||||
| Other long-term liabilities |
18,362 | 8,192 | ||||||
|
|
|
|
|
|||||
| Total liabilities |
682,206 | 638,412 | ||||||
|
|
|
|
|
|||||
| Commitments and contingencies (Note 9) |
||||||||
| Members’ equity |
||||||||
| Class A voting common units, no par value, unlimited units authorized, 1,000,000 issued and outstanding at December 31, 2019 and 2018 |
— | — | ||||||
| Class B limited voting common units, no par value, 50,000 authorized, none issued and outstanding at December 31, 2019 and 2018 |
— | — | ||||||
| Additional paid-in capital |
329,757 | 328,247 | ||||||
| Accumulated deficit |
(25,952 | ) | (10,017 | ) | ||||
| Accumulated other comprehensive income |
431 | — | ||||||
|
|
|
|
|
|||||
| Total members’ equity |
304,236 | 318,230 | ||||||
|
|
|
|
|
|||||
| Total liabilities and members’ equity |
$ | 986,442 | $ | 956,642 | ||||
|
|
|
|
|
|||||
See accompanying notes to consolidated financial statements.
F-28
Table of Contents
INTERIOR LOGIC GROUP HOLDINGS, LLC
CONSOLIDATED STATEMENTS OF COMPREHENSIVE (LOSS) INCOME
(In thousands, except unit and per unit data)
| Year Ended December 31 | ||||||||||||
| 2019 | 2018 | 2017 | ||||||||||
| Revenues |
$ | 1,785,388 | $ | 1,405,325 | $ | 851,918 | ||||||
| Cost of revenues |
1,390,606 | 1,099,337 | 670,274 | |||||||||
|
|
|
|
|
|
|
|||||||
| 394,782 | 305,988 | 181,644 | ||||||||||
| Selling, general and administrative |
321,143 | 246,234 | 152,218 | |||||||||
| Amortization of intangible assets |
63,545 | 40,843 | 9,080 | |||||||||
| Trade name impairment |
— | 10,000 | — | |||||||||
|
|
|
|
|
|
|
|||||||
| Total operating expenses |
384,688 | 297,077 | 161,298 | |||||||||
|
|
|
|
|
|
|
|||||||
| Income from operations |
10,094 | 8,911 | 20,346 | |||||||||
| Other income (expense): |
||||||||||||
| Interest expense |
(29,088 | ) | (22,238 | ) | (10,458 | ) | ||||||
| Loss on extinguishment of debt |
— | (3,068 | ) | (552 | ) | |||||||
| Other income |
8 | — | — | |||||||||
|
|
|
|
|
|
|
|||||||
| (Loss) income before income taxes |
(18,986 | ) | (16,395 | ) | 9,336 | |||||||
| Income tax benefit |
3,225 | 3,475 | 521 | |||||||||
|
|
|
|
|
|
|
|||||||
| Net (loss) income |
$ | (15,761 | ) | $ | (12,920 | ) | $ | 9,857 | ||||
| Other comprehensive income (loss): |
||||||||||||
| Unrealized gain (loss) on derivative instrument, net |
431 | — | (5 | ) | ||||||||
|
|
|
|
|
|
|
|||||||
| Comprehensive (loss) income |
$ | (15,330 | ) | $ | (12,920 | ) | $ | 9,852 | ||||
|
|
|
|
|
|
|
|||||||
| (Loss) earnings per unit |
||||||||||||
| Basic and diluted |
$ | (15.76 | ) | $ | (16.01 | ) | $ | 18.60 | ||||
| Weighted average units outstanding |
||||||||||||
| Basic and diluted |
1,000,000 | 806,849 | 530,000 | |||||||||
See accompanying notes to consolidated financial statements.
F-29
Table of Contents
INTERIOR LOGIC GROUP HOLDINGS, LLC
CONSOLIDATED STATEMENTS OF MEMBERS’ EQUITY
(In thousands, except unit data)
| Class A Voting Common Units |
Class B Limited Voting Common Units |
Additional Paid-in Capital |
Retained Earnings/ (Accumulated Deficit) |
Accumulated Other Comprehensive Income (Loss) |
Total Members’ Equity |
|||||||||||||||||||
| Balance at December 31, 2016 |
530,000 | — | $ | 84,561 | $ | (7,260 | ) | $ | — | $ | 77,301 | |||||||||||||
|
|
|
|
|
|
|
|
|
|
|
|
|
|||||||||||||
| Distribution to parent |
— | — | — | (257 | ) | — | (257 | ) | ||||||||||||||||
| Share-based compensation expense |
— | — | 825 | — | — | 825 | ||||||||||||||||||
| Net unrealized loss on derivative instrument |
— | — | — | — | (5 | ) | (5 | ) | ||||||||||||||||
| Net income |
— | — | — | 9,857 | — | 9,857 | ||||||||||||||||||
|
|
|
|
|
|
|
|
|
|
|
|
|
|||||||||||||
| Balance at December 31, 2017 |
530,000 | — | $ | 85,386 | $ | 2,340 | $ | (5 | ) | $ | 87,721 | |||||||||||||
|
|
|
|
|
|
|
|
|
|
|
|
|
|||||||||||||
| Cumulative effect of accounting policy change, net of tax |
— | — | — | 563 | — | 563 | ||||||||||||||||||
| Distribution to parent, net |
— | — | (3,625 | ) | — | — | (3,625 | ) | ||||||||||||||||
| Share-based compensation expense |
— | — | 1,131 | — | — | 1,131 | ||||||||||||||||||
| Contributed equity interests |
470,000 | — | 245,355 | — | — | 245,355 | ||||||||||||||||||
| Reclassification to earnings for discontinued hedge |
— | — | — | — | 5 | 5 | ||||||||||||||||||
| Net loss |
— | — | — | (12,920 | ) | — | (12,920 | ) | ||||||||||||||||
|
|
|
|
|
|
|
|
|
|
|
|
|
|||||||||||||
| Balance at December 31, 2018 |
1,000,000 | — | $ | 328,247 | $ | (10,017 | ) | $ | — | $ | 318,230 | |||||||||||||
|
|
|
|
|
|
|
|
|
|
|
|
|
|||||||||||||
| Interest received on Faraday unit holder promissory notes |
— | — | 4 | — | — | 4 | ||||||||||||||||||
| Share-based compensation expense |
— | — | 1,506 | — | — | 1,506 | ||||||||||||||||||
| Cumulative effect of accounting policy change, net of tax |
— | — | — | (174 | ) | — | (174 | ) | ||||||||||||||||
| Unrealized gain on derivative instrument, net |
— | — | — | — | 431 | 431 | ||||||||||||||||||
| Net loss |
— | — | — | (15,761 | ) | — | (15,761 | ) | ||||||||||||||||
|
|
|
|
|
|
|
|
|
|
|
|
|
|||||||||||||
| Balance at December 31, 2019 |
1,000,000 | — | $ | 329,757 | $ | (25,952 | ) | $ | 431 | $ | 304,236 | |||||||||||||
|
|
|
|
|
|
|
|
|
|
|
|
|
|||||||||||||
See accompanying notes to consolidated financial statements.
F-30
Table of Contents
INTERIOR LOGIC GROUP HOLDINGS, LLC
CONSOLIDATED STATEMENTS OF CASH FLOWS
(In thousands)
| Year Ended December 31 | ||||||||||||
| 2019 | 2018 | 2017 | ||||||||||
| Operating activities |
||||||||||||
| Net (loss) income |
$ | (15,761 | ) | $ | (12,920 | ) | $ | 9,857 | ||||
| Adjustment to reconcile net (loss) income to net cash provided by operating activities: |
||||||||||||
| Depreciation |
15,418 | 11,778 | 4,995 | |||||||||
| Intangible assets amortization |
63,545 | 40,843 | 9,080 | |||||||||
| Amortization of operating lease right-of-use assets |
24,285 | — | — | |||||||||
| Trade name impairment |
— | 10,000 | — | |||||||||
| Amortization of debt issuance costs |
1,840 | 1,410 | 731 | |||||||||
| Amortization of term loan discount |
285 | 167 | 133 | |||||||||
| Share-based compensation expense |
1,506 | 1,131 | 825 | |||||||||
| Provision for doubtful accounts |
2,427 | 1,383 | 890 | |||||||||
| Deferred rent |
— | 380 | 408 | |||||||||
| Interest paid-in-kind |
— | — | 2,112 | |||||||||
| Deferred income tax expense |
(18,549 | ) | (10,163 | ) | (3,097 | ) | ||||||
| Loss (gain) on sale of equipment |
677 | 138 | (80 | ) | ||||||||
| Loss on extinguishment of debt |
— | 3,068 | 552 | |||||||||
| Changes in operating assets and liabilities, excluding effects of business acquired: |
||||||||||||
| Accounts receivable and other receivables |
(10,505 | ) | (13,498 | ) | (5,885 | ) | ||||||
| Inventories |
638 | (4,458 | ) | 3,757 | ||||||||
| Prepaid expenses and other assets |
(11,726 | ) | (21,993 | ) | 4,401 | |||||||
| Accounts payable, accrued expenses and outstanding checks in excess of cash |
3,980 | (14,556 | ) | 23,672 | ||||||||
| Lease liabilities |
(20,272 | ) | — | — | ||||||||
| Customer deposits |
6,851 | 10,995 | (798 | ) | ||||||||
|
|
|
|
|
|
|
|||||||
| Net cash provided by operating activities |
44,639 | 3,705 | 51,553 | |||||||||
| Investing activities |
||||||||||||
| Acquisition of businesses, net of cash acquired |
(12,274 | ) | (18,645 | ) | (4,689 | ) | ||||||
| Purchases of property and equipment and capitalized software costs |
(11,870 | ) | (16,000 | ) | (12,951 | ) | ||||||
| Proceeds from sale of property and equipment |
218 | 49 | 114 | |||||||||
|
|
|
|
|
|
|
|||||||
| Net cash used in investing activities |
(23,926 | ) | (34,596 | ) | (17,526 | ) | ||||||
| Financing activities |
||||||||||||
| Borrowings on line of credit |
202,504 | 686,261 | 823,596 | |||||||||
| Repayments of line of credit |
(220,081 | ) | (692,099 | ) | (858,850 | ) | ||||||
| Interest received on Faraday unit holder promissory notes |
4 | 4 | — | |||||||||
| Distribution to parent |
— | (3,629 | ) | (257 | ) | |||||||
| Borrowing on long-term debt |
— | 398,000 | 23,075 | |||||||||
| Repayment of long-term debt |
(4,209 | ) | (337,292 | ) | (22,970 | ) | ||||||
| Payment of debt issuance costs |
— | (12,479 | ) | (764 | ) | |||||||
| Payment of prepayment penalty on debt extinguishment |
— | (931 | ) | — | ||||||||
| Payments on finance lease arrangements |
(54 | ) | (79 | ) | (9 | ) | ||||||
|
|
|
|
|
|
|
|||||||
| Net cash (used in) provided by financing activities |
(21,836 | ) | 37,756 | (36,179 | ) | |||||||
| Net (decrease) increase in cash |
(1,123 | ) | 6,865 | (2,152 | ) | |||||||
| Cash at beginning of each period |
6,865 | — | 2,152 | |||||||||
|
|
|
|
|
|
|
|||||||
| Cash at end of each period |
$ | 5,742 | $ | 6,865 | $ | — | ||||||
|
|
|
|
|
|
|
|||||||
| Supplemental cash flow information |
||||||||||||
| Cash payments for interest |
$ | 26,697 | $ | 19,256 | $ | 6,924 | ||||||
| Cash payments for income taxes |
$ | 5,820 | $ | 13,813 | $ | 5,967 | ||||||
| Supplemental disclosure of noncash activities |
||||||||||||
| Units issued in ILG Acquisition |
$ | — | $ | 245,355 | $ | — | ||||||
| Accrued consideration payments for purchase of a business |
$ | 400 | $ | 875 | $ | 1,000 | ||||||
| Property, plant and equipment accrued |
$ | — | $ | 321 | $ | — | ||||||
| Right-of-use assets obtained in exchange for operating lease obligations |
$ | 19,375 | $ | — | $ | — | ||||||
| Origination of finance lease arrangements |
$ | 669 | $ | 12 | $ | 207 | ||||||
See accompanying notes to consolidated financial statements.
F-31
Table of Contents
INTERIOR LOGIC GROUP HOLDINGS, LLC
NOTES TO CONSOLIDATED FINANCIAL STATEMENTS
1. The Company
Interior Logic Group Holdings, LLC (“the Company” or “ILGH”), a Delaware limited liability company, together with its subsidiaries, is a provider of interior finish solutions for U.S. homebuilders. The Company provides technology-enabled, interior design supply chain management and installation services for high value interior finishes and operates showrooms for homebuilders, enabling its homebuyer customers to select an array of high-value interior finishes, such as flooring, cabinetry, fixtures, countertops and other product options in a single location. In addition to the Company’s homebuilder solutions, the Company provides sourcing and installation services, both for its design center services customers and for a diverse range of multifamily, light commercial and repair & remodel customers as well as home improvement retailers. The Company indirectly, through various wholly owned subsidiaries, owns 100% of the outstanding capital of its operating subsidiaries, which include: Interior Specialists, Inc., and its wholly owned subsidiaries (“ISI”) and Installation Services Holdings, Inc., and its wholly owned subsidiaries (“ILG”).
Effective May 31, 2018 (“the Effective Date”), pursuant to a contribution agreement, 100% of the issued and outstanding equity interests of ISI held directly or indirectly by Faraday Holdings, LLC (“Faraday”), and 100% of the issued and outstanding equity interests of ILG held directly or indirectly by Installation Services Holdings, LLC (“ISH”) were exchanged for membership units in the Company. Through its ownership (directly or indirectly) of Faraday, Littlejohn & Co. (“Littlejohn”) (together with certain members of management of Faraday) own 53% of the equity interests in the Company and, an affiliate of Platinum Equity Advisors, LLC (“Platinum”) (together with certain members of management of ISH) own 47% of the equity interests of the Company. Faraday was deemed the accounting acquirer of ILG for accounting purposes and Faraday is deemed to have acquired the equity interests of ILG (such acquisition, “the ILG Acquisition”). The ILG Acquisition was accounted for as a business combination and a capital transaction with respect to ISI. The 2018 financial statements include the combined operations of ISI and ILG after the completion of the ILG Acquisition. The 2017 financial statements include the operations of ISI since such period is prior to the ILG Acquisition. The historical unit equity account of ISI has been retrospectively adjusted to reflect the one to .47 exchange of equity interests in the ILG Acquisition. See Note 5 for further discussion of the ILG Acquisition.
Operating segments are identified as components of an enterprise about which separate discrete financial information is available for evaluation by the chief operating decision-maker in making decisions regarding resource allocation and assessing performance. The Company’s operating segments are aggregated into a single reportable segment. Management has determined a single reportable segment is appropriate based on the uniformity of products and services and similar operating and economic characteristics.
2. Significant Accounting Policies
Basis of Presentation and Principles of Consolidation
The accompanying consolidated financial statements have been prepared in accordance with accounting principles generally accepted in the United States of America, or GAAP, and include the accounts of the Company and its wholly-owned subsidiaries. All significant intercompany transactions have been eliminated in consolidation.
Use of Estimates
The preparation of financial statements in conformity with GAAP requires that management make estimates and assumptions that affect the reported amounts of assets and liabilities and disclosure of contingent assets and
F-32
Table of Contents
INTERIOR LOGIC GROUP HOLDINGS, LLC
NOTES TO CONSOLIDATED FINANCIAL STATEMENTS (Continued)
liabilities at the date of the financial statements and the reported amounts of revenues and expenses during the reporting period. Areas that are more complex and involve a higher degree of judgment include revenue recognition, the allowance for doubtful accounts, fair value and recoverability of goodwill, intangible assets and long-lived assets, share-based compensation, the valuation allowance on deferred tax assets and certain accruals and reserves for general liability, workers’ compensation and warranties. Actual results could differ from those estimates.
Revenue recognition
On January 1, 2018, the Company adopted Accounting Standards Update (“ASU”) 2014-09, Revenue from Contracts with Customers (“Topic 606”), using the modified retrospective transition method applied to those contracts that were not completed as of January 1, 2018. The Company recorded a $0.6 million, net of $0.2 million in deferred taxes, cumulative effect adjustment as an increase to opening retained earnings on January 1, 2018 due to the impact of Topic 606, with the impact primarily related to the change in accounting for its contracts that were previously accounted for under a units-of-delivery method. The Company has determined that control for its design and installation services passes over time for the installed products, and revenue is recognized to the extent costs have been incurred until installation is complete and represents the estimated consideration the Company expects to receive for the exchange of the performance obligation. See Note 3, Revenue Recognition, for additional revenue recognition disclosures.
Cash
Substantially all cash is held in demand deposit accounts with various banks, which, at times, exceed federally insured limits. No losses have been experienced related to such amounts.
Accounts Receivable and Allowance for Doubtful Accounts
Accounts receivable are carried at the original invoice amount less payments applied, and an estimate is made for doubtful receivables based on a review of all amounts outstanding. Receivables are considered past due if any portion of the receivable is outstanding for more than thirty days. No interest on past-due amounts is charged. Management determines the allowance for doubtful accounts by regularly evaluating individual customer receivables and considering a customer’s financial condition and credit history as well as current economic conditions. Accounts receivable are written off when deemed uncollectible. Recoveries of accounts receivable previously written off are recorded when received.
The following table summarizes the allowance for doubtful accounts (in thousands):
| As of December 31, | ||||||||
| 2019 | 2018 | |||||||
| Beginning balance |
$ | 1,041 | $ | 1,341 | ||||
| Provision |
2,427 | 1,383 | ||||||
| Write-offs, net |
(668 | ) | (1,683 | ) | ||||
|
|
|
|
|
|||||
| Ending balance |
$ | 2,800 | $ | 1,041 | ||||
|
|
|
|
|
|||||
Concentration of Credit Risk
Credit risk is the risk of financial loss to the Company from non-performance of a contractual obligation on the part of the Company’s counterparty. Such risk arises principally from the Company’s receivables from customers and cash and bank balances. The Company believes it is not exposed to any significant concentrations of credit risk on its cash.
F-33
Table of Contents
INTERIOR LOGIC GROUP HOLDINGS, LLC
NOTES TO CONSOLIDATED FINANCIAL STATEMENTS (Continued)
Substantially all of the Company’s trade accounts receivables are from entities engaged in residential and commercial construction. The Company performs periodic evaluations of its customers’ financial condition. The general credit risk of the Company’s counterparties is not considered to be significant. For the years ended December 31, 2019, 2018 and 2017, no customer comprised more than 10% of revenues or trade accounts receivable.
Inventories
Inventories include materials purchased under homebuyer contracts, stock items and material supplies. Inventories are valued at net realizable value with cost determined using the first-in, first-out method. As of December 31, 2019 and 2018, the Company had $46.6 million and $46.5 million of finished goods, respectively.
Property, plant and equipment, net
Property, plant and equipment is stated at cost, less accumulated depreciation that is calculated using the straight-line method over the estimated useful lives of the related assets. Land is stated at acquired fair value and is not subject to depreciation. Improvements to leased property are stated at cost and are amortized over the lesser of the remaining lease term or the useful lives of the underlying improvements.
The following table summarizes the depreciable lives for property, plant and equipment, net (in years):
| Building |
45 | |
| Software |
2-7 | |
| Furniture and fixtures |
7 | |
| Machinery and equipment |
5-10 | |
| Vehicles |
4 | |
| Computer equipment |
3 |
Fair Value Measurements
The accounting guidance for fair value measurements and disclosures emphasizes that fair value is a market-based measurement, not an entity-specific measurement. Therefore, a fair value measurement should be determined based on the assumptions that market participants would use in pricing the asset or liability. As a basis for considering market participant assumptions in fair value measurements, the guidance establishes a fair value hierarchy that distinguishes between market participant assumptions based on market data obtained from sources independent of the reporting entity (observable inputs that are classified within Levels I and II of the hierarchy) and the reporting entity’s own assumptions about market participant assumptions (unobservable inputs classified within Level III of the hierarchy).
Hierarchical levels directly related to the amount of subjectivity associated with the inputs to fair value are as follows:
Level I—Observable inputs are unadjusted, quoted prices in active markets for identical equity instruments at the measurement date.
Level II—Inputs (other than quoted prices included in Level I) are either directly or indirectly observable for the instrument through correlation with market data at the measurement date.
Level III—Inputs are unobservable (such as a company’s own data) and used to measure fair value, to the extent that observable inputs are not available.
F-34
Table of Contents
INTERIOR LOGIC GROUP HOLDINGS, LLC
NOTES TO CONSOLIDATED FINANCIAL STATEMENTS—(Continued)
The level of the fair value hierarchy in which the fair value measurement falls is determined by the lowest level input that is significant to the fair value measurement.
With respect to the Company’s cash, accounts receivable, prepaid expense, rebates, accounts payable and accrued liabilities, carrying value approximates fair value due to the short maturity of these instruments. As it relates to the Company’s revolving line of credit and term loan facility (see Note 7), the carrying value is considered to approximate fair value as the interest rate approximates current market rates. The carrying amounts of the Company’s operating lease right-of-use assets and the obligations associated with its operating and finance leases approximate fair value as of December 31, 2019 and 2018. All debt classifications represent level II fair value measurements.
The fair value of the Company’s interest rate swap agreements were determined using level II inputs.
Intangible Assets, net
Intangible assets include the Company’s trade names, customer relationships and noncompete agreements. Amortization of intangible assets with definite lives is recognized on a straight-line basis over the respective lives of the asset or on an accelerated basis that reflects the economic benefit when there is a pattern of declining cash flows that is reliably determinable (generally one to nineteen years). The Company assesses the definite lived intangibles for impairment whenever events or circumstances indicate that their carrying amount may not be recoverable. An intangible impairment is recorded when the undiscounted cash flows generated from the definite lived intangible asset are less than the asset’s carrying value. The impairment loss is the difference between the discounted cash flows generated from the asset, which approximates fair value and the asset’s carrying amount. Based on the results of the Company’s qualitative assessment, no impairment charges were recorded related to the Company’s definite lived intangible assets during the years ended December 31, 2019, 2018 and 2017.
Indefinite lived trade names are tested annually for impairment or whenever there is evidence that events or changes in circumstances indicate an impairment condition may exist, by comparing the carrying value and fair value of the trade name to determine the amount, if any, of impairment. In performing its annual assessment, management first evaluates qualitative factors to determine whether a potential impairment has occurred. If the qualitative assessment indicates a potential impairment, the fair value of trade names is calculated using a “relief from royalty payments” methodology. This approach involves two steps: (i) estimating royalty rates for each trade name and (ii) applying these royalty rates to a net sales stream and discounting the resulting cash flows to determine fair value. If an intangible asset that is not being amortized is determined to have a definite useful life, the asset will be amortized prospectively over the estimated remaining useful life and accounted for in the same manner as intangible assets subject to amortization. There was no impairment recorded in 2017 related to the trade names. In connection with its rebranding resulting from the ILG Acquisition, the Company recognized an impairment charge of $10.0 million during the year ended December 31, 2018 because it had abandoned one of its trade names. In addition, the Company performed an impairment assessment of its remaining trade names by comparing the carrying value to the remaining discounted cash flows and determined there were no quantitative indicators of impairment. The Company also reassessed the useful life of its remaining trade names and determined certain of them to no longer be indefinite lived. Accordingly, effective as of the ILG Acquisition date, the Company will amortize the trade name prospectively over its estimated useful life. Based on results of the Company’s assessment, no impairment of intangible assets was recorded during the year ended December 31, 2019.
Goodwill
Goodwill results from business combinations and represents the excess of the purchase price over the fair value of acquired tangible assets and liabilities and identifiable intangible assets. The allocation of purchase price for acquisitions requires the use of accounting estimates and judgments to allocate the purchase price to the
F-35
Table of Contents
INTERIOR LOGIC GROUP HOLDINGS, LLC
NOTES TO CONSOLIDATED FINANCIAL STATEMENTS—(Continued)
tangible assets and liabilities and identifiable intangible assets based on their respective fair values. Goodwill is deemed to have an indefinite life and, therefore, is not amortized.
Annually, in the fourth quarter of each year, or if conditions indicate an earlier review is necessary, the Company assesses qualitative factors to determine if it is more likely than not the fair value of a reporting unit is less than its carrying amount and if it is necessary to perform the quantitative two-step goodwill impairment test. If the Company performs the quantitative test, the Company compares the carrying value of the reporting unit to the reporting unit’s fair value to identify potential impairment. The estimate of the reporting unit’s fair value is determined by using a market approach using current industry information classified as unobservable inputs (Level 3 inputs). In determining the estimated future cash flow, the Company considers and applies certain estimates and judgments, including the current and projected future levels of income based on management’s plans, business trends, prospects, and market and economic conditions and market-participant considerations. If the estimated fair value of the reporting unit is less than the carrying value, a second step is performed to measure goodwill impairment. Based on the results of the Company’s qualitative assessment, no impairment of goodwill was recorded in the years ended December 31, 2019, 2018 and 2017.
The following table summarizes the changes in the carrying amount of the Company’s goodwill (in thousands):
| As of December 31, | ||||||||
| 2019 | 2018 | |||||||
| Beginning balance |
$ | 249,849 | $ | 72,273 | ||||
| Goodwill acquired (Note 5) |
2,145 | 177,170 | ||||||
| Measurement period adjustments related to initial fair value of assets acquired and liabilities assumed |
1,243 | 406 | ||||||
| Adjustments related to deferred tax liabilities |
740 | — | ||||||
|
|
|
|
|
|||||
| Ending balance |
$ | 253,977 | $ | 249,849 | ||||
|
|
|
|
|
|||||
Impairment of Long-lived Assets
The Company reviews its depreciating long-lived assets when there is evidence that events or changes in circumstances indicate that their carrying values may not be recoverable. An impairment loss may be required to be recognized when the undiscounted cash flows expected to be generated by a long-lived asset (or group of such assets) are less than its carrying value. Any required impairment loss would be measured as the amount by which the asset’s carrying value exceeds its fair value and would be recorded as a reduction in the carrying value of the related asset and charged to results of operations. There was no impairment of long-lived assets recorded by the Company in the years ended December 31, 2019, 2018 and 2017.
Derivative Instruments and Hedging Activities
Interest Rate Swap Agreement
The Company entered into an interest rate swap agreement with respect to its Term Loan Facility, as defined in Note 7, during the year ended December 31, 2019 to offset the variability of the periodic cash flows associated with variable interest payments. This interest rate swap agreement expires in December 2022. As of December 31, 2019, the interest rate swap of $0.4 million was recorded net of tax at fair value in deposits and other assets in the accompanying consolidated balance sheets. Since the derivative was designated as a cash flow hedge and the hedging relationship qualified for hedge accounting, under the authoritative guidance, the effective portion of the change in fair value of the derivative was recorded in other comprehensive income. The entire change in the fair value was considered effective during the year ended December 31, 2019.
F-36
Table of Contents
INTERIOR LOGIC GROUP HOLDINGS, LLC
NOTES TO CONSOLIDATED FINANCIAL STATEMENTS—(Continued)
Interest Rate Cap Agreement
During the year ended December 31, 2017, the Company entered into an interest rate cap agreement with respect to its Prior Term Loan Facility, as defined in Note 7, to manage its exposure to interest rate changes by achieving a desired proportion of fixed rate versus variable rate debt. This interest rate cap agreement expired in October 2019. As of December 31, 2018, the interest rate cap of $45 thousand was recorded at fair value in deposits and other assets in the accompanying consolidated balance sheets. During the year ended December 31, 2018, the Company’s Prior Term Loan Facility was paid off in conjunction with the ILG Acquisition. Prior to the payoff of the Prior Term Loan Facility, the derivative was designated as a cash flow hedge and the hedging relationship qualified for hedge accounting under the authoritative guidance. The effective portion of the change in fair value of the derivative was recorded in other comprehensive loss. Subsequent to the payoff of the Prior Term Loan Facility, since the underlying debt instrument no longer existed, the Company no longer qualified for hedge accounting. As a result, the unrealized loss recorded in accumulated other comprehensive loss was reclassified to interest expense and all further changes in fair value of the interest rate cap were recorded to interest expense in the accompanying consolidated statements of comprehensive loss.
Debt Issuance Costs
Debt issuance costs related to the Company’s credit facilities are amortized and recognized as interest expense using the straight-line method, which does not differ materially from the effective-interest method, over the expected term of the related debt instrument. Unamortized debt issuance costs related to the Term Loan Facility are recorded as a reduction of the respective debt balances, in the accompanying consolidated balance sheets. Unamortized debt issuance costs that are related to the Revolving Credit Facility, as discussed in Note 7, are presented as other current assets if the balance is zero at December 31. As of December 31, 2019, 2018 and 2017, the Company had $9.6 million, $11.4 million and $2.5 million of unamortized debt issuance costs, respectively.
Amortization related to debt issuance costs was $1.8 million, $1.4 million and $0.7 million for the years ended December 31, 2019, 2018 and 2017, respectively.
Share-Based Compensation
The Company has share-based compensation plans for certain employees of the Company. Under the plans, each share-based award is measured at fair value as of the grant date with compensation expense recognized ratably over the vesting period. Expense associated with awards that contain a performance condition is not recognized until the event becomes probable, at which point the expense is recorded over the remaining service period after the point when the achievement of the milestone is probable or the performance condition has been achieved. Compensation expense is recorded in selling, general and administrative expenses in the accompanying consolidated statements of comprehensive loss.
Commission Expense
Commissions are expensed as incurred and included in cost of revenues in the accompanying consolidated statements of comprehensive loss. Commission expense was approximately $24.2 million, $19.4 million and $11.7 million for the years ended December 31, 2019, 2018 and 2017, respectively.
Income Taxes
The Company accounts for income taxes using the asset and liability method. Under this method, the amount of taxes currently payable or refundable are accrued, and deferred tax assets and liabilities are recognized for the estimated future tax consequences of temporary differences that exist between the tax basis and financial reporting basis of the Company’s assets and liabilities.
F-37
Table of Contents
INTERIOR LOGIC GROUP HOLDINGS, LLC
NOTES TO CONSOLIDATED FINANCIAL STATEMENTS—(Continued)
Valuation allowances are established against deferred tax assets when it is more likely than not that the realization of those deferred tax assets will not occur. In evaluating the Company’s ability to recover deferred tax assets within the jurisdiction from which they arise, both positive and negative evidence is considered as well as sources of taxable income, including income in carryback years, future reversals of existing taxable temporary differences, tax planning strategies and projected taxable income from future operations. In projecting future taxable income, the Company begins with historical results adjusted for the results of discontinued operations and changes in accounting policies and incorporates assumptions, including the amount of future federal and state pretax operating income, the reversal of temporary differences and the implementation of feasible and prudent tax planning strategies.
Deferred tax assets and liabilities are measured using the enacted tax rates in effect in the years when those temporary differences are expected to reverse. The effect on deferred taxes from a change in tax rate is recognized through continuing operations in the period that includes the enactment date of the change.
A tax benefit from an uncertain tax position may be recognized when it is more likely than not that the position will be sustained upon examination, including resolutions of any related appeals or litigation based on its technical merits. The Company recognizes tax liabilities for uncertain tax positions and adjusts these liabilities when its judgments change as a result of the evaluation of any new information.
The Company’s income tax expense, deferred tax assets and liabilities and allowances for unrecognized tax benefits reflect management’s best assessment of estimated future taxes to be paid. The Company is subject to income taxes in the United States which includes numerous state and local jurisdictions. Significant judgments and estimates are required in determining income tax expense.
Recently Issued Accounting Pronouncements
In June 2016, the FASB issued ASU 2016-13, Financial Instruments—Credit Losses (Topic 326), which amends the accounting for credit losses on available-for-sale securities and purchased financial assets with credit deterioration. In addition, these amendments require the measurement of all expected credit losses for financial assets, including trade accounts receivable, held at the reporting date based on historical experience, current conditions and reasonable and supportable facts. The ASU is effective for fiscal years beginning after December 15, 2019, including interim periods therein. Early adoption is permitted. The Company is currently evaluating whether the adoption of this ASU will have a material impact on its consolidated financial statements.
In January 2017, the FASB issued ASU 2017-04, Intangibles—Goodwill and Other (Topic 350): Simplifying the Test for Goodwill Impairment, which simplifies the process used to test for goodwill. Under the new standard, if the carrying amount of a reporting unit exceeds its fair value, an impairment loss shall be recognized in an amount equal to that excess, limited to the total amount of goodwill allocated to that reporting unit, therefore eliminating Step 2 of the goodwill impairment test. The ASU is effective for annual impairment tests for periods beginning after December 15, 2019. Early adoption is permitted. The Company does not believe the adoption of this ASU will have a material impact on its consolidated financial statements.
In August 2018, the FASB issued ASU 2018-13, Fair Value Measurement (Topic 820): Disclosure Framework—Changes to the Disclosure Requirements for Fair Value Measurement, which eliminates, adds, and modifies certain disclosure requirements for fair value measurements. ASU 2018-13 is effective for fiscal years, and interims periods within those years, beginning after December 15, 2019. Early adoption is permitted. The Company is currently evaluating whether the adoption of this ASU will have a material impact on its consolidated financial statements.
F-38
Table of Contents
INTERIOR LOGIC GROUP HOLDINGS, LLC
NOTES TO CONSOLIDATED FINANCIAL STATEMENTS—(Continued)
Recently Adopted Accounting Pronouncements
In February 2016, the Financial Accounting Standards Board, “FASB” issued Accounting Standards Update, “ASU” 2016-02, Leases (Topic 842) which was further modified in ASU 2018-10, Codification Improvements to Topic 842, Leases and ASU 2018-11, Leases (Topic 842) Targeted Improvements to clarify implementation guidance. The guidance requires a lessee to recognize assets and liabilities on the balance sheet for leases with lease terms greater than 12 months. The new standard is effective for fiscal years beginning on January 1, 2019. The Company adopted Topic 842 using a modified retrospective approach by recognizing a cumulative-effect adjustment to retained earnings. As of the effective date, January 1, 2019, the Company recognized total ROU assets of $68.2 million and $0.3 million related to operating and finance leases respectively. The Company also recognized total lease liabilities of $70.7 million and $0.3 million related to operating and finance leases respectively. The adoption of this standard did not have a material impact on its consolidated statements of comprehensive loss and consolidated statements of cash flows. As of December 31, 2019, future minimum lease payments under operating and finance leases were approximately $67.9 million and $0.8 million, respectively.
In January 2016, the FASB issued ASU 2016-01, Financial Instruments—Overall: Recognition and Measurement of Financial Assets and Financial Liabilities. ASU 2016-01 modifies how entities measure equity investments and present changes in the fair value of financial liabilities. Under the new guidance, entities have to measure equity investments that do not result in consolidation and are not accounted for under the equity method at fair value and recognize any changes in fair value in net income unless the investments qualify for the new practicality exception. A practicality exception will apply to those equity investments that do not have a readily determinable fair value and do not qualify for the practical expedient to estimate fair value under ASC 820, Fair Value Measurements, and as such, these investments may be measured at cost. ASU 2016-01 was effective for fiscal years beginning after December 15, 2018, and interim periods within fiscal years beginning after December 15, 2019. The Company adopted this standard on January 1, 2019 and it did not have a material effect on its financial statements.
In August 2017, the FASB issued ASU 2017-12, Derivative and Hedging (Topic 815): Targeted Improvement to Accounting for Hedging Activities, which amends the current hedge accounting model. The new standard eliminates the requirement to separately measure and report hedge ineffectiveness and generally requires the entire change in the fair value of a hedging instrument to be presented in the same income statement line as the hedged item. The change in fair value for qualifying cash flow and net investment hedges is included in other comprehensive loss until they are reclassified into the income statement. The standard also eased certain documentation and assessment requirements and modified the accounting for components excluded from the assessment of hedge effectiveness. The Company adopted this standard as of January 1, 2019 and it did not have a material effect on its financial statements.
In August 2018, the FASB issued ASU 2018-15, Intangibles—Goodwill and Other—Internal Use Software (Subtopic 350-40): Customer’s Accounting for Implementation Costs Incurred in a Cloud Computing Arrangement That is a Service Contract (a Consensus of the FASB Emerging Issues Task Force), which amended the existing accounting standards for capitalizing implementation costs of internal-use software by including service contracts in a cloud computing arrangement. This update is effective for financial statements issued for fiscal years beginning after December 15, 2019 and interim periods therein, with early adoption permitted. The Company elected to early adopt this ASU using the prospective method as of December 31, 2018. The adoption of this standard did not have a material impact on the accompanying consolidated financial statements.
In December 2019, the FASB issued ASU 2019-12, Income Taxes (Topic 740): Simplifying the Accounting for Income Taxes, which is intended to simplify various aspects related to accounting for income taxes. The new standard removes certain exceptions to the general principles in Topic 740 and also clarifies and amends existing
F-39
Table of Contents
INTERIOR LOGIC GROUP HOLDINGS, LLC
NOTES TO CONSOLIDATED FINANCIAL STATEMENTS—(Continued)
guidance to improve consistent application. This guidance is effective for fiscal years, and interim periods within those fiscal years, beginning after December 15, 2020, with early adoption permitted. The Company adopted the standard on January 1, 2019, and the adoption of the standard did not have a material impact on its consolidated financial statements.
3. Revenue Recognition
The Company has determined that its single performance obligation for contracts with customers is the combination of its sale and installation of products along with the associated design center services. Revenue is recognized over time as services are performed and beginning when transfer of control occurs as products are delivered to the Company’s customer and subsequently installed, which on average spans a period from one week up to six weeks depending on the type and extent of the interior products that are installed. Using a cost-to-cost input method, the Company recognizes revenue to the extent costs have been incurred over the installation period until it is complete, as the Company believes this represents the best measure of when goods and services are transferred to the customer.
During the performance of its contracts, there may instances when the delivery of goods and the start of installation of such goods may have a time lag and the customer may obtain control of some of the goods (uninstalled materials) before the Company has completed its installation services. As of the end of a reporting date, when the uninstalled materials are concluded to have significant cost relative to the contract and the materials were specifically purchased for the installation services for the customer, the Company recognizes revenue at an amount equal to the cost of the uninstalled materials for which control has transferred to the customer as of period end.
The Company offers assurance-type warranties on certain of its installed products and services that do not represent a separate performance obligation and, as such, do not impact the timing or extent of revenue recognition. The Company elected to exclude sales tax assessed by a government authority from the estimate of the transaction price within its customer’s contracts. The consideration within contracts with customers is typically a fixed amount specified in a purchase order. Because materials are ordered and installed per customer instructions based on unique selections by a homebuyer, who is the customer of the Company’s customer, variable consideration and obligations for returns are insignificant. Once installation is completed, the Company is entitled to payment which is generally due within 30 days of an invoice being issued to the customer.
The Company did not disclose the amount of unsatisfied performance obligations as of December 31, 2019 and 2018 because these performance obligations are part of contracts that have an original expected duration of one year or less. These unsatisfied performance obligations relate to incomplete product installations.
The Company accounts for a contract when it has approval and commitment from both parties, the rights of the parties are identified, payment terms are identified, the contract has commercial substance and collectability of consideration is probable.
The Company provides similar products and services based on the similarity in the installation methods and similarity in types of customers being homebuilders, multifamily developers or multi-unit property managers. The table below provides disaggregated revenues from contracts by type of customer because the Company believes it best depicts how timing of revenue and cash flows are affected by economic factors (in thousands):
| Year Ended December 31, | ||||||||||||
| 2019 | 2018 | 2017 | ||||||||||
| Homebuilder customers |
$ | 1,427,656 | $ | 1,165,302 | 777,756 | |||||||
| Multifamily, commercial and repair and remodel customers |
357,732 | 240,023 | 74,162 | |||||||||
|
|
|
|
|
|
|
|||||||
| Total revenues |
$ | 1,785,388 | $ | 1,405,325 | $ | 851,918 | ||||||
|
|
|
|
|
|
|
|||||||
F-40
Table of Contents
INTERIOR LOGIC GROUP HOLDINGS, LLC
NOTES TO CONSOLIDATED FINANCIAL STATEMENTS—(Continued)
As the cost and installation time by product type can vary, which determines the amount of revenue and time period over which revenue is recognized, the Company believes disaggregated revenues by product type also depicts how timing of revenue and cash flows are affected by economic factors. Disaggregated revenues by product type are as follows (in thousands):
| Year Ended December 31, | ||||||||||||||||
| 2019 | 2018 | |||||||||||||||
| Flooring |
$ | 1,329,098 | 74 | % | $ | 1,043,873 | 74 | % | ||||||||
| Countertops |
229,867 | 13 | % | 186,720 | 13 | % | ||||||||||
| Cabinets |
146,349 | 8 | % | 110,070 | 8 | % | ||||||||||
| Window treatments |
16,801 | 1 | % | 14,665 | 1 | % | ||||||||||
| Other |
63,273 | 4 | % | 49,997 | 4 | % | ||||||||||
|
|
|
|
|
|||||||||||||
| Total revenues |
$ | 1,785,388 | $ | 1,405,325 | ||||||||||||
Contract Assets and Liabilities
The Company’s contract assets consist of unbilled amounts typically resulting from installations where revenue recognized exceeds amounts billed to customers due to the contractual terms and timing of when the Company can bill the customer. The Company’s contract liabilities represent payments received by customers for performance obligations that have not been billed per the contract terms. The Company’s contract assets of $38.8 million and $41.0 million and contract liabilities of $26.5 million and $19.6 million are recorded in other current assets and other current liabilities, respectively, in the accompanying consolidated balance sheets for the years ended December 31, 2019 and 2018, respectively. During the years ended December 31, 2019 and 2018, the Company acquired $0.1 million and $9.1 million of contract assets and $30 thousand and $2.7 million of contract liabilities, respectively, as part of the 2019 and 2018 acquisitions (See Note 5).
During the years ended December 31, 2019 and 2018, the Company recognized $19.6 million and $6.0 million, respectively, of revenue that was included in the contract liability as of December 31, 2018 and 2017, respectively. The Company did not recognize any impairment losses on its contract assets during the years ended December 31, 2019 and 2018.
F-41
Table of Contents
INTERIOR LOGIC GROUP HOLDINGS, LLC
NOTES TO CONSOLIDATED FINANCIAL STATEMENTS—(Continued)
4. Supplementary Financial Information
Supplemental balance sheet information (in thousands):
| As of December 31, | ||||||||
| 2019 | 2018 | |||||||
| Property, plant and equipment, net(1): |
||||||||
| Leasehold improvements |
$ | 25,245 | $ | 23,262 | ||||
| Machinery and equipment |
16,520 | 13,489 | ||||||
| Software |
12,591 | 12,591 | ||||||
| Building and building improvements |
10,141 | 10,029 | ||||||
| Vehicles(2) |
8,311 | 6,893 | ||||||
| Computer equipment |
7,593 | 5,387 | ||||||
| Furniture and fixtures |
5,672 | 4,848 | ||||||
| Land |
2,150 | 2,150 | ||||||
| Construction-in-progress(3) |
1,741 | 2,061 | ||||||
|
|
|
|
|
|||||
| 89,964 | 80,710 | |||||||
| Less accumulated depreciation |
(36,276 | ) | (22,709 | ) | ||||
|
|
|
|
|
|||||
| $ | 53,688 | $ | 58,001 | |||||
|
|
|
|
|
|||||
| Accounts payable and accrued expenses: |
||||||||
| Accounts payable |
$ | 58,486 | $ | 70,627 | ||||
| Accrued wages and commissions |
27,132 | 21,635 | ||||||
| Accrued purchases |
23,980 | 14,838 | ||||||
| Accrued expenses |
18,320 | 16,159 | ||||||
| Accrued subcontractor labor |
11,570 | 13,209 | ||||||
| Accrued warranty reserve |
5,917 | 5,982 | ||||||
| Accrued taxes |
5,849 | 8,242 | ||||||
| Accrued insurance |
1,782 | 2,626 | ||||||
| Current portion of restructuring accrual |
200 | 324 | ||||||
| Accrued interest |
240 | 203 | ||||||
| Other |
74 | 1,077 | ||||||
|
|
|
|
|
|||||
| $ | 153,550 | $ | 154,922 | |||||
|
|
|
|
|
|||||
| (1) | The Company recorded depreciation expense of approximately $15.4 million, $11.8 million and $5.0 million for the years ended December 31, 2019, 2018 and 2017, respectively. |
| (2) | As of both December 31, 2019 and 2018, approximately $0.8 million and $0.3 million of assets were held under capital lease arrangements, respectively. Accumulated depreciation related to these assets totaled $0.2 million and $87 thousand at December 31, 2019 and 2018, respectively. |
| (3) | Construction-in-progress represents assets in development. Once the asset is placed in service, it is transferred to the appropriate property, plant and equipment category and depreciation commences. |
5. Acquisitions and Other Transactions
ILG Acquisition in the Year Ended December 31, 2018
The ILG Acquisition was accounted for under the acquisition method of accounting as prescribed by ASC 805, Business Combinations (“ASC 805”). Due to the Company not having assets, liabilities, or operations prior to the acquisition and since the Company was created for the sole purpose of completing the merger of ISI and
F-42
Table of Contents
INTERIOR LOGIC GROUP HOLDINGS, LLC
NOTES TO CONSOLIDATED FINANCIAL STATEMENTS—(Continued)
ILG, ISI was deemed the accounting acquirer. ILG was deemed the acquired entity to which the fair value of the acquired assets and liabilities was applied. The ILG Acquisition increased the Company’s scale, geographic diversification, and product offerings. The fair value of the consideration transferred as of the Effective Date of the ILG Acquisition was approximately $245.4 million. As discussed in Note 1, the consideration transferred was the fair value of equity issued in exchange for the outstanding capital of ILG as of the Effective Date. The fair value of the consideration transferred was determined based upon the estimated enterprise value of the Company as of the Effective Date and the associated interest received in the Company upon exchange of the equity instruments.
The acquisition method of accounting requires, among other things, that identifiable assets and liabilities assumed be recognized on the balance sheet at fair value as of the acquisition date. In determining the fair value, the Company utilized various forms of the income, cost, and market approaches depending on the asset or liability being valued. The estimation of fair value required significant judgments related to future net cash flows, discounts rates reflecting the risk inherent in each cash flow stream, competitive trends, market comparables, and other factors. Inputs were generally determined by taking into account historical data, supplemented by current and anticipated market conditions, and growth rates.
The following table summarizes the consideration transferred and the amount of identified net assets acquired and liabilities assumed based on fair value as of the ILG Acquisition date (in thousands):
| Fair value of consideration transferred: |
$ | 245,355 | ||
| Fair value of assets and liabilities acquired: |
||||
| Cash |
$ | 18,386 | ||
| Accounts receivable |
52,199 | |||
| Other receivables |
9,524 | |||
| Inventory |
18,607 | |||
| Property, plant, and equipment |
15,028 | |||
| Customer relationships |
281,200 | |||
| Noncompetition agreements |
19,200 | |||
| Tradenames |
35,100 | |||
| Prepaid expenses |
4,380 | |||
| Other assets |
11,247 | |||
|
|
|
|||
| Total acquired assets |
464,871 | |||
|
|
|
|||
| Accounts payable and accrued expenses |
56,414 | |||
| Line of credit |
20,941 | |||
| Long-term debt |
242,250 | |||
| Deferred tax liability |
58,399 | |||
| Other long-term liabilities |
7,551 | |||
|
|
|
|||
| Total liabilities assumed |
385,555 | |||
|
|
|
|||
| Fair value of net assets acquired |
79,316 | |||
|
|
|
|||
| Goodwill |
$ | 166,039 | ||
|
|
|
|||
The excess of the consideration transferred over the fair value of net assets acquired was recorded as goodwill. The fair value assigned to goodwill is primarily attributable to synergies expected to arise after the ILG Acquisition. Of the goodwill acquired, $81.7 million is expected to be deductible for income tax purposes. The weighted average life of acquired intangible assets is 17.1 years.
F-43
Table of Contents
INTERIOR LOGIC GROUP HOLDINGS, LLC
NOTES TO CONSOLIDATED FINANCIAL STATEMENTS—(Continued)
The Company estimated the fair value of customer relationships based on projected cash flows anticipated to arise from the customer relationships. The projected cash flows were discounted to determine the fair value of the assets at the date of the acquisition. The determination of the fair value of the intangible assets acquired required the use of significant judgment with regard to (i) assumptions in the discounted cash flow model used and (ii) determination of the useful lives of customer relationships.
Other Acquisitions in Years Ended December 31, 2019 and 2018
As part of the Company’s ongoing strategy to expand its countertop fabrication, cabinet, flooring, cabinet supply, and installations services, the Company completed two asset acquisitions during the year ended December 31, 2019 and three asset acquisitions during the year ended December 31, 2018. These acquisitions included the inputs and processes capable of producing a return to its owners and were therefore accounted for as business combinations. The goodwill recognized in conjunction with these business combinations represents the excess cost of the acquired entity over the net amount allocated to the net assets acquired and liabilities assumed. The Company expects to deduct $2.1 million and $11.1 million of goodwill for tax purposes as a result of the net assets purchased during the years ended December 31, 2019 and 2018, respectively.
The assets of Flooring Systems, Inc. (“Flooring Systems”) and the assets of Mike’s Flooring Companies, Inc., (“Mike’s Flooring”) were acquired during the year ended December 31, 2019. The assets of Chris and Dick’s Cabinets and Countertops LLC (“C&D”), Sterling Purchasing Corp (“Sterling”), and Coleman Floor, LLC (“Coleman”) were acquired during the year ended December 31, 2018.
Cash paid for the other acquisitions during the years ended December 31, 2019 (in thousands):
| Acquisition Name |
Acquisition Date | Cash Purchase Price | ||||||
| Flooring Systems, Inc.(1) |
August 1, 2019 | $ | 3,338 | |||||
| Mike’s Flooring Companies, Inc.(2) |
September 1, 2019 | 9,048 | ||||||
|
|
|
|||||||
| $ | 12,386 | |||||||
|
|
|
|||||||
| (1) | Upon closing, cash of $1.0 million of the transaction consideration was placed in escrow in accordance with the terms of the acquisition agreement to provide for contingencies related to the acquisition that could arise subsequent to the closing date. The $1.0 million, less any deductions made in accordance with the asset purchase agreement, will be released to the sellers of Flooring Systems within the 15 months following the closing of the purchase. |
Additionally, a performance contingency was established in the asset purchase agreement to measure the business’s performance for 12 months after the acquisition date. If certain targets are met, the Company could be responsible to pay the sellers of Flooring Systems up to $2.5 million, and this contingency was determined to be compensatory in nature. However, based on its assessment of the probability of the contingency as of December 31, 2019, the Company does not deem it probable that the contingent payment will be made. As such, the Company has not recorded compensation expense associated with the contingent payment during the year ended December 31, 2019.
| (2) | Upon closing, cash of $0.4 million of the transaction consideration was retained by the Company in accordance with the terms of the acquisition agreement to provide for an audit that was ongoing related to pre-acquisition activities that could require satisfaction. Subsequent to December 31, 2019, the audit was concluded and a portion of the funds were used to satisfy amounts identified and the audit and the remaining amounts were remitted to the sellers of Mike’s Flooring Companies. |
F-44
Table of Contents
INTERIOR LOGIC GROUP HOLDINGS, LLC
NOTES TO CONSOLIDATED FINANCIAL STATEMENTS—(Continued)
Additionally, a performance contingency was established in the asset purchase agreement to measure the business’s performance for the year ended December 31, 2020. If certain targets are met, the Company could be responsible to pay the sellers of Mike’s Flooring Company up to $1.9 million, and this contingency was determined to be compensatory in nature. Based on certain quantitative and qualitative factors, the Company has estimated it will pay $1.9 million related to this contingency. During the year ended December 31, 2019, the Company has recorded $0.4 million of compensation expense related to this contingency.
The following table summarizes the amounts of identified assets acquired and liabilities assumed based on the estimated fair value at the purchase date, as well as total purchase price paid (in thousands):
| Estimated fair values: |
Flooring Systems |
Mike’s Flooring |
Total | |||||||||
| Current assets |
$ | 1,103 | $ | 4,034 | $ | 5,137 | ||||||
| Property and equipment |
195 | 114 | 309 | |||||||||
| Other assets |
47 | 126 | 173 | |||||||||
| Customer relationships |
3,500 | 6,400 | 9,900 | |||||||||
| Goodwill |
— | 1,795 | 1,795 | |||||||||
| Current liabilities |
(1,486 | ) | (3,421 | ) | (4,907 | ) | ||||||
| Long-term liabilities |
(21 | ) | — | (21 | ) | |||||||
|
|
|
|
|
|
|
|||||||
| Cash paid |
$ | 3,338 | $ | 9,048 | $ | 12,386 | ||||||
|
|
|
|
|
|
|
|||||||
Cash paid for the other acquisitions during the years ended December 31, 2018 (in thousands):
| Acquisition Name |
Acquisition Date | Cash Purchase Price | ||||||
| Chris & Dick’s Cabinet and Countertops, LLC(1) |
May 1, 2018 | $ | 16,017 | |||||
| Sterling Purchasing Corporation(2) |
July 1, 2018 | 14,130 | ||||||
| Coleman Flooring, LLC |
November 1, 2018 | 7,759 | ||||||
|
|
|
|||||||
| $ | 37,906 | |||||||
|
|
|
|||||||
| (1) | Upon closing, cash of $1.5 million of the transaction consideration was retained by the Company in accordance with the terms of the acquisition agreement to provide for contingencies related to the acquisition that could arise subsequent to the closing date. Subsequent to the closing date, the Company and the sellers of C&D agreed to a $0.6 million net working capital deficit, thereby decreasing the Company’s purchase price and which will be withheld from the final holdback payment. The $0.9 million remaining holdback, less deductions made in accordance with the asset purchase agreement, was released to the sellers of C&D in May 2019. |
| (2) | Upon closing, cash of $1.9 million of the transaction consideration was placed in escrow in accordance with the terms of the acquisition agreement to provide for contingencies related to the acquisition that could arise subsequent to the closing date. The $1.9 million, less deductions made in accordance with the asset purchase agreement, was released to the sellers of Sterling within the 18 months following the closing of the purchase. |
F-45
Table of Contents
INTERIOR LOGIC GROUP HOLDINGS, LLC
NOTES TO CONSOLIDATED FINANCIAL STATEMENTS—(Continued)
The following table summarizes the amounts of identified assets acquired and liabilities assumed based on the estimated fair value at the purchase date, as well as total purchase price paid (in thousands):
| Estimated fair values: |
C&D | Sterling | Coleman | Total | ||||||||||||
| Current assets |
$ | 2,050 | $ | 4,480 | $ | 6,965 | $ | 13,495 | ||||||||
| Property and equipment |
1,809 | 1,928 | 527 | 4,264 | ||||||||||||
| Customer relationships |
6,300 | 4,400 | 2,200 | 12,900 | ||||||||||||
| Trade names |
1,200 | 1,150 | 100 | 2,450 | ||||||||||||
| Noncompetition agreements |
— | 200 | 100 | 300 | ||||||||||||
| Goodwill |
6,310 | 3,993 | 828 | 11,131 | ||||||||||||
| Current liabilities |
(1,652 | ) | (2,021 | ) | (2,961 | ) | (6,634 | ) | ||||||||
|
|
|
|
|
|
|
|
|
|||||||||
| Cash paid |
$ | 16,017 | $ | 14,130 | $ | 7,759 | $ | 37,906 | ||||||||
|
|
|
|
|
|
|
|
|
|||||||||
The Company estimated the fair value of customer relationships based on projected cash flows anticipated to arise from the customer relationships. The projected cash flows were discounted to determine the fair value of the assets at the date of acquisition. The determination of the fair value of the intangible assets acquired required the use of significant judgment with regard to (i) assumptions in the discounted cash flow model used and (ii) determination of the useful lives of customer relationships.
During the year ended December 31, 2019, the Company recorded $1.2 million in measurement period adjustments related to certain accruals that were not known at the time of the opening balance sheet date and that would have otherwise been charges to income during the post-acquisition period.
Acquisition Costs
The Company recognized approximately $1.6 million and $7.3 million of acquisition related costs for the years ended December 31, 2019 and 2018, respectively. The costs, which were expensed as incurred, were included within selling, general, and administrative expense in the accompanying consolidated statements of comprehensive loss.
Corporate Restructure
During the years ended December 31, 2019 and 2018, the Company restructured operations to integrate the acquisition of subsidiaries and align the resources of the Company that includes the consolidation of facilities resulting in early lease terminations in various states and a reduction in force. In connection with the restructuring, the Company recorded charges to selling, general and administrative expenses on the accompanying consolidated statements of comprehensive loss to recognize the costs of exiting leased equipment and facilities and for termination benefits due to work force reductions. The restructuring liability is included in other current and other long-term liabilities in the accompanying consolidated balance sheet and is reduced as rent, other direct costs and employee termination benefits are paid.
F-46
Table of Contents
INTERIOR LOGIC GROUP HOLDINGS, LLC
NOTES TO CONSOLIDATED FINANCIAL STATEMENTS—(Continued)
Restructuring accrual activity for the years ended December 31, 2019 and 2018 was as follows (in thousands):
| Total | ||||
| Balance, as of December 31, 2017 |
$ | 1,439 | ||
| Accruals |
1,534 | |||
| Payments |
(1,873 | ) | ||
|
|
|
|||
| Balance, as of December 31, 2018 |
$ | 1,100 | ||
|
|
|
|||
| January 1, 2019 ASC 842 transition adjustment |
(692 | ) | ||
| Accruals |
1,081 | |||
| Payments |
(607 | ) | ||
|
|
|
|||
| Balance, as of December 31, 2019 |
$ | 882 | ||
|
|
|
|||
As of December 31, 2019, $0.9 million was included in accounts payable and accrued expenses. As of December 31, 2018, $0.5 million was included in accounts payable and accrued expenses, and $0.6 million was included in other long-term liabilities.
6. Intangible Assets, net
In connection with the ILG Acquisition, the Company rebranded itself, which resulted in the useful lives of certain of its trade names changing from indefinite to finite. Concurrent with the adoption of this plan, the Company tested the trade names for impairment which resulted in the recognition of an impairment loss. There were not impairment charges recorded during the year ended December 31, 2019. This charge is included in trade name impairment in the accompanying consolidated statements of comprehensive loss.
Intangible assets, net consisted of the following (dollars in thousands):
| As of December 31, 2019 | ||||||||||||||||
| Weighted Average Life (in years) |
Gross Carrying Amount |
Accumulated Amortization |
Net Carrying Value |
|||||||||||||
| Finite lived assets |
||||||||||||||||
| Customer relationships |
17.0 | $ | 357,048 | $ | (99,918 | ) | $ | 257,130 | ||||||||
| Noncompetition agreements |
4.3 | 20,200 | (8,848 | ) | 11,352 | |||||||||||
| Trademarks |
7.6 | 56,250 | (23,988 | ) | 32,262 | |||||||||||
|
|
|
|
|
|
|
|||||||||||
| $ | 433,498 | $ | (132,754 | ) | $ | 300,744 | ||||||||||
|
|
|
|
|
|
|
|||||||||||
| As of December 31, 2018 | ||||||||||||||||||||
| Weighted Average Life (in years) |
Gross Carrying Amount |
Accumulated Amortization |
Impairment | Net Carrying Value |
||||||||||||||||
| Finite lived assets |
||||||||||||||||||||
| Customer relationships |
18.0 | $ | 347,147 | $ | (56,907 | ) | $ | — | $ | 290,240 | ||||||||||
| Noncompetition agreements |
4.3 | 20,200 | (3,496 | ) | — | 16,704 | ||||||||||||||
| Trademarks |
6.8 | 66,250 | (8,806 | ) | (10,000 | ) | 47,444 | |||||||||||||
|
|
|
|
|
|
|
|
|
|||||||||||||
| $ | 433,597 | $ | (69,209 | ) | $ | (10,000 | ) | $ | 354,388 | |||||||||||
|
|
|
|
|
|
|
|
|
|||||||||||||
F-47
Table of Contents
INTERIOR LOGIC GROUP HOLDINGS, LLC
NOTES TO CONSOLIDATED FINANCIAL STATEMENTS—(Continued)
Intangible assets subject to amortization had a total weighted-average life of 15.2 years, 17.1 years and 9.3 years as of December 31, 2019, 2018 and 2017, respectively. The Company recorded approximately $63.5 million, $40.8 million and $9.1 million of amortization expense related to intangible assets for the years ended December 31, 2019, 2018 and 2017, respectively.
Estimated aggregate amortization expense for intangibles for each of the next five years and thereafter is as follows (in thousands):
| Years ending December 31, |
||||
| 2020 |
$ | 54,823 | ||
| 2021 |
44,342 | |||
| 2022 |
36,822 | |||
| 2023 |
31,485 | |||
| 2024 |
26,922 | |||
| Thereafter |
106,350 | |||
|
|
|
|||
| $ | 300,744 | |||
|
|
|
|||
7. Borrowing Facility and Long-term Debt, net
On May 31, 2018, in conjunction with the ILG Acquisition, the Company entered into a revolving line of credit facility (“Revolving Credit Facility”) and a term loan credit agreement (“Term Loan Facility”) with an asset backed lending group (“ABL Lender Group”) which paid off the outstanding balance of the Company’s outstanding Prior Revolving Credit Facility, Prior Term Loan Facility, both of which are defined below, and the assumed line of credit and term debt from the ILG Acquisition (collectively, “Legacy Debt”).
The payoff of the Prior Revolving Credit Facility and Prior Term Loan Facility resulted in a debt extinguishment of $3.1 million. This loss on debt extinguishment consisted of $2.2 million of unamortized deferred financing fees and prepayment penalties of $0.9 million. The payoff of the assumed line of credit and term debt from the ILG Acquisition resulted in a debt modification.
Revolving Credit Facility
The Revolving Credit Facility is collateralized by substantially all of the Company’s current assets and expires on May 31, 2023. The facility is limited to a borrowing base calculation with a maximum availability of $100 million. The facility also provides for up to $30.0 million in letter of credit usage.
Availability under the Revolving Credit Facility is limited to the lesser of $100 million and a borrowing base determined by reference to, among other things, the value of the Company’s eligible receivables, eligible inventory, and eligible cash, reduced by certain reserve amounts. Availability under the Revolving Credit Facility is further limited by outstanding borrowings.
Obligations under the Revolving Credit Facility are guaranteed by the Company and its subsidiaries and secured on (i) a first priority basis by liens on, among other things, accounts receivable and other rights to payments, inventory, intangibles and other related assets, in each case except to the extent such items constitute identifiable proceeds of the Term Loan Facility Priority Collateral (“Revolving Credit Facility Priority Collateral”) and (ii) a second priority basis by liens on all of the Company’s assets other than the Revolving Credit Facility Priority Collateral (“Term Loan Facility Priority Collateral”). All guarantees by the Company and its subsidiaries are joint and several and full and unconditional.
F-48
Table of Contents
INTERIOR LOGIC GROUP HOLDINGS, LLC
NOTES TO CONSOLIDATED FINANCIAL STATEMENTS—(Continued)
The interest rate under the Revolving Credit Facility bears interest at the Company’s option, at either (i) the base rate plus an applicable margin between 0.5% and 1.0% per annum based on average usage of the Revolving Credit Facility or (ii) “London Inter-Bank Offer Rate” (LIBOR) plus an applicable margin that ranges from 1.5% to 2.0%, based on average usage under the Revolving Credit Facility. The weighted average interest rate was approximately 4.2% as of December 31, 2019. In addition, the Company is required to pay an unused commitment fee of 0.250% to 0.375% per annum of the average unused portion of the lending commitments.
The Revolving Credit Facility also contains covenants that restrict the Company’s ability to, subject to specified exceptions, incur additional debt; incur additional liens or contingent liabilities; sell or dispose of assets; merge with or acquire other companies; liquidate or dissolve; engage in businesses that are not reasonably related to its current business activities; make loans, advances, or guarantees; pay dividends or make other distributions; engage in transactions with affiliates; and make certain investments. The Revolving Credit Facility also requires that the Company maintain a fixed-charge coverage ratio of not less than 1.0 to 1.0 to be tested if and when excess availability, as defined, falls below 10% of the facility’s maximum availability or $8.0 million.
Events of default under the Revolving Credit Facility include, but are not limited to, payment defaults, covenant defaults, breaches of representations and warranties, cross-defaults to certain indebtedness, certain events of bankruptcy and insolvency, defaults under any security documents and a change of control. As of December 31, 2019, the Company was in compliance with all covenants and no event of default (as such term is defined in the Revolving Credit Facility) had occurred.
As of December 31, 2019, the Company had no borrowings on the Company’s Revolving Credit Facility and letters of credit in the amount of $3.2 million. Since there were no outstanding borrowings on the Company’s Revolving Credit facility as of December 31, 2019, the associated net deferred financing fees of $0.7 million were recorded in other current assets in the accompanying consolidated balance sheet. After taking into consideration the current borrowing base and actual borrowings under the Revolving Credit Facility, the Company had $96.8 million of remaining borrowing capacity as of December 31, 2019.
Prior Revolving Credit Facility
During 2016, the Company entered into a facility with its asset based lender (the “Prior Revolving Credit Facility”) which had a maximum availability of $65.0 million, provided for up to $8.0 million in letters of credit, and would have matured on March 30, 2020. On May 31, 2018, with the proceeds from the Term Loan Facility and Revolving Credit Facility, the Prior Revolving Credit Facility balance of $26.5 million was paid off.
Long-term debt
Long-term debt, net of current portion consists of the following (in thousands):
| As of December 31, | ||||||||
| 2019 | 2018 | |||||||
| Term Loan Facility |
$ | 395,000 | $ | 399,000 | ||||
| Other long-term debt |
78 | 12 | ||||||
| Unamortized discount on term loan |
(1,547 | ) | (1,833 | ) | ||||
| Unamortized debt issuance costs |
(8,849 | ) | (10,482 | ) | ||||
|
|
|
|
|
|||||
| $ | 384,682 | $ | 386,697 | |||||
| Current maturities of long-term debt |
(2,433 | ) | (2,378 | ) | ||||
|
|
|
|
|
|||||
| $ | 382,249 | $ | 384,319 | |||||
|
|
|
|
|
|||||
F-49
Table of Contents
INTERIOR LOGIC GROUP HOLDINGS, LLC
NOTES TO CONSOLIDATED FINANCIAL STATEMENTS—(Continued)
Term Loan Facility
On May 31, 2018, the Company entered into a credit agreement in conjunction with the ILG Acquisition with the ABL Lender Group (“the Term Loan Facility”).
The Term Loan Facility provides for (i) an initial term loan commitment of $400 million and (ii) the right to request two incremental borrowings up to the aggregate of $100 million and 75% of consolidated earnings before interest, taxes, depreciation and amortization further adjusted by terms in the agreement and subject to financial covenants. The Term Loan Facility is repayable in quarterly installments of $1.0 million. Payments commenced on December 31, 2018 with the remaining principal balance payable at maturity on May 31, 2025. Borrowings under the Term Loan Facility bear interest at the Company’s option, at either (i) LIBOR plus 4.0% per annum or (ii) the base rate plus 3.0%. The interest rate was approximately 6.3% at December 31, 2019.
The obligations under the Term Loan Facility are guaranteed by the Company and its subsidiaries and are secured on a (i) first priority basis by liens on the Term Loan Facility Priority Collateral and (ii) second-priority basis by liens on the Revolving Credit Facility Priority collateral. All guarantees by the Company are joint and several and full and unconditional.
The Term Loan Facility contains covenants that, among other things, restrict the Company’s ability, subject to specified exceptions, to incur additional debt; incur additional liens and contingent liabilities; sell or dispose of assets; merge with or acquire other companies; liquidate or dissolve; engage in businesses that are not reasonably related to the existing business activities; make loans, advances, or guarantees; pay dividends or make other distributions; engage in transactions with affiliates and make capital expenditures and other investments.
Events of default under the Term Loan Facility include, but are not limited to, payment defaults, covenant defaults, breaches of representations and warranties, cross-defaults to certain indebtedness, certain events of bankruptcy and insolvency, defaults under security documents and a change of control. As of December 31, 2019, the Company was in compliance with all covenants and no event of default (as such term is defined in the Term Loan Facility) had occurred.
Prior Term Loan Facility
During 2015, the Company entered into a credit agreement with an asset backed lending group (the “Prior Term Loan Facility”), which was amended in October 2017, and provided for a principal balance of $94.0 million. The term loan balance of $93.7 million, including accrued interest, was paid off on May 31, 2018, with the proceeds from the Term Loan Facility and Revolving Credit Facility.
The scheduled maturities of long-term debt outstanding, excluding amortization of debt issuance costs, as of December 31, 2019 are as follows (in thousands):
| Years ending December 31 |
||||
| 2020 |
$ | 4,000 | ||
| 2021 |
4,000 | |||
| 2022 |
4,000 | |||
| 2023 |
4,000 | |||
| 2024 |
4,000 | |||
| Thereafter |
375,000 | |||
|
|
|
|||
| $ | 395,000 | |||
|
|
|
|||
F-50
Table of Contents
INTERIOR LOGIC GROUP HOLDINGS, LLC
NOTES TO CONSOLIDATED FINANCIAL STATEMENTS—(Continued)
8. Operating and Finance Leases
Operating Leases
The Company leases its facilities and certain equipment under noncancelable operating leases which require monthly payments, expiring at various dates through June 2027. Some of the lease agreements contain renewal options at the expiration of their leases. Most of the facility lease agreements require the Company to pay its pro-rata share of the landlord’s operating expenses which include taxes, insurance and maintenance costs.
Total rent expense under all noncancelable operating and finance leases amounted to approximately $26.5 million and $21.9 million for the years ended December 31, 2019 and 2018, respectively, and is included in selling, general, and administrative expense in the accompanying consolidated statements of comprehensive loss.
In February 2016, the FASB issued ASU No. 2016-02, Leases (“ASC 842”). The FASB issued this Accounting Standards Update (“ASU”) to increase transparency and comparability among organizations by requiring lessees to recognize lease assets and lease liabilities on the balance sheet for those leases classified as operating leases and finance leases under current U.S. GAAP and disclosing key information about leasing arrangements. Enhanced disclosures are also required to give financial statement users the ability to assess the amount, timing and uncertainty of cash flows arising from leases. The standards became effective for the Company beginning January 1, 2019.
As a result of the adoption of the new accounting standard, the Company elected transition-related practical expedients as accounting policies which allowed it to not reassess, as of the adoption date, (1) whether any expired or existing contracts are or contain leases, (2) the classification of any expired or existing leases, and (3) if previously capitalized initial direct costs qualify for capitalization under ASC 842. The Company elected the practical expedient option to not separate lease and non-lease components for all of its leases, and also elected the short-term lease recognition exemption that keeps leases with an initial term of 12 months or less excluded from balance sheet.
Operating and finance lease liabilities are recognized at lease commencement based on the present value of the fixed lease payments using the Company’s incremental borrowing rate at commencement. Related operating and finance lease ROU (“Right of Use”) assets are recognized based on the initial present value of the fixed lease payments, reduced by cash payments received from the landlords as lease incentives, plus any prepaid rent and other direct costs from executing the leases. Amortization of both operating and finance lease ROU assets is recorded as part of rent expense in selling, general, and administrative expense on the consolidated statements of comprehensive loss. The interest expense amortization component of the finance lease liabilities is recorded within interest expense on the consolidated statements of comprehensive loss. ROU assets are tested for impairment in the same manner as long-lived assets.
Leases with an initial term of 12 months or less are not recorded on the balance sheet; the Company recognizes lease expense for these leases on a straight-line basis over the lease term. Variable lease payments are recognized as lease expense as they are incurred.
F-51
Table of Contents
INTERIOR LOGIC GROUP HOLDINGS, LLC
NOTES TO CONSOLIDATED FINANCIAL STATEMENTS—(Continued)
ROU assets and lease liabilities as of December 31, 2019 consist of the following:
| As of December 31, 2019 |
||||
| Assets |
||||
| Operating lease assets |
$ | 63,465 | ||
| Finance lease assets |
769 | |||
|
|
|
|||
| Total lease assets |
$ | 64,234 | ||
|
|
|
|||
| Liabilities |
||||
| Current |
||||
| Operating |
$ | 19,139 | ||
| Finance |
252 | |||
|
|
|
|||
| Total short-term lease liabilities |
$ | 19,391 | ||
| Non-Current |
||||
| Operating |
$ | 48,755 | ||
| Finance |
507 | |||
|
|
|
|||
| Total long-term lease liabilities |
$ | 49,262 | ||
|
|
|
|||
| Total lease liabilities |
$ | 68,653 | ||
|
|
|
|||
Total lease costs for the twelve months ended December 31, 2019 were:
| As of December 31, 2019 |
||||
| Finance lease costs |
||||
| Amortization of right-of-use assets |
$ | 182 | ||
| Interest on lease liabilities |
29 | |||
|
|
|
|||
| Total finance lease cost |
$ | 211 | ||
| Operating lease cost |
$ | 24,997 | ||
| Short-term lease cost |
343 | |||
| Variable lease cost |
1,183 | |||
| Sublease income |
(252 | ) | ||
|
|
|
|||
| Total lease cost |
$ | 26,482 | ||
|
|
|
|||
Approximate aggregate annual lease payments as of December 31, 2019:
| Year |
Operating Leases |
Finance Leases |
||||||
| 2020 |
$ | 21,634 | $ | 283 | ||||
| 2021 |
19,433 | 242 | ||||||
| 2022 |
14,694 | 163 | ||||||
| 2023 |
9,634 | 132 | ||||||
| 2024 |
4,253 | 42 | ||||||
| Thereafter |
2,080 | 21 | ||||||
|
|
|
|
|
|||||
| Total |
$ | 71,728 | $ | 883 | ||||
| Less: Imputed interest |
(3,834 | ) | (124 | ) | ||||
|
|
|
|
|
|||||
| Present value of net lease payments |
$ | 67,894 | $ | 759 | ||||
|
|
|
|
|
|||||
F-52
Table of Contents
INTERIOR LOGIC GROUP HOLDINGS, LLC
NOTES TO CONSOLIDATED FINANCIAL STATEMENTS—(Continued)
As of December 31, 2018, prior to the adoption of ASC 842, annual future minimum payments of the Company’s operating leases were as follows:
| Years ending December 31 |
||||
| 2019 |
$ | 24,262 | ||
| 2020 |
20,993 | |||
| 2021 |
16,779 | |||
| 2022 |
11,890 | |||
| 2023 |
6,648 | |||
| Thereafter |
8,006 | |||
|
|
|
|||
| Total minimum payments |
$ | 88,578 | ||
|
|
|
|||
The following table includes supplemental lease information:
| As of December 31, 2019 |
||||
| Cash paid for amounts included in the measurement of lease liabilities |
||||
| Operating cash flows from operating leases |
$ | 24,291 | ||
| Operating cash flows from finance leases |
29 | |||
| Financing cash flows from finance leases |
54 | |||
|
|
|
|||
| $ | 24,374 | |||
| Weighted average remaining lease term (in years) |
||||
| Operating leases |
3.47 | |||
| Finance leases |
3.80 | |||
| Weighted average discount rate |
||||
| Operating leases |
6.16 | % | ||
| Finance leases |
5.03 | % | ||
9. Commitments and Contingencies
Litigation
The Company is party to various legal proceedings, primarily relating to contractual matters and personnel and employment disputes. Management cannot predict the ultimate outcome of these proceedings, individually or in the aggregate, or their resulting effect on our business, financial position, results of operations or cash flows as litigation and related matters are subject to inherent uncertainties, and unfavorable rulings could occur. Were an unfavorable outcome to occur, there exists the possibility of a material adverse impact on our business, financial position, results of operations, or cash flows for the period in which the ruling occurs and/or future periods. We maintain general and excess liability insurance coverage. However, no assurances can be given that such insurance will continue to be available at an acceptable cost to us, that such coverage will be sufficient to cover one or more large claims, or that the insurers will not successfully disclaim coverage as to a pending or future claim.
Surety Bonds
Certain commercial customers require the Company to post performance and payment bonds issued by a financial institution known as a surety. If the Company fails to perform under the terms of a contract or to pay subcontractors and vendors that provided goods or services under the specific contract, the customer may demand that the surety make payments or provide services under the bond. The Company must reimburse the surety for any expenses or outlays it incurs. To date, the Company is not aware of any losses to its sureties in
F-53
Table of Contents
INTERIOR LOGIC GROUP HOLDINGS, LLC
NOTES TO CONSOLIDATED FINANCIAL STATEMENTS—(Continued)
connection with bonds and sureties that have been posted on the Company’s behalf, and it does not expect such losses to be incurred in the foreseeable future.
10. Related-Party Transactions
Certain lenders with which the Company had outstanding debt under the Prior Term Loan Facility are also member unit holders of Faraday which was paid off on May 31, 2018. Interest and other related costs of $3.6 million and $6.0 million were paid to these lenders for the year ended December 31, 2018 and 2017, respectively.
Certain lenders with which the Company had outstanding borrowings under the Sponsor Credit Agreement are also member unit holders of Faraday. The outstanding balance plus accrued interest of $21.4 million were paid off on October 16, 2017.
Certain leases for Company facilities are held with lessors that are affiliates of the Company. Lease payments included in selling, general, and administrative expenses to these lessors totaled approximately $2.4 million, $1.6 million and $0.3 million for the years ended December 31, 2019, 2018 and 2017, respectively.
Certain member unit holders of the Company provide management services to the Company. Expenses related to the management services was approximately $2.1 million, $1.3 million and $0.3 million for the years ended December 31, 2019, 2018 and 2017, respectively.
Certain Faraday unit holders purchased Faraday units in exchange for nonrecourse promissory notes on May 29, 2014. Interest on the notes are paid annually by the Faraday unit holders and is reflected in additional paid in capital in the accompanying consolidate statements of members’ equity.
11. Income Taxes
The provision for income taxes consists of the following (in thousands):
| Year Ended December 31 | ||||||||||||
| 2019 | 2018 | 2017 | ||||||||||
| Current tax expense: |
||||||||||||
| Federal |
$ | 11,091 | $ | 4,788 | $ | 2,143 | ||||||
| State |
4,620 | 1,900 | 824 | |||||||||
|
|
|
|
|
|
|
|||||||
| Total current tax expense |
15,711 | 6,688 | 2,967 | |||||||||
| Deferred tax expense (benefit): |
||||||||||||
| Federal |
(14,637 | ) | (7,196 | ) | (2,595 | ) | ||||||
| State |
(4,299 | ) | (2,967 | ) | (893 | ) | ||||||
|
|
|
|
|
|
|
|||||||
| Total deferred tax benefit |
(18,936 | ) | (10,163 | ) | (3,488 | ) | ||||||
|
|
|
|
|
|
|
|||||||
| Total benefit |
$(3,225 | ) | $(3,475 | ) | $(521 | ) | ||||||
|
|
|
|
|
|
|
|||||||
F-54
Table of Contents
INTERIOR LOGIC GROUP HOLDINGS, LLC
NOTES TO CONSOLIDATED FINANCIAL STATEMENTS—(Continued)
A reconciliation of the amounts computed by applying the statutory federal income tax rate to income before income taxes to the amounts recorded in the accompanying consolidated statements of comprehensive loss is summarized as follows (in thousands):
| Year Ended December 31 | ||||||||||||
| 2019 | 2018 | 2017 | ||||||||||
| Federal statutory income tax rate |
$ | (3,989 | ) | $ | (3,444 | ) | $ | 3,175 | ||||
| Tax rate adjustment and other |
(1,322 | ) | (799 | ) | (311 | ) | ||||||
| State income taxes, net of federal benefit |
(550 | ) | (304 | ) | 207 | |||||||
| Stock compensation |
13 | 49 | 11 | |||||||||
| Permanent differences |
17 | 66 | (167 | ) | ||||||||
| Meals and entertainment |
195 | 245 | 140 | |||||||||
| Uncertain tax positions |
213 | 415 | (1,159 | ) | ||||||||
| Return to provision adjustments |
867 | (492 | ) | (110 | ) | |||||||
| Change in valuation allowance |
1,331 | 361 | (1,967 | ) | ||||||||
| Transaction costs |
— | 428 | — | |||||||||
| Real property construction deductions |
— | — | (340 | ) | ||||||||
|
|
|
|
|
|
|
|||||||
| Total income tax benefit |
$ | (3,225 | ) | $ | (3,475 | ) | $ | (521 | ) | |||
|
|
|
|
|
|
|
|||||||
Deferred tax assets and liabilities are determined based on differences between financial reporting and tax basis of assets and liabilities are measured using enacted tax rates and laws that are expected to be in effect when the differences reverse. Deferred tax assets are also recognized for the estimated future effects of tax loss carryforwards. The effect on deferred taxes of changes in tax rates is recognized in the period in which the new tax is enacted.
Significant components of the Company’s deferred tax assets and liabilities are as follows (in thousands):
| As of December 31 | ||||||||
| 2019 | 2018 | |||||||
| Deferred tax assets: |
||||||||
| Lease liabilities |
$ | 16,210 | $ | — | ||||
| Deferred costs |
4,900 | — | ||||||
| Inventory |
3,789 | 3,318 | ||||||
| Interest expense limitation |
4,107 | 833 | ||||||
| Accrued compensation |
4,070 | 3,150 | ||||||
| Allowance for doubtful accounts |
3,288 | 1,968 | ||||||
| Net operating losses |
1,586 | 3,121 | ||||||
| Accrued expenses |
1,348 | 2,914 | ||||||
| Warranty reserve |
1,253 | 2,082 | ||||||
| Other reserves |
899 | 1,022 | ||||||
| Restructuring reserve |
894 | 266 | ||||||
| Share-based compensation |
699 | 461 | ||||||
| Deferred rent |
— | 392 | ||||||
| Transaction costs |
174 | 663 | ||||||
|
|
|
|
|
|||||
| Total deferred tax assets before valuation allowance |
43,217 | 20,190 | ||||||
| Less valuation allowance |
(2,278 | ) | (947 | ) | ||||
|
|
|
|
|
|||||
| Net deferred tax assets |
40,939 | 19,243 | ||||||
|
|
|
|
|
|||||
F-55
Table of Contents
INTERIOR LOGIC GROUP HOLDINGS, LLC
NOTES TO CONSOLIDATED FINANCIAL STATEMENTS—(Continued)
| As of December 31 | ||||||||
| 2019 | 2018 | |||||||
| Deferred tax liabilities: |
||||||||
| Intangible assets |
(46,574 | ) | (60,940 | ) | ||||
| Right of use asset |
(15,633 | ) | — | |||||
| Goodwill |
(7,326 | ) | (4,663 | ) | ||||
| Property, plant and equipment |
(1,522 | ) | (2,598 | ) | ||||
| Prepaid expenses |
(360 | ) | (67 | ) | ||||
|
|
|
|
|
|||||
| Total deferred tax liabilities |
(71,415 | ) | (68,268 | ) | ||||
|
|
|
|
|
|||||
| Net deferred tax liabilities |
$ | (30,476 | ) | $ | (49,025 | ) | ||
|
|
|
|
|
|||||
The Company assesses whether a valuation allowance should be established based on its determination of whether it is more likely than not that some portion or all of the deferred tax assets will not be realized. Both positive and negative evidence is considered when determining the necessity of the valuation allowance as well as the sources of taxable income supporting the realization of the deferred tax assets, including income in carryback years, future reversals of existing taxable temporary differences, tax-planning strategies and projected taxable income from future operations.
Based on the Company’s assessment, the Company recorded a valuation allowance of $2.3 million and $0.9 million against certain state deferred tax assets that are not more likely than not to be realized as of December 31, 2019 and 2018, respectively.
At December 31, 2019, the Company had no federal net operating loss (“NOL”) carryforwards and state NOL carryforwards of approximately $33.8 million. At December 31, 2018 the Company had federal NOL carryforwards of $12.3 million and state NOL carryforwards of $10.1 million, which may be available to offset future taxable income. At December 31, 2017, the Company had state NOL carryforwards of approximately $3.5 million. The state NOL carryforwards begin expiring in 2030, unless previously utilized.
As a result of the ILG Acquisition, certain of ILG’s tax attributes and net operating loss carryforwards are subject to the Internal Revenue Code Section 382 limitations for federal and state purposes. Future ownership changes may further limit the Company’s ability to utilize its remaining tax attributes.
The Company has recorded unrecognized tax benefits as of December 31, 2019 and 2018, of $10.5 million and $0.4 million, respectively. The Company has not recorded any unrecognized tax benefits as of December 31, 2017. The Company’s practice is to recognize interest and penalties related to income tax matters as a component of income tax expense.
A reconciliation of the beginning and ending amount of total unrecognized benefits is as follows (in thousands):
| As of December 31, |
||||||||
| 2019 | 2018 | |||||||
| Beginning balance |
$ | 431 | $ | — | ||||
| Lapse of statute of limitations |
— | — | ||||||
| Current period tax positions |
10,038 | 431 | ||||||
|
|
|
|
|
|||||
| Ending balance |
$ | 10,469 | $ | 431 | ||||
|
|
|
|
|
|||||
F-56
Table of Contents
INTERIOR LOGIC GROUP HOLDINGS, LLC
NOTES TO CONSOLIDATED FINANCIAL STATEMENTS—(Continued)
For the year ended December 31, 2019, the Company recognized $0.3 million of interest and penalties. For the years ended December 31, 2018 and 2017, the Company recognized no interest and penalties. The Company expects that $10.0 million of the reserve of unrecognized tax benefits will reverse within twelve months.
The Company is subject to U.S. federal and state income tax. The Company is no longer subject to U.S. federal or state income tax examinations for years before the tax years 2017 and 2016, respectively. However, to the extent allowed by the law, the tax authorities may have the right to examine prior periods, where net operating losses were generated and carried forward, and make adjustments up to the amount of the net operating loss. The Company is currently under examination in a state jurisdiction. Management does not anticipate material adjustments as a result of the examination. The Company is not under examination by the Internal Revenue Service; however, Faraday is currently under examination by the Internal Revenue Service for its tax years ended December 31, 2017 and December 31, 2018. The examination is in the early stages and there have been no proposed adjustments to date.
12. Share-Based Compensation
2018 Equity Incentive Plan
On May 31, 2018, the Company adopted the 2018 Equity Incentive Plan (“ILGH Plan”), the ILGH Plan allows for the grant of unit options, unit appreciation rights, and restricted unit grants to key employees. As of December 31, 2019 and 2018, a total of 50,000 Class B Limited Voting Common Units (“Class B common units”) were reserved for issuance, of which 12,113 and 36,875 were available for future awards at December 31, 2019 and 2018, respectively.
The Company’s unit options include both service and performance conditions. These unit options vest ratably over four years, with the last tranche of awards vesting only if Littlejohn, Platinum and their affiliates’, collectively, the indirect owners of the Company, equity interests in the Company as of the grant date decreases by 30%. Such a decrease is considered a performance condition. The Company assesses the probability of achievement of the performance conditions at the end of each reporting period. As of December 31, 2019 and 2018, none of the performance conditions for any of the unit options have been deemed probable of achievement. In the event such performance conditions become probable, the Company will recognize expense on the options at that time for the performance based options and in proportion to the extent service has already been completed for the time based options. The unit options are exercisable for up to ten years from the grant date.
2012 Equity Incentive Plan
Faraday allows for the grant of unit options and restricted unit awards to its employees and independent directors under its 2012 Equity Incentive Plan (the “2012 Plan”) and its Amended 2015 Equity Incentive Plan (the “2015 Amended Plan”). As of December 31, 2019, a total of 200,000 Class C common units were reserved for issuance, of which 50,500 were available for future awards, and 155,689 Class E common unit options were reserved for issuance, of which 92,667 common units were available for future awards.
Compensation cost related to the grant of unit options and restricted unit awards to employees of the Company are recognized in the Company’s financial statements with a corresponding credit to equity representing the capital contribution indirectly made by Faraday. Faraday is considered an economic interest holder in ISI, and, therefore, the Company accounts for unit options and restricted unit awards in the same manner as if the Company adopted the Plan.
Certain of the Company’s unit options and restricted unit awards include both service and performance conditions. These unit options and restricted unit awards generally vest four to five years from the grant date,
F-57
Table of Contents
INTERIOR LOGIC GROUP HOLDINGS, LLC
NOTES TO CONSOLIDATED FINANCIAL STATEMENTS—(Continued)
with the last tranche of awards vesting only upon a liquidation event, which is considered a performance condition. In addition, the Company granted unit options and restricted unit awards that vest periodically over a fixed term, usually five years which do not contain performance conditions. Share-based awards also generally provide for accelerated vesting if there is a liquidity event (as defined in the 2012 Plan and 2015 Amended Plan). The unit options are exercisable for up to ten years from the grant date.
Compensation expense is amortized on a straight-line basis over the requisite service period, which is generally the maximum vesting period of the award, and if necessary, is adjusted to ensure that the amount recognized is at least equal to the vested (earned) compensation. For awards containing a performance condition, the compensation expense associated with the contingent shares related to the performance condition is not recognized until the performance condition becomes probable.
Unit Options
The estimated fair value of the Company’s unit options and incentive units were determined using the Black-Sholes model. All unit options were granted at an exercise price equal to the fair value of the common units on the grant date. The weighted-average grant date fair value of employee unit options during the year ended December 31, 2019 and 2018, was $202.38 and $215.20, respectively, which was estimated using the following weighted-average grant date assumptions:
| As of December 31, | ||||||||
| 2019 | 2018 | |||||||
| Expected volatility |
33 | % | 30-33 | % | ||||
| Expected term (in years) |
6.0 | 6.0 | ||||||
| Risk-free interest rate |
1.83 | % | 2.5%-2.84 | % | ||||
| Expected dividend yield |
— | — | ||||||
The determination of the fair value of unit options using an option valuation model is affected by the Company’s common unit price, as well as assumptions regarding a number of complex and subjective variables. The volatility assumption is based on the volatilities of similar peer companies over a period equal to the expected term of the unit options. The expected term of employee unit options represents the weighted-average period the unit options are expected to remain outstanding. The expected term assumption is estimated based primarily on the options’ vesting terms and remaining contractual life and employees’ expected exercise and post-vesting employment termination behavior. The risk-free interest rate assumption is based upon observed interest rates at the grant date for the expected term of the option. The dividend yield assumption is based on the expectation of no future dividend payouts by the Company.
F-58
Table of Contents
INTERIOR LOGIC GROUP HOLDINGS, LLC
NOTES TO CONSOLIDATED FINANCIAL STATEMENTS—(Continued)
A summary of the Company’s unit option award activity under the 2012 plan for the years ended December 31, 2019, 2018 and 2017, respectively, is as follows:
| Number of Units |
Weighted- Average Exercise Price Per Unit |
Weighted- Average Remaining Contractual Term (In Years) |
||||||||||
| Options outstanding at December 31, 2016 |
55,689 | $ | 58.17 | 9.31 | ||||||||
|
|
|
|
|
|
|
|||||||
| Options exercisable or expected to be exercisable at December 31, 2016 |
51,467 | $ | 58.60 | 9.35 | ||||||||
|
|
|
|
|
|
|
|||||||
| Options granted |
25,961 | $ | 93.73 | |||||||||
| Options forfeited |
(6,500 | ) | $ | 60.81 | ||||||||
| Options exercised |
— | — | ||||||||||
|
|
|
|
|
|
|
|||||||
| Options outstanding at December 31, 2017 |
75,150 | $ | 70.23 | 8.83 | ||||||||
|
|
|
|
|
|
|
|||||||
| Options exercisable or expected to be exercisable at December 31, 2017 |
73,028 | $ | 70.15 | 8.82 | ||||||||
|
|
|
|
|
|
|
|||||||
| Options granted |
272 | $ | 108.39 | |||||||||
| Options forfeited |
(8,200 | ) | $ | 78.20 | ||||||||
| Options exercised |
(1,800 | ) | $ | 53.30 | ||||||||
|
|
|
|
|
|
|
|||||||
| Options outstanding at December 31, 2018 |
65,422 | $ | 69.86 | 8.06 | ||||||||
|
|
|
|
|
|
|
|||||||
| Options exercisable or expected to be exercisable at December 31, 2018 |
63,484 | $ | 70.36 | 7.81 | ||||||||
|
|
|
|
|
|
|
|||||||
| Options granted |
— | — | ||||||||||
| Options forfeited |
(4,800 | ) | $ | 59.90 | ||||||||
| Options exercised |
(3,200 | ) | $ | 59.90 | ||||||||
|
|
|
|
|
|
|
|||||||
| Options outstanding at December 31, 2019 |
57,422 | $ | 70.98 | 6.72 | ||||||||
|
|
|
|
|
|
|
|||||||
| Options exercisable or expected to be exercisable at December 31, 2019 |
55,484 | $ | 71.76 | 6.76 | ||||||||
|
|
|
|
|
|
|
|||||||
A summary of the Company’s unit option award activity under the 2018 plan for the years ended December 31, 2019 and December 31, 2018 since the plan’s formation is as follows:
| Number of Units |
Weighted- Average Exercise Price Per Unit |
Weighted- Average Remaining Contractual Term (In Years) |
||||||||||
| Options granted |
13,125 | $ | 551.95 | |||||||||
| Options forfeited |
— | — | ||||||||||
| Options exercised |
— | — | ||||||||||
|
|
|
|
|
|
|
|||||||
| Options outstanding at December 31, 2018 |
13,125 | $ | 551.95 | 9.81 | ||||||||
|
|
|
|
|
|
|
|||||||
| Options exercisable or expected to be exercisable at December 31, 2018 |
10,500 | $ | 551.95 | 9.81 | ||||||||
|
|
|
|
|
|
|
|||||||
| Options granted |
24,762 | $ | 574.68 | |||||||||
| Options forfeited |
— | — | ||||||||||
| Options exercised |
— | — | ||||||||||
|
|
|
|
|
|
|
|||||||
| Options outstanding at December 31, 2019 |
37,887 | $ | 566.81 | 9.39 | ||||||||
|
|
|
|
|
|
|
|||||||
| Options exercisable or expected to be exercisable at December 31, 2019 |
30,310 | $ | 566.81 | 9.39 | ||||||||
|
|
|
|
|
|
|
|||||||
F-59
Table of Contents
INTERIOR LOGIC GROUP HOLDINGS, LLC
NOTES TO CONSOLIDATED FINANCIAL STATEMENTS—(Continued)
The Company accounts for forfeitures as they occur, and compensation expense previously recognized for an award that is forfeited because of a failure to satisfy a service condition is reversed in the period of the forfeiture. Compensation expense related to unit options was $1.2 million, $0.4 million and $0.2 million for the years ended December 31, 2019, 2018 and 2017, respectively. At December 31, 2019, total unrecognized compensation expense related to unvested unit options was $0.6 million, which is expected to be recognized over a weighted-average period of 1.5 years. As of December 31, 2019, total unrecognized compensation expense related to unvested options with performance conditions and with both service and performance conditions was $6.9 million, which will be recognized in the event the performance condition becomes probable and, as applicable, in proportion to the extent the underlying service period has been completed. The options outstanding at December 31, 2019 had an intrinsic value of $4.0 million and the option exercisable, or expected to be exercisable, had an intrinsic value of $3.2 million.
Incentive Unit Plan
ISH allows for the grant of unit options to employees and independent directors under its Incentive Unit Plan (“ISH Plan”). The ISH Plan allows for the issuance of up to 4,000,000 of common units of ISH. This plan is intended to provide incentives to officers, employees, consultants, and other key persons determined by ISH’s Board of Managers by providing such person with awards of membership interests in ISH denominated as incentive units. Pursuant to the terms of ISH Plan, the ISH Managers shall have the right to issue up to 1,000,000 common units as incentive units.
Compensation costs related to the grant of the incentive units to employees of the Company are recognized in the Company’s separate financial statements with a corresponding credit to equity, representing the capital contribution indirectly made by ISH. ISH is considered an economic interest holder in ILG and, therefore, the Company accounts for the incentive units to employees of the Company as if the Company adopted the plan.
As of December 31, 2019, there were 19,697 incentive units reserved for issuance, and 12,941 units were available to be issued under the ISH Plan. Two types of units are granted: Time-based vesting incentive units, and Performance-based vesting incentive units. Time based vesting incentive units grade vest equally over four years at the end of the first four anniversaries of the grant date and 20% upon the sale of the Company. The performance-based incentive units vest upon the owners of ISH receiving proceeds greater than a target multiple of invested capital as defined in the ISH Plan, this is considered a performance condition. The ILG Acquisition was not considered a sale transaction. The time based incentive units contain additional performance conditions that the Company assesses for probability of achievement each reporting period. As of December 31, 2019 and 2018, none of the performance conditions for any of the incentive units have been deemed probable of achievement. In the event such performance conditions become probable, the Company will recognize expense on the incentive units at that time for the performance based incentive units and in proportion to the extent service has already been completed for the time based incentive units.
Restricted Unit Awards and Incentive Units
Under the authoritative guidance for share-based compensation, the fair value of the Company’s restricted unit awards is based on the grant date fair value of the Company’s common units. During the year ended December 31, 2019 and 2018, respectively, no restricted unit awards were granted.
F-60
Table of Contents
INTERIOR LOGIC GROUP HOLDINGS, LLC
NOTES TO CONSOLIDATED FINANCIAL STATEMENTS—(Continued)
A summary of the Company’s restricted unit awards for the years ended December 31, 2019, 2018 and 2017, respectively, is as follows:
| Number of Units |
Weighted- Average Grant Date Fair Value Per Unit |
|||||||
| Restricted unit awards issued (unvested) at December 31, 2016 |
41,800 | $ | 34.20 | |||||
| Units granted |
— | $ | — | |||||
| Units forfeited |
(3,200 | ) | $ | 48.75 | ||||
| Units vested |
(13,200 | ) | $ | 31.25 | ||||
|
|
|
|
|
|||||
| Restricted unit awards issued (unvested) at December 31, 2017 |
25,400 | $ | 33.90 | |||||
|
|
|
|
|
|||||
| Units granted |
— | $ | — | |||||
| Units forfeited |
— | $ | — | |||||
| Units vested |
(13,200 | ) | $ | 31.25 | ||||
|
|
|
|
|
|||||
| Restricted unit awards issued (unvested) at December 31, 2018 |
12,200 | $ | 36.76 | |||||
|
|
|
|
|
|||||
| Units granted |
— | $ | — | |||||
| Units forfeited |
— | $ | — | |||||
| Units vested |
(5,600 | ) | $ | 48.75 | ||||
|
|
|
|
|
|||||
| Restricted unit awards issued (unvested) at December 31, 2019 |
6,600 | $ | 26.59 | |||||
|
|
|
|
|
|||||
A summary of the Company’s incentive unit awards for the years ended December 31, 2019 and 2018 is as follows:
| Number of Units |
Weighted- Average Grant Date Fair Value Per Unit |
|||||||
| Incentive unit awards issued (unvested) at May 31, 2018 |
10,976 | $ | 306.00 | |||||
| Units granted |
— | $ | — | |||||
| Units forfeited |
(1,280 | ) | $ | 304.00 | ||||
| Units vested |
(97 | ) | $ | 315.00 | ||||
|
|
|
|
|
|||||
| Incentive unit awards issued (unvested) at December 31, 2018 |
9,599 | $ | 306.00 | |||||
|
|
|
|
|
|||||
| Units granted |
— | $ | — | |||||
| Units forfeited |
(4,572 | ) | $ | 303.00 | ||||
| Units vested |
(1,823 | ) | $ | 315.00 | ||||
|
|
|
|
|
|||||
| Incentive unit awards issued (unvested) at December 31, 2019 |
3,204 | $ | 305.00 | |||||
|
|
|
|
|
|||||
Compensation expense related to restricted and incentive unit awards was $0.3 million, $0.7 million and $0.6 million for the years ended December 31, 2019, 2018 and 2017, respectively.
The fair value on the vesting date of vested restricted and incentive unit awards was $1.2 million, $1.6 million and $1.4 million for the years ended December 31, 2019, 2018 and 2017, respectively.
At December 31, 2019, total unrecognized compensation expense related to unvested restricted unit awards was $0.3 million, which is associated with awards containing a liquidation vesting condition. The compensation associated with contingent units is not recognized until the liquidation event becomes probable.
F-61
Table of Contents
INTERIOR LOGIC GROUP HOLDINGS, LLC
NOTES TO CONSOLIDATED FINANCIAL STATEMENTS—(Continued)
13. Employee Benefit Plan
The Company’s 401(k) plan allows for employees with at least 30 days of service and who have attained 21 years of age, to defer a portion of their compensation each year based upon provisions as outlined in the plan. In 2019, the Company matched employee 401(k) contributions at the rate of $0.50 on each dollar of the first 2% of the employee’s annual compensation contributed, then $0.33 on each dollar contributed above 2% up to 6% of the employee’s annual salary contributed. Matching is at the sole discretion of the ILG.
For the year ended December 31, 2019, the Company recorded matching contribution expense of $3.3 million.
14. Earnings (loss) per unit
Basic earnings (loss) per unit is calculated by dividing net income (loss) by the weighted average number of common units outstanding during the reporting period. The following table sets forth the computation of basic and diluted earnings (loss) per unit:
| Year Ended December 31, | ||||||||||||
| 2019 | 2018 | 2017 | ||||||||||
| Net income (loss) |
$ | (15,761 | ) | $ | (12,920 | ) | $ | 9,857 | ||||
|
|
|
|
|
|
|
|||||||
| Earnings (loss) per unit—basic |
$ | (15.76 | ) | $ | (16.01 | ) | $ | 18.60 | ||||
|
|
|
|
|
|
|
|||||||
| Earnings (loss) per unit—diluted |
$ | (15.76 | ) | $ | (16.01 | ) | $ | 183.60 | ||||
|
|
|
|
|
|
|
|||||||
| Weighted average common units outstanding—basic |
1,000,000 | 806,849 | 530,000 | |||||||||
| Potential dilutive effect of potential common units |
— | — | ||||||||||
|
|
|
|
|
|
|
|||||||
| Weighted average common units outstanding—diluted |
1,000,000 | 806,849 | 530,000 | |||||||||
|
|
|
|
|
|
|
|||||||
There is no earnings per unit presented for the Class B common units, both basic and diluted, as there are no units outstanding and the options are not probable of vesting as of December 31, 2019. Share-based awards to purchase 50,000 units of Class B common units were not included in the above calculation of diluted earnings (loss) per unit for the years ended December 31, 2019, 2018 and 2017 because the effect of these instruments was anti-dilutive.
15. Subsequent Events
The Company has evaluated subsequent events after December 31, 2019 through December 2, 2020, the date that the consolidated financial statements were available to be issued, noting the below transaction.
Acquisition of Roomored, Inc.
On July 23, 2020, the Company entered into a merger agreement with Roomored, Inc., (“Roomored”) which was accounted for under the acquisition method as prescribed by ASC 805, Business Combinations (“ASC 805”). The Company paid $15.3 million of cash as consideration at the closing of the merger. Additionally, the Company had a previous cost method investment in Roomored of $1.2 million, which was remeasured at the acquisition date to a step-up in fair value of $2.6 million, which was also included as consideration of the acquisition, making total consideration for Roomored $17.9 million. Due to the step-up-in fair value of its previous cost method investment, the Company recorded a gain of $1.4 million during the nine months ended September 30, 2020.
F-62
Table of Contents
INTERIOR LOGIC GROUP HOLDINGS, LLC
NOTES TO CONSOLIDATED FINANCIAL STATEMENTS—(Continued)
The following table summarizes the amounts of identified assets acquired and liabilities assumed based on the estimated fair value at the purchase date, as well as total purchase price consideration (in thousands):
| Roomored | ||||
| Estimated fair values: |
||||
| Current assets |
$ | 563 | ||
| Property and equipment |
10 | |||
| Trademarks |
200 | |||
| Developed technology |
4,300 | |||
| Non-compete covenants |
300 | |||
| Customer relationships |
1,100 | |||
| Goodwill |
11,655 | |||
| Current liabilities |
(180 | ) | ||
|
|
|
|||
| Total consideration |
$ | 17,948 | ||
|
|
|
|||
Upon closing, $1.7 million of the transaction consideration was placed in escrow in accordance with the terms of the merger agreement to provide for contingencies that could arise subsequent to the closing date. The $1.7 million, less any deductions made in accordance with the merger agreement, will be released to the sellers of Roomored within the 24 months following the closing of the merger. The preliminary allocation of the consideration transferred is subject to change during the measurement period (up to one year from the acquisition date) as the Company finalizes the valuation of deferred tax assets and intangible assets acquired and deferred tax liabilities assumed in connection with the acquisition.
F-63
Table of Contents
Shares
Interior Logic Group Holdings, Inc.
Common Stock
PROSPECTUS
Citigroup
Goldman Sachs & Co. LLC
BofA Securities
Baird
Evercore ISI
Jefferies
RBC Capital Markets
Stephens Inc.
Truist Securities
UBS Investment Bank
, 2021
Through and including , 2021 (25 days after the date of this prospectus), all dealers that buy, sell or trade our common stock, whether or not participating in this offering, may be required to deliver a prospectus. This delivery requirement is in addition to the obligation of dealers to deliver a prospectus when acting as underwriters and with respect to their unsold allotments or subscriptions.
Table of Contents
PART II
INFORMATION NOT REQUIRED IN PROSPECTUS
Item 13. Other Expenses of Issuance and Distribution.
The following table sets forth the costs and expenses, other than the underwriting discounts and commissions, payable in connection with the sale of common stock being registered. All amounts shown are estimates, except the Securities and Exchange Commission registration fee, the Financial Industry Regulatory Authority filing fee and the listing fee.
| Securities and Exchange Commission registration fee |
$ | * | ||
| Financial Industry Regulatory Authority filing fee |
* | |||
| Nasdaq listing fee |
* | |||
| Legal fees and expenses |
* | |||
| Accountants’ fees and expenses |
* | |||
| Printing expenses |
* | |||
| Transfer agent and registrar fees and expenses |
* | |||
| Miscellaneous |
* | |||
|
|
|
|||
| Total |
$ | * | ||
|
|
|
| * | To be provided by amendment. |
Item 14. Indemnification of Directors and Officers.
We are incorporated under the laws of the state of Delaware. Section 145 of the Delaware General Corporation Law provides that a Delaware corporation may indemnify any persons who are, or are threatened to be made, parties to any threatened, pending or completed action, suit or proceeding, whether civil, criminal, administrative or investigative (other than an action by or in the right of such corporation), by reason of the fact that such person was an officer, director, employee or agent of such corporation, or is or was serving at the request of such person as an officer, director, employee or agent of another corporation or enterprise. The indemnity may include expenses (including attorneys’ fees), judgments, fines and amounts paid in settlement actually and reasonably incurred by such person in connection with such action, suit or proceeding, provided that such person acted in good faith and in a manner he or she reasonably believed to be in or not opposed to the corporation’s best interests and, with respect to any criminal action or proceeding, had no reasonable cause to believe that his or her conduct was illegal. A Delaware corporation may indemnify any persons who are, or are threatened to be made, a party to any threatened, pending or completed action or suit by or in the right of the corporation by reason of the fact that such person was a director, officer, employee or agent of such corporation, or is or was serving at the request of such corporation as a director, officer, employee or agent of another corporation or enterprise. The indemnity may include expenses (including attorneys’ fees) actually and reasonably incurred by such person in connection with the defense or settlement of such action or suit provided such person acted in good faith and in a manner he or she reasonably believed to be in or not opposed to the corporation’s best interests, except that no indemnification is permitted without judicial approval if the officer or director is adjudged to be liable to the corporation. Where an officer or director is successful on the merits or otherwise in the defense of any action referred to above, the corporation must indemnify him or her against the expenses that such officer or director has actually and reasonably incurred. Our charter and bylaws provide for the indemnification of our directors and officers to the fullest extent permitted under the Delaware General Corporation Law.
Section 102(b)(7) of the Delaware General Corporation Law permits a corporation to provide in its certificate of incorporation that a director of the corporation shall not be personally liable to the corporation or its stockholders for monetary damages for breach of fiduciary duties as a director, except for liability for:
| • | any breach of the director’s duty of loyalty to us or our stockholders; |
II-1
Table of Contents
| • | any act or omission not in good faith or that involves intentional misconduct or a knowing violation of law; |
| • | any act related to unlawful stock repurchases, redemptions or other distributions or payment of dividends; or |
| • | any transaction from which the director derived an improper personal benefit. |
These limitations of liability do not affect the availability of equitable remedies such as injunctive relief or rescission. Our charter also authorizes us to indemnify our officers, directors and other agents to the fullest extent permitted under Delaware law.
As permitted by Section 145 of the Delaware General Corporation Law, our bylaws provide that:
| • | we may indemnify our directors, officers and employees to the fullest extent permitted by the Delaware General Corporation Law, subject to limited exceptions; |
| • | we may advance expenses to our directors, officers and employees in connection with a legal proceeding to the fullest extent permitted by the Delaware General Corporation Law, subject to limited exceptions; and |
| • | the rights provided in our bylaws are not exclusive. |
Section 174 of the Delaware General Corporation Law provides, among other things, that a director who willfully or negligently approves of an unlawful payment of dividends or an unlawful stock purchase or redemption may be held liable for such actions. A director who was either absent when the unlawful actions were approved, or dissented at the time, may avoid liability by causing his or her dissent to such actions to be entered in the books containing minutes of the meetings of the board of directors at the time such action occurred or immediately after such absent director receives notice of the unlawful acts.
As permitted by the Delaware General Corporation Law, we have entered and expect to continue to enter into agreements to indemnify our directors, executive officers and other employees as determined by our board of directors. Under the terms of our indemnification agreements, we are required to indemnify each of our directors and officers, to the fullest extent permitted by the laws of the state of Delaware, if the basis of the indemnitee’s involvement was by reason of the fact that the indemnitee is or was a director, or officer of the company or any of its subsidiaries or was serving at the company’s request in an official capacity for another entity. We must indemnify our officers and directors against (1) attorneys’ fees and (2) all other costs of any type or nature whatsoever, including any and all expenses and obligations paid or incurred in connection with investigating, defending, being a witness in, participating in (including on appeal), or preparing to defend, be a witness or participate in any completed, actual, pending or threatened action, suit, claim or proceeding, whether civil, criminal, administrative or investigative, or establishing or enforcing a right to indemnification under the indemnification agreement. The indemnification agreements also set forth certain procedures that will apply in the event of a claim for indemnification thereunder. These indemnification provisions and the indemnification agreements may be sufficiently broad to permit indemnification of our officers and directors for liabilities, including reimbursement of expenses incurred, arising under the Securities Act.
In addition, we have purchased a policy of directors’ and officers’ liability insurance that insures our directors and officers against the cost of defense, settlement or payment of a judgment in some circumstances.
The form of Underwriting Agreement, to be filed as Exhibit 1.1 hereto, provides for indemnification by the underwriters of us and our officers who sign this registration statement and directors for specified liabilities, including matters arising under the Securities Act.
II-2
Table of Contents
Item 15. Recent Sales of Unregistered Securities.
During the three-year period preceding the date of filing of this registration statement, Interior Logic Group Holdings, LLC has issued securities in the transactions described below without registration under the Securities Act.
Issuance of Class A Units
On May 31, 2018, in connection with the Business Combination, the Company issued 530,000 Class A Units to Faraday and 470,000 Class A Units to ISH in exchange for the contributions of legacy ISI and legacy ILG, respectively. See “The Business Combination” in the prospectus contained herein and note 1 and note 5 of our audited consolidated financial statements accompanying the prospectus for additional information.
Option Grants
On October 22, 2018, in connection with the commencement of his employment, Mr. Peel received options to purchase 13,125 of the Company’s Class B Units at an exercise price per unit of $551.95.
On May 23, 2019, Mr. Davenport received options to purchase 5,812 of the Company’s Class B Units at an exercise price per unit of $574.68.
On October 21, 2019, Mr. Bader received options to purchase 750 of the Company’s Class B Units at an exercise price per unit of $574.68
On November 6, 2019, Mr. Trapp received options to purchase 1,510 of the Company’s Class B Units at an exercise price per unit of $574.68.
On November 6, 2019, Mr. Strulson received options to purchase 1,455 of the Company’s Class B Units at an exercise price per unit of $574.68.
On November 6, 2019, Ms. Liu received options to purchase 2,593 of the Company’s Class B Units at an exercise price per unit of $574.68.
On November 6, 2019, Mr. Peel received options to purchase 4,779 of the Company’s Class B Units at an exercise price per unit of $574.68.
On November 6, 2019, Ms. Carter received options to purchase 500 of the Company’s Class B Units at an exercise price per unit of $574.68. In October 2020, Ms. Carter also received options to purchase 500 of the Company’s Class B Units at an exercise price per unit of $900.
On November 6, 2019, Ms. Jovanovic received options to purchase 750 of the Company’s Class B Units at an exercise price per unit of $574.68.
Additionally, on April 2, 2019, August 8, 2019, September 12, 2019, November 6, 2019, June 25, 2020, July 23, 2020 and September 16, 2020, certain of our other employees received options to purchase an aggregate of 11,113 of our Class B Units at an exercise price per unit of $574.68.
For each of the grants listed above, the option awards vest as to 20% of the options on each of the first four anniversaries of the vesting commencement date, and the remaining 20% vest at such time as Littlejohn, Platinum Equity, and their affiliates own less than 30% of the Class A Units that they held as of the date of grant. Upon the completion of the initial public offering, the outstanding equity awards with respect to the Company’s Class B Units will be converted into equity awards with respect to shares of the Company’s common stock. None of the options have been exercised.
II-3
Table of Contents
None of the foregoing transactions involved any underwriters, underwriting discounts or commissions, or any public offering, and the Registrant believes each transaction was exempt from the registration requirements of the Securities Act in reliance upon Section 4(a)(2) of the Securities Act and Rules 506 or 701 promulgated thereunder. Furthermore, the Company affixed appropriate legends to the share certificates and instruments issued in each foregoing transaction setting forth that the securities had not been registered and the applicable restrictions on transfer.
Item 16. Exhibits and Financial Statement Schedules.
(a) Exhibits. See the “Index to Exhibits” attached to this registration statement, which is incorporated by reference herein.
(b) Financial Statement Schedules. Schedules not listed above have been omitted because the information required to be set forth therein is not applicable or is shown in the financial statements or the notes thereto.
Item 17. Undertakings.
The undersigned registrant hereby undertakes to provide to the underwriters at the closing specified in the underwriting agreement, certificates in such denominations and registered in such names as required by the underwriters to permit prompt delivery to each purchaser.
Insofar as indemnification for liabilities arising under the Securities Act may be permitted to directors, officers and controlling persons of the registrant pursuant to the provisions referred to in Item 14 of this registration statement or otherwise, the registrant has been advised that in the opinion of the Securities and Exchange Commission such indemnification is against public policy as expressed in the Securities Act and is, therefore, unenforceable. In the event that a claim for indemnification against such liabilities (other than the payment by the registrant of expenses incurred or paid by a director, officer or controlling person of the registrant in the successful defense of any action, suit or proceeding) is asserted by such director, officer or controlling person in connection with the securities being registered, the registrant will, unless in the opinion of its counsel the matter has been settled by controlling precedent, submit to a court of appropriate jurisdiction the question of whether such indemnification by it is against public policy as expressed in the Securities Act and will be governed by the final adjudication of such issue.
The undersigned registrant hereby undertakes that:
(1) for purposes of determining any liability under the Securities Act, the information omitted from the form of prospectus filed as part of this registration statement in reliance upon Rule 430A and contained in a form of prospectus filed by the registrant pursuant to Rule 424(b)(1) or (4) or 497(h) under the Securities Act of 1933 shall be deemed to be part of this registration statement as of the time it was declared effective; and
(2) for the purpose of determining any liability under the Securities Act, each post-effective amendment that contains a form of prospectus shall be deemed to be a new registration statement relating to the securities offered therein, and the offering of such securities at that time shall be deemed to be the initial bona fide offering thereof.
II-4
Table of Contents
INDEX TO EXHIBITS
II-5
Table of Contents
| Exhibit Number |
Description | |||
| 10.15 | Form of Non-Statutory Unit Option Award Agreement under the Faraday Holdings, LLC 2015 Equity Incentive Plan.# | |||
| 10.16 | Interior Logic Group Holdings, LLC 2018 Equity Incentive Plan.# | |||
| 10.17 | Form of Non-Statutory Unit Option Award Agreement under the Interior Logic Group Holdings, LLC 2018 Equity Incentive Plan.# | |||
| 10.18 | Interior Logic Group Holdings, Inc. 2021 Omnibus Incentive Plan.*# | |||
| 21.1 | List of Subsidiaries. | |||
| 23.1 | Consent of Independent Registered Public Accounting Firm. | |||
| 23.2 | Consent of Holland & Knight LLP (included in Exhibit 5.1).* | |||
| 24.1 | Power of Attorney. Reference is made to the signature page to the registration statement. | |||
| * | To be filed by amendment. |
| # | Indicates management contract or compensatory plan. |
| (1) | Exhibits and schedules have been omitted pursuant to Item 601(a)(5) of Regulation S-K and will be supplementally provided to the Securities and Exchange Commission upon request. |
II-6
Table of Contents
Pursuant to the requirements of the Securities Act of 1933, as amended, the registrant has duly caused this Registration Statement on Form S-1 to be signed on its behalf by the undersigned, thereunto duly authorized, in the city of Irvine, in the State of California, on this 8th day of January, 2021.
| INTERIOR LOGIC GROUP HOLDINGS, LLC | ||
| By: |
/s/ Alan K. Davenport | |
| Alan K. Davenport | ||
| Chief Executive Officer | ||
KNOW ALL MEN BY THESE PRESENTS, that each person whose signature appears below constitutes and appoints Alan K. Davenport, Richard D. Strulson and Anne M. Liu his or her true and lawful attorneys-in-fact and agents, with full power to act separately and full power of substitution and resubstitution, for him or her and in his or her name, place and stead, in any and all capacities, to sign any and all amendments (including post-effective amendments) to this Registration Statement and all additional registration statements pursuant to Rule 462(b) of the Securities Act of 1933, as amended, and to file the same, with all exhibits thereto, and all other documents in connection therewith, with the Securities and Exchange Commission, granting unto said attorneys-in-fact and agents full power and authority to do and perform each and every act in person, hereby ratifying and confirming all that said attorneys-in-fact and agents or his substitute or substitutes may lawfully do or cause to be done by virtue hereof.
Pursuant to the requirements of the Securities Act of 1933, as amended, this Registration Statement on Form S-1 has been signed by the following persons in the capacities and on the dates indicated.
| Signature |
Title |
Date | ||
| /s/ Alan K. Davenport Alan K. Davenport |
Chief Executive Officer and Chairman (Principal Executive Officer) |
January 8, 2021 | ||
| /s/ Anne M. Liu Anne M. Liu |
Executive Vice President and Chief Financial Officer (Principal Financial Officer and Principal Accounting Officer) |
January 8, 2021 | ||
| /s/ Paul T. Bader Paul T. Bader |
Director |
January 8, 2021 | ||
| /s/ Margot L. Carter Margot L. Carter |
Director |
January 8, 2021 | ||
| /s/ Brandon J. Crawley Brandon J. Crawley |
Director |
January 8, 2021 | ||
| /s/ Robert E. Davis Robert E. Davis |
Director |
January 8, 2021 | ||
| /s/ Todd D. Golditch Todd D. Golditch |
Director |
January 8, 2021 | ||
II-7
Table of Contents
| Signature |
Title |
Date | ||
| /s/ Janine S. Jovanovic Janine S. Jovanovic |
Director |
January 8, 2021 | ||
| /s/ Steven G. Raich Steven G. Raich |
Director |
January 8, 2021 | ||
| /s/ James B. Wigdale III James B. Wigdale III |
Director |
January 8, 2021 | ||
II-8