Attached files
| file | filename |
|---|---|
| EX-10.1 - EX-10.1 - Garrett Motion Inc. | d74296dex101.htm |
| 8-K - 8-K - Garrett Motion Inc. | d74296d8k.htm |

Exhibit 99.1 December 2020 REVISED BUSINESS OUTLOOKExhibit 99.1 December 2020 REVISED BUSINESS OUTLOOK
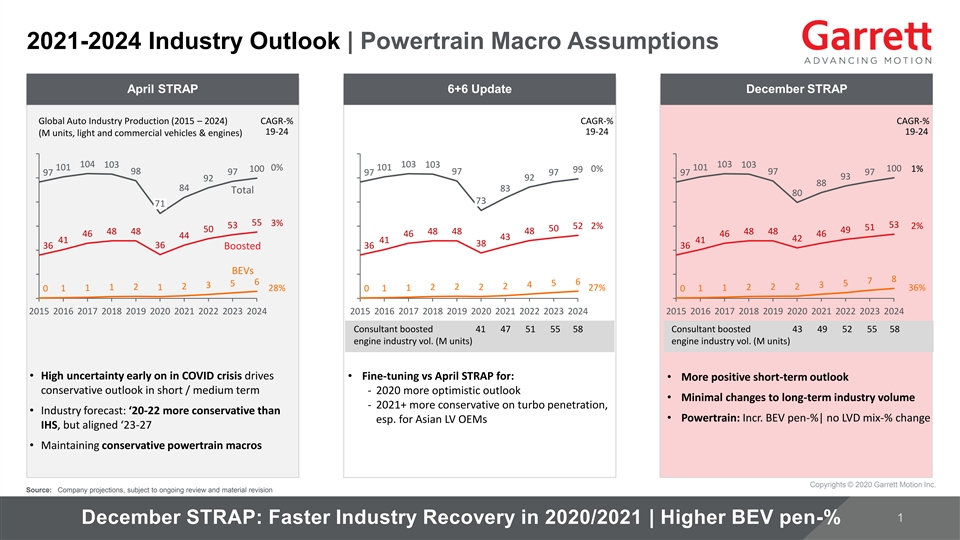
2021-2024 Industry Outlook | Powertrain Macro Assumptions April STRAP 6+6 Update December STRAP Global Auto Industry Production (2015 – 2024) CAGR-% CAGR-% CAGR-% 19-24 19-24 19-24 (M units, light and commercial vehicles & engines) 104 103 103 103 103 103 101 101 101 0% 100 100 0% 1% 99 98 97 97 97 97 97 97 97 97 93 92 92 88 84 83 Total 80 73 71 55 3% 53 53 52 2% 2% 51 50 50 49 48 48 48 48 48 48 48 46 46 46 46 44 43 42 41 41 41 38 36 36 Boosted 36 36 BEVs 8 7 6 6 5 5 5 3 4 3 2 2 1 2 1 2 2 2 2 2 2 1 1 28% 1 1 27% 1 1 36% 0 0 0 2015 2016 2017 2018 2019 2020 2021 2022 2023 2024 2015 2016 2017 2018 2019 2020 2021 2022 2023 2024 2015 2016 2017 2018 2019 2020 2021 2022 2023 2024 Consultant boosted 41 47 51 55 58 Consultant boosted 43 49 52 55 58 engine industry vol. (M units) engine industry vol. (M units) • High uncertainty early on in COVID crisis drives • Fine-tuning vs April STRAP for: • More positive short-term outlook conservative outlook in short / medium term - 2020 more optimistic outlook • Minimal changes to long-term industry volume - 2021+ more conservative on turbo penetration, • Industry forecast: ‘20-22 more conservative than • Powertrain: Incr. BEV pen-%| no LVD mix-% change esp. for Asian LV OEMs IHS, but aligned ‘23-27 • Maintaining conservative powertrain macros Copyrights © 2020 Garrett Motion Inc. Source: Company projections, subject to ongoing review and material revision December STRAP: Faster Industry Recovery in 2020/2021 | Higher BEV pen-% 2021-2024 Industry Outlook | Powertrain Macro Assumptions April STRAP 6+6 Update December STRAP Global Auto Industry Production (2015 – 2024) CAGR-% CAGR-% CAGR-% 19-24 19-24 19-24 (M units, light and commercial vehicles & engines) 104 103 103 103 103 103 101 101 101 0% 100 100 0% 1% 99 98 97 97 97 97 97 97 97 97 93 92 92 88 84 83 Total 80 73 71 55 3% 53 53 52 2% 2% 51 50 50 49 48 48 48 48 48 48 48 46 46 46 46 44 43 42 41 41 41 38 36 36 Boosted 36 36 BEVs 8 7 6 6 5 5 5 3 4 3 2 2 1 2 1 2 2 2 2 2 2 1 1 28% 1 1 27% 1 1 36% 0 0 0 2015 2016 2017 2018 2019 2020 2021 2022 2023 2024 2015 2016 2017 2018 2019 2020 2021 2022 2023 2024 2015 2016 2017 2018 2019 2020 2021 2022 2023 2024 Consultant boosted 41 47 51 55 58 Consultant boosted 43 49 52 55 58 engine industry vol. (M units) engine industry vol. (M units) • High uncertainty early on in COVID crisis drives • Fine-tuning vs April STRAP for: • More positive short-term outlook conservative outlook in short / medium term - 2020 more optimistic outlook • Minimal changes to long-term industry volume - 2021+ more conservative on turbo penetration, • Industry forecast: ‘20-22 more conservative than • Powertrain: Incr. BEV pen-%| no LVD mix-% change esp. for Asian LV OEMs IHS, but aligned ‘23-27 • Maintaining conservative powertrain macros Copyrights © 2020 Garrett Motion Inc. Source: Company projections, subject to ongoing review and material revision December STRAP: Faster Industry Recovery in 2020/2021 | Higher BEV pen-%
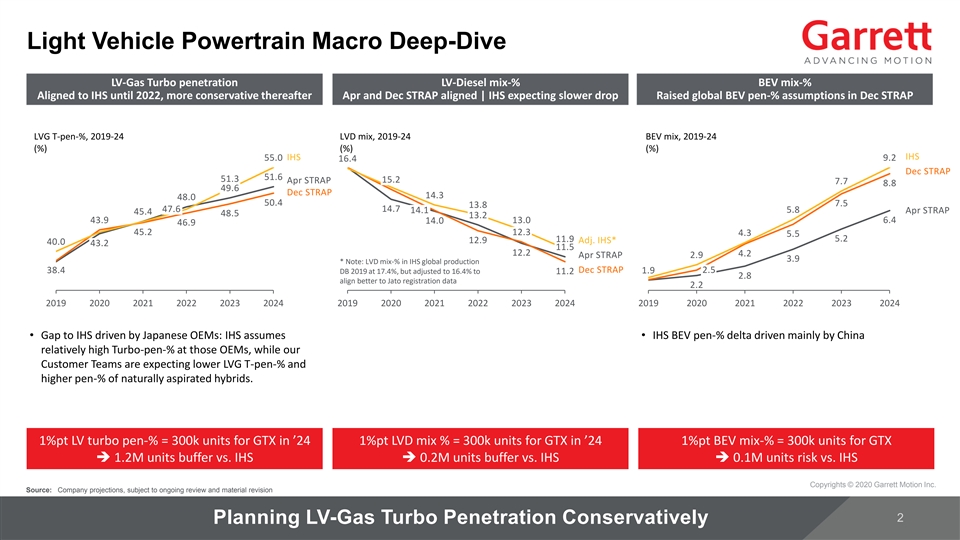
Light Vehicle Powertrain Macro Deep-Dive LV-Gas Turbo penetration LV-Diesel mix-% BEV mix-% Aligned to IHS until 2022, more conservative thereafter Apr and Dec STRAP aligned | IHS expecting slower drop Raised global BEV pen-% assumptions in Dec STRAP LVG T-pen-%, 2019-24 LVD mix, 2019-24 BEV mix, 2019-24 (%) (%) (%) IHS IHS 55.0 9.2 16.4 Dec STRAP 51.6 51.3 Apr STRAP 15.2 7.7 8.8 49.6 Dec STRAP 14.3 48.0 50.4 7.5 13.8 47.6 14.7 14.1 5.8 Apr STRAP 45.4 48.5 13.2 43.9 13.0 6.4 14.0 46.9 45.2 12.3 4.3 5.5 11.9 5.2 12.9 Adj. IHS* 40.0 43.2 11.5 12.2 4.2 Apr STRAP 2.9 3.9 * Note: LVD mix-% in IHS global production 38.4 Dec STRAP 1.9 2.5 DB 2019 at 17.4%, but adjusted to 16.4% to 11.2 2.8 align better to Jato registration data 2.2 2019 2020 2021 2022 2023 2024 2019 2020 2021 2022 2023 2024 2019 2020 2021 2022 2023 2024 • Gap to IHS driven by Japanese OEMs: IHS assumes • IHS BEV pen-% delta driven mainly by China relatively high Turbo-pen-% at those OEMs, while our Customer Teams are expecting lower LVG T-pen-% and higher pen-% of naturally aspirated hybrids. 1%pt LV turbo pen-% = 300k units for GTX in ’24 1%pt LVD mix % = 300k units for GTX in ’24 1%pt BEV mix-% = 300k units for GTX ➔ 1.2M units buffer vs. IHS➔ 0.2M units buffer vs. IHS➔ 0.1M units risk vs. IHS Copyrights © 2020 Garrett Motion Inc. Source: Company projections, subject to ongoing review and material revision Planning LV-Gas Turbo Penetration ConservativelyLight Vehicle Powertrain Macro Deep-Dive LV-Gas Turbo penetration LV-Diesel mix-% BEV mix-% Aligned to IHS until 2022, more conservative thereafter Apr and Dec STRAP aligned | IHS expecting slower drop Raised global BEV pen-% assumptions in Dec STRAP LVG T-pen-%, 2019-24 LVD mix, 2019-24 BEV mix, 2019-24 (%) (%) (%) IHS IHS 55.0 9.2 16.4 Dec STRAP 51.6 51.3 Apr STRAP 15.2 7.7 8.8 49.6 Dec STRAP 14.3 48.0 50.4 7.5 13.8 47.6 14.7 14.1 5.8 Apr STRAP 45.4 48.5 13.2 43.9 13.0 6.4 14.0 46.9 45.2 12.3 4.3 5.5 11.9 5.2 12.9 Adj. IHS* 40.0 43.2 11.5 12.2 4.2 Apr STRAP 2.9 3.9 * Note: LVD mix-% in IHS global production 38.4 Dec STRAP 1.9 2.5 DB 2019 at 17.4%, but adjusted to 16.4% to 11.2 2.8 align better to Jato registration data 2.2 2019 2020 2021 2022 2023 2024 2019 2020 2021 2022 2023 2024 2019 2020 2021 2022 2023 2024 • Gap to IHS driven by Japanese OEMs: IHS assumes • IHS BEV pen-% delta driven mainly by China relatively high Turbo-pen-% at those OEMs, while our Customer Teams are expecting lower LVG T-pen-% and higher pen-% of naturally aspirated hybrids. 1%pt LV turbo pen-% = 300k units for GTX in ’24 1%pt LVD mix % = 300k units for GTX in ’24 1%pt BEV mix-% = 300k units for GTX ➔ 1.2M units buffer vs. IHS➔ 0.2M units buffer vs. IHS➔ 0.1M units risk vs. IHS Copyrights © 2020 Garrett Motion Inc. Source: Company projections, subject to ongoing review and material revision Planning LV-Gas Turbo Penetration Conservatively
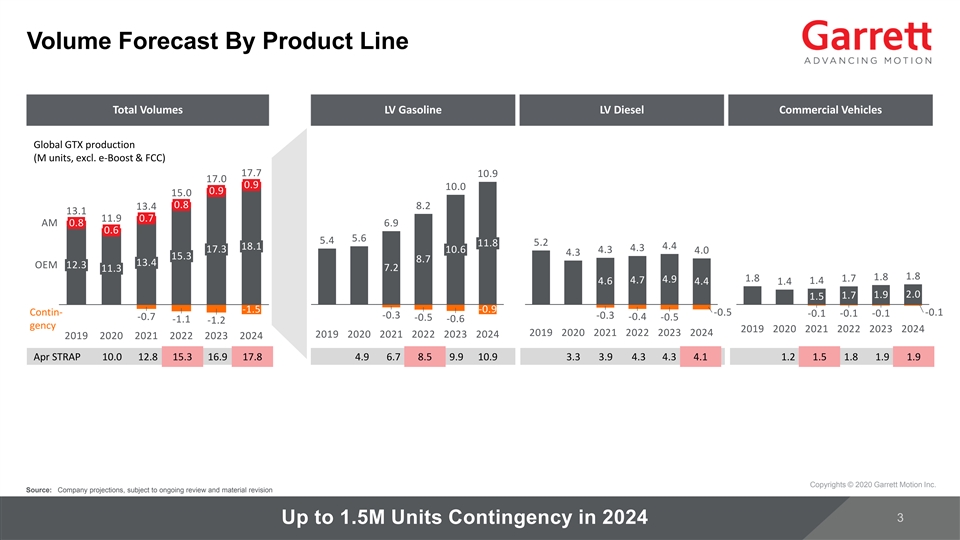
Volume Forecast By Product Line Total Volumes LV Gasoline LV Diesel Commercial Vehicles Global GTX production (M units, excl. e-Boost & FCC) 17.7 10.9 17.0 0.9 10.0 0.9 15.0 0.8 8.2 13.4 13.1 11.9 0.7 AM 0.8 6.9 0.6 5.6 5.4 11.8 5.2 4.4 18.1 4.3 17.3 10.6 4.3 4.0 4.3 15.3 8.7 13.4 OEM 12.3 7.2 11.3 1.8 1.8 1.8 1.7 4.7 4.9 4.6 1.4 4.4 1.4 1.9 2.0 1.7 1.5 -1.5 -0.9 Contin- -0.5 -0.1 -0.1 -0.1 -0.1 -0.3 -0.3 -0.7 -0.4 -0.5 -0.5 -0.6 -1.1 -1.2 gency 2019 2020 2021 2022 2023 2024 2019 2020 2021 2022 2023 2024 2019 2020 2021 2022 2023 2024 2019 2020 2021 2022 2023 2024 Apr STRAP 10.0 12.8 15.3 16.9 17.8 4.9 6.7 8.5 9.9 10.9 3.3 3.9 4.3 4.3 4.1 1.2 1.5 1.8 1.9 1.9 Copyrights © 2020 Garrett Motion Inc. Source: Company projections, subject to ongoing review and material revision Up to 1.5M Units Contingency in 2024Volume Forecast By Product Line Total Volumes LV Gasoline LV Diesel Commercial Vehicles Global GTX production (M units, excl. e-Boost & FCC) 17.7 10.9 17.0 0.9 10.0 0.9 15.0 0.8 8.2 13.4 13.1 11.9 0.7 AM 0.8 6.9 0.6 5.6 5.4 11.8 5.2 4.4 18.1 4.3 17.3 10.6 4.3 4.0 4.3 15.3 8.7 13.4 OEM 12.3 7.2 11.3 1.8 1.8 1.8 1.7 4.7 4.9 4.6 1.4 4.4 1.4 1.9 2.0 1.7 1.5 -1.5 -0.9 Contin- -0.5 -0.1 -0.1 -0.1 -0.1 -0.3 -0.3 -0.7 -0.4 -0.5 -0.5 -0.6 -1.1 -1.2 gency 2019 2020 2021 2022 2023 2024 2019 2020 2021 2022 2023 2024 2019 2020 2021 2022 2023 2024 2019 2020 2021 2022 2023 2024 Apr STRAP 10.0 12.8 15.3 16.9 17.8 4.9 6.7 8.5 9.9 10.9 3.3 3.9 4.3 4.3 4.1 1.2 1.5 1.8 1.9 1.9 Copyrights © 2020 Garrett Motion Inc. Source: Company projections, subject to ongoing review and material revision Up to 1.5M Units Contingency in 2024
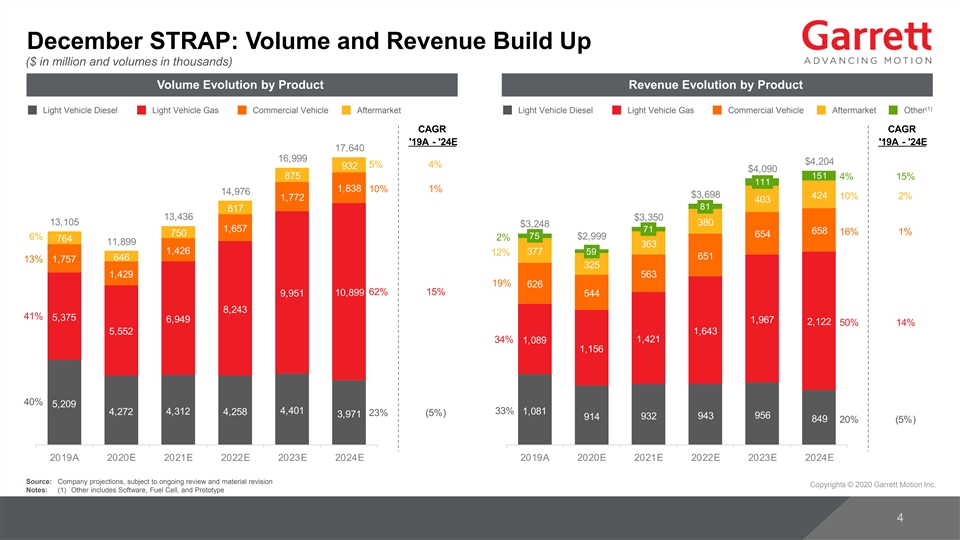
December STRAP: Volume and Revenue Build Up ($ in million and volumes in thousands) Volume Evolution by Product Revenue Evolution by Product (1) Light Vehicle Diesel Light Vehicle Gas Commercial Vehicle Aftermarket Light Vehicle Diesel Light Vehicle Gas Commercial Vehicle Aftermarket Other CAGR CAGR '19A - '24E '19A - '24E 17,640 16,999 $4,204 5% 4% 932 $4,090 875 151 4% 15% 111 1,838 10% 1% 14,976 $3,698 424 10% 2% 1,772 403 81 817 13,436 $3,350 13,105 380 $3,248 1,657 71 658 16% 1% 750 654 75 6% $2,999 2% 764 11,899 363 1,426 377 59 12% 651 646 13% 1,757 325 1,429 563 19% 626 62% 15% 10,899 9,951 544 8,243 41% 5,375 6,949 1,967 2,122 50% 14% 5,552 1,643 34% 1,421 1,089 1,156 40% 5,209 4,401 33% 4,272 4,312 4,258 1,081 23% (5%) 3,971 932 943 956 914 849 20% (5%) 2019A 2020E 2021E 2022E 2023E 2024E 2019A 2020E 2021E 2022E 2023E 2024E Source: Company projections, subject to ongoing review and material revision Copyrights © 2020 Garrett Motion Inc. Notes: (1) Other includes Software, Fuel Cell, and PrototypeDecember STRAP: Volume and Revenue Build Up ($ in million and volumes in thousands) Volume Evolution by Product Revenue Evolution by Product (1) Light Vehicle Diesel Light Vehicle Gas Commercial Vehicle Aftermarket Light Vehicle Diesel Light Vehicle Gas Commercial Vehicle Aftermarket Other CAGR CAGR '19A - '24E '19A - '24E 17,640 16,999 $4,204 5% 4% 932 $4,090 875 151 4% 15% 111 1,838 10% 1% 14,976 $3,698 424 10% 2% 1,772 403 81 817 13,436 $3,350 13,105 380 $3,248 1,657 71 658 16% 1% 750 654 75 6% $2,999 2% 764 11,899 363 1,426 377 59 12% 651 646 13% 1,757 325 1,429 563 19% 626 62% 15% 10,899 9,951 544 8,243 41% 5,375 6,949 1,967 2,122 50% 14% 5,552 1,643 34% 1,421 1,089 1,156 40% 5,209 4,401 33% 4,272 4,312 4,258 1,081 23% (5%) 3,971 932 943 956 914 849 20% (5%) 2019A 2020E 2021E 2022E 2023E 2024E 2019A 2020E 2021E 2022E 2023E 2024E Source: Company projections, subject to ongoing review and material revision Copyrights © 2020 Garrett Motion Inc. Notes: (1) Other includes Software, Fuel Cell, and Prototype
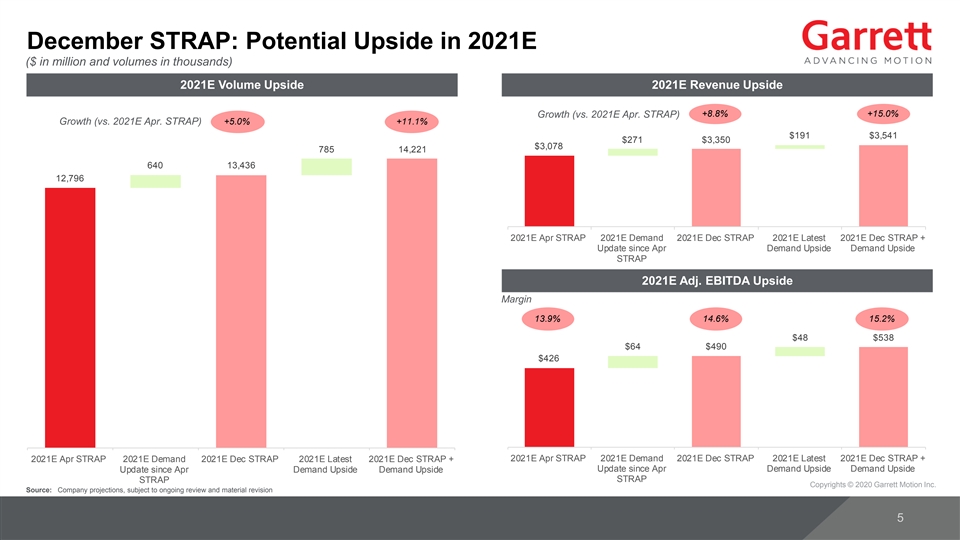
December STRAP: Potential Upside in 2021E ($ in million and volumes in thousands) 2021E Volume Upside 2021E Revenue Upside +8.8% +15.0% Growth (vs. 2021E Apr. STRAP) Growth (vs. 2021E Apr. STRAP) +5.0% +11.1% $191 $3,541 $271 $3,350 $3,078 785 14,221 640 13,436 12,796 2021E Apr STRAP 2021E Demand 2021E Dec STRAP 2021E Latest 2021E Dec STRAP + Update since Apr Demand Upside Demand Upside STRAP 2021E Adj. EBITDA Upside Margin 13.9% 14.6% 15.2% $48 $538 $64 $490 $426 2021E Apr STRAP 2021E Demand 2021E Dec STRAP 2021E Latest 2021E Dec STRAP + 2021E Apr STRAP 2021E Demand 2021E Dec STRAP 2021E Latest 2021E Dec STRAP + Update since Apr Demand Upside Demand Upside Update since Apr Demand Upside Demand Upside STRAP STRAP Copyrights © 2020 Garrett Motion Inc. Source: Company projections, subject to ongoing review and material revisionDecember STRAP: Potential Upside in 2021E ($ in million and volumes in thousands) 2021E Volume Upside 2021E Revenue Upside +8.8% +15.0% Growth (vs. 2021E Apr. STRAP) Growth (vs. 2021E Apr. STRAP) +5.0% +11.1% $191 $3,541 $271 $3,350 $3,078 785 14,221 640 13,436 12,796 2021E Apr STRAP 2021E Demand 2021E Dec STRAP 2021E Latest 2021E Dec STRAP + Update since Apr Demand Upside Demand Upside STRAP 2021E Adj. EBITDA Upside Margin 13.9% 14.6% 15.2% $48 $538 $64 $490 $426 2021E Apr STRAP 2021E Demand 2021E Dec STRAP 2021E Latest 2021E Dec STRAP + 2021E Apr STRAP 2021E Demand 2021E Dec STRAP 2021E Latest 2021E Dec STRAP + Update since Apr Demand Upside Demand Upside Update since Apr Demand Upside Demand Upside STRAP STRAP Copyrights © 2020 Garrett Motion Inc. Source: Company projections, subject to ongoing review and material revision
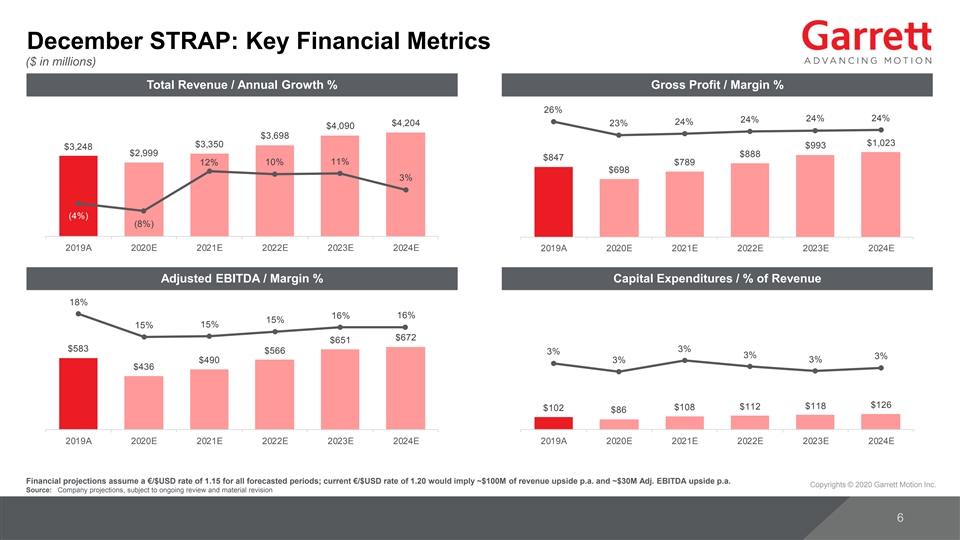
December STRAP: Key Financial Metrics ($ in millions) Total Revenue / Annual Growth % Gross Profit / Margin % 26% 24% 24% 24% 24% $4,204 23% $4,090 $3,698 $1,023 $3,350 $993 $3,248 $2,999 $888 $847 12% 10% 11% $789 $698 3% (4%) (8%) 2019A 2020E 2021E 2022E 2023E 2024E 2019A 2020E 2021E 2022E 2023E 2024E Adjusted EBITDA / Margin % Capital Expenditures / % of Revenue 18% 16% 16% 15% 15% 15% $672 $651 $583 3% $566 3% 3% 3% $490 3% 3% $436 $126 $118 $108 $112 $102 $86 2019A 2020E 2021E 2022E 2023E 2024E 2019A 2020E 2021E 2022E 2023E 2024E Financial projections assume a €/$USD rate of 1.15 for all forecasted periods; current €/$USD rate of 1.20 would imply ~$100M of revenue upside p.a. and ~$30M Adj. EBITDA upside p.a. Copyrights © 2020 Garrett Motion Inc. Source: Company projections, subject to ongoing review and material revisionDecember STRAP: Key Financial Metrics ($ in millions) Total Revenue / Annual Growth % Gross Profit / Margin % 26% 24% 24% 24% 24% $4,204 23% $4,090 $3,698 $1,023 $3,350 $993 $3,248 $2,999 $888 $847 12% 10% 11% $789 $698 3% (4%) (8%) 2019A 2020E 2021E 2022E 2023E 2024E 2019A 2020E 2021E 2022E 2023E 2024E Adjusted EBITDA / Margin % Capital Expenditures / % of Revenue 18% 16% 16% 15% 15% 15% $672 $651 $583 3% $566 3% 3% 3% $490 3% 3% $436 $126 $118 $108 $112 $102 $86 2019A 2020E 2021E 2022E 2023E 2024E 2019A 2020E 2021E 2022E 2023E 2024E Financial projections assume a €/$USD rate of 1.15 for all forecasted periods; current €/$USD rate of 1.20 would imply ~$100M of revenue upside p.a. and ~$30M Adj. EBITDA upside p.a. Copyrights © 2020 Garrett Motion Inc. Source: Company projections, subject to ongoing review and material revision
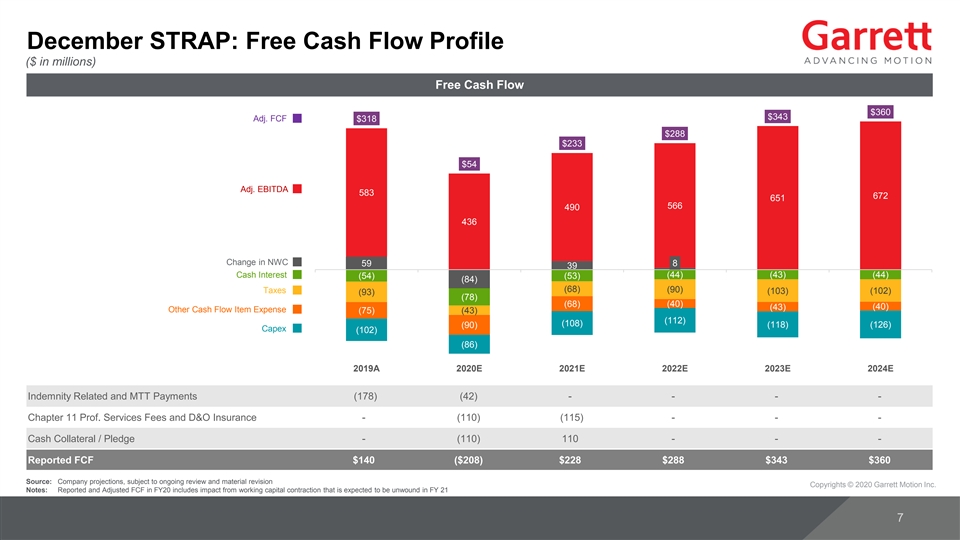
December STRAP: Free Cash Flow Profile ($ in millions) Free Cash Flow $360 $343 Adj. FCF $318 $288 $233 $54 Adj. EBITDA 583 672 651 566 490 436 Change in NWC 8 59 39 Cash Interest (44) (43) (44) (54) (53) (84) (68) Taxes (90) (103) (102) (93) (78) (68) (40) (43) (40) Other Cash Flow Item Expense (75) (43) (112) (108) (90) (118) (126) Capex (102) (86) 2019A 2020E 2021E 2022E 2023E 2024E Indemnity Related and MTT Payments (178) (42) - - - - Chapter 11 Prof. Services Fees and D&O Insurance - (110) (115) - - - Cash Collateral / Pledge - (110) 110 - - - Reported FCF $140 ($208) $228 $288 $343 $360 Source: Company projections, subject to ongoing review and material revision Copyrights © 2020 Garrett Motion Inc. Notes: Reported and Adjusted FCF in FY20 includes impact from working capital contraction that is expected to be unwound in FY 21December STRAP: Free Cash Flow Profile ($ in millions) Free Cash Flow $360 $343 Adj. FCF $318 $288 $233 $54 Adj. EBITDA 583 672 651 566 490 436 Change in NWC 8 59 39 Cash Interest (44) (43) (44) (54) (53) (84) (68) Taxes (90) (103) (102) (93) (78) (68) (40) (43) (40) Other Cash Flow Item Expense (75) (43) (112) (108) (90) (118) (126) Capex (102) (86) 2019A 2020E 2021E 2022E 2023E 2024E Indemnity Related and MTT Payments (178) (42) - - - - Chapter 11 Prof. Services Fees and D&O Insurance - (110) (115) - - - Cash Collateral / Pledge - (110) 110 - - - Reported FCF $140 ($208) $228 $288 $343 $360 Source: Company projections, subject to ongoing review and material revision Copyrights © 2020 Garrett Motion Inc. Notes: Reported and Adjusted FCF in FY20 includes impact from working capital contraction that is expected to be unwound in FY 21
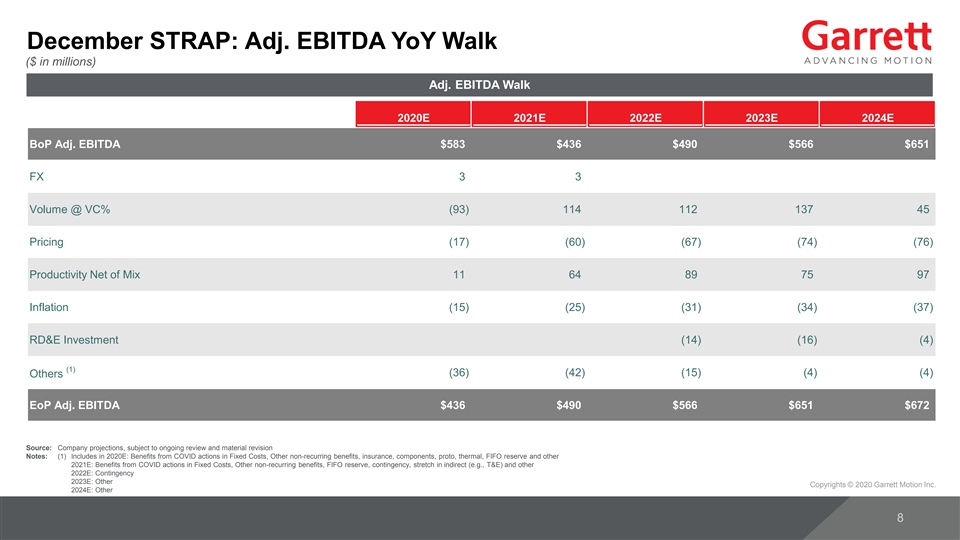
December STRAP: Adj. EBITDA YoY Walk ($ in millions) Adj. EBITDA Walk 2020E 2021E 2022E 2023E 2024E BoP Adj. EBITDA $583 $436 $490 $566 $651 FX 3 3 Volume @ VC% (93) 114 112 137 45 Pricing (17) (60) (67) (74) (76) Productivity Net of Mix 11 64 89 75 97 Inflation (15) (25) (31) (34) (37) RD&E Investment (14) (16) (4) (1) (36) (42) (15) (4) (4) Others EoP Adj. EBITDA $436 $490 $566 $651 $672 Source: Company projections, subject to ongoing review and material revision Notes: (1) Includes in 2020E: Benefits from COVID actions in Fixed Costs, Other non-recurring benefits, insurance, components, proto, thermal, FIFO reserve and other 2021E: Benefits from COVID actions in Fixed Costs, Other non-recurring benefits, FIFO reserve, contingency, stretch in indirect (e.g., T&E) and other 2022E: Contingency 2023E: Other Copyrights © 2020 Garrett Motion Inc. 2024E: OtherDecember STRAP: Adj. EBITDA YoY Walk ($ in millions) Adj. EBITDA Walk 2020E 2021E 2022E 2023E 2024E BoP Adj. EBITDA $583 $436 $490 $566 $651 FX 3 3 Volume @ VC% (93) 114 112 137 45 Pricing (17) (60) (67) (74) (76) Productivity Net of Mix 11 64 89 75 97 Inflation (15) (25) (31) (34) (37) RD&E Investment (14) (16) (4) (1) (36) (42) (15) (4) (4) Others EoP Adj. EBITDA $436 $490 $566 $651 $672 Source: Company projections, subject to ongoing review and material revision Notes: (1) Includes in 2020E: Benefits from COVID actions in Fixed Costs, Other non-recurring benefits, insurance, components, proto, thermal, FIFO reserve and other 2021E: Benefits from COVID actions in Fixed Costs, Other non-recurring benefits, FIFO reserve, contingency, stretch in indirect (e.g., T&E) and other 2022E: Contingency 2023E: Other Copyrights © 2020 Garrett Motion Inc. 2024E: Other
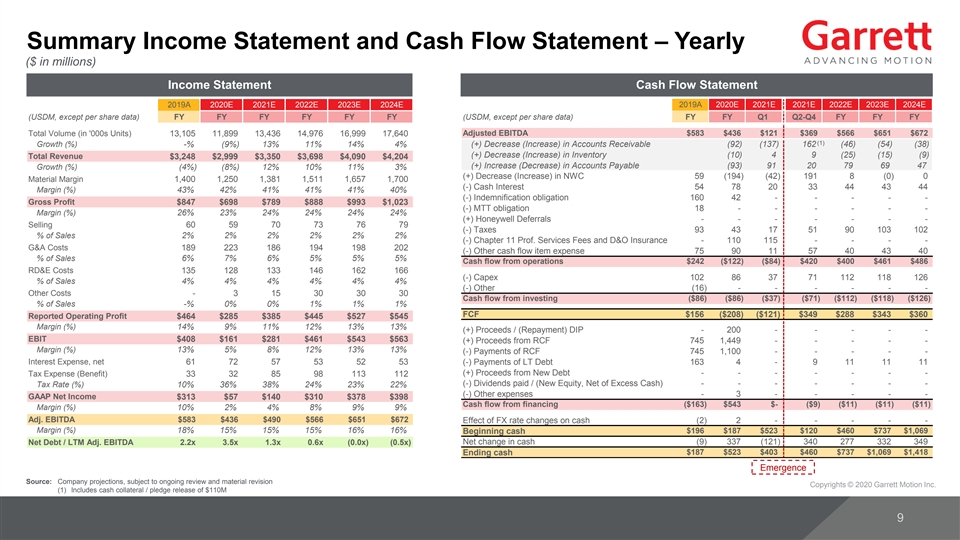
Summary Income Statement and Cash Flow Statement – Yearly ($ in millions) Income Statement Cash Flow Statement 2019A 2020E 2021E 2022E 2023E 2024E 2019A 2020E 2021E 2021E 2022E 2023E 2024E (USDM, except per share data) FY FY FY FY FY FY (USDM, except per share data) FY FY Q1 Q2-Q4 FY FY FY Total Volume (in '000s Units) 13,105 11,899 13,436 14,976 16,999 17,640 Adjusted EBITDA $583 $436 $121 $369 $566 $651 $672 (1) Growth (%) -% (9%) 13% 11% 14% 4% (+) Decrease (Increase) in Accounts Receivable (92) (137) 162 (46) (54) (38) (+) Decrease (Increase) in Inventory (10) 4 9 (25) (15) (9) Total Revenue $3,248 $2,999 $3,350 $3,698 $4,090 $4,204 (+) Increase (Decrease) in Accounts Payable (93) 91 20 79 69 47 Growth (%) (4%) (8%) 12% 10% 11% 3% (+) Decrease (Increase) in NWC 59 (194) (42) 191 8 (0) 0 Material Margin 1,400 1,250 1,381 1,511 1,657 1,700 (-) Cash Interest 54 78 20 33 44 43 44 Margin (%) 43% 42% 41% 41% 41% 40% (-) Indemnification obligation 160 42 - - - - - Gross Profit $847 $698 $789 $888 $993 $1,023 (-) MTT obligation 18 - - - - - - Margin (%) 26% 23% 24% 24% 24% 24% (+) Honeywell Deferrals - - - - - - - Selling 60 59 70 73 76 79 (-) Taxes 93 43 17 51 90 103 102 % of Sales 2% 2% 2% 2% 2% 2% (-) Chapter 11 Prof. Services Fees and D&O Insurance - 110 115 - - - - G&A Costs 189 223 186 194 198 202 (-) Other cash flow item expense 75 90 11 57 40 43 40 % of Sales 6% 7% 6% 5% 5% 5% Cash flow from operations $242 ($122) ($84) $420 $400 $461 $486 RD&E Costs 135 128 133 146 162 166 (-) Capex 102 86 37 71 112 118 126 % of Sales 4% 4% 4% 4% 4% 4% (-) Other (16) - - - - - - Other Costs - 3 15 30 30 30 Cash flow from investing ($86) ($86) ($37) ($71) ($112) ($118) ($126) % of Sales -% 0% 0% 1% 1% 1% FCF $156 ($208) ($121) $349 $288 $343 $360 Reported Operating Profit $464 $285 $385 $445 $527 $545 Margin (%) 14% 9% 11% 12% 13% 13% (+) Proceeds / (Repayment) DIP - 200 - - - - - EBIT $408 $161 $281 $461 $543 $563 (+) Proceeds from RCF 745 1,449 - - - - - Margin (%) 13% 5% 8% 12% 13% 13% (-) Payments of RCF 745 1,100 - - - - - Interest Expense, net 61 72 57 53 52 53 (-) Payments of LT Debt 163 4 - 9 11 11 11 (+) Proceeds from New Debt - - - - - - - Tax Expense (Benefit) 33 32 85 98 113 112 (-) Dividends paid / (New Equity, Net of Excess Cash) - - - - - - - Tax Rate (%) 10% 36% 38% 24% 23% 22% (-) Other expenses - 3 - - - - - GAAP Net Income $313 $57 $140 $310 $378 $398 Cash flow from financing ($163) $543 $- ($9) ($11) ($11) ($11) Margin (%) 10% 2% 4% 8% 9% 9% Adj. EBITDA $583 $436 $490 $566 $651 $672 Effect of FX rate changes on cash (2) 2 - - - - - Margin (%) 18% 15% 15% 15% 16% 16% $196 $187 $523 $120 $460 $737 $1,069 Beginning cash Net Debt / LTM Adj. EBITDA 2.2x 3.5x 1.3x 0.6x (0.0x) (0.5x) Net change in cash (9) 337 (121) 340 277 332 349 Ending cash $187 $523 $403 $460 $737 $1,069 $1,418 Emergence Source: Company projections, subject to ongoing review and material revision Copyrights © 2020 Garrett Motion Inc. (1) Includes cash collateral / pledge release of $110MSummary Income Statement and Cash Flow Statement – Yearly ($ in millions) Income Statement Cash Flow Statement 2019A 2020E 2021E 2022E 2023E 2024E 2019A 2020E 2021E 2021E 2022E 2023E 2024E (USDM, except per share data) FY FY FY FY FY FY (USDM, except per share data) FY FY Q1 Q2-Q4 FY FY FY Total Volume (in '000s Units) 13,105 11,899 13,436 14,976 16,999 17,640 Adjusted EBITDA $583 $436 $121 $369 $566 $651 $672 (1) Growth (%) -% (9%) 13% 11% 14% 4% (+) Decrease (Increase) in Accounts Receivable (92) (137) 162 (46) (54) (38) (+) Decrease (Increase) in Inventory (10) 4 9 (25) (15) (9) Total Revenue $3,248 $2,999 $3,350 $3,698 $4,090 $4,204 (+) Increase (Decrease) in Accounts Payable (93) 91 20 79 69 47 Growth (%) (4%) (8%) 12% 10% 11% 3% (+) Decrease (Increase) in NWC 59 (194) (42) 191 8 (0) 0 Material Margin 1,400 1,250 1,381 1,511 1,657 1,700 (-) Cash Interest 54 78 20 33 44 43 44 Margin (%) 43% 42% 41% 41% 41% 40% (-) Indemnification obligation 160 42 - - - - - Gross Profit $847 $698 $789 $888 $993 $1,023 (-) MTT obligation 18 - - - - - - Margin (%) 26% 23% 24% 24% 24% 24% (+) Honeywell Deferrals - - - - - - - Selling 60 59 70 73 76 79 (-) Taxes 93 43 17 51 90 103 102 % of Sales 2% 2% 2% 2% 2% 2% (-) Chapter 11 Prof. Services Fees and D&O Insurance - 110 115 - - - - G&A Costs 189 223 186 194 198 202 (-) Other cash flow item expense 75 90 11 57 40 43 40 % of Sales 6% 7% 6% 5% 5% 5% Cash flow from operations $242 ($122) ($84) $420 $400 $461 $486 RD&E Costs 135 128 133 146 162 166 (-) Capex 102 86 37 71 112 118 126 % of Sales 4% 4% 4% 4% 4% 4% (-) Other (16) - - - - - - Other Costs - 3 15 30 30 30 Cash flow from investing ($86) ($86) ($37) ($71) ($112) ($118) ($126) % of Sales -% 0% 0% 1% 1% 1% FCF $156 ($208) ($121) $349 $288 $343 $360 Reported Operating Profit $464 $285 $385 $445 $527 $545 Margin (%) 14% 9% 11% 12% 13% 13% (+) Proceeds / (Repayment) DIP - 200 - - - - - EBIT $408 $161 $281 $461 $543 $563 (+) Proceeds from RCF 745 1,449 - - - - - Margin (%) 13% 5% 8% 12% 13% 13% (-) Payments of RCF 745 1,100 - - - - - Interest Expense, net 61 72 57 53 52 53 (-) Payments of LT Debt 163 4 - 9 11 11 11 (+) Proceeds from New Debt - - - - - - - Tax Expense (Benefit) 33 32 85 98 113 112 (-) Dividends paid / (New Equity, Net of Excess Cash) - - - - - - - Tax Rate (%) 10% 36% 38% 24% 23% 22% (-) Other expenses - 3 - - - - - GAAP Net Income $313 $57 $140 $310 $378 $398 Cash flow from financing ($163) $543 $- ($9) ($11) ($11) ($11) Margin (%) 10% 2% 4% 8% 9% 9% Adj. EBITDA $583 $436 $490 $566 $651 $672 Effect of FX rate changes on cash (2) 2 - - - - - Margin (%) 18% 15% 15% 15% 16% 16% $196 $187 $523 $120 $460 $737 $1,069 Beginning cash Net Debt / LTM Adj. EBITDA 2.2x 3.5x 1.3x 0.6x (0.0x) (0.5x) Net change in cash (9) 337 (121) 340 277 332 349 Ending cash $187 $523 $403 $460 $737 $1,069 $1,418 Emergence Source: Company projections, subject to ongoing review and material revision Copyrights © 2020 Garrett Motion Inc. (1) Includes cash collateral / pledge release of $110M
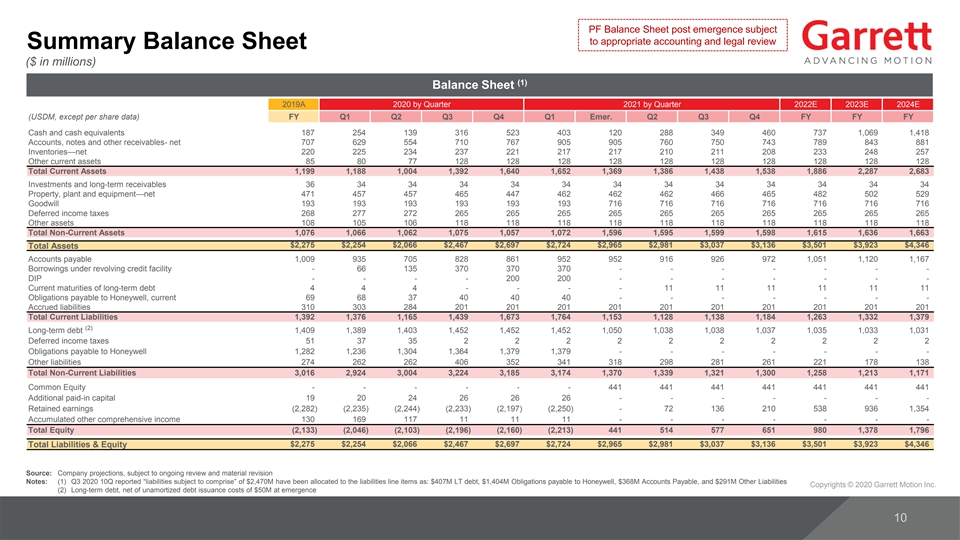
PF Balance Sheet post emergence subject to appropriate accounting and legal review Summary Balance Sheet ($ in millions) (1) Balance Sheet 2019A 2020 by Quarter 2021 by Quarter 2022E 2023E 2024E (USDM, except per share data) FY Q1 Q2 Q3 Q4 Q1 Emer. Q2 Q3 Q4 FY FY FY Cash and cash equivalents 187 254 139 316 523 403 120 288 349 460 737 1,069 1,418 Accounts, notes and other receivables- net 707 629 554 710 767 905 905 760 750 743 789 843 881 Inventories—net 220 225 234 237 221 217 217 210 211 208 233 248 257 Other current assets 85 80 77 128 128 128 128 128 128 128 128 128 128 Total Current Assets 1,199 1,188 1,004 1,392 1,640 1,652 1,369 1,386 1,438 1,538 1,886 2,287 2,683 Investments and long-term receivables 36 34 34 34 34 34 34 34 34 34 34 34 34 Property, plant and equipment—net 471 457 457 465 447 462 462 462 466 465 482 502 529 Goodwill 193 193 193 193 193 193 716 716 716 716 716 716 716 Deferred income taxes 268 277 272 265 265 265 265 265 265 265 265 265 265 Other assets 108 105 106 118 118 118 118 118 118 118 118 118 118 Total Non-Current Assets 1,076 1,066 1,062 1,075 1,057 1,072 1,596 1,595 1,599 1,598 1,615 1,636 1,663 $2,275 $2,254 $2,066 $2,467 $2,697 $2,724 $2,965 $2,981 $3,037 $3,136 $3,501 $3,923 $4,346 Total Assets Accounts payable 1,009 935 705 828 861 952 952 916 926 972 1,051 1,120 1,167 Borrowings under revolving credit facility - 66 135 370 370 370 - - - - - - - DIP - - - - 200 200 - - - - - - - Current maturities of long-term debt 4 4 4 - - - - 11 11 11 11 11 11 Obligations payable to Honeywell, current 69 68 37 40 40 40 - - - - - - - Accrued liabilities 310 303 284 201 201 201 201 201 201 201 201 201 201 Total Current Liabilities 1,392 1,376 1,165 1,439 1,673 1,764 1,153 1,128 1,138 1,184 1,263 1,332 1,379 (2) Long-term debt 1,409 1,389 1,403 1,452 1,452 1,452 1,050 1,038 1,038 1,037 1,035 1,033 1,031 Deferred income taxes 51 37 35 2 2 2 2 2 2 2 2 2 2 Obligations payable to Honeywell 1,282 1,236 1,304 1,364 1,379 1,379 - - - - - - - Other liabilities 274 262 262 406 352 341 318 298 281 261 221 178 138 Total Non-Current Liabilities 3,016 2,924 3,004 3,224 3,185 3,174 1,370 1,339 1,321 1,300 1,258 1,213 1,171 Common Equity - - - - - - 441 441 441 441 441 441 441 Additional paid-in capital 19 20 24 26 26 26 - - - - - - - Retained earnings (2,282) (2,235) (2,244) (2,233) (2,197) (2,250) - 72 136 210 538 936 1,354 Accumulated other comprehensive income 130 169 117 11 11 11 - - - - - - - Total Equity (2,133) (2,046) (2,103) (2,196) (2,160) (2,213) 441 514 577 651 980 1,378 1,796 Total Liabilities & Equity $2,275 $2,254 $2,066 $2,467 $2,697 $2,724 $2,965 $2,981 $3,037 $3,136 $3,501 $3,923 $4,346 Source: Company projections, subject to ongoing review and material revision Notes: (1) Q3 2020 10Q reported “liabilities subject to comprise” of $2,470M have been allocated to the liabilities line items as: $407M LT debt, $1,404M Obligations payable to Honeywell, $368M Accounts Payable, and $291M Other Liabilities Copyrights © 2020 Garrett Motion Inc. (2) Long-term debt, net of unamortized debt issuance costs of $50M at emergencePF Balance Sheet post emergence subject to appropriate accounting and legal review Summary Balance Sheet ($ in millions) (1) Balance Sheet 2019A 2020 by Quarter 2021 by Quarter 2022E 2023E 2024E (USDM, except per share data) FY Q1 Q2 Q3 Q4 Q1 Emer. Q2 Q3 Q4 FY FY FY Cash and cash equivalents 187 254 139 316 523 403 120 288 349 460 737 1,069 1,418 Accounts, notes and other receivables- net 707 629 554 710 767 905 905 760 750 743 789 843 881 Inventories—net 220 225 234 237 221 217 217 210 211 208 233 248 257 Other current assets 85 80 77 128 128 128 128 128 128 128 128 128 128 Total Current Assets 1,199 1,188 1,004 1,392 1,640 1,652 1,369 1,386 1,438 1,538 1,886 2,287 2,683 Investments and long-term receivables 36 34 34 34 34 34 34 34 34 34 34 34 34 Property, plant and equipment—net 471 457 457 465 447 462 462 462 466 465 482 502 529 Goodwill 193 193 193 193 193 193 716 716 716 716 716 716 716 Deferred income taxes 268 277 272 265 265 265 265 265 265 265 265 265 265 Other assets 108 105 106 118 118 118 118 118 118 118 118 118 118 Total Non-Current Assets 1,076 1,066 1,062 1,075 1,057 1,072 1,596 1,595 1,599 1,598 1,615 1,636 1,663 $2,275 $2,254 $2,066 $2,467 $2,697 $2,724 $2,965 $2,981 $3,037 $3,136 $3,501 $3,923 $4,346 Total Assets Accounts payable 1,009 935 705 828 861 952 952 916 926 972 1,051 1,120 1,167 Borrowings under revolving credit facility - 66 135 370 370 370 - - - - - - - DIP - - - - 200 200 - - - - - - - Current maturities of long-term debt 4 4 4 - - - - 11 11 11 11 11 11 Obligations payable to Honeywell, current 69 68 37 40 40 40 - - - - - - - Accrued liabilities 310 303 284 201 201 201 201 201 201 201 201 201 201 Total Current Liabilities 1,392 1,376 1,165 1,439 1,673 1,764 1,153 1,128 1,138 1,184 1,263 1,332 1,379 (2) Long-term debt 1,409 1,389 1,403 1,452 1,452 1,452 1,050 1,038 1,038 1,037 1,035 1,033 1,031 Deferred income taxes 51 37 35 2 2 2 2 2 2 2 2 2 2 Obligations payable to Honeywell 1,282 1,236 1,304 1,364 1,379 1,379 - - - - - - - Other liabilities 274 262 262 406 352 341 318 298 281 261 221 178 138 Total Non-Current Liabilities 3,016 2,924 3,004 3,224 3,185 3,174 1,370 1,339 1,321 1,300 1,258 1,213 1,171 Common Equity - - - - - - 441 441 441 441 441 441 441 Additional paid-in capital 19 20 24 26 26 26 - - - - - - - Retained earnings (2,282) (2,235) (2,244) (2,233) (2,197) (2,250) - 72 136 210 538 936 1,354 Accumulated other comprehensive income 130 169 117 11 11 11 - - - - - - - Total Equity (2,133) (2,046) (2,103) (2,196) (2,160) (2,213) 441 514 577 651 980 1,378 1,796 Total Liabilities & Equity $2,275 $2,254 $2,066 $2,467 $2,697 $2,724 $2,965 $2,981 $3,037 $3,136 $3,501 $3,923 $4,346 Source: Company projections, subject to ongoing review and material revision Notes: (1) Q3 2020 10Q reported “liabilities subject to comprise” of $2,470M have been allocated to the liabilities line items as: $407M LT debt, $1,404M Obligations payable to Honeywell, $368M Accounts Payable, and $291M Other Liabilities Copyrights © 2020 Garrett Motion Inc. (2) Long-term debt, net of unamortized debt issuance costs of $50M at emergence
AppendixAppendix
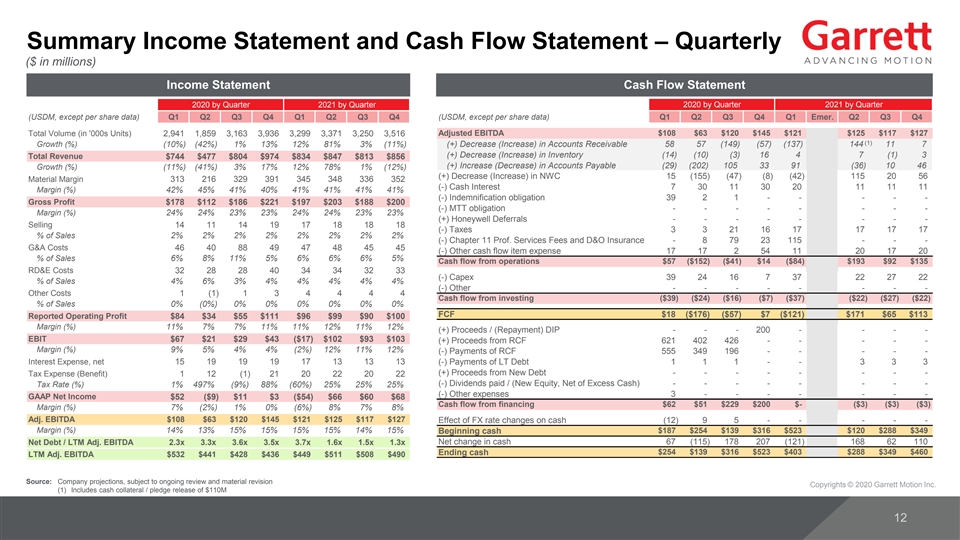
Summary Income Statement and Cash Flow Statement – Quarterly ($ in millions) Income Statement Cash Flow Statement 2020 by Quarter 2021 by Quarter 2020 by Quarter 2021 by Quarter (USDM, except per share data) Q1 Q2 Q3 Q4 Q1 Q2 Q3 Q4 (USDM, except per share data) Q1 Q2 Q3 Q4 Q1 Emer. Q2 Q3 Q4 Total Volume (in '000s Units) 2,941 1,859 3,163 3,936 3,299 3,371 3,250 3,516 Adjusted EBITDA $108 $63 $120 $145 $121 $125 $117 $127 (1) Growth (%) (10%) (42%) 1% 13% 12% 81% 3% (11%) (+) Decrease (Increase) in Accounts Receivable 58 57 (149) (57) (137) 144 11 7 (+) Decrease (Increase) in Inventory (14) (10) (3) 16 4 7 (1) 3 Total Revenue $744 $477 $804 $974 $834 $847 $813 $856 (+) Increase (Decrease) in Accounts Payable (29) (202) 105 33 91 (36) 10 46 Growth (%) (11%) (41%) 3% 17% 12% 78% 1% (12%) (+) Decrease (Increase) in NWC 15 (155) (47) (8) (42) 115 20 56 Material Margin 313 216 329 391 345 348 336 352 (-) Cash Interest 7 30 11 30 20 11 11 11 Margin (%) 42% 45% 41% 40% 41% 41% 41% 41% (-) Indemnification obligation 39 2 1 - - - - - Gross Profit $178 $112 $186 $221 $197 $203 $188 $200 (-) MTT obligation - - - - - - - - Margin (%) 24% 24% 23% 23% 24% 24% 23% 23% (+) Honeywell Deferrals - - - - - - - - Selling 14 11 14 19 17 18 18 18 (-) Taxes 3 3 21 16 17 17 17 17 % of Sales 2% 2% 2% 2% 2% 2% 2% 2% (-) Chapter 11 Prof. Services Fees and D&O Insurance - 8 79 23 115 - - - G&A Costs 46 40 88 49 47 48 45 45 (-) Other cash flow item expense 17 17 2 54 11 20 17 20 % of Sales 6% 8% 11% 5% 6% 6% 6% 5% Cash flow from operations $57 ($152) ($41) $14 ($84) $193 $92 $135 RD&E Costs 32 28 28 40 34 34 32 33 (-) Capex 39 24 16 7 37 22 27 22 % of Sales 4% 6% 3% 4% 4% 4% 4% 4% (-) Other - - - - - - - - Other Costs 1 (1) 1 3 4 4 4 4 Cash flow from investing ($39) ($24) ($16) ($7) ($37) ($22) ($27) ($22) % of Sales 0% (0%) 0% 0% 0% 0% 0% 0% FCF $18 ($176) ($57) $7 ($121) $171 $65 $113 Reported Operating Profit $84 $34 $55 $111 $96 $99 $90 $100 Margin (%) 11% 7% 7% 11% 11% 12% 11% 12% (+) Proceeds / (Repayment) DIP - - - 200 - - - - EBIT $67 $21 $29 $43 ($17) $102 $93 $103 (+) Proceeds from RCF 621 402 426 - - - - - Margin (%) 9% 5% 4% 4% (2%) 12% 11% 12% (-) Payments of RCF 555 349 196 - - - - - Interest Expense, net 15 19 19 19 17 13 13 13 (-) Payments of LT Debt 1 1 1 - - 3 3 3 (+) Proceeds from New Debt - - - - - - - - Tax Expense (Benefit) 1 12 (1) 21 20 22 20 22 (-) Dividends paid / (New Equity, Net of Excess Cash) - - - - - - - - Tax Rate (%) 1% 497% (9%) 88% (60%) 25% 25% 25% (-) Other expenses 3 - - - - - - - GAAP Net Income $52 ($9) $11 $3 ($54) $66 $60 $68 Cash flow from financing $62 $51 $229 $200 $- ($3) ($3) ($3) Margin (%) 7% (2%) 1% 0% (6%) 8% 7% 8% Adj. EBITDA $108 $63 $120 $145 $121 $125 $117 $127 Effect of FX rate changes on cash (12) 9 5 - - - - - Margin (%) 14% 13% 15% 15% 15% 15% 14% 15% $187 $254 $139 $316 $523 $120 $288 $349 Beginning cash Net change in cash 67 (115) 178 207 (121) 168 62 110 Net Debt / LTM Adj. EBITDA 2.3x 3.3x 3.6x 3.5x 3.7x 1.6x 1.5x 1.3x Ending cash $254 $139 $316 $523 $403 $288 $349 $460 LTM Adj. EBITDA $532 $441 $428 $436 $449 $511 $508 $490 Source: Company projections, subject to ongoing review and material revision Copyrights © 2020 Garrett Motion Inc. (1) Includes cash collateral / pledge release of $110MSummary Income Statement and Cash Flow Statement – Quarterly ($ in millions) Income Statement Cash Flow Statement 2020 by Quarter 2021 by Quarter 2020 by Quarter 2021 by Quarter (USDM, except per share data) Q1 Q2 Q3 Q4 Q1 Q2 Q3 Q4 (USDM, except per share data) Q1 Q2 Q3 Q4 Q1 Emer. Q2 Q3 Q4 Total Volume (in '000s Units) 2,941 1,859 3,163 3,936 3,299 3,371 3,250 3,516 Adjusted EBITDA $108 $63 $120 $145 $121 $125 $117 $127 (1) Growth (%) (10%) (42%) 1% 13% 12% 81% 3% (11%) (+) Decrease (Increase) in Accounts Receivable 58 57 (149) (57) (137) 144 11 7 (+) Decrease (Increase) in Inventory (14) (10) (3) 16 4 7 (1) 3 Total Revenue $744 $477 $804 $974 $834 $847 $813 $856 (+) Increase (Decrease) in Accounts Payable (29) (202) 105 33 91 (36) 10 46 Growth (%) (11%) (41%) 3% 17% 12% 78% 1% (12%) (+) Decrease (Increase) in NWC 15 (155) (47) (8) (42) 115 20 56 Material Margin 313 216 329 391 345 348 336 352 (-) Cash Interest 7 30 11 30 20 11 11 11 Margin (%) 42% 45% 41% 40% 41% 41% 41% 41% (-) Indemnification obligation 39 2 1 - - - - - Gross Profit $178 $112 $186 $221 $197 $203 $188 $200 (-) MTT obligation - - - - - - - - Margin (%) 24% 24% 23% 23% 24% 24% 23% 23% (+) Honeywell Deferrals - - - - - - - - Selling 14 11 14 19 17 18 18 18 (-) Taxes 3 3 21 16 17 17 17 17 % of Sales 2% 2% 2% 2% 2% 2% 2% 2% (-) Chapter 11 Prof. Services Fees and D&O Insurance - 8 79 23 115 - - - G&A Costs 46 40 88 49 47 48 45 45 (-) Other cash flow item expense 17 17 2 54 11 20 17 20 % of Sales 6% 8% 11% 5% 6% 6% 6% 5% Cash flow from operations $57 ($152) ($41) $14 ($84) $193 $92 $135 RD&E Costs 32 28 28 40 34 34 32 33 (-) Capex 39 24 16 7 37 22 27 22 % of Sales 4% 6% 3% 4% 4% 4% 4% 4% (-) Other - - - - - - - - Other Costs 1 (1) 1 3 4 4 4 4 Cash flow from investing ($39) ($24) ($16) ($7) ($37) ($22) ($27) ($22) % of Sales 0% (0%) 0% 0% 0% 0% 0% 0% FCF $18 ($176) ($57) $7 ($121) $171 $65 $113 Reported Operating Profit $84 $34 $55 $111 $96 $99 $90 $100 Margin (%) 11% 7% 7% 11% 11% 12% 11% 12% (+) Proceeds / (Repayment) DIP - - - 200 - - - - EBIT $67 $21 $29 $43 ($17) $102 $93 $103 (+) Proceeds from RCF 621 402 426 - - - - - Margin (%) 9% 5% 4% 4% (2%) 12% 11% 12% (-) Payments of RCF 555 349 196 - - - - - Interest Expense, net 15 19 19 19 17 13 13 13 (-) Payments of LT Debt 1 1 1 - - 3 3 3 (+) Proceeds from New Debt - - - - - - - - Tax Expense (Benefit) 1 12 (1) 21 20 22 20 22 (-) Dividends paid / (New Equity, Net of Excess Cash) - - - - - - - - Tax Rate (%) 1% 497% (9%) 88% (60%) 25% 25% 25% (-) Other expenses 3 - - - - - - - GAAP Net Income $52 ($9) $11 $3 ($54) $66 $60 $68 Cash flow from financing $62 $51 $229 $200 $- ($3) ($3) ($3) Margin (%) 7% (2%) 1% 0% (6%) 8% 7% 8% Adj. EBITDA $108 $63 $120 $145 $121 $125 $117 $127 Effect of FX rate changes on cash (12) 9 5 - - - - - Margin (%) 14% 13% 15% 15% 15% 15% 14% 15% $187 $254 $139 $316 $523 $120 $288 $349 Beginning cash Net change in cash 67 (115) 178 207 (121) 168 62 110 Net Debt / LTM Adj. EBITDA 2.3x 3.3x 3.6x 3.5x 3.7x 1.6x 1.5x 1.3x Ending cash $254 $139 $316 $523 $403 $288 $349 $460 LTM Adj. EBITDA $532 $441 $428 $436 $449 $511 $508 $490 Source: Company projections, subject to ongoing review and material revision Copyrights © 2020 Garrett Motion Inc. (1) Includes cash collateral / pledge release of $110M
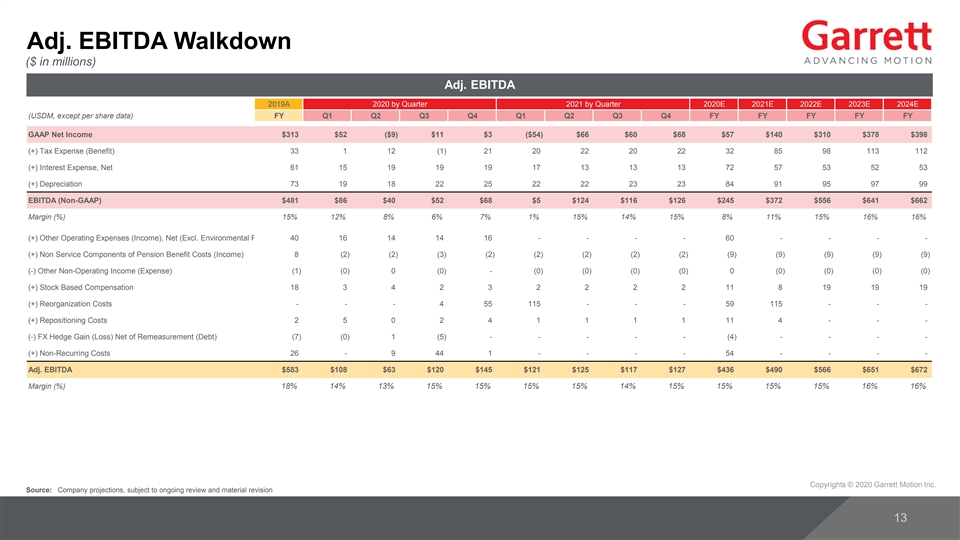
Adj. EBITDA Walkdown ($ in millions) Adj. EBITDA 2019A 2020 by Quarter 2021 by Quarter 2020E 2021E 2022E 2023E 2024E (USDM, except per share data) FY Q1 Q2 Q3 Q4 Q1 Q2 Q3 Q4 FY FY FY FY FY GAAP Net Income $313 $52 ($9) $11 $3 ($54) $66 $60 $68 $57 $140 $310 $378 $398 (+) Tax Expense (Benefit) 33 1 12 (1) 21 20 22 20 22 32 85 98 113 112 (+) Interest Expense, Net 61 15 19 19 19 17 13 13 13 72 57 53 52 53 (+) Depreciation 73 19 18 22 25 22 22 23 23 84 91 95 97 99 EBITDA (Non-GAAP) $481 $86 $40 $52 $68 $5 $124 $116 $126 $245 $372 $556 $641 $662 Margin (%) 15% 12% 8% 6% 7% 1% 15% 14% 15% 8% 11% 15% 16% 16% (+) Other Operating Expenses (Income), Net (Excl. Environmental Remediation 40 Costs) 16 14 14 16 - - - - 60 - - - - (+) Non Service Components of Pension Benefit Costs (Income) 8 (2) (2) (3) (2) (2) (2) (2) (2) (9) (9) (9) (9) (9) (-) Other Non-Operating Income (Expense) (1) (0) 0 (0) - (0) (0) (0) (0) 0 (0) (0) (0) (0) (+) Stock Based Compensation 18 3 4 2 3 2 2 2 2 11 8 19 19 19 (+) Reorganization Costs - - - 4 55 115 - - - 59 115 - - - (+) Repositioning Costs 2 5 0 2 4 1 1 1 1 11 4 - - - (-) FX Hedge Gain (Loss) Net of Remeasurement (Debt) (7) (0) 1 (5) - - - - - (4) - - - - (+) Non-Recurring Costs 26 - 9 44 1 - - - - 54 - - - - Adj. EBITDA $583 $108 $63 $120 $145 $121 $125 $117 $127 $436 $490 $566 $651 $672 Margin (%) 18% 14% 13% 15% 15% 15% 15% 14% 15% 15% 15% 15% 16% 16% Copyrights © 2020 Garrett Motion Inc. Source: Company projections, subject to ongoing review and material revisionAdj. EBITDA Walkdown ($ in millions) Adj. EBITDA 2019A 2020 by Quarter 2021 by Quarter 2020E 2021E 2022E 2023E 2024E (USDM, except per share data) FY Q1 Q2 Q3 Q4 Q1 Q2 Q3 Q4 FY FY FY FY FY GAAP Net Income $313 $52 ($9) $11 $3 ($54) $66 $60 $68 $57 $140 $310 $378 $398 (+) Tax Expense (Benefit) 33 1 12 (1) 21 20 22 20 22 32 85 98 113 112 (+) Interest Expense, Net 61 15 19 19 19 17 13 13 13 72 57 53 52 53 (+) Depreciation 73 19 18 22 25 22 22 23 23 84 91 95 97 99 EBITDA (Non-GAAP) $481 $86 $40 $52 $68 $5 $124 $116 $126 $245 $372 $556 $641 $662 Margin (%) 15% 12% 8% 6% 7% 1% 15% 14% 15% 8% 11% 15% 16% 16% (+) Other Operating Expenses (Income), Net (Excl. Environmental Remediation 40 Costs) 16 14 14 16 - - - - 60 - - - - (+) Non Service Components of Pension Benefit Costs (Income) 8 (2) (2) (3) (2) (2) (2) (2) (2) (9) (9) (9) (9) (9) (-) Other Non-Operating Income (Expense) (1) (0) 0 (0) - (0) (0) (0) (0) 0 (0) (0) (0) (0) (+) Stock Based Compensation 18 3 4 2 3 2 2 2 2 11 8 19 19 19 (+) Reorganization Costs - - - 4 55 115 - - - 59 115 - - - (+) Repositioning Costs 2 5 0 2 4 1 1 1 1 11 4 - - - (-) FX Hedge Gain (Loss) Net of Remeasurement (Debt) (7) (0) 1 (5) - - - - - (4) - - - - (+) Non-Recurring Costs 26 - 9 44 1 - - - - 54 - - - - Adj. EBITDA $583 $108 $63 $120 $145 $121 $125 $117 $127 $436 $490 $566 $651 $672 Margin (%) 18% 14% 13% 15% 15% 15% 15% 14% 15% 15% 15% 15% 16% 16% Copyrights © 2020 Garrett Motion Inc. Source: Company projections, subject to ongoing review and material revision
Forward Looking Statements This presentation contains “forward-looking statements” within the meaning of Section 21E of the Securities Exchange Act of 1934, as amended. All statements, other than statements of fact, that address activities, events or developments that we or our management intend, expect, proj ect, believe or anticipate will or may occur in the future are forward-looking statements including without limitation our statements regarding our anticipated financial performance, expectations regarding global automotive demand, anticipated growth of our gasoline business, trends in foreign exchange rates, the antici pated impact of the novel coronavirus (“COVID-19”) pandemic on our business, results of operations and financial position, estimated payments to Honeywell, and projections regarding our technology solutions. Although we believe forward-looking statements are based upon reasonable assumptions, such statements involve known and unknown risks, uncertainties, and other factors, which may cause the actual results or performance of the company to be mater ially different from any future results or performance expressed or implied by such forward-looking statements. Such risks and uncertainties include, but are not limited to those described in our annual report on Form 10-K for the year ended December 31, 2019, as updated by our quarterly report on Form 10-Q for the three months ended March 31, 2020, as well as our other filings with the Securities and Exchange Commission, under the headings “Risk Factors” and “Cautio nary Statement Concerning Forward-Looking Statements.” You are cautioned not to place undue reliance on these forward-looking statements, which speak only as of the date of this document. Forward-looking statements are not guarantees of future performance, and actual results, developments and business decisions may differ from those envisaged by our forward-looking statements. Non-GAAP Financial Measures This presentation includes EBITDA, Adjusted EBITDA, Net to Consolidated EBITDA ratio, Consolidated Debt to Consolidated EBIT DA ratio, Adjusted Free Cash Flow, Consolidated EBITDA, Adjusted EBITDA Margin, Adjusted Net Income, Adjusted Earnings Per Share (“EPS”), Cash flow from operations minus capital expenditures, Free Cash Flow, Adjusted Free Cash Flow Conversion, constant currency sales growth and other financial measures not compliant with generally accepted accounting principles in the United States (“GAAP”). The Non-GAAP financial measures provided herein are adjusted for certain items as presented in the Appendix containing Non-GAAP Reconciliations and may not be directly comparable to similar measures used by other companies in our industry, as other companies may define such measures differently. Management believes that, when considered together with reported amounts, the se measures are useful to investors and management in understanding our ongoing operations and in analysis of ongoing operating trends. Garrett believe s that Adjusted EBITDA, Adjusted EBITDA Margin and Consolidated EBITDA are important indicators of operating performance because they exclude the eff ects of income taxes and certain other items, as well as the effects of financing and investing activities by eliminating the effects of interest and depreciation expenses and therefore more closely measures our operational performance. These metrics should be considered in addition to, and not as replacements for, the most comparable GAAP measure. For additional information, see our annual report on Form 10-K for the year ended December 31, 2019 and our quarterly report on Form 10-Q for the three months ended March 31, 2020. Copyrights © 2020 Garrett Motion Inc.Forward Looking Statements This presentation contains “forward-looking statements” within the meaning of Section 21E of the Securities Exchange Act of 1934, as amended. All statements, other than statements of fact, that address activities, events or developments that we or our management intend, expect, proj ect, believe or anticipate will or may occur in the future are forward-looking statements including without limitation our statements regarding our anticipated financial performance, expectations regarding global automotive demand, anticipated growth of our gasoline business, trends in foreign exchange rates, the antici pated impact of the novel coronavirus (“COVID-19”) pandemic on our business, results of operations and financial position, estimated payments to Honeywell, and projections regarding our technology solutions. Although we believe forward-looking statements are based upon reasonable assumptions, such statements involve known and unknown risks, uncertainties, and other factors, which may cause the actual results or performance of the company to be mater ially different from any future results or performance expressed or implied by such forward-looking statements. Such risks and uncertainties include, but are not limited to those described in our annual report on Form 10-K for the year ended December 31, 2019, as updated by our quarterly report on Form 10-Q for the three months ended March 31, 2020, as well as our other filings with the Securities and Exchange Commission, under the headings “Risk Factors” and “Cautio nary Statement Concerning Forward-Looking Statements.” You are cautioned not to place undue reliance on these forward-looking statements, which speak only as of the date of this document. Forward-looking statements are not guarantees of future performance, and actual results, developments and business decisions may differ from those envisaged by our forward-looking statements. Non-GAAP Financial Measures This presentation includes EBITDA, Adjusted EBITDA, Net to Consolidated EBITDA ratio, Consolidated Debt to Consolidated EBIT DA ratio, Adjusted Free Cash Flow, Consolidated EBITDA, Adjusted EBITDA Margin, Adjusted Net Income, Adjusted Earnings Per Share (“EPS”), Cash flow from operations minus capital expenditures, Free Cash Flow, Adjusted Free Cash Flow Conversion, constant currency sales growth and other financial measures not compliant with generally accepted accounting principles in the United States (“GAAP”). The Non-GAAP financial measures provided herein are adjusted for certain items as presented in the Appendix containing Non-GAAP Reconciliations and may not be directly comparable to similar measures used by other companies in our industry, as other companies may define such measures differently. Management believes that, when considered together with reported amounts, the se measures are useful to investors and management in understanding our ongoing operations and in analysis of ongoing operating trends. Garrett believe s that Adjusted EBITDA, Adjusted EBITDA Margin and Consolidated EBITDA are important indicators of operating performance because they exclude the eff ects of income taxes and certain other items, as well as the effects of financing and investing activities by eliminating the effects of interest and depreciation expenses and therefore more closely measures our operational performance. These metrics should be considered in addition to, and not as replacements for, the most comparable GAAP measure. For additional information, see our annual report on Form 10-K for the year ended December 31, 2019 and our quarterly report on Form 10-Q for the three months ended March 31, 2020. Copyrights © 2020 Garrett Motion Inc.

Disclosure This presentation contains forward-looking statements that reflect, when made, the Company's current estimates with respect to current events, certain investments and financial performance. Such forward- looking statements are subject to many risks, uncertainties and factors relating to the Company's operations and business environment, which may cause the actual results of the Company to be materially different from any future results. All statements that address future operating, financial or business performance or the Company's strategies or expectations are forward-looking statements. Certain factors that could cause actual results to differ materially from these forward-looking statements are discussed under the captions Risk Factors and Management's Discussion and Analysis of Financial Condition and Results of Operations in the Company's filings with the Securities and Exchange Commission. New risks and uncertainties arise from time to time, and it is impossible for us to predict these events or how they may affect the Company. The Company disclaims any intention or obligation to update or revise any forward- looking statements, whether as a result of new information, future events and/or otherwise, except as may be required by law. Copyrights © 2020 Garrett Motion Inc.Disclosure This presentation contains forward-looking statements that reflect, when made, the Company's current estimates with respect to current events, certain investments and financial performance. Such forward- looking statements are subject to many risks, uncertainties and factors relating to the Company's operations and business environment, which may cause the actual results of the Company to be materially different from any future results. All statements that address future operating, financial or business performance or the Company's strategies or expectations are forward-looking statements. Certain factors that could cause actual results to differ materially from these forward-looking statements are discussed under the captions Risk Factors and Management's Discussion and Analysis of Financial Condition and Results of Operations in the Company's filings with the Securities and Exchange Commission. New risks and uncertainties arise from time to time, and it is impossible for us to predict these events or how they may affect the Company. The Company disclaims any intention or obligation to update or revise any forward- looking statements, whether as a result of new information, future events and/or otherwise, except as may be required by law. Copyrights © 2020 Garrett Motion Inc.

Copyrights © 2020 Garrett Motion Inc.Copyrights © 2020 Garrett Motion Inc.