Attached files
| file | filename |
|---|---|
| 8-K - 8-K - Juniper Industrial Holdings, Inc. | d946704d8k.htm |
Exhibit 99.1

A Best-in-Class Building Product Solutions Platform INVESTOR PRESENTATION January 2021
Disclaimer This presentation is being furnished solely for the purpose of considering a potential transaction involving Juniper Industrial Holdings, Inc. (“Juniper”) and Janus International Group, LLC (“Janus”). Any securities of Juniper to be offered in any transaction contemplated hereby have not been and will not be registered under the Securities Act of 1933, as amended (the “Securities Acts”), or any applicable state or foreign securities laws. Although the information contained herein is believed to be accurate, each of Juniper and Janus (as well as each of their respective directors, officers, shareholders, members, partners and representatives), expressly disclaims liability for, and makes no expressed or implied representation or warranty with respect to, any information contained in or omitted from this presentation, or any other information or communication (whether written or oral) transmitted to any prospective investor. Only those representations and warranties made in a definitive agreement with any person shall have any legal effect. PAST PERFORMANCE IS NO GUARANTEE OF FUTURE PERFORMANCE. The recipient of this presentation acknowledges that it is (a) aware that United States securities laws prohibit any person who has material, non-public information concerning a company from purchasing and selling securities of such company or from communicating such information to any other person under circumstances in which it is reasonably foreseeable that such person may purchase or sell such securities and (b) that the recipient will neither use, nor cause any third party to use this investor presentation or any information contained herein in violation of the Securities Exchange Act of 1934, as amended, including, without limitation, Rule 10b-5 thereunder. Use of Projections and Financial Information and Forward-Looking Statements This presentation contains financial forecasts relating to the anticipated future financial performance of Janus, Juniper and the combined company. For example, projections of future Adjusted EBITDA and Adjusted EBITDA Margin and other metrics are forward-looking statements. These forward-looking statements can generally be identified by the use of forward-looking terminology, including the terms “believes,” “anticipates,” “estimates.” “seeks,” “projects,” “targets,” “intends,” “plans,” “may,” “will,” or “should” or, in each case, their negative or other variations or comparable terminology. These forward-looking statements include all matters that are not historical facts. By their nature, forward-looking statements involve risks and uncertainties because they relate to events and depend on circumstances that may or may not occur in the future. Such financial forecasts constitute forward-looking information, are for illustrative purposes only and should not be relied upon as necessarily being indicative of future results. Actual results may differ materially from the results contemplated by the financial forecasts contained in this presentation, and the inclusion of such information in this presentation should not be regarded as a representation by any person that the results reflected in such forecasts will be achieved. Any forward-looking statements that we make in this presentation speak only as of the date of those statements, and we undertake no obligation to update those statements, whether written or oral, that may be made from time to time, whether as a result of new information, future developments or otherwise. All of the forward-looking statements herein are qualified by these cautionary statements. Financial Information This presentation also includes references to financial measures that are calculated and presented on the basis of methodologies other than in accordance with generally accepted accounting principles in the United States of America (“GAAP”). Any non-GAAP financial measures used in this presentation are in addition to, and should not be considered superior to, or a substitute for, financial statements prepared in accordance with GAAP. Non-GAAP financial measures should not be considered in isolation and are subject to significant inherent limitations. The non-GAAP measures presented herein not be comparable to similar non-GAAP measures presented by other companies. Janus believes these non-GAAP measures of financial results provide useful information to management and investors regarding certain financial and business trends relating to Janus’s financial condition and results of operations. Janus believes that the use of these non-GAAP financial measures provides an additional tool for investors to use in evaluating ongoing operating results and trends in and in comparing Janus’s financial measures with other similar companies, many of which present similar non-GAAP financial measures to investors. These non-GAAP financial measures are subject to inherent limitations as they reflect the exercise of judgments by management about which expense and income are excluded or included in determining these non-GAAP financial measures.
Disclaimer (Cont’d) Important Information For Investors and Shareholders In connection with the proposed business combination, Juniper intends to file a proxy statement / prospectus on Form S-4 with the SEC. The definitive proxy statement / prospectus and other relevant documents will be sent or given to the shareholders of Juniper and will contain important information about the proposed business combination, information about Janus and related matters. Juniper shareholders and other interested persons are advised to read, when available, the proxy statement / prospectus in connection with Juniper’s solicitation of proxies for the meeting of shareholders to be held to approve the business combination because the proxy statement / prospectus will contain important information about the proposed business combination. When available, the definitive proxy statement / prospectus will be mailed to Juniper shareholders as of a record date to be established for voting on the business combination. Shareholders will also be able to obtain copies of the proxy statement / prospectus, without charge, once available, at the SEC’s website at www.sec.gov Participants in Solicitation Juniper, Janus and their respective directors and officers may be deemed participants in the solicitation of proxies of Juniper’s shareholders in connection with the proposed business combination. Juniper shareholders and other interested persons may obtain, without charge, more detailed information regarding the directors and officers of Juniper in Juniper’s Annual Report on Form 10-K for the fiscal year ended December 31, 2019. Additional information will be available in the definitive proxy statement / prospectus when it becomes available. No Offer or Solicitation This presentation does not constitute a solicitation of a proxy, consent or authorization with respect to any securities or in respect of the business combination. This presentation also does not constitute an offer to sell or the solicitation of an offer to buy securities, nor will there be any sale of securities in any state or jurisdiction in which such offer, solicitation or sale would be unlawful prior to registration or qualification under the securities laws of any such jurisdiction. No offering of securities will be made except by means of a prospectus meeting the requirements of Securities Act of 1933, as amended, or an exemption therefrom.
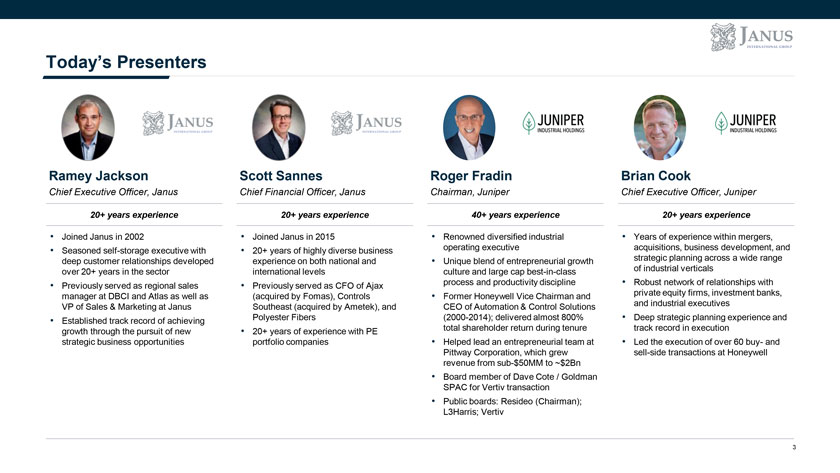
Today’s Presenters Ramey Jackson Scott Sannes Roger Fradin Brian Cook Chief Executive Officer, Janus Chief Financial Officer, Janus Chairman, Juniper Chief Executive Officer, Juniper 20+ years experience 20+ years experience 40+ years experience 20+ years experience • Joined Janus in 2002 • Joined Janus in 2015 • Renowned diversified industrial • Years of experience within mergers, • Seasoned self-storage executive with • 20+ years of highly diverse business operating executive acquisitions, business development, and deep customer relationships developed experience on both national and • Unique blend of entrepreneurial growth strategic planning across a wide range over 20+ years in the sector international levels culture and large cap best-in-class of industrial verticals • Previously served as regional sales • Previously served as CFO of Ajax process and productivity discipline • Robust network of relationships with manager at DBCI and Atlas as well as (acquired by Fomas), Controls • Former Honeywell Vice Chairman and private equity firms, investment banks, VP of Sales & Marketing at Janus Southeast (acquired by Ametek), and CEO of Automation & Control Solutions and industrial executives • Established track record of achieving Polyester Fibers (2000-2014); delivered almost 800% • Deep strategic planning experience and growth through the pursuit of new • 20+ years of experience with PE total shareholder return during tenure track record in execution strategic business opportunities portfolio companies • Helped lead an entrepreneurial team at • Led the execution of over 60 buy- and Pittway Corporation, which grew sell-side transactions at Honeywell revenue from sub-$50MM to ~$2Bn • Board member of Dave Cote / Goldman SPAC for Vertiv transaction • Public boards: Resideo (Chairman); L3Harris; Vertiv
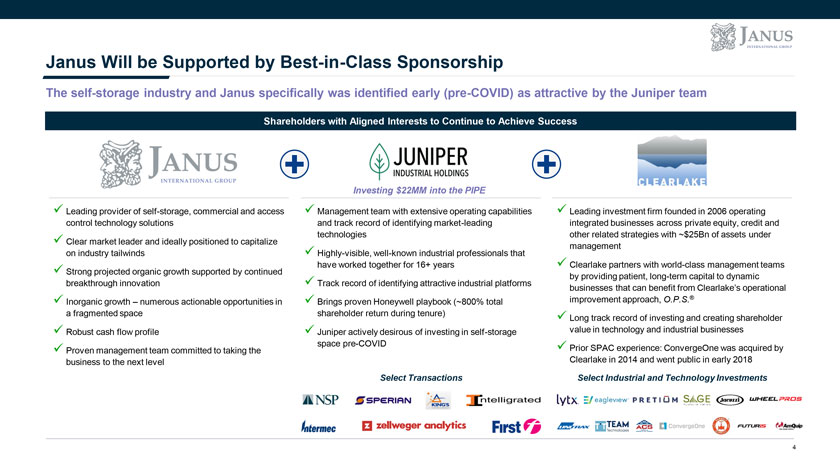
Janus Will be Supported by Best-in-Class Sponsorship The self-storage industry and Janus specifically was identified early (pre-COVID) as attractive by the Juniper team Shareholders with Aligned Interests to Continue to Achieve Success Investing $22MM into the PIPE Leading provider of self-storage, commercial and access Management team with extensive operating capabilities Leading investment firm founded in 2006 operating control technology solutions and track record of identifying market-leading integrated businesses across private equity, credit and technologies other related strategies with ~$25Bn of assets under Clear market leader and ideally positioned to capitalize management on industry tailwindsHighly-visible, well-known industrial professionals that  have worked together for 16+ years Clearlake partners with world-class management teams Strong projected organic growth supported by continued  by providing patient, long-term capital to dynamic breakthrough innovation Track record of identifying attractive industrial platforms businesses that can benefit from Clearlake’s operational Inorganic growth – numerous actionable opportunities in Brings proven Honeywell playbook (~800% total improvement approach, O.P.S.® a fragmented space shareholder return during tenure) Long track record of investing and creating shareholder Robust cash flow profileJuniper actively desirous of investing in self-storage value in technology and industrial businesses space pre-COVID Proven management team committed to taking the Prior SPAC experience: ConvergeOne was acquired by business to the next level Clearlake in 2014 and went public in early 2018 Select Transactions Select Industrial and Technology Investments
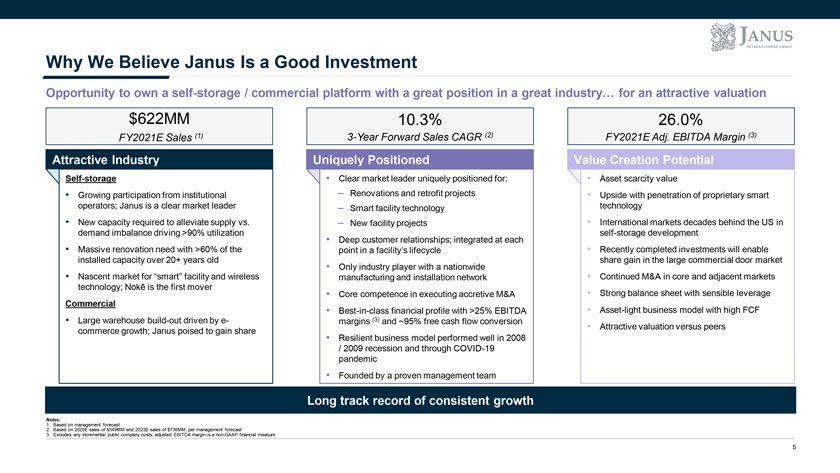
Why We Believe Janus Is a Good Investment Opportunity to own a self-storage / commercial platform with a great position in a great industry… for an attractive valuation $622MM 10.3% 26.0% FY2021E Sales (1) 3-Year Forward Sales CAGR (2) FY2021E Adj. EBITDA Margin (3) Attractive Industry Uniquely Positioned Value Creation Potential Self-storage • Clear market leader uniquely positioned for: • Asset scarcity value • Growing participation from institutional – Renovations and retrofit projects • Upside with penetration of proprietary smart operators; Janus is a clear market leader – Smart facility technology technology • New capacity required to alleviate supply vs. – New facility projects • International markets decades behind the US in demand imbalance driving >90% utilization self-storage development • Deep customer relationships; integrated at each • Massive renovation need with >60% of the point in a facility’s lifecycle • Recently completed investments will enable installed capacity over 20+ years old share gain in the large commercial door market • Only industry player with a nationwide • Nascent market for “smart” facility and wireless manufacturing and installation network • Continued M&A in core and adjacent markets technology; Nokē is the first mover • Core competence in executing accretive M&A • Strong balance sheet with sensible leverage Commercial • Best-in-class financial profile with >25% EBITDA • Asset-light business model with high FCF • Large warehouse build-out driven by e- margins (3) and ~95% free cash flow conversion Attractive valuation versus peers • commerce growth; Janus poised to gain share • Resilient business model performed well in 2008 / 2009 recession and through COVID-19 pandemic • Founded by a proven management team Long track record of consistent growth Notes: 1. Based on management forecast 2. Based on 2020E sales of $549MM and 2023E sales of $736MM, per management forecast 3. Excludes any incremental public company costs; adjusted EBITDA margin is a non-GAAP financial measure 5
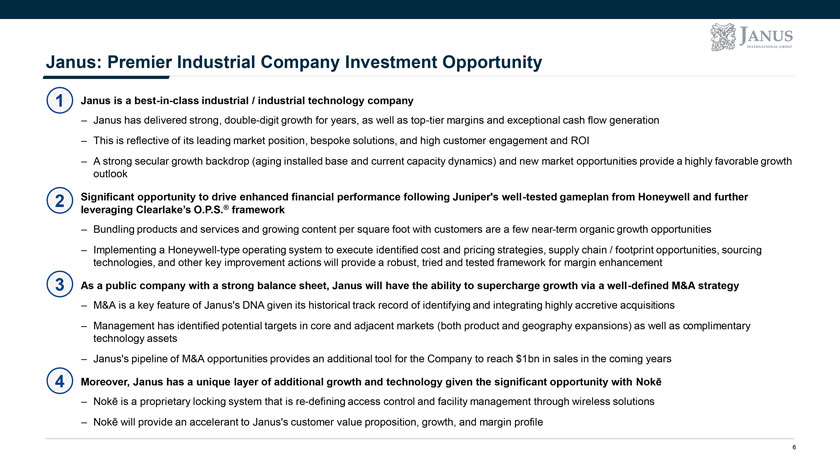
Janus: Premier Industrial Company Investment Opportunity 1• Janus is a best-in-class industrial / industrial technology company – Janus has delivered strong, double-digit growth for years, as well as top-tier margins and exceptional cash flow generation – This is reflective of its leading market position, bespoke solutions, and high customer engagement and ROI – A strong secular growth backdrop (aging installed base and current capacity dynamics) and new market opportunities provide a highly favorable growth outlook 2• Significant opportunity to drive enhanced financial performance following Juniper’s well-tested gameplan from Honeywell and further leveraging Clearlake’s O.P.S.® framework – Bundling products and services and growing content per square foot with customers are a few near-term organic growth opportunities – Implementing a Honeywell-type operating system to execute identified cost and pricing strategies, supply chain / footprint opportunities, sourcing technologies, and other key improvement actions will provide a robust, tried and tested framework for margin enhancement 3• As a public company with a strong balance sheet, Janus will have the ability to supercharge growth via a well-defined M&A strategy – M&A is a key feature of Janus’s DNA given its historical track record of identifying and integrating highly accretive acquisitions – Management has identified potential targets in core and adjacent markets (both product and geography expansions) as well as complimentary technology assets – Janus’s pipeline of M&A opportunities provides an additional tool for the Company to reach $1bn in sales in the coming years 4• Moreover, Janus has a unique layer of additional growth and technology given the significant opportunity with Nokē – Nokē is a proprietary locking system that is re-defining access control and facility management through wireless solutions – Nokē will provide an accelerant to Janus’s customer value proposition, growth, and margin profile 6
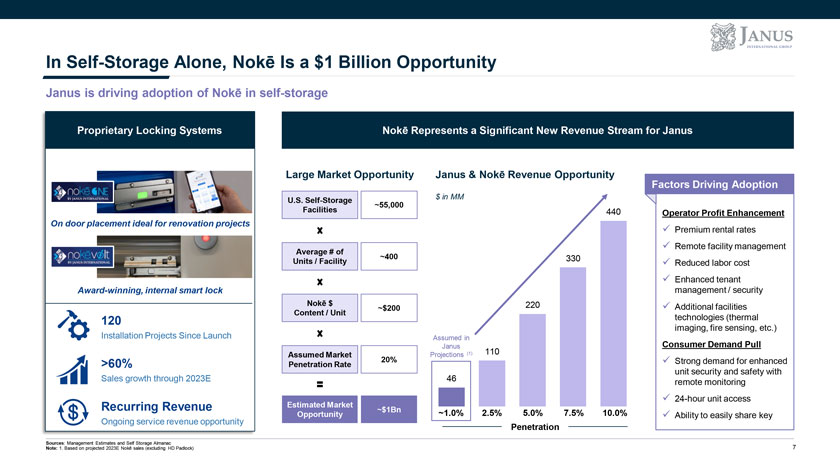
In Self-Storage Alone, Nokē Is a $1 Billion Opportunity Janus is driving adoption of Nokē in self-storage Proprietary Locking Systems Nokē Represents a Significant New Revenue Stream for Janus Large Market Opportunity Janus & Nokē Revenue Opportunity Factors Driving Adoption $ in MM U.S. Self-Storage ~55,000 Facilities 440 Operator Profit Enhancement On door placement ideal for renovation projects  Premium rental rates  Remote facility management Average # of ~400 330 Units / Facility Reduced labor cost  Enhanced tenant Award-winning, internal smart lock management / security Nokē $ 220 Additional facilities ~$200 Content / Unit 120 technologies (thermal Installation Projects Since Launch imaging, fire sensing, etc.) Assumed in Janus Consumer Demand Pull Assumed Market Projections (1) 110 20% Strong demand for enhanced >60% Penetration Rate unit security and safety with Sales growth through 2023E 46 remote monitoring 24-hour unit access Recurring Revenue Estimated Market ~$1Bn ~1.0% 2.5% 5.0% 7.5% 10.0% Ongoing service revenue opportunity Opportunity Ability to easily share key Penetration Sources: Management Estimates and Self Storage Almanac Note: 1. Based on projected 2023E Nokē sales (excluding HD Padlock) 7
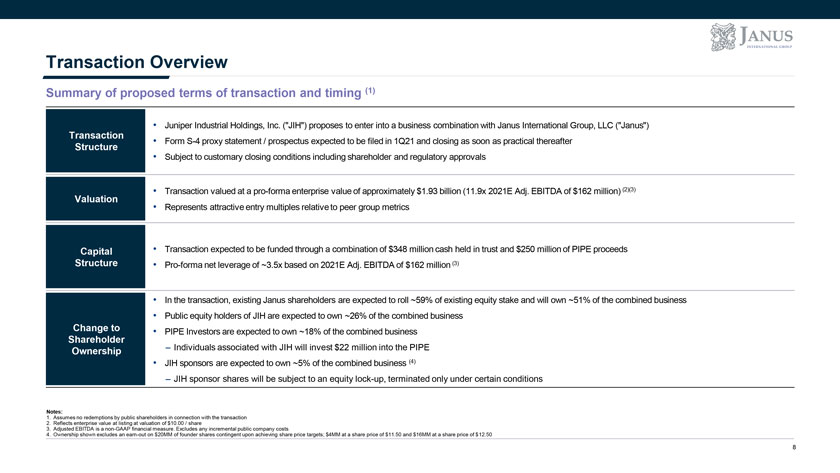
Transaction Overview Summary of proposed terms of transaction and timing (1) • Juniper Industrial Holdings, Inc. (“JIH”) proposes to enter into a business combination with Janus International Group, LLC (“Janus”) Transaction • Form S-4 proxy statement / prospectus expected to be filed in 1Q21 and closing as soon as practical thereafter Structure • Subject to customary closing conditions including shareholder and regulatory approvals • Transaction valued at a pro-forma enterprise value of approximately $1.93 billion (11.9x 2021E Adj. EBITDA of $162 million) (2)(3) Valuation Represents attractive entry multiples • relative to peer group metrics Capital • Transaction expected to be funded through a combination of $348 million cash held in trust and $250 million of PIPE proceeds Structure • Pro-forma net leverage of ~3.5x based on 2021E Adj. EBITDA of $162 million (3) • In the transaction, existing Janus shareholders are expected to roll ~59% of existing equity stake and will own ~51% of the combined business • Public equity holders of JIH are expected to own ~26% of the combined business Change to • PIPE Investors are expected to own ~18% of the combined business Shareholder – Individuals associated with JIH will invest $22 million into the PIPE Ownership • JIH sponsors are expected to own ~5% of the combined business (4) – JIH sponsor shares will be subject to an equity lock-up, terminated only under certain conditions Notes: 1. Assumes no redemptions by public shareholders in connection with the transaction 2. Reflects enterprise value at listing at valuation of $10.00 / share 3. Adjusted EBITDA is a non-GAAP financial measure. Excludes any incremental public company costs 4. Ownership shown excludes an earn-out on $20MM of founder shares contingent upon achieving share price targets; $4MM at a share price of $11.50 and $16MM at a share price of $12.50 8

Company Overview
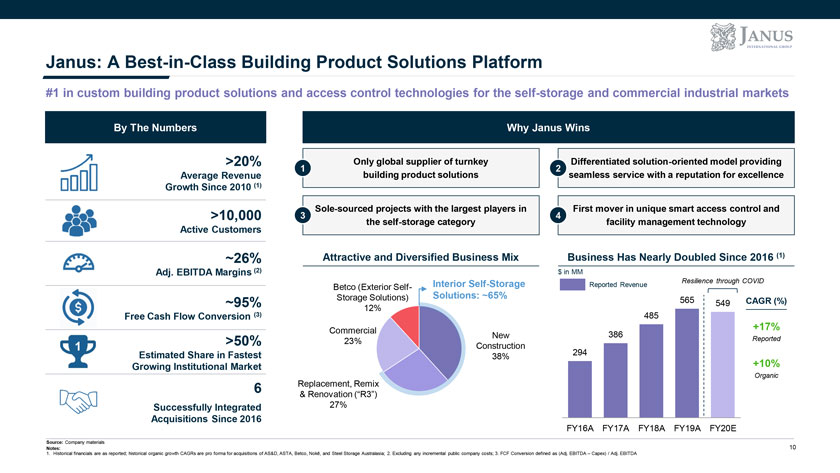
Janus: A Best-in-Class Building Product Solutions Platform #1 in custom building product solutions and access control technologies for the self-storage and commercial industrial markets By The Numbers Why Janus Wins >20% Only global supplier of turnkey Differentiated solution-oriented model providing 1 2 Average Revenue building product solutions seamless service with a reputation for excellence Growth Since 2010 (1) Sole-sourced projects with the largest players in First mover in unique smart access control and >10,000 3 4 the self-storage category facility management technology Active Customers ~26% Attractive and Diversified Business Mix Business Has Nearly Doubled Since 2016 (1) Adj. EBITDA Margins (2) $ in MM Interior Self-Storage Resilience through COVID Betco (Exterior Self- Reported Revenue Storage Solutions) Solutions: ~65% ~95% 12% 565 549 CAGR (%) Free Cash Flow Conversion (3) 485 Commercial 386 +17% New Reported >50% 23% 1 Construction Estimated Share in Fastest 294 38% Growing Institutional Market +10% Organic 6 Replacement, Remix & Renovation (“R3”) Successfully Integrated 27% Acquisitions Since 2016 FY16A FY17A FY18A FY19A FY20E Source: Company materials 10 Notes: 1. Historical financials are as reported; historical organic growth CAGRs are pro forma for acquisitions of AS&D, ASTA, Betco, Nokē, and Steel Storage Australasia; 2. Excluding any incremental public company costs; 3. FCF Conversion defined as (Adj. EBITDA – Capex) / Adj. EBITDA
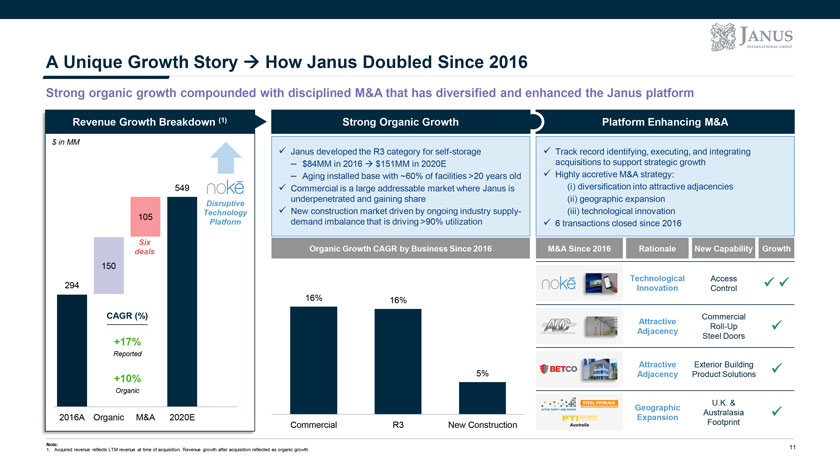
A Unique Growth Story ïƒ How Janus Doubled Since 2016 Strong organic growth compounded with disciplined M&A that has diversified and enhanced the Janus platform Revenue Growth Breakdown (1) Strong Organic Growth Platform Enhancing M&A $ in MM  Janus developed the R3 category for self-storage Track record identifying, executing, and integrating – $84MM in 2016 ïƒ $151MM in 2020E acquisitions to support strategic growth – Aging installed base with ~60% of facilities >20 years old Highly accretive M&A strategy: 549 Commercial is a large addressable market where Janus is (i) diversification into attractive adjacencies underpenetrated and gaining share (ii) geographic expansion Disruptive by technological innovation Technology  New construction market driven ongoing industry supply- (iii) 105 Platform demand imbalance that is driving >90% utilization 6 transactions closed since 2016 Six deals Organic Growth CAGR by Business Since 2016 M&A Since 2016 Rationale New Capability Growth 150 Technological Access  294 Innovation Control 16% 16% CAGR (%) Commercial Attractive Roll-Up  Adjacency Steel Doors +17% Reported Attractive Exterior Building  5% Adjacency Product Solutions +10% Organic U.K. & Geographic Australasia  2016A Organic M&A 2020E Expansion Commercial R3 New Construction Australia Footprint Note: 11 1. Acquired revenue reflects LTM revenue at time of acquisition. Revenue growth after acquisition reflected as organic growth
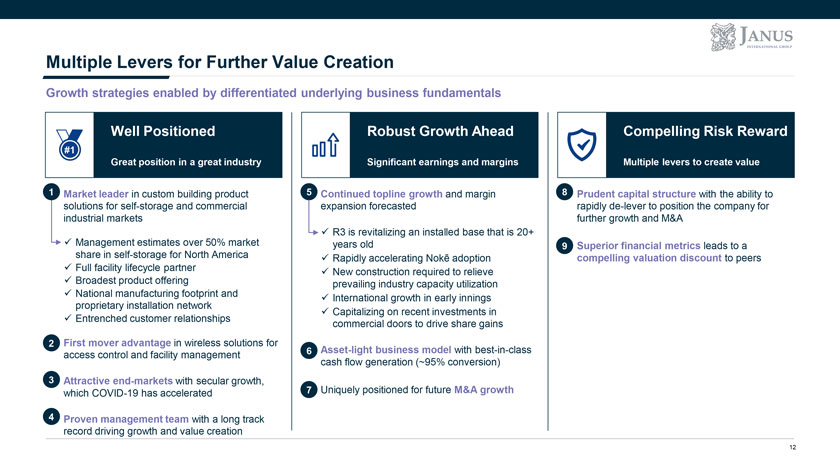
Multiple Levers for Further Value Creation Growth strategies enabled by differentiated underlying business fundamentals Well Positioned Robust Growth Ahead Compelling Risk Reward #1 Great position in a great industry Significant earnings and margins Multiple levers to create value 1 Market leader in custom building product 5 Continued topline growth and margin 8 Prudent capital structure with the ability to solutions for self-storage and commercial expansion forecasted rapidly de-lever to position the company for industrial markets further growth and M&A  R3 is revitalizing an installed base that is 20+  Management estimates over 50% market years old 9 Superior financial metrics leads to a share in self-storage for North America Rapidly accelerating Nokē adoption compelling valuation discount to peers Full facility lifecycle partner New construction required to relieve  Broadest product offering prevailing industry capacity utilization National manufacturing footprint and  International growth in early innings proprietary installation network Capitalizing on recent investments in  Entrenched customer relationships commercial doors to drive share gains 2 First mover advantage in wireless solutions for 6 Asset-light business model with best-in-class access control and facility management cash flow generation (~95% conversion) 3 Attractive end-markets with secular growth, which COVID-19 has accelerated 7 Uniquely positioned for future M&A growth 4 Proven management team with a long track record driving growth and value creation 12
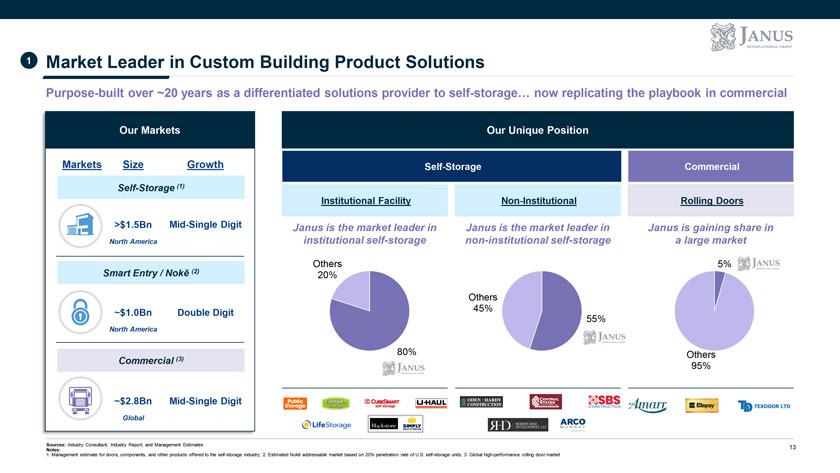
1 Market Leader in Custom Building Product Solutions Purpose-built over ~20 years as a differentiated solutions provider to self-storage… now replicating the playbook in commercial Our Markets Our Unique Position Markets Size Growth Self-Storage Commercial Self-Storage (1) Institutional Facility Non-Institutional Rolling Doors >$1.5Bn Mid-Single Digit Janus is the market leader in Janus is the market leader in Janus is gaining share in North America institutional self-storage non-institutional self-storage a large market Others 5% Smart Entry / Nokē (2) 20% Others ~$1.0Bn Double Digit 45% 55% North America (3) 80% Others Commercial 95% ~$2.8Bn Mid-Single Digit Global Sources: Industry Consultant, Industry Report, and Management Estimates 13 Notes: 1. Management estimate for doors, components, and other products offered to the self-storage industry; 2. Estimated Nokē addressable market based on 20% penetration rate of U.S. self-storage units; 3. Global high-performance rolling door market
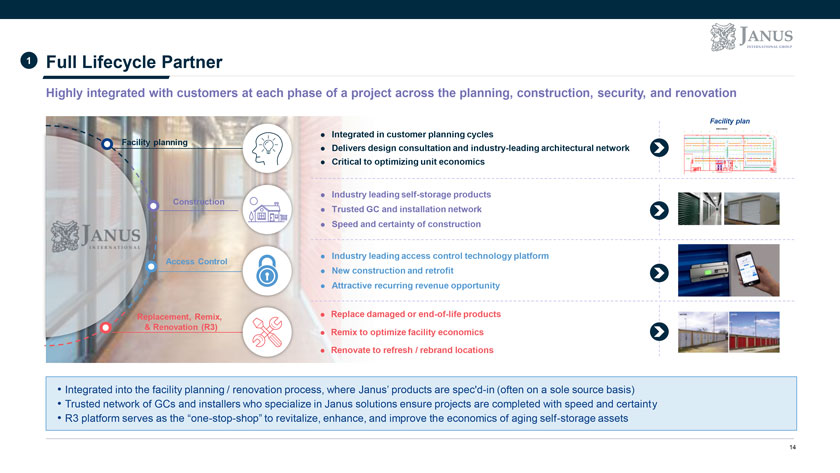
1 Full Lifecycle Partner Highly integrated with customers at each phase of a project across the planning, construction, security, and renovation Facility plan Facility planningï¬ Integrated in customer planning cycles ` industry-leading architectural networkï¬ Delivers design consultation andï¬ Critical to optimizing unit economics Constructionï¬ Industry leading self-storage products ` and installation networkï¬ Trusted GC ï¬ Speed and certainty of construction ï¬ Industry leading access control technology platform Access Control ` construction and ï¬ New retrofit ï¬ Attractive recurring revenue opportunity Replacement, Remix, ï¬ Replace damaged or end-of-life products ` & Renovation (R3) ï¬ Remix to optimize facility economics ï¬ Renovate to refresh / rebrand locations • Integrated into the facility planning / renovation process, where Janus’ products are spec’d-in (often on a sole source basis) • Trusted network of GCs and installers who specialize in Janus solutions ensure projects are completed with speed and certainty • R3 platform serves as the “one-stop-shop” to revitalize, enhance, and improve the economics of aging self-storage assets 14
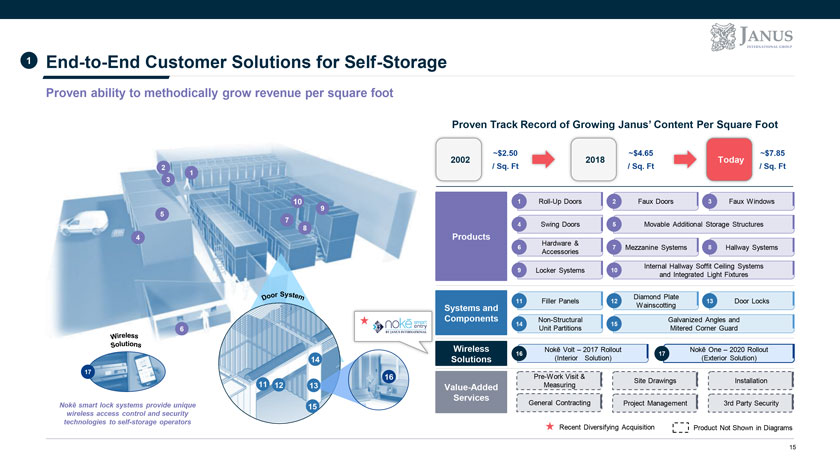
1 End-to-End Customer Solutions for Self-Storage Proven ability to methodically grow revenue per square foot Proven Track Record of Growing Janus’ Content Per Square Foot ~$2.50 ~$4.65 ~$7.85 2002 2018 Today 2 1 / Sq. Ft / Sq. Ft / Sq. Ft 3 10 1 Roll-Up Doors 2 Faux Doors 3 Faux Windows 5 9 7 4 Swing Doors 5 Movable Additional Storage Structures 8 4 Products Hardware & 6 7 Mezzanine Systems 8 Hallway Systems Accessories Internal Hallway Soffit Ceiling Systems 9 Locker Systems 10 and Integrated Light Fixtures Diamond Plate 11 Filler Panels 12 13 Door Locks Systems and Wainscotting Components Non-Structural Galvanized Angles and 14 15 6 Unit Partitions Mitered Corner Guard Wireless Nokē Volt – 2017 Rollout Nokē One – 2020 Rollout 16 17 14 Solutions (Interior Solution) (Exterior Solution) 17 16 Pre-Work Visit & Site Drawings Installation 11 12 13 Value-Added Measuring Services Nokē smart lock systems provide unique General Contracting Project Management 3rd Party Security 15 wireless access control and security technologies to self-storage operators Recent Diversifying Acquisition Product Not Shown in Diagrams 15
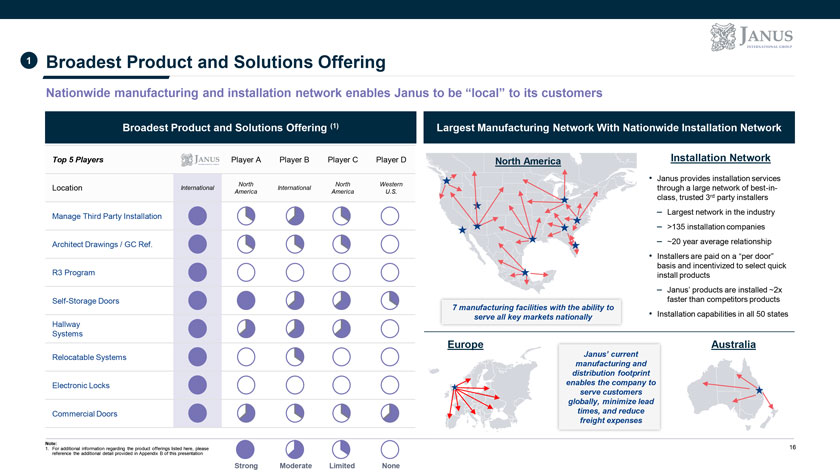
1 Broadest Product and Solutions Offering Nationwide manufacturing and installation network enables Janus to be “local” to its customers Broadest Product and Solutions Offering (1) Largest Manufacturing Network With Nationwide Installation Network Top 5 Players Player A Player B Player C Player D North America Installation Network North North Western • Janus provides installation services Location International International through a large network of best-in- America America U.S. class, trusted 3rd party installers – Largest network in the industry Manage Third Party Installation – >135 installation companies Architect Drawings / GC Ref. – ~20 year average relationship • Installers are paid on a “per door” R3 Program basis and incentivized to select quick install products – Janus’ products are installed ~2x Self-Storage Doors faster than competitors products 7 manufacturing facilities with the ability to serve all key markets nationally • Installation capabilities in all 50 states Hallway Systems Europe Australia Relocatable Systems Janus’ current manufacturing and distribution footprint Electronic Locks enables the company to serve customers globally, minimize lead Commercial Doors times, and reduce freight expenses Note: 1. For additional information regarding the product offerings listed here, please 16 reference the additional detail provided in Appendix B of this presentation Strong Moderate Limited None
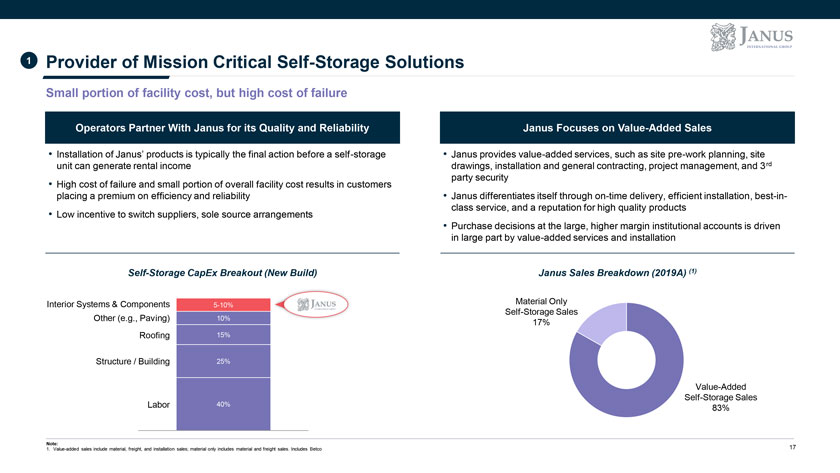
1 Provider of Mission Critical Self-Storage Solutions Small portion of facility cost, but high cost of failure Operators Partner With Janus for its Quality and Reliability Janus Focuses on Value-Added Sales • Installation of Janus’ products is typically the final action before a self-storage • Janus provides value-added services, such as site pre-work planning, site unit can generate rental income drawings, installation and general contracting, project management, and 3rd party security • High cost of failure and small portion of overall facility cost results in customers placing a premium on efficiency and reliability • Janus differentiates itself through on-time delivery, efficient installation, best-in-class service, and a reputation for high quality products • Low incentive to switch suppliers, sole source arrangements • Purchase decisions at the large, higher margin institutional accounts is driven in large part by value-added services and installation Self-Storage CapEx Breakout (New Build) Janus Sales Breakdown (2019A) (1) Interior Systems & Components Material Only 5-10% Self-Storage Sales Other (e.g., Paving) 10% 17% Roofing 15% Structure / Building 25% Value-Added Labor 40% Self-Storage Sales 83% Note: 1. Value-added sales include material, freight, and installation sales; material only includes material and freight sales. Includes Betco 17
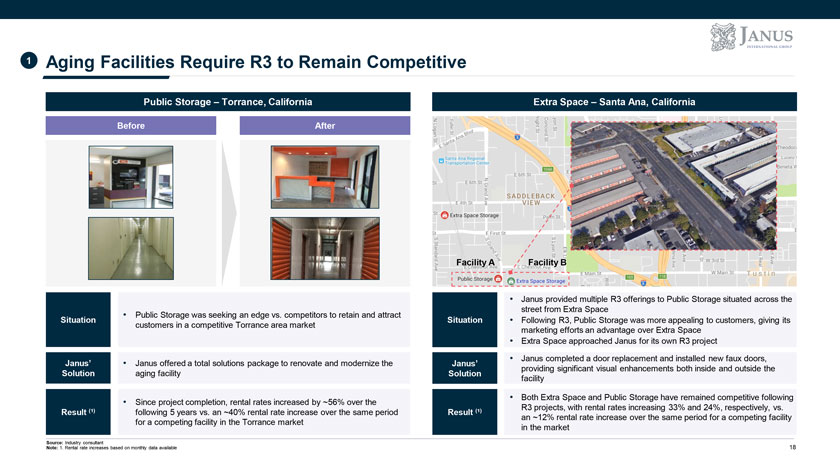
1 Aging Facilities Require R3 to Remain Competitive Public Storage – Torrance, California Extra Space – Santa Ana, California Before After Facility A Facility B • Janus provided multiple R3 offerings to Public Storage situated across the street from Extra Space • Public Storage was seeking an edge vs. competitors to retain and attract Situation Situation • Following R3, Public Storage was more appealing to customers, giving its customers in a competitive Torrance area market marketing efforts an advantage over Extra Space • Extra Space approached Janus for its own R3 project • Janus completed a door replacement and installed new faux doors, Janus’ • Janus offered a total solutions package to renovate and modernize the Janus’ providing significant visual enhancements both inside and outside the Solution aging facility Solution facility • Both Extra Space and Public Storage have remained competitive following • Since project completion, rental rates increased by ~56% over the ( ) ( ) R3 projects, with rental rates increasing 33% and 24%, respectively, vs. Result ¹ following 5 years vs. an ~40% rental rate increase over the same period Result ¹ an ~12% rental rate increase over the same period for a competing facility for a competing facility in the Torrance market in the market Source: Industry consultant 18 Note: 1. Rental rate increases based on monthly data available
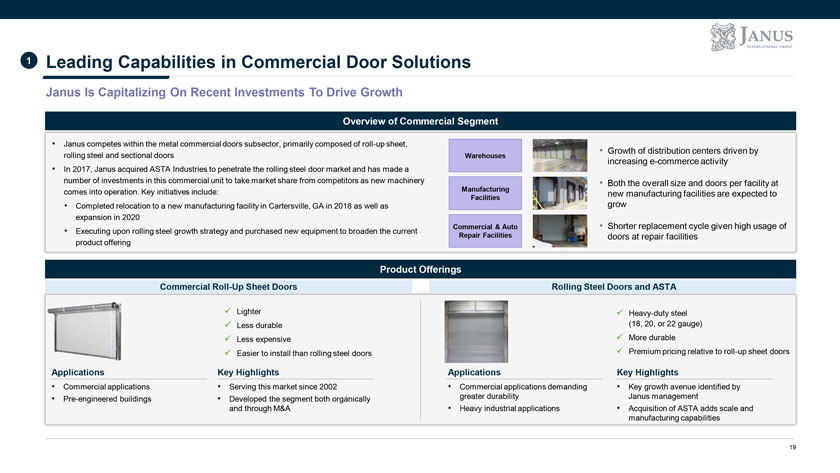
1 Leading Capabilities in Commercial Door Solutions Janus Is Capitalizing On Recent Investments To Drive Growth Overview of Commercial Segment • Janus competes within the metal commercial doors subsector, primarily composed of roll-up sheet, • Growth of distribution centers driven by rolling steel and sectional doors Warehouses increasing e-commerce activity • In 2017, Janus acquired ASTA Industries to penetrate the rolling steel door market and has made a number of investments in this commercial unit to take market share from competitors as new machinery • Both the overall size and doors per facility at comes into operation. Key initiatives include: Manufacturing new manufacturing facilities are expected to Facilities • Completed relocation to a new manufacturing facility in Cartersville, GA in 2018 as well as grow expansion in 2020 Commercial & Auto • Shorter replacement cycle given high usage of • Executing upon rolling steel growth strategy and purchased new equipment to broaden the current Repair Facilities doors at repair facilities product offering Product Offerings Commercial Roll-Up Sheet Doors Rolling Steel Doors and ASTA  Lighter Heavy-duty steel  Less durable (18, 20, or 22 gauge) Less expensive More durable  Easier to install than rolling steel doors Premium pricing relative to roll-up sheet doors Applications Key Highlights Applications Key Highlights • Commercial applications • Serving this market since 2002 • Commercial applications demanding • Key growth avenue identified by • Pre-engineered buildings • Developed the segment both organically greater durability Janus management and through M&A • Heavy industrial applications • Acquisition of ASTA adds scale and manufacturing capabilities 19
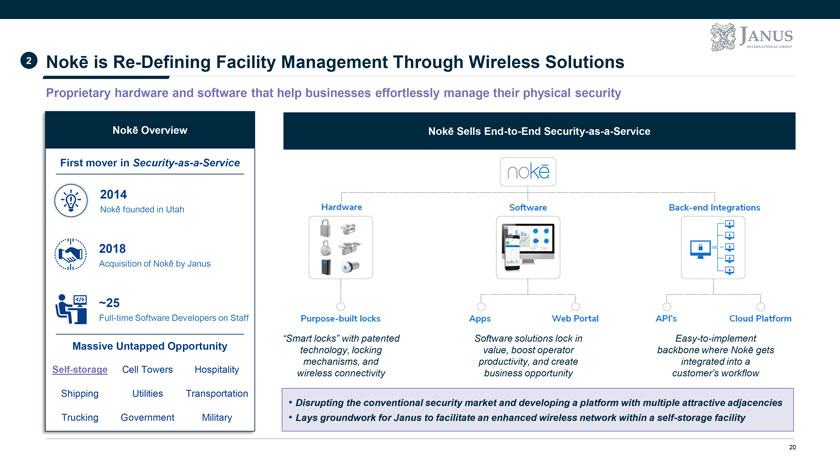
2 Nokē is Re-Defining Facility Management Through Wireless Solutions Proprietary hardware and software that help businesses effortlessly manage their physical security “Smart locks” with patented Software solutions lock in Easy-to-implement technology, locking value, boost operator backbone where Nokē gets mechanisms, and productivity, and create integrated into a wireless connectivity business opportunity customer’s workflow • Disrupting the conventional security market and developing a platform with multiple attractive adjacencies • Lays groundwork for Janus to facilitate an enhanced wireless network within a self-storage facility 20

2 In Self-Storage Alone, Nokē Is a $1 Billion Opportunity Janus is driving adoption of Nokē in self-storage Proprietary Locking Systems Nokē Represents a Significant New Revenue Stream for Janus Large Market Opportunity Janus & Nokē Revenue Opportunity Factors Driving Adoption $ in MM U.S. Self-Storage ~55,000 Facilities 440 Operator Profit Enhancement On door placement ideal for renovation projects  Premium rental rates  Remote facility management Average # of ~400 330 Units / Facility Reduced labor cost  Enhanced tenant Award-winning, internal smart lock management / security Nokē $ 220 Additional facilities ~$200 Content / Unit 120 technologies (thermal Installation Projects Since Launch imaging, fire sensing, etc.) Assumed in Janus Consumer Demand Pull Assumed Market Projections (1) 110 20% Strong demand for enhanced >60% Penetration Rate unit security and safety with Sales growth through 2023E 46 remote monitoring 24-hour unit access Recurring Revenue Estimated Market ~$1Bn ~1.0% 2.5% 5.0% 7.5% 10.0% Ongoing service revenue opportunity Opportunity Ability to easily share key Penetration Sources: Management Estimates and Self Storage Almanac Note: 1. Based on projected 2023E Nokē sales (excluding HD Padlock) 21
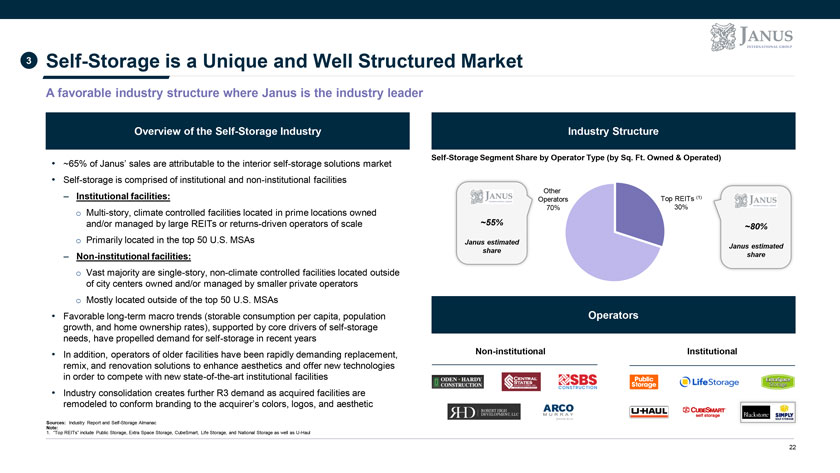
3 Self-Storage is a Unique and Well Structured Market A favorable industry structure where Janus is the industry leader Overview of the Self-Storage Industry Industry Structure Self-Storage Segment Share by Operator Type (by Sq. Ft. Owned & Operated) • ~65% of Janus’ sales are attributable to the interior self-storage solutions market • Self-storage is comprised of institutional and non-institutional facilities Other – Institutional facilities: Operators Top REITs (1) 70% 30% o Multi-story, climate controlled facilities located in prime locations owned and/or managed by large REITs or returns-driven operators of scale ~55% ~80% o Primarily located in the top 50 U.S. MSAs Janus estimated Janus estimated share – Non-institutional facilities: share o Vast majority are single-story, non-climate controlled facilities located outside of city centers owned and/or managed by smaller private operators o Mostly located outside of the top 50 U.S. MSAs • Favorable long-term macro trends (storable consumption per capita, population Operators growth, and home ownership rates), supported by core drivers of self-storage needs, have propelled demand for self-storage in recent years • In addition, operators of older facilities have been rapidly demanding replacement, Non-institutional Institutional remix, and renovation solutions to enhance aesthetics and offer new technologies in order to compete with new state-of-the-art institutional facilities • Industry consolidation creates further R3 demand as acquired facilities are remodeled to conform branding to the acquirer’s colors, logos, and aesthetic Sources: Industry Report and Self-Storage Almanac Note: 1. “Top REITs” include Public Storage, Extra Space Storage, CubeSmart, Life Storage, and National Storage as well as U-Haul 22
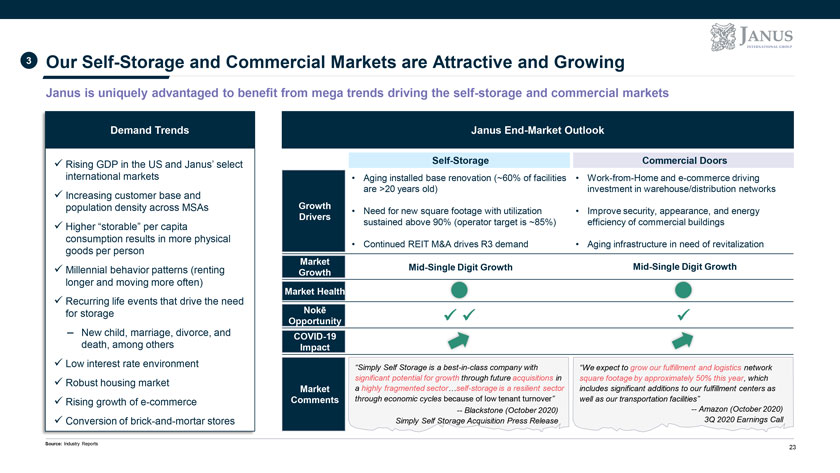
3 Our Self-Storage and Commercial Markets are Attractive and Growing Janus is uniquely advantaged to benefit from mega trends driving the self-storage and commercial markets Demand Trends Janus End-Market Outlook  Rising GDP in the US and Janus’ select Self-Storage Commercial Doors international markets • Aging installed base renovation (~60% of facilities • Work-from-Home and e-commerce driving are >20 years old) investment in warehouse/distribution networks  Increasing customer base and population density across MSAs Growth • Need for new square footage with utilization • Improve security, appearance, and energy Drivers sustained above 90% (operator target is ~85%) efficiency of commercial buildings  Higher “storable” per capita consumption results in more physical • Continued REIT M&A drives R3 demand • Aging infrastructure in need of revitalization goods per person Market  Millennial behavior patterns (renting Mid-Single Digit Growth Mid-Single Digit Growth Growth longer and moving more often) Market Health  Recurring life events that drive the need for storage Nokē Opportunity – New child, marriage, divorce, and COVID-19 death, among others Impact  Low interest rate environment “Simply Self Storage is a best-in-class company with “We expect to grow our fulfillment and logistics network significant potential for growth through future acquisitions in square footage by approximately 50% this year, which  Robust housing market Market a highly fragmented sector…self-storage is a resilient sector includes significant additions to our fulfillment centers as  Rising growth of e-commerce Comments through economic cycles because of low tenant turnover” well as our transportation facilities” — Blackstone (October 2020) — Amazon (October 2020) Conversion of brick-and-mortar stores Simply Self Storage Acquisition Press Release 3Q 2020 Earnings Call Source: Industry Reports 23
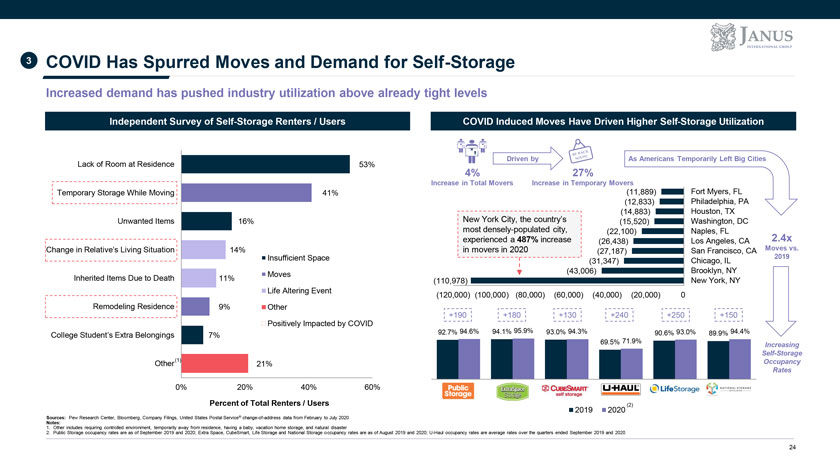
3 COVID Has Spurred Moves and Demand for Self-Storage Increased demand has pushed industry utilization above already tight levels Independent Survey of Self-Storage Renters / Users COVID Induced Moves Have Driven Higher Self-Storage Utilization Lack of Room at Residence 53% Driven by 4% 27% As Americans Temporarily Left Big Cities Temporary Storage While Moving 41% Increase in Total Movers Increase in Temporary Movers (11,889) (12,833) (14,883) Fort Myers, FL Philadelphia, PA Houston, TX Unwanted Items Change in Relative’s Living Situation 16% 14% Insufficient Space New York City, the country’s most densely-populated city, experienced a 487% increase in movers in 2020 (15,520) (22,100) (26,438) (27,187) (31,347) Washington, DC Naples, FL Los Angeles, CA San Francisco, CA Chicago, IL 2.4x Moves vs. 2019 Inherited Items Due to Death 11% Moves (110,978) (43,006) Brooklyn, NY New York, NY Remodeling Residence Life Altering Event 9% Other Positively Impacted by COVID (120,000) (100,000) (80,000) (60,000) (40,000) (20,000) 0 +190 +180 +130 +240 +250 +150 College Student’s Extra Belongings 7% Other(1) 21% 92.7% 94.6% 94.1% 95.9% 93.0% 94.3% 69.5% 71.9% 90.6% 93.0% 89.9% 94.4% Increasing Self-Storage Occupancy Rates 0% 20% 40% 60% Percent of Total Renters / Users Sources: Pew Research Center, Bloomberg, Company Filings, United States Postal Service® change-of-address data from February to July 2020 Notes: 1. Other includes requiring controlled environment, temporarily away from residence, having a baby, vacation home storage, and natural disaster 2019 2020 (2) 2. Public Storage occupancy rates are as of September 2019 and 2020; Extra Space, CubeSmart, Life Storage and National Storage occupancy rates are as of August 2019 and 2020; U-Haul occupancy rates are average rates over the quarters ended September 2019 and 2020 24
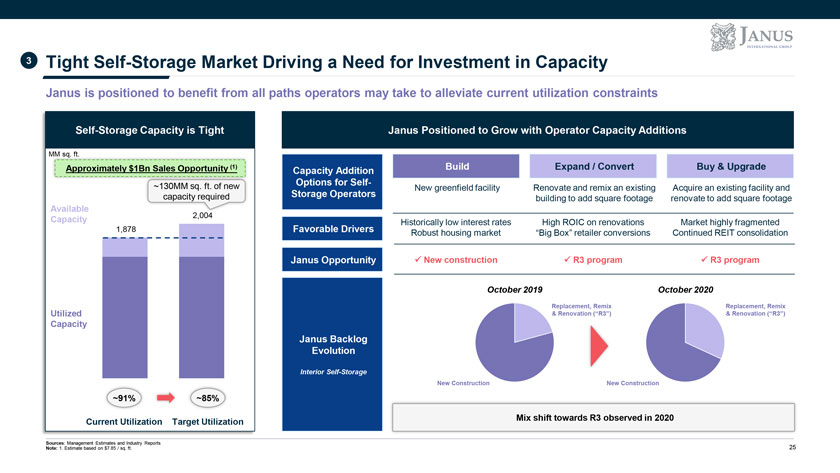
3 Tight Self-Storage Market Driving a Need for Investment in Capacity Janus is positioned to benefit from all paths operators may take to alleviate current utilization constraints Self-Storage Capacity is Tight Janus Positioned to Grow with Operator Capacity Additions MM sq. ft. Approximately $1Bn Sales Opportunity (1) Capacity Addition Build Expand / Convert Buy & Upgrade ~130MM sq. ft. of new Options for Self- New greenfield facility Renovate and remix an existing Acquire an existing facility and capacity required Storage Operators building to add square footage renovate to add square footage Available Capacity 2,004 1,878 Historically low interest rates High ROIC on renovations Market highly fragmented Favorable Drivers Robust housing market “Big Box” retailer conversions Continued REIT consolidation Janus Opportunity New construction R3 program R3 program October 2019 October 2020 Replacement, Remix Replacement, Remix Utilized & Renovation (“R3”) & Renovation (“R3”) Capacity Janus Backlog Evolution Interior Self-Storage New Construction New Construction ~91% ~85% Current Utilization Target Utilization Mix shift towards R3 observed in 2020 Sources: Management Estimates and Industry Reports Note: 1. Estimate based on $7.85 / sq. ft. 25
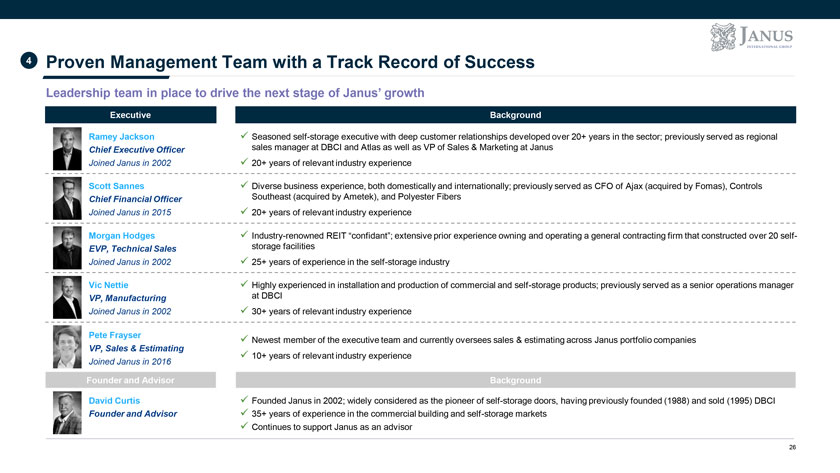
4 Proven Management Team with a Track Record of Success Leadership team in place to drive the next stage of Janus’ growth Executive Background Ramey Jackson Seasoned self-storage executive with deep customer relationships developed over 20+ years in the sector; previously served as regional Chief Executive Officer sales manager at DBCI and Atlas as well as VP of Sales & Marketing at Janus Joined Janus in 2002 20+ years of relevant industry experience Scott Sannes Diverse business experience, both domestically and internationally; previously served as CFO of Ajax (acquired by Fomas), Controls Chief Financial Officer Southeast (acquired by Ametek), and Polyester Fibers Joined Janus in 2015 20+ years of relevant industry experience Morgan Hodges Industry-renowned REIT “confidant”; extensive prior experience owning and operating a general contracting firm that constructed over 20 self- EVP, Technical Sales storage facilities Joined Janus in 2002 25+ years of experience in the self-storage industry Vic Nettie Highly experienced in installation and production of commercial and self-storage products; previously served as a senior operations manager VP, Manufacturing at DBCI Joined Janus in 2002 30+ years of relevant industry experience Pete Frayser  Newest member of the executive team and currently oversees sales & estimating across Janus portfolio companies VP, Sales & Estimating relevant industry experience  10+ years of Joined Janus in 2016 Founder and Advisor Background David Curtis Founded Janus in 2002; widely considered as the pioneer of self-storage doors, having previously founded (1988) and sold (1995) DBCI Founder and Advisor 35+ years of experience in the commercial building and self-storage markets Continues to support Janus as an advisor 26
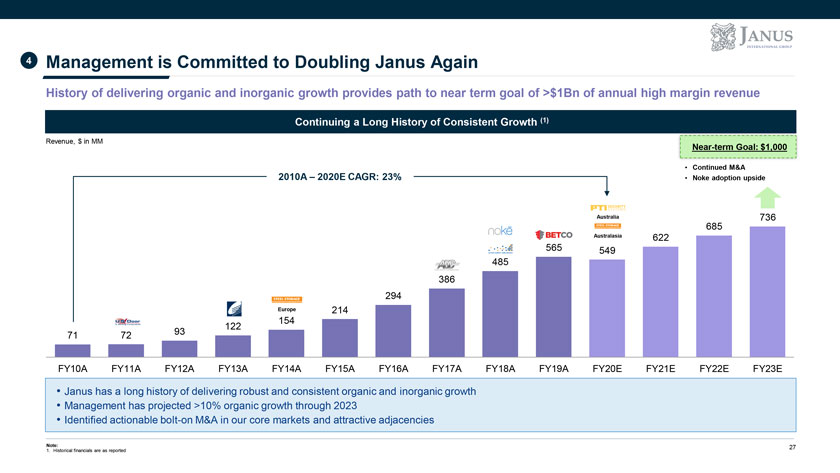
4 Management is Committed to Doubling Janus Again History of delivering organic and inorganic growth provides path to near term goal of >$1Bn of annual high margin revenue Continuing a Long History of Consistent Growth (1) Revenue, $ in MM Near-term Goal: $1,000 • Continued M&A 2010A – 2020E CAGR: 23% • Noke adoption upside Australia 736 685 Australasia 622 565 549 485 386 294 Europe 214 154 122 71 72 93 FY10A FY11A FY12A FY13A FY14A FY15A FY16A FY17A FY18A FY19A FY20E FY21E FY22E FY23E • Janus has a long history of delivering robust and consistent organic and inorganic growth • Management has projected >10% organic growth through 2023 • Identified actionable bolt-on M&A in our core markets and attractive adjacencies Note: 27 1. Historical financials are as reported

Financial Overview
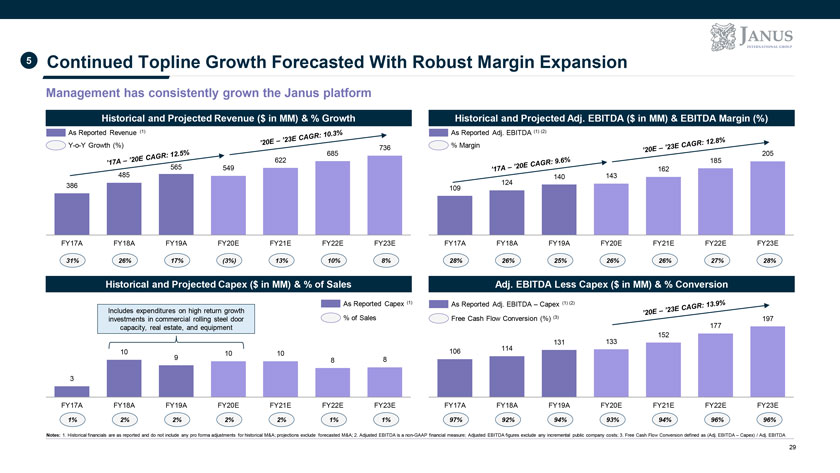
5 Continued Topline Growth Forecasted With Robust Margin Expansion Management has consistently grown the Janus platform Historical and Projected Revenue ($ in MM) & % Growth Historical and Projected Adj. EBITDA ($ in MM) & EBITDA Margin (%) As Reported Revenue (1) As Reported Adj. EBITDA (1) (2) Y-o-Y Growth (%) 736 % Margin 685 205 622 185 565 549 162 485 140 143 124 386 109 FY17A FY18A FY19A FY20E FY21E FY22E FY23E FY17A FY18A FY19A FY20E FY21E FY22E FY23E 31% 26% 17% (3%) 13% 10% 8% 28% 26% 25% 26% 26% 27% 28% Historical and Projected Capex ($ in MM) & % of Sales Adj. EBITDA Less Capex ($ in MM) & % Conversion As Reported Capex (1) As Reported Adj. EBITDA – Capex (1) (2) Includes expenditures on high return growth investments in commercial rolling steel door % of Sales Free Cash Flow Conversion (%) (3) 197 capacity, real estate, and equipment 177 152 131 133 106 114 10 9 10 10 8 8 3 FY17A FY18A FY19A FY20E FY21E FY22E FY23E FY17A FY18A FY19A FY20E FY21E FY22E FY23E 1% 2% 2% 2% 2% 1% 1% 97% 92% 94% 93% 94% 96% 96% Notes: 1. Historical financials are as reported and do not include any pro forma adjustments for historical M&A; projections exclude forecasted M&A; 2. Adjusted EBITDA is a non-GAAP financial measure; Adjusted EBITDA figures exclude any incremental public company costs; 3. Free Cash Flow Conversion defined as (Adj. EBITDA – Capex) / Adj. EBITDA 29
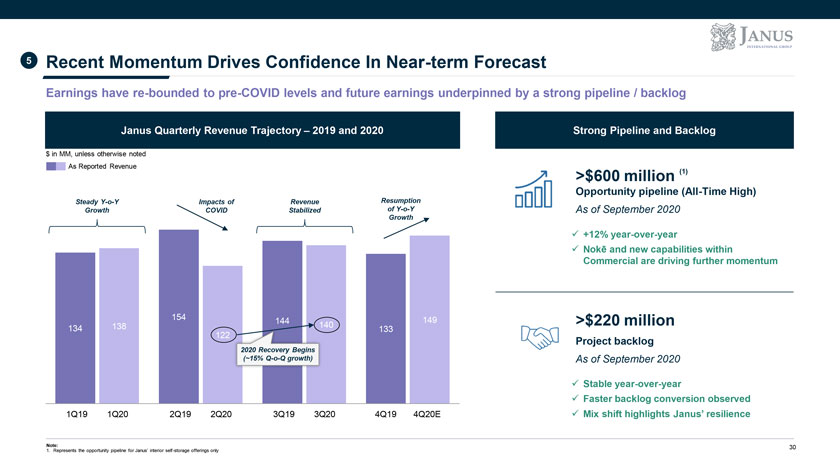
5 Recent Momentum Drives Confidence In Near-term Forecast Earnings have re-bounded to pre-COVID levels and future earnings underpinned by a strong pipeline / backlog Janus Quarterly Revenue Trajectory – 2019 and 2020 Strong Pipeline and Backlog $ in MM, unless otherwise noted As Reported Revenue >$600 million (1) Opportunity pipeline (All-Time High) Steady Y-o-Y Impacts of Revenue Resumption Growth COVID Stabilized of Y-o-Y As of September 2020 Growth  +12% year-over-year  Nokē and new capabilities within Commercial are driving further momentum 154 144 140 149 >$220 million 134 138 133 122 Project backlog 2020 Recovery Begins (~15% Q-o-Q growth) As of September 2020  Stable year-over-year  Faster backlog conversion observed 1Q19 1Q20 2Q19 2Q20 3Q19 3Q20 4Q19 4Q20E Mix shift highlights Janus’ resilience Note: 30 1. Represents the opportunity pipeline for Janus’ interior self-storage offerings only
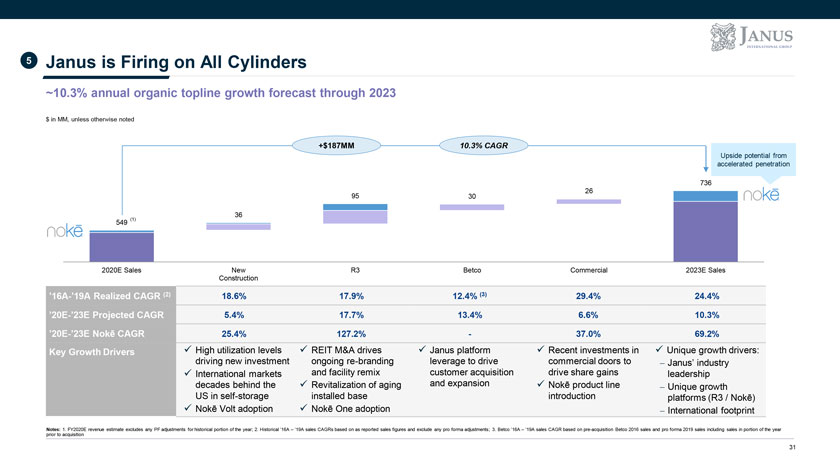
5 Janus is Firing on All Cylinders ~10.3% annual organic topline growth forecast through 2023 $ in MM, unless otherwise noted +$187MM 10.3% CAGR Upside potential from accelerated penetration 736 26 95 30 36 (1) 549 2020E Sales New R3 Betco Commercial 2023E Sales Construction ’16A-’19A Realized CAGR (2) 18.6% 17.9% 12.4% (3) 29.4% 24.4% ’20E-’23E Projected CAGR 5.4% 17.7% 13.4% 6.6% 10.3% ’20E-’23E Nokē CAGR 25.4% 127.2%—37.0% 69.2% Key Growth Drivers High utilization levels  REIT M&A drives  Janus platform  Recent investments in  Unique growth drivers: driving new investment ongoing re-branding leverage to drive commercial doors to ï€ Janus’ industry  International markets and facility remix customer acquisition drive share gains leadership decades behind the  Revitalization of aging and expansion Nokē product line ï€ Unique growth US in self-storage installed base introduction platforms (R3 / Nokē) Nokē Volt adoption Nokē One adoptionï€ International footprint Notes: 1. FY2020E revenue estimate excludes any PF adjustments for historical portion of the year; 2. Historical ’16A – ’19A sales CAGRs based on as reported sales figures and exclude any pro forma adjustments; 3. Betco ’16A – ’19A sales CAGR based on pre-acquisition Betco 2016 sales and pro forma 2019 sales including sales in portion of the year prior to acquisition 31
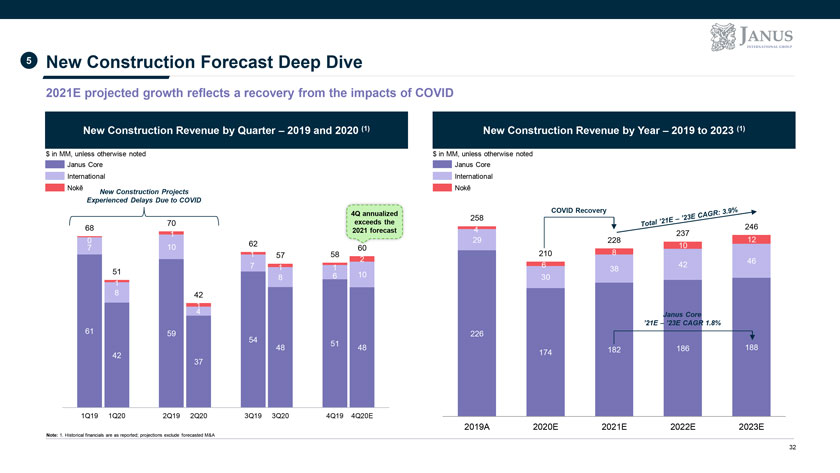
5 New Construction Forecast Deep Dive 2021E projected growth reflects a recovery from the impacts of COVID New Construction Revenue by Quarter – 2019 and 2020 (1) New Construction Revenue by Year – 2019 to 2023 (1) $ in MM, unless otherwise noted $ in MM, unless otherwise noted Janus Core Janus Core International International Nokē Nokē New Construction Projects Experienced Delays Due to COVID COVID Recovery 4Q annualized 258 70 exceeds the 68 4 246 2021 forecast 237 1 0 29 228 12 10 62 10 7 1 57 58 2 210 8 46 7 1 1 6 42 51 38 8 6 10 30 1 8 42 1 4 Janus Core ’21E – ’23E CAGR 1.8% 61 59 226 54 51 48 48 182 186 188 42 174 37 1Q19 1Q20 2Q19 2Q20 3Q19 3Q20 4Q19 4Q20E 2019A 2020E 2021E 2022E 2023E Note: 1. Historical financials are as reported; projections exclude forecasted M&A 32
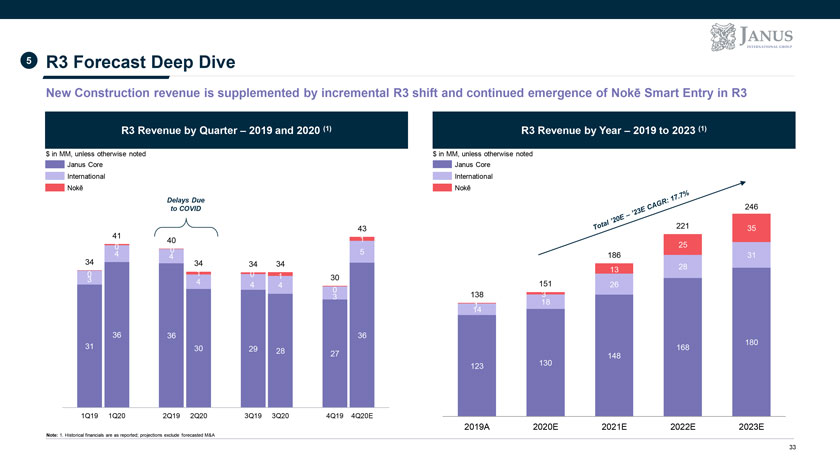
5 R3 Forecast Deep Dive New Construction revenue is supplemented by incremental R3 shift and continued emergence of Nokē Smart Entry in R3 R3 Revenue by Quarter – 2019 and 2020 (1) R3 Revenue by Year – 2019 to 2023 (1) $ in MM, unless otherwise noted $ in MM, unless otherwise noted Janus Core Janus Core International International Nokē Nokē Delays Due 246 to COVID 43 221 35 41 1 40 0 25 0 5 4 4 186 31 34 34 34 34 1 13 28 0 0 1 30 3 4 4 4 151 26 0 3 138 3 1 18 14 36 36 36 180 31 30 29 168 28 27 130 148 123 1Q19 1Q20 2Q19 2Q20 3Q19 3Q20 4Q19 4Q20E 2019A 2020E 2021E 2022E 2023E Note: 1. Historical financials are as reported; projections exclude forecasted M&A 33
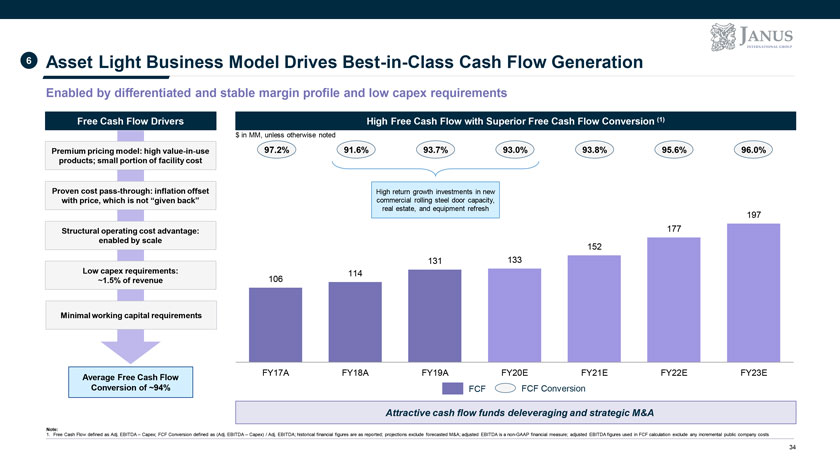
6 Asset Light Business Model Drives Best-in-Class Cash Flow Generation Enabled by differentiated and stable margin profile and low capex requirements Free Cash Flow Drivers High Free Cash Flow with Superior Free Cash Flow Conversion (1) $ in MM, unless otherwise noted Premium pricing model: high value-in-use 97.2% 91.6% 93.7% 93.0% 93.8% 95.6% 96.0% products; small portion of facility cost Proven cost pass-through: inflation offset High return growth investments in new with price, which is not “given back” commercial rolling steel door capacity, real estate, and equipment refresh 197 Structural operating cost advantage: 177 enabled by scale 152 131 133 Low capex requirements: 114 ~1.5% of revenue 106 Minimal working capital requirements FY17A FY18A FY19A FY20E FY21E FY22E FY23E Average Free Cash Flow Conversion of ~94% FCF FCF Conversion Attractive cash flow funds deleveraging and strategic M&A Note: 1. Free Cash Flow defined as Adj. EBITDA – Capex; FCF Conversion defined as (Adj. EBITDA – Capex) / Adj. EBITDA; historical financial figures are as reported; projections exclude forecasted M&A; adjusted EBITDA is a non-GAAP financial measure; adjusted EBITDA figures used in FCF calculation exclude any incremental public company costs 34
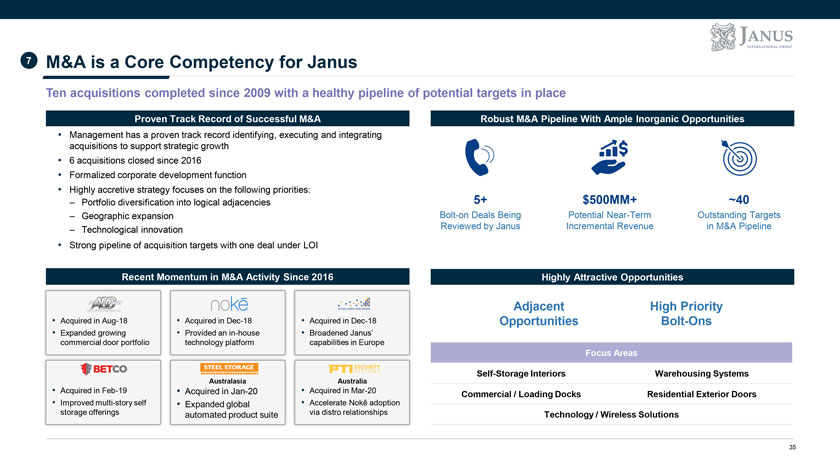
7 M&A is a Core Competency for Janus Ten acquisitions completed since 2009 with a healthy pipeline of potential targets in place Proven Track Record of Successful M&A Robust M&A Pipeline With Ample Inorganic Opportunities • Management has a proven track record identifying, executing and integrating acquisitions to support strategic growth • 6 acquisitions closed since 2016 • Formalized corporate development function • Highly accretive strategy focuses on the following priorities: 5+ $500MM+ ~40 – Portfolio diversification into logical adjacencies – Geographic expansion Bolt-on Deals Being Potential Near-Term Outstanding Targets – Technological innovation Reviewed by Janus Incremental Revenue in M&A Pipeline • Strong pipeline of acquisition targets with one deal under LOI Recent Momentum in M&A Activity Since 2016 Highly Attractive Opportunities Adjacent High Priority • Acquired in Aug-18 • Acquired in Dec-18 • Acquired in Dec-18 Opportunities Bolt-Ons • Expanded growing • Provided an in-house • Broadened Janus’ commercial door portfolio technology platform capabilities in Europe Focus Areas Self-Storage Interiors Warehousing Systems Australasia Australia • Acquired in Feb-19 • Acquired in Jan-20 • Acquired in Mar-20 Commercial / Loading Docks Residential Exterior Doors • Improved multi-story self • Expanded global • Accelerate Nokē adoption storage offerings automated product suite via distro relationships Technology / Wireless Solutions 35
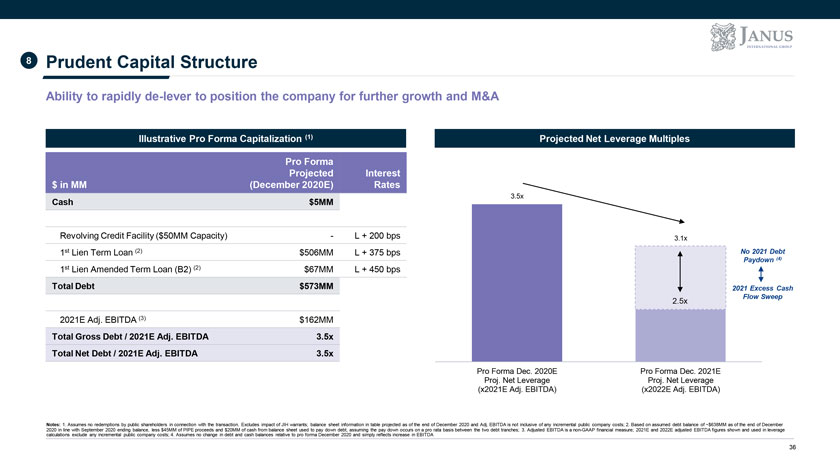
8 Prudent Capital Structure Ability to rapidly de-lever to position the company for further growth and M&A Illustrative Pro Forma Capitalization (1) Projected Net Leverage Multiples Pro Forma Projected Interest $ in MM (December 2020E) Rates 3.5x Cash $5MM Revolving Credit Facility ($50MM Capacity)—L + 200 bps 3.1x 1st Lien Term Loan (2) $506MM L + 375 bps No 2021 Debt Paydown (4) 1st Lien Amended Term Loan (B2) (2) $67MM L + 450 bps Total Debt $573MM 2021 Excess Cash Flow Sweep 2.5x 2021E Adj. EBITDA (3) $162MM Total Gross Debt / 2021E Adj. EBITDA 3.5x Total Net Debt / 2021E Adj. EBITDA 3.5x Pro Forma Dec. 2020E Pro Forma Dec. 2021E Proj. Net Leverage Proj. Net Leverage (x2021E Adj. EBITDA) (x2022E Adj. EBITDA) Notes: 1. Assumes no redemptions by public shareholders in connection with the transaction. Excludes impact of JIH warrants; balance sheet information in table projected as of the end of December 2020 and Adj. EBITDA is not inclusive of any incremental public company costs; 2. Based on assumed debt balance of ~$638MM as of the end of December 2020 in line with September 2020 ending balance, less $45MM of PIPE proceeds and $20MM of cash from balance sheet used to pay down debt, assuming the pay down occurs on a pro rata basis between the two debt tranches; 3. Adjusted EBITDA is a non-GAAP financial measure; 2021E and 2022E adjusted EBITDA figures shown and used in leverage calculations exclude any incremental public company costs; 4. Assumes no change in debt and cash balances relative to pro forma December 2020 and simply reflects increase in EBITDA 36
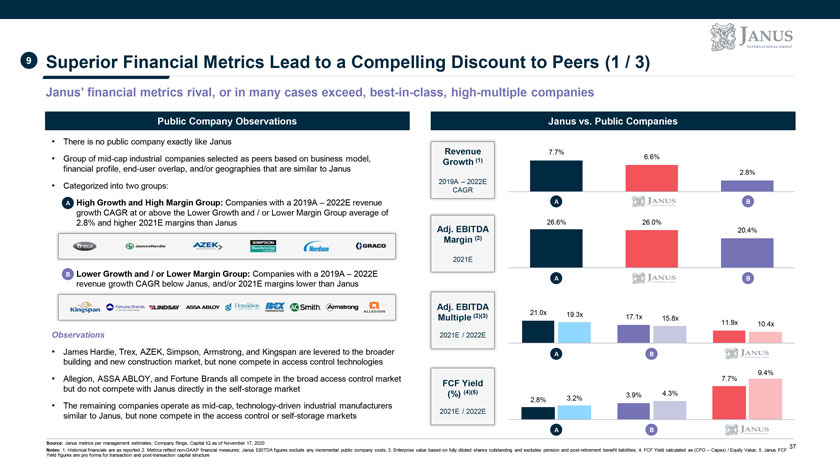
9 Superior Financial Metrics Lead to a Compelling Discount to Peers (1 / 3) Janus’ financial metrics rival, or in many cases exceed, best-in-class, high-multiple companies Public Company Observations Janus vs. Public Companies • There is no public company exactly like Janus Revenue 7.7% • Group of mid-cap industrial companies selected as peers based on business model, 6.6% Growth (1) financial profile, end-user overlap, and/or geographies that are similar to Janus 2.8% • 2019A – 2022E Categorized into two groups: CAGR – A High Growth and High Margin Group: Companies with a 2019A – 2022E revenue A B growth CAGR at or above the Lower Growth and / or Lower Margin Group average of 2.8% and higher 2021E margins than Janus Adj. EBITDA 26.6% 26.0% 20.4% Margin (2) 2021E – B Lower Growth and / or Lower Margin Group: Companies with a 2019A – 2022E A B revenue growth CAGR below Janus, and/or 2021E margins lower than Janus Adj. EBITDA 21.0x 19.3x Multiple (2)(3) 17.1x 15.8x 11.9x 10.4x Observations 2021E / 2022E • James Hardie, Trex, AZEK, Simpson, Armstrong, and Kingspan are levered to the broader A B building and new construction market, but none compete in access control technologies 7.7% 9.4% • Allegion, ASSA ABLOY, and Fortune Brands all compete in the broad access control market FCF Yield but do not compete with Janus directly in the self-storage market (4)(5) (%) 3.9% 4.3% 2.8% 3.2% • The remaining companies operate as mid-cap, technology-driven industrial manufacturers 2021E / 2022E similar to Janus, but none compete in the access control or self-storage markets A B Source: Janus metrics per management estimates, Company filings, Capital IQ as of November 17, 2020 37 Notes: 1. Historical financials are as reported 2. Metrics reflect non-GAAP financial measures; Janus EBITDA figures exclude any incremental public company costs; 3. Enterprise value based on fully diluted shares outstanding and excludes pension and post-retirement benefit liabilities; 4. FCF Yield calculated as (CFO – Capex) / Equity Value; 5. Janus FCF Yield figures are pro forma for transaction and post-transaction capital structure
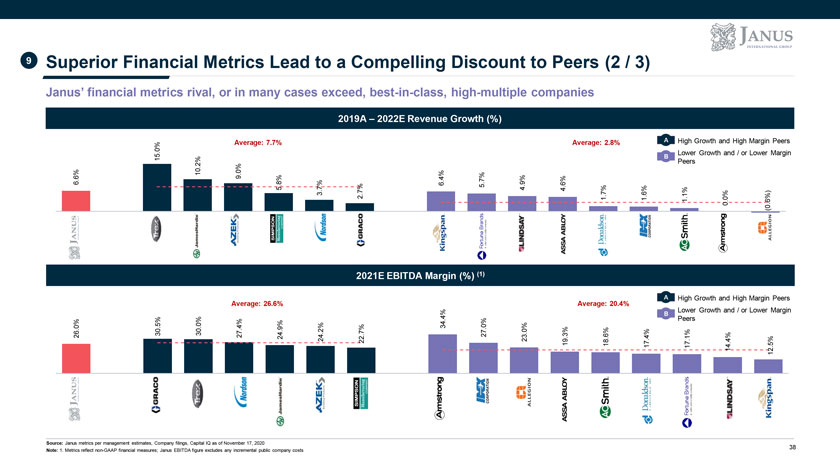
9 Superior Financial Metrics Lead to a Compelling Discount to Peers (2 / 3) Janus’ financial metrics rival, or in many cases exceed, best-in-class, high-multiple companies 2019A – 2022E Revenue Growth (%) 0% Average: 7.7% Average: 2.8% A High Growth and High Margin Peers . Lower Growth and / or Lower Margin 15 B 2% Peers . 0% 6% 10 . 9 4% . . 7% 8% . 9% 6 . 6 . 6% 7% 5 . 5 . 7% 4 4 7% 3 . . . 6% 1% 2 1 1 . 0% 1 . 6%) 0 (0 . f 2021E EBITDA Margin (%) (1) A High Growth and High Margin Peers Average: 26.6% Average: 20.4% Lower Growth and / or Lower Margin B 4% . Peers 0% 0% 5% . . 4% 34 0% 9% . . . . 2% . 7% . 0% 26 30 30 27 . 27 3% 6% 24 . . . 4% 1% 24 22 23 . 4% 19 18 . 5% 17 17 14 12 . f Source: Janus metrics per management estimates, Company filings, Capital IQ as of November 17, 2020 38 Note: 1. Metrics reflect non-GAAP financial measures; Janus EBITDA figure excludes any incremental public company costs
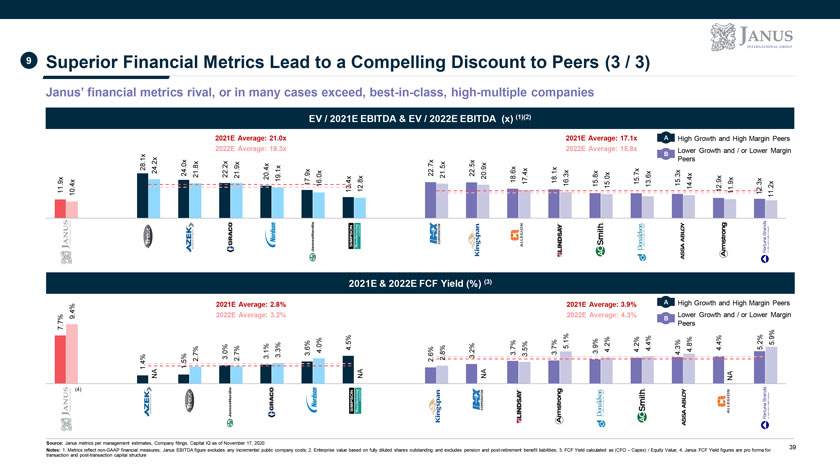
9 Superior Financial Metrics Lead to a Compelling Discount to Peers (3 / 3) Janus’ financial metrics rival, or in many cases exceed, best-in-class, high-multiple companies EV / 2021E EBITDA & EV / 2022E EBITDA (x) (1)(2) 2021E Average: 21.0x 2021E Average: 17.1x A High Growth and High Margin Peers 2022E Average: 19.3x 2022E Average: 15.8x B Lower Growth and / or Lower Margin . 1x 2x Peers . 0x 8x 2x 7x 5x 5x . 9x . . 9x 28 24 . . . 4x . 1x . . 6x 1x 24 . 9x 22 22 . 4x . 3x 7x 3x 21 22 21 . 0x . 21 20 . . 8x 0x . 6x . 20 . . 4x 19 . 9x 4x 8x 18 18 . 9x 9x . 4x 17 16 . . 17 16 15 15 . . 3x 15 13 . 2x . 15 14 11 10 13 12 12 11 12 . 11 f 2021E & 2022E FCF Yield (%) (3) 4% 2021E Average: 2.8% 2021E Average: 3.9% A High Growth and High Margin Peers 7% 9 . 2022E Average: 3.2% 2022E Average: 4.3% B Lower Growth and / or Lower Margin . Peers 7 9% 1% . 5% . 4% 4% 2% 5 . 2% 2% 8% . 0% 9% . . 7% 5 . . 3% . 3% 6% . 4 . 7% 5% . . 4 . 4 4 5 1% . 4 2% . 4 4 0% . 3 7% 7% . 3 8% . 3 3 4 . 6% . 3 . 3 . 3 3 . 3 4% 5% 2 2 2 2 . 1 . 1 NA NA NA NA (4) f Source: Janus metrics per management estimates, Company filings, Capital IQ as of November 17, 2020 39 Notes: 1. Metrics reflect non-GAAP financial measures; Janus EBITDA figure excludes any incremental public company costs; 2. Enterprise value based on fully diluted shares outstanding and excludes pension and post-retirement benefit liabilities; 3. FCF Yield calculated as (CFO – Capex) / Equity Value; 4. Janus FCF Yield figures are pro forma for transaction and post-transaction capital structure
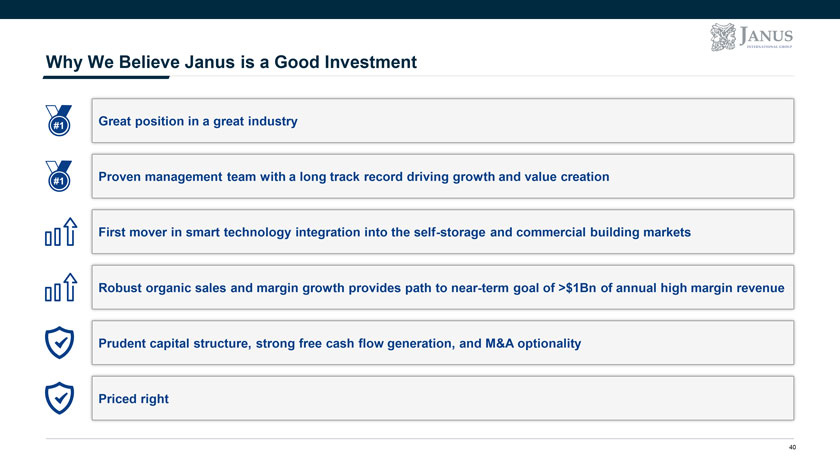
Why We Believe Janus is a Good Investment #1 Great position in a great industry #1 Proven management team with a long track record driving growth and value creation First mover in smart technology integration into the self-storage and commercial building markets Robust organic sales and margin growth provides path to near-term goal of >$1Bn of annual high margin revenue Prudent capital structure, strong free cash flow generation, and M&A optionality Priced right 40
APPENDIX A Additional Transaction Information
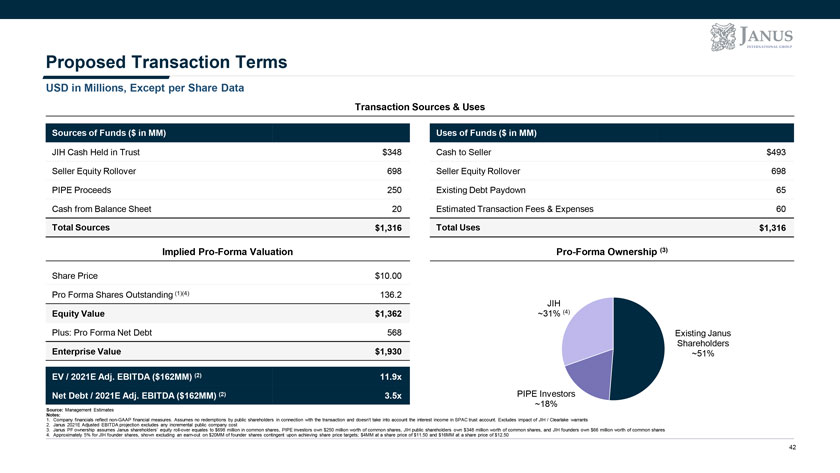
Proposed Transaction Terms USD in Millions, Except per Share Data Transaction Sources & Uses Sources of Funds ($ in MM) Uses of Funds ($ in MM) JIH Cash Held in Trust $348 Cash to Seller $493 Seller Equity Rollover 698 Seller Equity Rollover 698 PIPE Proceeds 250 Existing Debt Paydown 65 Cash from Balance Sheet 20 Estimated Transaction Fees & Expenses 60 Total Sources $1,316 Total Uses $1,316 Implied Pro-Forma Valuation Pro-Forma Ownership (3) Share Price $10.00 Pro Forma Shares Outstanding (1)(4) 136.2 JIH Equity Value $1,362 ~31% (4) Plus: Pro Forma Net Debt 568 Existing Janus Shareholders Enterprise Value $1,930 ~51% EV / 2021E Adj. EBITDA ($162MM) (2) 11.9x Net Debt / 2021E Adj. EBITDA ($162MM) (2) 3.5x PIPE Investors ~18% Source: Management Estimates Notes: 1. Company financials reflect non-GAAP financial measures. Assumes no redemptions by public shareholders in connection with the transaction and doesn’t take into account the interest income in SPAC trust account. Excludes impact of JIH / Clearlake warrants 2. Janus 2021E Adjusted EBITDA projection excludes any incremental public company cost 3. Janus PF ownership assumes Janus shareholders’ equity roll-over equates to $698 million in common shares, PIPE investors own $250 million worth of common shares, JIH public shareholders own $348 million worth of common shares, and JIH founders own $66 million worth of common shares 4. Approximately 5% for JIH founder shares, shown excluding an earn-out on $20MM of founder shares contingent upon achieving share price targets; $4MM at a share price of $11.50 and $16MM at a share price of $12.50 42
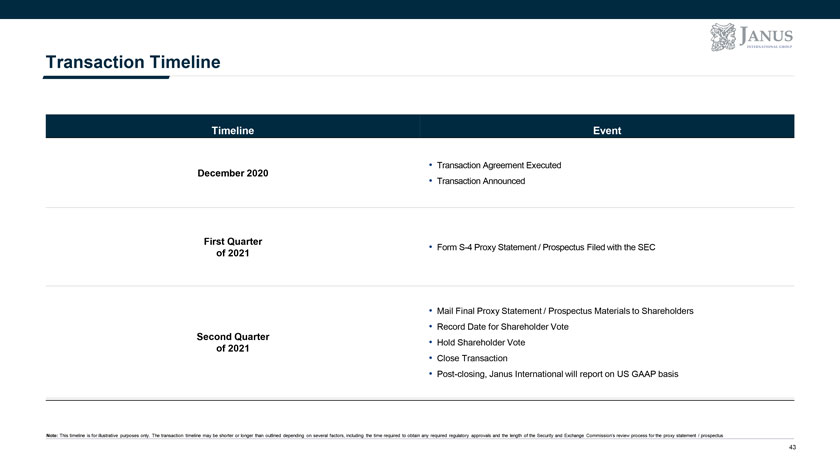
Transaction Timeline Timeline Event December 2020 • Transaction Agreement Executed • Transaction Announced First Quarter • Form S-4 Proxy Statement / Prospectus Filed with the SEC of 2021 • Mail Final Proxy Statement / Prospectus Materials to Shareholders • Record Date for Shareholder Vote Second Quarter • Hold Shareholder Vote of 2021 • Close Transaction • Post-closing, Janus International will report on US GAAP basis Note: This timeline is for illustrative purposes only. The transaction timeline may be shorter or longer than outlined depending on several factors, including the time required to obtain any required regulatory approvals and the length of the Security and Exchange Commission’s review process for the proxy statement / prospectus 43
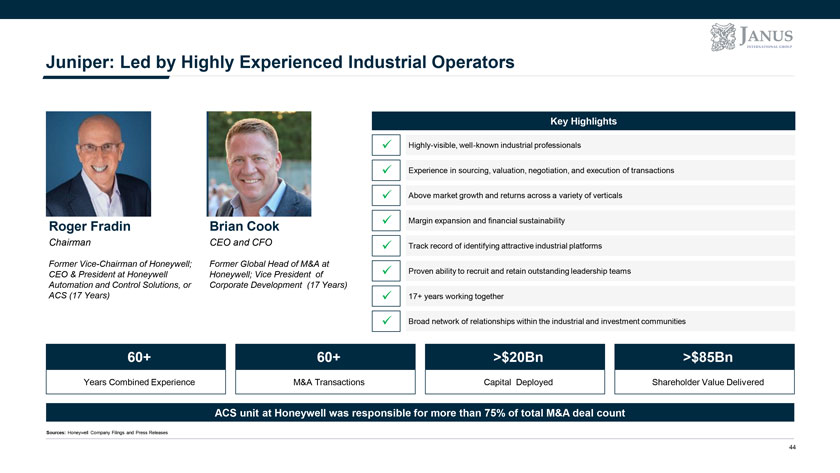
Juniper: Led by Highly Experienced Industrial Operators Key Highlights  Highly-visible, well-known industrial professionals  Experience in sourcing, valuation, negotiation, and execution of transactions Above market growth and returns across a variety of verticals Roger Fradin Brian Cook Margin expansion and financial sustainability Chairman CEO and CFO Track record of identifying attractive industrial platforms Former Vice-Chairman of Honeywell; Former Global Head of M&A at Proven ability to recruit and retain outstanding leadership teams CEO & President at Honeywell Honeywell; Vice President of  Automation and Control Solutions, or Corporate Development (17 Years) ACS (17 Years) 17+ years working together  Broad network of relationships within the industrial and investment communities 60+ 60+ >$20Bn >$85Bn Years Combined Experience M&A Transactions Capital Deployed Shareholder Value Delivered ACS unit at Honeywell was responsible for more than 75% of total M&A deal count Sources: Honeywell Company Filings and Press Releases 44
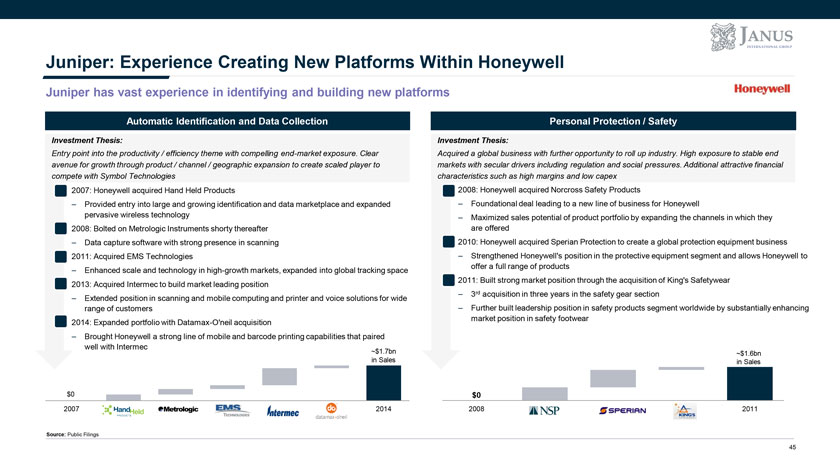
Juniper: Experience Creating New Platforms Within Honeywell Juniper has vast experience in identifying and building new platforms Automatic Identification and Data Collection Personal Protection / Safety Investment Thesis: Investment Thesis: Entry point into the productivity / efficiency theme with compelling end-market exposure. Clear Acquired a global business with further opportunity to roll up industry. High exposure to stable end avenue for growth through product / channel / geographic expansion to create scaled player to markets with secular drivers including regulation and social pressures. Additional attractive financial compete with Symbol Technologies characteristics such as high margins and low capex • 2007: Honeywell acquired Hand Held Products • 2008: Honeywell acquired Norcross Safety Products – Provided entry into large and growing identification and data marketplace and expanded – Foundational deal leading to a new line of business for Honeywell pervasive wireless technology – Maximized sales potential of product portfolio by expanding the channels in which they • 2008: Bolted on Metrologic Instruments shorty thereafter are offered – Data capture software with strong presence in scanning • 2010: Honeywell acquired Sperian Protection to create a global protection equipment business • 2011: Acquired EMS Technologies – Strengthened Honeywell’s position in the protective equipment segment and allows Honeywell to offer a full range of products – Enhanced scale and technology in high-growth markets, expanded into global tracking space • • 2011: Built strong market position through the acquisition of King’s Safetywear 2013: Acquired Intermec to build market leading position – 3rd acquisition in three years in the safety gear section – Extended position in scanning and mobile computing and printer and voice solutions for wide range of customers – Further built leadership position in safety products segment worldwide by substantially enhancing market position in safety footwear • 2014: Expanded portfolio with Datamax-O’neil acquisition – Brought Honeywell a strong line of mobile and barcode printing capabilities that paired well with Intermec ~$1.7bn ~$1.6bn in Sales in Sales $0 $0 2007 2014 2008 2011 Source: Public Filings 45
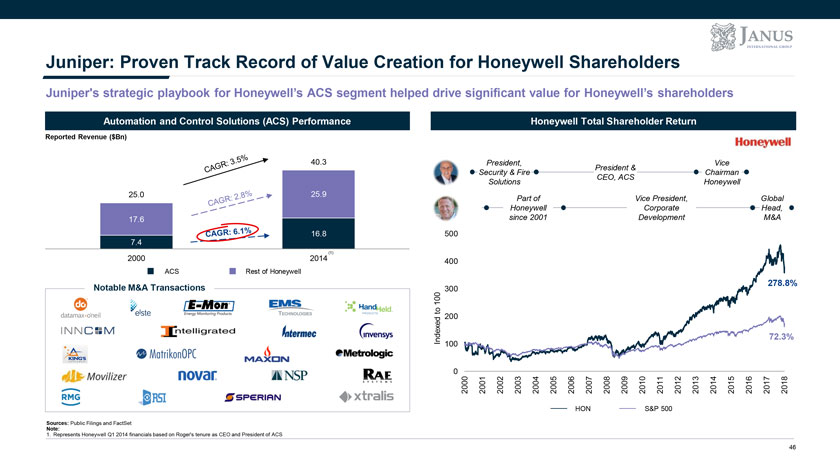
Juniper: Proven Track Record of Value Creation for Honeywell Shareholders Juniper’s strategic playbook for Honeywell’s ACS segment helped drive significant value for Honeywell’s shareholders Automation and Control Solutions (ACS) Performance Honeywell Total Shareholder Return Reported Revenue ($Bn) 40.3 President, Vice President & Security & Fire Chairman CEO, ACS Solutions Honeywell 25.0 25.9 Part of Vice President, Global Honeywell Corporate Head, since 2001 Development M&A (1) 278.8% 72.3% 2005 2006 2007 2008 2009 2010 2011 2012 2013 2014 2015 2016 2017 2018 HON S&P 500 46
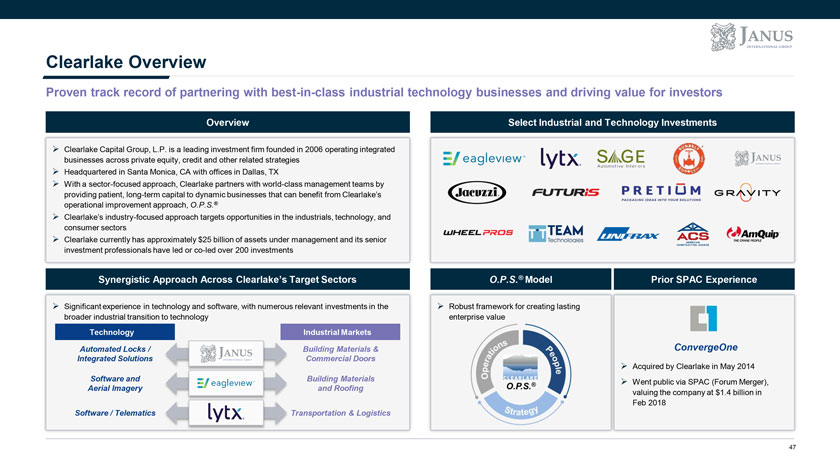
Clearlake Overview Proven track record of partnering with best-in-class industrial technology businesses and driving value for investors Overview Select Industrial and Technology Investments ïƒ~ Clearlake Capital Group, L.P. is a leading investment firm founded in 2006 operating integrated businesses across private equity, credit and other related strategies ïƒ~ Headquartered in Santa Monica, CA with offices in Dallas, TX ïƒ~ With a sector-focused approach, Clearlake partners with world-class management teams by providing patient, long-term capital to dynamic businesses that can benefit from Clearlake’s operational improvement approach, O.P.S.®ïƒ~ Clearlake’s industry-focused approach targets opportunities in the industrials, technology, and consumer sectorsïƒ~ Clearlake currently has approximately $25 billion of assets under management and its senior investment professionals have led or co-led over 200 investments Synergistic Approach Across Clearlake’s Target Sectors O.P.S.® Model Prior SPAC Experience ïƒ~ Significant experience in technology and software, with numerous relevant investments in the ïƒ~ Robust framework for creating lasting broader industrial transition to technology enterprise value Technology Industrial Markets Automated Locks / Building Materials & ConvergeOne Integrated Solutions Commercial Doors ïƒ~ Acquired by Clearlake in May 2014 Software and Building Materials ïƒ~ Went public via SPAC (Forum Merger), Aerial Imagery and Roofing valuing the company at $1.4 billion in Feb 2018 Software / Telematics Transportation & Logistics 47
APPENDIX B Additional Company Materials
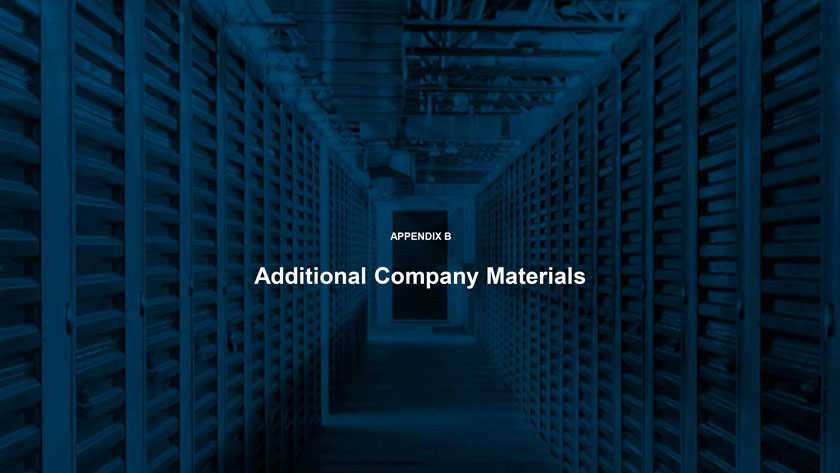
Janus is Uniquely Positioned Within the Self-Storage Value-Chain Turnkey Approach and Full-Service Solutions Secure Optimal Outcomes for All Value-Chain Participants Janus enables self- Janus produces and storage operators to assists architects start operations up to Customers with over 1,000 3 months quicker (Self-Storage drawings per year than competitors Operators) Architects Janus’ products General install ~2x faster than Contractors Janus refers well over Installers its competitors, $100MM of business resulting in more annually to third party completed jobs for general contractors installers 49
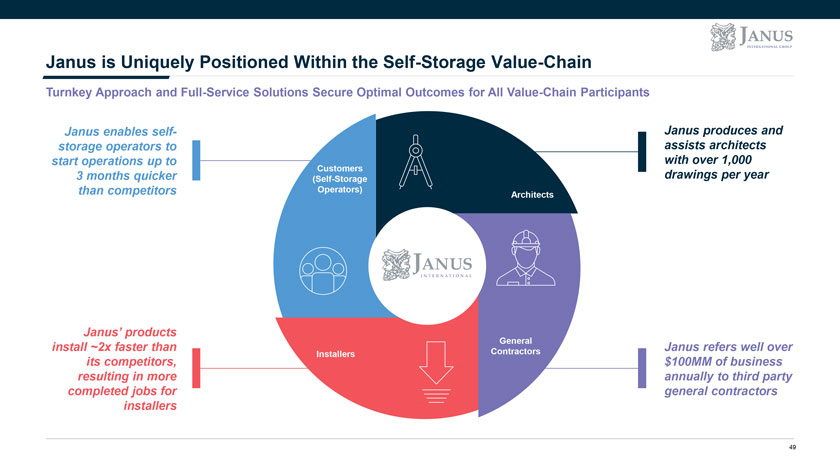
Janus Involved Every Step of the Way New construction A Differentiated Platform Providing Speed, Certainty and Control Select General Site Construction and Final Installation and The Result Initial Architectural Design Contractor Component Delivery Testing Independently sourced Independently sourced Components sourced from multiple Installation crew based • Disparate providers: architects GC independent suppliers on GC relationships Cost overruns • Independently source and • Independently source • Supplier selection based on GC or • Contracts based on • Lack of integration: The “Traditional” engage developers / architects and engage a GC with architect’s specifications via specs and availability – Construction delays Approach to produce project designs with varying experience in competitive tender no leeway to deal with Increased chance of varying levels of domain self-storage issues that arise • knowledge • Disparate vendor base required change orders In-house design experts GC recommended Comprehensive integrated Extensive installation • Speed: Faster construction by Janus system network • In-house design services with the • Certainty: Schedule, cost, ability to leverage extensive 3rd • Ensures capabilities of • Flexible built-to-order • Turnkey installation scope The Janus party architectural network GCs manufacturing and nationwide services delivered via a provides entry to customer’s footprint provides delivery with large network of • Control: Ownership of Approach planning process • Access to 3rd party speed and certainty partners who are tested, entirety of project, including network and ability to highly skilled, and economics • Services optimize economics of supplement and support • Vertically aligned to deliver a incentivized by Janus a facility before plans are GC services seamless end-to-end system finalized Janus controls the whole process as opposed to a disparate supply chain with divergent interests 50
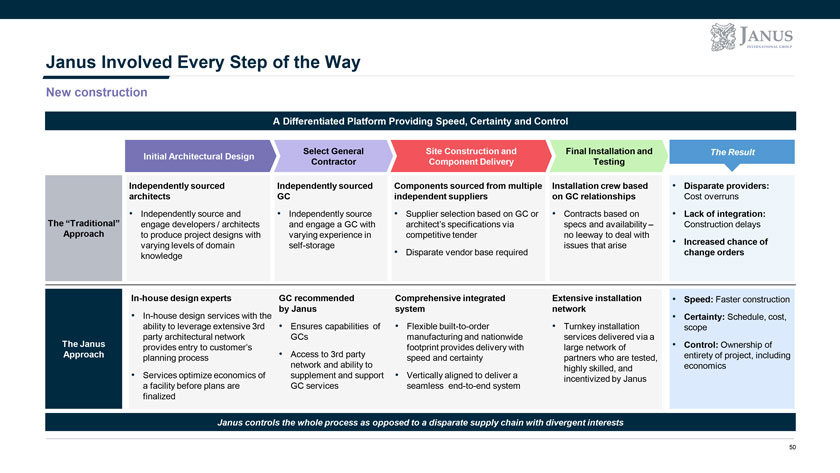
Janus’ R3 Opportunity Driven by a Growing and Aging Installed Base New construction continues to grow in an effort to meet pent up demand. As the market reaches equilibrium, operators will look to R3 projects as the next avenue for profitability and growth Replacement Remix / Renovations • Large installed base of aging facilities from large self-storage construction activity in • Non-institutional operators’ need to remain competitive with new modern facilities built by 1970s and early 1980s institutional operators drives demand • Older facilities often operated by non-institutional operators • Growing trend in the market to re-size storage units (“remix”) to better meet modern customer demand • Competitive markets drive the need to maintain modern aesthetics • Increased consolidation within the self-storage sector (by the large public REITs) Age of Current Self-Storage Facilities(1) Substantial Non-institutional Base Set to Drive R3 Demand 42% • The 1.9bn sq. ft. ~60% of the current (2) non-institutional market is Public REITs installed base is over 30% beginning to engage in R3 20 years old investments • Market fragmentation 13% 16% creates consolidation 9% 9% opportunities for 8% 3% Other Customers institutional operators, 70% resulting in remix / <5 6-10 11-15 16-20 21-25 26-30 >30 renovation project Years Old opportunities for Janus Sources: Self-Storage Almanac, REIS and management estimates Notes: 1. Based on REIS data comprising a representative universe of 10,745 facilities (~20% of total estimated facility count) 2. Includes Public Storage, Extra Space, CubeSmart, Life Storage, National Storage and U-Haul 51
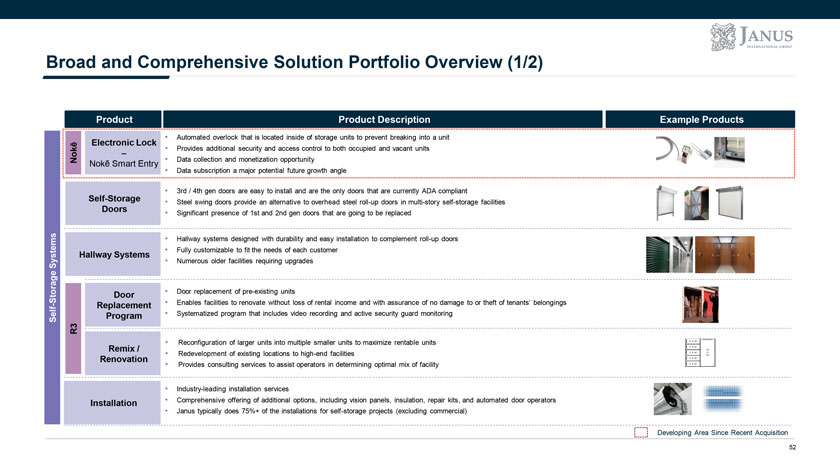
Broad and Comprehensive Solution Portfolio Overview (1/2) Product Product Description Example Products • Automated overlock that is located inside of storage units to prevent breaking into a unit ē Electronic Lock • Provides additional security and access control to both occupied and vacant units – collection and Nok • Data monetization opportunity Nokē Smart Entry Data subscription a major potential future growth angle • • 3rd / 4th gen doors are easy to install and are the only doors that are currently ADA compliant Self-Storage • Steel swing doors provide an alternative to overhead steel roll-up doors in multi-story self-storage facilities Doors • Significant presence of 1st and 2nd gen doors that are going to be replaced • Hallway systems designed with durability and easy installation to complement roll-up doors • Fully customizable to fit the needs of each customer Hallway Systems Systems • Numerous older facilities requiring upgrades Storage Door • Door replacement of pre-existing units - Replacement • Enables facilities to renovate without loss of rental income and with assurance of no damage to or theft of tenants’ belongings Self Program • Systematized program that includes video recording and active security guard monitoring R3 • Reconfiguration of larger units into multiple smaller units to maximize rentable units Remix / • Redevelopment of existing locations to high-end facilities Renovation • Provides consulting services to assist operators in determining optimal mix of facility • Industry-leading installation services Installation • Comprehensive offering of additional options, including vision panels, insulation, repair kits, and automated door operators • Janus typically does 75%+ of the installations for self-storage projects (excluding commercial) Developing Area Since Recent Acquisition 52
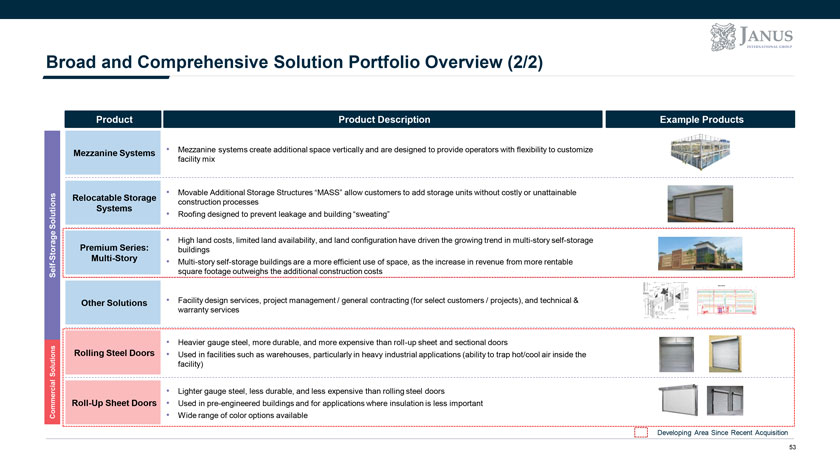
Broad and Comprehensive Solution Portfolio Overview (2/2) Product Product Description Example Products Mezzanine Systems • Mezzanine systems create additional space vertically and are designed to provide operators with flexibility to customize facility mix • Movable Additional Storage Structures “MASS” allow customers to add storage units without costly or unattainable Relocatable Storage construction processes Systems Solutions • Roofing designed to prevent leakage and building “sweating” Premium Series: • High land costs, limited land availability, and land configuration have driven the growing trend in multi-story self-storage Storage buildings Multi-Story - • Multi-story self-storage buildings are a more efficient use of space, as the increase in revenue from more rentable Self square footage outweighs the additional construction costs Other Solutions • Facility design services, project management / general contracting (for select customers / projects), and technical & warranty services • Heavier gauge steel, more durable, and more expensive than roll-up sheet and sectional doors Rolling Steel Doors • Used in facilities such as warehouses, particularly in heavy industrial applications (ability to trap hot/cool air inside the Solutions facility) • Lighter gauge steel, less durable, and less expensive than rolling steel doors Roll-Up Sheet Doors • Used in pre-engineered buildings and for applications where insulation is less important Commercial • Wide range of color options available Developing Area Since Recent Acquisition 53
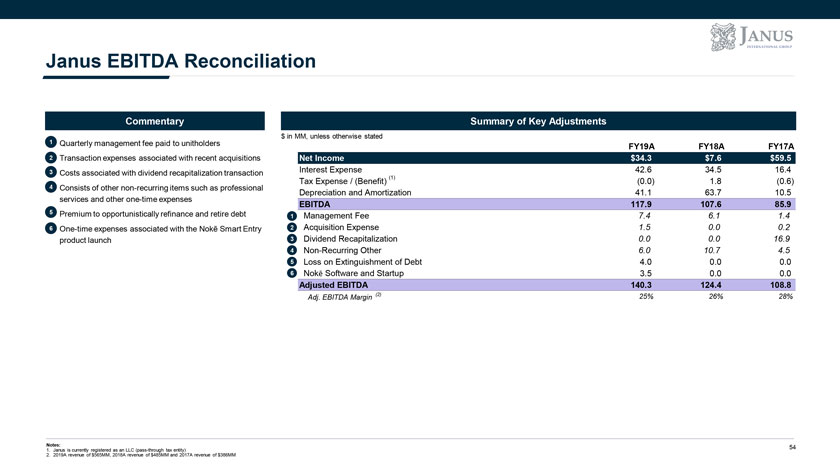
Janus EBITDA Reconciliation Commentary Summary of Key Adjustments 1 Quarterly management $ in MM, unless otherwise stated • fee paid to unitholders FY19A FY18A FY17A 2• Transaction expenses associated with recent acquisitions Net Income $34.3 $7.6 $59.5 3• Costs associated with dividend recapitalization transaction Interest Expense 42.6 34.5 16.4 Tax Expense / (Benefit) (1) (0.0) 1.8 (0.6) 4• Consists of other non-recurring items such as professional Depreciation and Amortization 41.1 63.7 10.5 services and other one-time expenses EBITDA 117.9 107.6 85.9 5• Premium to opportunistically refinance and retire debt 1 Management Fee 7.4 6.1 1.4 6• One-time expenses associated with the Nokē Smart Entry 2 Acquisition Expense 1.5 0.0 0.2 product launch 3 Dividend Recapitalization 0.0 0.0 16.9 4 Non-Recurring Other 6.0 10.7 4.5 5 Loss on Extinguishment of Debt 4.0 0.0 0.0 6 Nokē Software and Startup 3.5 0.0 0.0 Adjusted EBITDA 140.3 124.4 108.8 Adj. EBITDA Margin (2) 25% 26% 28% Notes: 54 1. Janus is currently registered as an LLC (pass-through tax entity) 2. 2019A revenue of $565MM, 2018A revenue of $485MM and 2017A revenue of $386MM

JANUS INTERNATIONAL GROUP