Attached files
| file | filename |
|---|---|
| 8-K - 8-K - HTG MOLECULAR DIAGNOSTICS, INC | htgm-8k_20210106.htm |
Advancing the Promise of Precision Medicine Corporate Overview January 2021 Exhibit 99.1
Forward Looking Statements This presentation contains forward-looking statements that involve substantial risks and uncertainties. All statements, other than statements of historical facts, contained in this presentation, including statements regarding our transactions with biopharmaceutical companies, possible companion diagnostic and HTG Molecular Diagnostics, Inc. (“HTG”) diagnostic products, potential addressable markets and the size of those markets, our timeline strategy, planned product development and our product and technology roadmap, expected regulatory submissions and filings, anticipated reimbursement, prospects, and plans and objectives are forward-looking statements. The words ‘‘anticipate,’’ ‘‘believe,’’ ‘‘estimate,’’ ‘‘expect,’’ ‘‘intend,’’ ‘‘may,’’ ‘‘plan,’’ ‘‘predict,’’ ‘‘project,’’ ‘‘target,’’ ‘‘potential,’’ ‘‘will,’’ ‘‘would,’’ ‘‘could,’’ ‘‘should,’’ ‘‘continue,’’ and similar expressions are intended to identify forward-looking statements, although not all forward-looking statements contain these identifying words. We may not actually achieve the plans, intentions or expectations disclosed in our forward-looking statements, and you should not place undue reliance on our forward-looking statements. Actual results or events could differ materially from the plans, intentions and expectations disclosed in forward-looking statements, including due to risks and uncertainties associated with the development and commercialization of products, competition with new and existing technologies, the outcome of relationships with third parties, the COVID-19 pandemic and other factors as discussed under the heading “Risk Factors” in our periodic reports on Form 10-Q and Form 10-K. The forward-looking statements contained in this presentation reflect our views with respect to future events as of the date set forth on the first page of this presentation, and we assume no obligation to update any forward-looking statements as a result of new information, future events or otherwise as of such date. This presentation also contains estimates, projections and other information concerning our industry, our business, and the markets for our products, product candidates and services, as well as data regarding market research, estimates and forecasts prepared by our management. Information that is based on estimates, forecasts, projections, market research or similar methodologies is inherently subject to uncertainties and actual events or circumstances may differ materially from events and circumstances reflected in this information. These statements are based upon information available to us as of the date of the presentation, and while we believe such information forms a reasonable basis for such statements, such information may be limited or incomplete, and our statements should not be read to indicate that we have conducted an exhaustive inquiry into, or review of, all potentially available relevant information. These statements are inherently uncertain, and you are cautioned not to unduly rely upon these statements. 2
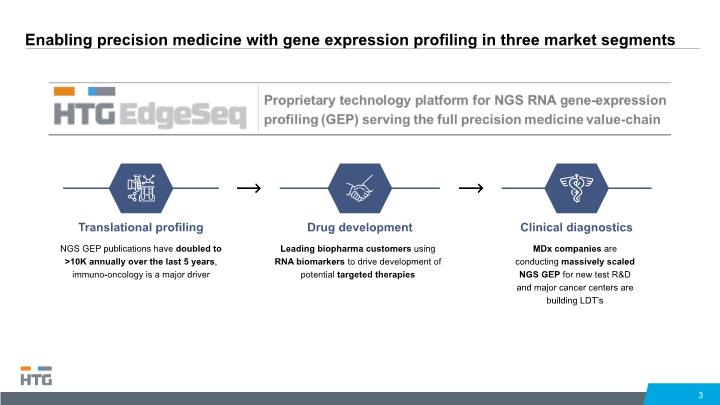
Enabling precision medicine with gene expression profiling in three market segments 3 Translational profiling Clinical diagnostics Drug development NGS GEP publications have doubled to >10K annually over the last 5 years, immuno-oncology is a major driver Leading biopharma customers using RNA biomarkers to drive development of potential targeted therapies MDx companies are conducting massively scaled NGS GEP for new test R&D and major cancer centers are building LDT’s
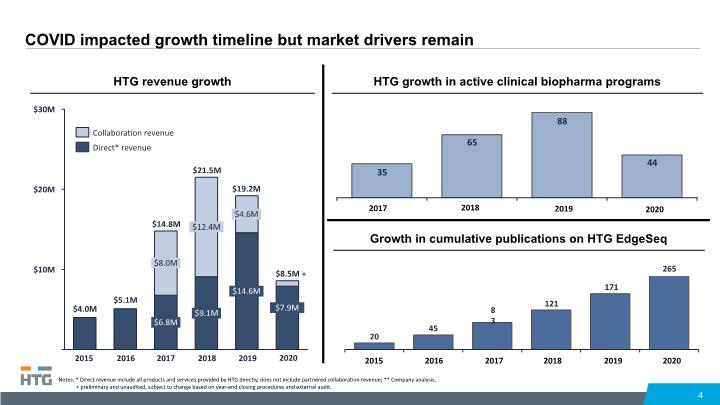
COVID impacted growth timeline but market drivers remain 4 HTG revenue growth $10M $30M $20M 2016 2017 2015 $8.0M $6.8M $12.4M $21.5M 2019 $9.1M 2018 $4.6M $14.6M $14.8M $19.2M Notes: * Direct revenue include all products and services provided by HTG directly, does not include partnered collaboration revenue; ** Company analysis, + preliminary and unaudited, subject to change based on year-end closing procedures and external audit. Collaboration revenue Direct* revenue $8.5M $7.9M HTG growth in active clinical biopharma programs 2017 2018 2019 2020 2020 Growth in cumulative publications on HTG EdgeSeq 2015 2020 2017 2016 2018 2019 +
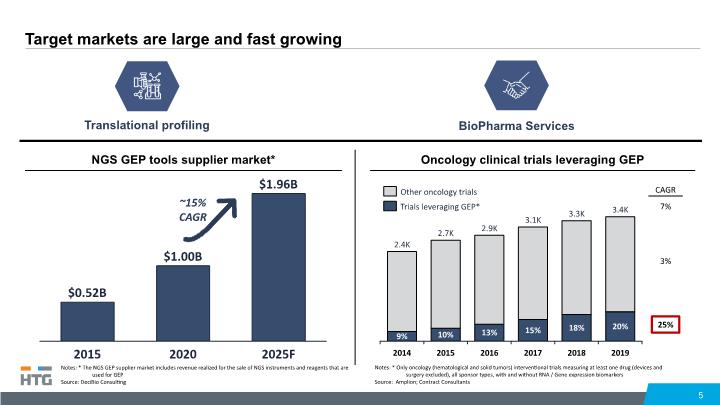
Target markets are large and fast growing 5 Oncology clinical trials leveraging GEP 3.1K 9% 2014 13% 2015 10% 15% 2016 2017 2019 18% 2018 20% 2.4K 2.7K 2.9K 3.3K 3.4K 7% 25% 3% NGS GEP tools supplier market* CAGR 2020 2015 $0.52B 2025F $1.00B $1.96B ~15% CAGR Translational profiling BioPharma Services Notes: * The NGS GEP supplier market includes revenue realized for the sale of NGS instruments and reagents that are used for GEP Source: DeciBio Consulting Notes: * Only oncology (hematological and solid tumors) interventional trials measuring at least one drug (devices and surgery excluded), all sponsor types, with and without RNA / Gene expression biomarkers Source: Amplion; Contract Consultants Trials leveraging GEP* Other oncology trials
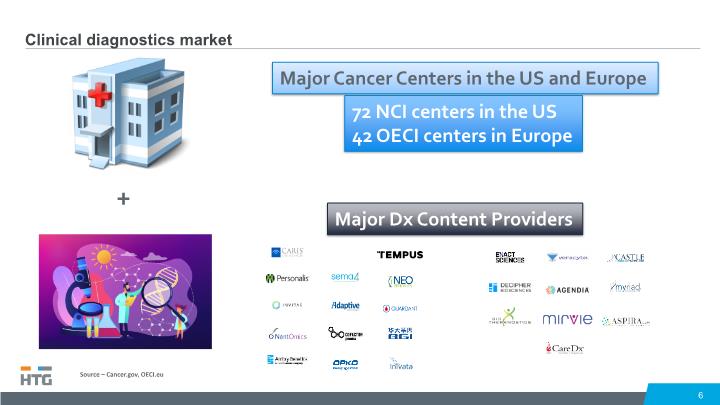
Clinical diagnostics market 6 + Source – Cancer.gov, OECI.eu
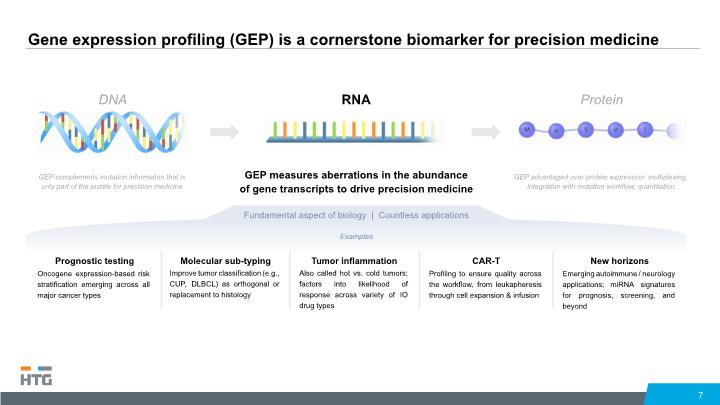
Gene expression profiling (GEP) is a cornerstone biomarker for precision medicine 7 RNA GEP measures aberrations in the abundance of gene transcripts to drive precision medicine DNA GEP complements mutation information that is only part of the puzzle for precision medicine Protein GEP advantaged over protein expression: multiplexing, integration with mutation workflow, quantitation Fundamental aspect of biology | Countless applications Examples Prognostic testing Oncogene expression-based risk stratification emerging across all major cancer types Molecular sub-typing Improve tumor classification (e.g., CUP, DLBCL) as orthogonal or replacement to histology Tumor inflammation Also called hot vs. cold tumors; factors into likelihood of response across variety of IO drug types CAR-T Profiling to ensure quality across the workflow, from leukapheresis through cell expansion & infusion New horizons Emerging autoimmune / neurology applications; miRNA signatures for prognosis, screening, and beyond
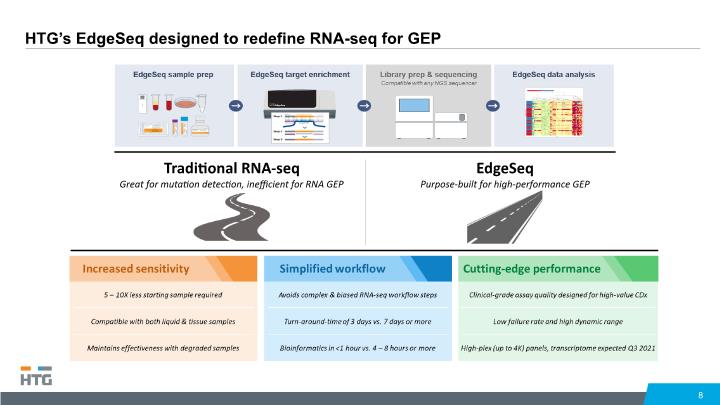
HTG’s EdgeSeq designed to redefine RNA-seq for GEP 8 Traditional RNA-seq Great for mutation detection, inefficient for RNA GEP EdgeSeq Purpose-built for high-performance GEP
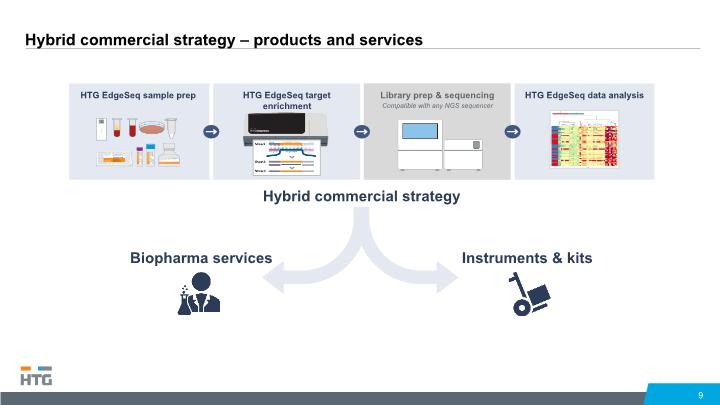
Hybrid commercial strategy – products and services 9 HTG EdgeSeq target enrichment Hybrid commercial strategy Biopharma services Instruments & kits
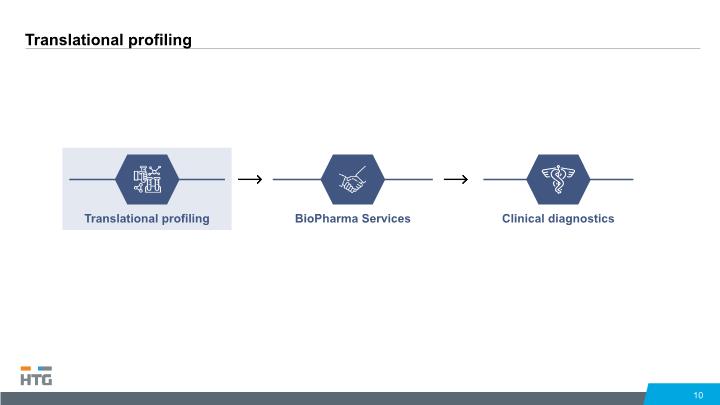
Translational profiling 10
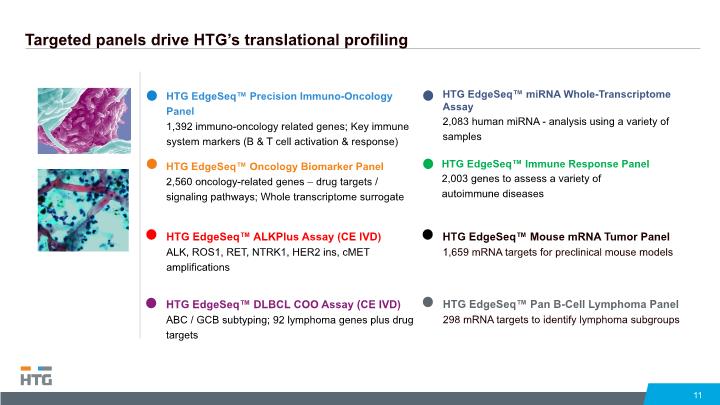
Targeted panels drive HTG’s translational profiling 11 HTG EdgeSeq™ Immune Response Panel 2,003 genes to assess a variety of autoimmune diseases HTG EdgeSeq™ miRNA Whole-Transcriptome Assay 2,083 human miRNA - analysis using a variety of samples HTG EdgeSeq™ Mouse mRNA Tumor Panel 1,659 mRNA targets for preclinical mouse models HTG EdgeSeq™ Pan B-Cell Lymphoma Panel 298 mRNA targets to identify lymphoma subgroups
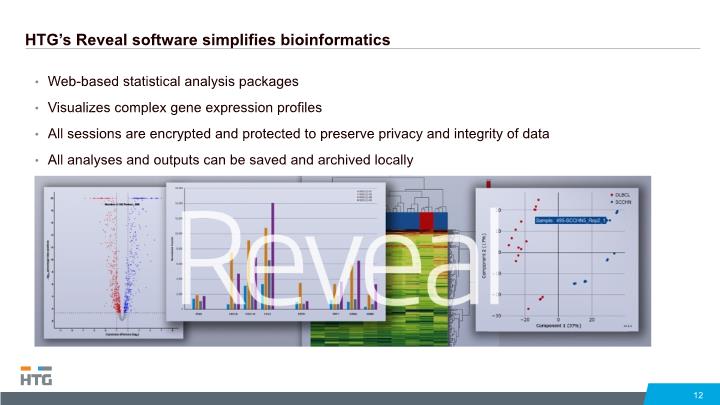
HTG’s Reveal software simplifies bioinformatics 12 Web-based statistical analysis packages Visualizes complex gene expression profiles All sessions are encrypted and protected to preserve privacy and integrity of data All analyses and outputs can be saved and archived locally
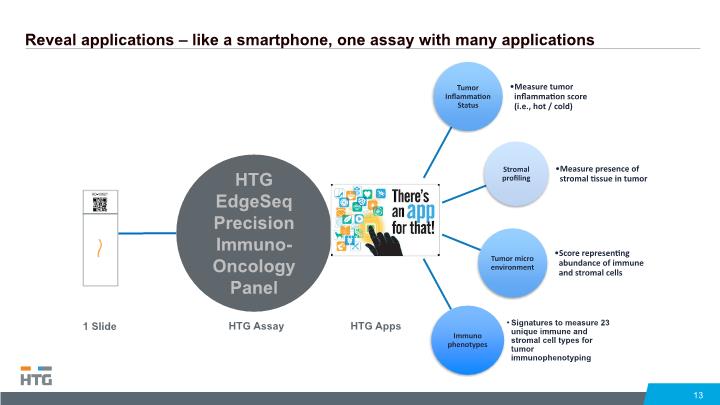
Reveal applications – like a smartphone, one assay with many applications 13 HTG EdgeSeq Precision Immuno-Oncology Panel HTG Assay HTG Apps 1 Slide
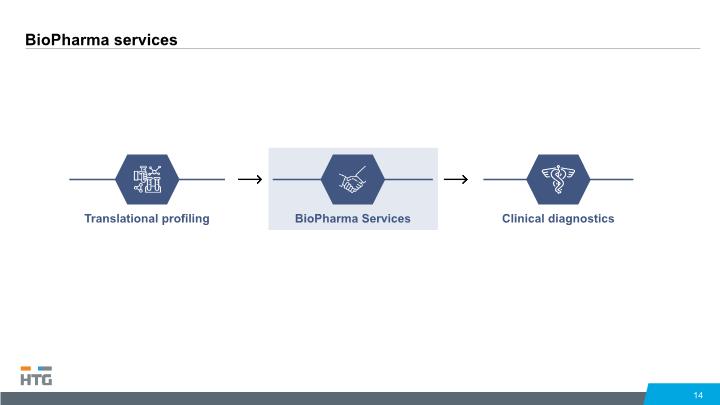
BioPharma services 14
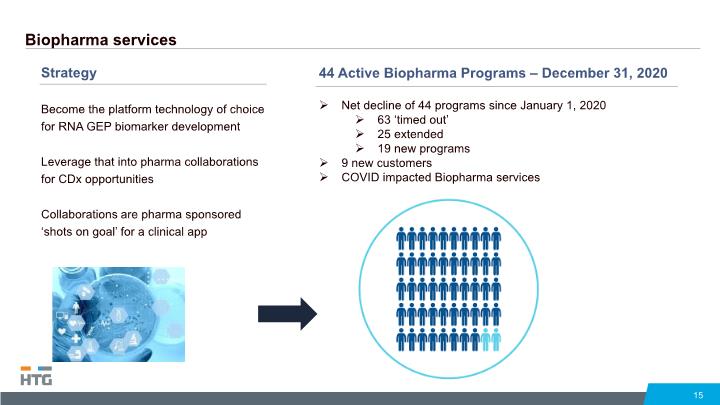
Biopharma services Strategy Become the platform technology of choice for RNA GEP biomarker development Leverage that into pharma collaborations for CDx opportunities Collaborations are pharma sponsored ‘shots on goal’ for a clinical app 15 44 Active Biopharma Programs – December 31, 2020 Net decline of 44 programs since January 1, 2020 63 ‘timed out’ 25 extended 19 new programs 9 new customers COVID impacted Biopharma services
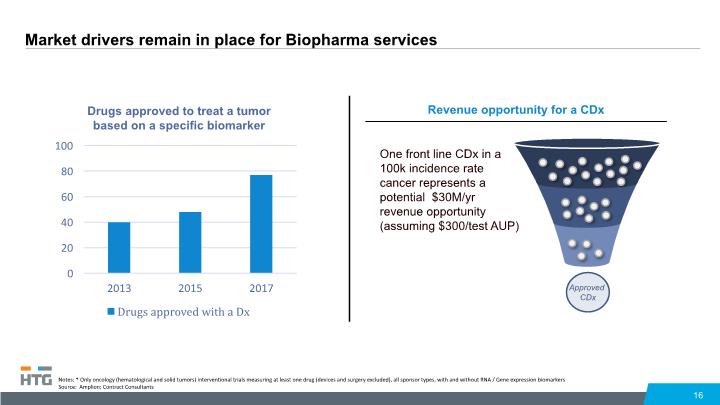
Market drivers remain in place for Biopharma services 16 Notes: * Only oncology (hematological and solid tumors) interventional trials measuring at least one drug (devices and surgery excluded), all sponsor types, with and without RNA / Gene expression biomarkers Source: Amplion; Contract Consultants Revenue opportunity for a CDx Approved CDx One front line CDx in a 100k incidence rate cancer represents a potential $30M/yr revenue opportunity (assuming $300/test AUP)
Clinical diagnostics 17
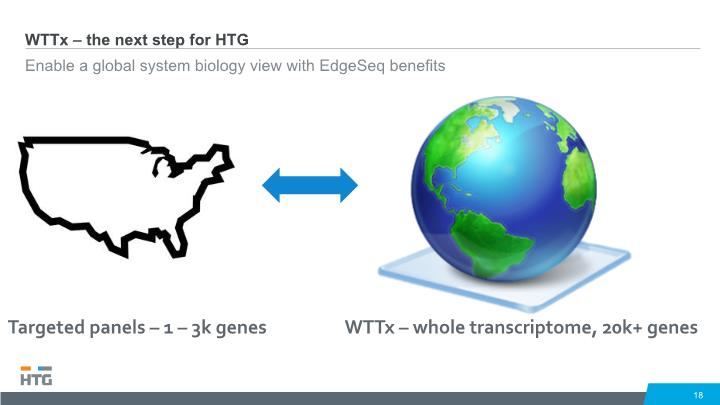
WTTx – the next step for HTG Enable a global system biology view with EdgeSeq benefits 18 WTTx – whole transcriptome, 20k+ genes Targeted panels – 1 – 3k genes
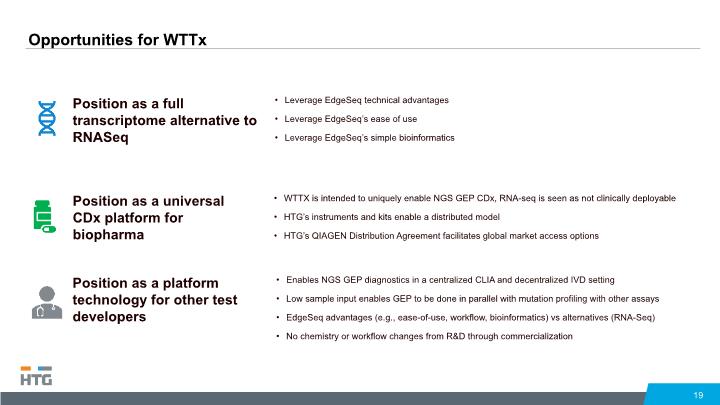
Opportunities for WTTx 19 WTTX is intended to uniquely enable NGS GEP CDx, RNA-seq is seen as not clinically deployable HTG’s instruments and kits enable a distributed model HTG’s QIAGEN Distribution Agreement facilitates global market access options Enables NGS GEP diagnostics in a centralized CLIA and decentralized IVD setting Low sample input enables GEP to be done in parallel with mutation profiling with other assays EdgeSeq advantages (e.g., ease-of-use, workflow, bioinformatics) vs alternatives (RNA-Seq) No chemistry or workflow changes from R&D through commercialization Position as a full transcriptome alternative to RNASeq Position as a universal CDx platform for biopharma Position as a platform technology for other test developers
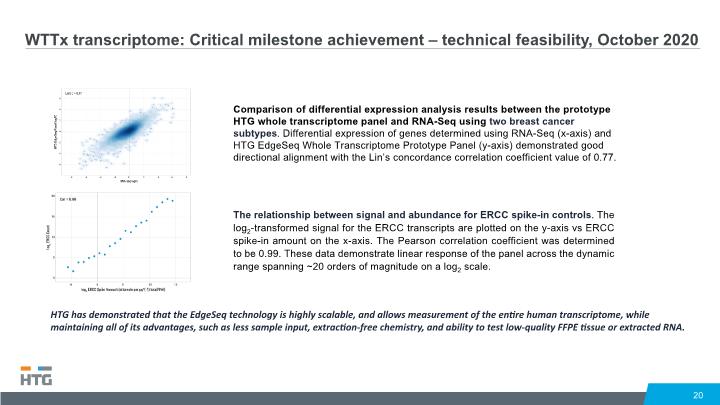
WTTx transcriptome: Critical milestone achievement – technical feasibility, October 2020 20 The relationship between signal and abundance for ERCC spike-in controls. The log2-transformed signal for the ERCC transcripts are plotted on the y-axis vs ERCC spike-in amount on the x-axis. The Pearson correlation coefficient was determined to be 0.99. These data demonstrate linear response of the panel across the dynamic range spanning ~20 orders of magnitude on a log2 scale. Comparison of differential expression analysis results between the prototype HTG whole transcriptome panel and RNA-Seq using two breast cancer subtypes. Differential expression of genes determined using RNA-Seq (x-axis) and HTG EdgeSeq Whole Transcriptome Prototype Panel (y-axis) demonstrated good directional alignment with the Lin’s concordance correlation coefficient value of 0.77. HTG has demonstrated that the EdgeSeq technology is highly scalable, and allows measurement of the entire human transcriptome, while maintaining all of its advantages, such as less sample input, extraction-free chemistry, and ability to test low-quality FFPE tissue or extracted RNA.
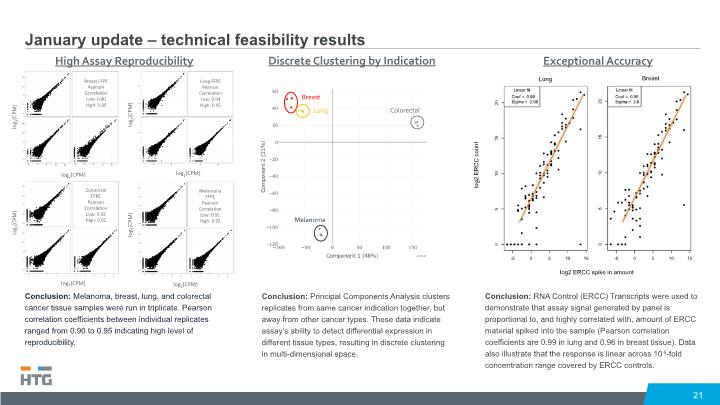
January update – technical feasibility results 21 Conclusion: Melanoma, breast, lung, and colorectal cancer tissue samples were run in triplicate. Pearson correlation coefficients between individual replicates ranged from 0.90 to 0.95 indicating high level of reproducibility. Conclusion: Principal Components Analysis clusters replicates from same cancer indication together, but away from other cancer types. These data indicate assay’s ability to detect differential expression in different tissue types, resulting in discrete clustering in multi-dimensional space. Conclusion: RNA Control (ERCC) Transcripts were used to demonstrate that assay signal generated by panel is proportional to, and highly correlated with, amount of ERCC material spiked into the sample (Pearson correlation coefficients are 0.99 in lung and 0.96 in breast tissue). Data also illustrate that the response is linear across 106-fold concentration range covered by ERCC controls.
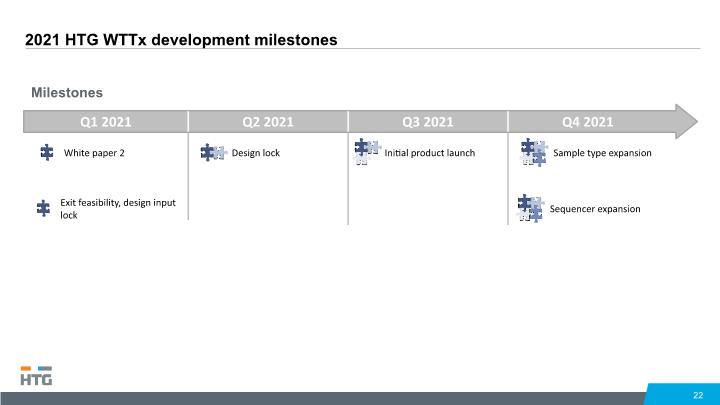
22 2021 HTG WTTx development milestones Q1 2021 Q2 2021 Q3 2021 Q4 2021 White paper 2 Design lock Initial product launch Sample type expansion Milestones Q12020 Q2 2020 Q3 2020 Q4 2020
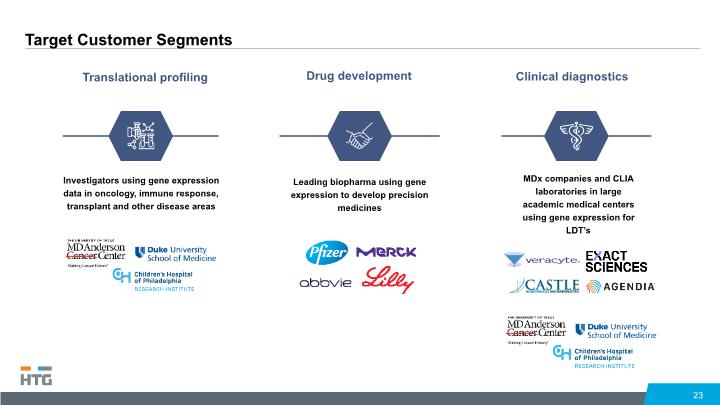
Target Customer Segments 23 Translational profiling Clinical diagnostics Drug development Investigators using gene expression data in oncology, immune response, transplant and other disease areas Leading biopharma using gene expression to develop precision medicines MDx companies and CLIA laboratories in large academic medical centers using gene expression for LDT’s
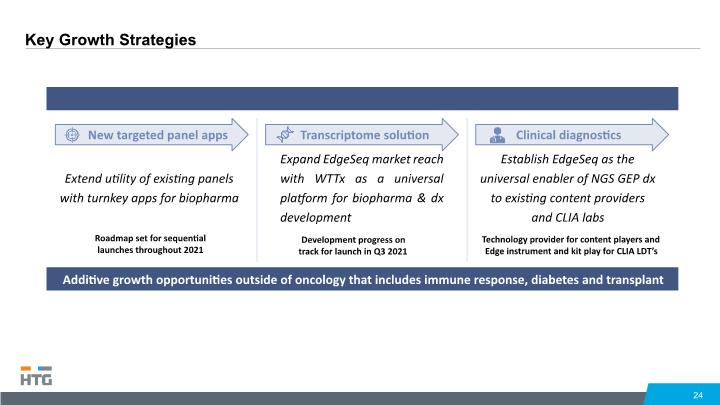
24 New targeted panel apps Extend utility of existing panels with turnkey apps for biopharma Roadmap set for sequential launches throughout 2021 Transcriptome solution Expand EdgeSeq market reach with WTTx as a universal platform for biopharma & dx development Development progress on track for launch in Q3 2021 Clinical diagnostics Establish EdgeSeq as the universal enabler of NGS GEP dx to existing content providers and CLIA labs Technology provider for content players and Edge instrument and kit play for CLIA LDT’s Additive growth opportunities outside of oncology that includes immune response, diabetes and transplant Key Growth Strategies
